1. Introduction
Natural disasters are one of the major threats to the sustainable societal development. Out of the weather related disasters, lightning occurrences have been the most underestimated disaster. Therefore, understanding the atmospheric lightning flashes/strikes and their occurrences is one of the most important questions in the sustainable development and climate science. Real-time, lightning data have profound importance in climate science, air quality research, and atmospheric nitrogen budget, apart from this being one of the major natural disasters (Price, 2000; Romps et al. 2014). In recent times, it has also been shown that with earth’s climate getting warmer, the numbers of lightning occurrences are going to increase (Romps et al. 2014). These scenarios make the monitoring and understanding of lightning a societal demand. The lightning can be monitored using space borne as well as ground based methods. In terms of the space borne exploration, Lightning Imaging Sensor (LIS) on board the Tropical Rainfall Measuring Mission (TRMM), provided snap-shot information and did help in characterizing the occurrences of lightning (e.g., Cecil et al., 2014). At present, a GOES-16 monitors the American and European sector using the Global Lightning Mapper (GLM) sensor (e.g., Goodman et al., 2012). However, for the exact monitoring with temporal characteristics and societal applications such as identification of potential danger zones and now-casting, only ground based Very Low Frequency (VLF) receivers have been found very useful. Using this method, few countries, such as USA, Brazil, Poland, Finland, Japan, etc. have established a very dense network of long-range lightning detection sensors (e.g., Jacobson et al., 2006; Rodger et al., 2006; Betz et al., 2009). In Indian sector, India Meterological Department (IMD) through Indian Institute of Tropical Meteorology (IITM) has established a network based on Earth Network sensors. In a parallel effort, NRSC has initiated another Lightning Detection Sensor Network (LDSN) which is capable of detecting the cloud to ground lighting flashes with desired geolocation accuracies for the generation of Lightning Essential Climate Variable (L-ECV) as per the World Meteorological Organization (WMO) in the year 2016. The initial findings and L-ECV generation method are elaborated by Taori et al. (2021, 2022).
Apart from the number of occurrences, the vulnerability estimates need the associated current estimates as well. The present report utilizes the known and reported methods derived from the Maxwell’s equations, which have been implemented on the NRSC LDS network. The estimates thus obtained are compared with the current estimates of IITM/IMD network which utilizes the Earth Network USA data with a case study over Karnataka state of India.
2. NRSC-LDS Network
Until April 2022, NRSC has installed 46 sensors (Boltek make) in a network (
Figure 1), with each sensor separated by about 200 km. The Boltek LRX sensors works in the frequency range of 1 Hz to 30 MHz and collects the waveform of a static discharge. Each of these waveforms is GPS time stamped. Though, every sensor is capable of detection up to 1000 km range; however the detection efficiency is more than 98% within 300 km range. To cover mainland India uniformly and to generate the lightning essential climate variable (L-ECV) as per the World Meteorological Organization report, the sensors are placed such that sufficient overlap between two sensors persists. For identification of the lightning occurrence location, the waveforms from at least 4 sensors are utilized for the estimations using the time of arrival method (Taori et al., 2020). The present NRSC LDS network stations are depicted in the
Figure 1.
The lighting flash is a static discharge of electric fields which can be estimated using the potential difference between the ground and top of the cloud. The electric field associated with the accumulation of charges can be estimated using the electro-dynamic equations. The radiation emitted by CG return strokes is governed by Maxwell’s equations. For a vertical lightning channel, using vertical electric field change, and azimuth magnetic flux density currents can be estimated (e.g., Orville, 1991; Liaw et al., 1996 and references cited therein).
3. Results
Using the above method, electric current are estimated with each flash monitored by the LDSN. The assumptions and estimates on the current associated were thoroughly validated by Liaw et al., (1996) and Johnson and Vaughan (1999).
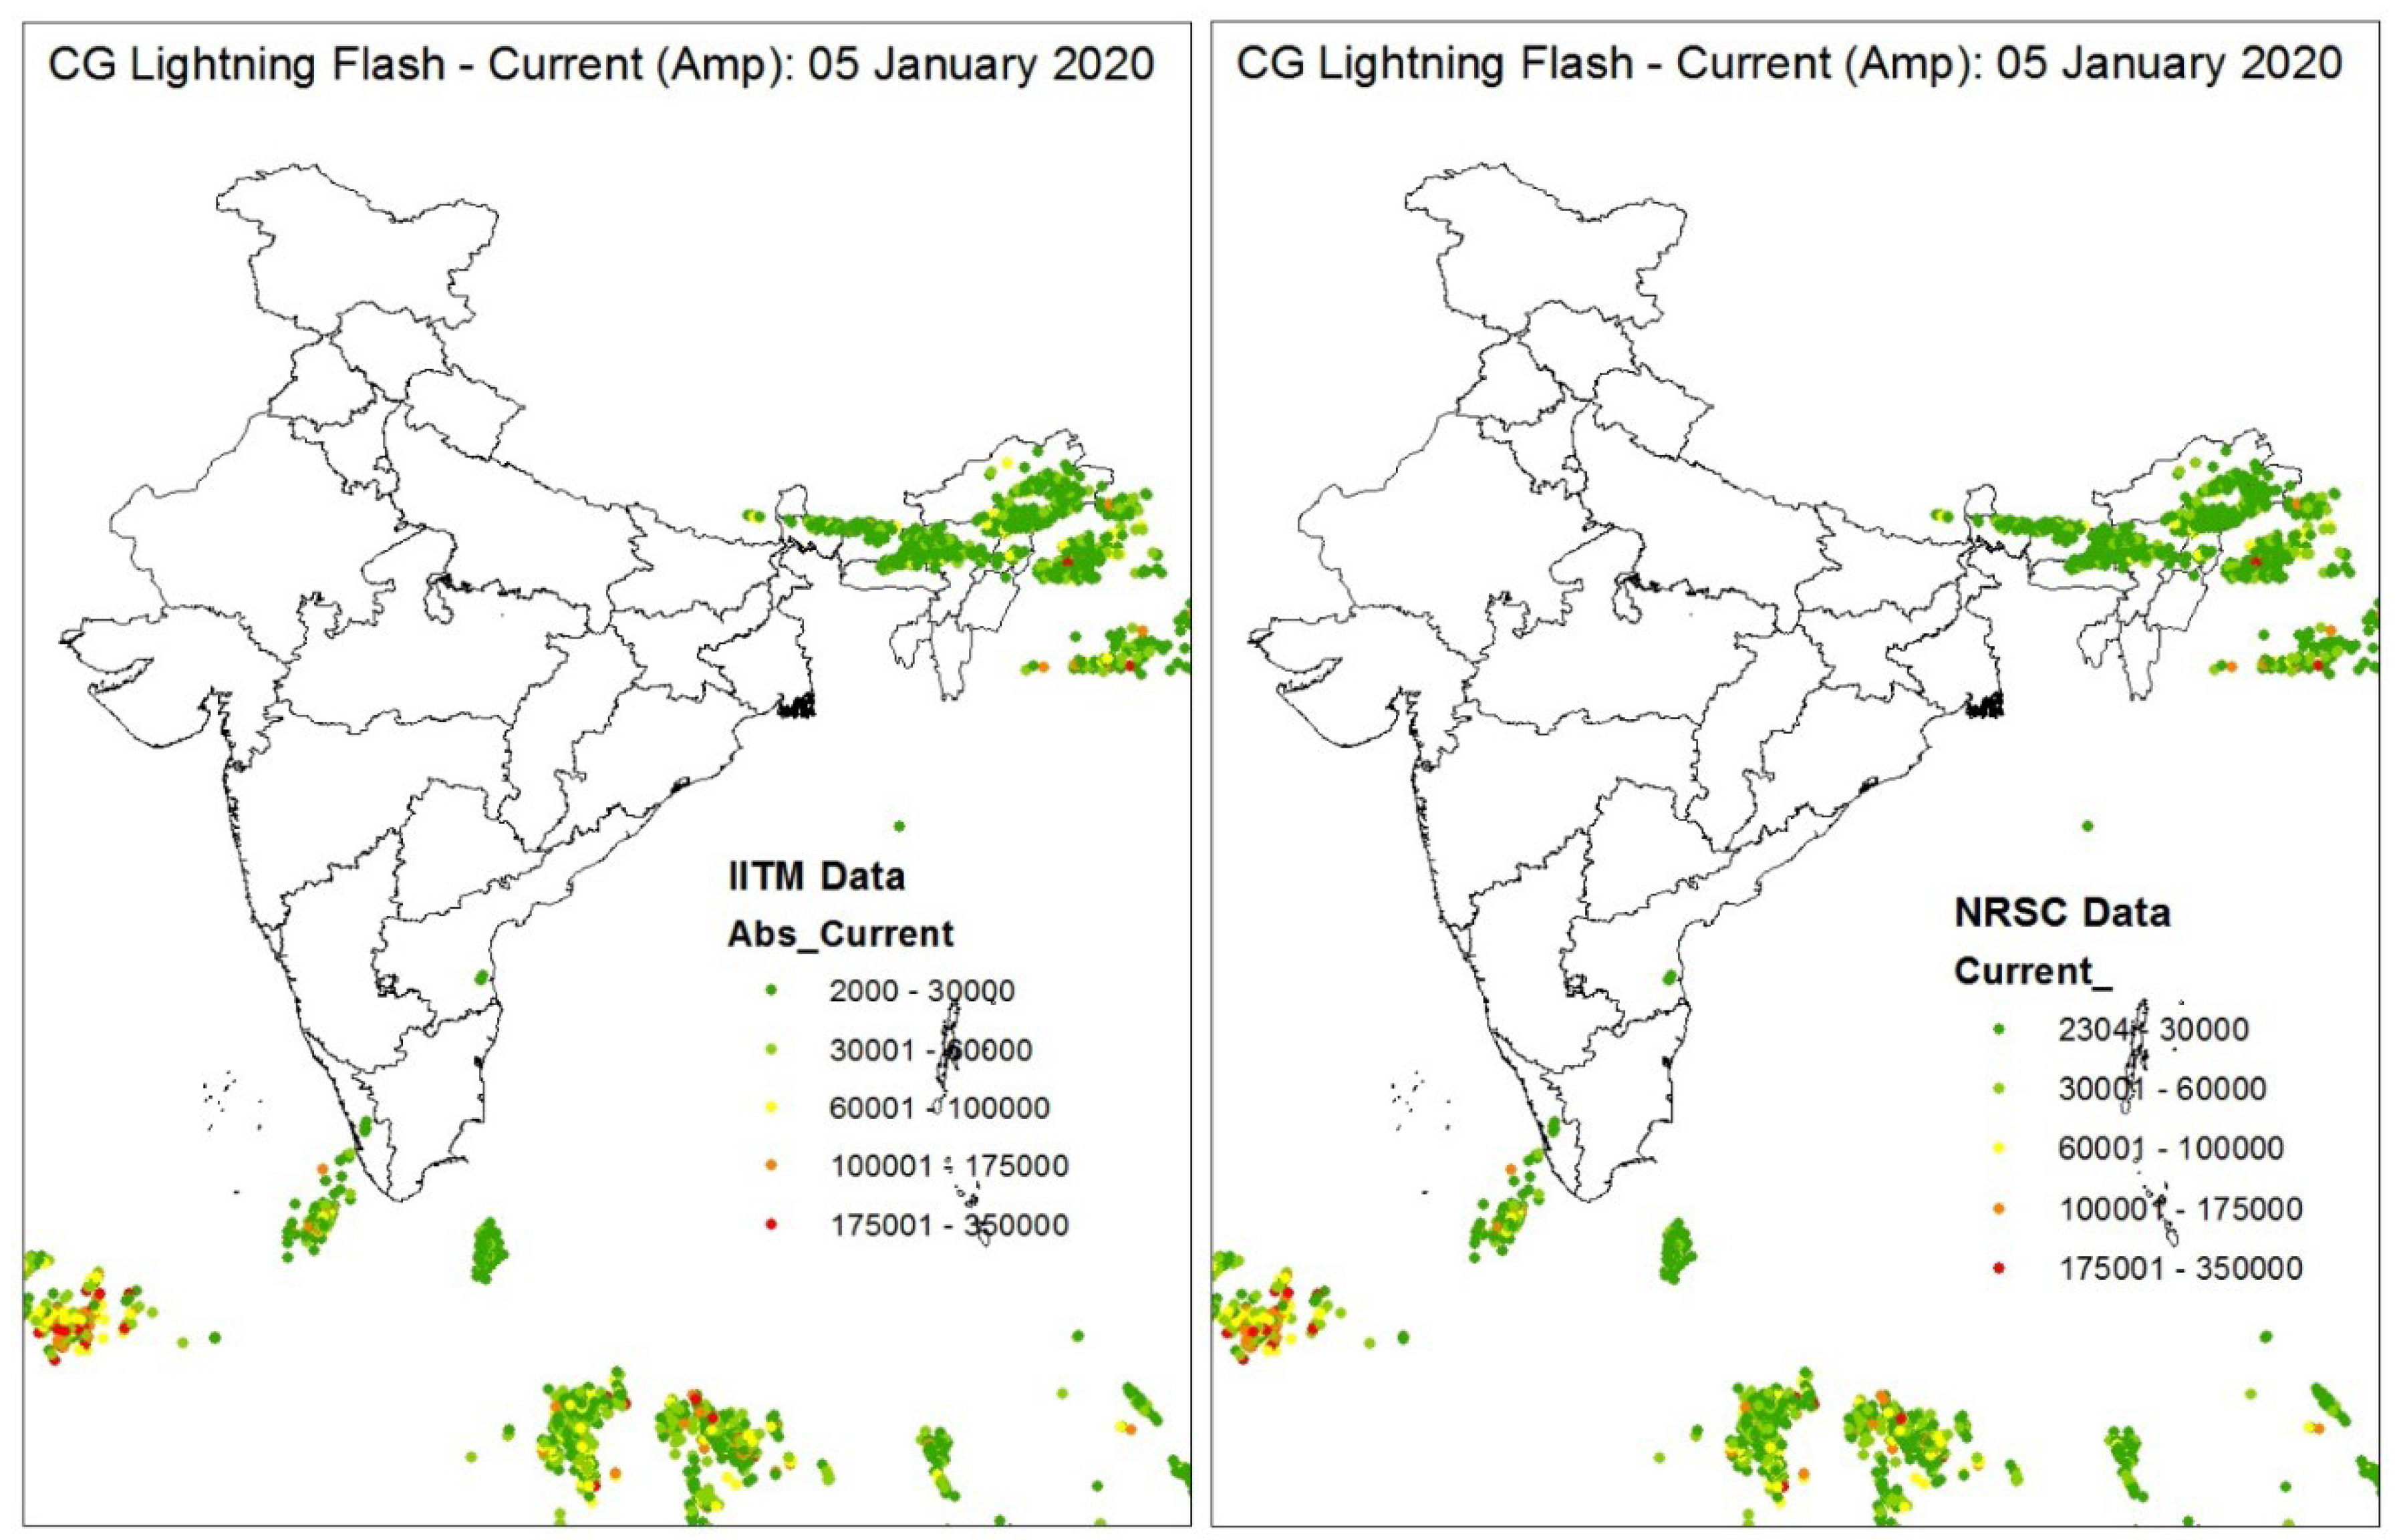
Figure 2,
Figure 3 and
Figure 4 show comparison of estimated currents on 05 January 2020 between the IITM/IMD sensor network and NRSC-LDS network at different spatial resolutions.
It is noted that in both data current estimates vary from 2000 Amp to 300000 Amp. The major parts of India have not received lightning on this day. It is noted that Andhra Pradesh show few CG lightning occurrences while the majority of the occurrences on this day occurred over the north-east locations of India. The lightning occurrences over the Arabian and Indian Ocean were also noteworthy. The IITM monitored the number of occurrences over India to be 3285 on this day with current values varying from 2091 Amp to 348093 Amp, while, the NRSC-LDSN show the number of occurrences to be 3247 with current values ranging from 2304 Amp to 341915 Amp. This signifies that both the data sets have good resemblances.
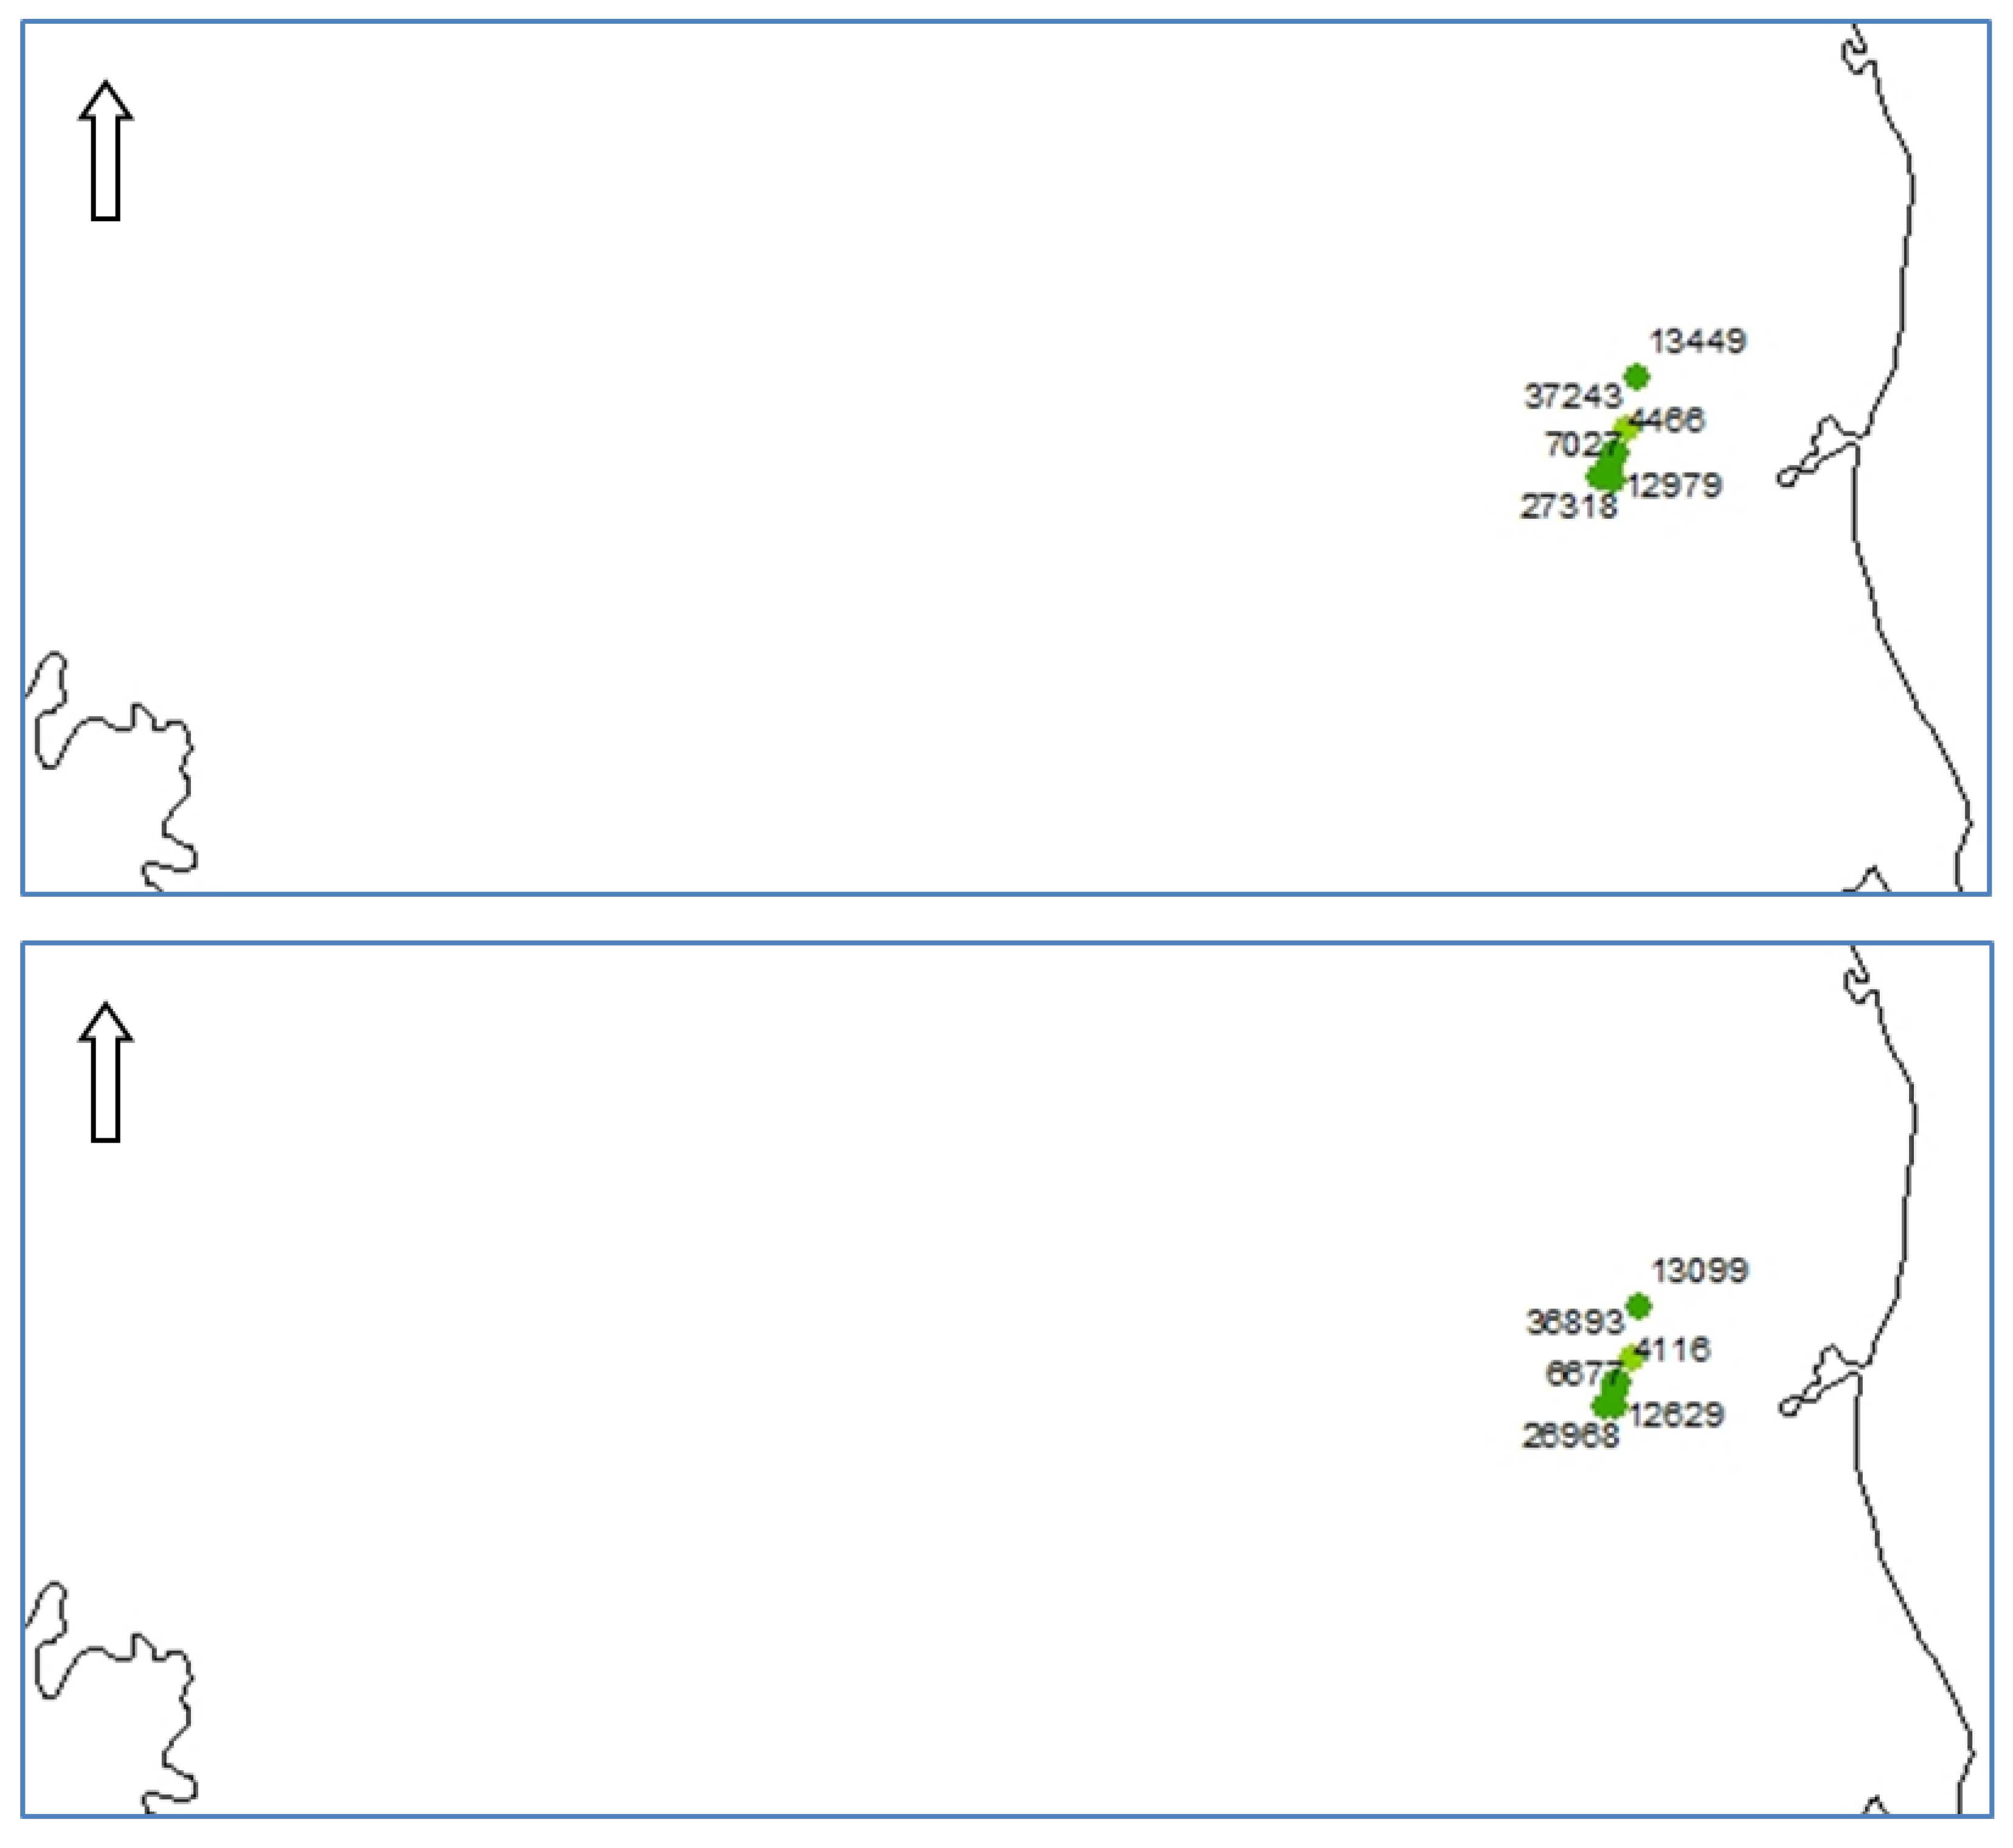
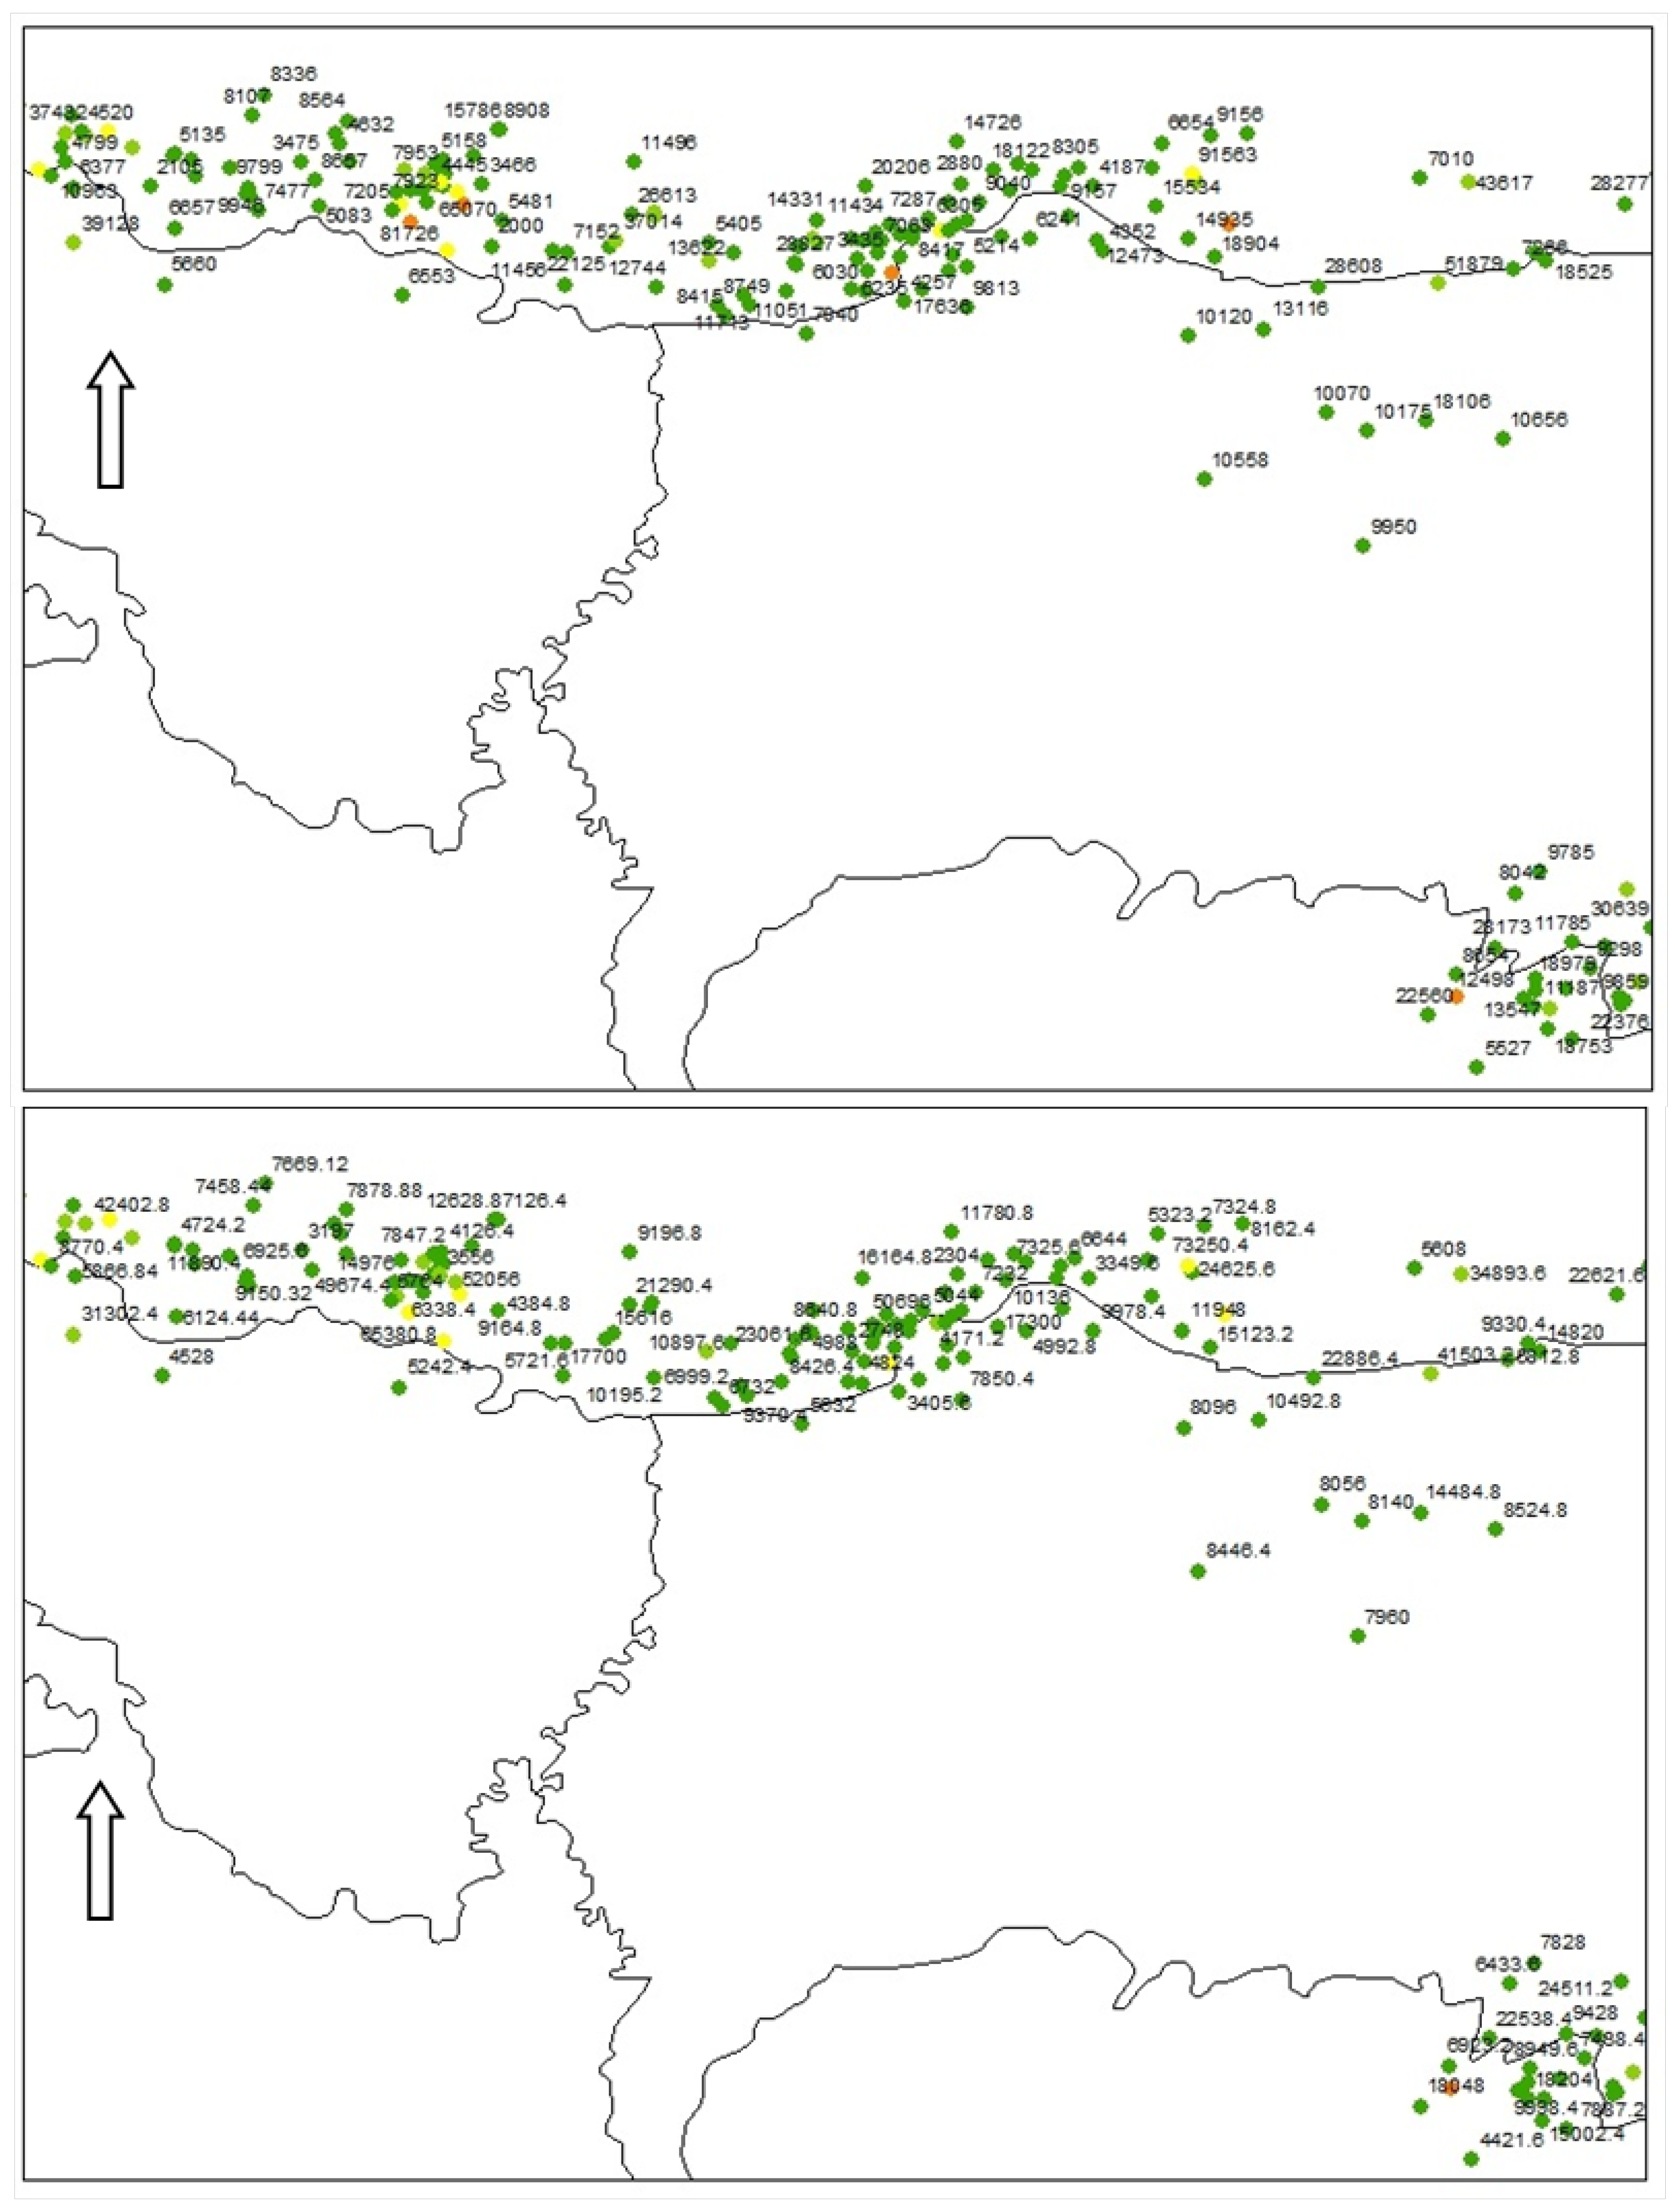
For further comparison, the data was zoomed to Andhra Pradesh locations (
Figure 3) and north-east (
Figure 4) regions where lightning occurrences are noteworthy. In zoomed portion of measurements over the Andhra Pradesh (
Figure 3), each point indicates the lightning occurrence while the numbers near to the points show the current associated with that CG flash.
It is noted that 6 events were monitored in Andhra Pradesh by both the networks, which are identical. The values were 4466 – 37243 Amp (IITM) and 4116 – 36893 Amp (LDSN). This suggests an underestimation of ~8 % for lower current value and ~1% in the higher current value.
The zoomed portion of measurements over the north-ease is shown in
Figure 4.
The total number of lightning events monitored by the IITM network was 768 while the number of lightning occurrences noted by the NRSC network is 754 which is an underestimation of 14 events (~2%). When we compare the current estimates of the two networks over the north-east locations, we note that few estimates which recorded less than 3000 Amp, the NRSC LDSN did not note such occurrences. Although, the proportionality of the current range is similar, there seems to be a systematic bias in the current estimates with NRSC systems reporting somewhat less current which is quantified in the regression analysis as in the following.
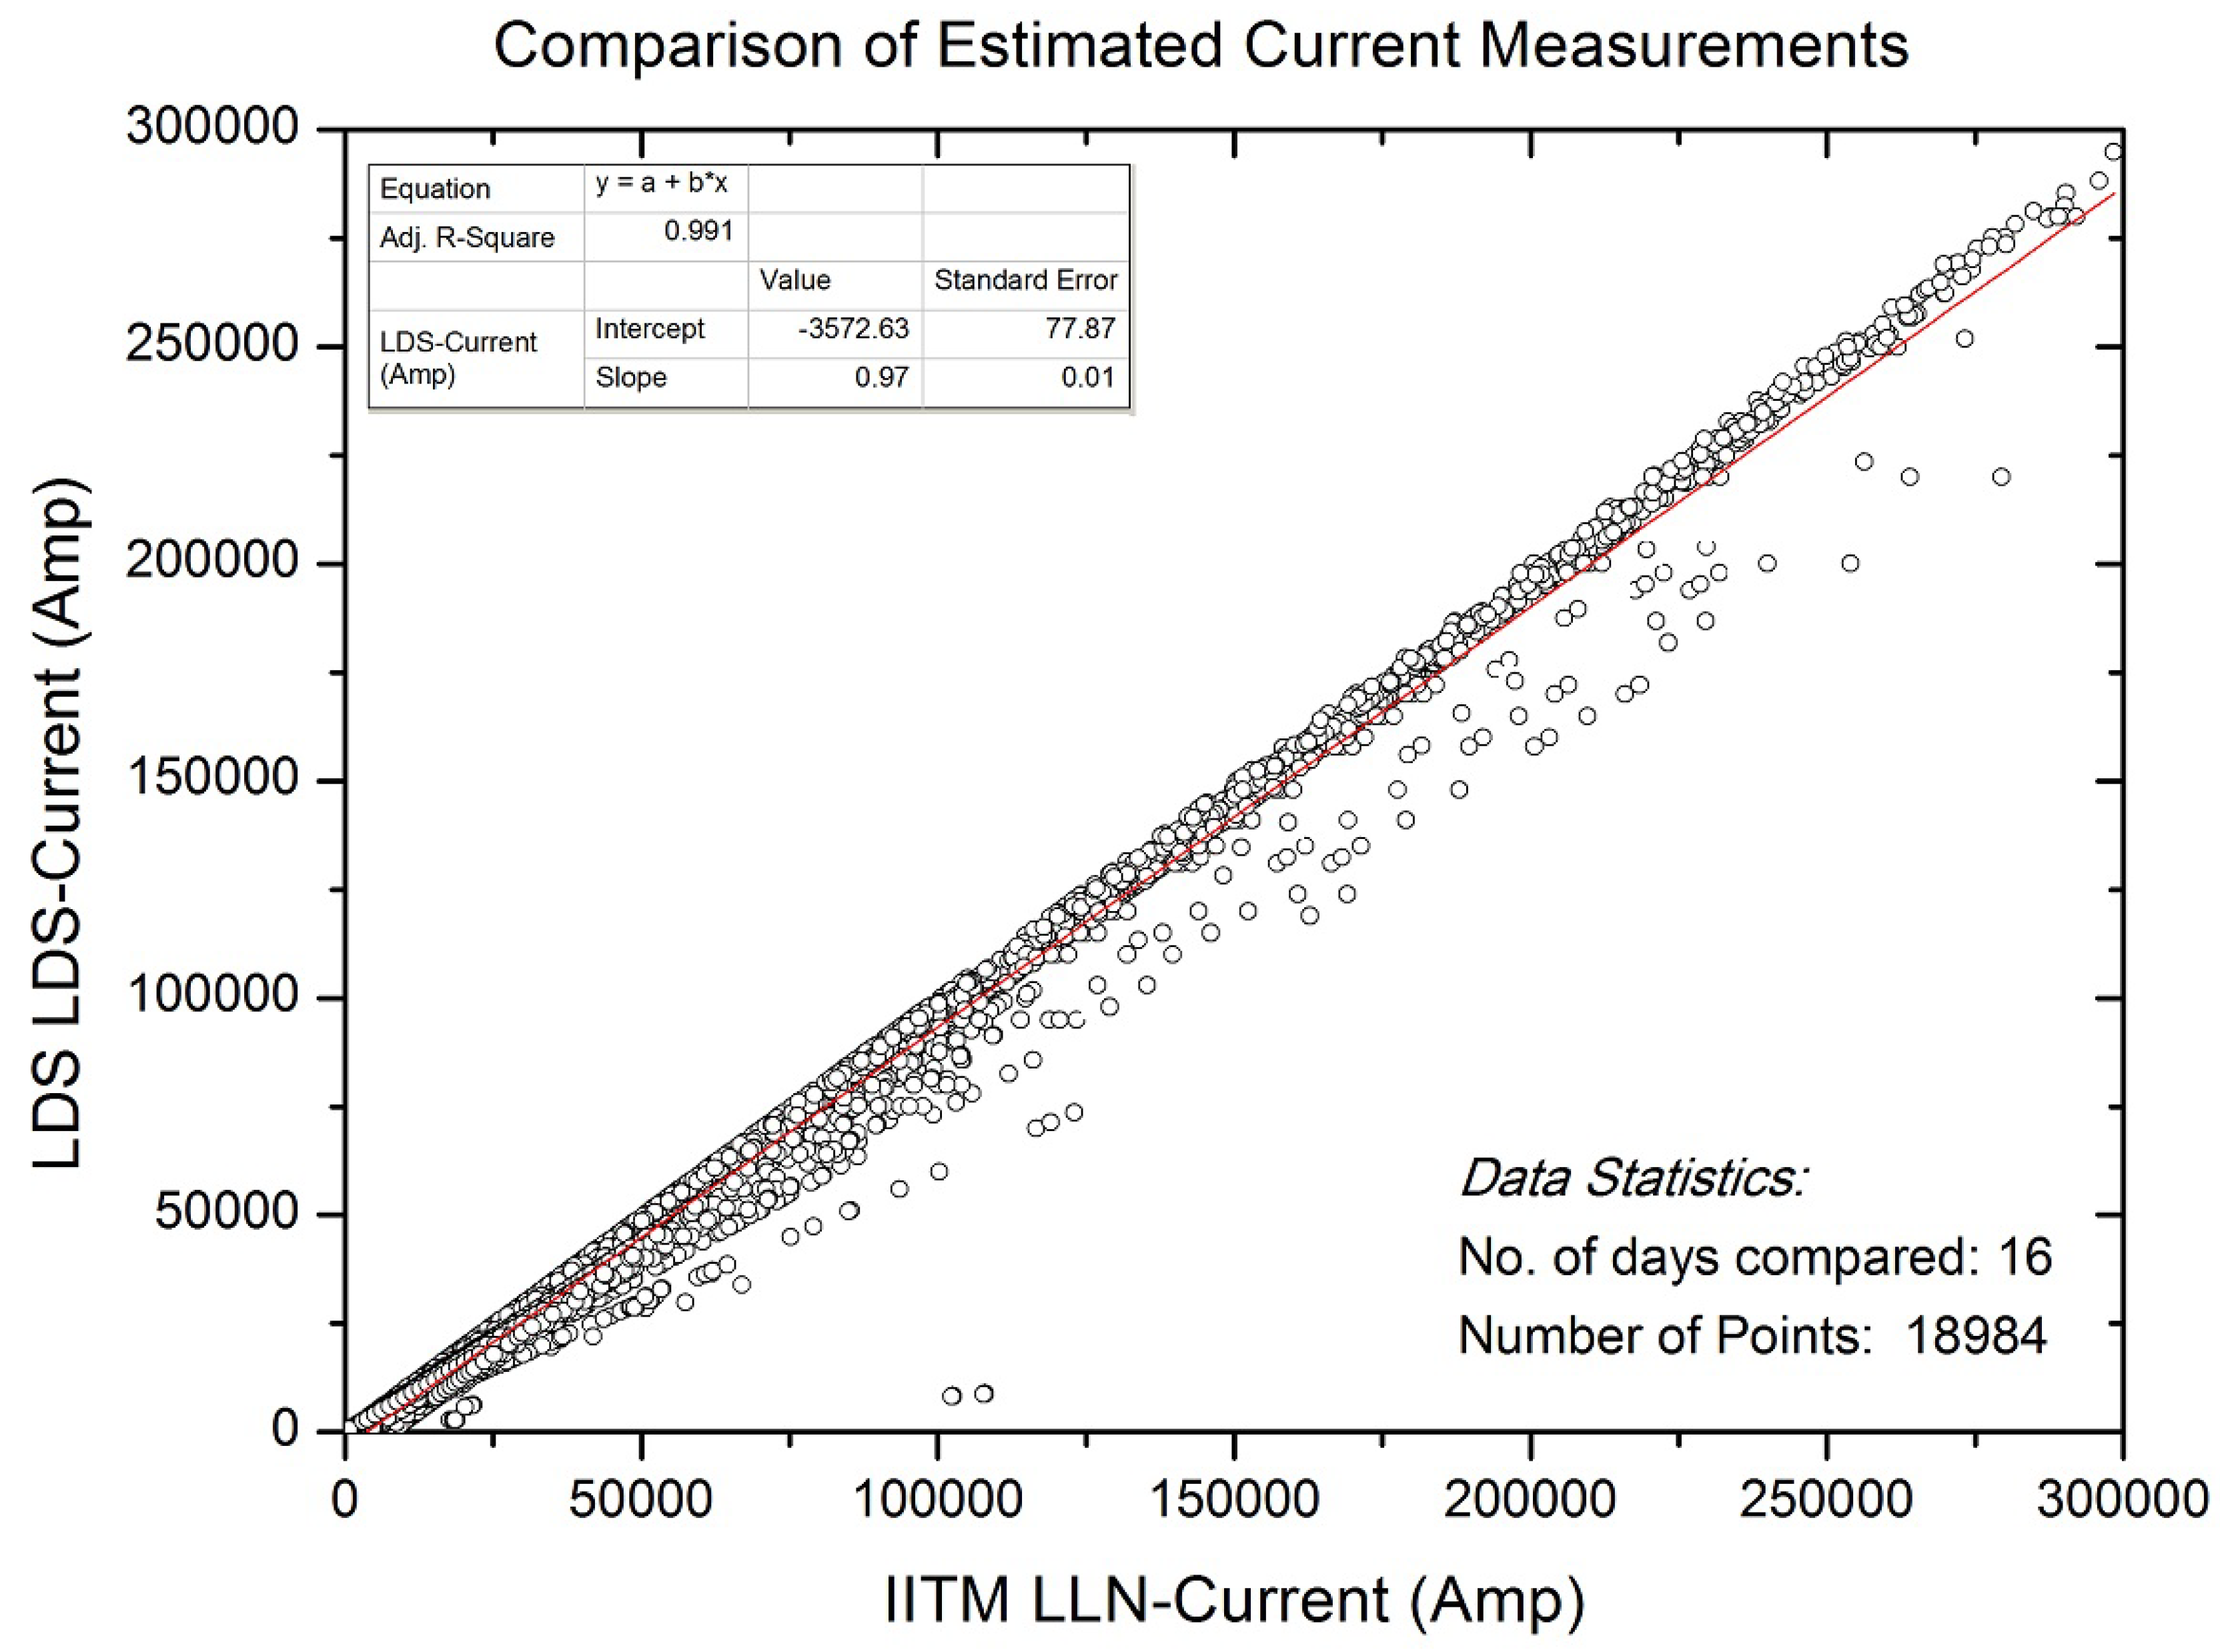
To estimate the relation between these two independent estimates of the flash current, 5 days of continuous data (04 – 09 January 2020) having the current estimates of each flash occurrence have been utilized. This encompasses 18984 points of flash occurrences. Result of this comparison is shown in
Figure 5. The x-axis in
Figure 5 show the IITM-LLN network deduced current data while the y-axis exhibits the current estimated by the NRSC LDSN.
One may note from the
Figure 2,
Figure 3 and
Figure 4 as well as the
Figure 5 that both the network show good agreement in the estimates. It is evident from the
Figure 5 that two networks estimates of the lightning currents are a kin to each other. The occasional differences between them is also noted which may be due to the differences in the number of sensors. The NRSC LDS network has 46 sensors while the IITM/IMD is operating with 134 sensors as on January 2022. However, a linear fit signifies good correlation between these estimates (Corr Coeff. 0.99) with following relation.
Above relation suggests that the NRSC LDS has not monitored the flashes which have the associated current below 3573 Amp and the error in the NRSC estimates is about 78 Amp in this data set. It is obvious that with less number of sensors deployed, the NRSC LDSN provide reasonably good estimates as far as the cloud to ground lightning and its current estimates are concerned. This also signifies that there is no linear relation between the performance of the network and the number of sensors employed.
4. A Case of Lightning Hazards on 06 January 2021
Though there were a number of lightning occurrences throughout India on 06 January 2020. However, on this day,
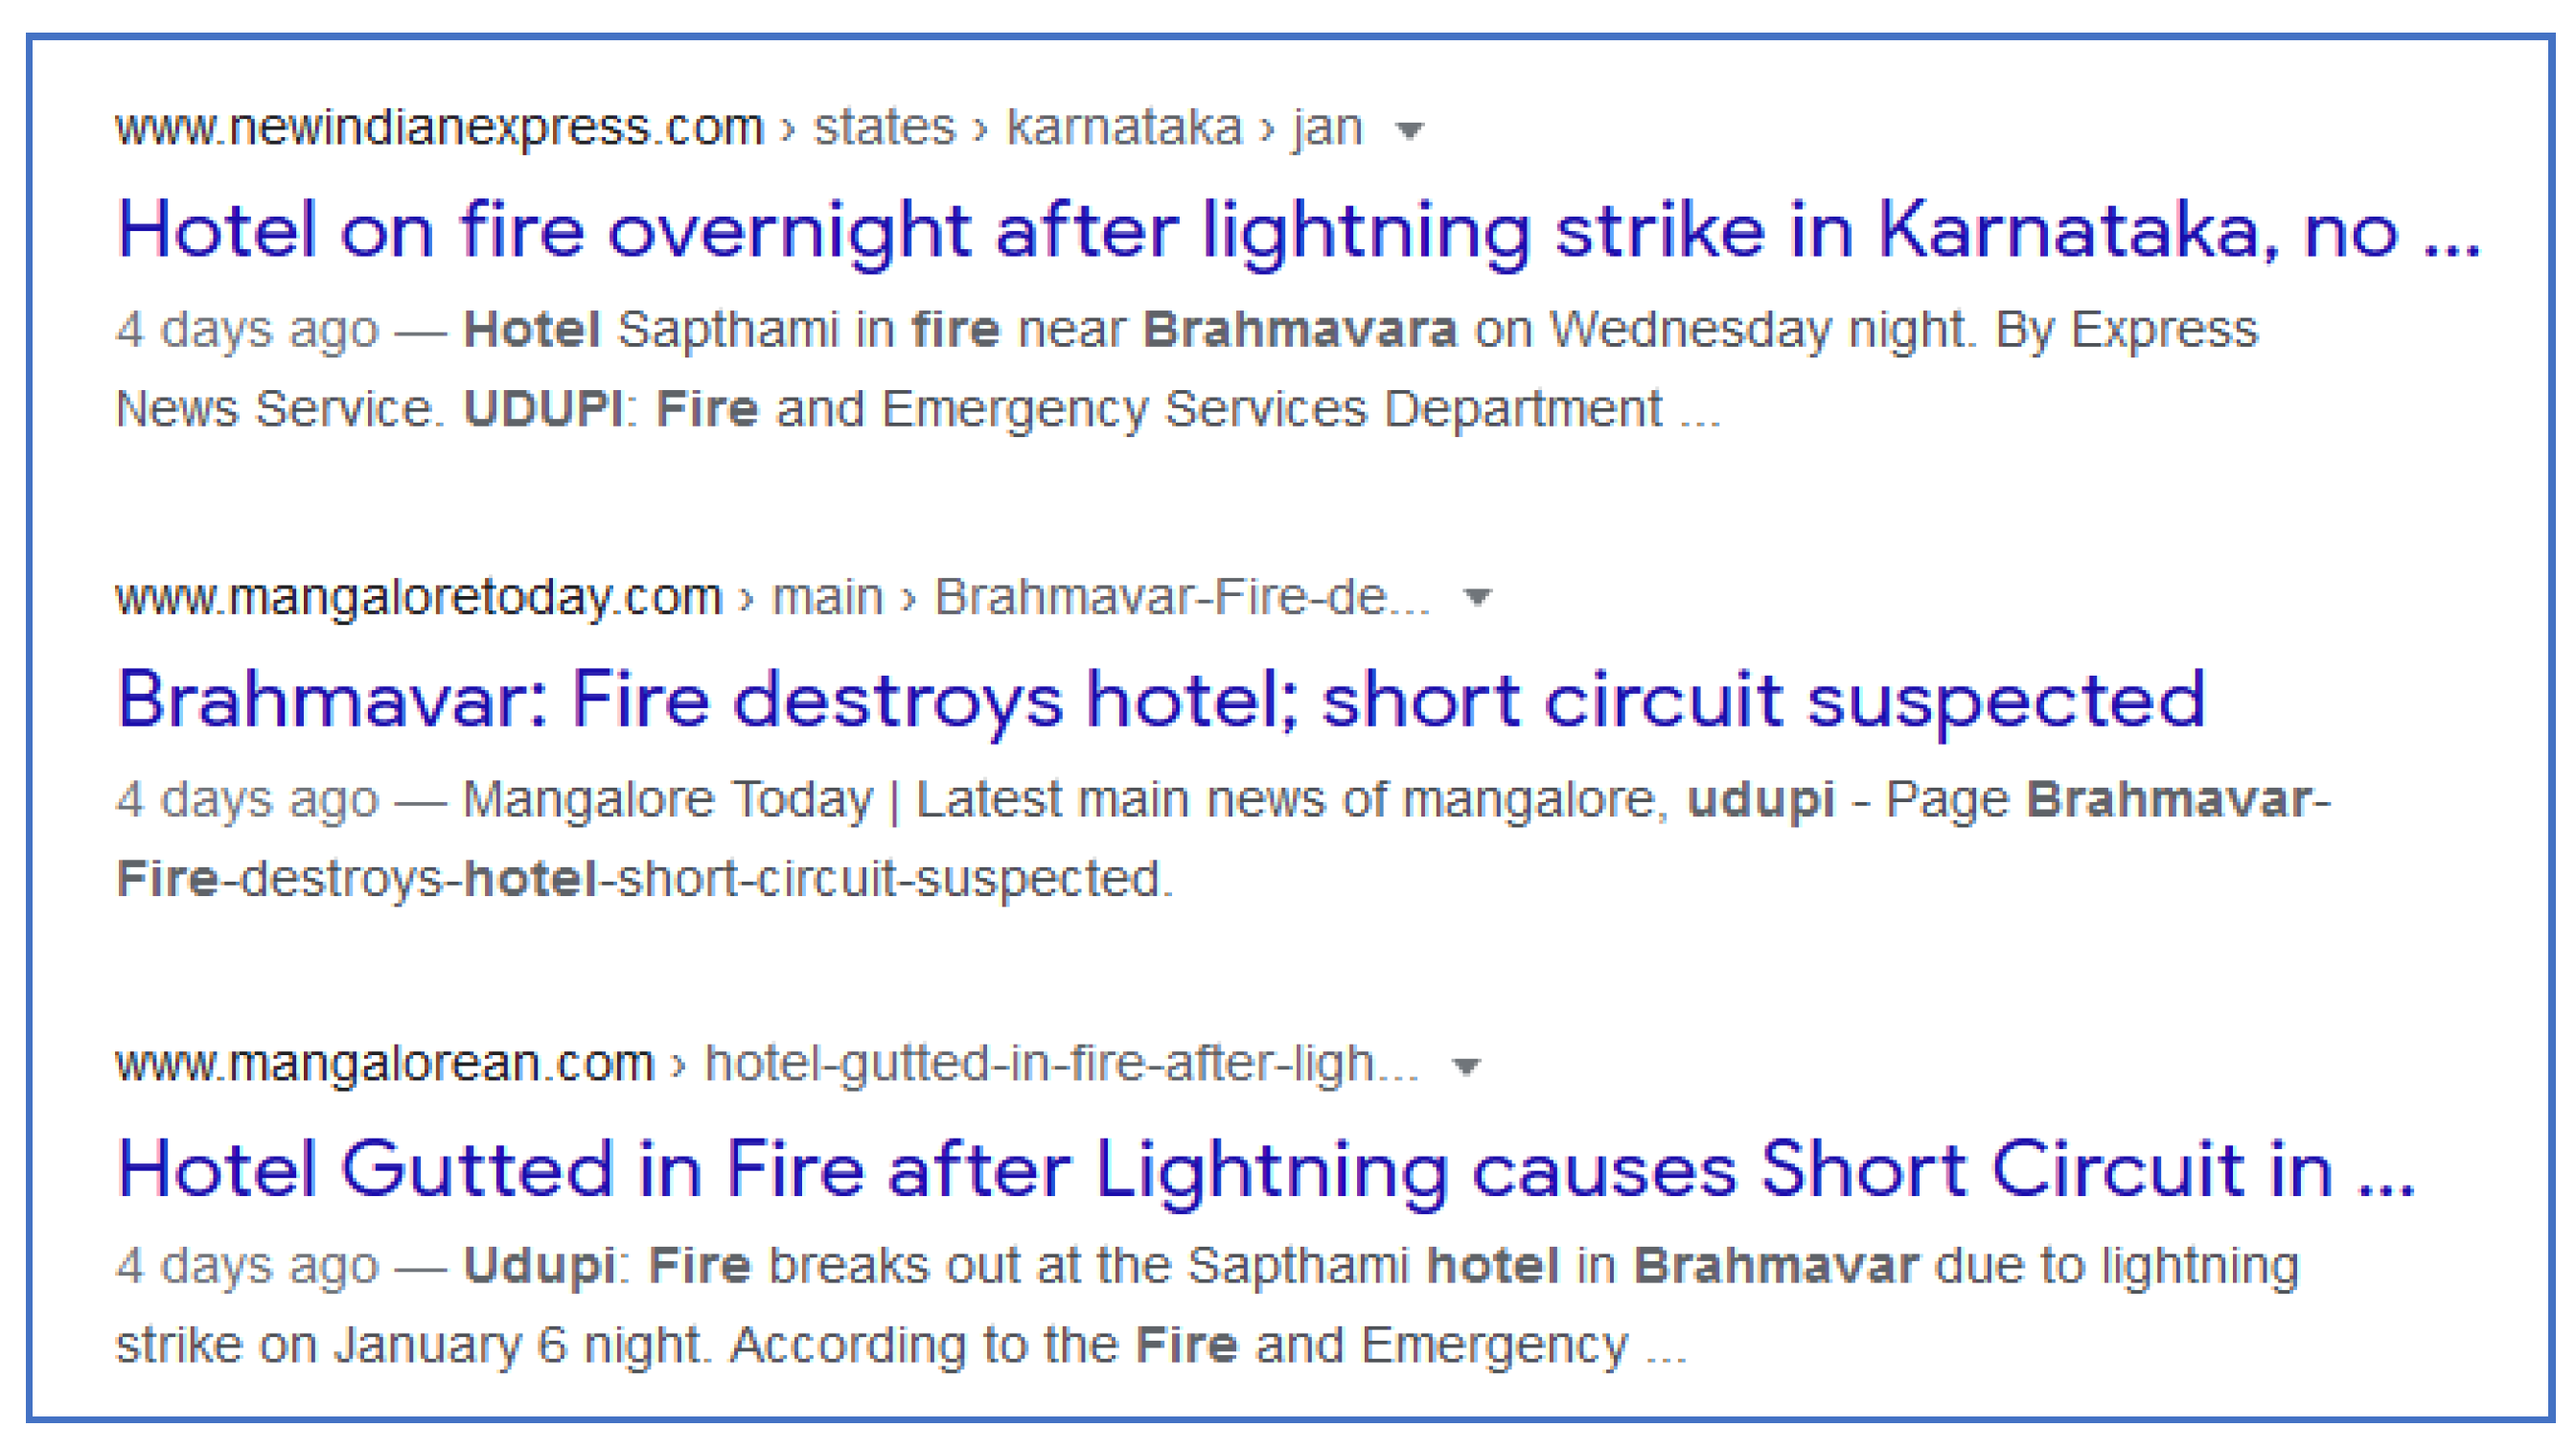
Udupi substation of Mangaluru All India Radio, located at Brahmavara received a number of atmospheric lightning occurrences. Around 0800 PM, a hotel named ‘Sapthami’ in Brahmavara, Udupi, Karnataka was charred in fire (
https://www.newindianexpress.com/states/karnataka/2021/Jan/07/hotel-on-fire-overnight-afterlightning-strike-in-karnataka-no-injuries-2246726.html). Investigations revealed that a short circuit due to lightning was the root cause of the fire incident and further devastation. The eye witnesses on television news stated that the event of heavy lightning lasted for about 2 minutes after which the building was ablated. A set of newspaper clip of the event is shown in
Figure 6.
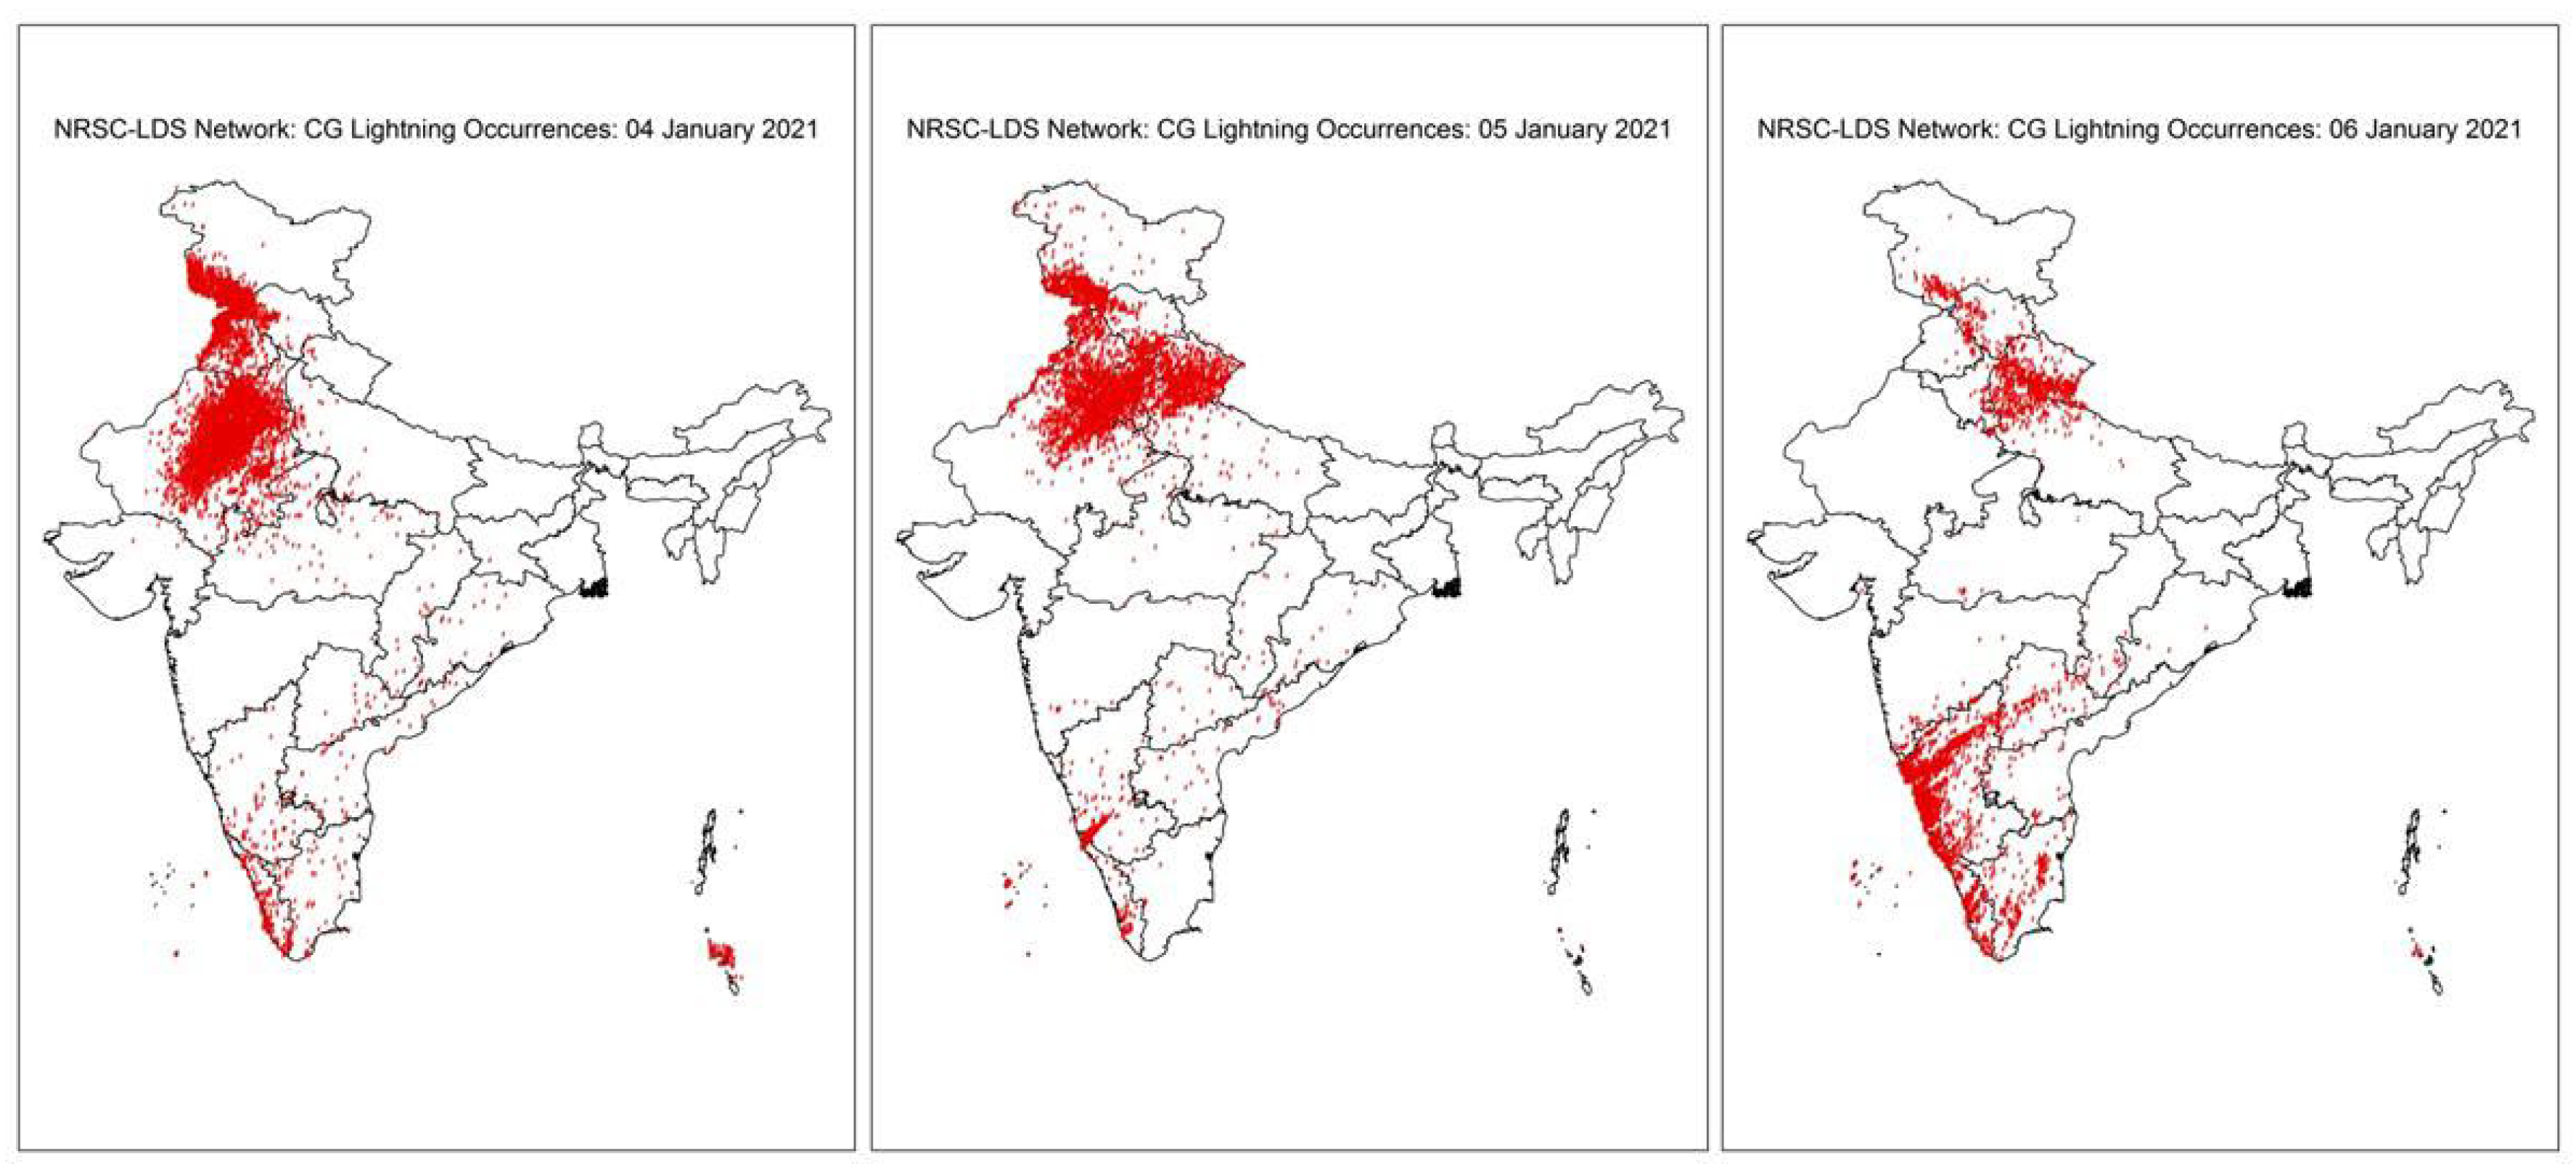
We investigated this event in detail with the Cloud-to-ground (CG) lightning flash occurrences noted during 04 – 06 January 2021 over the mainland India shown in the
Figure 7.
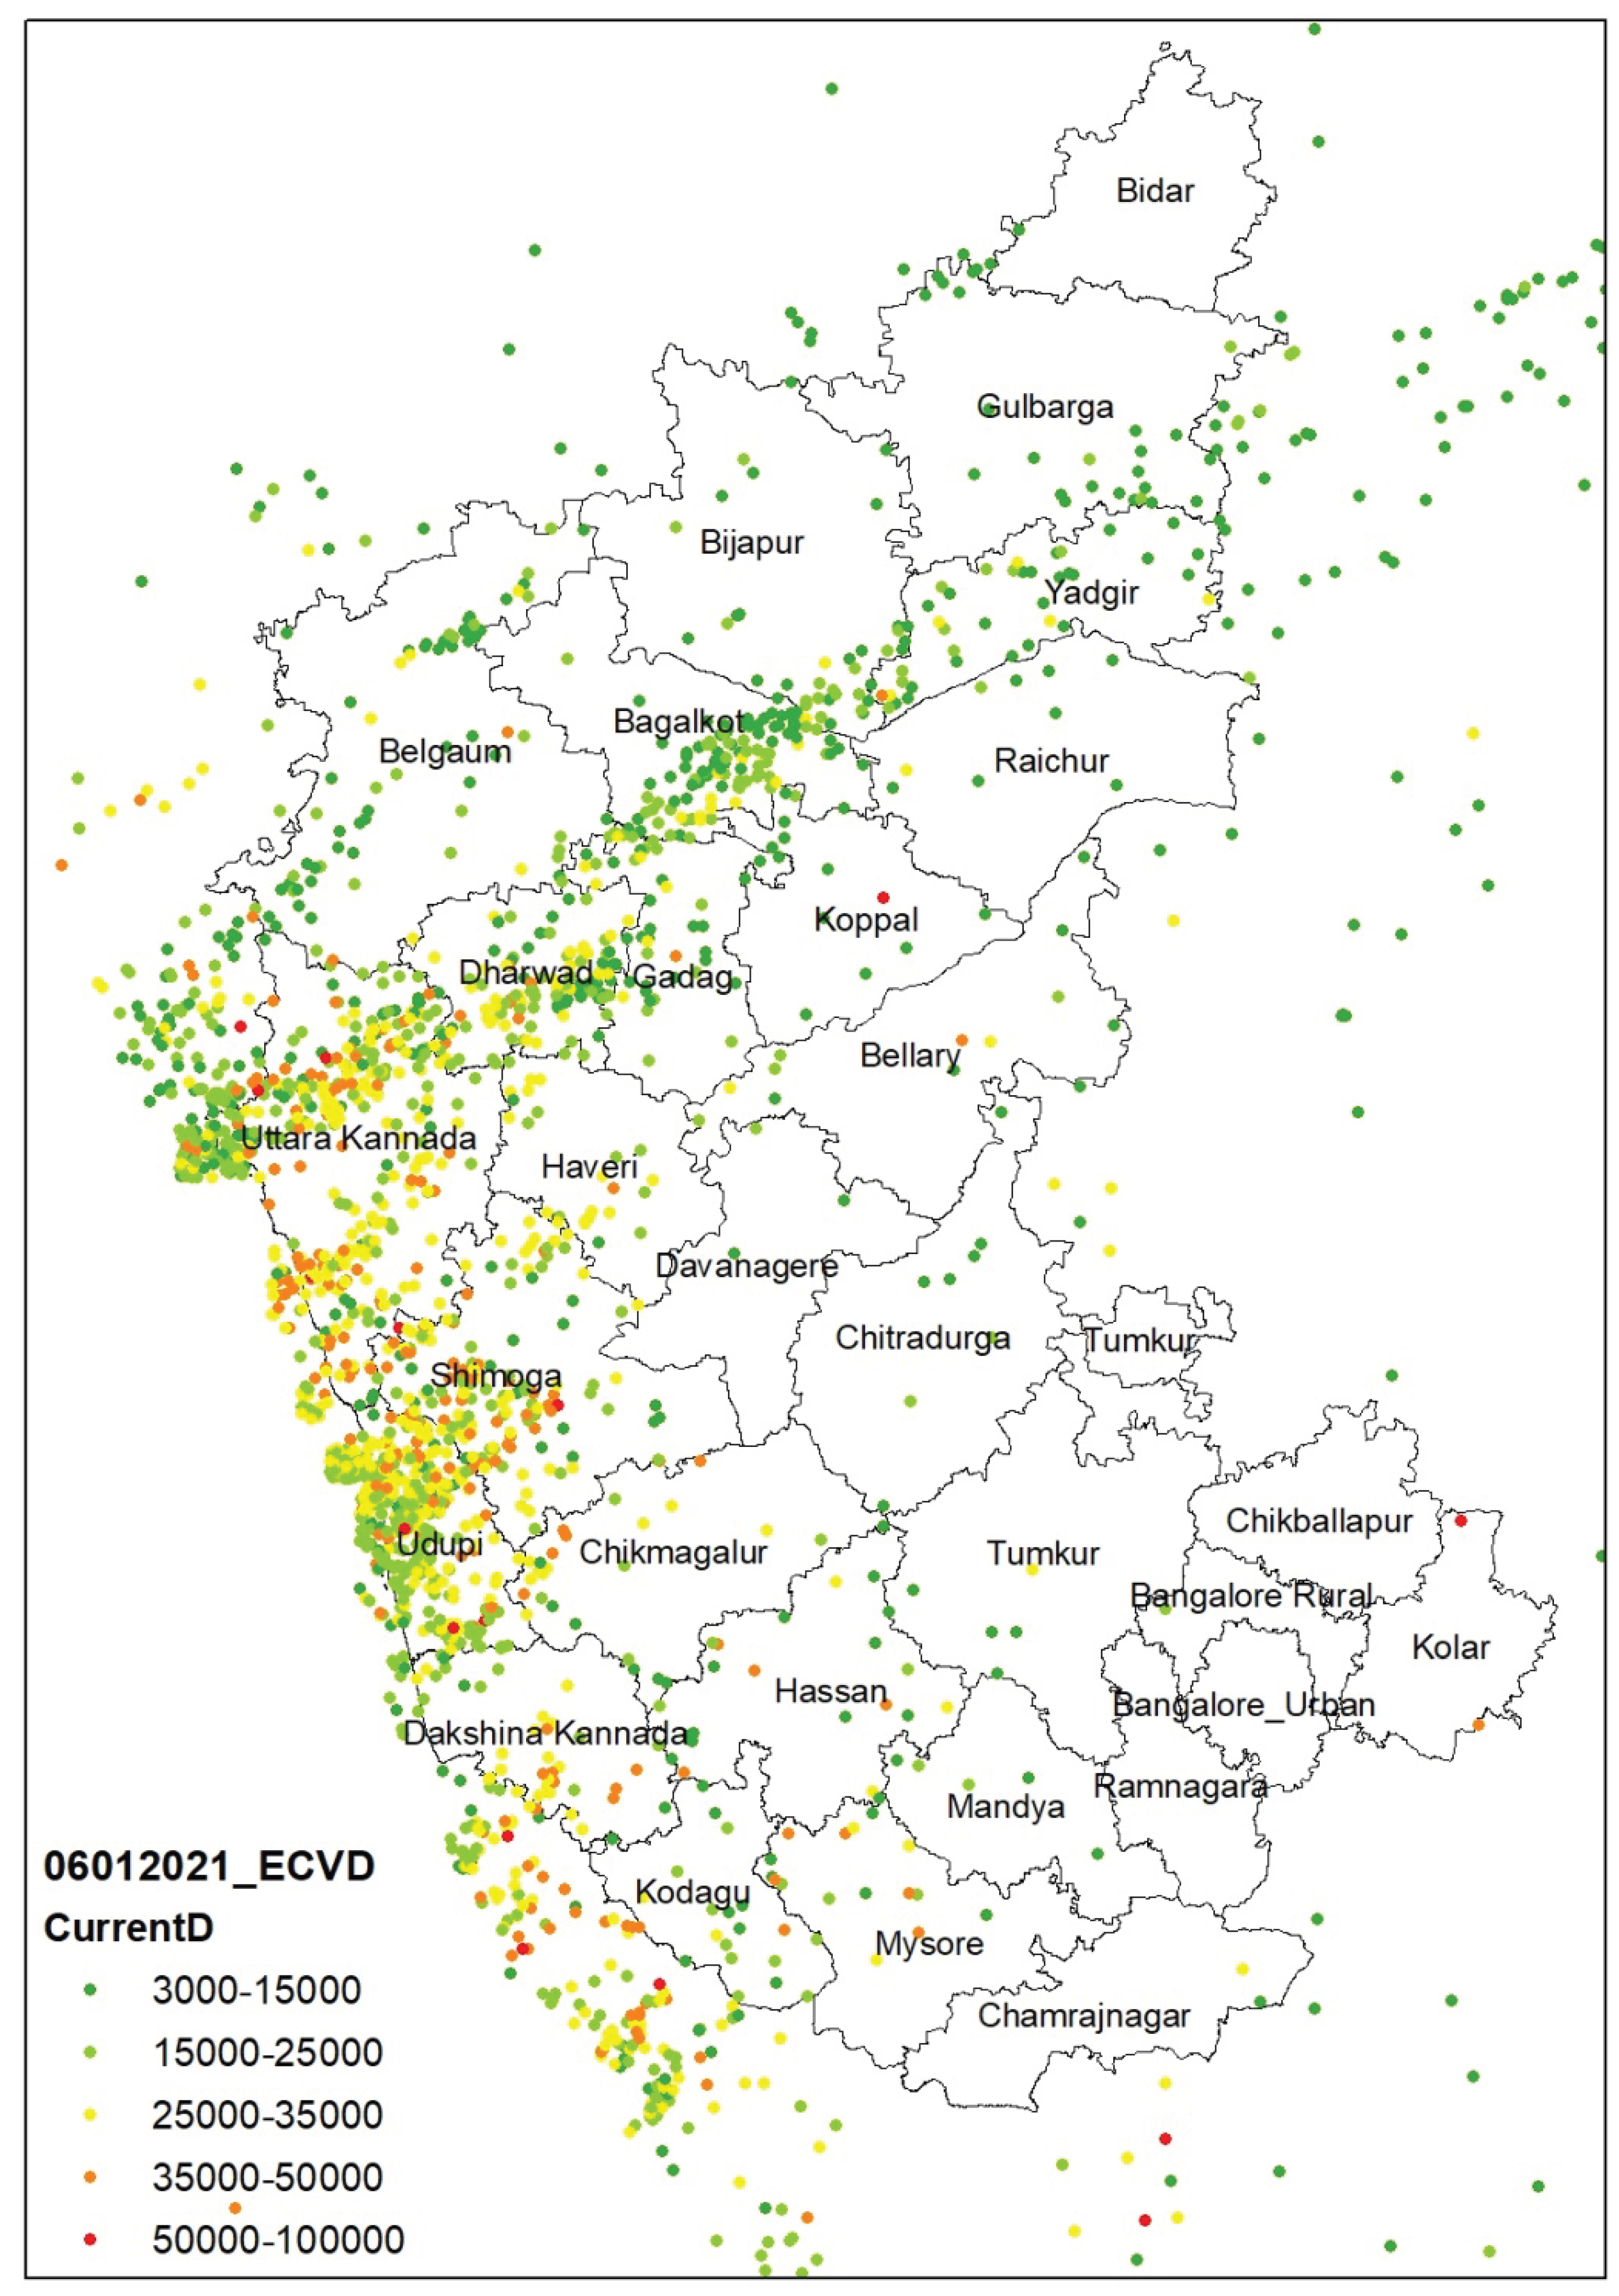
It is noteworthy that though there had been a number of lightning occurrences on this day, the significant density of lightning occurrences are over the northern states of the India. Therefore, it is pertinent to know about the severity of each flash event. As the number of occurrences alone does not tell about the severity of the event, we calculated the amount of static electric current involved in each flash in Karnataka.
Figure 8 show the static current associated with each flash. We note that over Brahmavara, Udupi, very close to the event of occurrence, at least four dangerous events occurred.
We noted that the static current discharge occurred over the Brahmavara was very close to 62000 Amp which falls into the dangerous category as stated by the color coded category classification, while over the other parts of India the current ranged from 5000 Amp to 40000 Amp. As the event passed the current reduced to about 17300 amperes however, the flashes repeated at similar locations till 0257 PM UT, viz., 0837 PM IST. Under such high current situation, if not through the direct incidence, the induced ground currents may have caused the short-circuit in the hotel circuitry which may have caused the fire at the location of event (e.g., Mansoor and Martzloff, 1998; Schoene et al., 2009).
This investigation also indicate that it is pertinent to know the status of proper earthing and status of the lightning arresters installed over a building so that such incidences could be avoided. It would be appropriate to suggest that the lightning arresters should have enough capacity to stop the maximum surge as dictated by the maximum current associated with the lightning flashes which may vary from one region to the other. It is important not only from the safety of the establishments but also to safeguard the life around.
5. Conclusion
As stated in earlier section, we note that there are systematic differences between the two estimates. This may be due to the inherent differences in the sensors used for the observations. We believe that these offsets can be reduced upon the comprehensive inter-calibration and enhanced sensor densities. This statement can be evaluated from
Figure 3 and
Figure 4 that over Andhra Pradesh, which is covered with more than 6 sensors, differences in the current estimates between the two networks are significantly less (< 10%). The differences in the measured current over the north-east region ranged between 10% – 15%, where sensor density is less. However, often the comparison between these network is very good indicating that both network overall are in agreement.
It is important to note that the event shown here was only 62000 Amp, while, we noted that sometimes they are much higher and sometimes to the range of 200 K Amp. Therefore, there is a need for lightning protection devises which can withstand the currents as high as 200K Amp.
Author Contributions
AT designed and established the LDS network, AS and DV helped in management and troubleshooting occurring time to time, GSR helped in overall administration and provided support to the LDSN project, SP supplied the IITM-LLN data for a comparison while Mallikarjun helped in day-to-day maintenance of the LDSN data.
Funding
The present work is supported by the Department of Space, ISRO under the NICES program.
Data Availability Statement
Acknowledgments
The NRSC-LDS network is funded through National Information System for Climate and Environment Studies (NICES) program of NRSC, ISRO, Dept. of Space. Authors thank Director, NRSC; Associate Director, NRSC and PPEG, NRSC for their continued support. The support of Chief General Manager, RC’s, NRSC; Dr. G. Sreenivasan, DGM, RC-Central; Dr. Chirinjivi Jayaram (RC-East) and Dr. S. Rama Subramoniam (RC-South) in establishing and maintaining various LDS nodes is duly acknowledged. Authors acknowledge the help received from Mr. J. Sairamakrishna and Mr. Arul Raj of BWSD, NRSC, for hosting the LDSN data on the BHUVAN portal. Authors thank Robert Boll of Boltek Inc., Canada, and Shri Jatinder Pal Singh of Dhruva Tech., New Delhi for their time-to-time help.
Conflicts of Interest
The authors declare no conflicts of interest.
References
- Betz Hans, D. , Schmidt Kersten, Laroche Pierre, Blanchet Patrice, Oettinger Wolf P, Defer Eric, Dziewit Z, Konarski JLINET - An international lightning detection network in Europe. Atmospheric Research 2009, 91, 564–573. [Google Scholar] [CrossRef]
- Cecil D J, Buechler D E, Blakeslee R J (2014) Gridded lightning climatology from TRMM-LIS and OTD: Data set description. Atmos. Res. 135–136 404–414. [CrossRef]
- GCOS Report. https://gcos.wmo.int/en/essential-climate-variables, June 2016.
- Goodman, Steven J.; Gurka, James; DeMaria, Mark; Schmit, Timothy J.; Mostek, Anthony; Jedlovec, Gary; Siewert, Chris; Feltz, Wayne; Gerth, Jordan; Brummer, Renate; Miller, Steven; Reed, Bonnie; Reynolds, Richard R., The GOES-R Proving Ground: Accelerating User Readiness for the Next-Generation Geostationary Environmental Satellite System”. Bulletin of the American Meteorological Society. 93 (7): 1029–1040. [CrossRef]
- Jacobson Abram R, Holzworth Robert H, Jeremiah Harlin, Dowden R L, Lay E H (2006) Performance assessment of the World Wide Lightning Location Network (WWLLN), using the Los Alamos Sferic Array (LASA) array as ground-truth. Journal of Atmospheric and Oceanic Technology, 23, 1082-1092. [CrossRef]
- Johnson, D. L. , and W. W. Vaughan, Analysis and assessment of peak lightning current probabilities at the NASA Kennedy space centre, NASA/TM-2000-210131, 1999.
- Liaw Y. P., D. R. Cook, and D. L. Sisterson, Estimation of Lightning Stroke Peak Current as a Function of Peak Electric Field and the Normalized Amplitude of Signal Strength: Corrections and Improvements, Journal of Atmospheric and Oceanic Technology. [CrossRef]
- Mansoor, A. Mansoor, A. And Martzloff F., The Effect of Neutral Earthing Practices on Lightning Current Dispersion in a Low-Voltage Installation, IEEE Transactions on Power Delivery, Vol. 13, No. 3, 783-792, July 1998.
- Orville,R. E., Calibration of a magnetic direction finding network using measured triggered lightning return stroke peak current, J. Geophys. Res., 96, 17,135-17,142, 1991.
- Price, Collin G., Lightning Applications in Weather and Climate Research, Survy. Geophys. [CrossRef]
- Rodger Craig J, Simon Werner, Brundell J B, Lay E H, Thomson N R, Holzworth R H, Dowden R L (2006) Detection efficiency of the VLF World-Wide Lightning Location Network (WWLLN): Initial case study. Ann. Geophys., 24, 3197-3214, 2006 Ann. Geophys., 24, 3197–3214. [CrossRef]
- Romps, D. M., J. T. Seeley, D. Vollaro, and J. Molinari, Projected increase in lightning strikes in the United States due to global warming, Science, 346, 6211, 851–854. [CrossRef]
- Schoene, J., V. A. Rakov, J. Jerauld, Keith J. Rambo, D. M. Jordan, G. H. Schnetzer, M. Paolone, C. A. Nucci, E. Petrache, and F. Rachidi, Lightning Currents Flowing in the Soil and Entering a Test Power Distribution Line Via Its Grounding, IEEE Transactions on Power Delivery, vol. 24, No. 3, 1095-1103, July 2009.
- Taori, A. , Suryavanshi, A., Gharai, B., Seshasai, M.V.R., Atmospheric Lightning as Essential Climate Variable (ECV) and Its Availability Over India Using NRSC/ISRO Lightning Detection Sensor Network, Preprints, 2021120183. [CrossRef]
- Taori A, Suryavanshi A, Pawar S, Seshasai M V R, Establishment of lightning detection sensors network in India: generation of essential climate variable and characterization of cloud-to-ground lightning occurrences. Natural Hazards, 111, 19–32. [CrossRef]
|
Disclaimer/Publisher’s Note: The statements, opinions and data contained in all publications are solely those of the individual author(s) and contributor(s) and not of MDPI and/or the editor(s). MDPI and/or the editor(s) disclaim responsibility for any injury to people or property resulting from any ideas, methods, instructions or products referred to in the content. |
© 2024 by the authors. Licensee MDPI, Basel, Switzerland. This article is an open access article distributed under the terms and conditions of the Creative Commons Attribution (CC BY) license (http://creativecommons.org/licenses/by/4.0/).

