Preprint
Article

A Comparative Study of Indentation Size Effect Models for Different Materials

Altmetrics

Downloads

120

Views

52

Comments

0

A peer-reviewed article of this preprint also exists.

This version is not peer-reviewed

Submitted:

01 April 2024

Posted:

10 April 2024

You are already at the latest version

Alerts
Abstract
Although researchers have proposed various indentation size effect (ISE) models, these models often involve different form and number of parameters that can make our wonder which is the best in existed ISE models. Three types of ISE test data, namely, normal ISE, reverse ISE and transition of normal to reverse ISE, are used to evaluate the sixteen ISE models. The comparatively study indicates that H-J, N-G-Fs, N-G-H, N-G-A and N-G-Qs models can accurately predict the normal ISE. The reason for this is that the friction stress that is not related to dislocation activities or the indentation size effect of plastic zone has been introduced into these models. Therefore, these two factors should be considered in future ISE models. The sixteen ISE models are originally proposed to describe the normal ISE of different materials. However, to our surprise, some of these models are able to capture the reverse ISE and the transition of normal to reverse ISE of different materials. The determination coefficients (DC) of the sixteen ISE models are also determined for different materials. For reverse ISE, the highest DC value for NiCSi, TC4 and PED Ni are given by the EXP, N-G-Fs and N-G-A models, respectively. For the transition of normal to reverse ISE, the N-G-YC, N-G-Fs, and N-G-H models produce the maximum DC for ZrO2, Cu and Y2O3-ZrO2, respectively. Moreover, the mean DC of the N-G-Fs model is the maximum among the sixteen ISE models, followed by the N-G-H model, but they cannot accurately predict the reverse ISE. Therefore, the N-G-Fs and N-G-H models should be further modified to accurately predict the reverse ISE.
Keywords: 
Subject: Engineering  -   Other

1. Introduction

In traditional mechanical test, standard tensile specimen needs to be cut from materials or structure for obtaining the mechanical properties of materials. However, for service equipment, small size materials and expensive materials in aerospace, nuclear power, microelectronics, medicine and other fields, it is difficult to obtain the mechanical properties parameters by the traditional mechanical test. Due to the “no sample” and “micro damage”, the indentation test has been proposed by Oliver and Pharr, and widely employed to calculate the elasticity modulus and flow stress of different materials [1,2,3,4,5]. The phenomenon of indentation size effect (ISE), which the measured hardness changes with indentation depth, have been observed in various materials such as metallic, ceramics, fibers and thin films [6,7,8,9,10].
Over the past several decades, several theories had been developed to explain the phenomenon of ISE. The major explanations of ISE can be classified into three branches: the energy balance theory, the strain gradient plasticity theory and the dislocation theory [11]. In addition, other factors can be regarded to cause the ISE, which include friction between the surface and the indenter [12], variation of contact surface [13], presence of residual surface stress [14], energy dissipation associated with the contact surfaces [15], variation in solid load bearing contact area inside the indentation region [16], the role of elastic deformation [17], and pre-existing defects [18].
Based on above explanations and experimental data, many ISE models have been proposed to describe the ISE. An empirical power function of applied load and indentation diagonal is introduced by Meyer. According to Hays and Kendall [19], there is a threshold minimum load that must be surpassed for plastic deformation to take place. Li and Bradt [20] formulated the proportional specimen resistance (PSR) model by taking into account energy balance. Gong et al. [14] have proposed a modified proportional specimen resistance (MPSR) model, taking into account the impact of residual compressive or tensile stress on hardness measurements. An elastic plastic deformation (EPD) model, which was introduced by Bull et al. [21], suggested that the elastic stresses at the indentation edge are a direct result of the discrete plastic deformation. Ruiz-Moreno et al. [22] proposed an empirical model based on exponential function. A model, which taking into account the contribution of grain size and dislocation pinning defects, was developed by Hou and Jennet [23].
One of the most popular models of ISE is the Nix-Gao model which considers the variation of geometrically necessary dislocations (GND) density with indentation depth [24]. However, further nanoindentation analysis revealed that the Nix-Gao model tends to overestimate hardness in cases of extremely shallow indentations, due to the intense repulsive force between GNDs [25]. Therefore, Swadener et al. [25]., Feng and Nix [26], and Durst et al. [27] thought that the Nix-Gao model should be modified by considering that the ratio of the size of plastic zone to indentation depth is not fixed. A modified version of the Nix-Gao model was developed by Huang et al. [28] for assessing nano-indentation hardness, taking into account a maximum permissible GND density. Feng-Nix [26] and Haušild [29] had incorporated the exponentially decay function and negative power function into the Nix-Gao model to depict the connection between plastic zone size and indentation depth, respectively. In the meantime, Abu Al-Rub [30] enhanced the Nix-Gao model by incorporating the Taylor hardening law, which takes into account nonlinearity of flow stresses caused by both SSDs and GNDs. Qiu et al. [31] improved the Nix-Gao model by introducing the friction stress that was not related to dislocation activities. Different with above modification, Yuan and Chen [32] improved the Nix-Gao model by a gradient plasticity model with an intrinsic micro-material length. Liu et al. [17] had integrated elastic deformation into the Nix-Gao model to enhance its applicability for predicting ISE at depths below 100 nm.
Above models have contributed to comprehensively understand the ISE. These models often involve different form and number of parameters that can make our wonder which is the best in existed ISE models. So far, Nix-Gao model and four modification of it are evaluated by Haušild [29]. Renjo et al. [1], Maiti et al. [33], Alao et al. [34], and Kathavate et al. [35] used part of models to predict the ISE of specific material. And others only compared Nix-Gao model with one improved by themselves [26,30,31]. However, to the best of our knowledge, a comprehensive and quantitative evaluation of existed ISE modes is still lacked for various materials. In this paper, existed ISE modes are reviewed. The ISE data of different materials are assembled from publications. These reviewed models are then applied to predict the ISE of assembled data. After presenting the predicted results and evaluating the accuracy of each model for different materials, the suitable models are recommended to describe the specific ISE of different materials.

2. Indentation Size Effect (ISE) Models

In this section, sixteen ISE models of isotropic materials will be reviewed in the follow. Readers should note that the ISE models of multilayers and bicrystals materials are not covered in this article [36,37,38,39,40].

2.1. Meyer Model

An empirical power function of applied load and indentation diagonal is introduced by Meyer as follow:
P = α 1 d m
where P is the maximum load applied during the indention test, d is the indentation length, m and α1 are Meyer’s index and material constant, respectively.
For a given indenter, a linear relation is assumed between indentation length d and indentation depth h as follow:
h = α 2 d
If taking no account of tip bluntness, the contact area A is proportional to the contact area of the indenter d2, which can be expressed as:
A = α 3 d 2 = α 3 α 2 2 h 2
where α2 and α3 are the constants that depend on indenter geometry.
Combining Equations (1)–(3) and hardness H = P/A, the Meyer model is obtained as:
H = m 1 h m 0
where m1 = α1/[α3(α2)n-2] ≥ 0 and m0 = 2-m ≥ 0 are constants depends on material and indenter geometry.

2.2. Hays and Kendall (H-K) Model

According to Hays and Kendall [2], plastic deformation can only occur after a minimum load has been surpassed. The relationship between the applied load P and the indentation diagonal d is described as follows:
P = k 0 + k 1 d 2
where k0 is required load of producing the initial plastic deformation, and k1 is the load independent constant.
Combining Equations (1)–(3) and hardness H = P/A, the H-K model is obtained as:
H = k 2 + k 3 h 2
where k2 = k1/α3 ≥ 0 and k3 = k0(α2)2/α3 ≥ 0.

2.3. Proportional Specimen Resistance (PSR) Model

Taking into consideration energy balance, Li and Bradt [20] given a correlation between the applied load P and indentation diagonal d as
P = l 1 d + l 2 d 2
where l1 and l2 are the elastic and friction resistance at indenter/specimen interface and plastic deformation constant, respectively.
Combining Equations (1)–(3) and hardness H = P/A, the PSR model is determined as:
H = b 0 + b 1 h
where b0 = l2/α3 ≥ 0 and b1 = l1α2/α3 ≥ 0.

2.4. Modified Proportional Specimen Resistance (MPSR) Model

Taking into account the impact of residual compressive or tensile stress on hardness measurements, Gong et al. [14] had proposed a modified proportional specimen resistance (MPSR) model as follow:
P = a 0 + a 1 d + a 2 d 2
where l0 is the induced-residual stress effect during surface preparations, l1 and l2 are described previously.
Combining Equations (1)–(3) and hardness H = P/A, the MPSR model is determined as:
H = g 0 + g 1 h + g 2 h 2
where g2 = a0(α2)2/α3, g0 = a2/α3 ≥ 0 and g1 = a1α2/α3 are constants.

2.5. Elastic Plastic Deformation (EPD) Model

Assuming that the elastic stresses at the indentation edge are a direct result of the discrete plastic deformation, the EPD model is introduced by Bull et al. [21] as:
H = e 0 + e 1 h 2
where e0 ≥ 0 and e1 ≥ 0 are constants depends on material and indenter geometry.

2.6. Exponential (EXP) Model

An empirical model, which based on exponential function, is proposed by Ruiz-Moreno et al. [22] as follow:
H = r 1 exp r 2 h + r 3
where r1, r2 and r3 are constants.

2.7. Hou-Jennet(H-J) Model

Considering the contribution of grain size and dislocation pinning defects on the flow stress (hardness) of a material, a model was developed by Hou and Jennet [23] as follow:
H = j 0 + j 1 h + j 2
where j2 = j3/D+j4r ≥ 0, D and r are grain size and density of dislocations respectively, j0 ≥ 0, j1 ≥ 0, j3 ≥ 0 and j4 ≥ 0 are material constants.

2.8. Nix-Gao (N-G) Model

Taking the effect densities of geometrically necessary and statistically stored dislocations on hardness into consideration, Nix–Gao model [24] is proposed by using the strain gradient plasticity theory to describe the ISE of crystalline materials, then the relation of indentation hardness and depth is given as follow:
H = H 0 1 + h 0 h
where H0 ≥ 0 is the classical indentation hardness which depends on density of statistically stored dislocations, indenter’s geometry, magnitude of the Burgers vector and material’s shear modulus in the deformation zone, h0 ≥ 0 is a length scale characterizing the depth dependence of hardness.

2.9. Nix-Gao-Feng (N-G-Fs) Model

Exponentially decay function that described the relationship between the size of plastic zone and indentation depth, had been used to modify the Nix-Gao model by Feng-Nix [26], then the relation of indentation hardness and depth is given as follow:
H = H 0 1 + 1 + r 0 exp h h 1 3 h 0 h
where r0 ≥ 0 and h1 ≥ 0 are fitting parameters.

2.10. Nix-Gao-Huangs (N-G-Hs) Model

A modified version of the Nix-Gao model was developed by Huang et al. [28] for assessing nano-indentation hardness, taking into account a maximum permissible GND density. The model given a piece-wise relation between indentation hardness and depth as follow:
H = H 0 1 + 2 h 0 3 h n a n o h < h n a n o H 0 1 + h 0 h h 0 h n a n o 2 3 h 3 h h n a n o
where hnano ≥ 0 is a new characteristic length for nano-indentation which depends on indenter’s geometry, magnitude of the Burgers vector and maximum allowable GND density in the deformation zone.

2.11. Nix-Gao-Haušild (N-G-H) Model

Haušild [29] assumes that the relation between number of dislocations contained in the effective plastic zone under the indenter and the penetration depth is a power function, then Nix-Gao model is modified as follow:
H = H 0 1 + 1 exp h n h 1 h 0 h
where h1 ≥ 0 is a parameter (of the similar meaning as in N-G-Hs model) and n is an exponent (shape parameter).

2.12. Nix–Gao-Abu Al-Rub (N-G-A) Model

Abu Al-Rub [30] enhanced the Nix-Gao model by incorporating the Taylor hardening law, which takes into account nonlinearity of flow stresses caused by both SSDs and GNDs. The relation of indentation hardness and depth of this model is given as follow:
H = H y + H 0 H y 1 + h 0 h β 2 1 β
where Hy ≥ 0 is the hardness related to the initial yield stress, and β ≥ 0 is the interaction coefficient.

2.13. Nix–Gao-Qius (N-G-Qs) Model

Introducing the intrinsic lattice resistance, the Nix-Gao model is improved by Qiu et al. [31] as follow:
H = 3 σ 0 + H 0 1 3 σ 0 H 0 2 + h 0 h
where σ0 is the contribution of friction stress to the tension flow stress.

2.14. Nix–Gao-Yuan-Chen (N-G-YC) Model

Yuan and Chen [32] improvs the Nix-Gao model by a gradient plasticity model with an intrinsic micro-material length, and the relation of indentation hardness and depth is expressed as follow:
H = H 0 1 + h 0 h h 3 h 2
where h3 ≥ 0 is the intrinsic micro-material length, and depends on the material property and the indenter geometry.

2.15. Nix–Gao-Lius (N-G-Ls) Model

Liu et al. [17] had integrated elastic deformation into the Nix-Gao model to enhance its applicability for predicting ISE at depths below 100 nm, and this model is expressed as follow:
H = H 0 1 + h 0 f 3 h 2 h π π 2 π h + ξ m c + d h h 0 f 3 h 3 h + ξ m c + d h h π π 2 π h + ξ m c + d h
where f is the ratio of GND storage region radius to the indentation radius, c and d are associated with load-indentation depth curve, ξ and m are geometric parameters accounting for the indenter shape, m = 2 for a conical tip and m = 1.5 for a spherical tip.

2.16. Li-Zhang -Hans (L-Z-Hs) Model

A mechanistic model incorporating surface undulation and indenter tip irregularity, which can simultaneously describe Normal and Reverse ISE, is proposed by Li et al. as follow [41]:
H = H 0 h h + δ m
where δ is the deviation of indentation depth, and caused by surface undulation and indenter tip irregularity. m = 2 for a conical tip and m = 1.5 for a spherical tip.

3. Collection of Experimental and Simulated Results

In recent decades, many researches have consistently shown that isotropic materials exhibit ISE when subjected to nanoindentation [17,26,29,41,42,43,44,45,46,47]. Three main types of ISEs are observed from experimental and simulated results as follow:
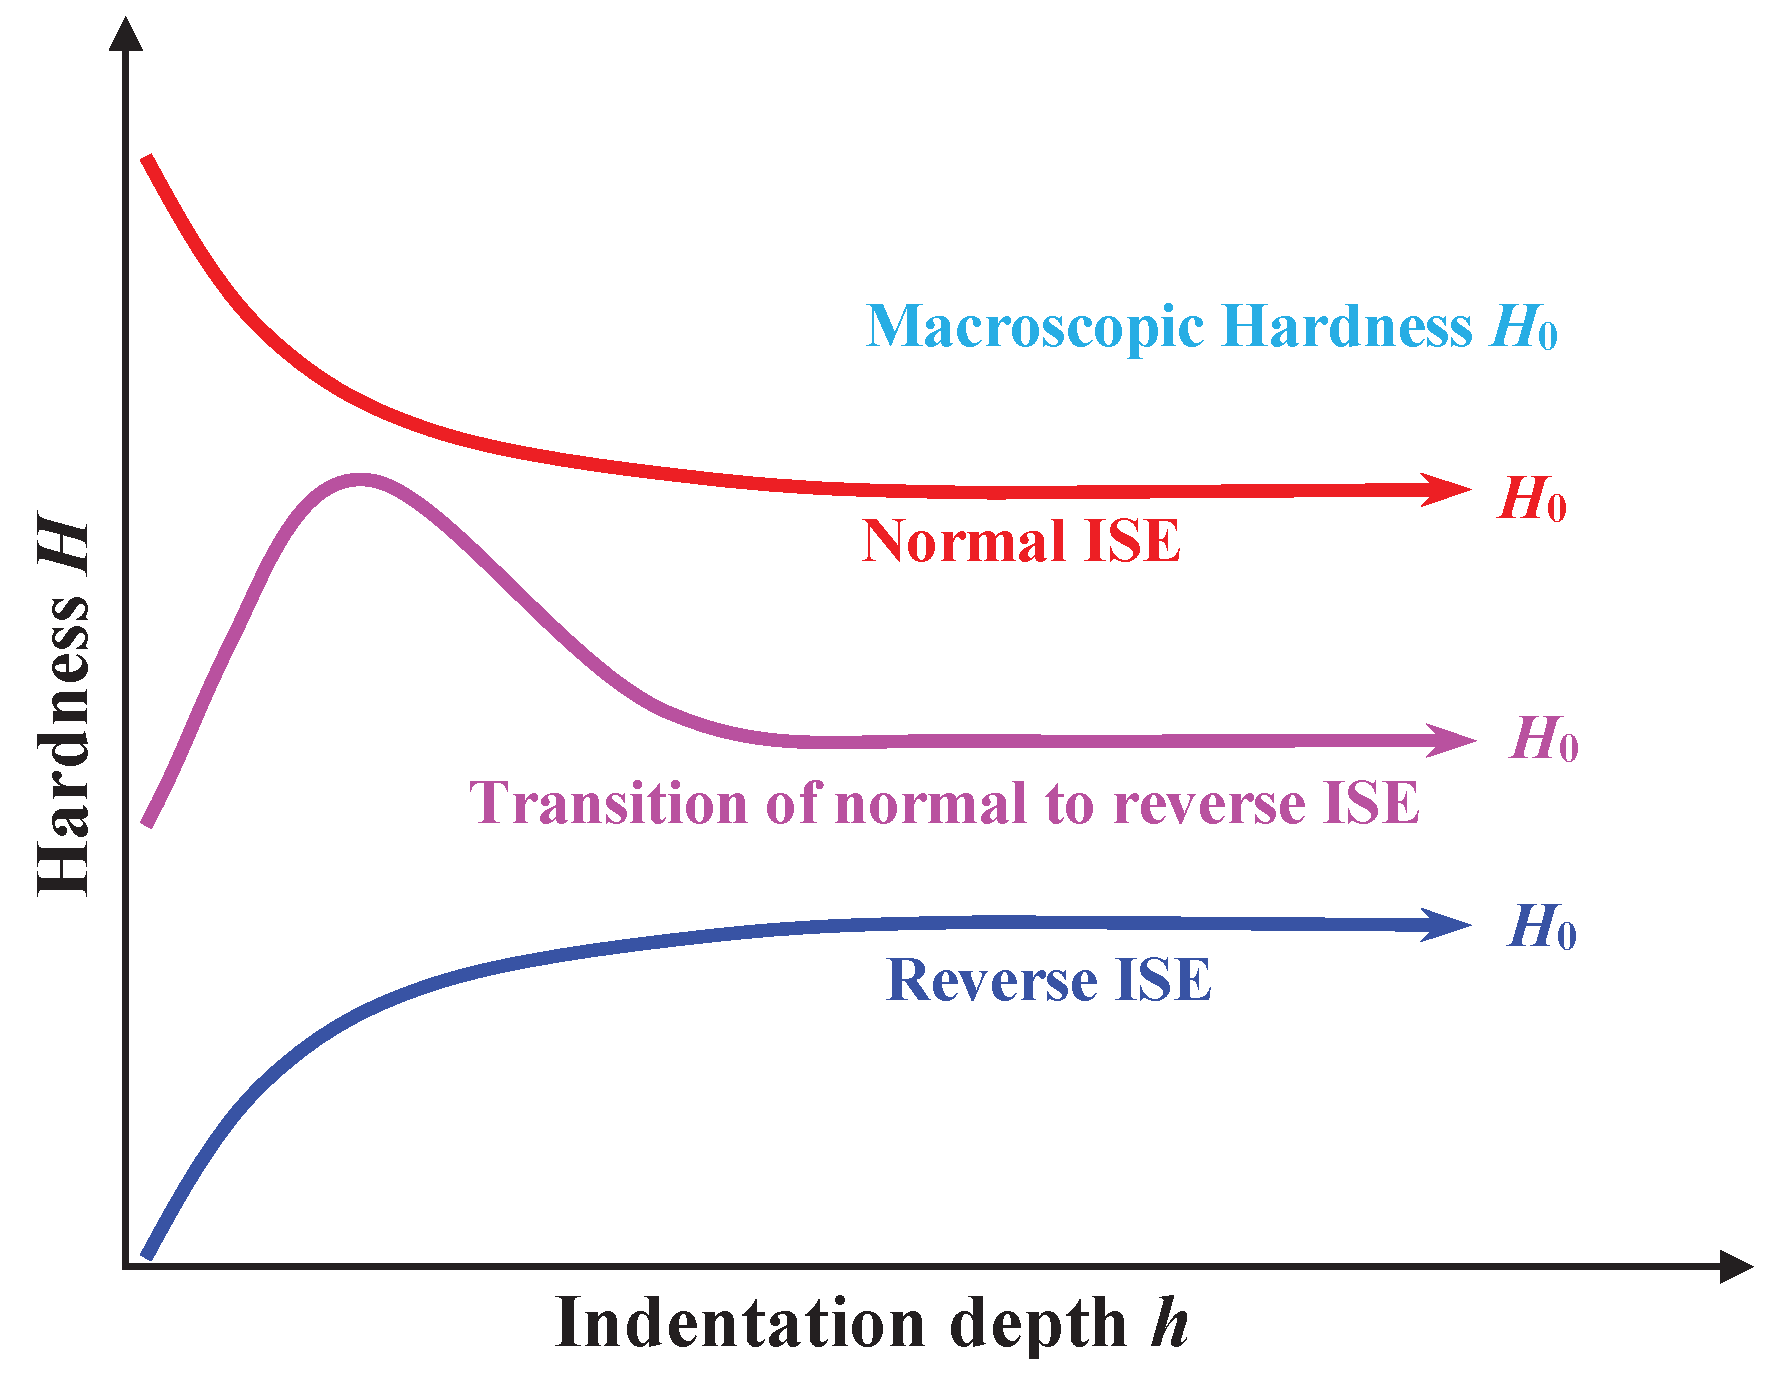
Normal ISE: In Figure 1, the hardness H decreases with the increase of indentation depth h, and then tend to a constant.
Reverse ISE: In Figure 1, the hardness H increases with the increasing indentation depth h and then tends to a constant.
Transition of normal to reverse ISE: In Figure 1, the hardness H first increases, then decreases and finally tend to a constant with the increasing indentation depth h.
Readers should note that the ISE of multilayers and bicrystals materials, which the hardness H first decreases and then increases, then decreases, and finally tends to a constant with the increasing indentation depth h, is not covered in this article [36,37,38,39,40].
To evaluate the accuracy and rationality of the sixteen ISE models in section 2, nine test data of MgO single crystals, 16MND5 steel, High entropy alloy (HEA), Ni Carbide Silicon (NiCSi), TC4 titanium alloy, Pulsed electro-deposited Ni (PED Ni), ZrO2 ceramic, Cu single crystals, Y2O3-ZrO2 ceramic, are collected from the literature. The collected data sets are provided in tabular form and given in Table 1. It is crucial to ensure a sufficient number of experimental or simulated data points to avoid overfitting and accurately determine the model parameters. Otherwise, it becomes difficult to distinguish the accuracy of different ISE models. Considering for the collected data is very time-consuming; these data are uploaded in ResearchGate (DOI: 10.13140/RG.2.2.26190.68167) for use by other researchers.

4. Comparative Study of Indentation Size Effect Models

In the sixteen ISE models, the model parameters can be determined by utilizing an equivalent amount of experimental or simulated data. However, more experimental or simulation data are preferred to obtain high-accuracy ISE curves. Thus, an optimization method is utilized to calculate the model parameters of sixteen ISE models. For three types of ISE data in Table 1, the parameters of sixteen ISE models are determined by optimization method and given in Table 2.

4.1. Qualitative Comparison

By inserting these optimized parameters in Table 2 into the sixteen ISE models, predicted ISE curves can be obtained. The experimental or simulated data and the predicted ISE curves of sixteen ISE models are shown in are shown in Figure 2, Figure 3 and Figure 4.
According to Figure 2, the Meyer, H-K, PSR, MPSR and EPD give a poor prediction to the experimental or simulated data of the normal ISE. This is because Meyer could not predict the finite asymptotic indentation hardness when the indentation is deep, and H-K, PSR, MPSR and EPD cannot reflect the nonlinear variation of the normal ISE. The empirical EXP model is nonlinear, and can predict a non-vanishing asymptotic indentation hardness. However, EXP model underestimates the indention hardness for the relatively lower indentation depth and overestimates the indentation hardness for the relatively higher indentation depth. This means that the EXP model cannot reflect the intrinsic nonlinear characteristics of the normal ISE.
It can be found that N-G, N-G-Hs, N-G-YC and N-G-Ls models can accurately describe the normal ISE of HEA [see in Figure 2e,f], but it gives a poor fit to the normal ISE of MgO and 16MND5 [see in Figure 2a–d]. This is because the indentation depth of MgO and 16MND5 is at the nanometer and micron scale, while the indentation depth of HEA is mainly at the micron scale. The assumption of N-G, N-G-Hs, N-G-A, N-G-YC and N-G-Ls models, which the radius of GNDs zone is equal to the contact radius, breaks down when the indentation depth transits from micron to nanometer scale [29,48].
Figure 2 shows that predicted ISE curves of H-J, N-G-A and N-G-Qs models agrees well with the experimental or simulated data of the normal ISE. The reason is that friction stress that is not related to dislocation activities takes into account has been introduced into these models. It can be found from Equations (13), (18) and (19) that the H-J and N-G-Qs models have the same expression, and the H-J and N-G-Qs models are obtained when β = 2 in N-G-A [Equation (18)]. Moreover, N-G-Fs and N-G-H models also can accurately predict the experimental or simulated data of the normal ISE [see in Figure 2]. This is because N-G-Fs model takes the progressive expansion of the plastic zone with decreasing indentation depth into account, and N-G-H model suppose that the number of dislocations in effective plastic zone increases with the increasing hn in Equation (18) [49].
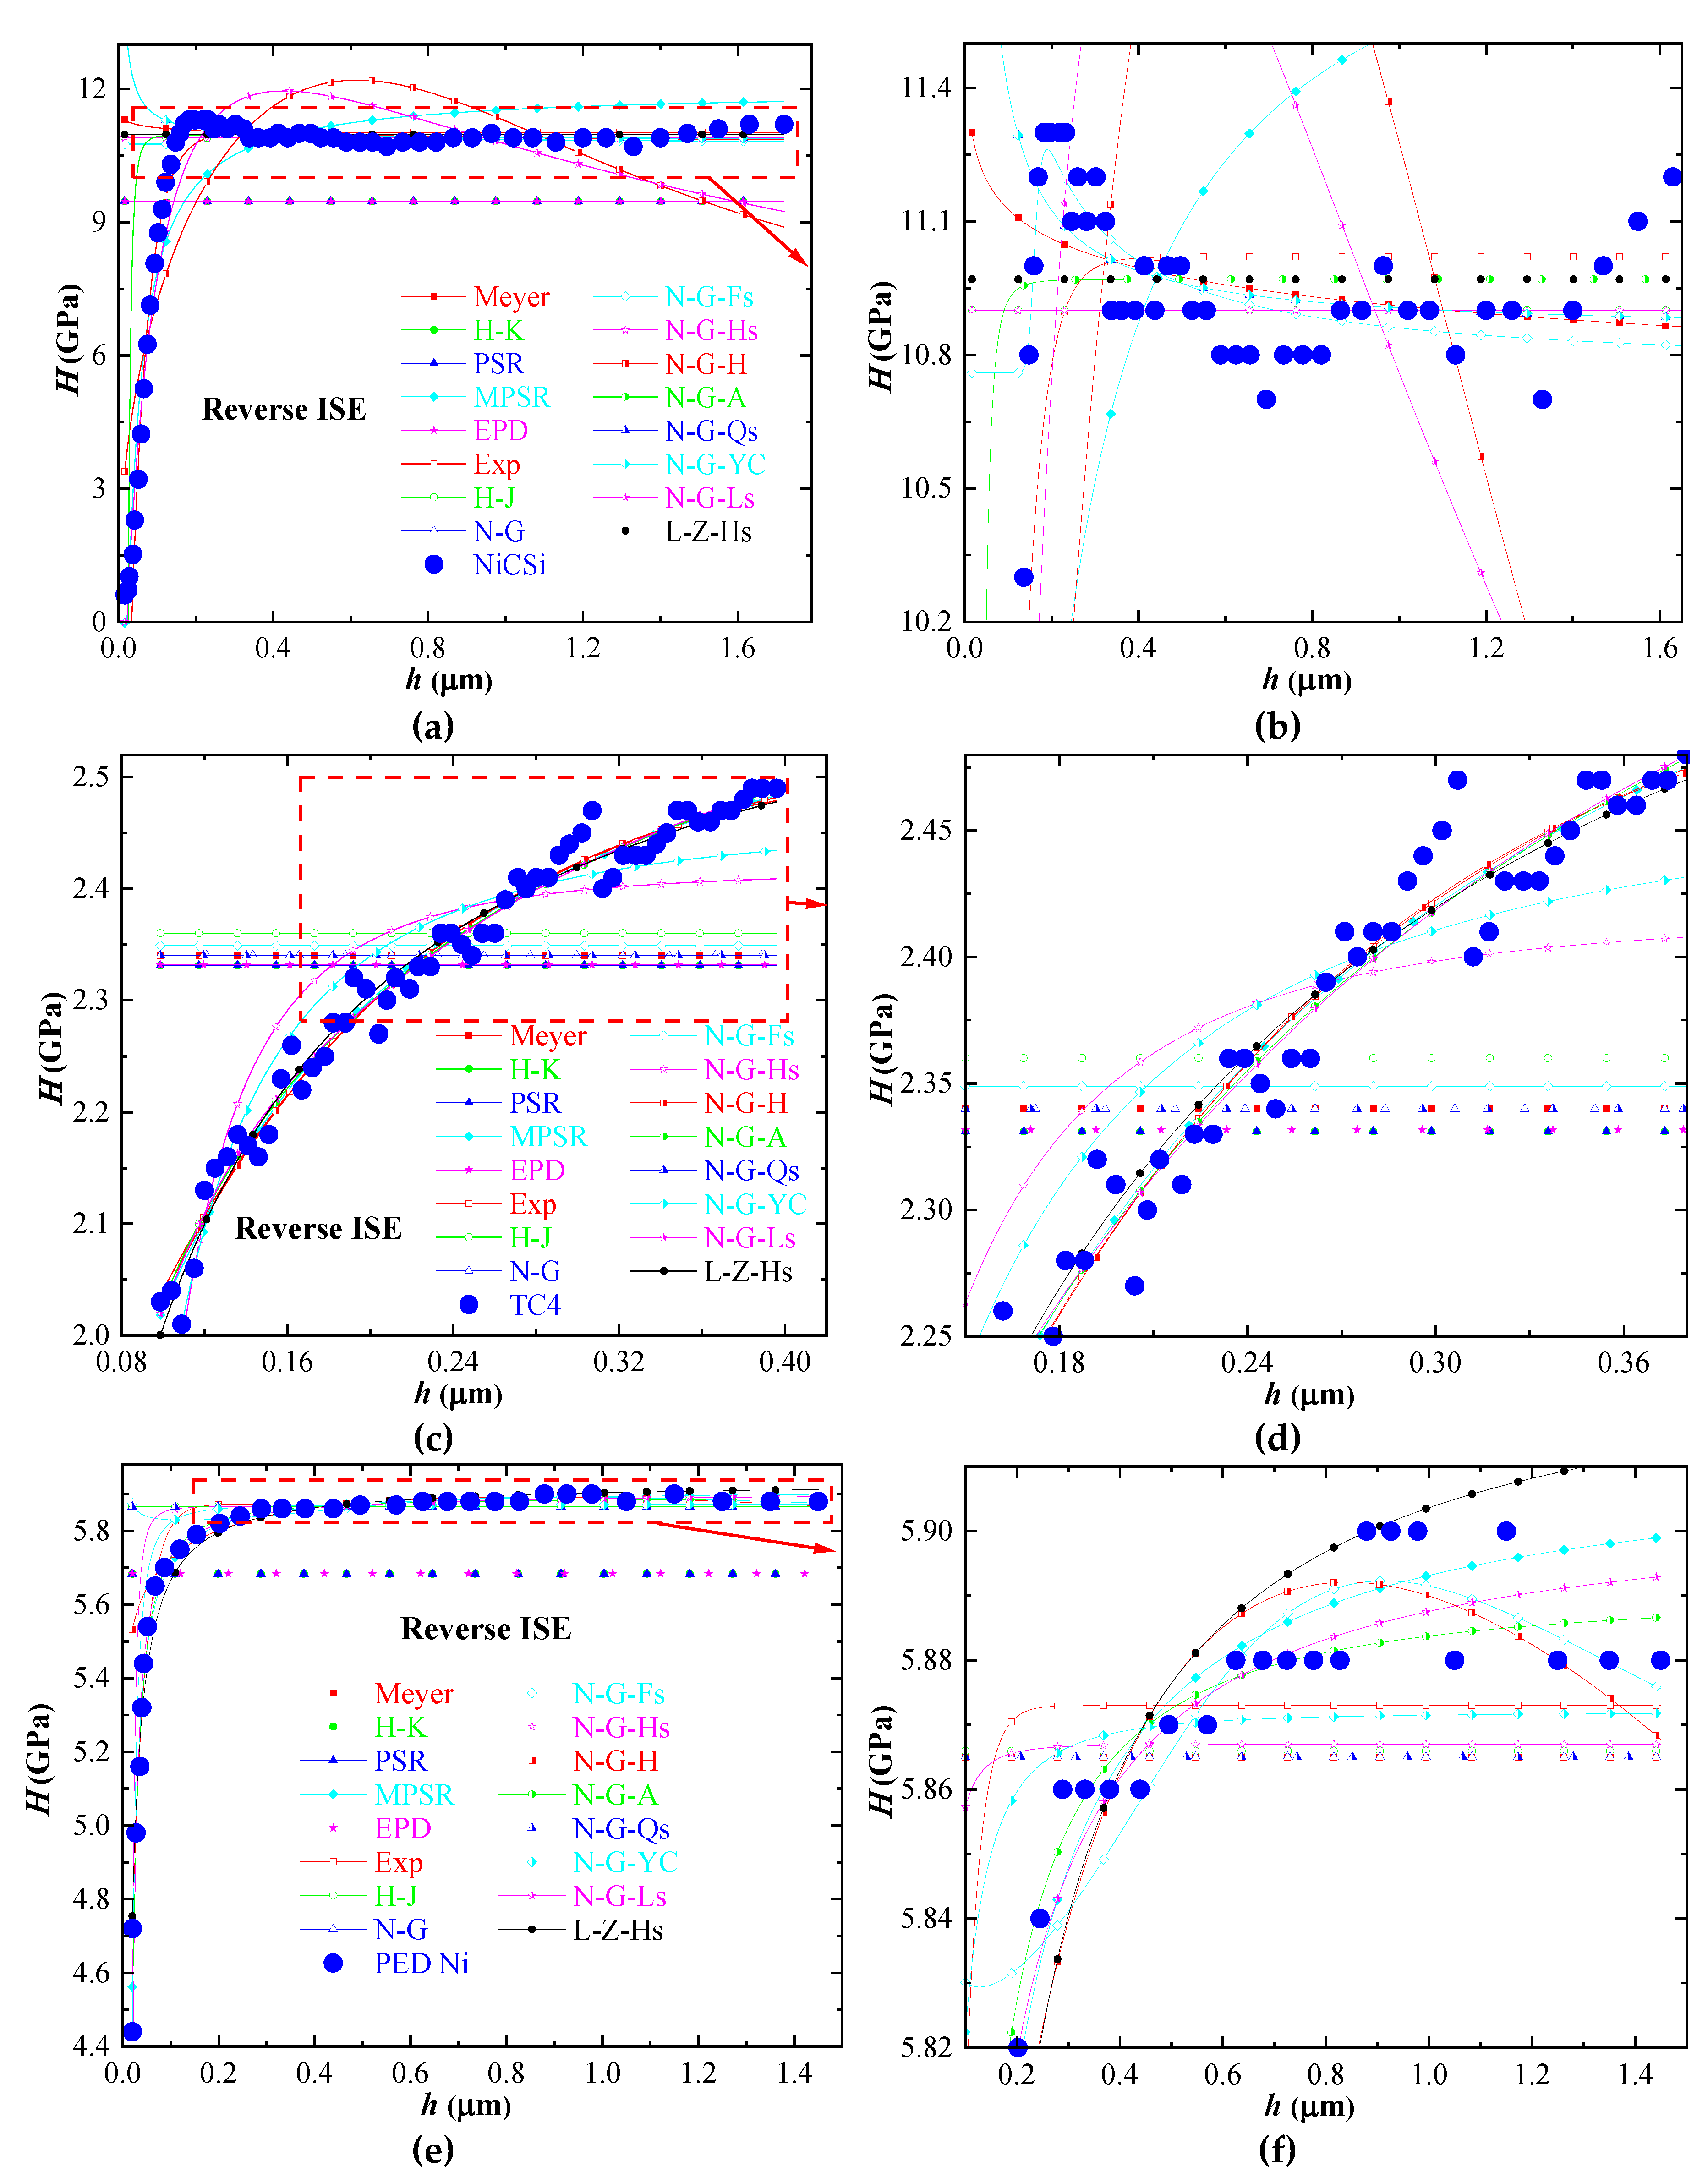
Figure 3 shows the compared experimental or simulated results of different materials and predicted curves of sixteen ISE models for reverse ISE. For NiCSi [see in Figure 3a,b], the EXP model performs well, but the MPSR and N-G-A models can only reflect the trend of reverse ISE. For the TC4 [see in Figure 3c,d], the MPSR, EXP, N-G-Fs, N-G-H, N-G-A and L-Z-Hs models predict accurately, while N-G-Hs and N-G-YC models can only describe its growth trend. For the PED Ni [see in Figure 3e,f], the MPSR, N-G-H, N-G-A, N-G-Ls and L-Z-Hs models well predicts the reverse ISE, whereas the EXP and N-G-YC models can only embody the trend of reverse ISE. Other models fail to predict the reverse ISE of NiCSi, TC4 and PED Ni.
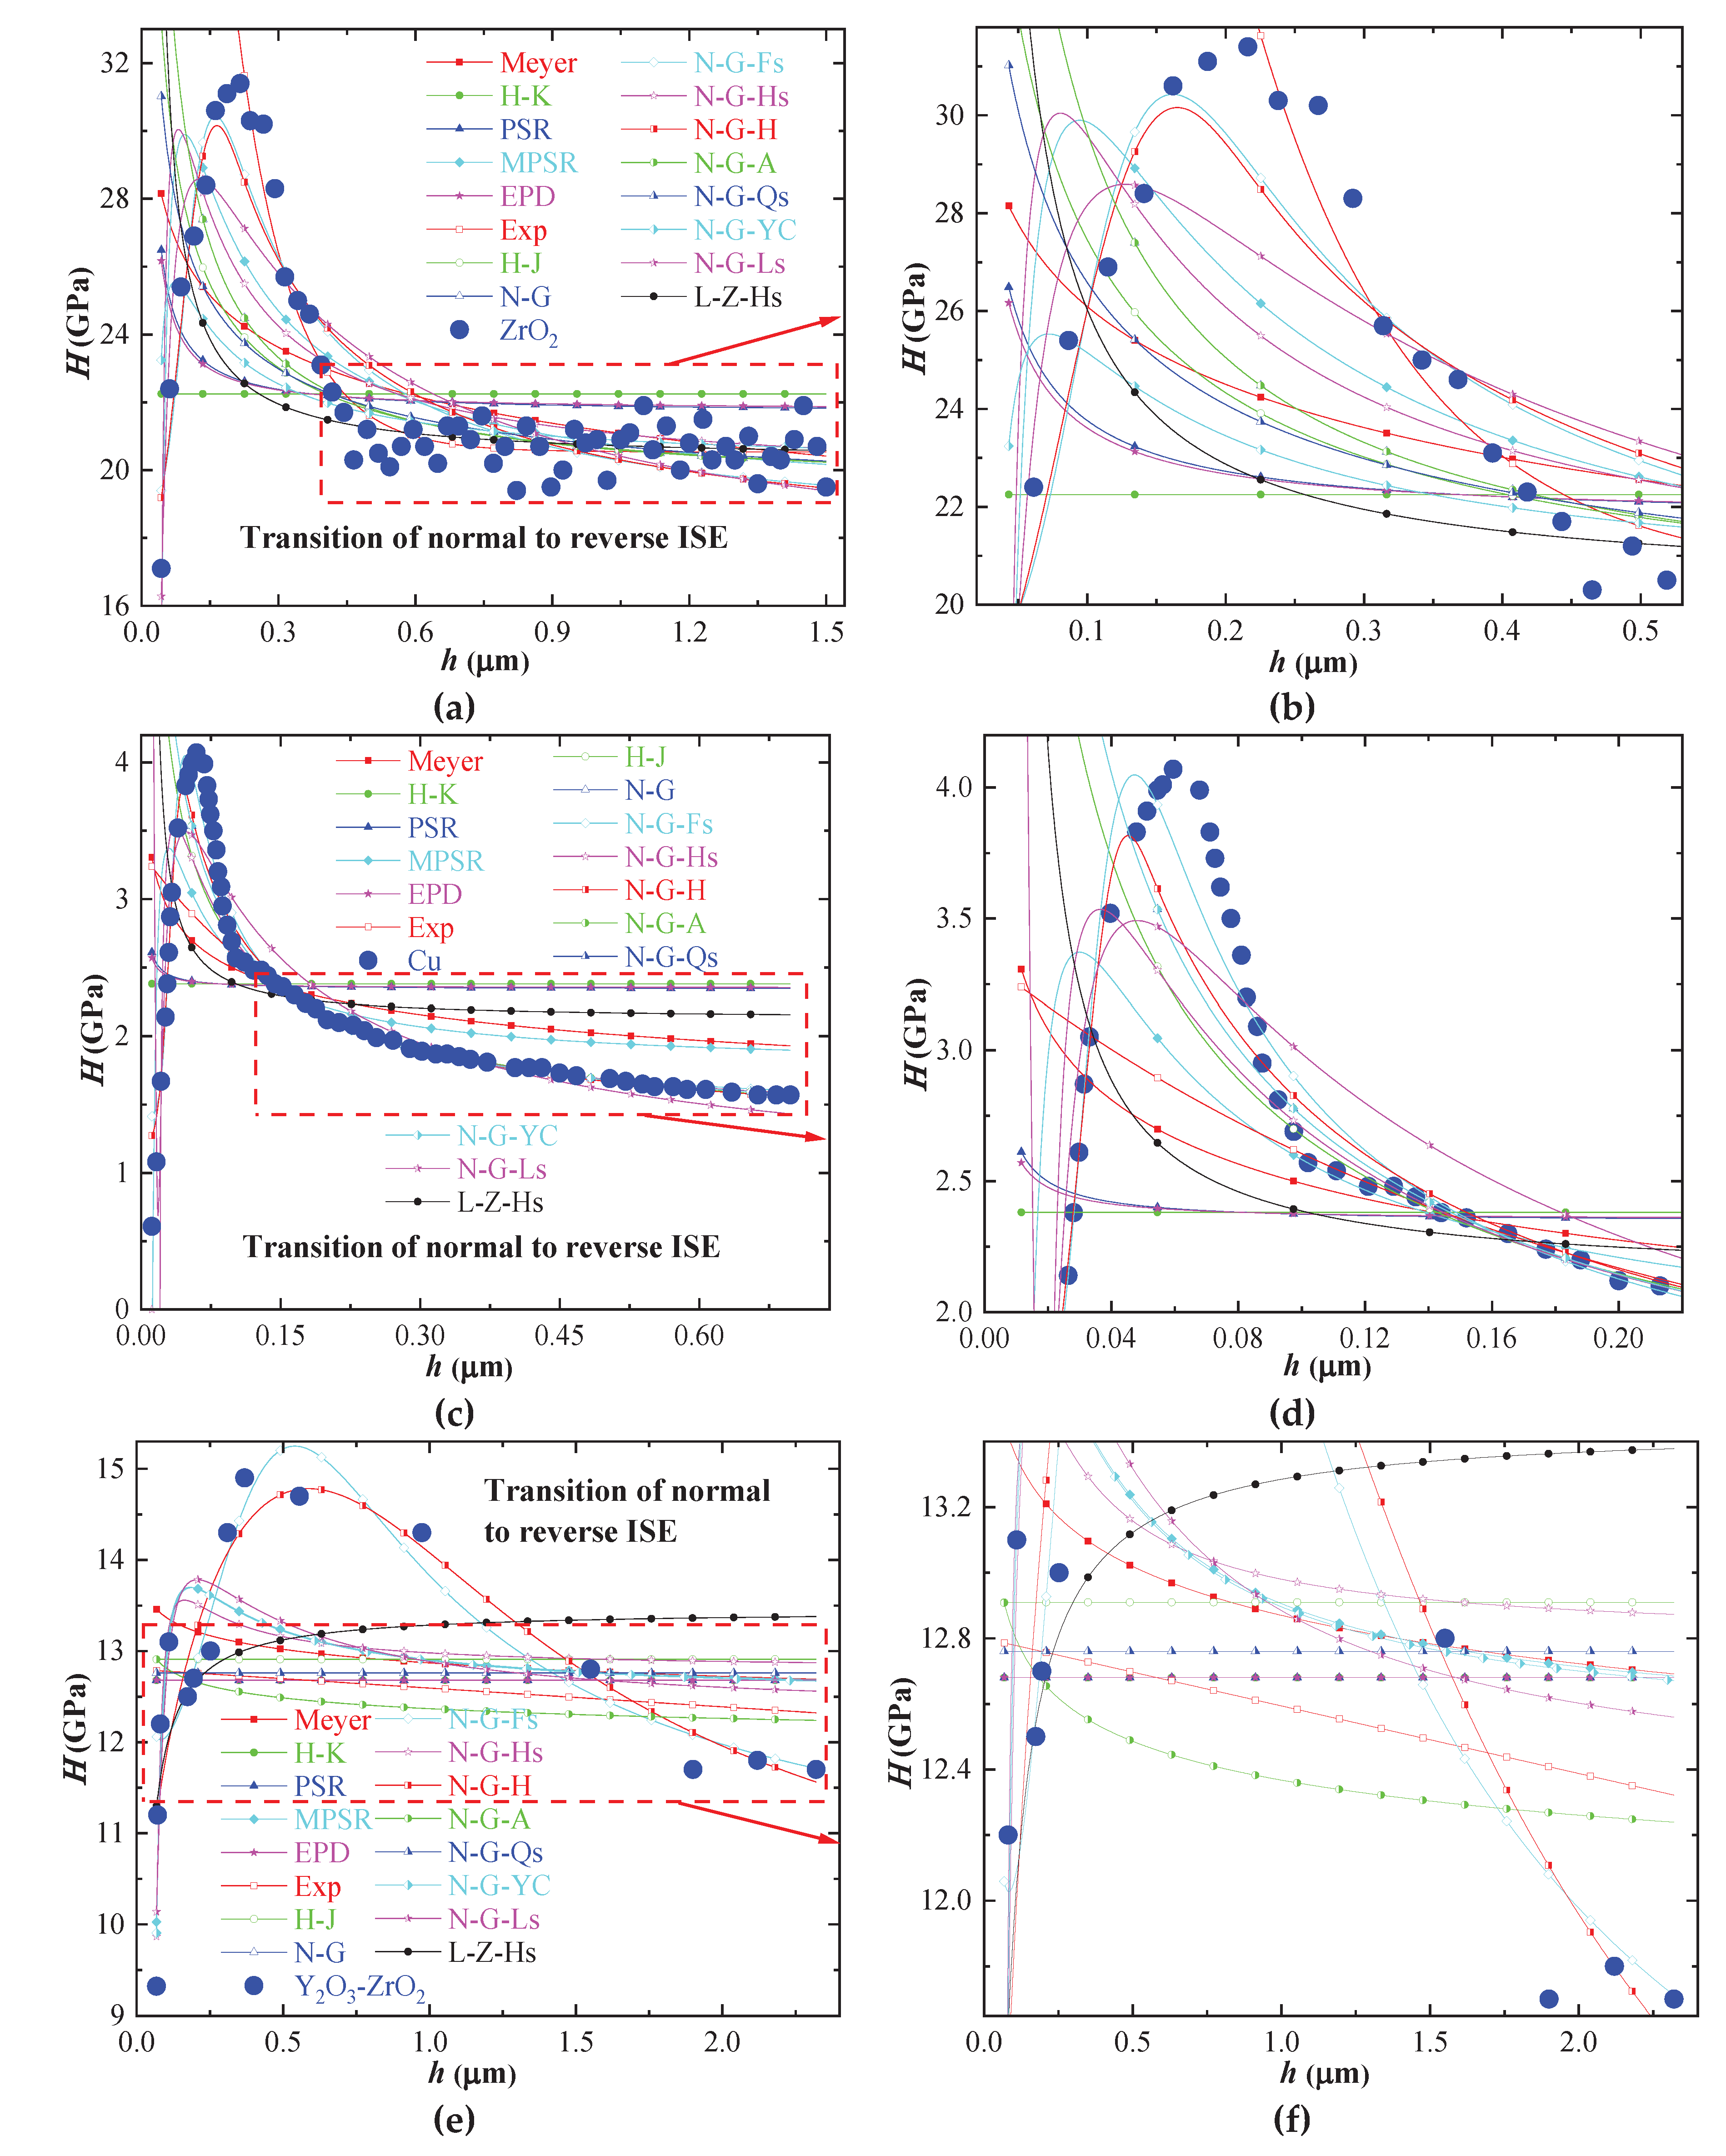
For the transition of normal to reverse ISE, the prediction of the sixteen ISE models is illustrated in Figure 4. The MPSR, N-G-Fs N-G-Hs, N-G-H and N-G-Ls models give good prediction of the test data of ZrO2 and Cu [see in Figure 3a–d]. The experimental data of Y2O3-ZrO2 can be well described by the N-G-Fs and N-G-H models [see in Figure 4e,f].
In fact, the sixteen ISE models are proposed to describe the normal ISE of different materials. However, to our surprise, some of these models are able to capture the reverse ISE and the transition of normal to reverse ISE of different materials. Moreover, it can be concluded from the prediction results of different models that the friction stress that is not related to dislocation activities and the Indentation size effect of plastic zone are critical to accurately predict the three types of ISEs. Therefore, these two factors should be considered in future models.

4.2. Quantitative Comparison

In order to quantificationally evaluate the accuracy of the sixteen ISE models, the determination coefficients (DC) are defined as follow:
DC = 1 i = 1 k H ri H p i 2 i = 1 k H ri H rm 2
where k is the number of experimental or simulated data for a specific material, i = 1; 2. . . k. Hri is the i-th experimental or simulated data, and Hpi is the i-th predicted value according to ISE models. Hrm is the mean value of the experimental or simulated data, which is defined as follow:
H rm = 1 k i = 1 k H ri
The DC is employed to determine the reliability of prediction by the sixteen ISE models. Having a higher DC is desirable, the best outcome is when the experimental or simulated data and predicted data match perfectly, resulting in zero misfit (DC = 1).
Substituting optimized parameters in Table 2 into the sixteen ISE models, the predicted value Hp can be calculated for each experimental or simulated data Hr. Then by using the Equations (23) and (24), the DCs of the sixteen ISE models are determined for different materials and given in Table 3.
Among the sixteen ISE models, N-G-Fs model has the best fits to the normal ISE of MgO and 16MND5 with the maximum DC values. The N-G-H and N-G-Ls models give the maximum DC for HEA. Moreover, it can be found that other ISE models except the H-K, PSR, EPD, N-G and L-Z-Hs provide higher DC values for the normal ISE.
For reverse ISE in Table 3, the highest DC value for NiCSi is given by the EXP model, while the N-G-Fs model provides the maximum DC value for TC4 and the N-G-A model forecasts the maximum DC value for PED Ni. Moreover, when the indentation depth is very small, it can be noted in Table 3 that N-G-YC mode fits the data of NiCSi and PED Ni with high DC values (0.9314 and 0.9835), but it predicts exactly opposite trend compared to the experimental data [see in Figure 3a,b,e,f]. This means that the DC alone cannot fully assess the accuracy of models’ predictions, and the comparison of test data with models’ predictions should be analyzed.
For the transition of normal to reverse ISE in Table 3, the N-G-YC model has the highest value of DC for ZrO2. One can see that the maximum DC of Cu is obtained by using the N-G-Fs and N-G-H models. The maximum DC of Y2O3-ZrO2 determined by the N-G-H model is 0.9206.
In addition, the mean DCs of the sixteen ISE models are calculated and given at the right of Table 3. It can be seen that the mean DC=0.92060 of the N-G-Fs model is the maximum among the sixteen ISE models, followed by the N-G-H model. It is obvious that a better correlation is obtained by using the N-G-Fs and N-G-H models, but they cannot accurately predict the reverse ISE. Therefore, it can be concluded that the N-G-Fs and N-G-H models should be modified to accurately predict the reverse ISE.

5. Conclusions

In this paper, through applying the sixteen ISE models to predict the three types of ISEs, namely, normal ISE, reverse ISE and transition of normal to reverse ISE. The following conclusions can be drawn.
For the normal ISE, it can be found that the predicted ISE curves of H-J, N-G-A and N-G-Qs models agrees well with the experimental or simulated data. The reason is that friction stress that is not related to dislocation activities takes into account has been introduced into these models. N-G-Fs and N-G-H models also can accurately predict the normal ISE. The reason for this is that the N-G-Fs model considers the gradual expansion of the plastic zone as indentation depth decreases, while the N-G-H model assumes an increase in the number of dislocations in the effective plastic zone as the hn increases. On this basis, it can be concluded that the friction stress that is not related to dislocation activities and the indentation size effect of plastic zone are critical to accurately predict the three types of ISEs. Therefore, these two factors should be considered in future models.
The sixteen ISE models are originally proposed to describe the normal ISE of different materials. However, to our surprise, some of these models are able to capture the reverse ISE and the transition of normal to reverse ISE of different materials. The DCs of the sixteen ISE models are also determined for different materials. For reverse ISE, the highest DC value for NiCSi, TC4 and PED Ni are given by the EXP, N-G-Fs and N-G-A models, respectively. For the transition of normal to reverse ISE, the N-G-YC, N-G-Fs, and N-G-H models produce the maximum DC for ZrO2, Cu and Y2O3-ZrO2, respectively. Moreover, the mean DC of the N-G-Fs model is the maximum among the sixteen ISE models, followed by the N-G-H model, but they cannot accurately predict the reverse ISE. Therefore, it can be concluded that the N-G-Fs and N-G-H models should be further modified to accurately predict the reverse ISE.

Author Contributions

Conceptualization, P.N.W., Y.G. and P.H.W.; methodology, P.N.W.; software, P.N.W.; validation, P.N.W., Y.G. and P.H.W.; formal analysis, Y.G.; investigation, P.H.W.; data curation, P. H. W.; writing—original draft preparation, P.N. W., Y. G. and P. H. W.; writing—review and editing, P. H. W.; supervision, P. H. W.; project administration, P. H. W. All authors have read and agreed to the published version of the manuscript.

Funding

This research received no external funding.

Informed Consent Statement

Not applicable.

Data Availability Statement

Data are contained within the article.

Conflicts of Interest

The authors declare no conflicts of interest.

References

  1. Renjo, M.M.; Ćurković, L.; Štefančić, S.; Ćorić, D. Indentation size effect of Y-TZP dental ceramics. Dent. Mater. 2014, 30, e371–e376. [Google Scholar] [CrossRef] [PubMed]
  2. Čech, J.; Haušild, P.; Karlík, M.; Čapek, J.; Průša, F. Indentation Size Effect in CoCrFeMnNi HEA Prepared by Various Techniques. Materials 2021, 14, 7246. [Google Scholar] [CrossRef] [PubMed]
  3. Golovin, Y.I.; Gusev, A.A.; Golovin, D.Y.; Matveev, S.M.; Vasyukova, I.A. Multiscale Mechanical Performance of Wood: From Nano- to Macro-Scale across Structure Hierarchy and Size Effects. Nanomaterials 2022, 12, 1139. [Google Scholar] [CrossRef] [PubMed]
  4. Luo, Q.; Kitchen, M. Microhardness, Indentation Size Effect and Real Hardness of Plastically Deformed Austenitic Hadfield Steel. Materials 2023, 16, 1117. [Google Scholar] [CrossRef] [PubMed]
  5. Muslić, M.; Orešković, L.; Rede, V.; Maksimović, V. Indentation Size Effect of Composite A356 + 6%FA Subjected to ECAP. Metals 2022, 12, 821. [Google Scholar] [CrossRef]
  6. Voyiadjis, G.Z.; Yaghoobi, M. Chapter 1 - Introduction: Size effects in materials. In Size Effects in Plasticity, Voyiadjis, G.Z., Yaghoobi, M., Eds.; Academic Press: 2019; pp. 1–79.
  7. Ma, Y.; Song, Y.; Zhang, T. Revealing Nanoindentation Size-Dependent Creep Behavior in a La-Based Metallic Glassy Film. Nanomaterials 2019, 9, 1712. [Google Scholar] [CrossRef] [PubMed]
  8. Li, X.; Zhang, W.; Dong, Z.; Wang, Z.; Li, D.; Zhang, J. Study on Size Effect in Indentation Tests. Coatings 2022, 12, 1962. [Google Scholar] [CrossRef]
  9. Šolc, M.; Blaško, P.; Petrík, J.; Palfy, P.; Girmanová, L. The Indentation Size Effect (ISE) of Ag–Cu Alloys. Crystals 2023, 13, 91. [Google Scholar] [CrossRef]
  10. Petrík, J.; Blaško, P.; Markulík, S.; Šolc, M.; Palfy, P. The Indentation Size Effect (ISE) of Metals. Crystals 2022, 12, 795. [Google Scholar] [CrossRef]
  11. Chakraborty, R.; Dey, A.; Mukhopadhyay, A.K.; Joshi, K.D.; Rav, A.; Mandal, A.K.; Bysakh, S.; Biswas, S.K.; Gupta, S.C. Indentation size effect of alumina ceramic shocked at 12GPa. Int. J. Refract. Met. Hard Mater. 2012, 33, 22–32. [Google Scholar] [CrossRef]
  12. Li, H.; Ghosh, A.; Han, Y.; Bradt, R. The frictional component of the indentation size effect in low load microhardness testing. J. Mater. Res. 1993, 8, 1028–1032. [Google Scholar] [CrossRef]
  13. Iost, A.; Bigot, R. Indentation size effect: reality or artefact? J. Mater. Sci. 1996, 31, 3573–3577. [Google Scholar] [CrossRef]
  14. Gong, J.; Wu, J.; Guan, Z. Analysis of the indentation size effect on the apparent hardness for ceramics. Mater. Lett. 1999, 38, 197–201. [Google Scholar] [CrossRef]
  15. Gao, Y.X.; Fan, H. A micro-mechanism based analysis for size-dependent indentation hardness. J. Mater. Sci. 2002, 37, 4493–4498. [Google Scholar] [CrossRef]
  16. Dey, A.; Mukhopadhyay, A.K.; Gangadharan, S.; Sinha, M.K.; Basu, D. Weibull modulus of nano-hardness and elastic modulus of hydroxyapatite coating. J. Mater. Sci. 2009, 44, 4911–4918. [Google Scholar] [CrossRef]
  17. Liu, W.; Chen, L.; Cheng, Y.; Yu, L.; Yi, X.; Gao, H.; Duan, H. Model of nanoindentation size effect incorporating the role of elastic deformation. J. Mech. Phys. Solids 2019, 126, 245–255. [Google Scholar] [CrossRef]
  18. Chauniyal, A.; Dehm, G.; Janisch, R. On the role of pre-existing defects in influencing hardness in nanoscale indentations — Insights from atomistic simulations. J. Mech. Phys. Solids 2021, 154, 104511. [Google Scholar] [CrossRef]
  19. Hays, C.; Kendall, E. An analysis of Knoop microhardness. Metallography 1973, 6, 275–282. [Google Scholar] [CrossRef]
  20. Li, H.; Bradt, R.C. The effect of indentation-induced cracking on the apparent microhardness. J. Mater. Sci. 1996, 31, 1065–1070. [Google Scholar] [CrossRef]
  21. Bull, S.J.; Page, T.F.; Yoffe, E.H. An explanation of the indentation size effect in ceramics. Philos. Mag. Lett. 1989, 59, 281–288. [Google Scholar] [CrossRef]
  22. Ruiz-Moreno, A.; Hähner, P.; Kurpaska, L.; Jagielski, J.; Spätig, P.; Trebala, M.; Hannula, S.-P.; Merino, S.; de Diego, G.; Namburi, H.; et al. Round Robin into Best Practices for the Determination of Indentation Size Effects. Nanomaterials 2020, 10, 130. [Google Scholar] [CrossRef] [PubMed]
  23. Hou, X.; Jennett, N.M. Application of a modified slip-distance theory to the indentation of single-crystal and polycrystalline copper to model the interactions between indentation size and structure size effects. Acta Mater. 2012, 60, 4128–4135. [Google Scholar] [CrossRef]
  24. Nix, W.D.; Gao, H. Indentation size effects in crystalline materials: A law for strain gradient plasticity. J. Mech. Phys. Solids 1998, 46, 411–425. [Google Scholar] [CrossRef]
  25. Swadener, J.; George, E.; Pharr, G. The correlation of the indentation size effect measured with indenters of various shapes. J. Mech. Phys. Solids 2002, 50, 681–694. [Google Scholar] [CrossRef]
  26. Feng, G.; Nix, W.D. Indentation size effect in MgO. Scr. Mater. 2004, 51, 599–603. [Google Scholar] [CrossRef]
  27. Durst, K.; Backes, B.; Göken, M. Indentation size effect in metallic materials: Correcting for the size of the plastic zone. Scr. Mater. 2005, 52, 1093–1097. [Google Scholar] [CrossRef]
  28. Huang, Y.; Zhang, F.; Hwang, K.; Nix, W.; Pharr, G.; Feng, G. A model of size effects in nano-indentation. J. Mech. Phys. Solids 2006, 54, 1668–1686. [Google Scholar] [CrossRef]
  29. Haušild, P. On the breakdown of the Nix-Gao model for indentation size effect. Philos. Mag. 2021, 101, 420–434. [Google Scholar] [CrossRef]
  30. Abu Al-Rub, R.K. Prediction of micro and nanoindentation size effect from conical or pyramidal indentation. Mech. Mater. 2007, 39, 787–802. [Google Scholar] [CrossRef]
  31. Qiu, X.; Huang, Y.; Nix, W.; Hwang, K.; Gao, H. Effect of intrinsic lattice resistance in strain gradient plasticity. Acta Mater. 2001, 49, 3949–3958. [Google Scholar] [CrossRef]
  32. Yuan, H.; Chen, J. Identification of the intrinsic material length in gradient plasticity theory from micro-indentation tests. Int. J. Solids Struct. 2001, 38, 8171–8187. [Google Scholar] [CrossRef]
  33. Maiti, P.; Bhattacharya, M.; Das, P.S.; Devi, P.S.; Mukhopadhyay, A.K. Indentation size effect and energy balance issues in nanomechanical behavior of ZTA ceramics. Ceram. Int. 2018, 44, 9753–9772. [Google Scholar] [CrossRef]
  34. Alao, A.-R.; Azhari, M.A.M. Investigation of indentation size effect and R-curve behaviour of Li2O–SiO2 and Li2O–2SiO2 glass ceramics. J. Mech. Behav. Biomed. Mater. 2021, 124, 104842. [Google Scholar] [CrossRef] [PubMed]
  35. Kathavate, V.; Kumar, B.P.; Singh, I.; Prasad, K.E. Analysis of indentation size effect (ISE) in nanoindentation hardness in polycrystalline PMN-PT piezoceramics with different domain configurations. Ceram. Int. 2021, 47, 11870–11877. [Google Scholar] [CrossRef]
  36. Liu, K.; Zhang, B.; Long, X.; Deng, H.; Xiao, X.; Jiang, C. Revealing the hardening mechanisms of ion-irradiated nanostructured multilayers/substrate systems: A theoretical model. Int. J. Plast. 2021, 138, 102925. [Google Scholar] [CrossRef]
  37. Xiao, X.; Terentyev, D.; Chen, Q.; Yu, L.; Chen, L.; Bakaev, A.; Duan, H. The depth dependent hardness of bicrystals with dislocation transmission through grain boundaries: A theoretical model. Int. J. Plast. 2017, 90, 212–230. [Google Scholar] [CrossRef]
  38. Zhang, C.; Voyiadjis, G.Z. Rate-dependent size effects and material length scales in nanoindentation near the grain boundary for a bicrystal FCC metal. Mater. Sci. Eng. A 2016, 659, 55–62. [Google Scholar] [CrossRef]
  39. Voyiadjis, G.Z.; Zhang, C. The mechanical behavior during nanoindentation near the grain boundary in a bicrystal FCC metal. Mater. Sci. Eng. A 2015, 621, 218–228. [Google Scholar] [CrossRef]
  40. Voyiadjis, G.Z.; Znemah, R.A.; Wood, P.; Gunputh, U.; Zhang, C. Effect of element wall thickness on the homogeneity and isotropy of hardness in SLM IN718 using nanoindentation. Mech. Res. Commun. 2021, 114, 103568. [Google Scholar] [CrossRef]
  41. Li, X.; Zhang, W.; Han, M.; Xie, F.; Li, D.; Zhang, J.; Long, B. Indentation size effect: an improved mechanistic model incorporating surface undulation and indenter tip irregularity. J. Mater. Res. Technol. 2023, 23, 143–153. [Google Scholar] [CrossRef]
  42. Liu, M. Study on mechanics problem in the indentation testing. Tianjin University, Tianjin, China, 2007.
  43. Liu, X.; Wang, R.; Ren, A.; Jiang, J.; Xu, C.; Huang, P.; Qian, W.; Wu, Y.; Zhang, C. Evaluation of radiation hardening in ion-irradiated Fe based alloys by nanoindentation. J. Nucl. Mater. 2013, 444, 1–6. [Google Scholar] [CrossRef]
  44. Wang, L.; Asempah, I.; Li, X.; Zang, S.-Q.; Zhou, Y.-F.; Ding, J.; Jin, L. Indentation size effect in aqueous electrophoretic deposition zirconia dental ceramic. J. Mater. Res. 2019, 34, 555–562. [Google Scholar] [CrossRef]
  45. Yang, R.; Zhang, Q.; Xiao, P.; Wang, J.; Bai, Y. Two opposite size effects of hardness at real nano-scale and their distinct origins. Sci. Rep. 2017, 7, 16053. [Google Scholar] [CrossRef] [PubMed]
  46. Luo, J.; Dai, C.; Shen, Y.; Mao, W. Elasto-plastic characteristics and mechanical properties of as-sprayed 8mol% yttria-stabilized zirconia coating under nano-scales measured by nanoindentation. Appl. Surf. Sci. 2014, 309, 271–277. [Google Scholar] [CrossRef]
  47. Seekala, H.; Bathini, L.; Wasekar, N.P.; Krishnaswamy, H.; Phani, P.S. A unified approach to quantify the material and geometrical effects in indentation size effect. J. Mater. Res. 2023, 38, 1740–1755. [Google Scholar] [CrossRef]
  48. Pharr, G.M.; Herbert, E.G.; Gao, Y. The Indentation Size Effect: A Critical Examination of Experimental Observations and Mechanistic Interpretations. Annu. Rev. Mater. Res. 2010, 40, 271–292. [Google Scholar] [CrossRef]
  49. Ma, X.; Higgins, W.; Liang, Z.; Zhao, D.; Pharr, G.M.; Xie, K.Y. Exploring the origins of the indentation size effect at submicron scales. Proc. Natl. Acad. Sci. USA 2021, 118, e2025657118. [Google Scholar] [CrossRef] [PubMed]
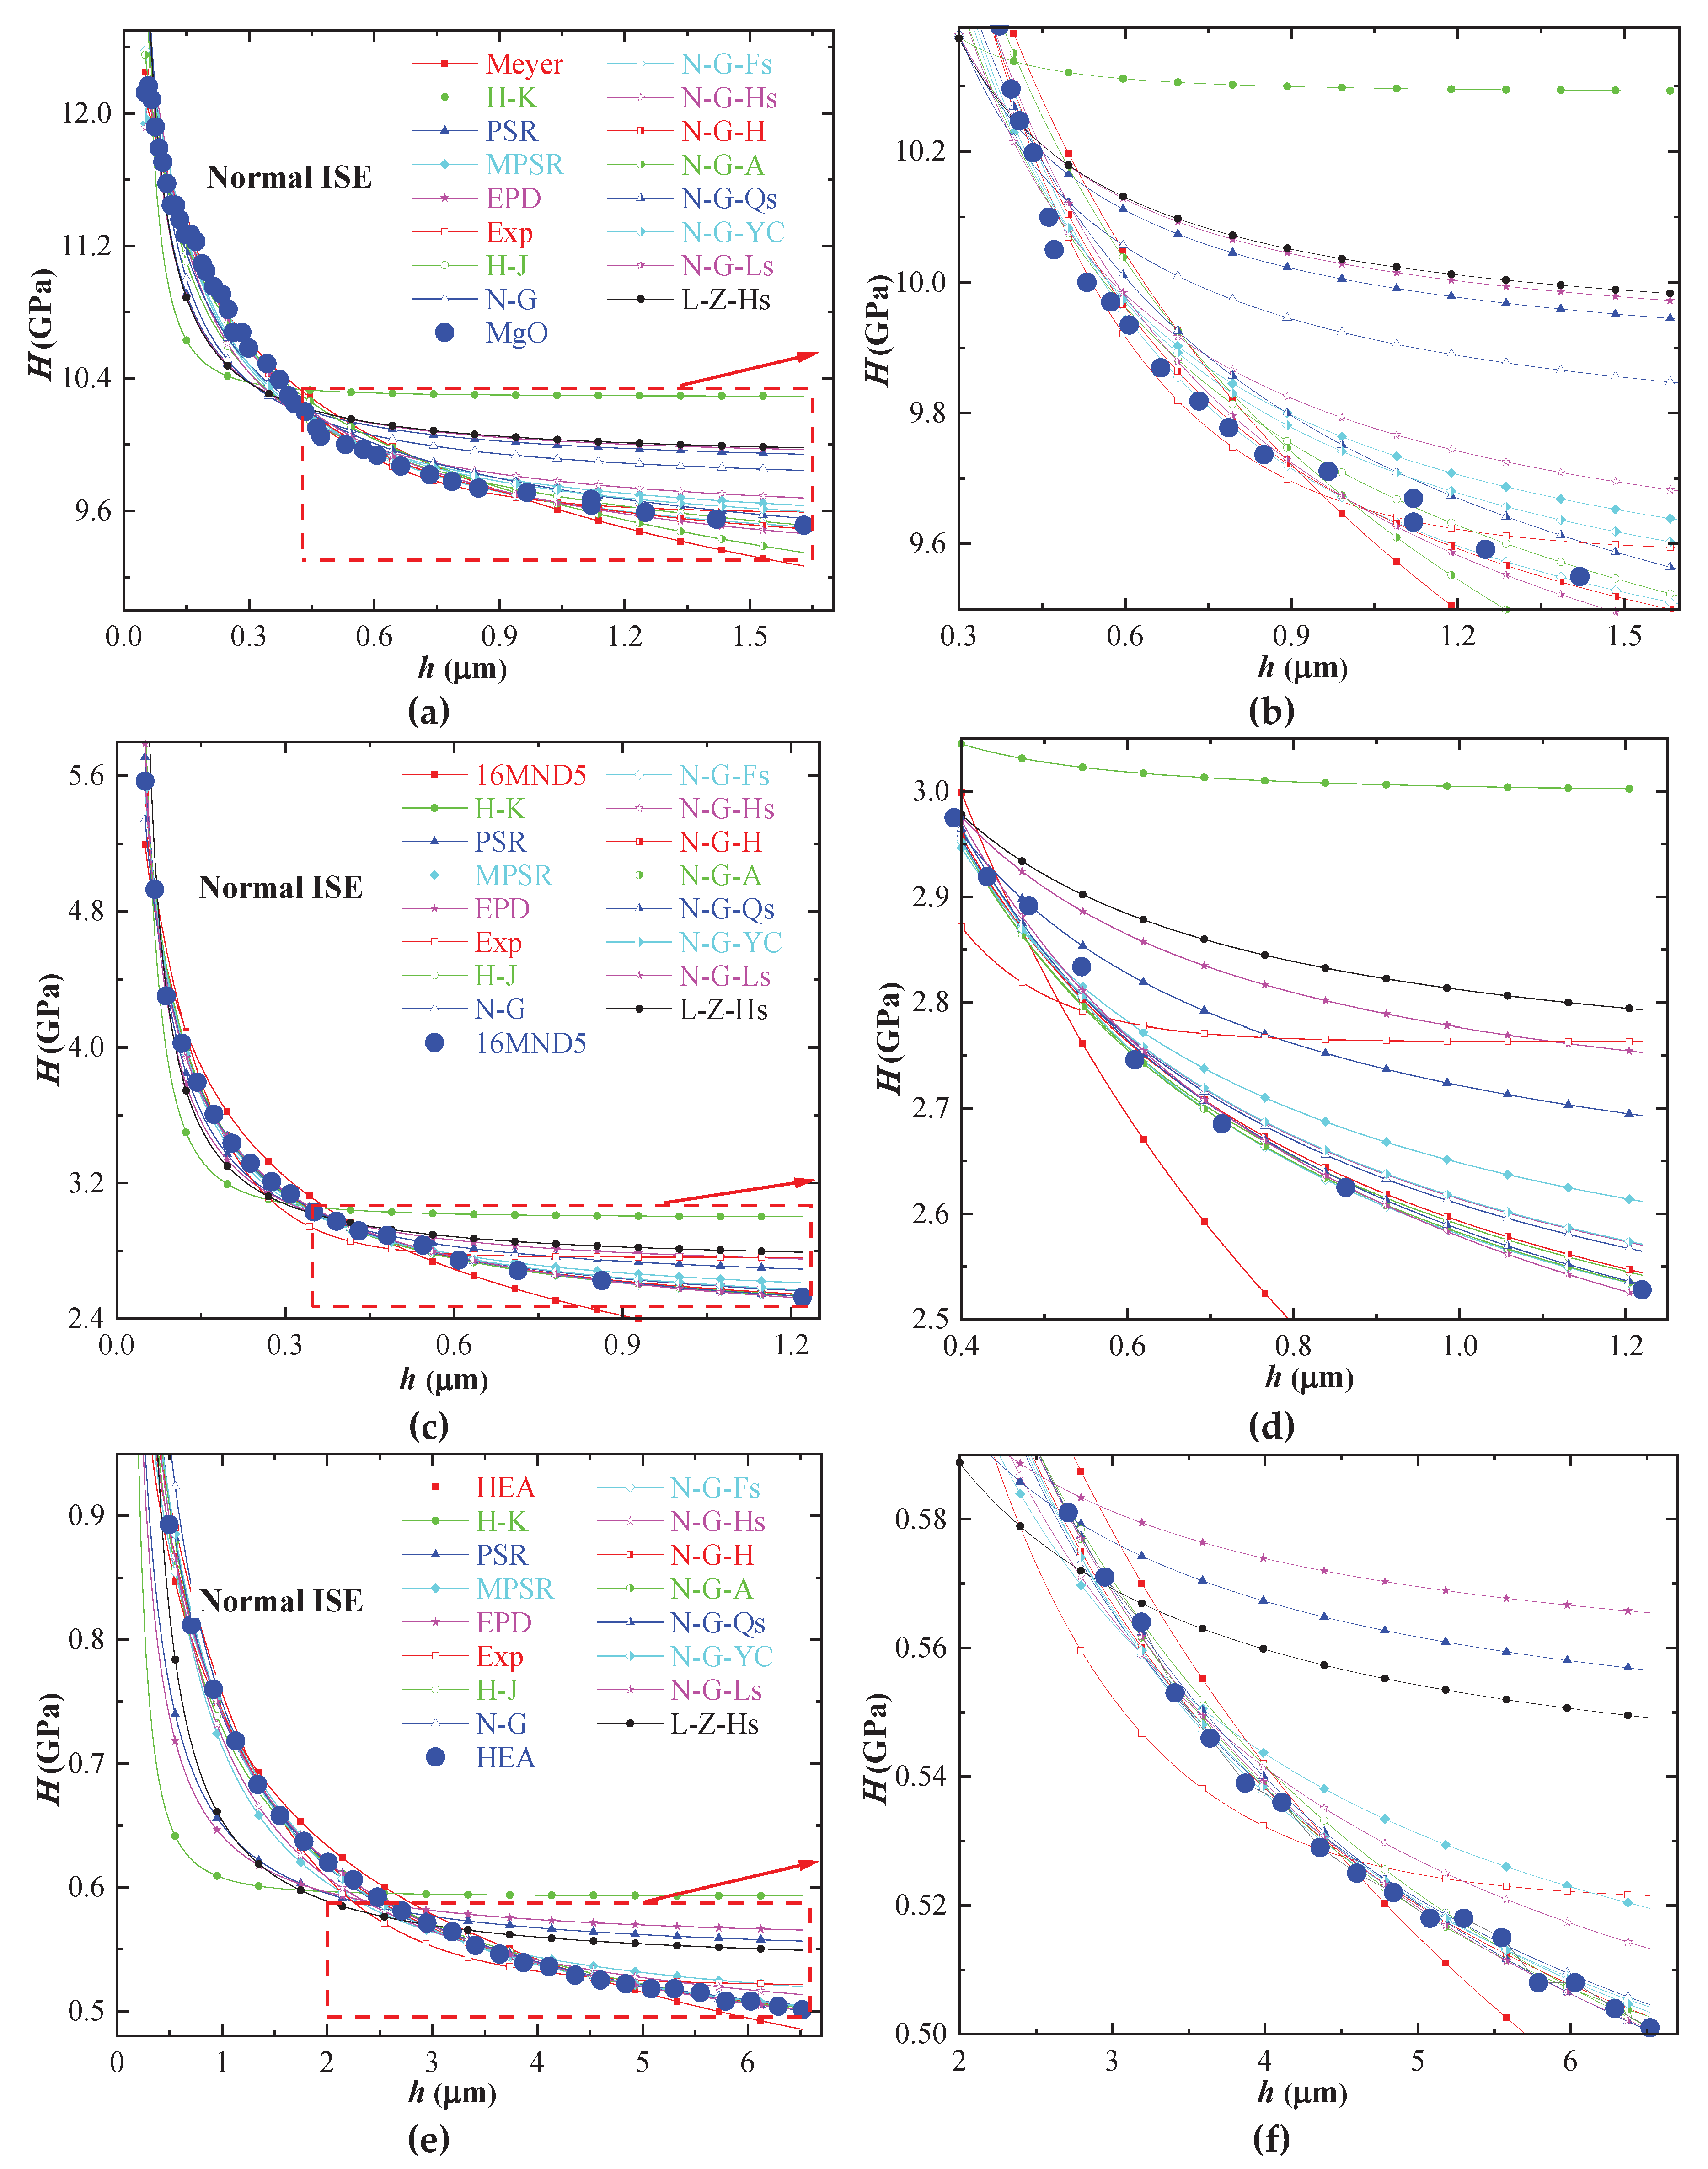
Figure 1. Schematic of ISE for geometrically self-similar indenters [41,48].
Preprints 102771 g001
Figure 2. Compared experimental or simulated results of different materials and predicted values of the sixteen ISE models for normal ISE, (a) MgO and (b) enlarge part of it; (c) 16MND5 and (d) enlarge part of it; (e) HEA and (f) enlarge part of it.
Preprints 102771 g002
Figure 3. Compared experimental or simulated results of different materials and predicted values of the sixteen ISE models for reverse ISE, (a) NiCSi and (b) enlarge part of it; (c) TC4 and (d) enlarge part of it; (e) PED Ni and (f) enlarge part of it.
Preprints 102771 g003
Figure 4. Compared experimental or simulated results of different materials and predicted values of the sixteen ISE models for transition of normal to reverse ISE, (a) ZrO2 and (b) enlarge part of it; (c) Cu and (d) enlarge part of it; (e) Y2O3-ZrO2 and (f) enlarge part of it.
Preprints 102771 g004
Table 1. Experiment and simulated data of ISE for different materials.
Type of ISE No. Material Data bulk Data sources
Normal ISE 1 MgO 41 [26]
2 16MND5 19 [17]
3 HEA 29 [29]
Reverse ISE 4 NiCSi 57 [42]
5 TC4 58 [41]
6 PED Ni 32 [47]
Transition of normal to reverse ISE 7 ZrO2 59 [44]
8 Cu 64 [45]
9 Y2O3-ZrO2 15 [46]
Table 2. The optimized parameters of the sixteen ISE models for different materials.
Model Parameter Normal ISE Reverse ISE Transition of normal to reverse ISE
MgO 16MND5 HEA NiCSi TC4 PED Ni ZrO2 Cu Y2O3-ZrO2
Meyer m0 8.063E-02 2.651E-01 2.257E-01 1.580E-11 2.221E-14 2.220E-14 9.056E-02 1.314E-01 1.661E-02
m1 9.639E+00 2.352E+00 7.408E-01 9.467E+00 2.340E+00 5.865E+00 2.118E+01 1.841E+00 1.287E+01
H-K k2 1.029E+01 2.997E+00 5.927E-01 9.467E+00 2.331E+00 5.683E+00 2.225E+01 2.381E+00 1.268E+01
k3 7.630E-03 7.652E-03 1.493E-02 3.973E-14 1.628E-13 1.626E-12 3.771E-12 3.653E-12 1.391E-11
PSR b0 9.844E+00 2.563E+00 5.395E-01 9.467E+00 2.331E+00 5.683E+00 2.169E+01 2.343E+00 1.268E+01
b1 1.597E-01 1.586E-01 1.110E-01 2.770E-14 1.317E-11 3.611E-09 2.072E-01 3.111E-03 8.098E-10
MPSR g0 9.422E+00 2.443E+00 4.805E-01 1.198E+01 2.703E+00 5.912E+00 1.882E+01 1.763E+00 1.250E+01
g1 3.502E-01 2.079E-01 2.585E-01 -4.535E-01 -9.325E-02 -1.595E-04 2.091E+00 9.640E-02 4.476E-01
g2 -1.133E-02 -2.643E-03 -2.527E-02 4.208E-03 2.534E-03 -1.869E-02 -9.867E-02 -1.444E-03 -4.187E-02
EPD e0 3.143E+00 1.627E+00 7.431E-01 3.077E+00 1.527E+00 2.384E+00 4.664E+00 1.533E+00 3.561E+00
e1 2.356E-02 3.925E-02 5.782E-02 5.445E-12 2.275E-14 3.682E-14 1.950E-02 8.139E-04 3.512E-12
EXP r1 3.018E+00 4.024E+00 6.453E-01 -2.426E+01 -1.027E+00 -2.377E+00 7.590E+01 1.804E+00 2.699E+02
r2 3.685E+00 9.041E+00 1.004E+00 2.302E+01 7.165E+00 3.617E+01 8.536E+00 5.288E+00 7.642E-04
r3 9.586E+00 2.763E+00 5.206E-01 1.102E+01 2.542E+00 5.873E+00 2.054E+01 1.542E+00 -2.571E+02
H-J j0 8.821E+00 4.150E-01 3.544E-01 4.168E+00 4.838E-02 2.410E-01 1.521E+01 8.493E-01 6.014E-01
j1 7.819E-01 1.140E+00 1.402E-01 1.068E-12 2.443E-14 2.220E-14 1.334E+01 3.302E-01 2.220E-14
j2 2.337E-14 3.589E+00 2.266E-14 4.532E+01 5.344E+00 3.164E+01 1.651E+01 3.290E-02 1.515E+02
N-G H0 9.719E+00 2.351E+00 4.461E-01 1.085E+01 2.340E+00 5.865E+00 1.939E+01 1.280E+00 1.276E+01
h0 4.216E-02 2.316E-01 1.821E+00 1.026E-02 2.220E-14 2.220E-14 1.338E-01 3.613E-01 2.220E-14
N-G-Fs H0 9.242E+00 2.309E+00 4.516E-01 1.076E+01 2.349E+00 5.801E+00 1.794E+01 1.391E+00 1.005E+01
h0 4.607E-02 1.176E-01 7.597E-01 9.346E-03 1.097E-13 1.940E-02 1.388E-01 1.058E-01 3.835E-01
h1 8.170E-02 1.249E-01 4.369E-01 1.039E-02 1.043E+00 2.606E-01 3.447E-02 7.292E-03 1.622E-01
r0 7.189E-01 2.731E-01 5.481E-01 1.594E+06 1.416E+02 3.497E+00 8.178E+00 3.544E+01 3.109E+00
N-G-Hs H0 9.495E+00 2.362E+00 4.651E-01 1.090E+01 2.417E+00 5.867E+00 1.960E+01 1.286E+00 1.279E+01
h0 6.329E-02 2.248E-01 1.421E+00 4.431E-14 7.455E-07 7.385E-08 1.629E-01 3.586E-01 3.024E-02
hnano 6.487E-02 1.982E-08 1.893E-01 2.220E-14 4.093E+01 1.161E+01 8.047E-02 3.646E-02 1.628E-01
N-G-H H0 9.204E+00 2.295E+00 4.406E-01 5.834E-02 6.391E-01 1.571E-01 1.739E+01 1.236E+00 8.682E+00
h0 1.035E-01 4.700E+01 1.967E+00 3.993E+04 1.349E+01 1.414E+04 3.807E-01 4.120E-01 1.795E+00
h1 1.198E-01 1.695E+02 3.633E-01 3.641E-01 4.807E-01 9.558E+00 1.315E-03 1.896E-08 4.193E-01
n 9.735E-01 4.901E-02 8.645E-01 1.847E+00 1.473E+00 1.045E+00 3.286E+00 5.415E+00 1.688E+00
N-G-A H0 4.784E+00 2.265E+00 4.877E-01 1.097E+01 3.007E+00 5.891E+00 1.939E+01 1.280E+00 1.104E+01
Hy 3.825E+00 2.257E-14 3.343E-01 5.967E+04 3.189E+00 2.460E+03 0.000E+00 0.000E+00 1.050E+01
h0 1.038E-07 2.371E-01 6.968E+00 4.902E-03 2.257E+00 1.684E-04 1.338E-01 3.613E-01 1.492E-09
β 1.475E-01 1.822E+00 9.192E+00 7.944E+00 8.292E-01 2.702E+00 0.000E+00 0.000E+00 1.536E-01
N-G-Qs H0 8.855E+00 1.741E-02 1.804E-01 1.085E+01 2.340E+00 5.865E+00 1.807E+01 1.280E+00 1.276E+01
h0 2.952E+00 3.802E-01 9.892E-02 1.026E-02 2.220E-14 2.220E-14 6.023E+00 3.613E-01 2.220E-14
σ0 1.016E-02 2.725E+03 5.598E+00 0.000E+00 0.000E+00 0.000E+00 2.219E-02 0.000E+00 0.000E+00
N-G-YC H0 9.359E+00 2.363E+00 4.408E-01 1.085E+01 2.466E+00 5.872E+00 2.007E+01 1.280E+00 1.248E+01
h0 8.538E-02 2.244E-01 2.011E+00 1.026E-02 2.337E-14 2.337E-14 8.916E-02 3.613E-01 7.457E-02
h3 5.199E-02 1.025E-04 4.287E-01 0.000E+00 6.322E-02 1.296E-02 5.670E-02 0.000E+00 8.235E-02
N-G-Ls H0 9.087E+00 2.227E+00 4.290E-01 1.215E+00 2.534E+00 5.905E+00 1.649E+01 8.363E-01 1.227E+01
h0 7.354E+01 4.284E+00 1.024E+01 2.374E+01 3.728E+01 4.508E+02 5.995E-01 1.672E+05 2.691E+01
c 4.424E-03 2.970E-02 1.694E-02 6.971E-02 1.410E-01 8.128E-03 1.079E-02 1.363E+05 1.012E-02
d 6.967E-02 4.037E-01 1.344E-01 2.353E-01 9.211E-01 1.121E+00 7.524E-01 4.612E+06 1.241E+00
f 3.199E+01 2.160E+00 4.007E+00 8.769E-01 1.121E+00 3.633E+00 3.753E-01 3.401E+01 1.044E+00
m 2.000E+00 2.000E+00 2.000E+00 2.000E+00 2.000E+00 2.000E+00 2.000E+00 2.000E+00 2.000E+00
ξ 6.030E-03 2.498E-02 1.346E-02 1.817E-02 4.861E-02 3.544E-03 3.368E-12 6.148E+01 8.113E-03
L-Z-Hs H0 9.895E+00 2.709E+00 5.329E-01 1.097E+01 2.675E+00 5.931E+00 2.026E+01 2.122E+00 1.345E+01
δ -6.993E-03 -1.848E-02 -9.721E-02 2.221E-14 1.544E-02 2.315E-03 -1.177E-02 -5.695E-03 6.193E-03
m 2.000E+00 2.000E+00 2.000E+00 2.000E+00 2.000E+00 2.000E+00 2.000E+00 2.000E+00 2.000E+00
Table 3. The DC of the sixteen ISE models for different materials.
Model Normal ISE Reverse ISE Transition of normalto reverse ISE Mean DC
MgO 16MND5 HEA NiCSi TC4 PED Ni ZrO2 Cu Y2O3-ZrO2
Meyer 0.9863 0.9623 0.9940 0.0000 0.0000 0.0000 0.3087 0.2138 0.1120 0.3975
H-K 0.6088 0.8641 0.5672 0.0000 0.0000 0.0000 0.0000 0.0000 0.0000 0.2267
PSR 0.8595 0.9875 0.8354 0.0000 0.0000 0.0000 0.0587 0.0033 0.0000 0.3049
MPSR 0.9803 0.9955 0.9854 0.9209 0.9783 0.9853 0.6786 0.5455 0.5512 0.8468
EPD 0.8472 0.9753 0.7910 0.0000 0.0000 0.0000 0.0535 0.0027 0.0000 0.2966
EXP 0.9961 0.9732 0.9904 0.9864 m 0.9766 0.9902 0.8691 0.9275 0.0147 0.8582
H-J 0.9937 0.9991 0.9936 0.8636 0.0502 0.7699 0.7944 0.8870 0.1019 0.7170
N-G 0.8882 0.9895 0.9988 0.9314 0.0505 0.8761 0.8391 0.9403 0.0759 0.7322
N-G-Fs 0.9977 m 0.9993 m 0.9991 0.8708 0.9789 m 0.8082 0.8400 0.9900 m 0.8029 0.9208 m
N-G-Hs 0.9710 0.9971 0.9917 0.8636 0.7920 0.9528 0.7141 0.9144 0.3963 0.8437
N-G-H 0.9965 0.9983 0.9998 m 0.7414 0.9771 0.9443 0.8278 0.9900 m 0.8098 m 0.9206
N-G-A 0.9884 0.9987 0.9978 0.9624 0.9777 0.9952 m 0.8391 0.9403 0.2496 0.8832
N-G-Qs 0.9704 0.9983 0.9934 0.9314 0.0505 0.8761 0.8925 0.9403 0.0759 0.7476
N-G-YC 0.9853 0.9971 0.9993 0.9314 0.8977 0.9835 0.9183 m 0.9403 0.5586 0.9124
N-G-Ls 0.9956 0.9986 0.9998 m 0.9265 0.9773 0.9266 0.7489 0.8580 0.5672 0.8887
L-Z-Hs 0.8195 0.9546 0.8555 0.9854 0.9741 0.9860 0.8508 0.1935 0.2686 0.7653
Note: superscript m denotes the maximum DC of the sixteen ISE models.
Disclaimer/Publisher’s Note: The statements, opinions and data contained in all publications are solely those of the individual author(s) and contributor(s) and not of MDPI and/or the editor(s). MDPI and/or the editor(s) disclaim responsibility for any injury to people or property resulting from any ideas, methods, instructions or products referred to in the content.
Copyright: This open access article is published under a Creative Commons CC BY 4.0 license, which permit the free download, distribution, and reuse, provided that the author and preprint are cited in any reuse.
Prerpints.org logo

Preprints.org is a free preprint server supported by MDPI in Basel, Switzerland.

Subscribe

© 2024 MDPI (Basel, Switzerland) unless otherwise stated