1. Introduction
The precise collection of surface current observations is crucial for addressing a spectrum of contemporary issues, including climate forecasting [
1,
2], oceanic predictions [
3,
4], environmental incidents [
5], and understanding the mechanisms driving contaminant dispersion [
6,
7]. By merging observations of surface currents with scalar tracers (e.g., dye), it’s possible to simulate the distribution of contaminants as influenced by surface currents. This approach provides a valuable experimental framework for exploring marine disasters related to pollutant releases. Gathering surface current observations through an array of integrated platforms, encompassing both Eulerian and Lagrangian methods, alongside tracer observations from satellites, drones, and in-situ observational platforms, presents a robust method for examining the significant role of surface currents. These efforts are instrumental in deciphering the physical mechanisms and enhancing the accuracy of predictive models.
Drifters, HF radar, and ocean color imagery are widely used for estimating surface currents. Drifters, passive devices tracked by satellite, provide direct measurements of surface currents, reflecting the movements of water parcels at the ocean’s surface within a Lagrangian reference frame. Consequently, they have been instrumental in monitoring ocean circulations across various water bodies, from lakes and coastal areas to open oceans, moving passively with the surface current [
8,
9,
10,
11,
12]. This platform has been proven to be an effective means of quantifying horizontal dispersion [
13,
14]. HF radar offers a comprehensive view, capable of mapping surface currents over wide areas from land-based stations, thus providing valuable data, particularly for nearshore regions. Ocean color imagery, derived from platforms like the Geostationary Ocean Color Imager (GOCI) and Himawari satellites, provides indirect estimates of surface currents by tracking the movement of chlorophyll, sediments, and other scalar products that induce color changes in extensive surface water areas [
15,
16]. Both HF radar and satellite-based current observations provide a velocity map in a Eulerian reference frame, which allows for the comprehensive analysis of surface current patterns and predicting contaminant movements [
17,
18].
Scalar tracers have been used to elucidate the fate of contaminants and quantify mixing in water bodies [
19,
20]. Rhodamine WT, a water-soluble dye known for its strong fluorescence, has been widely used in investigating water movement and mixing processes in aquatic environments [
21,
22,
23]. The visibility and detectability of Rhodamine WT at low concentrations afford a significant advantage in characterizing the dispersion rate in surface waters [
24,
25] and deep waters [
26] in both horizontal [
27] and vertical directions [
28,
29]. Advances in drone technology have further bolstered observation capabilities, enabling high-resolution aerial imagery collection to track dye movement across temporal and spatial scales [
30,
31]. These methods support traditional sampling observations, where water samples are collected to measure dye concentration quantitatively, providing data that complement qualitative observations from drones and remote sensing technologies [
32].
The near-surface current significantly influences the initial dispersion of tracers within the top surface layer, affected by a variety of physical phenomena, including the Ekman current, Stokes drift, and wind-induced surface currents. Stemming from the interplay between wind force, the Coriolis effect, and viscous drag in the ocean’s upper layers, the Ekman current usually aligns at a 45-degree angle eastward relative to the prevailing wind at the surface in the Northern Hemisphere [
33,
34]. This orientation aids in the formation of the Ekman spiral, recognized for its depth-dependent variations in current direction and speed. Moreover, Stokes drift, driven by wave dynamics, plays a crucial role in the horizontal transport of materials within the top surface layer, through the net displacement of water particles along the wave propagation path across consecutive wave cycles [
35]. Consequently, wind energizes vertical current shear within the top surface layer by integrating effects including both the Ekman current and Stokes drift, with wind impacts reaching several meters down in coastal regions. Given the fast vertical diffusion of scalar tracers near the surface, high-resolution observation during the onset of dispersion is essential for precisely analyzing tracer dispersion mechanisms, underscored by the physical processes prevalent in the top surface layer. Enhanced insight into these processes also aids in developing more effective response mechanisms to environmental incidents, such as oil spills and chemical discharges.
In this work, we monitored the temporal variation of surface-released dye distribution in a coastal area for half a semidiurnal duration, focusing on characterizing the dispersion mechanism by the physical processes prevailing in the top surface layer. The horizontal temporal variation of the dye patch was monitored by drone, polar-orbital satellite, and in-situ sampling, and the estimation of vertical diffusivity was estimated by casting a fluorometer. Concurrently, the Eulerian surface current was observed by HF radar, and the Lagrangian surface current was observed by float and drifters. Through the integrated observation of dye patch and surface current, we aimed to investigate the synergistic effects of these currents on the dispersion rate and fate of various tracers.
2. Materials and Methods
2.1. Field Experiment
The dye release and monitoring experiment was carried out aboard the R/V Research 1, a 390-ton vessel, during a cruise on September 26, 2021 [
36]. Observations of the dye commenced at 9:10 am and ended at 4:10 pm on the same day. The research area was selected off the coast of Yeosu City (
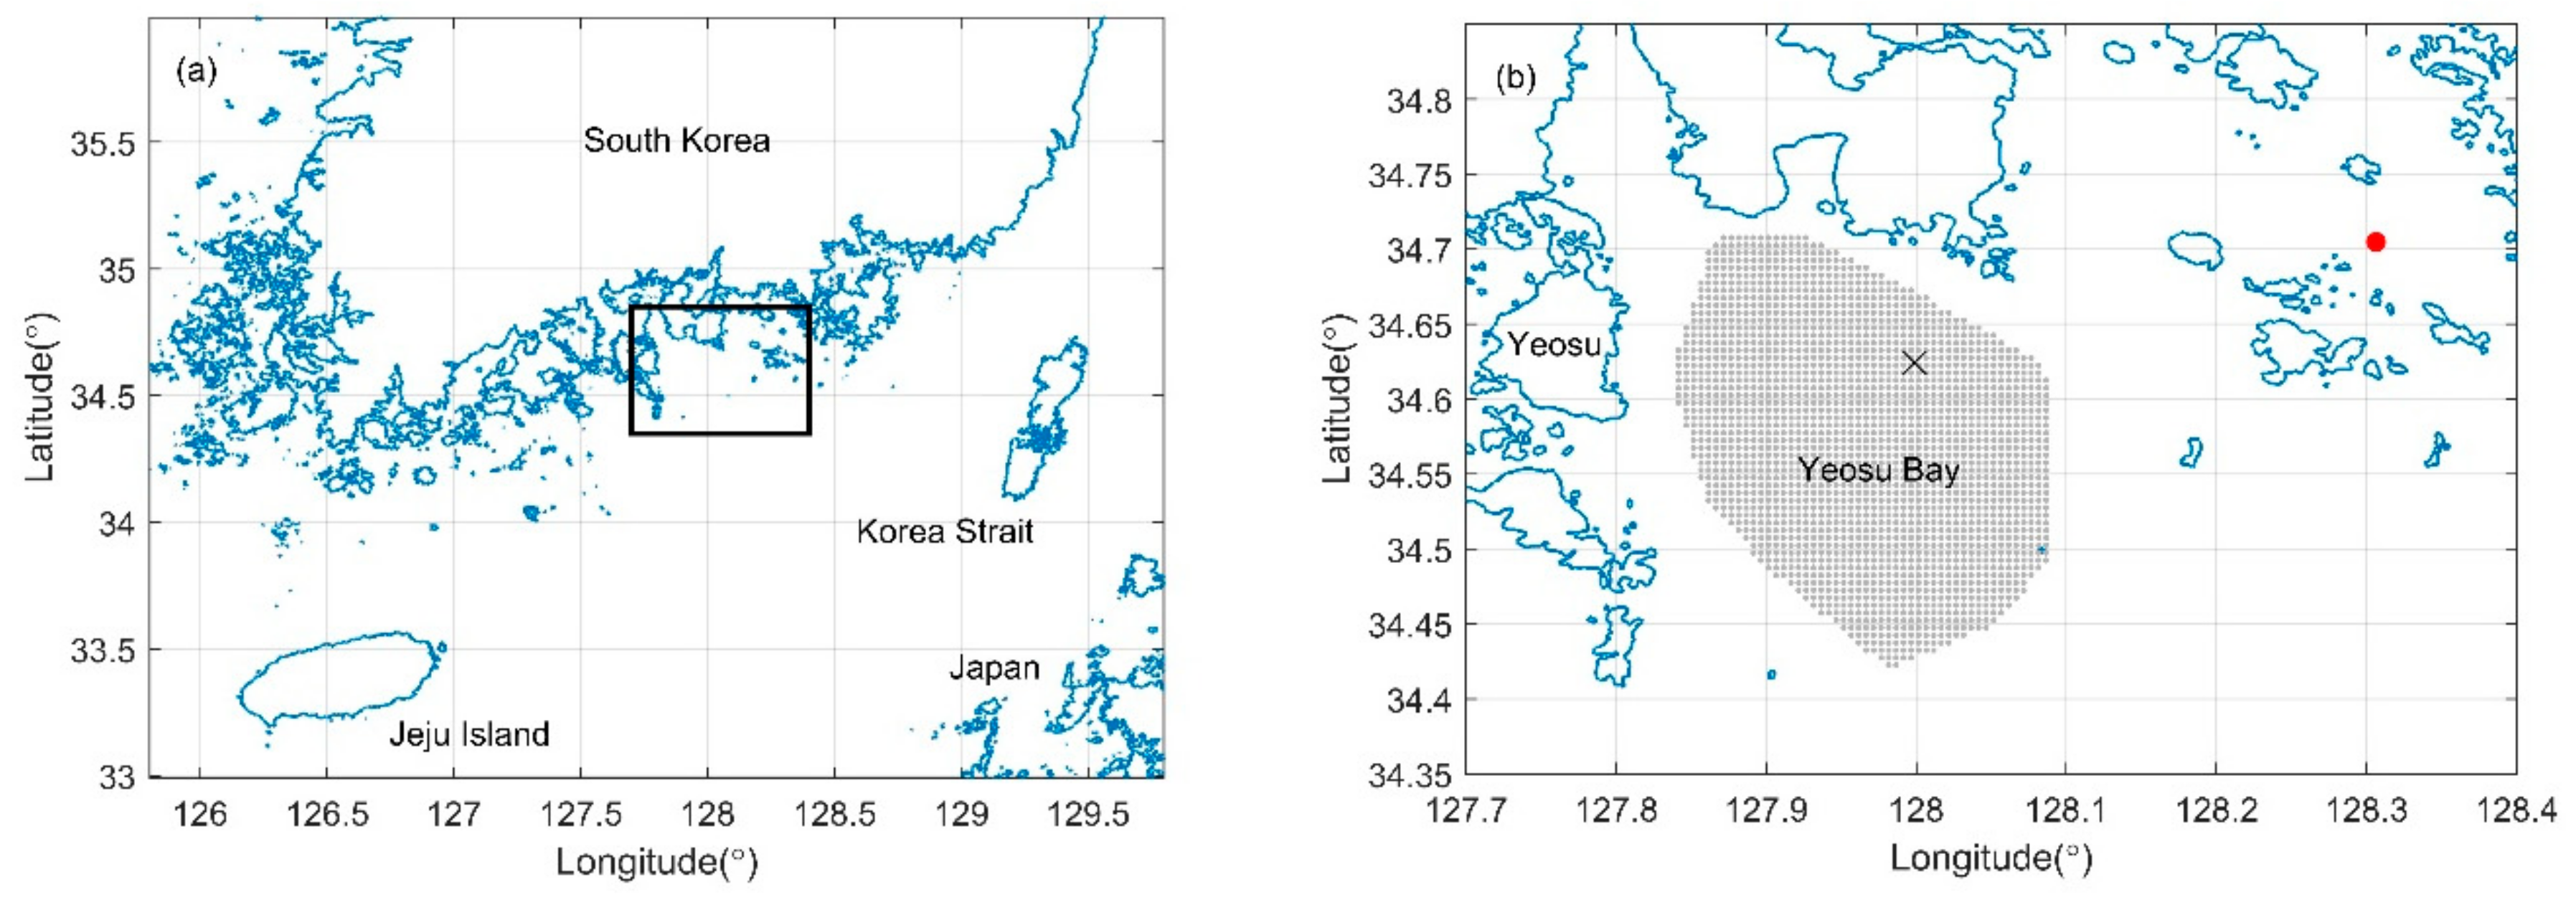
Figure 1), situated on the southern boundary of South Korea. Positioned approximately 10 km from the nearest coast, this area lies within the coverage of HF radar (shaded area in
Figure 1b), chosen to minimize disruptions from commercial and cargo ship traffic.
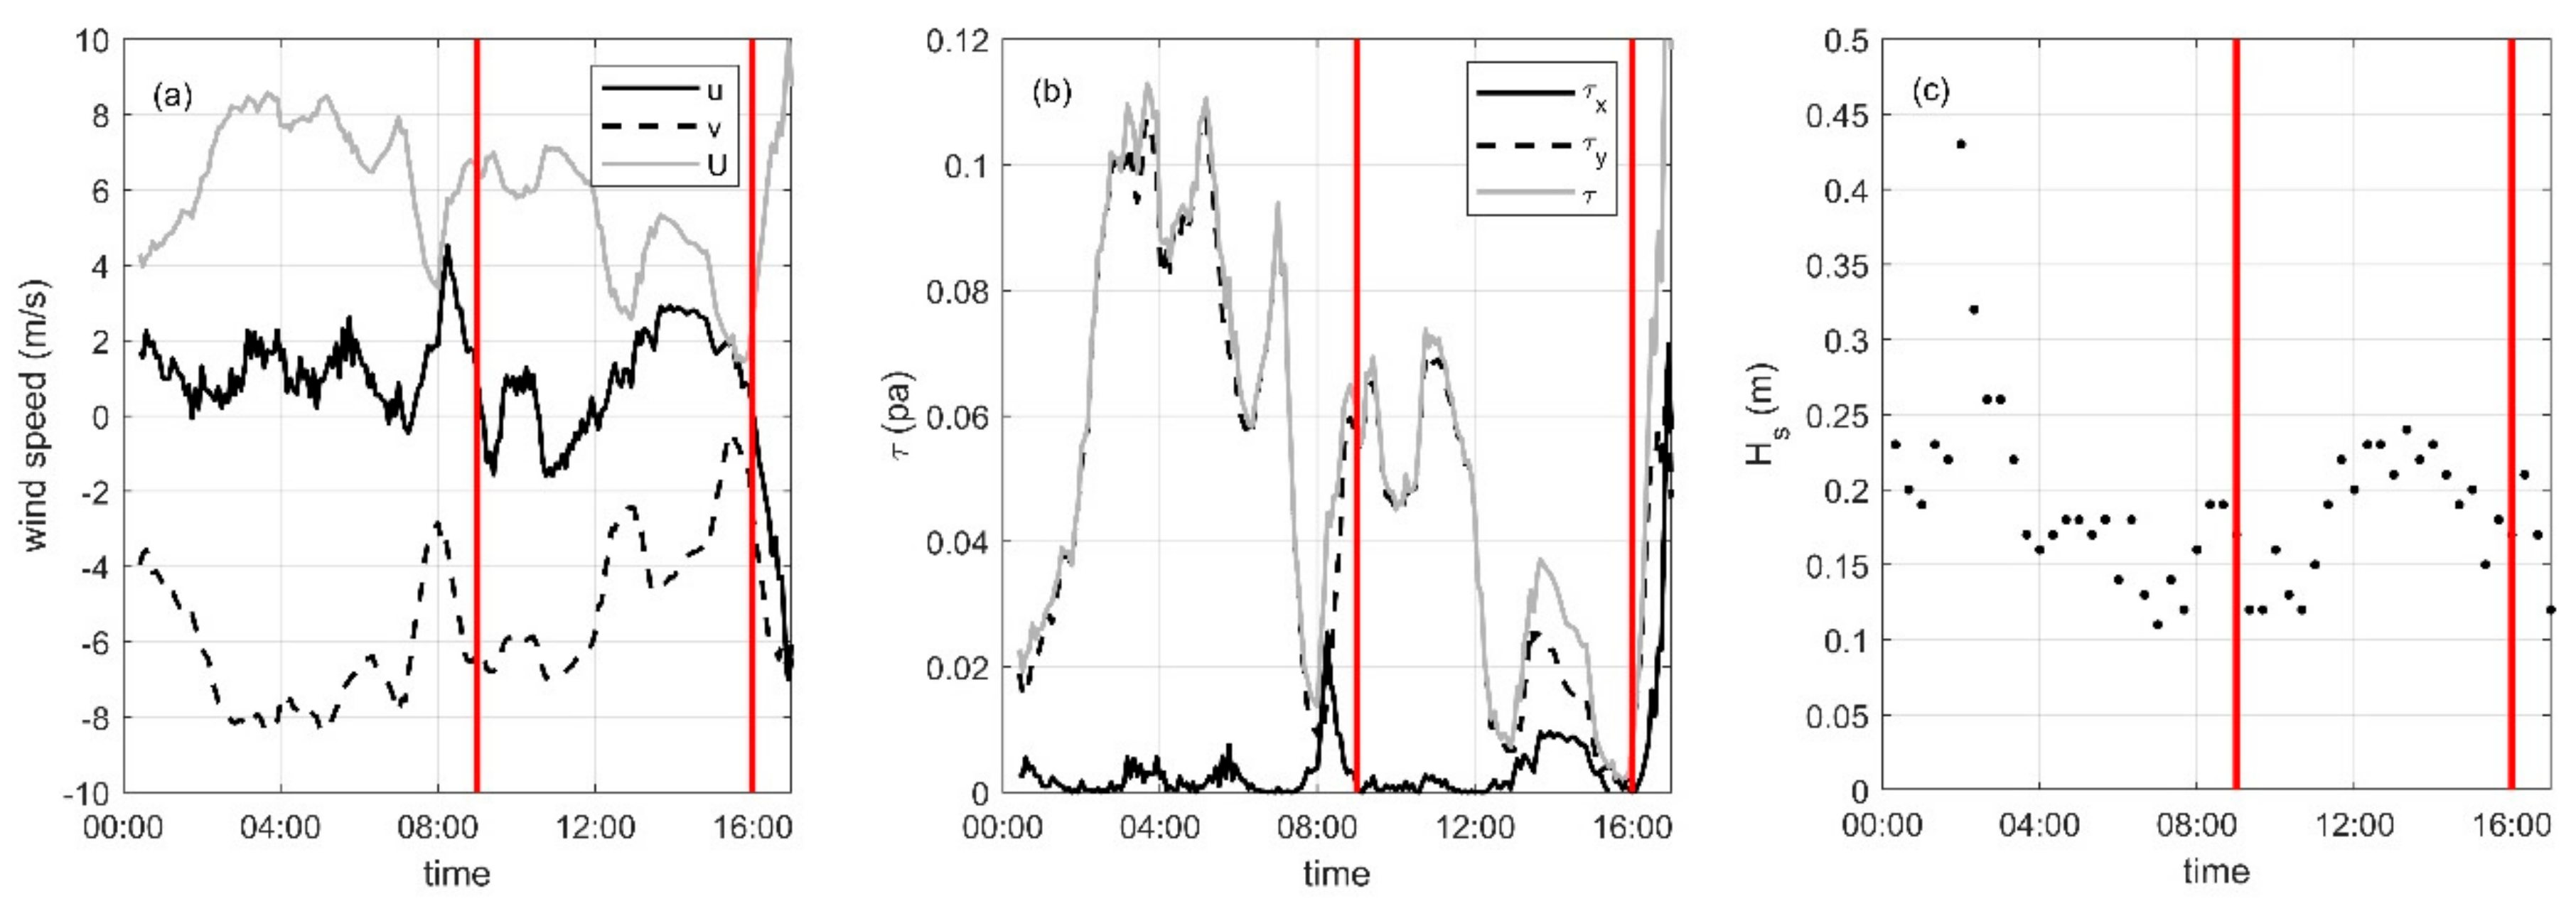
Throughout the experiment, the average wind speed was recorded at 4.87 m/s, with the southward wind speed (4.50 m/s) significantly exceeding the westward wind speed (0.91 m/s). The corresponding average wind stress (
) was calculated at 0.04 Pa, based on the drag coefficient parameterized by
[
37]. The significant wave height, measured by a buoy located 30 km from the dye release point, was approximately 0.2 m. The field experiment, encompassing observations of both the dye patch and surface currents, took place under calm weather conditions marked by light northerly winds and small wave activity.
2.2. Dye Observations
In the study of early dispersion of a scalar contaminant, Rhodamine WT (RWT) dye was chosen as the tracer because of its good water solubility and distinct pink coloration, which facilitates easy detection. The dye was introduced into the ocean surface at the coordinates 34.6302N, 127.9767E in Yeosu Bay (
Figure 1b), where the water depth was 28 m. To match the density of dye solution closely with seawater and prevent it from immediate sinking, 38 L of 20% RWT (1150 kg/m
3) were mixed with 17 L of ethanol (789 kg/m
3) and 40 L of in situ seawater (1029 kg/m
3). This mixture resulted in a total volume of 95 L of dye solution with a density of approximately 1015 kg/m
3, slightly lower than that of the surface water. For efficient mixing with the surface water, a diffuser with around 100 holes, each 3 mm in diameter, was used for diffusing dye. The dye was discharged at a flow rate of 0.2 L/s over a span of 10 min from a floating diffuser located 40 m from the ship, to reduce the disturbance caused by the vessel.
The dye concentration distribution was monitored using both in situ sampling and remote sensing data, including drone and satellite imagery. Measurements spanned a total of 7 h from the start, with the distribution not being measured simultaneously; hence, data from various platforms were integrated to complete the dispersion time series. From the beginning of the dye release, two drones, Mavic 2 Pro and Inspire 2, intermittently captured images of the dye patch, from which concentration estimates were derived from RGB images. These images were then converted to grayscale, featuring separate channels for red, green, and blue, with each pixel in the grayscale image ranging from 0 to 255. Pixels valued below 120 were identified as part of the dye patch, while those exceeding 120 were excluded, which mapping matched well with in situ measurements. Since the images were taken over the ocean, external factors such as waves and the direction of sunlight introduced color variations within the patch. Color filtering might inadvertently omit portions of the patch due to these variations, and linear interpolation was employed to estimate missing pixel values and reconstruct the patch. The ship’s dimensions, 46.5 m in length and 9 m in width, served as reference points for distance calibration during image processing to establish pixel dimensions.
To complement drone measurements, two maps depicting the dye distribution at 1 h and 7 h after the release were observed using in situ sampling. The first sampling was conducted by a small boat, measuring 5 m in length, which navigated through the dye patch, collecting surface samples in thirty-five 20 mL plastic bottles over an 18-min period, while GPS coordinates were recorded at the sampling locations. The dye concentrations of the collected water samples were determined in the laboratory using a Turner Designs 10AU fluorometer. A second sampling was conducted by the R/V Research 1, utilizing an underway system. This system continuously drew surface water from around 2 m depth as the vessel traversed the dye patch in a zigzag pattern for approximately 25 min. The dye concentration was directly measured in real-time by a Turner Designs 10AU fluorometer connected to the underway system on board. The dye concentrations were interpolated using the kriging method to develop a two-dimensional distribution map. The methods of dye preparation, dye sampling, and interpolation were similar to the previous work done by Choi et al. 2020 [
10].
Additional monitoring of the dye patch was conducted using satellite images from Kompsat-2 (at 10:10 AM) and Landsat OLI (at 11:06 AM), captured approximately 1 and 2 h after the dye release, respectively. The Kompsat-2 image, supplied by the Korea Aerospace Research Institute (KARI), was an uncorrected 1R file. It underwent geometric correction utilizing Rational Function Coefficients (RPCs), with further corrections made by selecting Ground Control Points (GCPs) using the Landsat OLI image as a reference. The Top of Atmosphere (TOA) radiance was calculated from gain values and subsequently converted to reflectance (Lee and Lee, 2015). The Landsat OLI data, acquired as Level 1 products from the USGS website, received atmospheric correction through the QUAC model in ENVI 5.6.3 software (NV5 geospatial, Broomfield, CO, USA) [
38]. To estimate the dye concentration within the satellite imagery, a concentration index was computed using the (red-blue) / (red+blue) formula [
39]. Correlation with in-situ dye concentrations was established via linear regression, utilizing measurements (n = 24) that coincided with the time of the Landsat OLI capture. Given the 30 m spatial resolution of the Landsat OLI image and the presence of multiple observation points within single pixels, the images were resampled to a 5 m resolution using Spline interpolation. A positive correlation was noted between increases in dye concentration and index values, with the index normalized to a 0 to 1 range using min-max scaling [
40,
41].
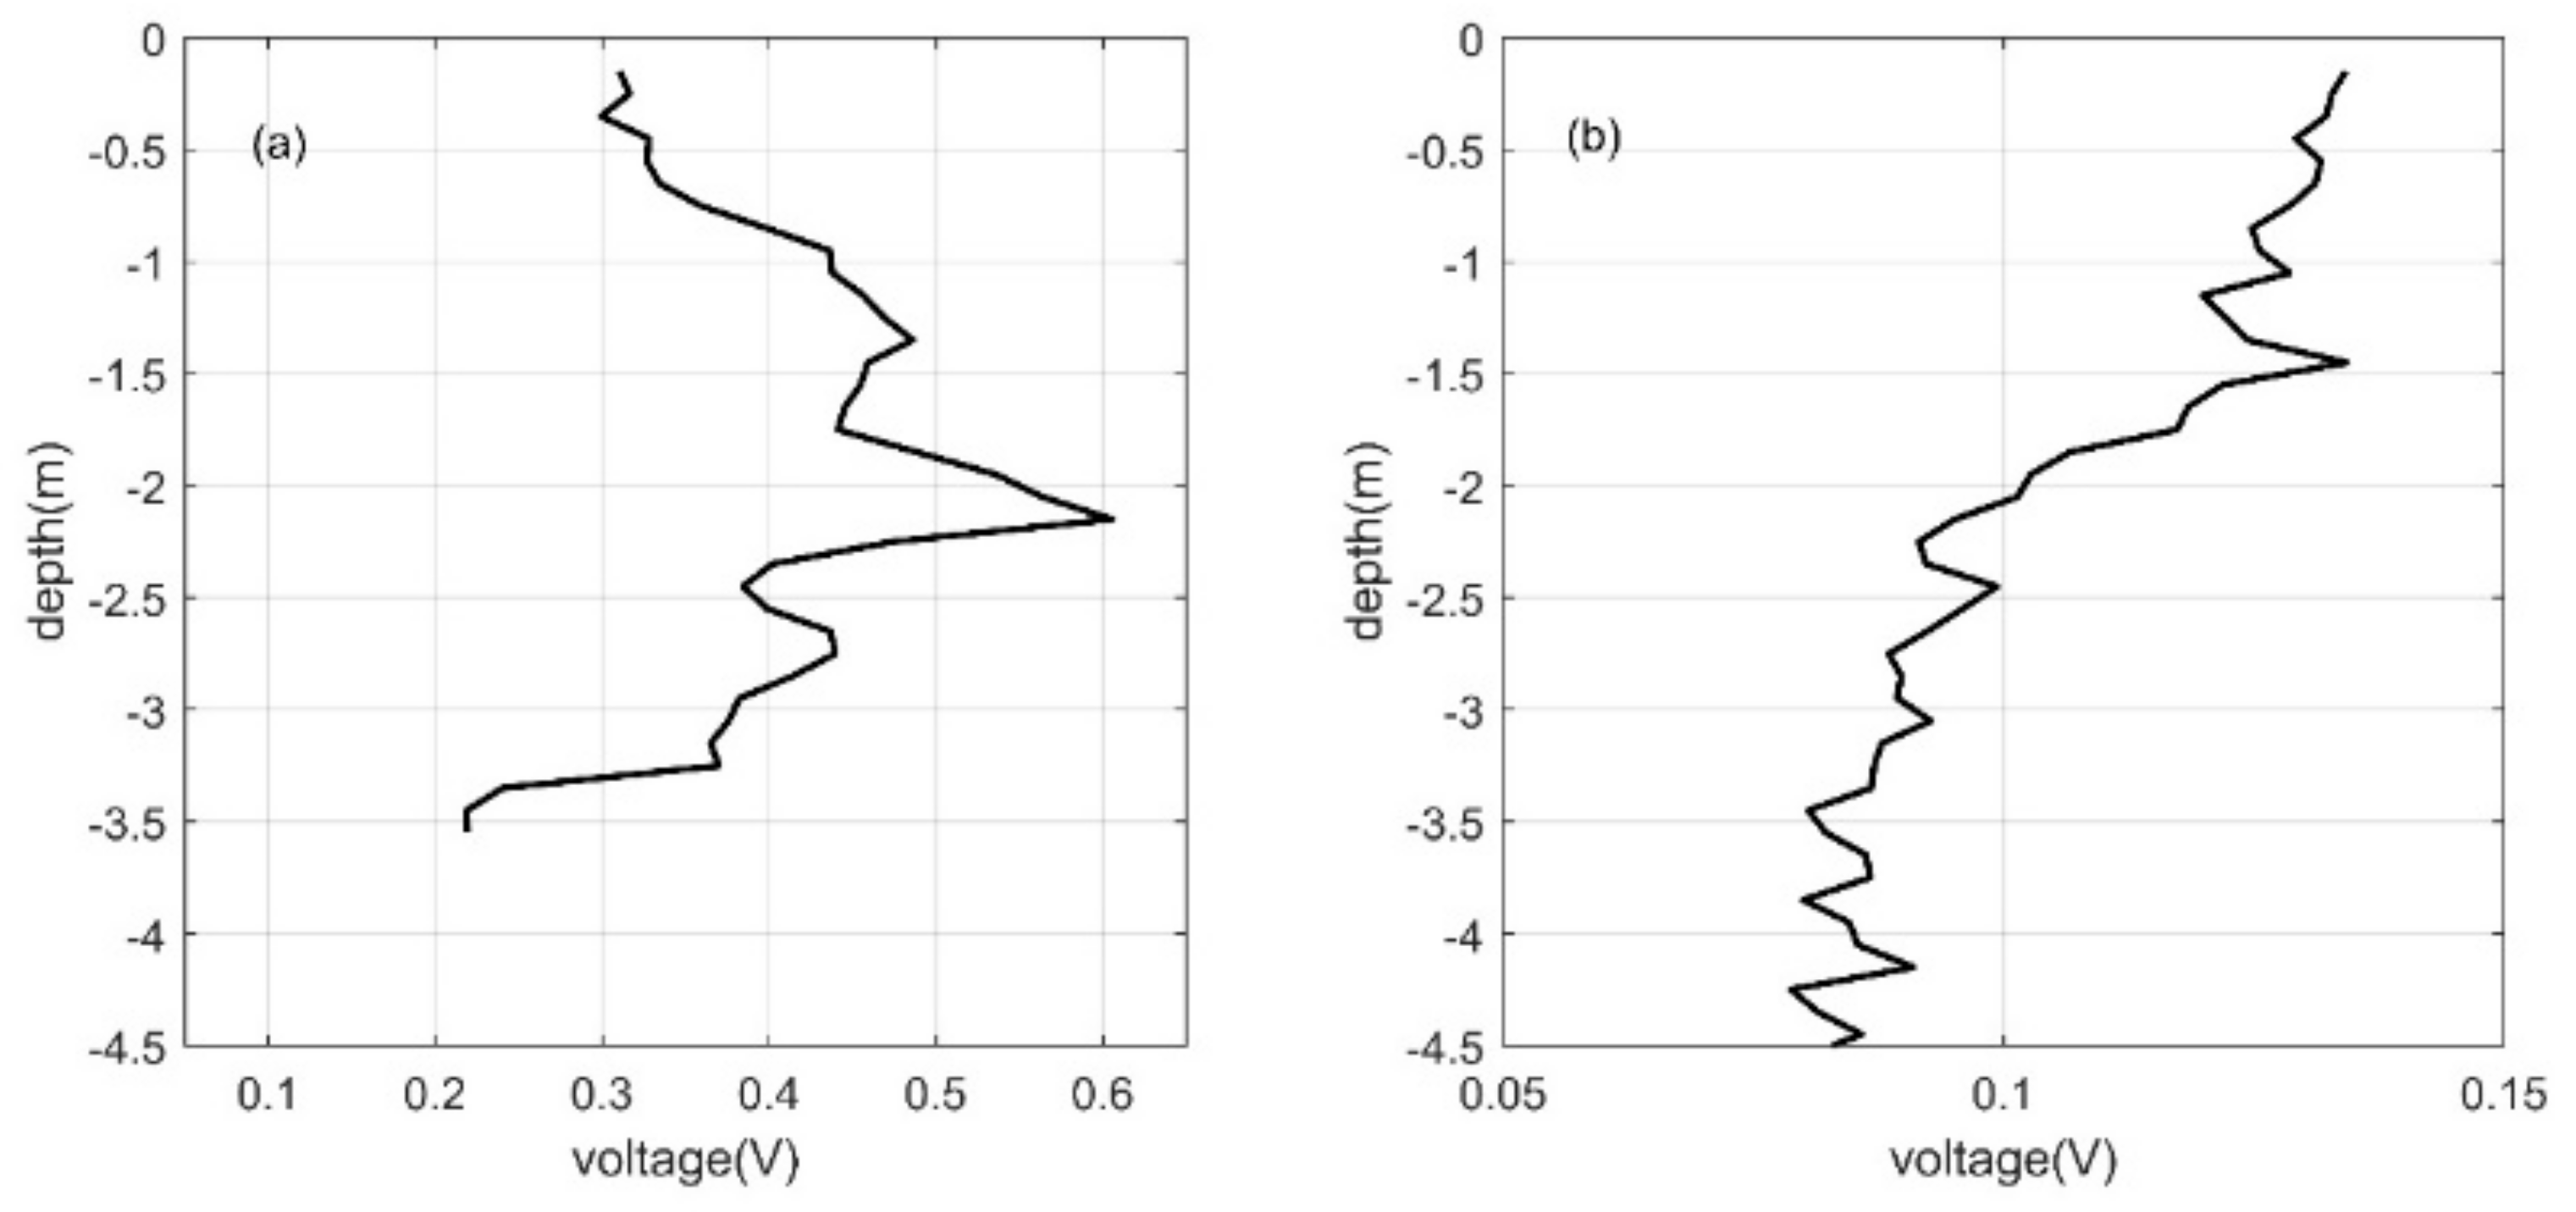
The observation platforms were primarily used to monitor the horizontal dispersion of the dye. For capturing vertical profiles of dye concentration, a fluorometer attached to the Self-Contained Autonomous Micro-Profiler (SCAMP) was utilized. This sensor records fluorescence emitted by the dye, converting it into voltage readings via a photodiode. The fluorometer operated at a sampling rate of 100 Hz and was set to measure in an upward mode from a depth of 5 m to the surface. For a comprehensive vertical profile, voltage data were binned at 10 cm intervals throughout the profile. In total, nine castings were conducted, resulting in two distinct vertical distribution profiles. The collected voltage data were subsequently analyzed to evaluate variations in the vertical dye distribution, estimating vertical eddy diffusivity near the surface.
2.3. Surface Current Observations
Concurrently with dye observations, the surface layer current was measured in both Eulerian and Lagrangian reference frames. The Eulerian surface current data were derived from combining radial data from the Yeosu Harbor area, overseen by the Korea Hydrographic and Oceanographic Agency (KHOA), which monitors surface currents in Yeosu Bay, with additional data from a nearby radar installed by the Korea Institute of Ocean Science & Technology (KIOST). This integration aimed to enhance the accuracy of data within the study area. The synthesis utilized radial data corrected via Antenna Pattern Measurement (APM) conducted through shipboard operations. The CODAR-type ocean radars used in these areas operate on a 25 MHz frequency band, featuring an angular resolution of 5 degrees and a range resolution of 1 km, with a maximum operational range of approximately 45 km. Data from these instruments are averaged over a ±37.5-min period around each hour, with average values reported on the hour.
Lagrangian observations of the surface current were conducted using one float without a drogue and three drifters equipped with drogues at varying depths. These transmitted their GPS coordinates via an Iridium modem at 30-min intervals. The main body of each device, housing the GPS and battery, was cylindrical, measuring 9 cm in diameter and 16.5 cm in height. For buoyancy, floating materials with outer and inner diameters of 23 and 9 cm, respectively, and a thickness of 6 cm were attached. Drogues, constructed from two intersecting 40 cm plastic plates, were secured to the drifters, setting the average depths of the drogues at 0.6, 0.8, and 1 m, respectively. The drifters were tracked for one day, primarily to compare their dispersion with the movement of the dye patch.
3. Results
3.1. Surface Current Observations
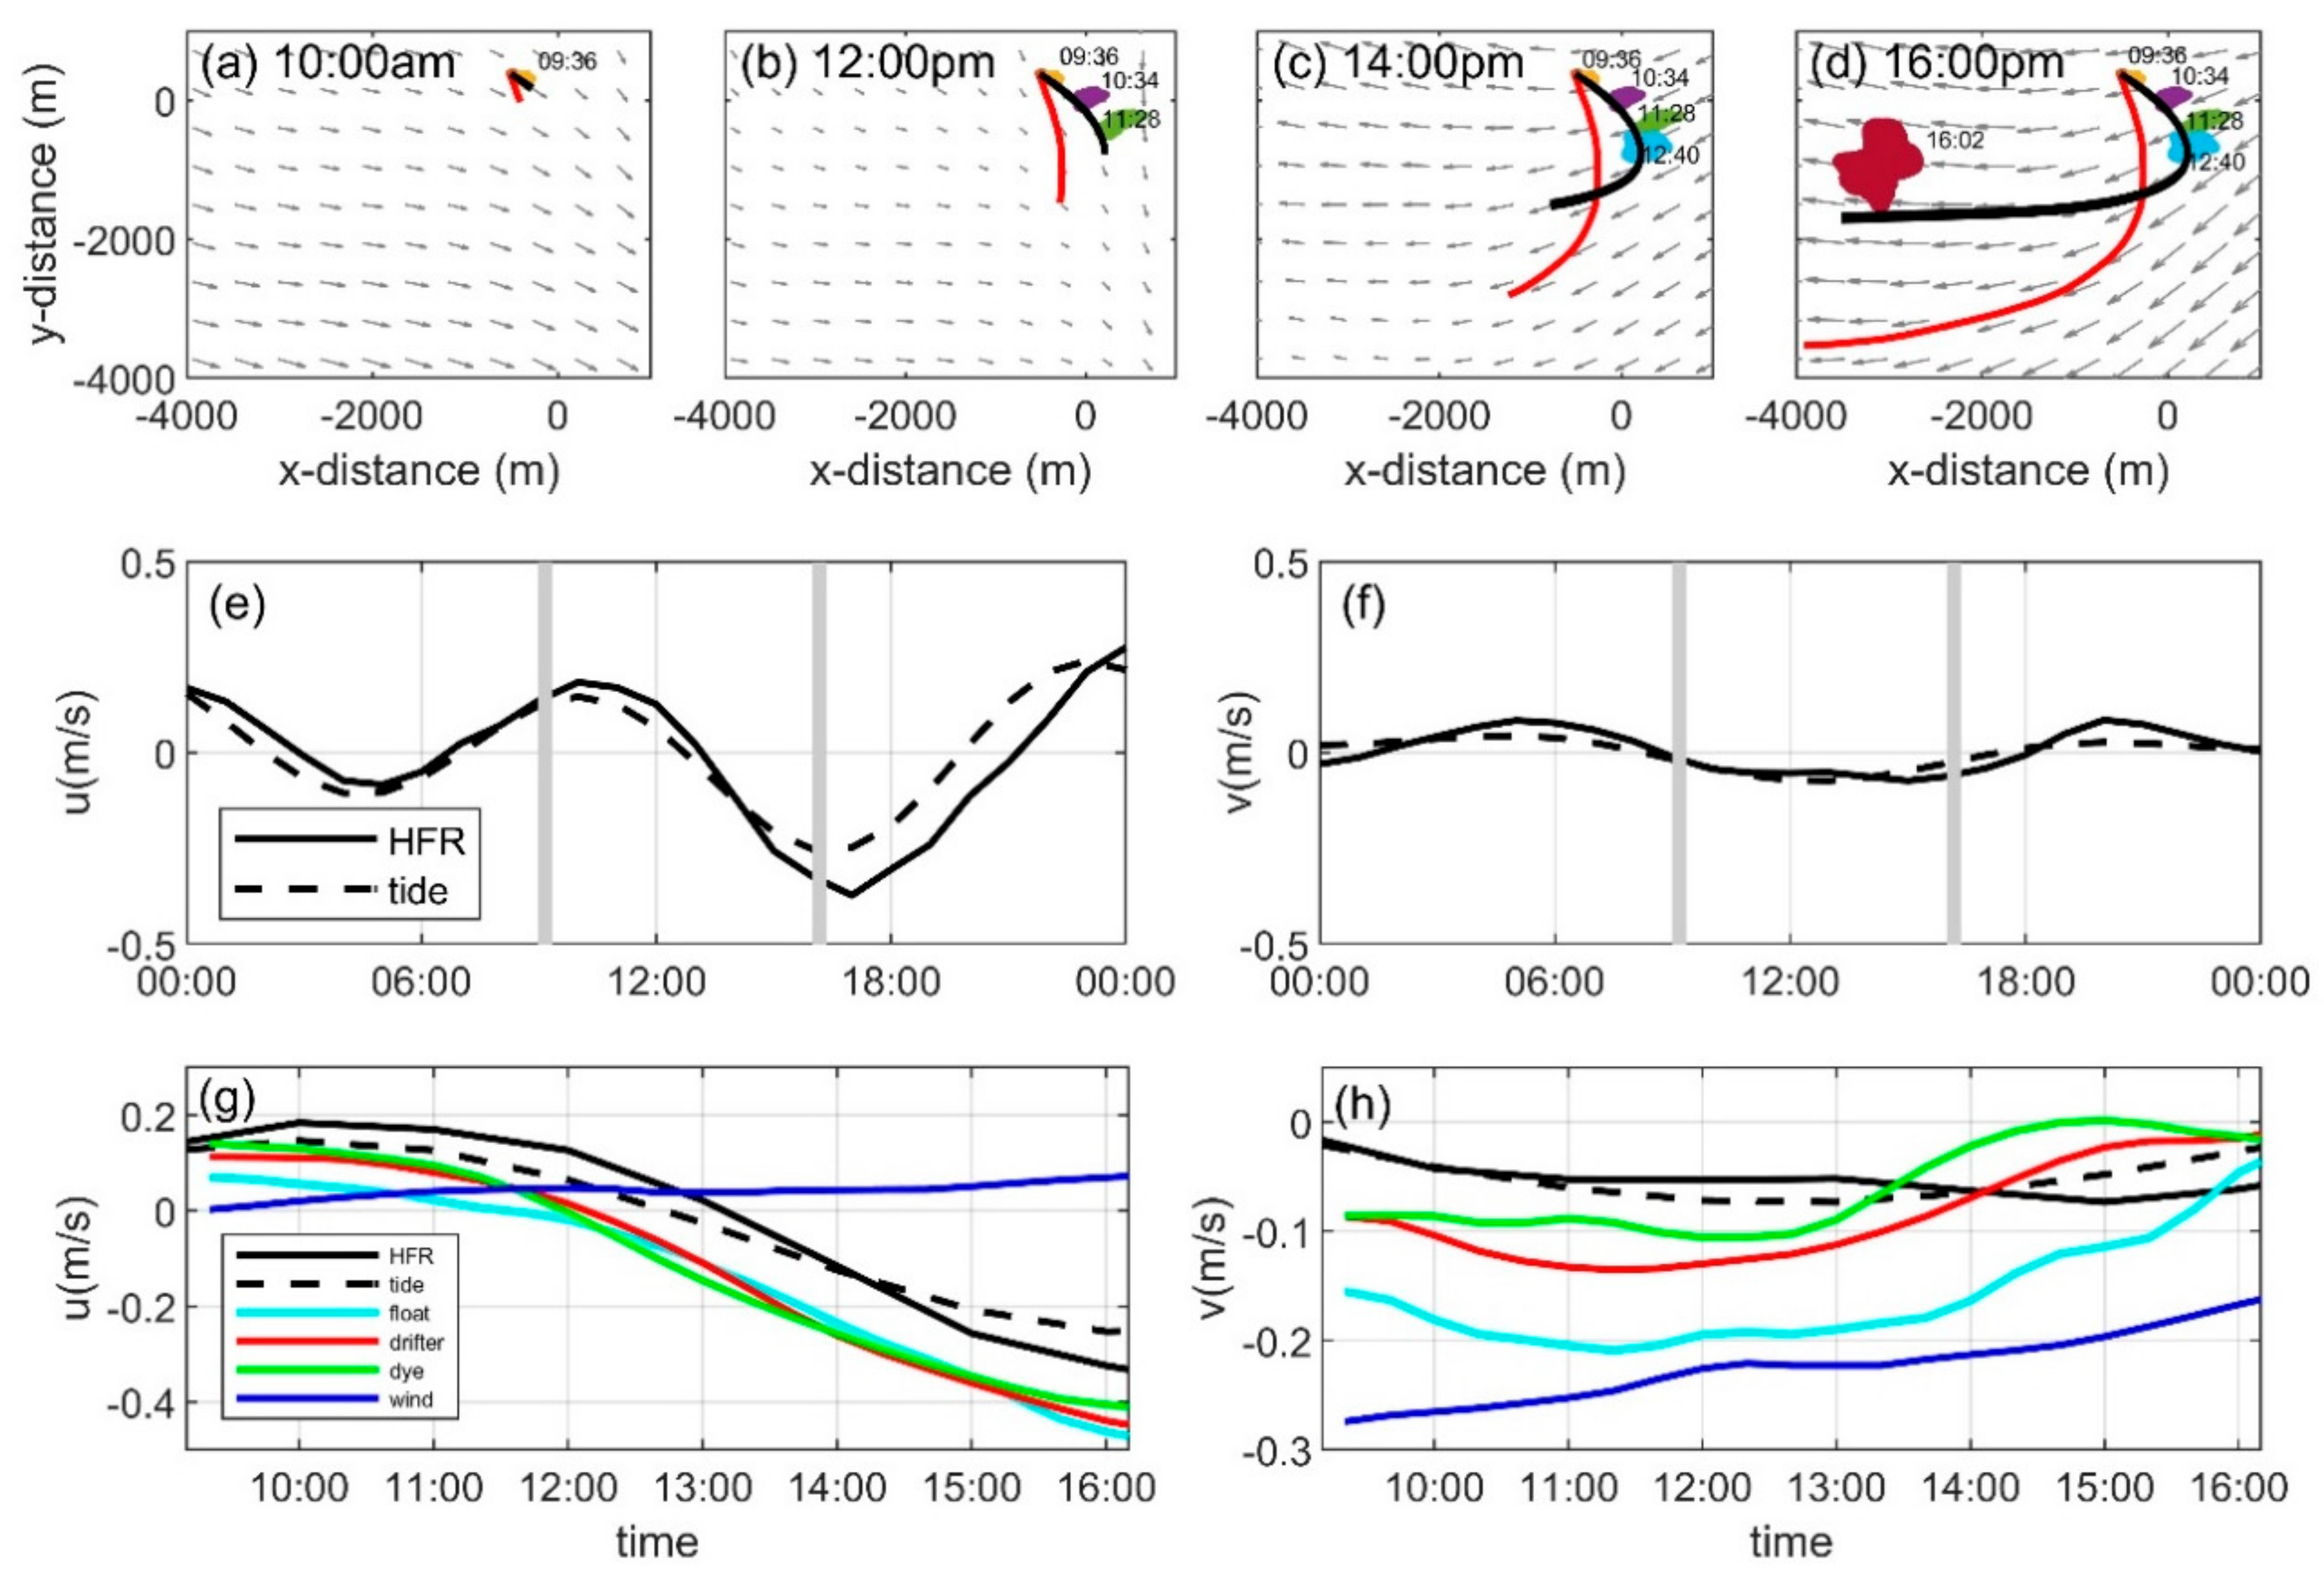
The observed phases of surface currents, as detected by HF radar and analyzed through the movements of surface drifters, demonstrated strong coherence with the phase of tidal currents. Throughout a 7-h period of monitoring dye distribution, HF radar data revealed a significant shift in current direction due to tide transition. Initially flowing in an east-south direction (
Figure 3a), the current later shifted westward, influenced by tidal changes (
Figure 3d). The tidal currents, predicted by the TMD model, and the HF radar (HFR) currents at a specific point near the dye release site showed substantial agreement (
Figure 3e-f), with strong correlation coefficients of 0.89 for the East-West direction and 0.66 for the North-South direction.
When examining the Lagrangian velocities of the three different tracers (dye, float, and drifter), their movements in the EW direction appeared similar and aligned with the Eulerian surface current (
Figure 3g). However, in the NS direction, the velocities of the tracers showed variation and differed from the Eulerian surface current (
Figure 3h). This disparity was primarily attributed to the influence of relatively strong northerly winds, leading to differential responses among the tracers based on their effective depths. Time series (
Figure 3e,f) reveal the correlation coefficients between the drifter velocity and the HF radar current, as well as the drifter velocity and the tidal current, to be 0.68 and 0.61, respectively. Similarly, the correlation coefficients for the float velocity with both the HF radar current and the tidal current were 0.61 and 0.77, respectively. The tracking data demonstrate a cohesive movement pattern between the observed Eulerian surface currents and the Lagrangian velocities of the tracers.
3.2. Horizontal Tracer Behaviors
The horizontal advection of the three tracers exhibited distinct behaviors despite being subjected to the same current. The center of the dye patch, influenced by currents at various depths, showed the least displacement, while the float, situated on the surface, exhibited the most significant movement. The three drifters, positioned at slightly varying depths, displayed moderate displacement with minimal relative dispersion among themselves. This variation in advection, especially in the North-South direction, is clearly depicted in
Figure 4a, where the central positions of the dye, drifters, and float are connected by lines. These points had displaced approximately 1500 m, 2000 m, and 4000 m in the NS direction, respectively (
Figure 4c), from their release point. A delayed response to the tidal current was observed in the float, but an immediate response to the current was noted in the dye patch (
Figure 4c). Notably, the final positions of the three different tracers aligned almost linearly in a direction that subtly deviated westward from the prevailing southward-blowing wind (
Figure 3a). This coherent pattern indicates a nuanced interplay between surface currents and wind direction, potentially influenced by Ekman transport.
Through a comprehensive approach employing drones, satellites, and in-situ sampling, we observed a biased dispersion direction, as determined by principal axis analysis [
42,
43]. The variance was calculated using
, where
and
denotes the spatial concentration field of the dye patch at a given time. The i and j represent the x and y dimensions of the dye patch, respectively. From these calculated variances in the x and y directions, the standard deviations along the major
and minor
principal axes were determined from the eigenvalues of the covariance matrix, with the matrix’s eigenvectors clarifying the orientation of the principal axes. The temporal evolution of variances in both x (EW) and y (NW) directions, along with the major and minor axes and their angles relative to the southward direction, were tabulated in
Table 1.
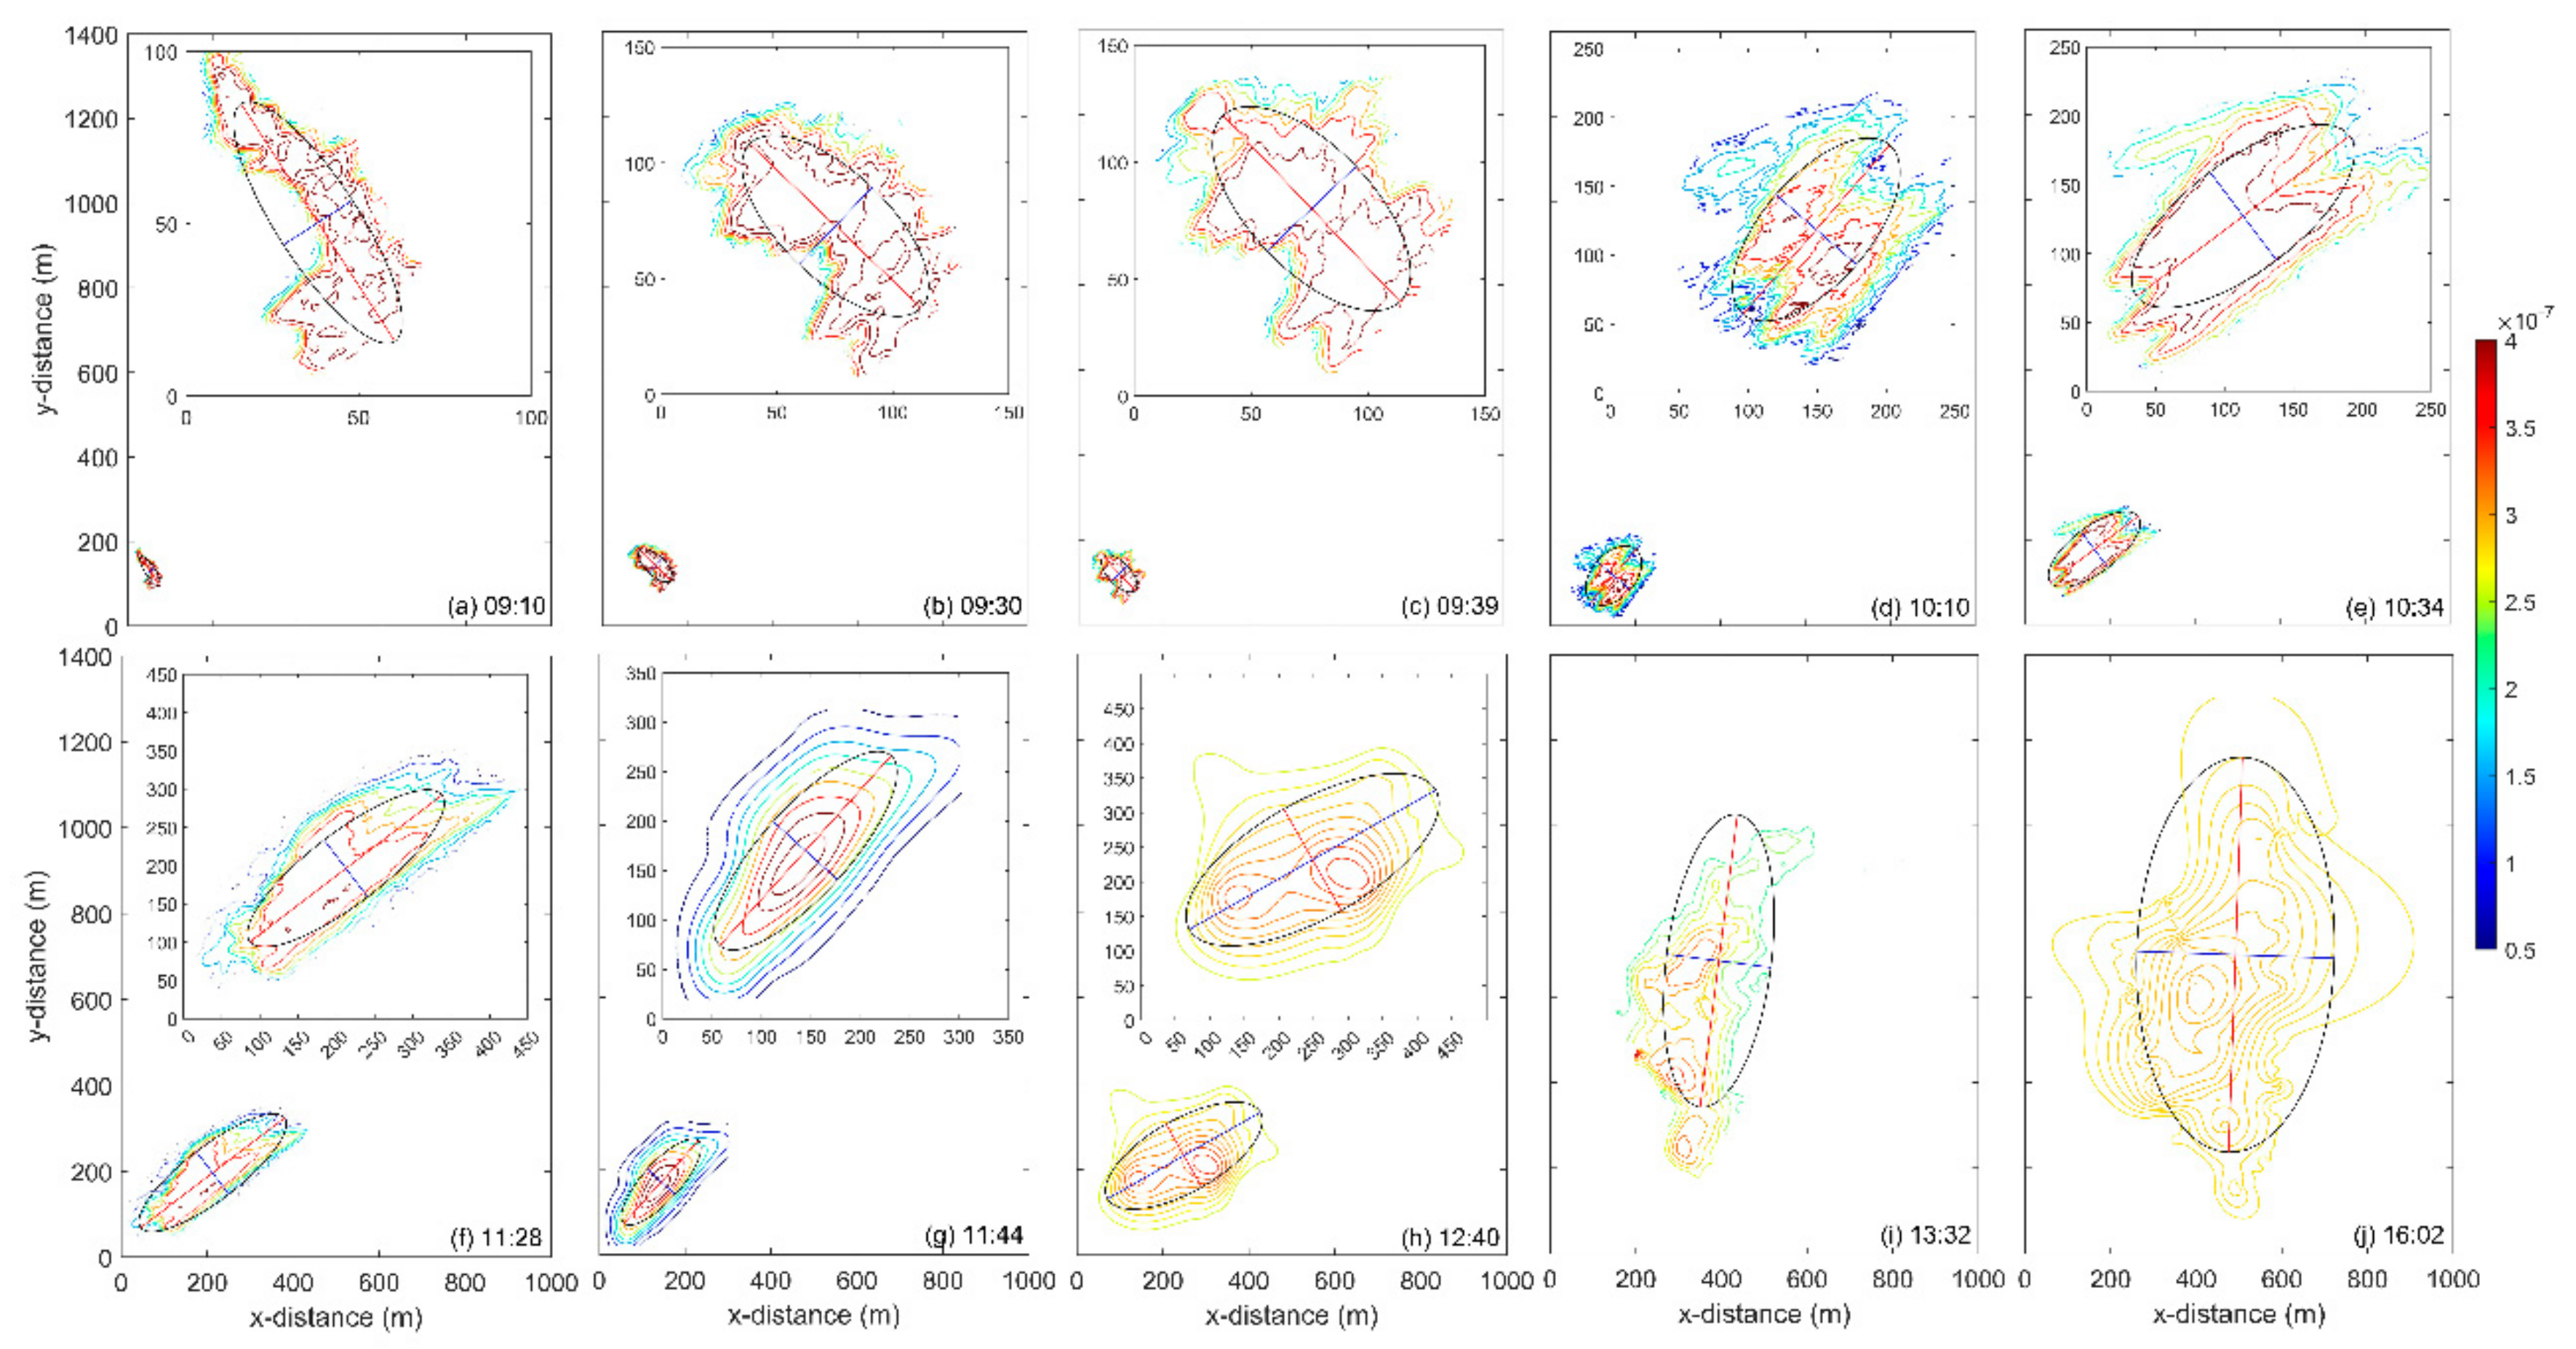
Figure 5 illustrates the temporal evolution of dye concentration, with an ellipse fitting the dye patch at various times. Following the completion of dye injection, a long dye strip approximately 100 m in length and 20 m in width formed in an East-South to West-North direction (
Figure 5a). Initially, the dye distribution showed a broad area of uniform concentration for the first 30 min (
Figure 5a–c). Subsequently, around 10:30 am, the direction of the elongated dye patch reversed, shifting to an East-North to West-South direction, persisting until 1 pm. During this phase, swift changes in tidal current direction significantly reduced the surface current velocity, amplifying the wind’s isolated effect on the dispersion pattern. The direction of elongation, approximately 45 degrees eastward relative to the prevailing southward wind, indicates the potential impact of wind on the elongation pattern. After 1 pm, the tidal current accelerated westward, and the elongation direction became aligned with the northerly wind direction.
Given that HF radar measures surface currents at depths of 1–2 m, a layer influenced by various physical processes, it is considered to provide an integrated view of currents that can impact tracers within the thin surface layer. The near-surface shear, not detectable by HF radar currents, can play a crucial role in surface dispersion of contaminants [
44,
45] and may account for the observed differences between the distribution of the dye patch and the trajectories of the float and drifters. The positioning of the drifters at the elongated end of the dye suggests that the surface currents affecting the drifter, at approximately 1 m depth, are faster in a southward direction than those influencing the dye spread over a depth of 5 m. Moreover, the fact that the float, located at roughly 0.1 m depth, moved further south than the drifters indicates that currents at 0.1 m depth are faster southward than those at lower depths. This implies the presence of strong vertical shear closer to the surface.
3.3. Vertical Dye Distribution
Two vertical concentration distributions of the dye patch were assessed using a fluorometer mounted on the SCAMP. The initial profile was captured 10 min after dye release was completed, and the subsequent profile was recorded 4 h later. The first vertical distribution revealed a peak concentration just below the surface, likely due to the slightly higher density of the dye solution. Conversely, the second vertical distribution showed a peak at the surface. The Gaussian fitting was applied to the first profile and adapted for the second by assuming a distribution mirrored with respect to the surface. This analysis yielded vertical standard deviations of 1.39 m and 2.72 m for the first and second profiles, respectively. The vertical eddy diffusivity, calculated from the variance differences (
) over time (
), was determined to be
. This estimate, focused on the top surface layer, indicates a vertical diffusivity coefficient significantly higher than those observed at deeper depths, highlighting enhanced mixing near the surface [
46] even under mild weather conditions.
4. Discussion
4.1. Vertical Shear induced by Near-Surface Dynamics
Dye and drifters constitute an effective experimental pairing for investigating near-surface current dynamics and their influence on surface dispersion. Studies have illuminated that dispersion in coastal regions is anisotropic, showcasing marked differences between the dispersion patterns of dyes and drifters, particularly concerning the orientation of wind and surface currents [
47]. Additional research on lateral dispersion in a large lake has highlighted that near-surface shear can lead to varying dispersion rates for buoyant versus nonbuoyant pollutants, thus reflecting the distinct behaviors of dyes and drifters [
10]. Importantly, vertical shear, propelled by wind forces, has a pronounced impact on the dispersion of dyes and drifters, with dyes, due to their susceptibility to depth-dependent currents, tending to display wider and more segmented dispersion patterns [
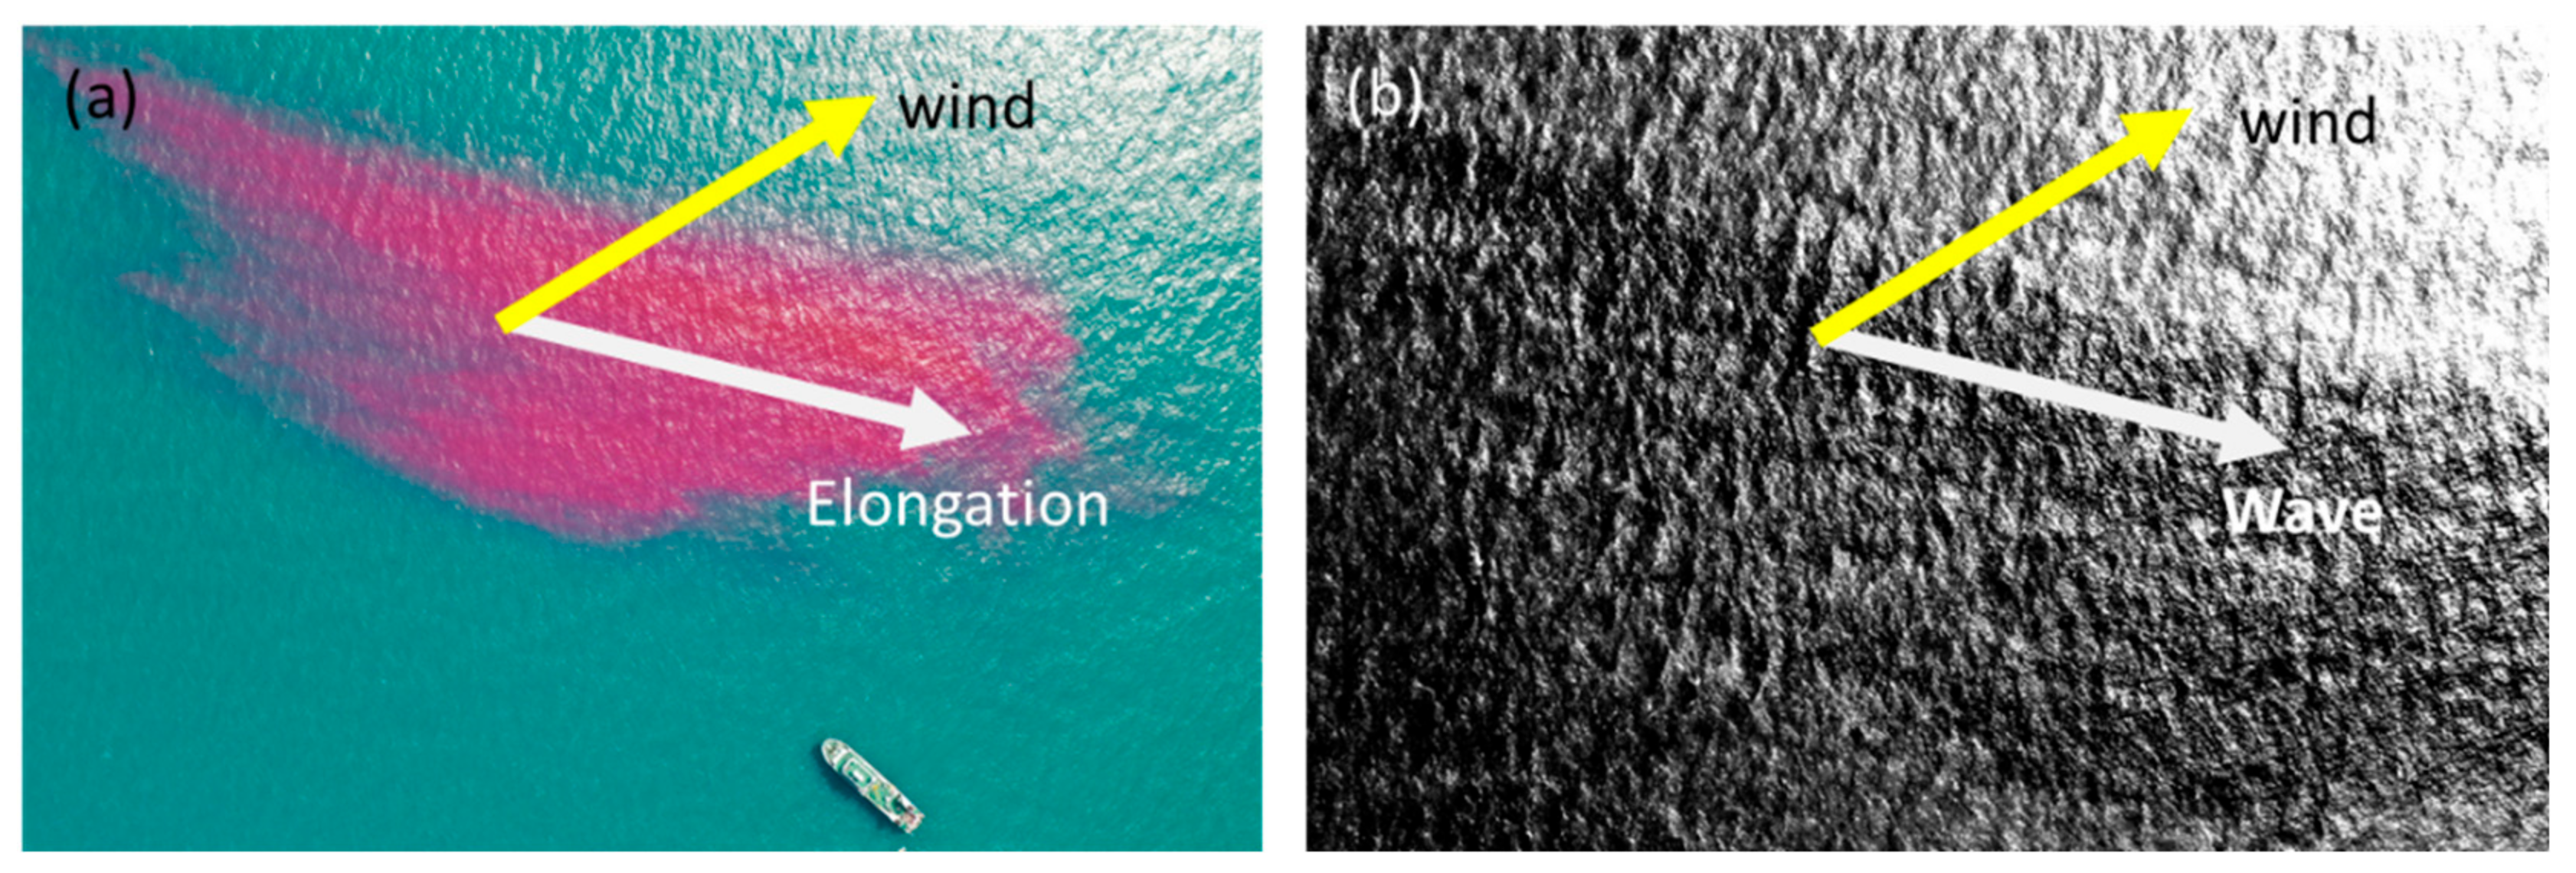
25]. The wind, which induces the Ekman current and Stokes drift, stands out as the main source of vertical shear affecting horizontal dispersion near the surface. Our observations indicated that the elongation direction of the dye patch aligned with both the theoretical Ekman current at the surface and the direction of wave propagation, as detected by drone imagery (
Figure 7), captured 2.3 h post-release (around 11:30 am), during a period of reduced current speed. The principal axis of the dye patch was deflected approximately 45 degrees relative to the southward direction, coinciding with the wind direction. While the reason for the alignment of the wave propagation direction and theoretical Ekman current direction at the surface remains uncertain, our findings suggest that the early biased dispersion behavior of the dye patch in our study can be ascribed to the synergistic effects of the Ekman current and Stokes drift.
To understand this phenomenon further, we performed analytical calculations based on in-situ measurements to assess the near-surface vertical shear, thereby estimating the contributions of the Ekman current and Stokes drift components to the observed vertical shear. The Ekman depth
, using
observed during the experiment, was found to be 2 m. This depth signifies the layer in the ocean at which the effect of wind-driven surface currents, influenced by Earth’s rotation, markedly diminishes. The calculated surface currents driven by Ekman flow (
and
) were approximately 0.20 m/s. Based on the surface current calculation, the Ekman spiral represented as
and
at the vertical transact oriented 45 degrees from the south is depicted in
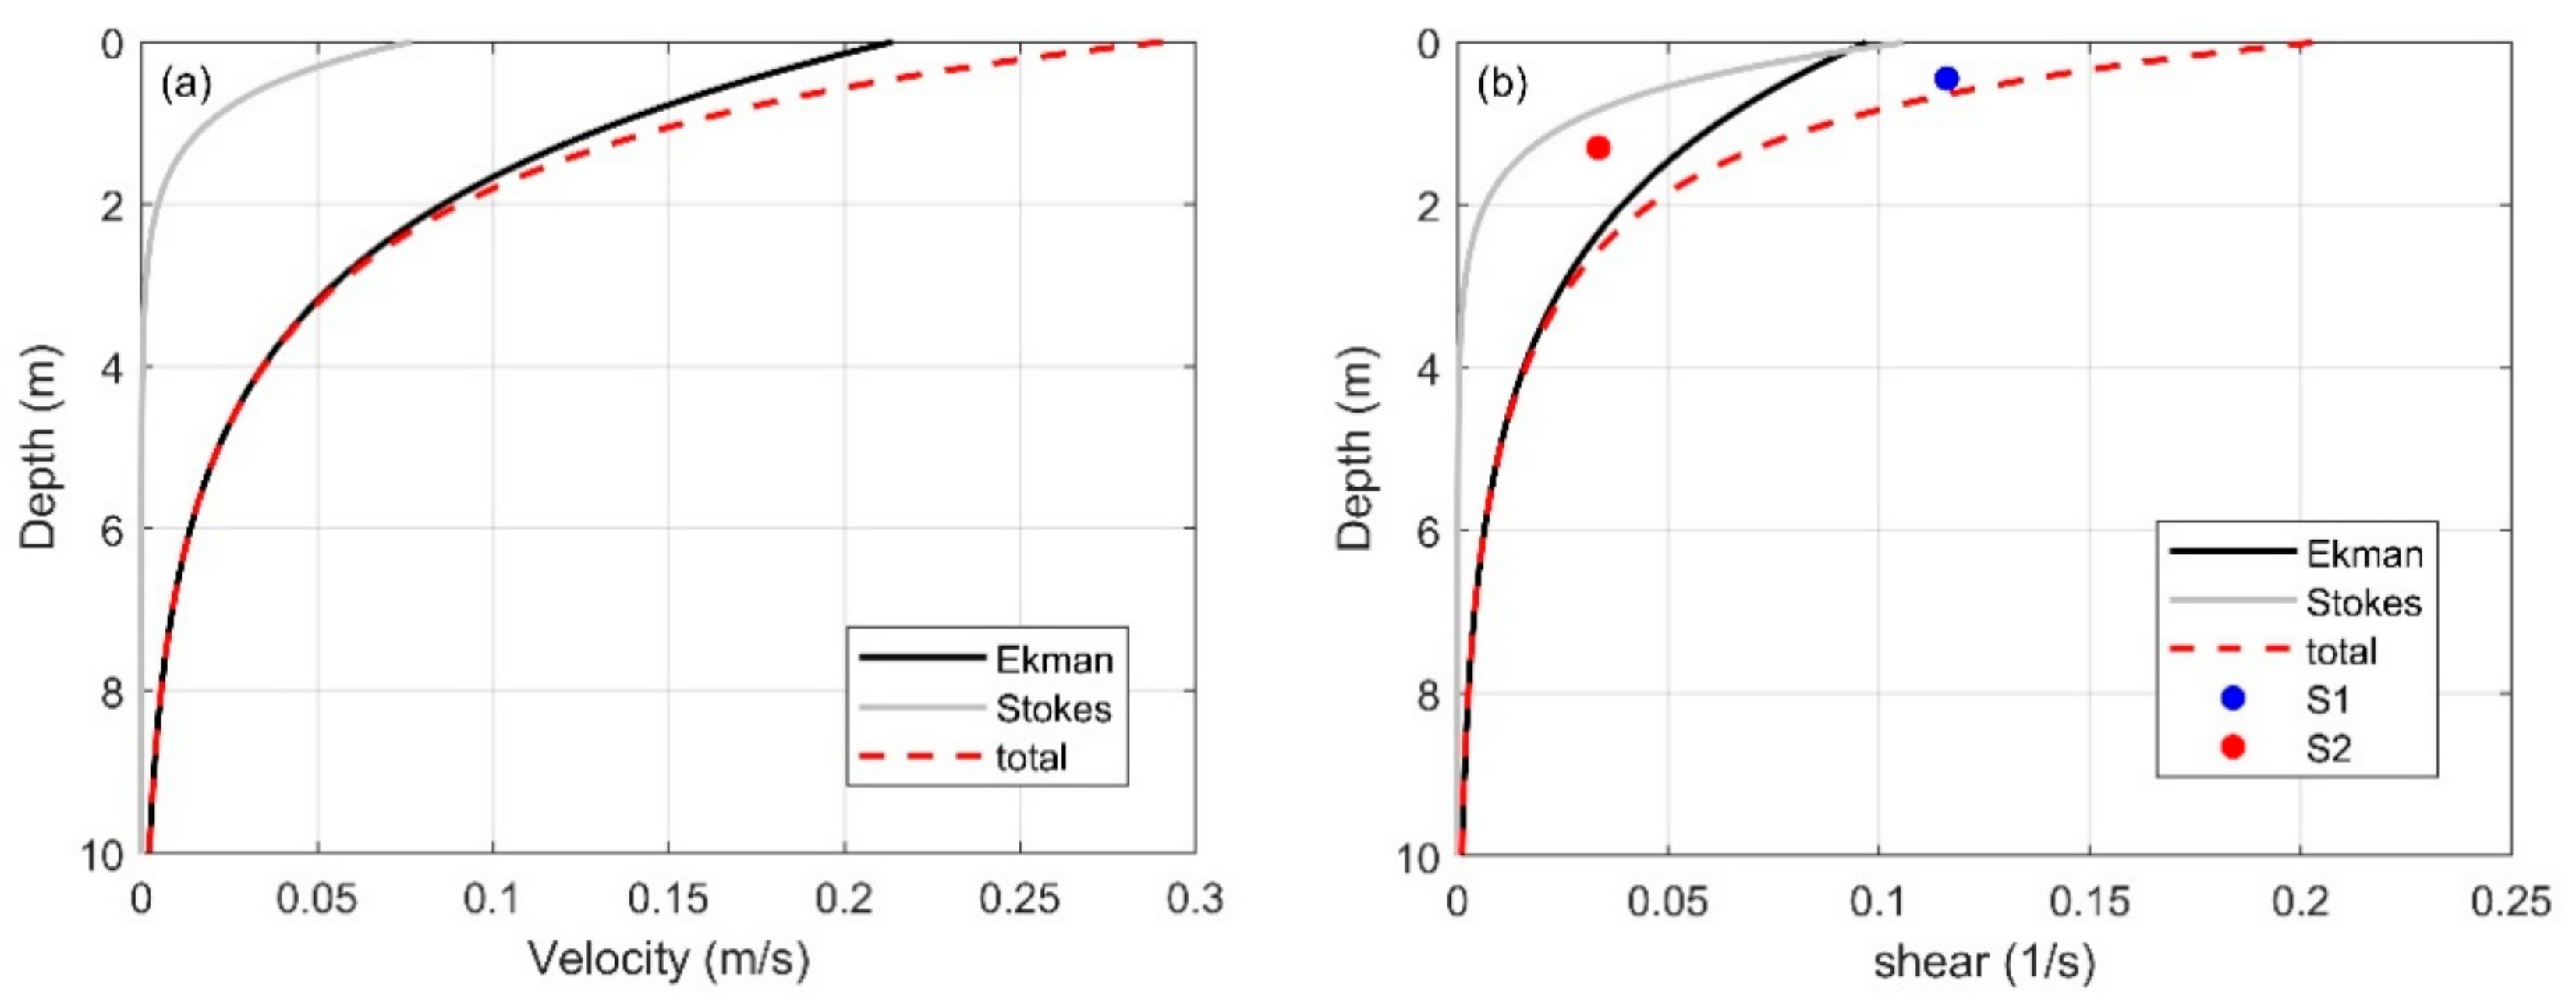
Figure 8. This illustration emphasizes that vertical shear is predominantly concentrated within the upper 5 m. Furthermore,
Figure 8 also shows the vertical velocity profile driven by Stokes drift for a monochromatic wave (
) [
48].
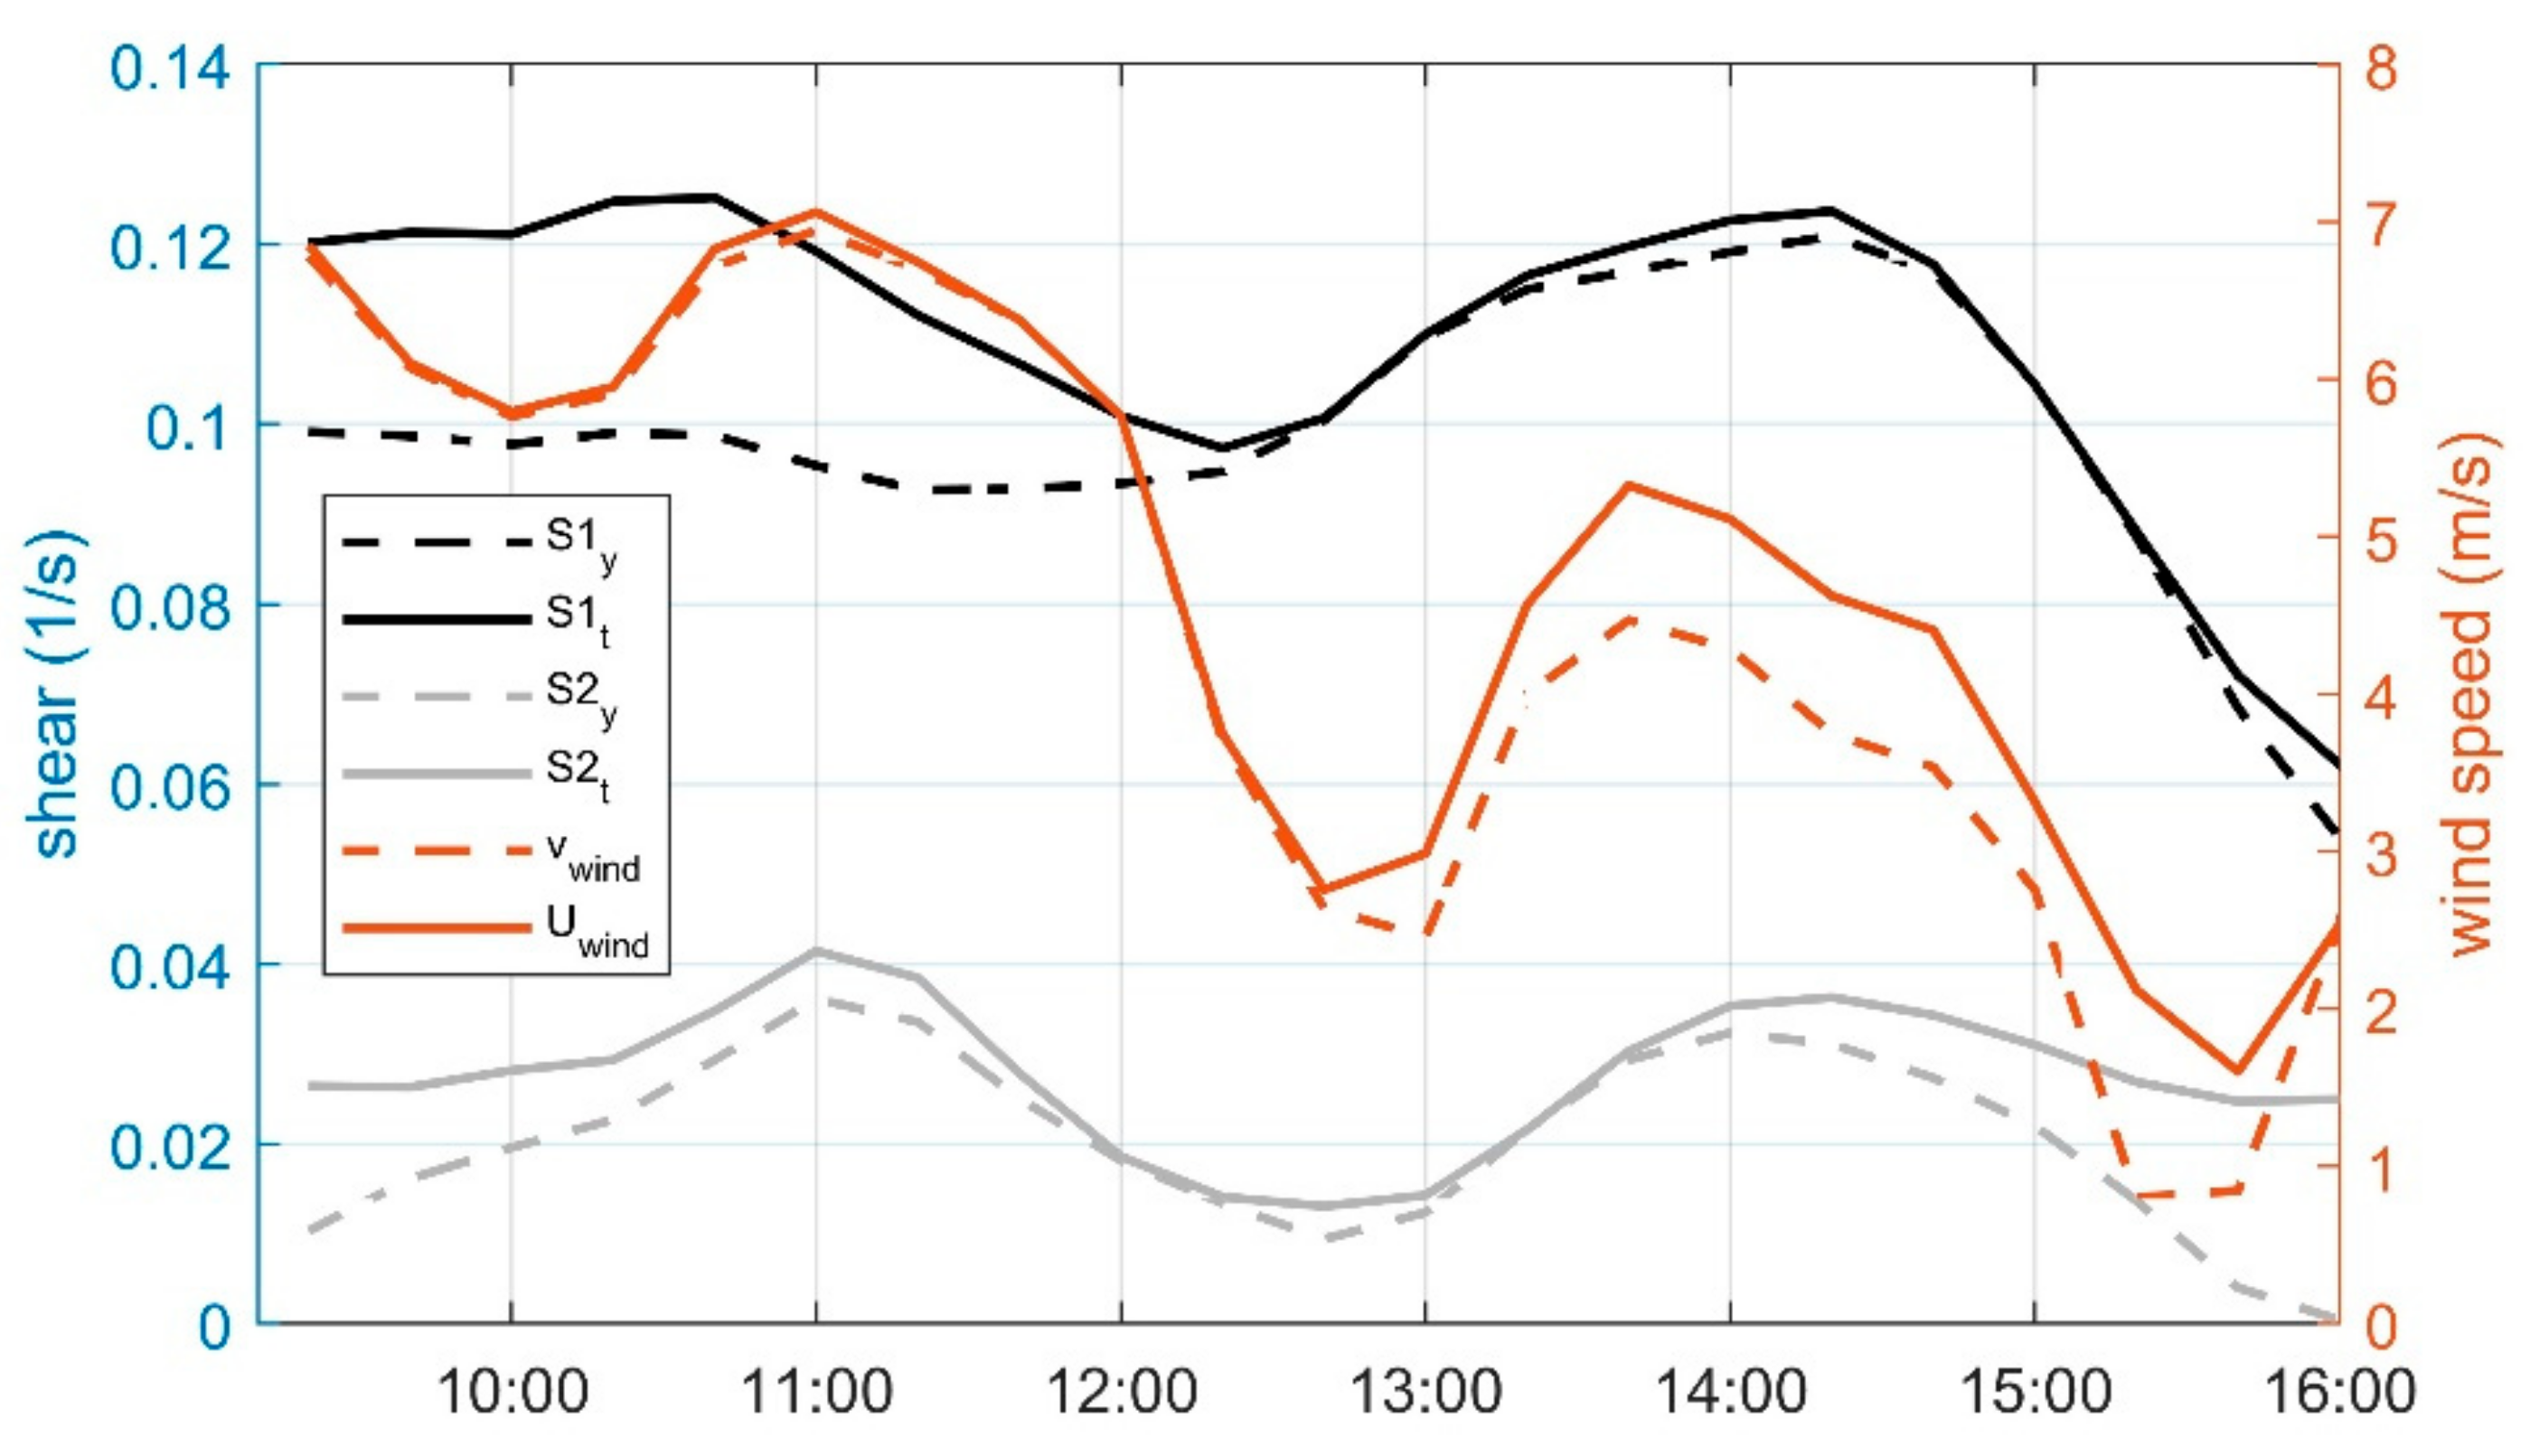
The analytical estimations of vertical shear closely aligned with shear values derived from observations of tracers. By examining velocity differences between the float, positioned at an average depth of around 0.1 m, and the drifters, with an average depth of 0.8 m, the shear was calculated to be 0.12/s. Additionally, analyzing the velocity difference between the drifters and the dye patch, with the dye’s average concentration depth around 2 m depth, the shear was estimated to be approximately 0.03/s. The two observations are indicated by two dots in
Figure 8b. The time series of shear calculations based on tracers revealed that fluctuations in vertical shear closely followed wind speed variations, with peaks in wind events corresponding to peaks in shear events (
Figure 9). This congruence between observed and estimated vertical shear strongly indicates that the early dispersion of dye or other scalar contaminants released at the surface is markedly influenced by wind-induced vertical shear. Below deeper depths (e.g., below the Ekman depth), the direct effect of wind stress weakens, leading to changes in the current’s direction and speed that more closely align with deeper currents like tidal currents. This implies that the impact of wind events can be more pronounced when barotropic tidal currents are minimal.
4.2. Dispersion of Tracers
Dispersion phases can be delineated by examining the slope of the diffusion diagram [
49,
50]. Linear increases in the second moment of dye distribution over time
signify the diffusive phase, quadratic increases
denote ballistic dispersion, and cubic increases (
) suggest Richardson dispersion [
51] or are indicative of unsteady shear dispersion [
52].
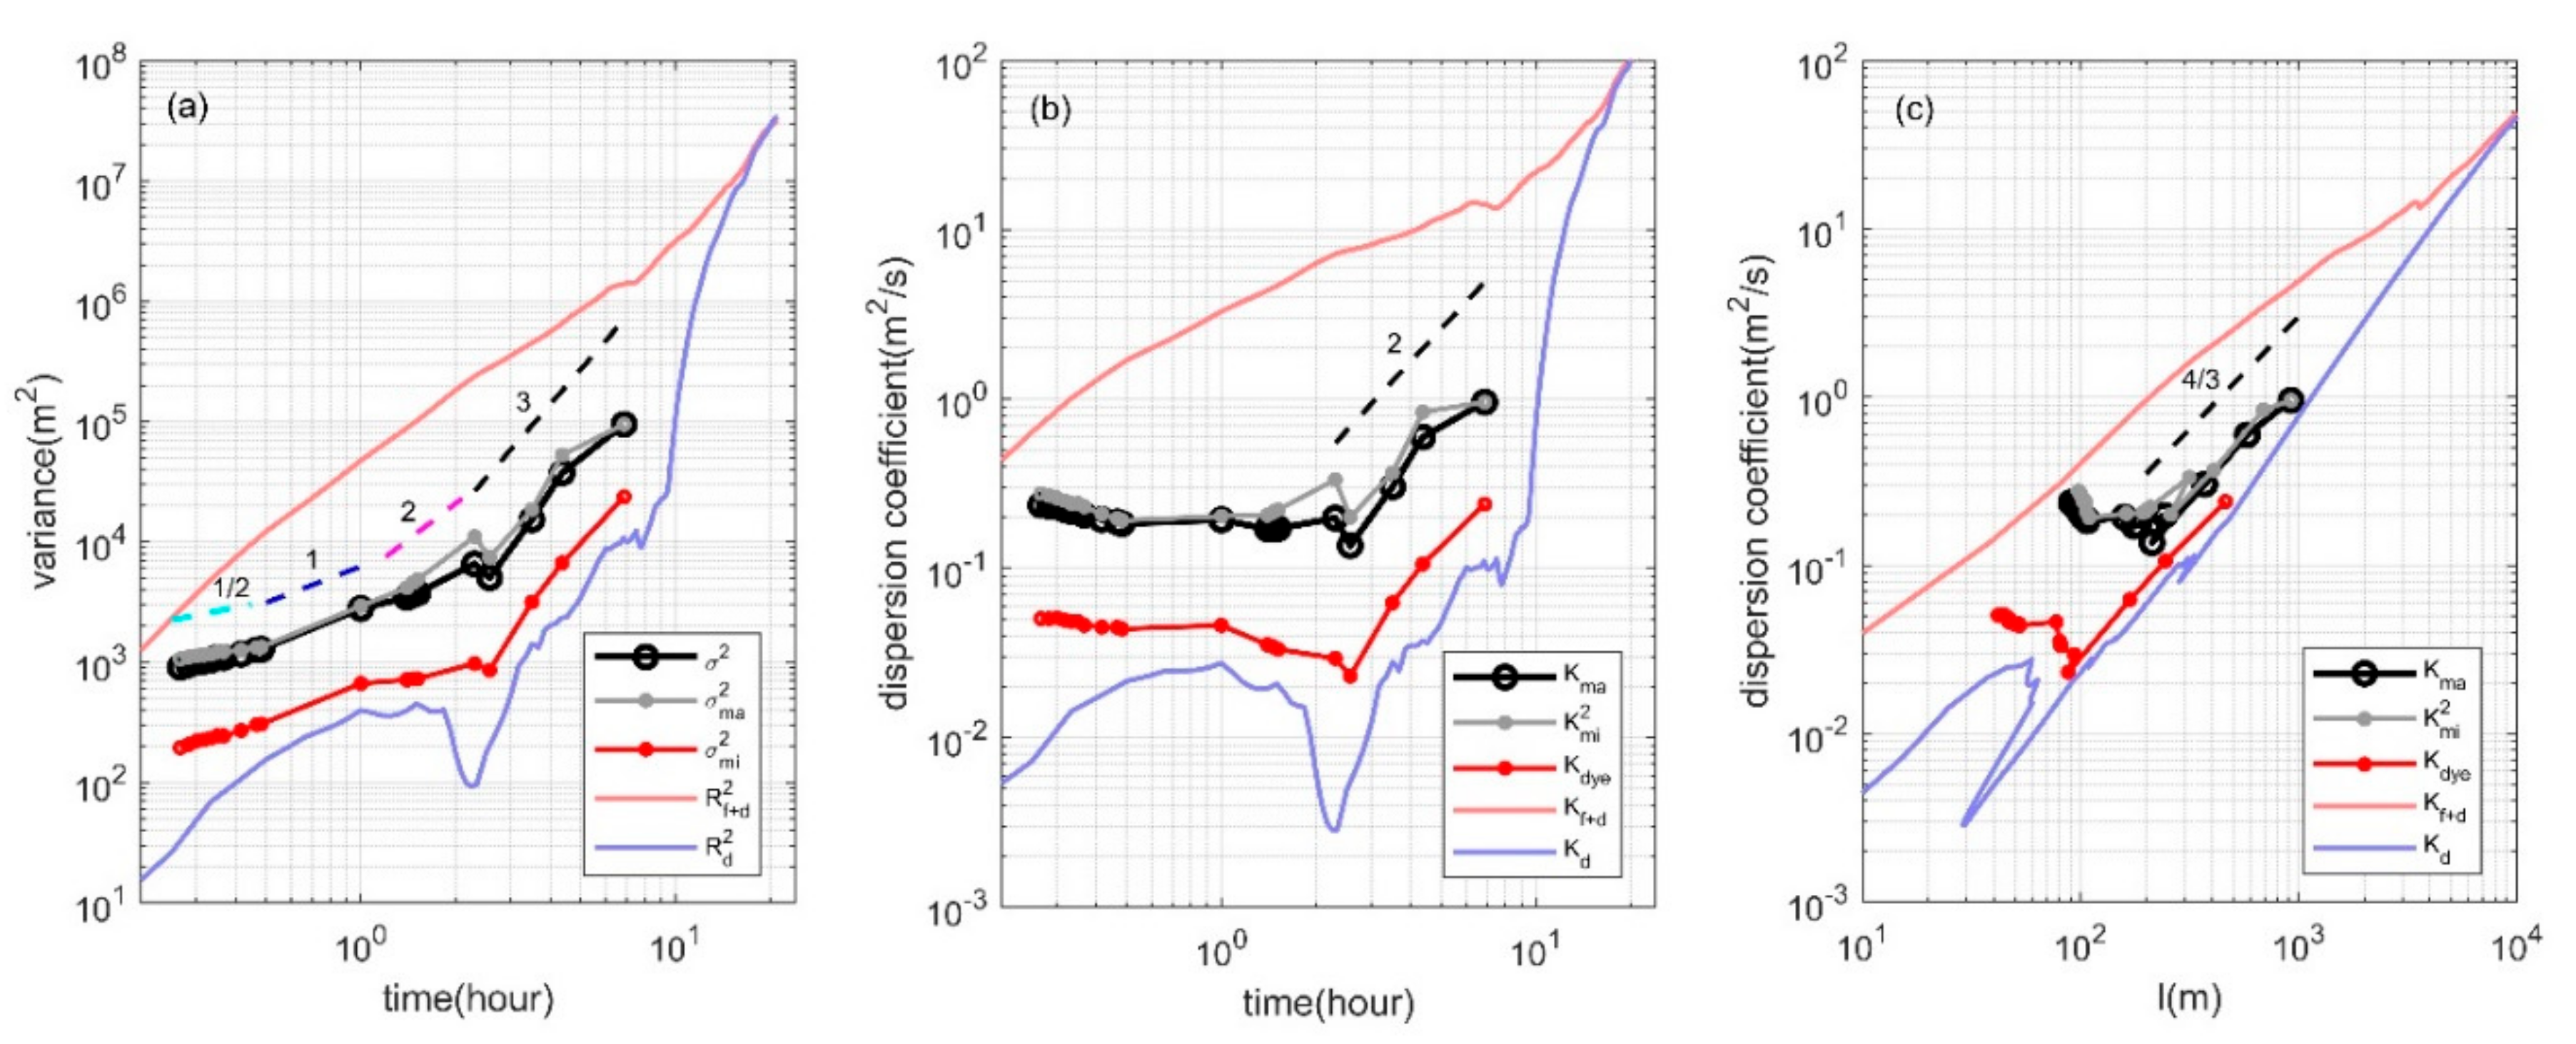
Figure 10 illustrates the horizontal variance
for three scenarios: a dye patch affected by an intermediate level of vertical shear; a combination of a float and three drifters experiencing significant vertical shear; and three drifters subjected to minimal vertical shear. During the 7-h observation period of dye dispersion, the dye patch exhibited distinct dispersion phases. Initially, sub-diffusion
was observed for the first 30 min, likely due to restricted dispersion caused by the temporarily buoyant dye patch with a broad, uniform concentration distribution that limited vertical diffusion until the tracer’s density matched the surrounding water density. Subsequently, the total variance (
) transitioned to a diffusive phase
, while the variance along the major axis entered a ballistic phase
, suggesting shear dispersion [
53] likely driven by vertical shear related to the Ekman current and Stokes drift. This period corresponds to the elongation direction deviating by 45 degrees eastwards from the wind direction. Later, both the variances in major and minor axes exhibited a
slope, indicating a transition to unsteady shear dispersion.
The combined case of float and drifters showed the greatest variance, initially surging with a
slope before persistently ascending at a
slope (red solid line in
Figure 10). The early phase of ballistic dispersion (
), likely spurred by vertical shear from continuous southward winds, leads to a divergence between the surface current affecting the float and the subsurface currents acting on the drogues connected to the drifters. The dispersion in a major axis may be linked to unsteady shear dispersion (
), while the dispersion in a minor axis followed a diffusive pattern (
), rendering the total dispersion rate as ballistic, with a
slope
). As the scale extends to about a kilometer, the float and drifter ensemble engages with large-scale horizontal shear, prompting horizontal shear dispersion. Consequently, at larger scales, the
phase could stem from both unsteady horizontal and vertical shear. The case involving only drifters exhibited the lowest horizontal dispersion rate, reflecting the dye dispersion along the minor axis. The dispersion coefficient
) of the drifters and the dye patch was observed to be 0.03
and 0.2
, respectively, at length scales of a few hundred meters. It increased to 1
at a length scale of 1 km, as depicted in
Figure 10c. For the cases involving a float plus drifters and drifters only, the dispersion coefficients were found to be 5
and 0.7
, respectively, at a length scale of 1 km. The dispersion coefficient (K) of the dye patch transitioned to a
scaling 2.5 h after release (
Figure 10a), corresponding to
(
Figure 10b) and
(
Figure 10c) scalings. This phase shift coincided with the dye patch aligning with the direction of the Ekman current and wave propagation, as depicted in
Figure 7. This alignment suggests that the dispersion process of the dye patch can be accelerated by the vertical shear induced by the Ekman current and Stokes drift.
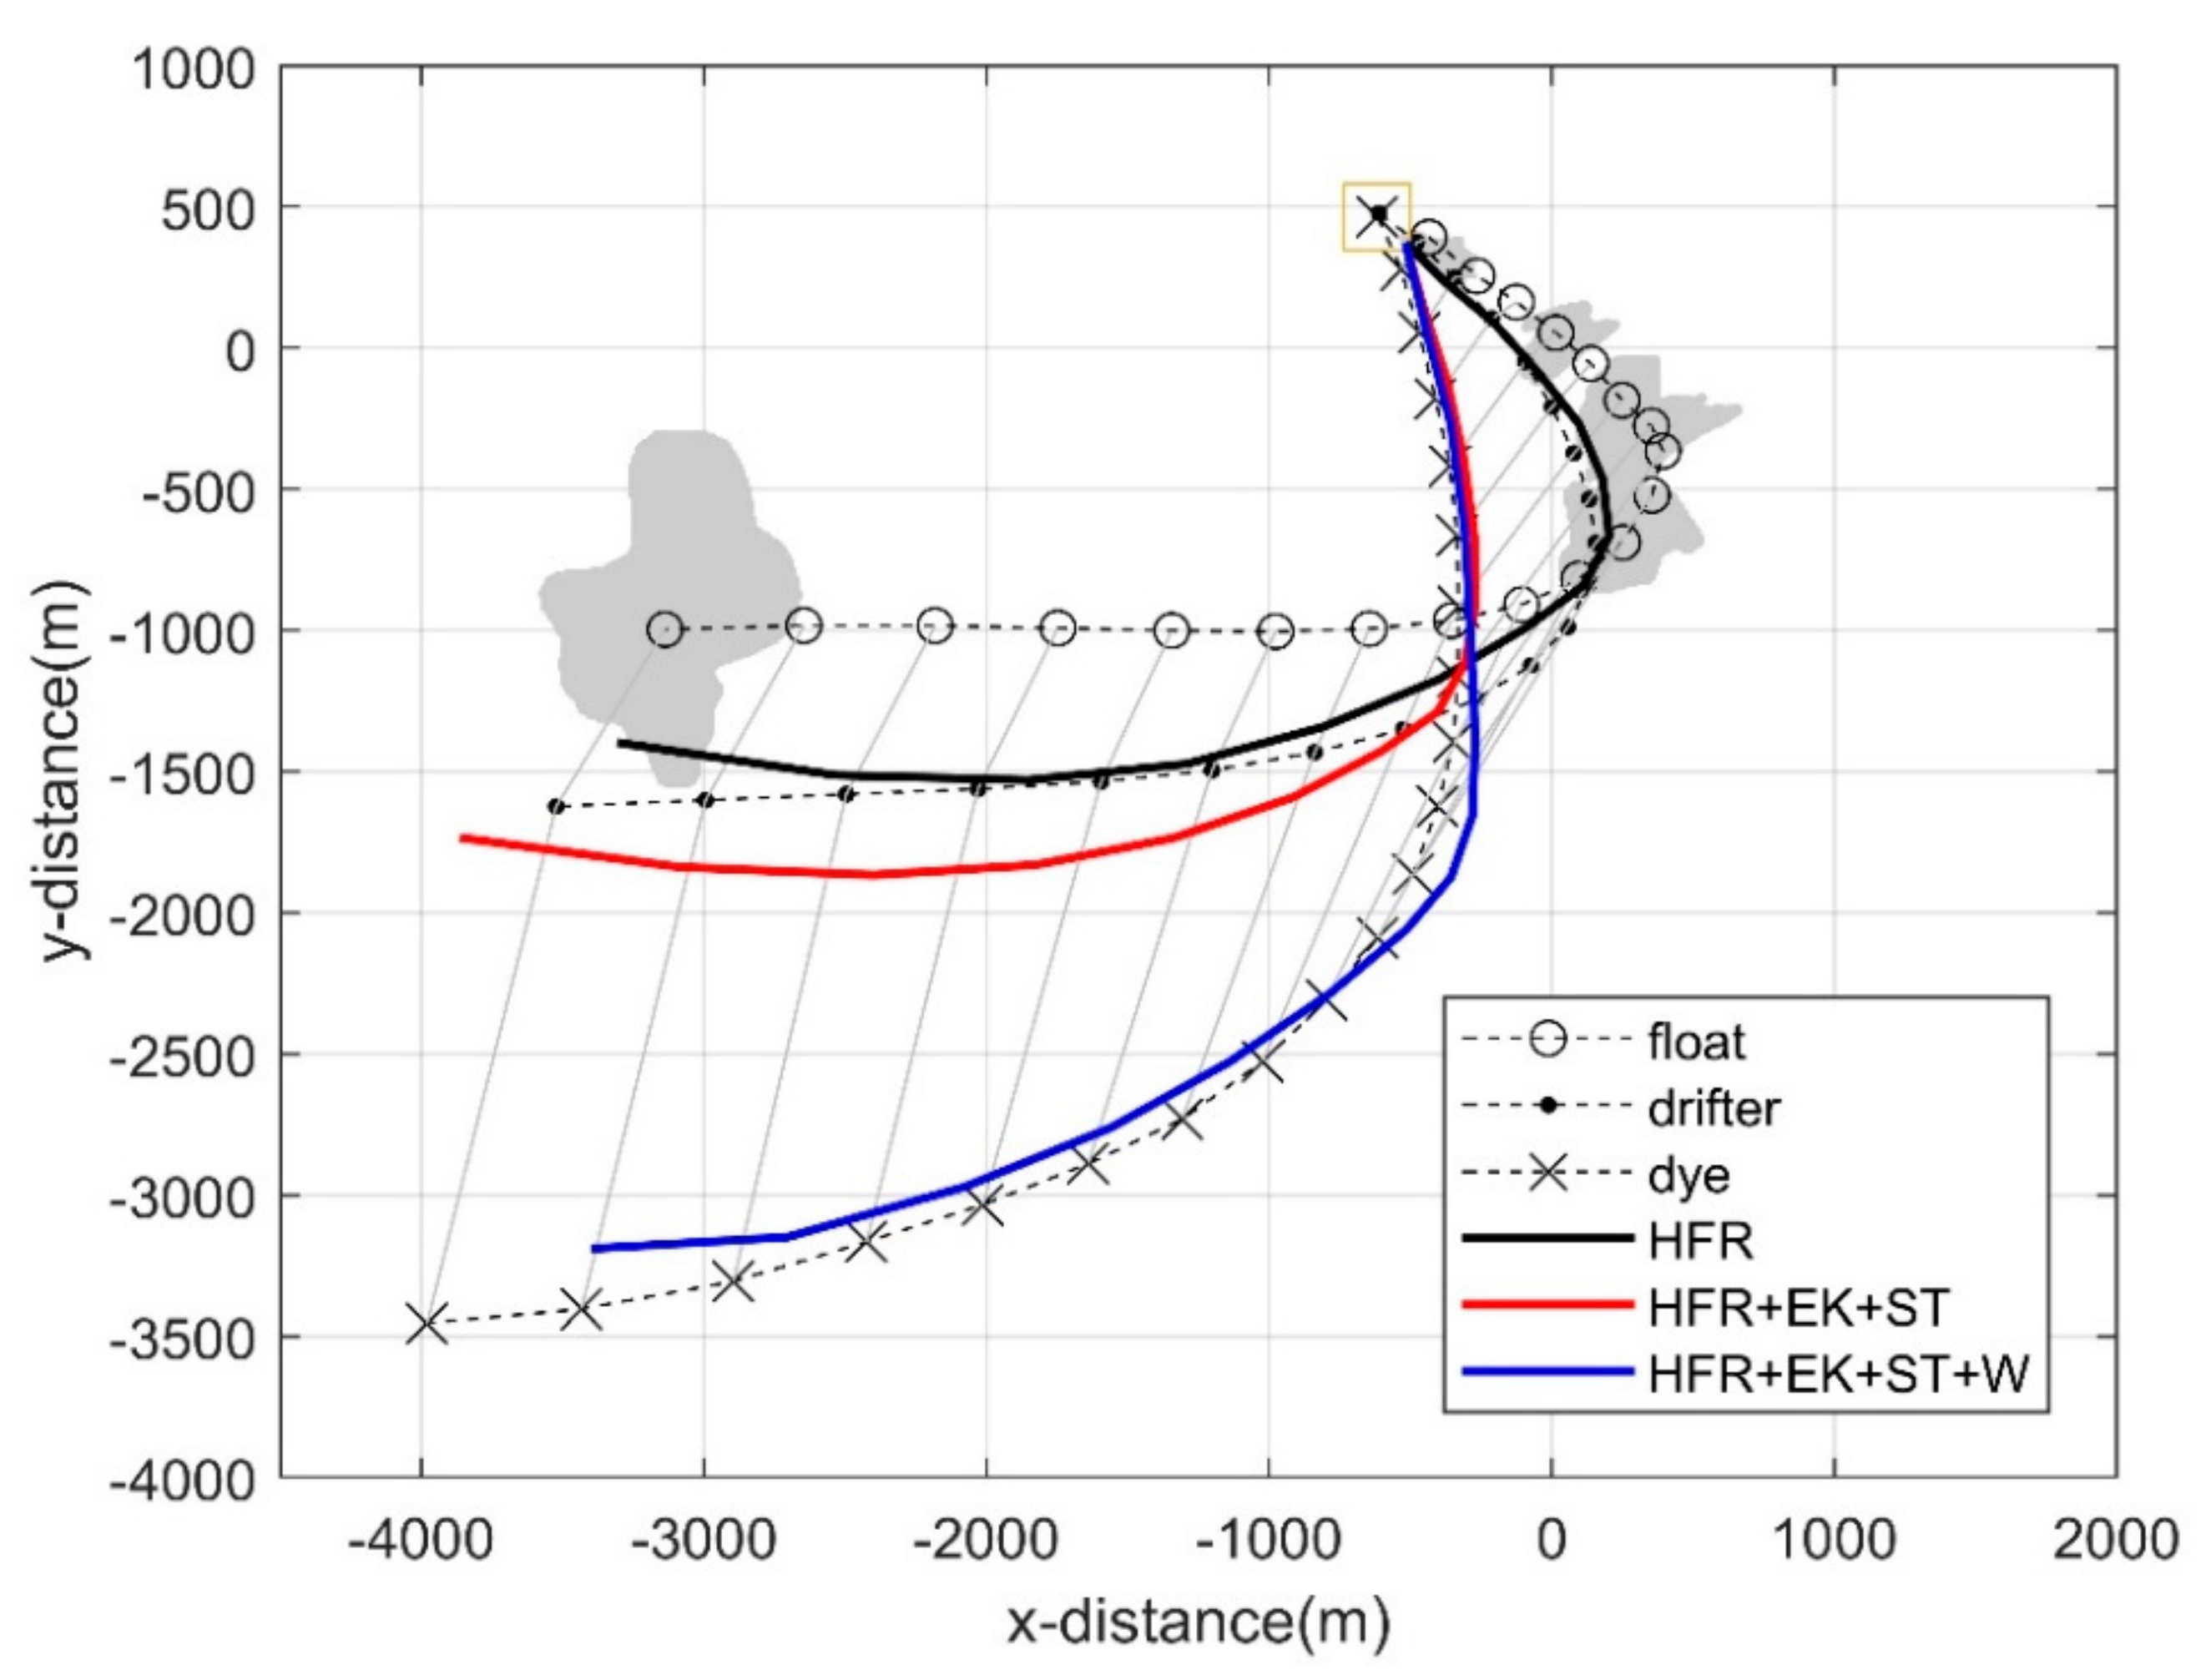
By combining near-surface currents from HF radar with analytical calculations of Ekman currents and Stokes drifts, we employed a particle tracking model [
54] to forecast tracer paths, as illustrated in
Figure 11. Trajectories calculated using HF radar currents closely mirrored those of drifters at an average depth of 0.6 m, showcasing HF radar’s capability to accurately capture surface currents up to a 1 m depth. However, particle paths intersected the periphery of the wind-elongated dye patch, leading to a slight deviation of trajectories predicted by HF radar from those of the dye patch. This discrepancy arises because the dye patch diffuses across a broader depth, exceeding 5 m, thus affecting its dispersion differently. When Stokes drift and Ekman current were integrated into HF radar data, the combined effect steered particle paths predominantly southwestward. Adding a 1% wind influence further refined the particle trajectories, aligning them closely with that of the float. This variation in tracer paths, influenced by the selection of current components, highlights the critical need for a precise integration of Ekman current and Stokes drift, alongside a wind effect, to accurately predict the dispersion patterns of tracers with varied characteristics.
5. Conclusions
This study was propelled by the necessity to understand the mechanisms behind the dispersion of near-surface contaminants such as oil, chemicals, microplastics, and debris in coastal waters, aiming to refine predictive models crucial for environmental management strategies. By employing an integrated approach that marries scalar tracers with Lagrangian markers, we capitalized on the use of both dye and drifters as tracers, alongside advanced observational tools like drones, satellites, in-situ sampling, and HF radar. This comprehensive methodology led to a thorough examination of the influence of surface currents on contaminant dispersion, emphasizing the vital roles of the Ekman current, Stokes drift, and wind-driven currents in shaping early dispersion behaviors. These physical processes, prevalent in the surface layer, naturally create vertical shear that effectively elongates the dye patch and causes deviations in the velocities of debris on the water surface compared to partially submerged debris. The direction of the dye patch’s elongation closely matched the vertical shear induced by the Ekman current during periods of reduced current velocity. Analytical calculations of vertical shear, on the order of 0.1/s within 1 m depth, guided by the dynamics of the Ekman current and Stokes drift, closely aligned with tracer movement observations. Our experiments revealed vertical diffusivity rates of and horizontal eddy diffusivity of the dye at 1 at a length scale of 1000 m. The incorporation of particle tracking models, refined through the integration of various near-surface current data, highlighted the necessity of combining observational data with analytical insights for improved predictive accuracy. This approach enhances the ability to predict the fate of tracers by considering the intricate interplay of physical forces in the near-surface layer. Consequently, this research not only broadens our understanding of near-surface dispersion processes but also enlarges the toolkit available to environmental scientists and policymakers, thereby supporting more informed decision-making to reduce the impacts of pollution in coastal waters.
References
- Bojinski, S., Verstraete, M., Peterson, T.C., Richter, C., Simmons, A., & Zemp, M. The concept of essential climate variables in support of climate research, applications, and policy. Bulletin of the American Meteorological Society 2014, 95, 1431–1443. [Google Scholar] [CrossRef]
- Du, Y., Dong, X., Jiang, X., Zhang, Y., Zhu, D., Sun, Q., … & Peng, S. Ocean surface current multiscale observation mission (OSCOM): Simultaneous measurement of ocean surface current, vector wind, and temperature. Progress in Oceanography 2021, 193, 102531. [Google Scholar] [CrossRef]
- Röhrs, J., Sutherland, G., Jeans, G., Bedington, M., Sperrevik, A.K., Dagestad, K.F., … & LaCasce, J.H. Surface currents in operational oceanography: Key applications, mechanisms, and methods. Journal of Operational Oceanography 2023, 16, 60–68. [Google Scholar] [CrossRef]
- Aijaz, S., Brassington, G.B., Divakaran, P., Régnier, C., Drévillon, M., Maksymczuk, J., & Peterson, K.A. Verification and intercomparison of global ocean Eulerian near-surface currents. Ocean Modelling 2023, 186, 102241. [Google Scholar] [CrossRef]
- Shen, Y.T., Lai, J.W., Leu, L.G., Lu, Y.C., Chen, J.M., Shao, H.J., … & Tseng, R.S. Applications of ocean currents data from high-frequency radars and current profilers to search and rescue missions around Taiwan. Journal of Operational Oceanography 2019, 12, S126–S136. [Google Scholar] [CrossRef]
- Liu, Y.; Harvey, C.M.; Hamlyn, F.E.; Liu, C. Bayesian estimation and reconstruction of marine surface contaminant dispersion. Science of The Total Environment 2024, 907, 167973. [Google Scholar] [CrossRef]
- Aravind, H.M., Huntley, H.S., Kirwan Jr, A.D., & Allshouse, M.R. Drifter Deployment Strategies to Determine Lagrangian Surface Convergence in Submesoscale Flows. Journal of Atmospheric and Oceanic Technology 2024, 41, 95–112. [Google Scholar] [CrossRef]
- Davis, R.E. Lagrangian ocean studies. Annual Review of Fluid Mechanics 1991, 23, 43–64. [Google Scholar] [CrossRef]
- Peeters, F., Wüest, A., Piepke, G., & Imboden, D.M. Horizontal mixing in lakes. Journal of Geophysical Research: Oceans 1996, 101, 18361–18375. [Google Scholar] [CrossRef]
- Choi, J., Troy, C., Hawley, N., McCormick, M., & Wells, M. Lateral dispersion of dye and drifters in the center of a very large lake. Limnology and Oceanography 2020, 65, 336–348. [Google Scholar] [CrossRef]
- Subbaraya, S., Breitenmoser, A., Molchanov, A., Muller, J., Oberg, C., Caron, D.A., & Sukhatme, G.S. Circling the seas: Design of Lagrangian drifters for ocean monitoring. IEEE robotics & automation magazine 2016, 23, 42–53. [Google Scholar]
- Berti, S., Dos Santos, F.A., Lacorata, G., & Vulpiani, A. Lagrangian drifter dispersion in the southwestern Atlantic Ocean. Journal of Physical Oceanography 2011, 41, 1659–1672. [Google Scholar] [CrossRef]
- Mantovanelli, A., Heron, M.L., Heron, S.F., & Steinberg, C.R. Relative dispersion of surface drifters in a barrier reef region. Journal of Geophysical Research: Oceans 2012, 117. [Google Scholar]
- Bertin, S., Sentchev, A., & Alekseenko, E. Fusion of Lagrangian drifter data and numerical model outputs for improved assessment of turbulent dispersion. EGUsphere 2024, 1–24. [Google Scholar]
- Choi, J.M., Kim, W., Hong, T.T.M., & Park, Y.G. Derivation and evaluation of satellite-based surface current. Frontiers in Marine Science 2021, 8, 695780. [Google Scholar] [CrossRef]
- Hong, T.T.M., Park, Y.G., & Choi, J.M. Divergence Observation in a Mesoscale Eddy during Chla Bloom Revealed in Submesoscale Satellite Currents. Remote Sensing 2023, 15, 995. [Google Scholar] [CrossRef]
- Dohan, K. Ocean surface currents from satellite data. Journal of Geophysical Research: Oceans 2017, 122, 2647–2651. [Google Scholar] [CrossRef]
- Parks, A.B., Shay, L.K., Johns, W.E., Martinez-Pedraja, J., & Gurgel, K.W. HF radar observations of small-scale surface current variability in the Straits of Florida. Journal of Geophysical Research: Oceans 2009, 114. [Google Scholar]
- Ledwell, J.R., Watson, A.J., & Law, C.S. Evidence for slow mixing across the pycnocline from an open-ocean tracer-release experiment. Nature 1993, 364, 701–703. [Google Scholar] [CrossRef]
- Sundermeyer, M.A., & Price, J.F. Lateral mixing and the North Atlantic Tracer Release Experiment: Observations and numerical simulations of Lagrangian particles and a passive tracer. Journal of Geophysical Research: Oceans 1998, 103, 21481–21497. [Google Scholar] [CrossRef]
- Runkel, R.L. On the use of rhodamine WT for the characterization of stream hydrodynamics and transient storage. Water Resources Research 2015, 51, 6125–6142. [Google Scholar] [CrossRef]
- Giraldi, D., Vitturi, M.D.M., Zaramella, M., Marion, A., & Iannelli, R. Hydrodynamics of vertical subsurface flow constructed wetlands: Tracer tests with rhodamine WT and numerical modelling. Ecological Engineering 2009, 35, 265–273. [Google Scholar] [CrossRef]
- Stride, B., Abolfathi, S., Bending, G.D., & Pearson, J. Quantifying microplastic dispersion due to density effects. Journal of Hazardous Materials 2024, 466, 133440. [Google Scholar] [CrossRef] [PubMed]
- Upstill-Goddard, R.C., Suijlen, J.M., Malin, G., & Nightingale, P.D. The use of photolytic rhodamines WT and sulpho G as conservative tracers of dispersion in surface waters. Limnology and oceanography 2001, 46, 927–934. [Google Scholar] [CrossRef]
- Geyer, N.L., Balwada, D., Simons, E., Speer, K., & Huettel, M. Drifter, and dye tracks reveal dispersal processes that can affect phytoplankton distributions in shallow estuarine environments. Estuarine, Coastal and Shelf Science 2022, 269, 107811. [Google Scholar] [CrossRef]
- Richardson, S.D., Willson, C.S., & Rusch, K.A. Use of rhodamine water tracer in the marshland upwelling system. Groundwater 2004, 42, 678–688. [Google Scholar] [CrossRef]
- Stevens, C.L., Lawrence, G.A., & Hamblin, P.F. Horizontal dispersion in the surface layer of a long narrow lake. Journal of Environmental Engineering and Science 2004, 3, 413–417. [Google Scholar] [CrossRef]
- Giraldi, D., Vitturi, M.D.M., Zaramella, M., Marion, A., & Iannelli, R. Hydrodynamics of vertical subsurface flow constructed wetlands: Tracer tests with rhodamine WT and numerical modelling. Ecological Engineering 2009, 35, 265–273. [Google Scholar] [CrossRef]
- Mirfenderesk, H., Hughes, L., & Tomlinson, R. (2007, December). Verification of a three-dimensional advection dispersion model using dye release experiment. In Proc. 16th Australasian Fluid Mechanics Conference (pp. 233–240).
- Johansen, K., Dunne, A.F., Tu, Y.H., Almashharawi, S., Jones, B.H., & McCabe, M.F. Dye tracing and concentration mapping in coastal waters using unmanned aerial vehicles. Scientific Reports 2022, 12, 1141.
- Burdziakowski, P., Specht, C., Dabrowski, P.S., Specht, M., Lewicka, O., & Makar, A. Using UAV photogrammetry to analyse changes in the coastal zone based on the sopot tombolo (Salient) measurement project. Sensors 2020, 20, 4000. [Google Scholar] [CrossRef] [PubMed]
- Sibanda, M., Mutanga, O., Chimonyo, V.G., Clulow, A.D., Shoko, C., Mazvimavi, D., … & Mabhaudhi, T. Application of drone technologies in surface water resources monitoring and assessment: A systematic review of progress, challenges, and opportunities in the global south. Drones 2021, 5, 84. [Google Scholar] [CrossRef]
- Bressan, A., & Constantin, A. The deflection angle of surface ocean currents from the wind direction. Journal of Geophysical Research: Oceans 2019, 124, 7412–7420. [Google Scholar] [CrossRef]
- Constantin, A. Frictional effects in wind-driven ocean currents. Geophysical & Astrophysical Fluid Dynamics 2021, 115, 1–14. [Google Scholar]
- Tamtare, T., Dumont, D., & Chavanne, C. The Stokes drift in ocean surface drift prediction. Journal of Operational Oceanography 2022, 15, 156–168. [Google Scholar] [CrossRef]
- Kim, K., Kim, E., Choi, J.M., Shin, J., Kim, W., Lee, K.J., … & Ryu, J.H. Simulation approach for the tracing the marine pollution using multi-remote sensing data. Korean Journal of Remote Sensing 2020, 36, 249–261. [Google Scholar]
- Wu, J. Wind-stress coefficients over sea surface near neutral conditions—A revisit. Journal of Physical Oceanography 1980, 10, 727–740. [Google Scholar] [CrossRef]
- Dewi, E.K., & Trisakti, B. Comparing atmospheric correction methods for Landsat OLI data. International Journal of Remote Sensing and Earth Sciences (IJReSES) 2017, 13, 105–120. [CrossRef]
- Guo, Y., Wang, H., Wu, Z., Wang, S., Sun, H., Senthilnath, J., … & Fu, Y. Modified red blue vegetation index for chlorophyll estimation and yield prediction of maize from visible images captured by UAV. Sensors 2020, 20, 5055. [Google Scholar] [CrossRef]
- Shaheen, H.; Agarwal, S.; Ranjan, P. MinMaxScaler Binary PSO for Feature Selection. In: Luhach, A., Kosa, J., Poonia, R., Gao, XZ., Singh, D. (eds) First International Conference on Sustainable Technologies for Computational Intelligence. Advances in Intelligent Systems and Computing, 2020, vol 1045. Springer, Singapore. [CrossRef]
- ang, W., Park, Y., Pyo, J., Park, S., Kim, J., Kim, J.H., … & Kim, S. Optimal band selection for airborne hyperspectral imagery to retrieve a wide range of cyanobacterial pigment concentration using a data-driven approach. Remote Sensing 2022, 14, 1754. [Google Scholar] [CrossRef]
- Zill, D. G, L.I. Advance engineering mathematics, 3rd ed., Jones & Bartlett Learning, Burlington, MA, 2020, pp. 418–452.
- Smith, L.I. A tutorial on principal components analysis; University of Otago, New Zealand, 2002, pp. 12–20.
- Laxague, N.J., Özgökmen, T.M., Haus, B.K., Novelli, G., Shcherbina, A., Sutherland, P., … & Molemaker, J. Observations of near-surface current shear help describe oceanic oil and plastic transport. Geophysical Research Letters 2018, 45, 245–249. [Google Scholar] [CrossRef]
- Lee, J.H., & Choi, J.M. Measurement of Near-Surface Current Shear Using a Lagrangian Platform and Its Implication on Microplastic Dispersion. Journal of Marine Science and Engineering 2023, 11, 1716. [Google Scholar] [CrossRef]
- Shee, A., & Sil, S. (2023). Estimations of vertical diffusivity and applications on a mixed layer budget analysis of the Bay of Bengal using Argo data. Journal of Marine Systems, 239, 103857.
- Romero, L., Ohlmann, J.C., Pallàs-Sanz, E., Statom, N.M., Pérez-Brunius, P., & Maritorena, S. Coincident observations of dye and drifter relative dispersion over the inner shelf. Journal of Physical Oceanography 2019, 49, 2447–2468. [Google Scholar] [CrossRef]
- Tamura, H., Miyazawa, Y., & Oey, L.Y. The Stokes drift and wave induced-mass flux in the North Pacific. Journal of Geophysical Research: Oceans 2012, 117. [Google Scholar]
- Okubo, A. (1971, August). Oceanic diffusion diagrams. In Deep sea research and oceanographic abstracts (Vol. 18, No. 8, pp. 789–802). Elsevier.
- McWilliams, J.C. (2016). Submesoscale currents in the ocean. Proceedings of the Royal Society A: Mathematical, Physical and Engineering Sciences, 472, 20160117.
- Richardson, L.F. (1921). I. some measurements of atmospheric turbulence. Philosophical Transactions of the Royal Society of London. Series A, Containing Papers of a Mathematical or Physical Character, 221(582–593), 1–28.
- Fischer, H.B. (1979). Mixing in inland and coastal waters. Academic press.
- Saffman, P.G. (1962). The effect of wind shear on horizontal spread from an instantaneous ground source. Quarterly Journal of the Royal Meteorological Society, 88, 382–393.
- Jalón-Rojas, I., Wang, X.H., & Fredj, E. (2019). A 3D numerical model to Track Marine Plastic Debris (TrackMPD): Sensitivity of microplastic trajectories and fates to particle dynamical properties and physical processes. Marine pollution bulletin, 141, 256–272.
Figure 1.
Study area. The domain of (b) indicates the area within a rectangle in (a). The gray-shaded area represents the coverage of HF radar in Yeosu Bay. The ‘x’ marks the initial dye release location, while the red dot denotes the nearby buoy location where wind and wave data were collected.
Figure 1.
Study area. The domain of (b) indicates the area within a rectangle in (a). The gray-shaded area represents the coverage of HF radar in Yeosu Bay. The ‘x’ marks the initial dye release location, while the red dot denotes the nearby buoy location where wind and wave data were collected.
Figure 2.
(a) Wind speed measured from R/V Research 1 and (b) corresponding wind stress. (c) Significant wave height as measured by the nearby buoy indicated in
Figure 1. The dye monitoring experiment was conducted during the period highlighted by two red lines. Variables u and v represent wind velocities in the East-West (EW) and North-South (NS) directions, respectively, while U denotes the magnitude of wind speed.
and
indicate wind stresses in the EW and NS directions, with
representing the overall magnitude of wind stress.
Figure 3.
(a-d) Dye and drifter trajectories against the background of HF radar current (HFR). Comparison of Eulerian HFR and tidal velocities (modeled from the TMD matlab toolbox) at a fixed location near the dye release point in the East-West direction (e) and North-South direction (f). Panels (g) and (h) compare the Eulerian velocities in (e) and (f) with Lagrangian observational velocities during the experiment duration, marked by two gray lines in (e) and (f). Wind speeds in (g) and (h) are scaled by a factor of 20.
Figure 4.
(a) Displacement of the center of the dye patch, float, and drifters. The square indicates the release location, and the three concurrent locations are connected by lines. Displacements in the East-West direction (b) and North-South direction (c).
Figure 4.
(a) Displacement of the center of the dye patch, float, and drifters. The square indicates the release location, and the three concurrent locations are connected by lines. Displacements in the East-West direction (b) and North-South direction (c).
Figure 5.
Temporal evolution of the dye patch distribution at different times, with size and direction of the ellipse calculated from the principal axis analysis. The ellipse comprises two axes: the length of the longer axis is
and that of the shorter axis is
. The angle, measured from the southward direction rotating clockwise, is recorded in
Table 1. The actual size of all distributions can be observed along the x and y axes, while insets show the magnified distributions.
Figure 6.
Vertical dye concentration distributions at 10 min (a) and 4 h (b) after release, as measured by a fluorometer installed on the SCAMP.
Figure 6.
Vertical dye concentration distributions at 10 min (a) and 4 h (b) after release, as measured by a fluorometer installed on the SCAMP.
Figure 7.
(a) Raw RGB images taken by a drone 2.3 h post-dye release (around 11:30 am); (b) A zoomed-in segment of (a), converted to grayscale to emphasize the wave propagation direction. The angle between the two vectors is approximately 45 degrees.
Figure 7.
(a) Raw RGB images taken by a drone 2.3 h post-dye release (around 11:30 am); (b) A zoomed-in segment of (a), converted to grayscale to emphasize the wave propagation direction. The angle between the two vectors is approximately 45 degrees.
Figure 8.
Estimations of near-surface currents driven by the Ekman current and Stokes drift by analytical calculations (a), and the corresponding vertical shear (b). ‘Total’ represents the sum of the Ekman and Stokes components. Two dots represent the estimations of mean vertical shear derived from the mean velocity difference between the float and drifters (S1) and between the drifters and dye (S2).
Figure 9.
Shear estimation using three tracers. S1 and S2 represent the shear calculated from the velocity difference between the float and drifters (S1) and between the drifters and dye (S2). The subscripts ‘y’ and ‘t’ indicate the North-South (NS) component and the sum of the NS and East-West (EW) components, respectively. denotes the total wind speed, and represents the NS component of the wind speed. The axis for wind speed is on the right side.
Figure 10.
(a) Second moments of distribution and (b) dispersion coefficient (K) over time for three tracers: a dye patch, a combination of float and drifters (‘f+d’), and drifters only (‘d’). The total variance, , is calculated as . represents the relative dispersion of Lagrangian tracers.
Figure 10.
(a) Second moments of distribution and (b) dispersion coefficient (K) over time for three tracers: a dye patch, a combination of float and drifters (‘f+d’), and drifters only (‘d’). The total variance, , is calculated as . represents the relative dispersion of Lagrangian tracers.
Figure 11.
Estimated trajectories from the particle tracking model. HFR, EK, ST, and W indicate current components from HF Radar (HFR), Ekman current (EK), Stokes drift (ST), and 1% of wind speed (W), respectively. The gray shaded area indicates the dye patch.
Figure 11.
Estimated trajectories from the particle tracking model. HFR, EK, ST, and W indicate current components from HF Radar (HFR), Ekman current (EK), Stokes drift (ST), and 1% of wind speed (W), respectively. The gray shaded area indicates the dye patch.
Table 1.
Temporal variations in variance and orientation of the dye patch.
Table 1.
Temporal variations in variance and orientation of the dye patch.
| No. |
Time |
Source |
σx (m) |
σy (m) |
σma (m) |
σmi(m) |
Angle(o) |
| 1 |
09:10 |
Drone |
14.92 |
24.26 |
7.93 |
27.35 |
-32.89 |
| 2 |
09:26 |
Drone |
26.34 |
23.71 |
13.94 |
32.58 |
-52.10 |
| 3 |
09:27 |
Drone |
26.25 |
24.81 |
14.36 |
33.15 |
-49.56 |
| 4 |
09:28 |
Drone |
26.64 |
25.22 |
14.85 |
33.55 |
-49.52 |
| 5 |
09:29 |
Drone |
26.56 |
25.84 |
15.04 |
33.86 |
-47.99 |
| 6 |
09:30 |
Drone |
26.40 |
26.43 |
15.28 |
34.09 |
-46.34 |
| 7 |
09:31 |
Drone |
27.28 |
26.83 |
15.64 |
34.93 |
-47.37 |
| 8 |
09:32 |
Drone |
27.16 |
27.02 |
15.61 |
34.98 |
-46.70 |
| 9 |
09:35 |
Drone |
27.22 |
28.04 |
16.45 |
35.45 |
-44.54 |
| 10 |
09:38 |
Drone |
27.99 |
29.02 |
17.38 |
36.38 |
-44.06 |
| 11 |
09:39 |
Drone |
28.03 |
29.28 |
17.49 |
36.56 |
-43.58 |
| 12 |
10:10 |
Satellite |
41.17 |
43.58 |
25.78 |
54.12 |
40.91 |
| 13 |
10:34 |
Drone |
52.03 |
46.53 |
26.73 |
64.48 |
52.97 |
| 14 |
10:38 |
Drone |
52.99 |
49.80 |
26.96 |
67.53 |
42.91 |
| 15 |
10:41 |
Drone |
53.47 |
52.20 |
26.99 |
69.68 |
45.09 |
| 16 |
11:28 |
Drone |
86.58 |
67.35 |
31.23 |
105.15 |
52.62 |
| 17 |
11:44 |
Satellite |
61.26 |
67.25 |
29.25 |
86.13 |
42.08 |
| 18 |
12:40 |
Ship |
115.39 |
91.61 |
56.17 |
136.20 |
29.50 |
| 19 |
13:32 |
Drone |
120.63 |
211.82 |
81.69 |
229.66 |
7.26 |
| 20 |
16:02 |
Ship |
193.80 |
284.35 |
153.94 |
307.76 |
2.00 |
|
Disclaimer/Publisher’s Note: The statements, opinions and data contained in all publications are solely those of the individual author(s) and contributor(s) and not of MDPI and/or the editor(s). MDPI and/or the editor(s) disclaim responsibility for any injury to people or property resulting from any ideas, methods, instructions or products referred to in the content. |
© 2024 by the authors. Licensee MDPI, Basel, Switzerland. This article is an open access article distributed under the terms and conditions of the Creative Commons Attribution (CC BY) license (http://creativecommons.org/licenses/by/4.0/).
