Preprint
Article

Simple Method to Enhance the Molecular Weight of Polyfurfuryl Alcohol Resin Using A Straightforward Co-Catalytic System

Altmetrics

Downloads

173

Views

58

Comments

0

This version is not peer-reviewed

Submitted:

08 April 2024

Posted:

09 April 2024

You are already at the latest version

Alerts
Abstract
This study represents a significant stride in advancing furan chemistry, presenting the synthesis of high-molecular-weight polyfurfuryl alcohol (PFA) resin (Mw = 118,959 g/mol) from furfuryl alcohol (FA) using a co-catalytic system as against the conventional single-catalytic methods. The resulting PFA resin is fully characterised, and we conclude that it exhibits good shelf life and potential in diverse applications, serving as a standalone moulded material or contributing to composites, coatings, adhesives, and nanostructured carbons.
Keywords: 
Subject: Chemistry and Materials Science  -   Polymers and Plastics

1. Introduction

FA can polymerise to PFA resin, which can be brought about by prolonged exposure to open air, oxygen, elevated temperatures, acidic substances, sufficient UV radiation or ultrasonic vibrations, or combinations thereof [1,2,3,4,5,6]. Notwithstanding, the conventional preparation techniques for PFA resins are the use of catalytic systems (e.g., transition metal catalysts, halogenated and nitrated compounds, etc.) that are sufficiently active to induce polymerisation of FA, often with limited control and low molecular weights (Mw) [1,7,8,9,10,11,12,13,14,15,16,17]. Due to their low processability (i.e., forming insoluble solids), PFA resins with Mw above 24 000 g/mol have limited applications [4,18]. Thus, creating the challenge of producing high Mw of processable PFA resins.
The need for processable high Mw PFA resins is consequent on several merits. For example, since Mw significantly impacts the properties of polymers, including thermal stability, chemical resistance, mechanical strength, and low shrinkage [19,20]; thus, expectedly, the higher the Mw of polymers, the better their performance as a result of larger molecular sizes, reduced chain diffusion, higher chain parking, increased chain entanglements, and stronger intermolecular interactions [21,22]. Besides, the Mw of a polymer ultimately influences the properties of its derived carbon materials, including strength, porosity, surface area, dielectric features, heterogeneity, and others; therefore, biomass-derived carbons (i.e., above-the-ground feedstock) represent reliable and efficient resources for producing carbon-based systems that demonstrate matchless hierarchical porous structures capable of exceptional transport phenomena (e.g., thermal and electron) for material fabrication (e.g., supercapacitors) [23,24,25,26,27]. Besides, enhancing the Mw of PFA resins holds considerable industrial importance and offers the opportunity to advance biobased hydrocarbons and related technologies toward achieving the mandate of sustainability development. Therefore, studies that contribute to developing processes in preparing polymeric systems from furans with improved properties are imperative.
To attain an elevated Mw for PFA resin that maintains processability and workability, we conceived a method that prioritises simplicity, reproducibility, and practicality. Our approach was inspired by laboratory experiments demonstrating that boron-tri-fluoride-diethyl-ether complex (C4H10BF3O), along with other commonly used catalysts such as fuming sulfuric acid (H2SO4) and nitric acid (HNO3), induces an exothermic reaction leading to the formation of a hard, unprocessable material during FA polymerisation. In contrast, hydrochloric acid (HCl) exhibited less violent reaction behaviour and improved control during polymerisation, resulting in a consistent furanic backbone in the resin [1,2,4]. Additionally, attempts to resinify FA using carboxylic acids like acetic acid as a standalone catalyst at ambient and elevated temperatures (~130 – 140 °C) were unsuccessful despite observing the typical colour change associated with catalysed FA polymerisation. This led us to hypothesise that organic acids, such as acetic acid, could serve as precursors for FA resinification, with HCl acting as the primary catalyst to enhance the resulting PFA's Mw.
This study is the outcome of a straightforward hypothesis positing the feasibility of producing high Mw PFA resin (Mw = 118,959 g/mol) that remains processable and exhibits a shelf life exceeding 6 months without forming a hard insoluble solid when stored at room temperature, utilising a simple co-catalytic system.

2. Materials and Methods

2.1. Materials

Chemicals and reagents were purchased from Merck (Sigma-Aldrich), South Africa. They were used as received: FA monomer (99%, pH = 6.0), acetic glacial (reagent plus, 99%), HCl acid (37 %, ACS reagent), NaOH (reagent grade, 98%), molecular sieve (0.3. nm beads), silica gel-60 F254 coated aluminium, THF (98 %), acetone (ACS reagent, 99.5%), N, N-Dimethylformamide (ACS reagent 99.8 %), toluene. The FA monomer was dried under a molecular sieve in a vacuum for 72 hours before use.

2.2. Methods

2.2.1. Preparation PFA-I (Control)

Our study employed a minimalist sample set containing only a control and the target sample. This choice stemmed from two considerations:
  • Retention Time Impact: We observed that irrespective of the acetic acid quantity used, the retention time during adding the primary acid significantly impacted the resulting molecular weight (Mw). Thus, exploring a wider range of acetic acid quantities would not have yielded meaningful impacts on the Mw.
  • Viscometer Constraints: In-situ monitoring of the reaction within a viscometer was deemed infeasible due to potential instrument damage. Therefore, we opted for the pragmatic approach of physically observing the viscosity increase to determine the optimal neutralisation point and halt the reaction progression.
For the control sample, the FA monomer (100 mL) underwent heating in a round bottom flask at a temperature range of approximately 110 - 115 °C with intense stirring for 72 hours, transforming the golden yellow monomer to a light brown shade. This temperature range facilitates significant ring-scission of furan rings, removes water molecules, and is just below the boiling point of acetic acid (around 118 °C), which would be used for sample II preparation. After cooling to room temperature, any remaining water was eliminated using toluene and a rota-vacuum system. Polymerisation initiation occurred by adding 0.5 mL of HCl under continuous stirring at 300 rpm, forming a dense, resinous system after approximately 2 hours. A 1 M NaOH solution in 50 mL distilled water was added to stop further polymerisation. The resulting resin was thoroughly washed in distilled water using a separating funnel to remove unreacted monomers and residual acid. The pH, determined with standard laboratory litmus test paper, was around 6. The dark brownish system was collected and stored in THF for analysis. A 0.5 mL of acid per 100 mL of heated FA monomer is optimal, with continuous and vigorous stirring to prevent localised viscosity increase and potential exothermic explosion. Quick addition of NaOH is crucial to prevent the system from becoming unworkable and stirring speed should be increased (e.g., 450 – 500 rpm). Water addition should be avoided to avert gelation, hardening, and cross-linking into a thermoset, making it challenging to handle.

2.2.2. Preparation of PFA-II (Primary)

The preparation method for PFA-II is the same as PFA-I; however, 5 mL of acetic acid (organo-catalyst) is added before refluxing. The same work-up procedure is employed as well. The resin is collected and stored under DMF instead. Comparatively, PFA-II is more elastic than PFA-I.

2.3. Characterization of Resins

2.3.1. Size Exclusion Chromatography

HF-based SEC measurements were performed at 30 °C on a Viscotek GPCmax VE 2001 from ViscotekTM, applying a CLM3008 precolumn and a CLM3008 central column. As solvent THF was used, the sample concentration was adjusted to 3 mg-1/ml [1] while applying a flow rate of 1 ml-1/min. To determine molecular weights, the refractive index of the investigated sample was detected with the VE 3580 RI detector of ViscotekTM and the UV detector 2600 of Viscotek. The data analysis software is OmniSEC 5.12. External calibration was done using polystyrene (PS) standards (purchased from Viscotek) with molecular weights ranging from 1050 to 115 000 g mol-1.

2.3.2. Fourier Transform Infra-Red Spectroscopy (FTIR)

Perkin-Elmer discovery (Spectrum 100 FTIR-Spectrometer) fitted with a diamond crystal was used for the FTIR study shown in Figure 1. Spectra were averaged and cut in the 4000 – 500 cm-1 range with 256 scans (background and sample). Spectrum IR version 10.7.2 was used to analyse the sample spectra on the system.

2.3.3. Thermogravimetric Analysis (TGA)

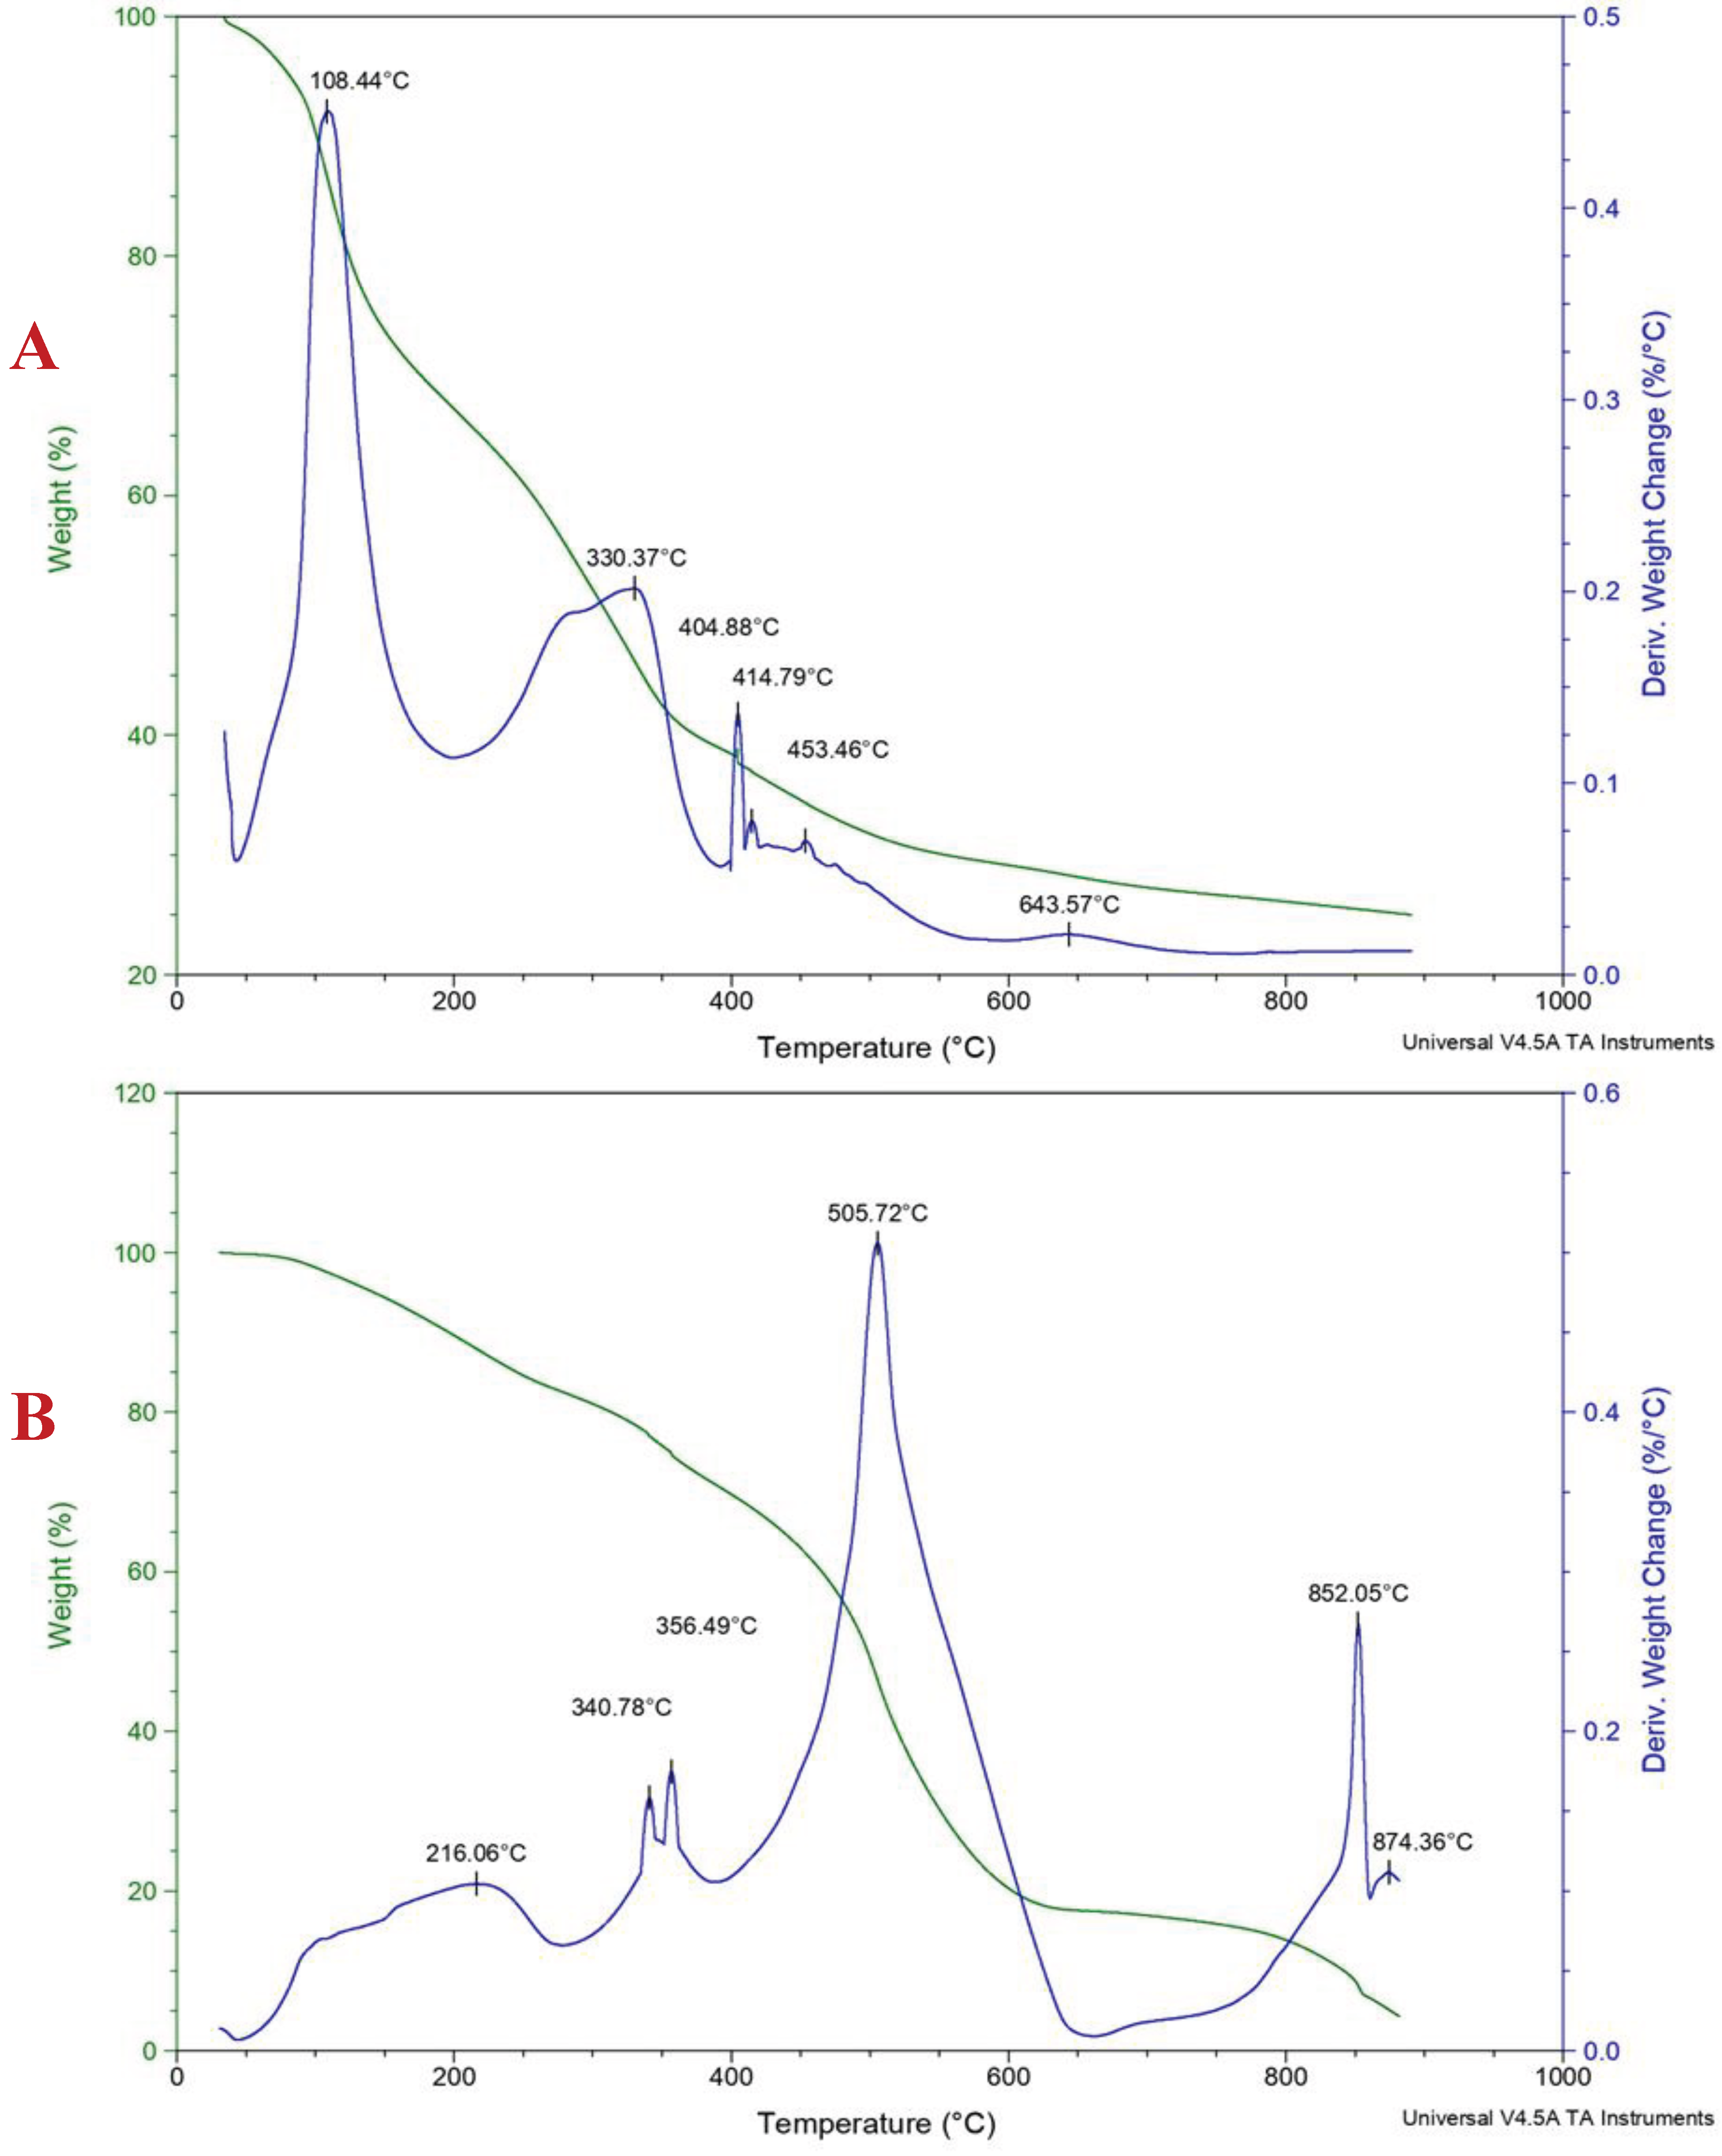
The thermogravimetry technique measures a sample’s mass or change as a function of temperature. A Hi-Res TA instrument Discovery series (TGA Q500) was used for the analysis, as shown in Figure 2. The study was performed from 30 °C to 900 °C at a heating rate per minute under nitrogen (90 mL per minute). TA universal analysis software was used to interpret the data. A constant mass of ca. 55 mg was used.

2.3.4. Differential Scanning Calorimetry (DSC)

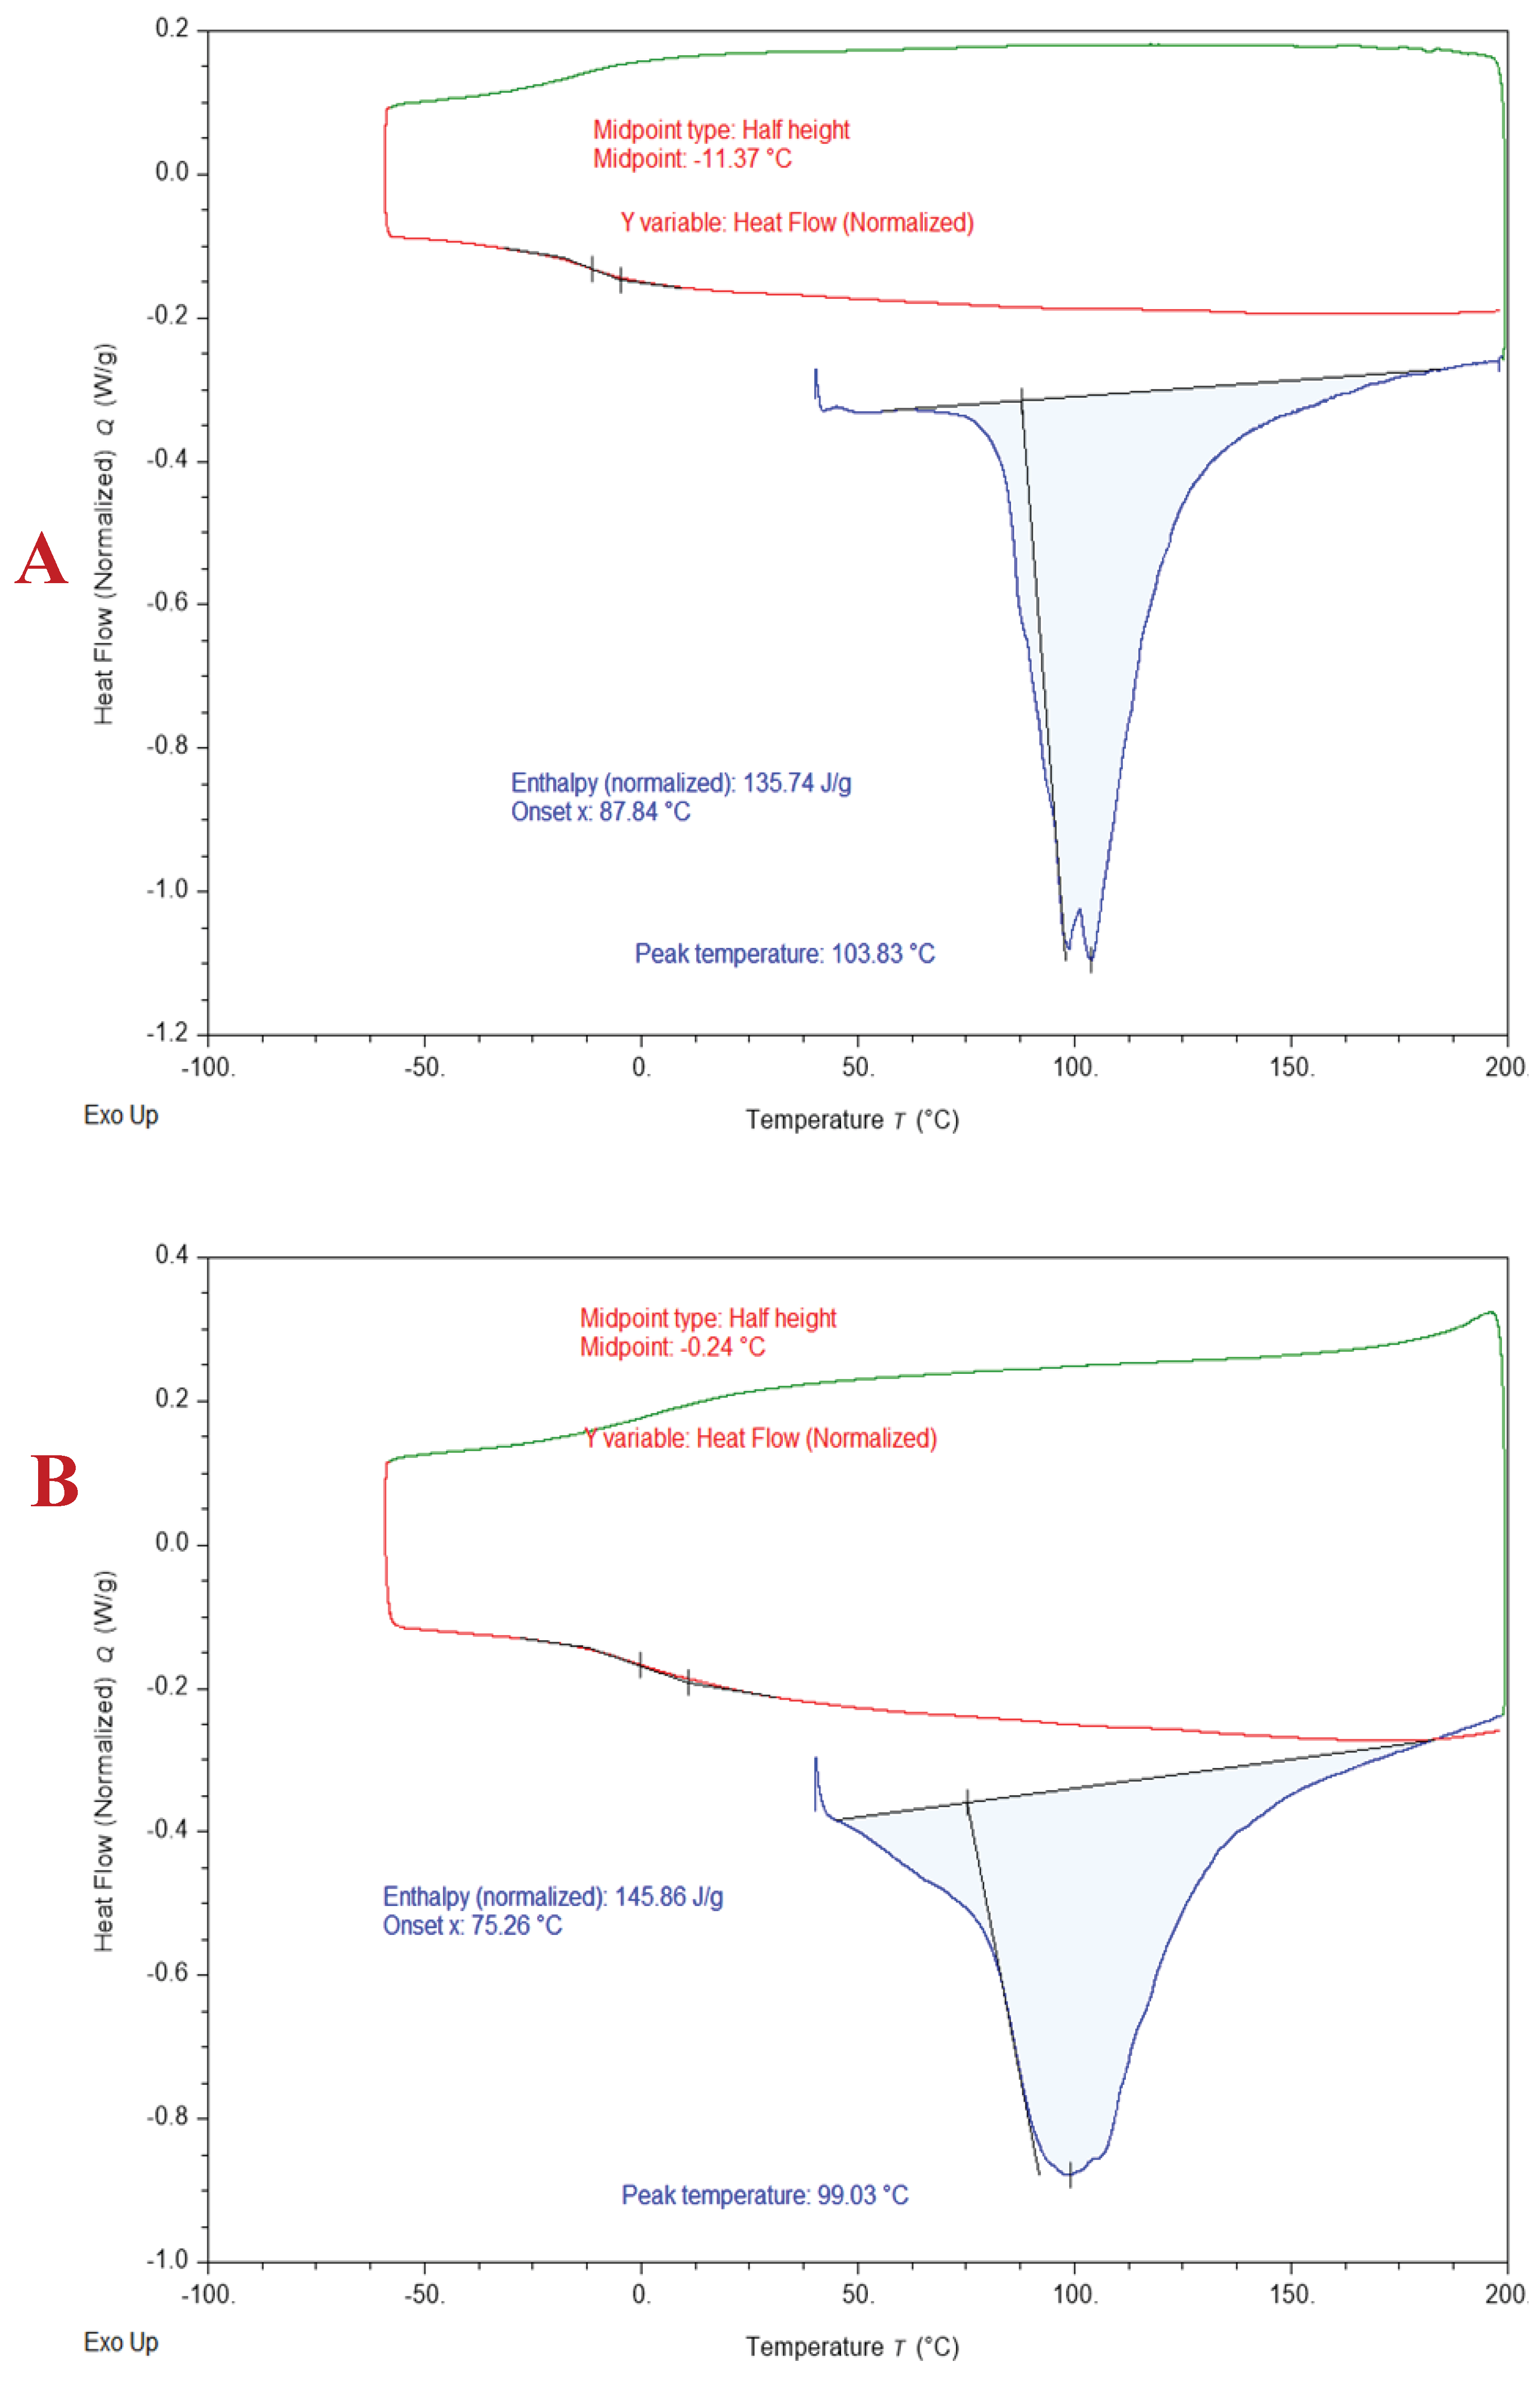
Thermal analysis using a Hi-Res DSC 2500 (TA Instrument) under ultra-high purity nitrogen. The sample size was constant at 10 mg with a nitrogen purge flow rate of 50 mL per minute. The ramp temperature was from minus 60 °C to 200 °C at 10 °C per minute. The TA Trios software was used for the data analysis, as shown in Figure 3.

2.3.5. Scanning Electron Microscopy (SEM)

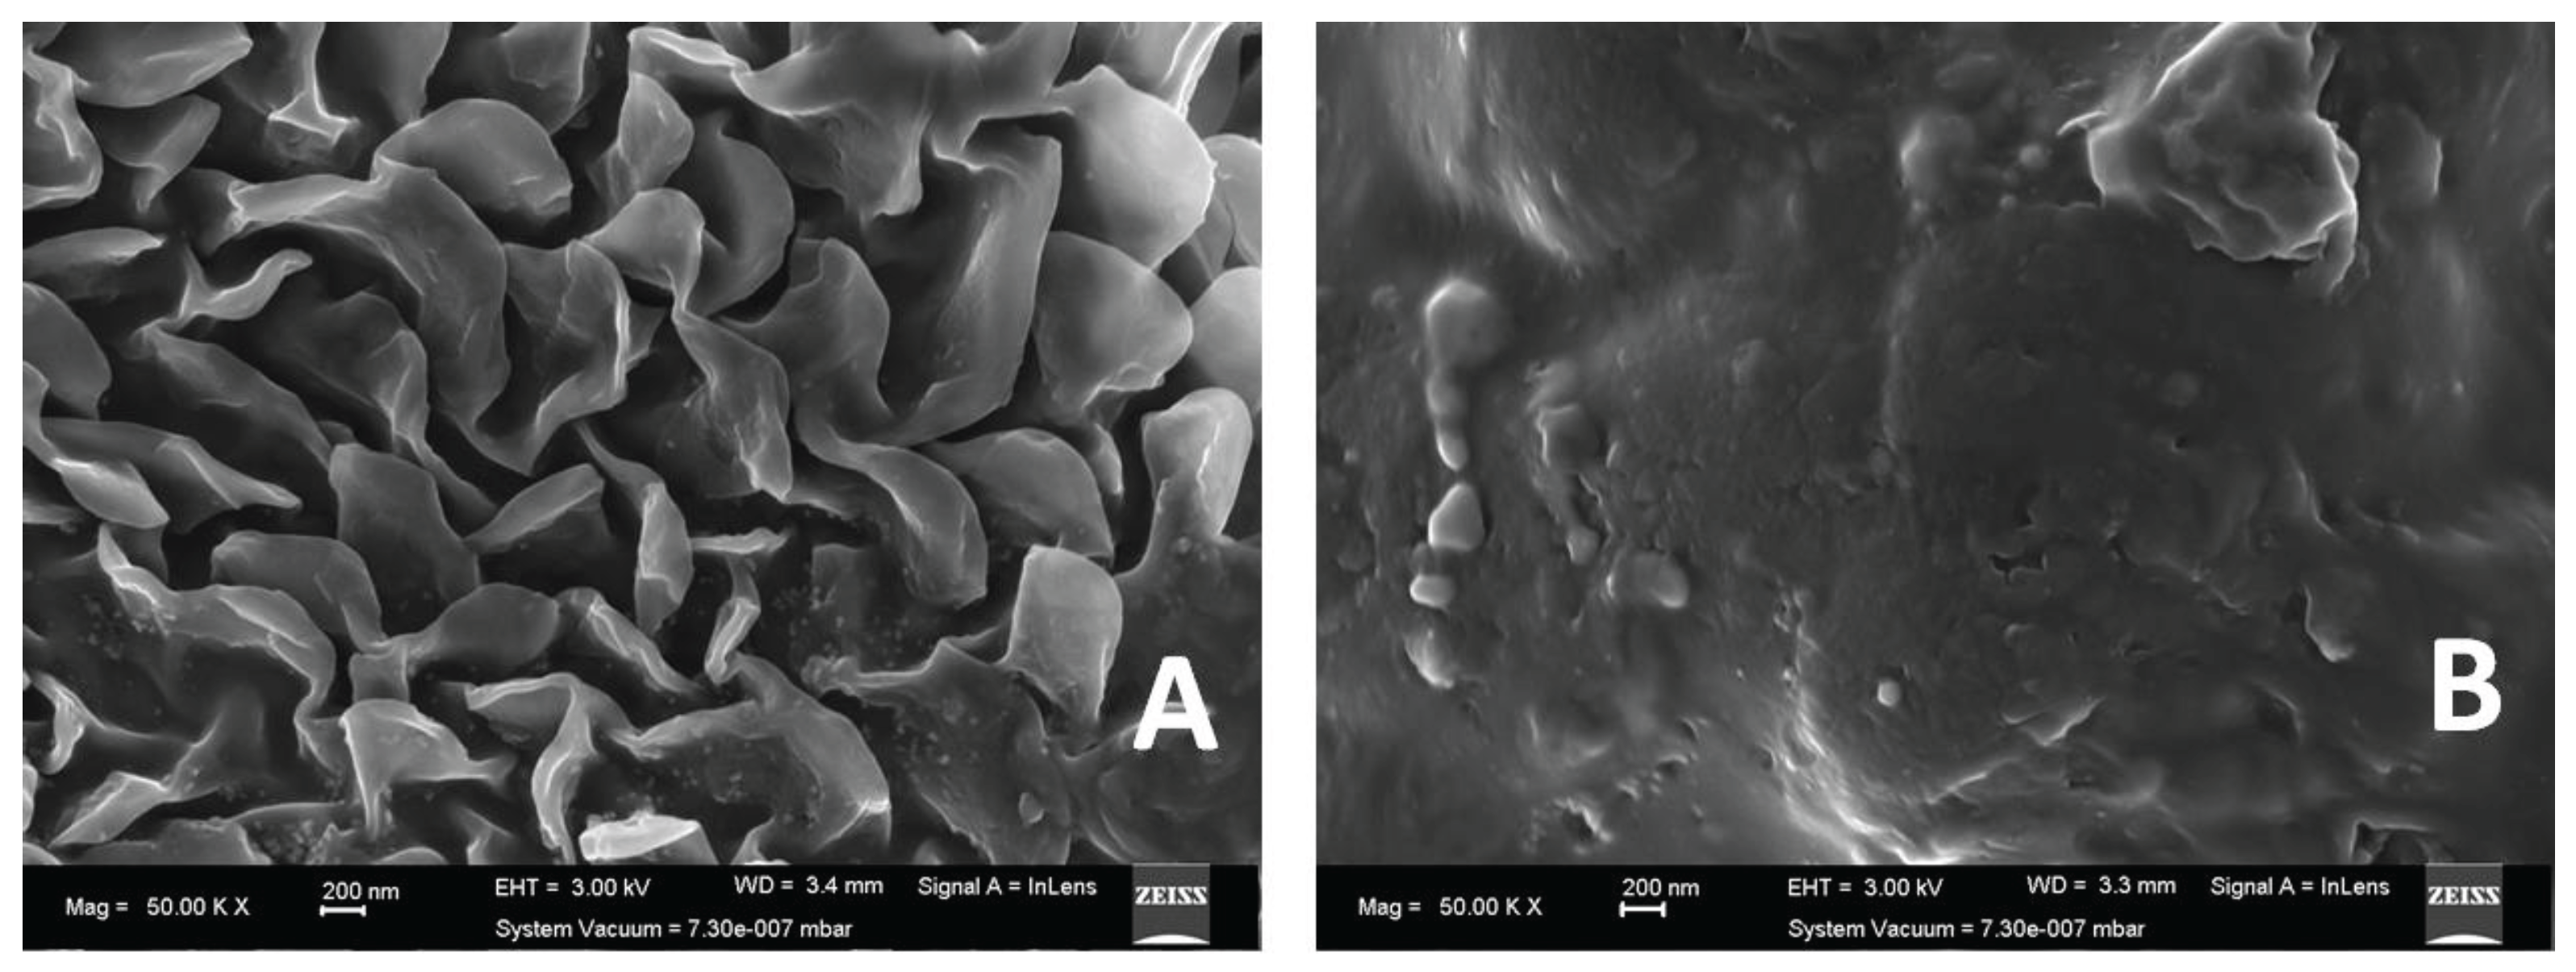
SEM images are shown in Figure 4. Samples were affixed to SEM stubs using conductive double-sided carbon tape. They were then coated with Carbon to render them conductive. Samples were viewed with the Zeiss Auriga Scanning electron microscope with a field emission gun, using SmartSEM software. EDX mapping was performed using an Oxford EDX detector and Aztec software. The SEM is calibrated twice a year for measurements using a gold-on-carbon standard. The EDX system is calibrated using a Cu standard.

2.3.6. 1. H, 13C, and DOSY Nuclear Magnetic Resonance (NMR)

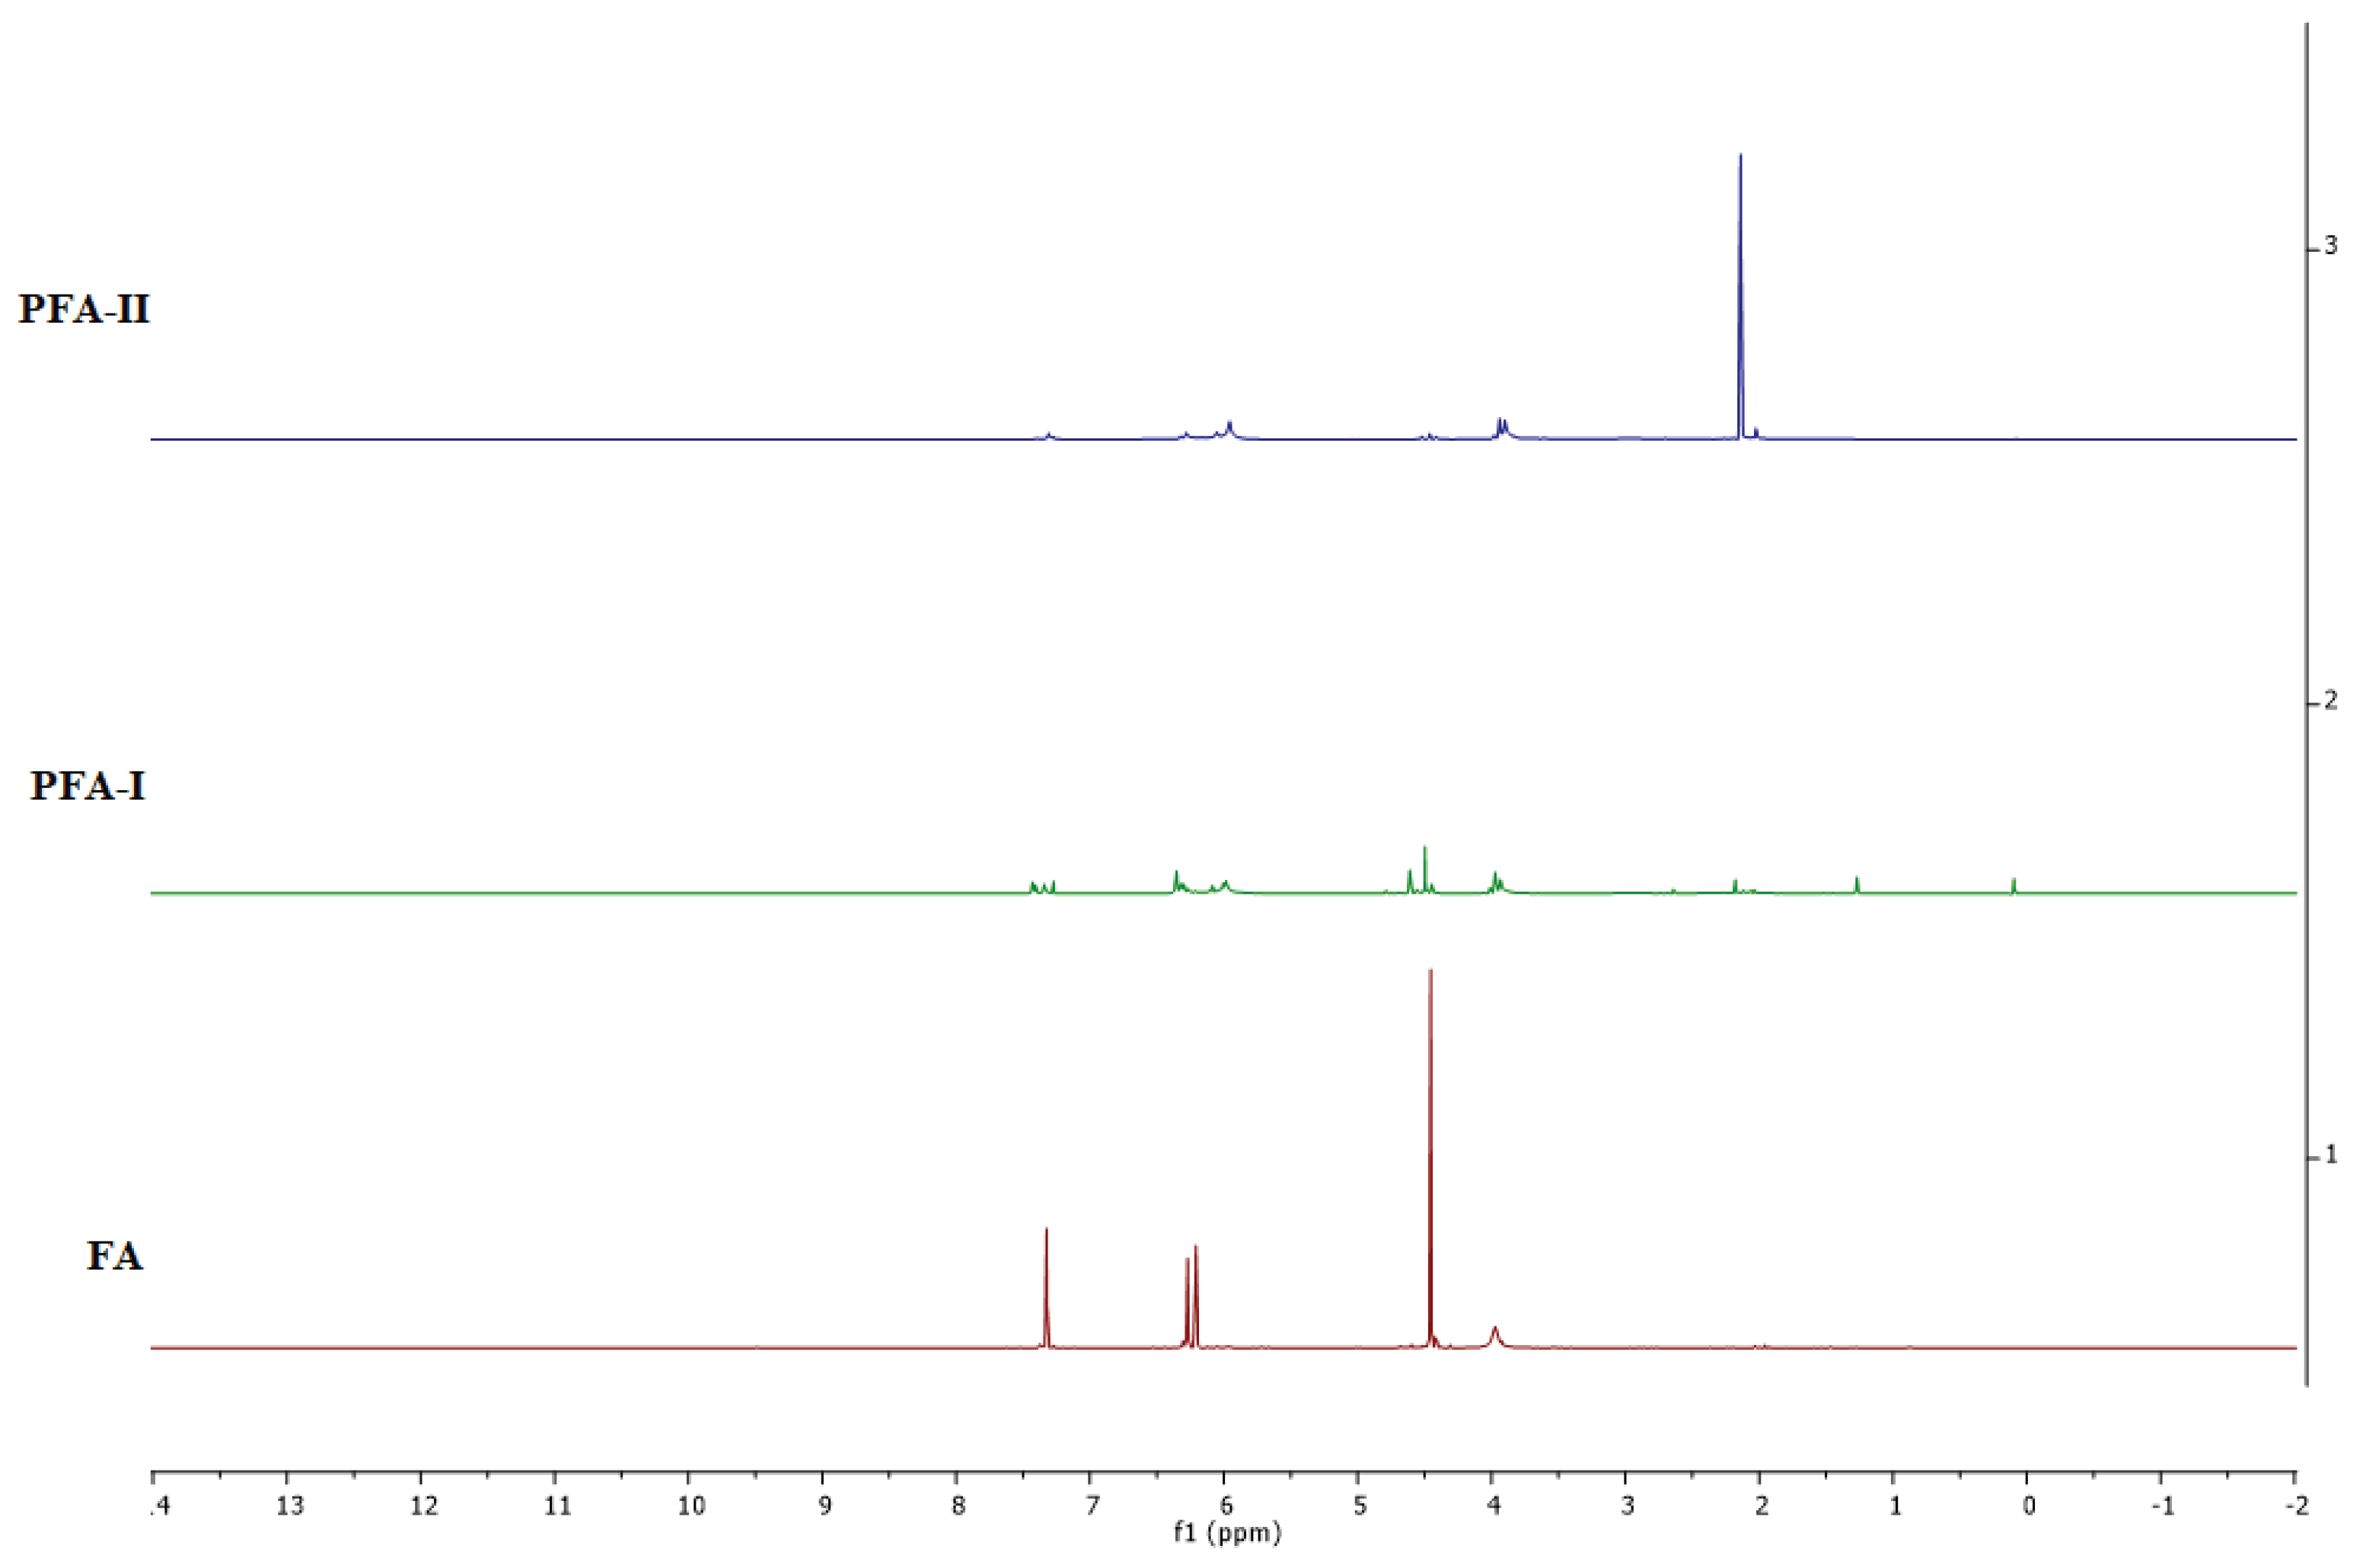
NMR spectra (shown in Figure 5, Figure 6 and Figure 7) were measured on Agilent Technologies 400 MHz VNMRS and 500 MHz DD2 at 27°C. Chemical shifts (δ) are reported in ppm and referred to the solvent residual signal (CDCl3 7.26 ppm for 1H and 77.0 ppm for 13C). Diffusion-ordered spectroscopy (DOSY) measurements were done on an Agilent VNMR DD2 500 MHz (sfrq = 499.727 MHz). The experiment was performed under OpenVnmrJ 1.1 and equipped with a 5 mm PFG One NMR probe, z-gradient, and temperature unit. The Diffusion-ordered spectroscopy data were acquired using the Agilent pulse program DgcsteSL_cc using a stimulated echo with self-compensating gradient schemes and conventional compensation. The length of the gradient pulse was set to 3.0 ms for 1 Hour in combination with a diffusion period of 300 ms (D2O). Data were systematically accumulated by linearly varying the diffusion encoding gradients from 2% to 95% for 64 gradient increment values. The Software used for data analyses is MestReNova.

2.3.7. Matrix-Assisted Laser Desorption/Ionization Time-of-Flight Spectrometry (MALDI-TOF)

MALDI-TOF MS was performed on a Bruker Autoflex III system (Bruker Daltonics) using a nitrogen laser operating at a wavelength of λ = 337 nm in reflection mode. The used matrix: analyte: the salt ratio was 100:10:1, and 1 μL of the mixture was spotted on the MALDI target. The polymer samples were either dissolved or suspended in HFIP or DMF with a concentration of 10 mg/mL, and dithranol was used as a matrix, adjusting a concentration of 20 mg/mL in THF. In comparison, KTFA was used as salt with a concentration of 5 mg/mL in THF). Data evaluation was carried out via Flex-Analysis software (3.4), and the isotopic pattern was simulated by Data Analysis software (version 4.0).

3. Results and Discussion

3.1. Molecular Weight Determination

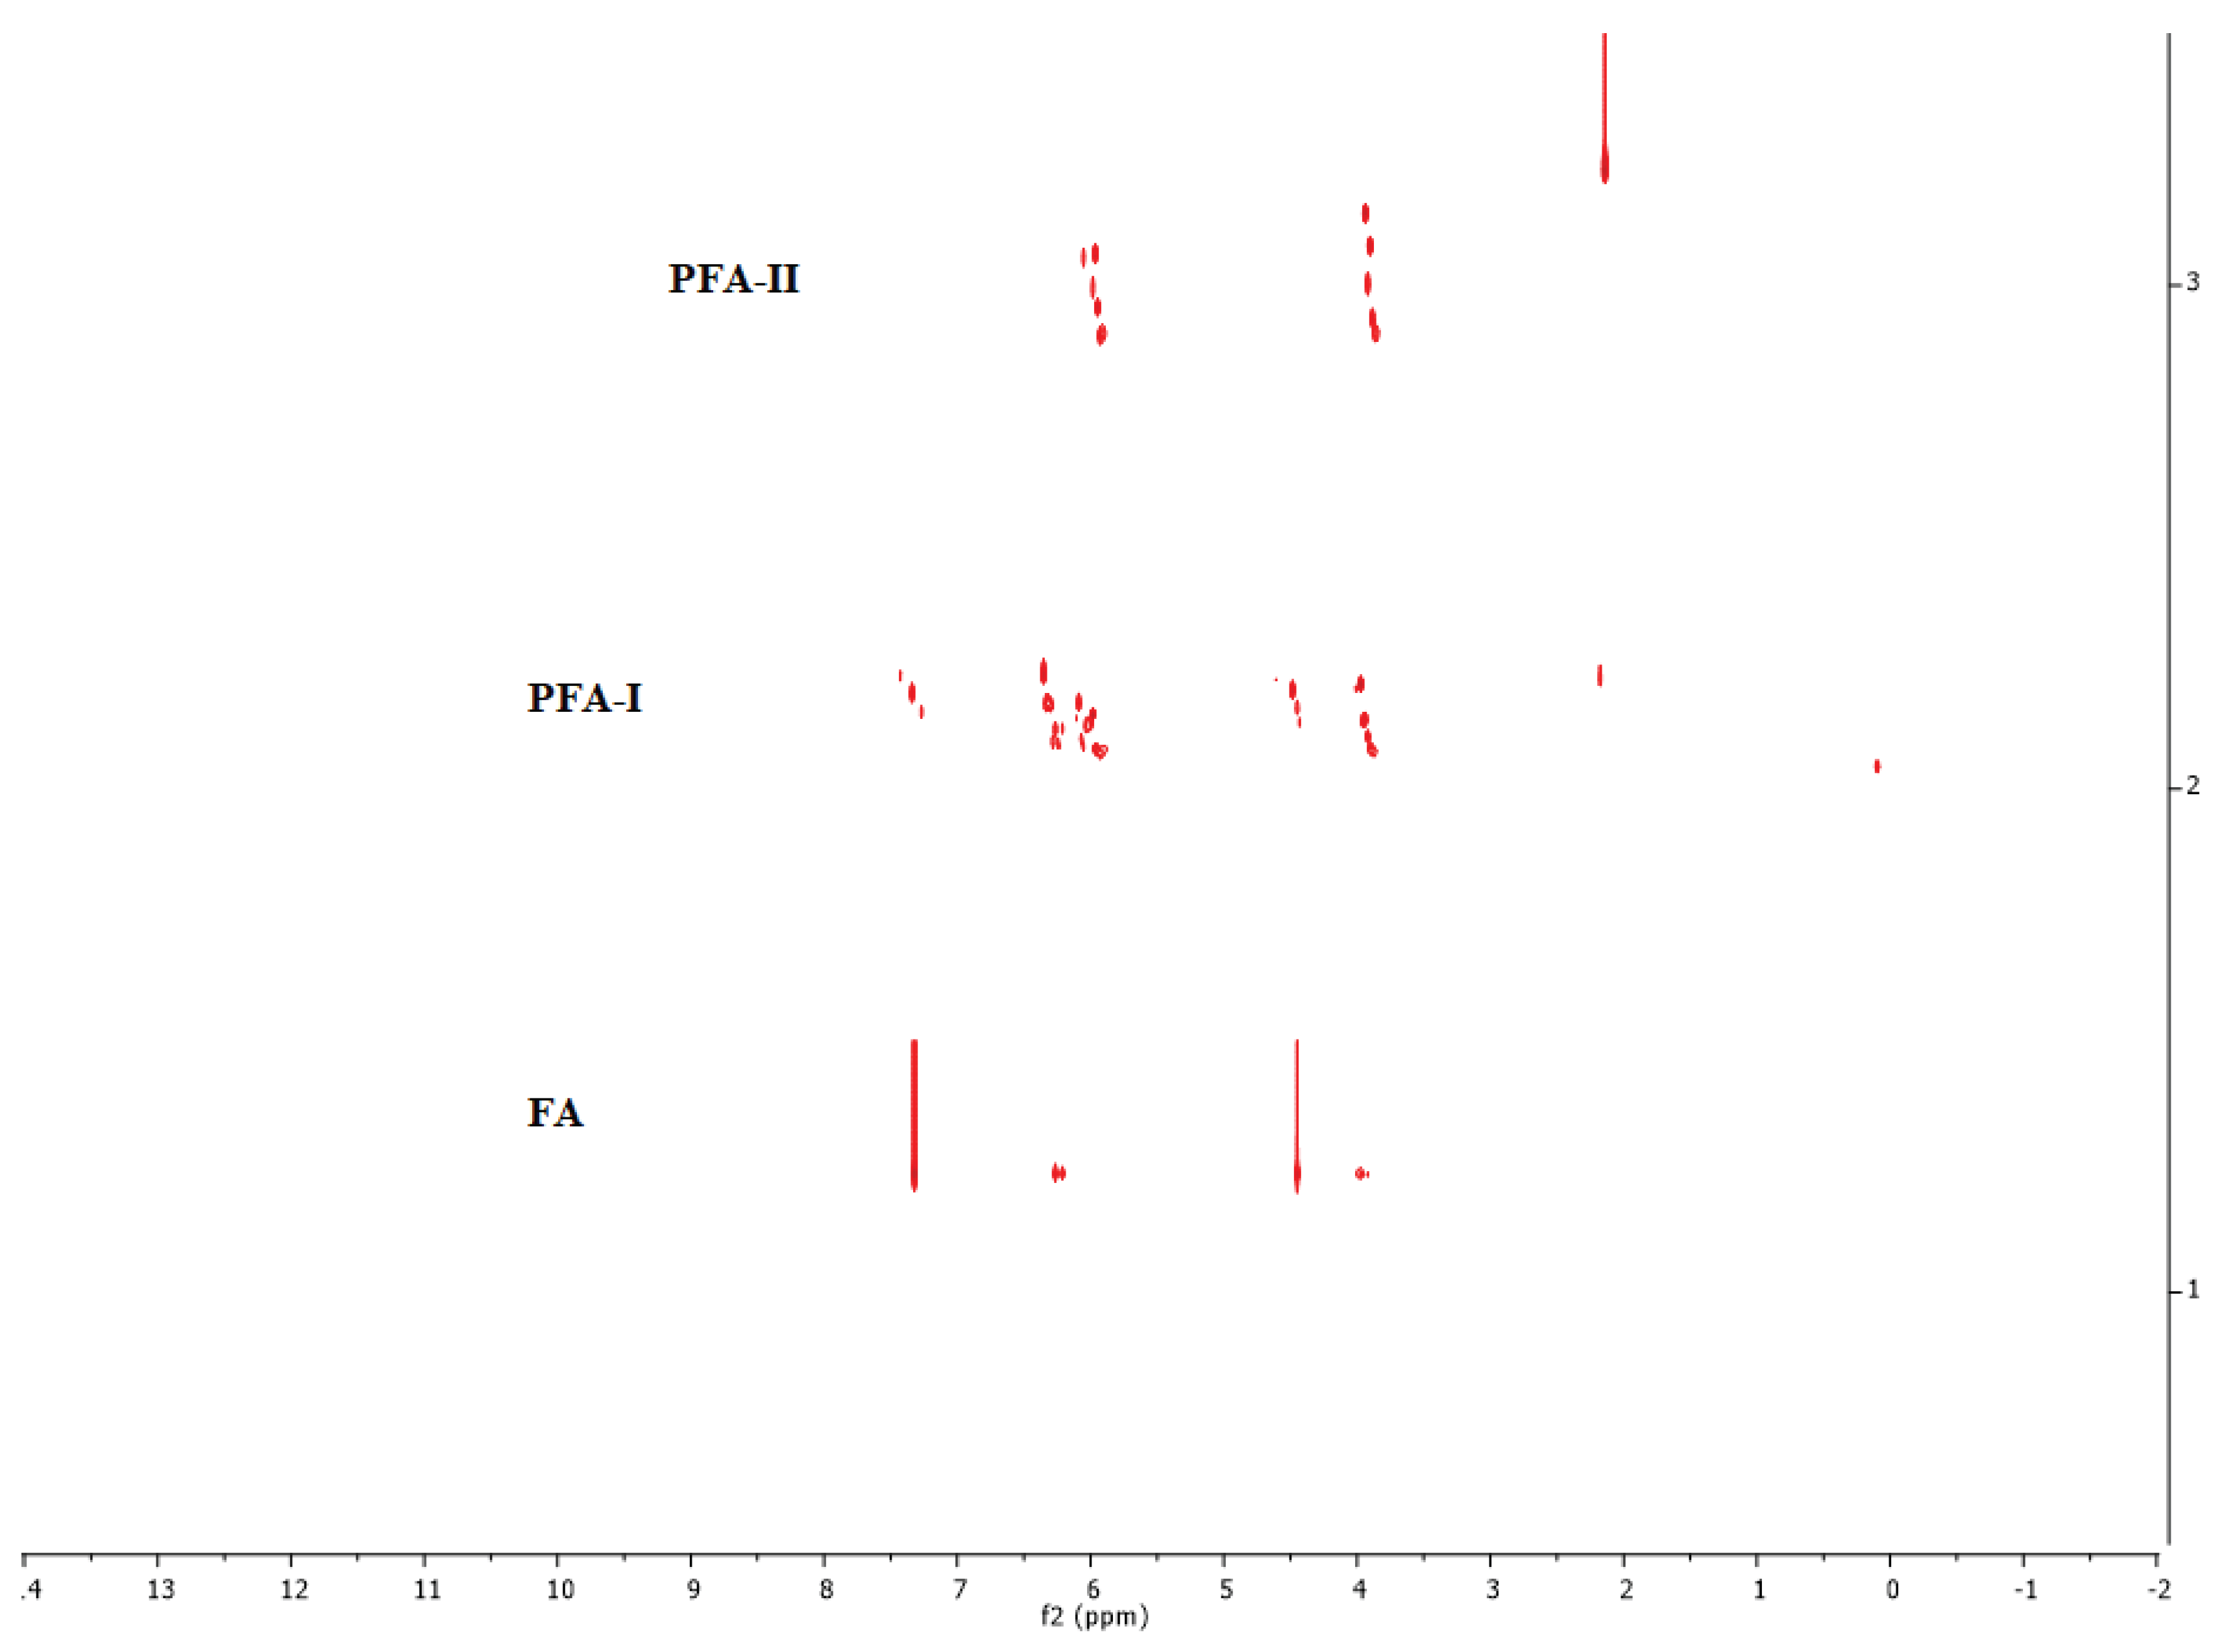
This study's MALDI-TOF analysis yielded few meaningful results due to several factors. Firstly, the polydispersity inherent in the polymerisation process of PFA leads to a wide range of molecular weights within the sample. MALDI-TOF analysis, which assumes monodispersity, struggles to determine the average molecular weight in such polydisperse mixtures accurately. Secondly, effective ionisation of PFA molecules is crucial for successful MALDI-TOF analysis. Despite various sample preparation methods being attempted, no efficient ionisation of PFA could be achieved, making it challenging to obtain reliable mass spectra. Our deductions are supported by the DOSY spectra in Figure 7, which demonstrates that both PFA-I and PFA-II consisted of mixtures of species, which may include oligomers, tetramers, pentamers, polymers, etc., agreeing with earlier studies [4,13,17,28,29].
In light of these limitations, GPC/SEC was utilised to determine the molecular weight of the PFA resins. GPC/SEC is a practical technique for characterising polymer molecular weights and distributions. It operates based on the relative size or hydrodynamic volumes of macromolecules within a column's average pore size, regulated by entropy factors such as temperature, pressure, or composition. Two types of detectors, Refractive Index (RI) and Ultraviolet (UV) were employed in the GPC/SEC analysis. RI detectors respond to all polymers regardless of their chemical composition, measuring changes in the refractive index of eluents. They offer good baseline stability and are less sensitive to changes in mobile phase composition. On the other hand, UV detectors provide information about the presence of absorbing groups in polymer structures, allowing for quasi-quantitative or qualitative analysis. They are particularly sensitive to polymers with high absorbance in the UV range and can be configured for detection at specific wavelengths. The GPC/SEC results chromatogram (See Supplementary Material S1) are summarised in Table 1, confirming the Mw of the PFA-I and PFA-II resins and PDIs.
The molecular weight obtained for PFA-I (a combination of heat and HCl catalysis) is relatively close to the previous experiment [4]. It was shown that bulk polymerisation of FA resulted in an Mw of 4 486 g/mol and 23 042 g/mol for HCl and heat-catalyzed polymerisation, respectively. Therefore, the present study demonstrates that a preheated FA monomeric system on further catalysation employing an acid such as HCl will result in a much higher Mw. A relatively higher molecular weight of 118 959 g/mol is observed when the FA is refluxed with a pre-catalyst (i.e., a weak carboxylic acid such as acetic acid). This molecular weight is currently the highest recorded in the literature. Additionally, the significantly lower Polydispersity Index (PDI) of PFA-I (13,820) in comparison to PFA-II (66,718) suggests a much narrower range of molecular weights, indicating higher uniformity and potentially more consistent properties. This may lead to predictable performance and suitability for applications demanding consistency. Conversely, PFA-II's broader distribution suggests potential heterogeneity and processing difficulties, although it might offer adaptability for specific purposes. The GPC/SEC results ultimately agree with the FTIR and NMR results.

3.2. FTIR Spectroscopy Analysis

Figure 1 represents the FTIR spectra of the monomer (FA, blue spectra), the control resin (PFA-I, red spectra), and the primary resin (PFA-II, greyish spectra). In IR investigations, bond lengths and angles of molecules are mean harmonics of vibrating atoms, not exact positions; hence, even simple compounds yield complex spectra, which are usually apposite to known references and correlations [30]. Comparative analysis of the FTIR spectra shows a range of similarities in the FA, PFA-I, and PFA-II spectra. For example, at ~3000 – 2800 cm-1, characteristic of an aromatic C-H stretch or methyl groups [31], it is seen in the monomer as a doublet peak, which appears as a singlet peak in PFA-I and almost disappears in PFA-II. When FA is heated, alone or with acidic catalysts, this peak is usually present as a doublet identified in a previous report [4]; However, PFA-I, which has been pre-heated and acid-catalyzed, appears as a single peak. At ~1240 – 1230 cm-1, a stretching appears prominently in the FA monomer, which diminishes downward the spectra, which is unusual because this region is characteristic of C-N stretching in amines. In another instance, at ~ 1050 – 990 cm-1, there is a strong peak that is evident in all three spectra, which is assignable to ether a =C-H bending for alkanes, C=C bending for monosubstituted alkenes or possibly a C-O stretching of primary alcohol [31]. Notwithstanding, some peaks are uncommon in the three spectra or exclusive to one or two ranges. For example, at ~3600 – 3100 cm-1, there is a sharp and broad peak (with shoulders) present in FA and PFA-I, attributable to the hydroxyl O-H stretching of water, alcohol, and acid, which does not appear in the PFA-II sample; however, there are no peaks observed in the range ~3200 – 2500 to buttress the presence of carboxylic acids or possible intramolecular O-H groups; hence, the acetic acid used as pre-catalyst is not part of the PFA-II resin. At ~1510 – 1490 cm-1, a peak is mutual to FA and PFA-I, which could be attributed to a C-C stretch (in-rings) of aromatic systems [31,32] A jagged peak appears prominently at ~1485 – 1480 cm-1 in the FA and PFA-I spectra but not in the PFA-II spectra. Besides, PFA-II and PFA-I also share a similar range at ~800 – 650 cm-1, which is more pronounced in PFA-I than in PFA-II, possibly 2,5-disubstituted furan rings [10,32] All peaks in PFA-II seem weaker than in PFA-I and the FA. Moreover, PFA-I and FA spectra show striking similarity in most instances contrary to the remarkable deviations of PFA-II. Without any deep analysis, it is deduced that the monomer and derived resins consist of a mixture of compounds or chemical species, which has been previously reported [33]; supported by the DOSY spectra in Figure 7. PFA-I contains aspects of the monomeric species that are different from PFA-II. Moreover, the PFA-II resin appears to possess fewer features of the monomeric system (e.g., almost non-existent hydroxyl groups). This supports the argument that except for a freshly prepared or high-purity FA monomer, there is the possibility of commercially available monomeric FA containing a mixture of species that could arise from self-condensation/autooxidation due to long storage. For example, bottles of FA monomers stored in the dark, cold room of the author’s laboratory for more than 10 months turned dark brown and resinous.

3.3. Thermal Degradation Characteristics

The PFA-I thermograph (Figure 2A) shows that the TG curve's inflexion points, the temperature of the maximum rate of change in the mass (% weight), occurred at around 108 and 330 °C, respectively. This could be because of residual solvents, FA monomers, readily volatile compounds (e.g., water), low-molecular-weight resins, etc., because of the mixture of species, which agrees with the FTIR analysis [4]. Moreover, a close succession of overlapping weight losses could be seen at around 404, 415, and 453 °C, and the maximum inflexion temperature was observed at about 644 °C with the evolution of possibly furan moiety and other small molecules such as carbon dioxide, carbon monoxide, water, etc., before the final carbonisation [34,35,36]. Compared to the TG curves, PFA-II appears more stable (Figure 2B). For example, after around 130 °C, the material remained stable until approximately 216 °C, where a significant weight loss (endotherm) occurred at a temperature range of 341 °C and 356 °C, respectively [34,35,36]. The high molecular weight of the material ensured stability, and there was no noticeable close succession of overlapping weight losses until weight loss at around 506 °C [34,35,36]. The difference in the highest inflexion temperature of PFA-I and PFA-II is over 100 °C, which shows that the high molecular weight of PFA impacts the furan resin’s thermal stability.

3.4. DSC Analysis

The DSC curves (Figure 3) show a remarkable difference in the glass transition temperatures (Tg) of PFA-I (Figure 3A) and PFA-II (Figure 3B). For example, the Tg for PFA-I ranges between -5 to -11.9 °C. However, the Tg for PFA-II ranges between 0 to 5.8 °C. Hence, it could be deduced that the molecular weight also influenced the Tg, possibly due to increased intermolecular forces and chain entanglements, which resulted in higher energy barriers. The enthalpy (endothermic) changes observed in both DSC-curves of PFA-I and PFA-II at 103.84 °C and 99.03 °C can be attributed to evaporation or loss of volatile compounds (e.g., water) [34,35].

3.5. SEM Analysis

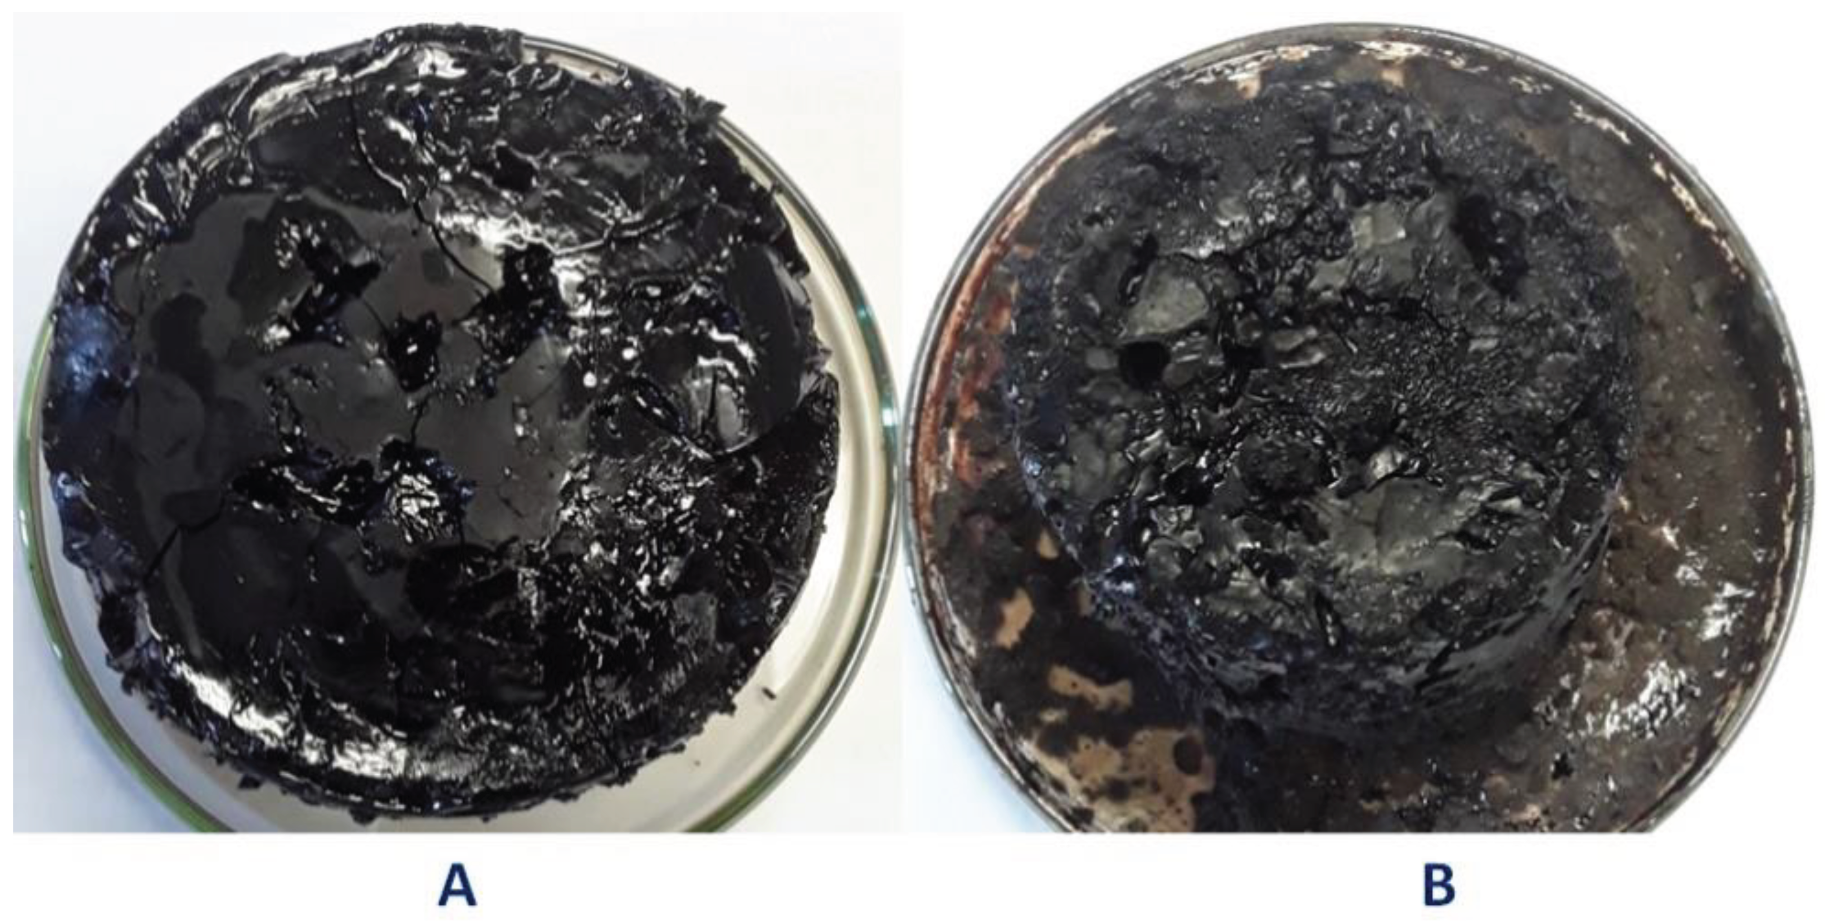
As observed in Figure 4, SEM micrographs of PFA-I (left image) and PFA-II (right image) show that surface morphologies of PFA-I and PFA-II using SEM differ significantly. Where PFA-I appears rough with clefts and ridges, PFA-II appears smoother and compacted. Nonetheless, macroscopically, the materials appear different. For example, when cured to about 200 °C, after 48 hours, PFA-I appeared glassier (shiny) than PFA-II, which seemed dull and lacked lustre, as shown in Figure 8.

3.6. NMR Analysis

For the 1H NMR spectrum (Figure 5), it is evident that both samples show peaks around 6.0-6.4 ppm, suggesting the presence of aromatic protons in the furan rings of the PFA backbone. However, PFA-I exhibits more resolved and differentiated peaks than the broader and weaker ones in PFA-II. This indicates a more ordered and structurally regular PFA-I. It can also be seen that PFA-I shows multiple peaks between 3.5-4.7 ppm, likely corresponding to protons on methylene (–CH2–) and methine (–CH–) groups adjacent to the furan rings. PFA-II has fewer distinct peaks in this region, suggesting a less complex aliphatic environment. However, both samples have peaks around 1.3-2.0 ppm, assigned to methyl (–CH3–) groups. The stronger and sharper peak in PFA-II implies a higher relative abundance of methyl groups than PFA-I. This is attributable to increased chain packing, enhanced Mw, and material flexibility, that is, the ease of processability.
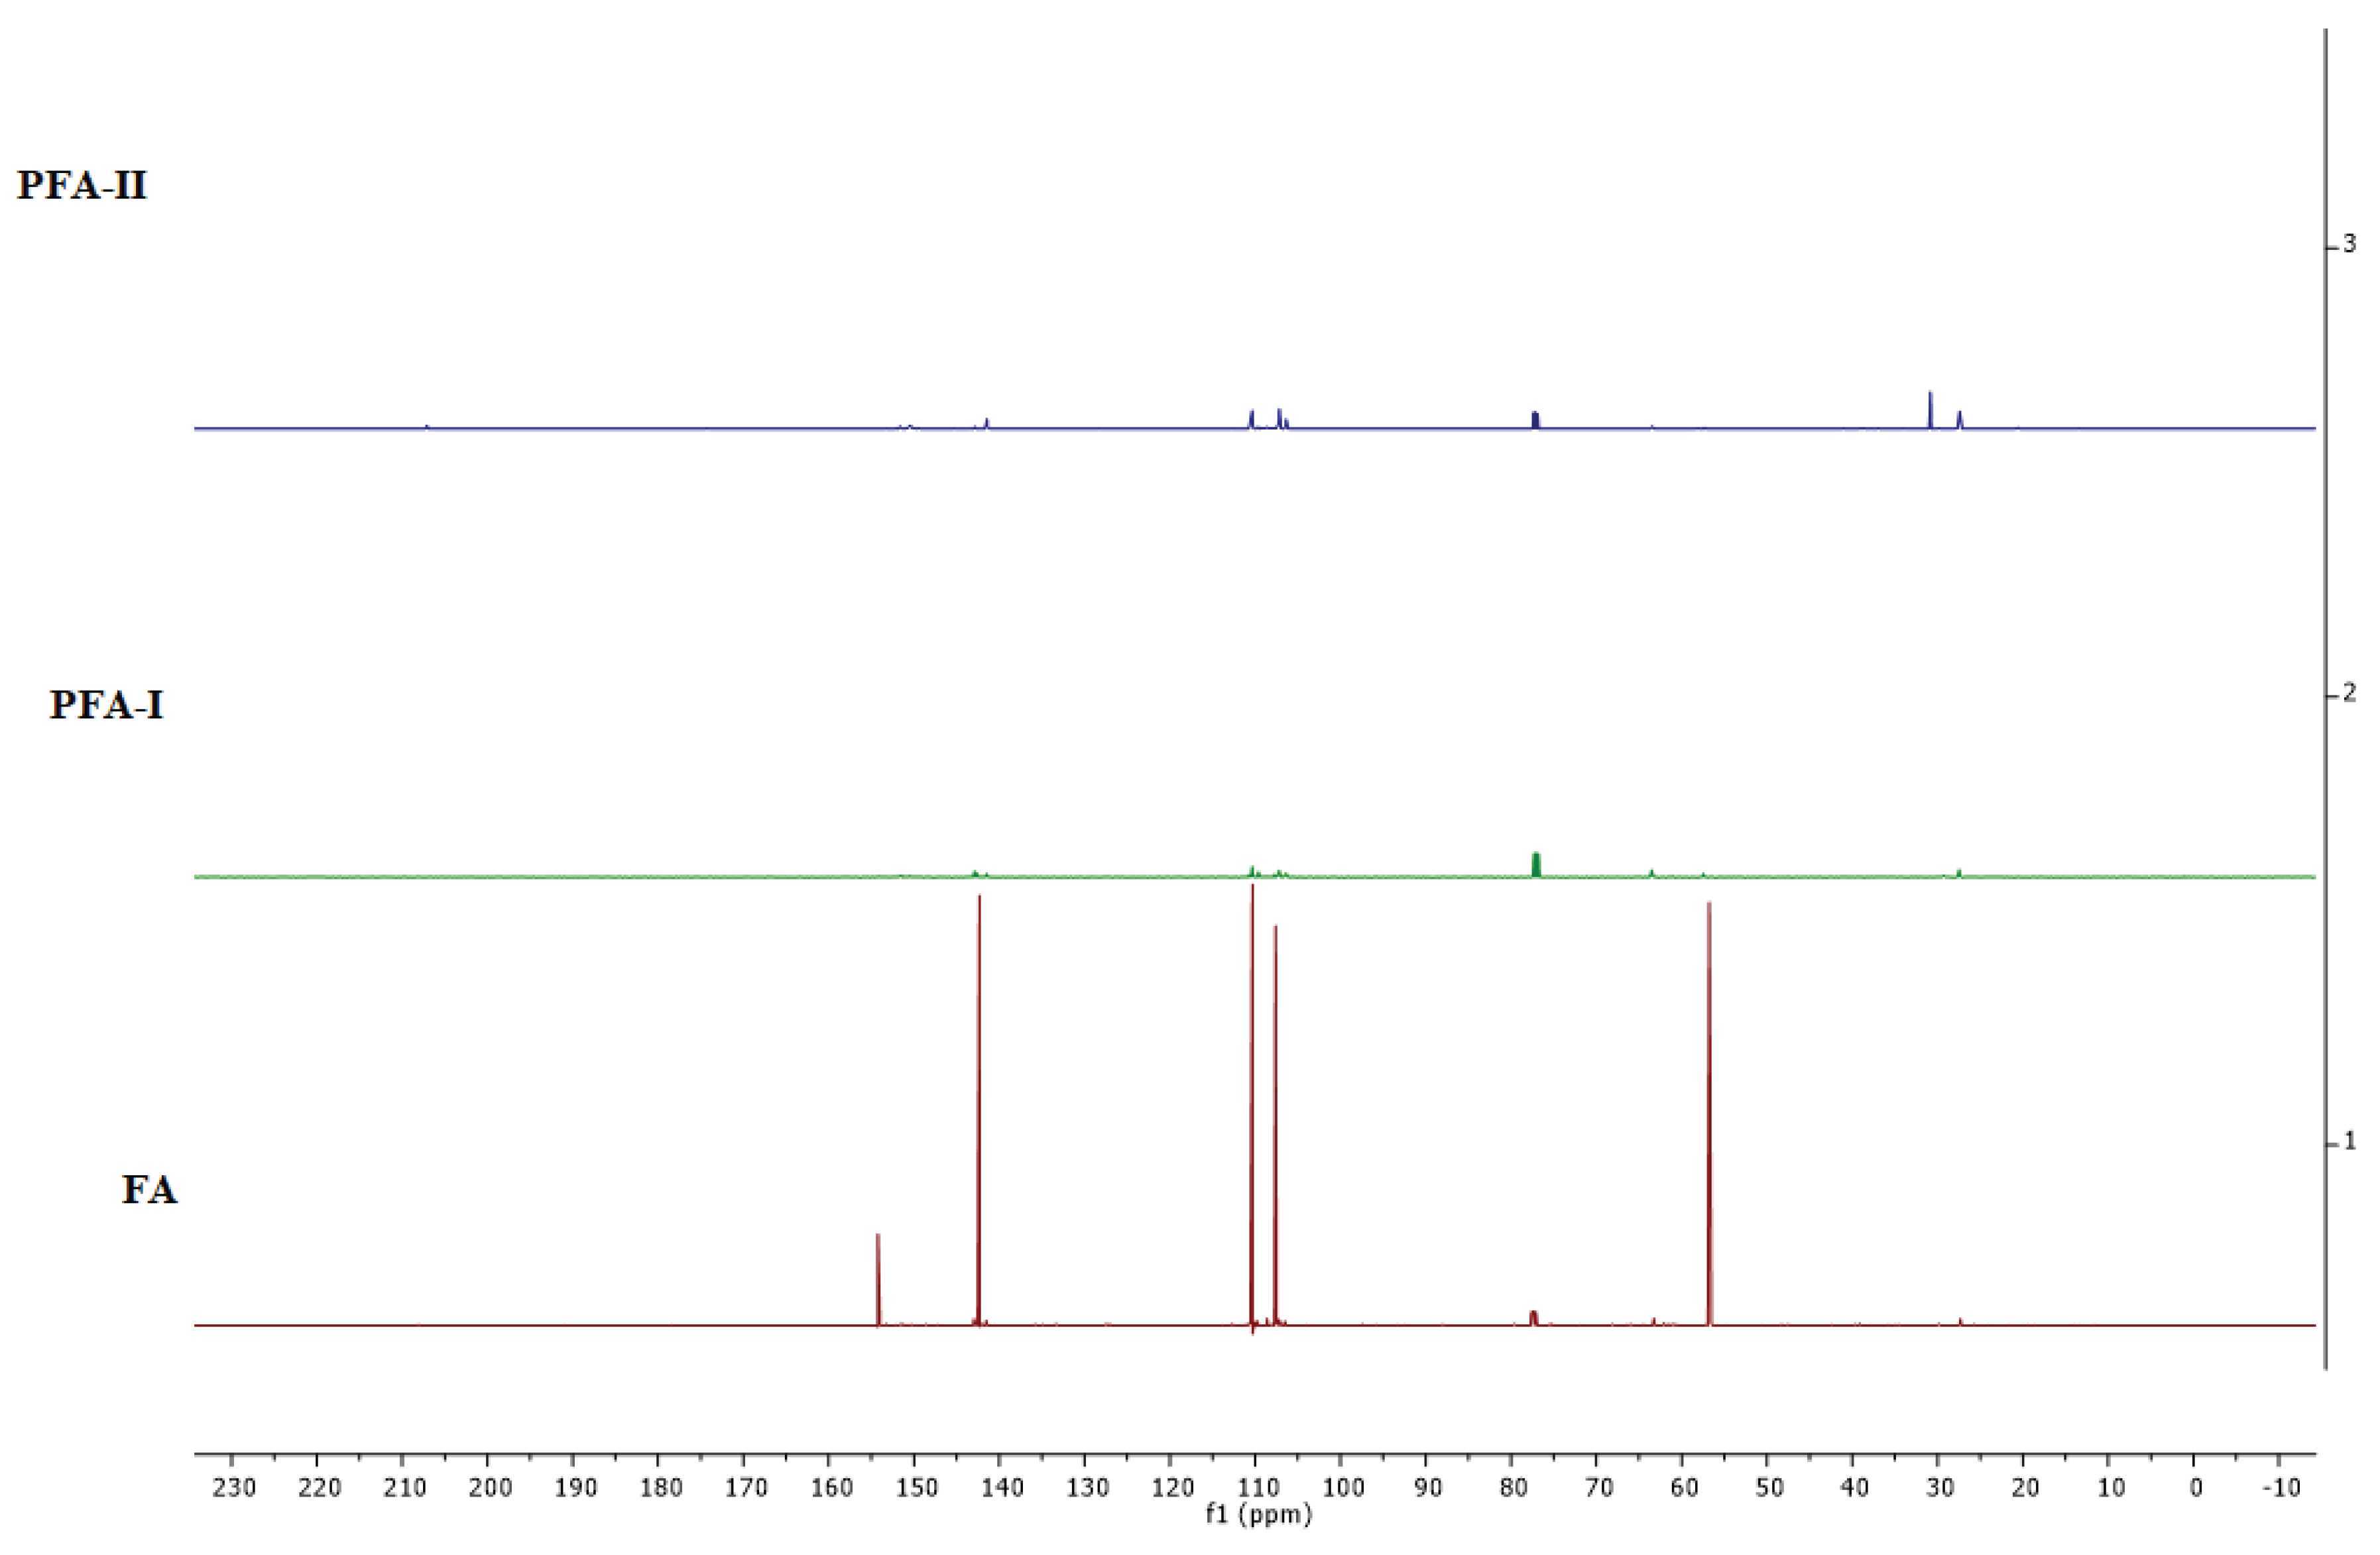
As for the 13C-NMR spectrum (Figure 6), we observed that both samples show peaks around 141 – 142 ppm and 109 – 110 ppm, corresponding to the carbons in the furan rings [37,38]. Doublet peaks in PFA-I suggest different chemical environments for some furan carbons, implying a more structured arrangement than the single PFA-II peak [37,38]. Furthermore, PFA-I exhibits various peaks between 57 – 64 ppm, likely representing methylene and methine carbons. PFA-II has fewer peaks in this region, indicating a simpler aliphatic structure. The peak around 27 ppm in PFA-I and stronger peaks at 30 – 35 ppm in PFA-II confirm the presence of methyl groups [37,38]. The shift to higher ppm in PFA-II suggests a different electronic environment around these methyl groups, possibly due to their proximity to other functional groups [37,38].
PFA-I appears to have a more ordered and well-defined structure, evidenced by the sharper and more resolved peaks in both 1H and 13C spectra. This could be due to our well-controlled polymerisation process leading to a more regular arrangement of furan units. Additionally, the significant difference in methyl content between the samples suggests the presence of end-chain modifications or complicated mixtures in the backbone of PFA-II. Moreover, the weak peak at 155 ppm in the 13C spectrum of PFA-II might indicate the presence of carbonyl carbons (C=O), which is not observed in PFA-I [37,38].
Combining the FTIR and NMR spectra insights gives us a more comprehensive understanding of the structural differences between PFA-I and PFA-II. It is evident that PFA-I appears to have a more ordered and well-defined structure, and PFA-II is a more complex and less regular structure, as observed in the DOSY spectra in Figure 7, where heightened mixtures of species and disorderliness are seen in PFA-II resin compared to PFA-I resin.
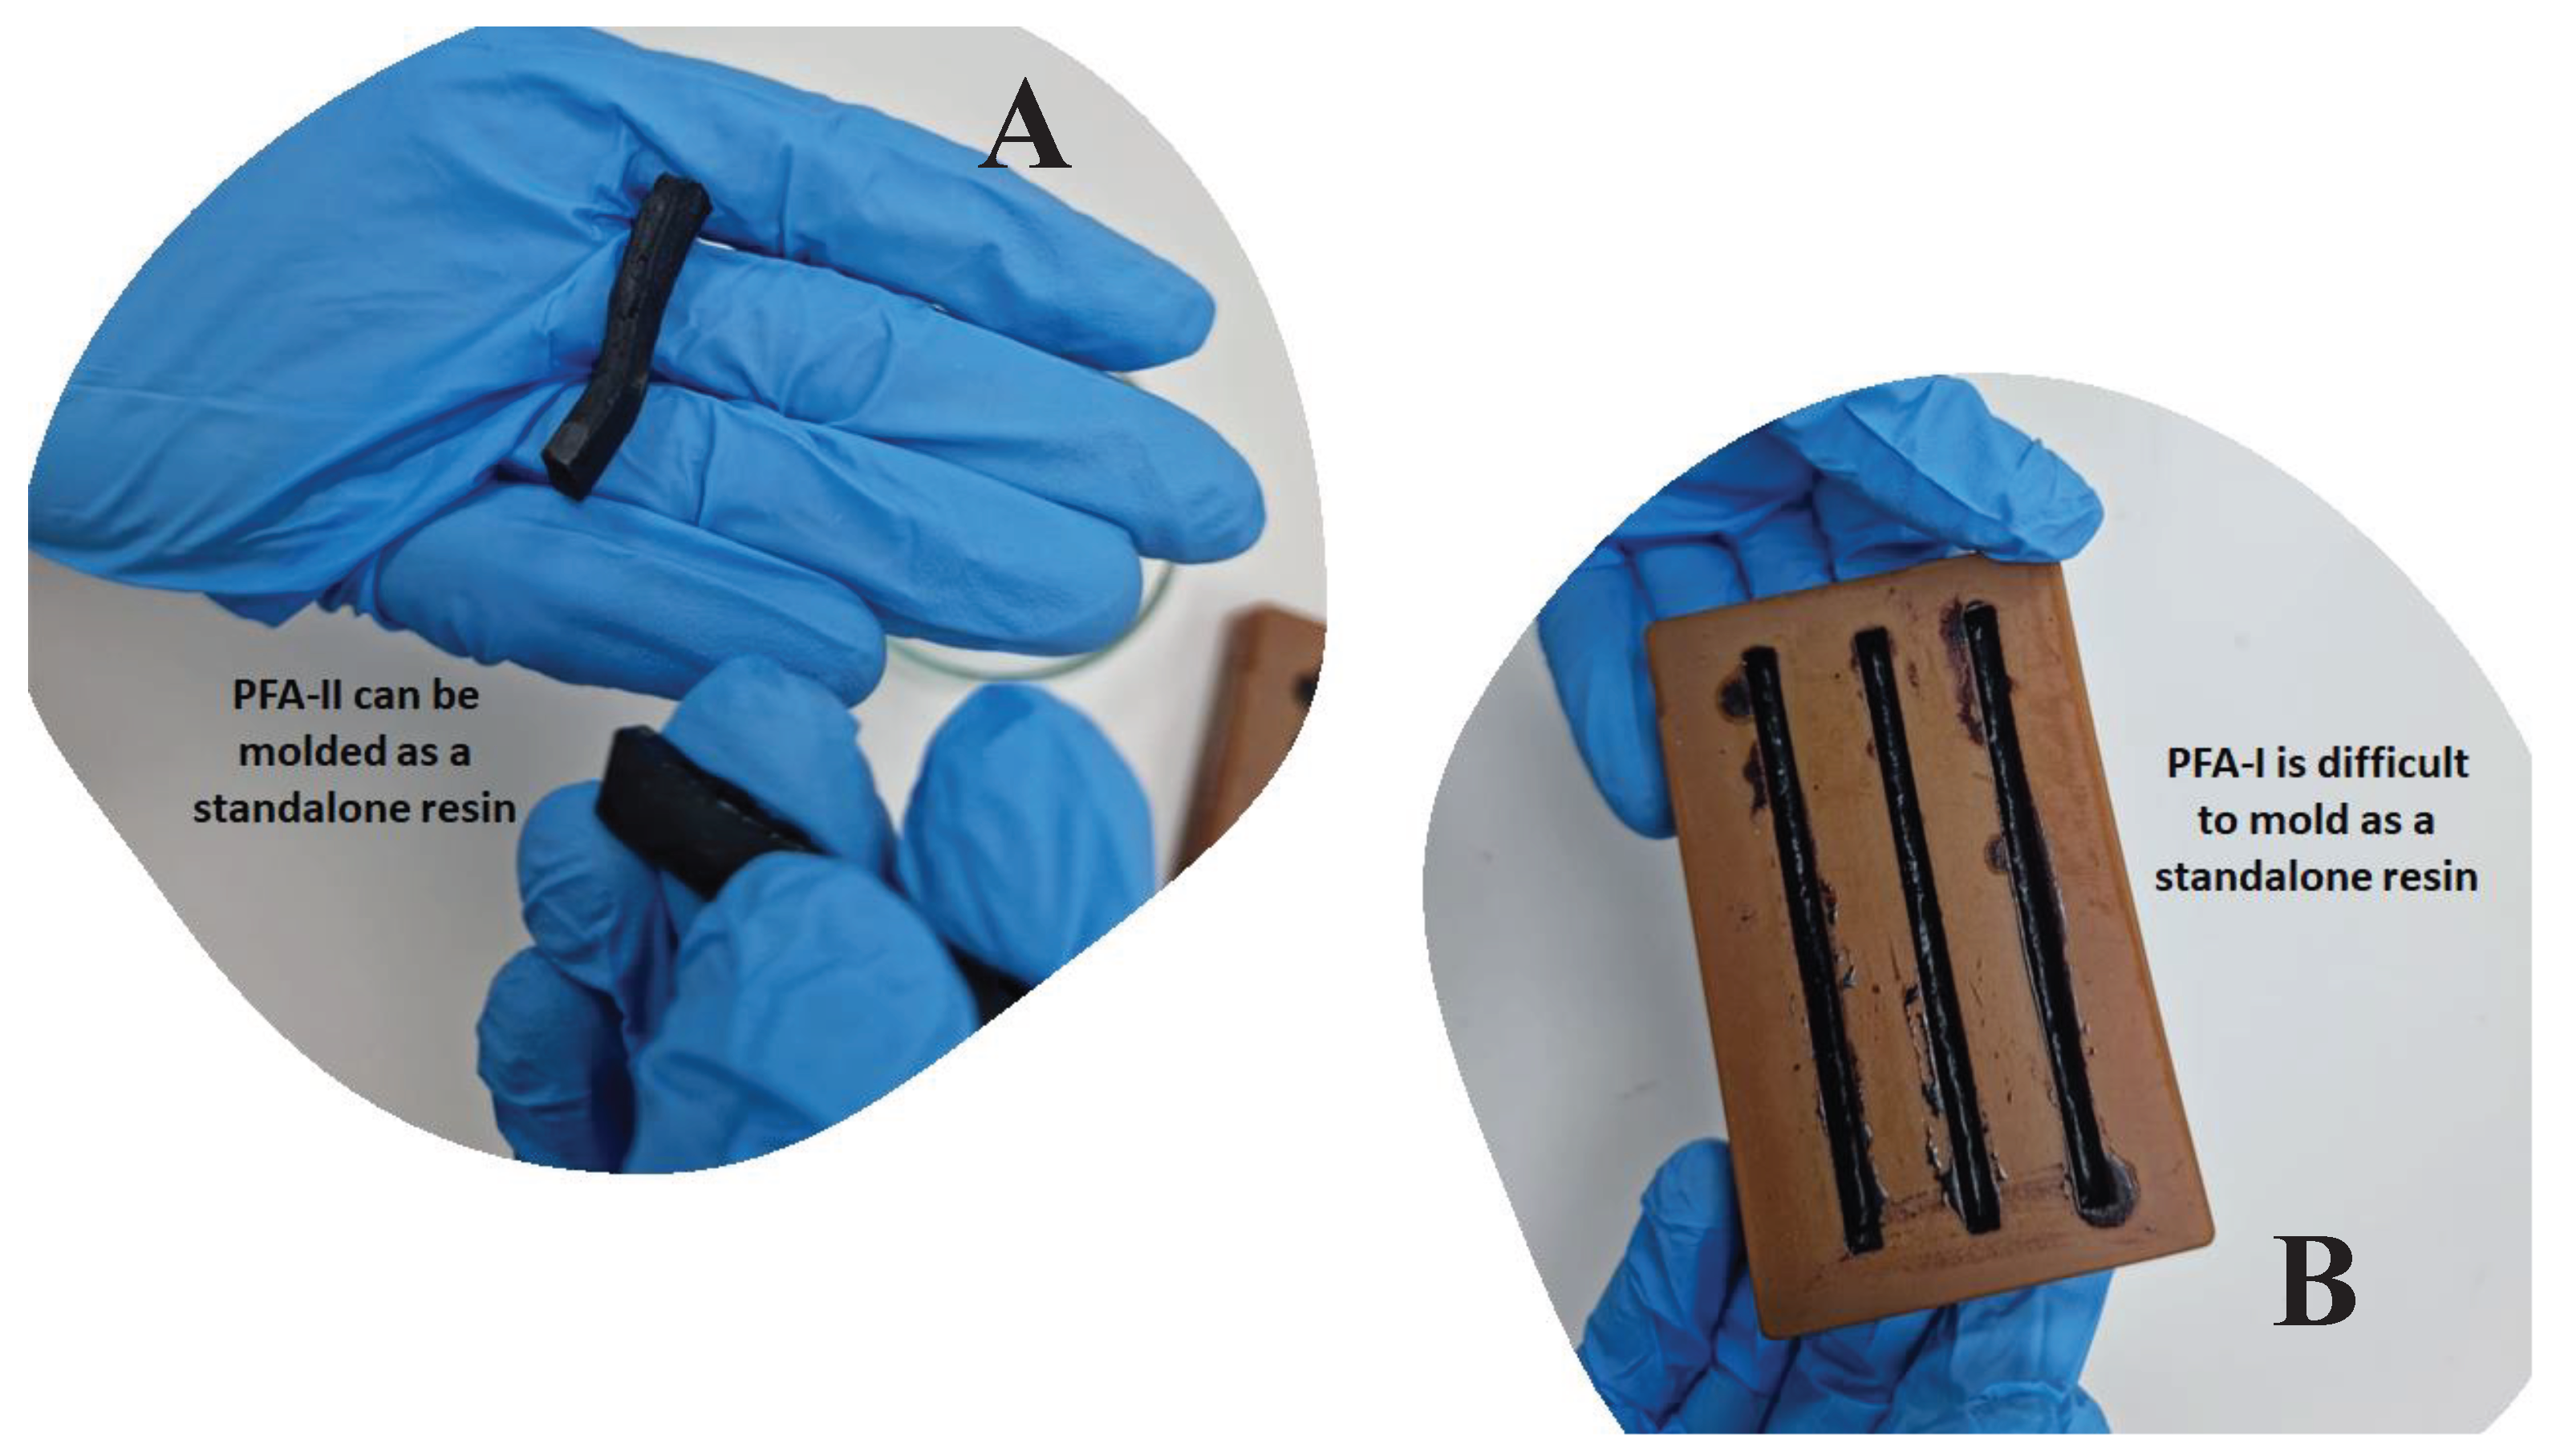
Regarding processability, the enhanced Mw of PFA-II offered a range of merits, including ease of mouldability resulting from improved flow properties, as shown in Figure 9. PFA-I exhibited lower melt viscosity than PFA-II; moreover, it was observed that the PFA-II showed a shorter cooling time, enhanced dimensional stability, and reduced warpage. Therefore, as expected, the high molecular weight enhancement.

4. Structural Elucidation

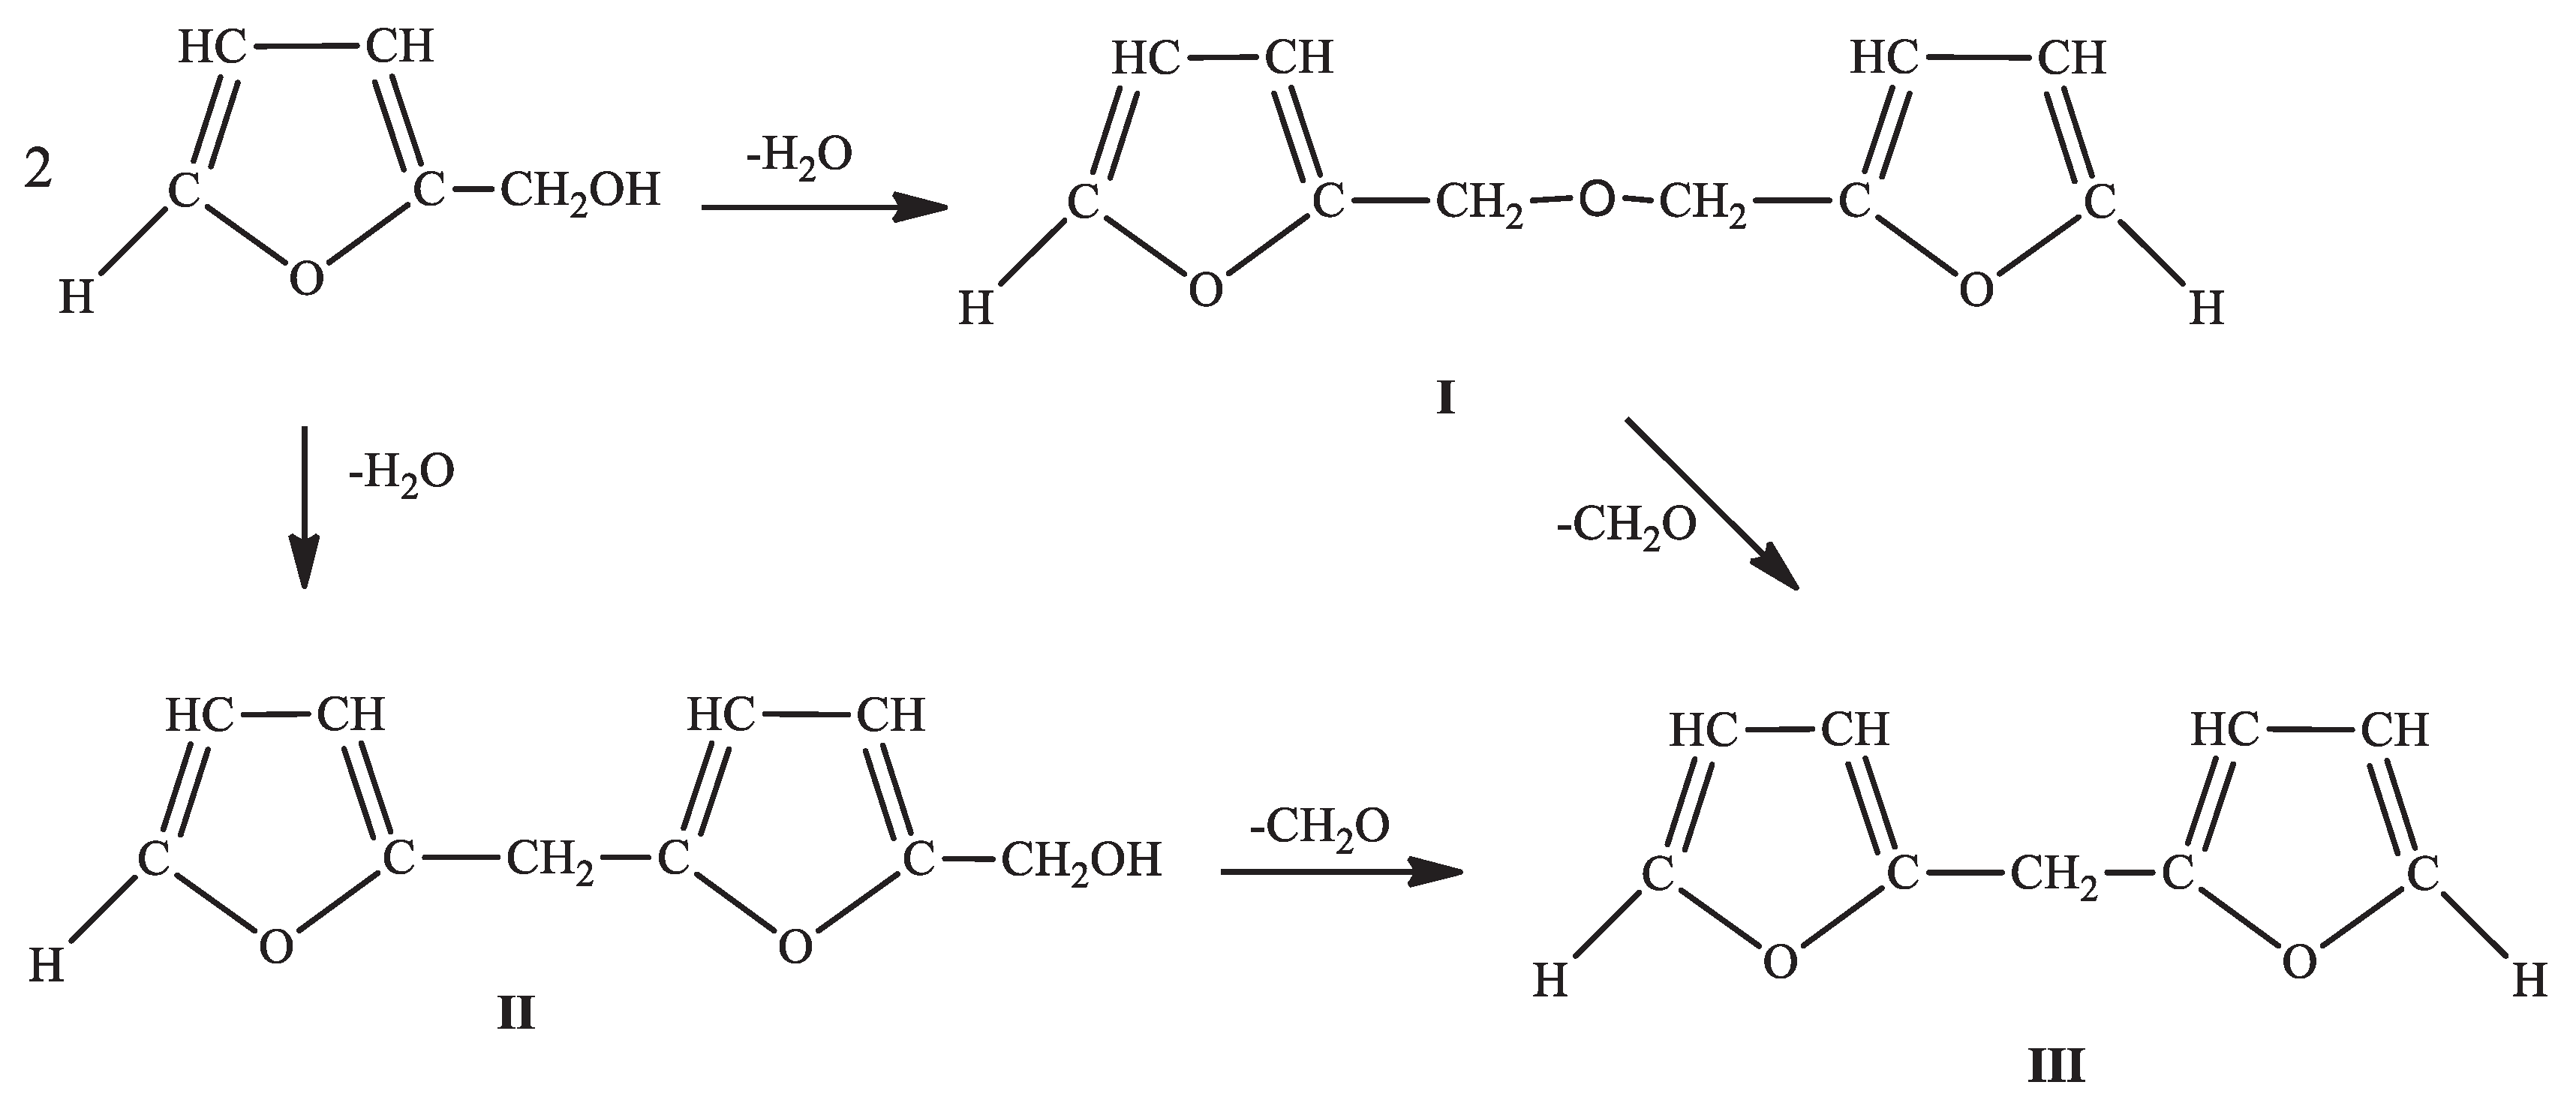
FA possesses characteristics of a bifunctional monomer, particularly in the early polymerisation stages, as depicted in Scheme 1 [1,2,3,4]. Consequently, FA can transition from a simple bifunctional system to a multifunctional system, encompassing a mixture of reaction species, thereby enabling the formation of a wide range of complex polymeric systems [4,13,15]. As a result, predicting the specific functional groups that emerge during the resinification of FA to PFA becomes exceedingly challenging. This challenge has contributed to divergent observations and reports in the literature regarding the kinetics, mechanisms, and structure of PFA resins [10,39]. Intermolecular dehydration emerges as the predominant process in the initial FA to PFA resinification stages, irrespective of the reaction conditions [1,2,10]. This process involves the formation of furfuryl ether to some extent (I) [2]. However, dehydration occurs via the condensation between the hydroxyl group of one alcohol molecule and the labile α-hydrogen atom of another, producing 5-furfuryl furfuryl alcohol (II) [2,40]. Additionally, a chemical compound known as di-2-furyl methane (III) has been isolated, albeit in relatively small quantities, and is presumed to originate from the thermal decomposition of I or II. Formaldehyde has also been identified as part of the complex reaction mixture and is known to participate in the crosslinking of PFA into a thermoset [1,2,10,40].
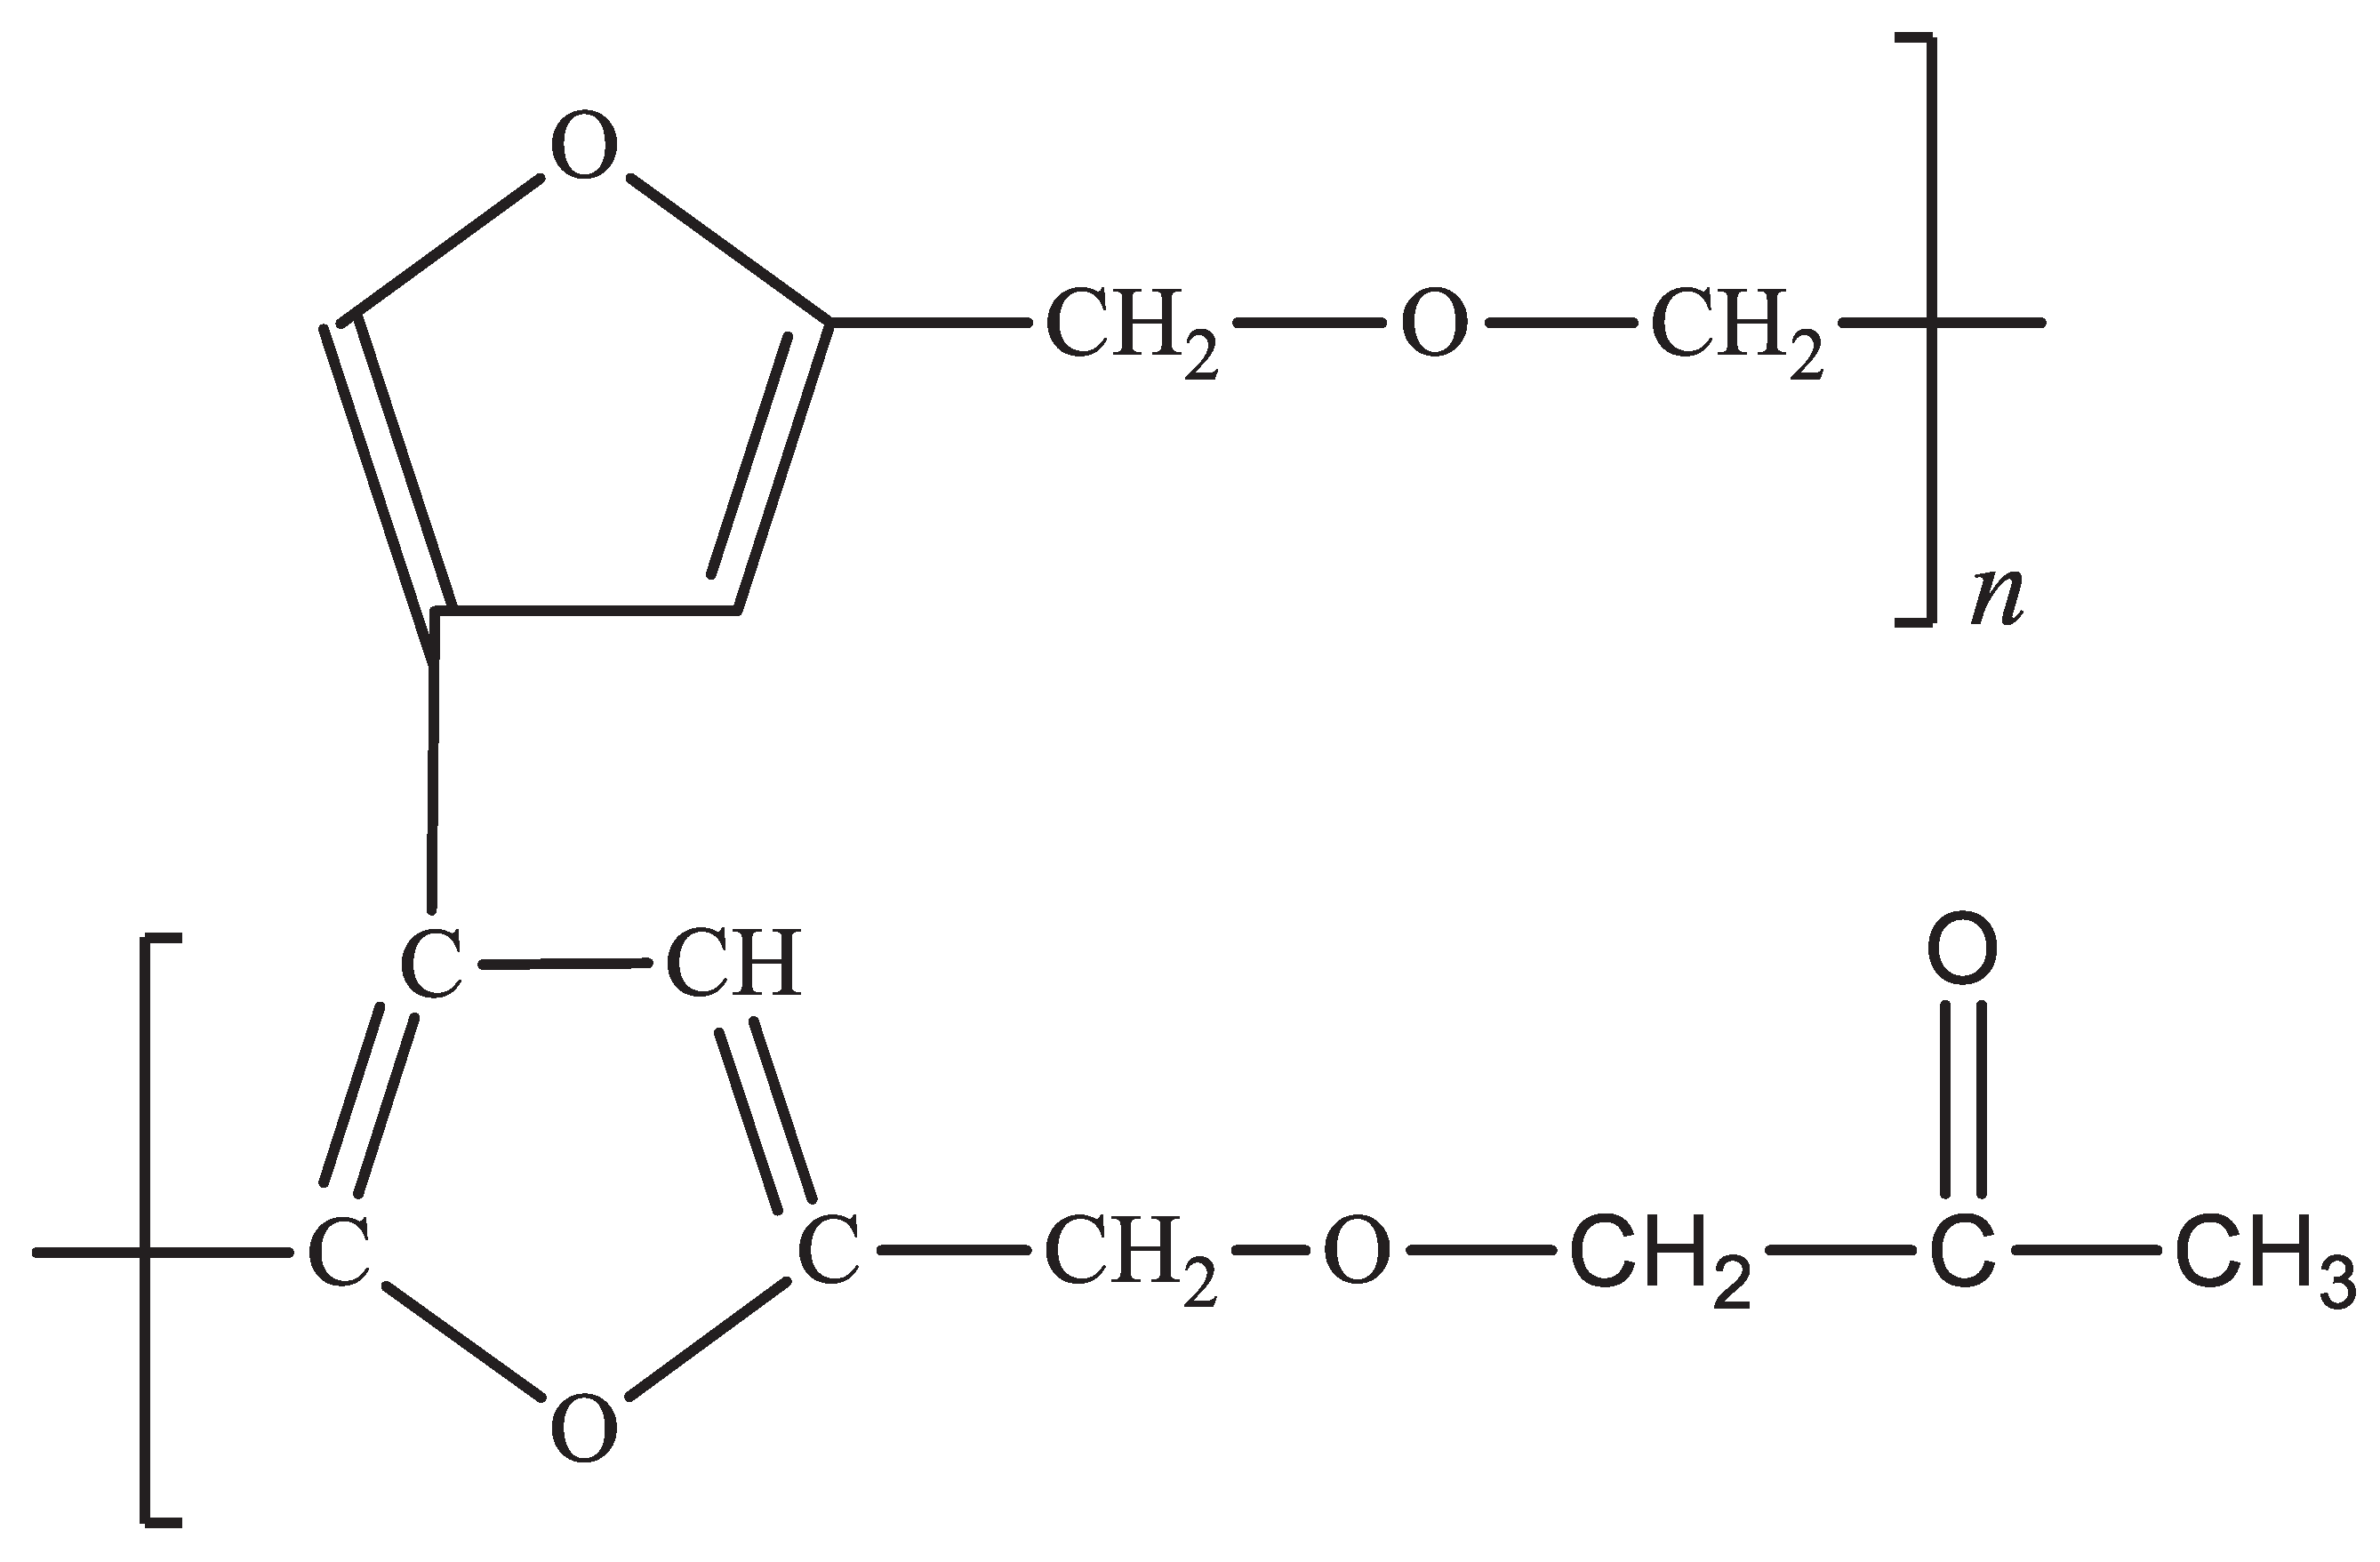
We therefore propose the following structure in Figure 10 for PFA-I and Figure 11 for PFA-II. The heterogeneity of simple molecules in the backbone of the PFA-II polymer could account for the ease of processability and improved shelf life due to less reactive furan rings, given that the furanic ring is very reactive and can even initiate self-catalysation leading to gelation or self-crosslinking [2,41,42].

5. Conclusion

In embracing bio-derived hydrocarbons, we chart a course toward a sustainable and low-carbon future. This work marks a substantial breakthrough in furan chemistry by achieving the synthesis of high-molecular-weight polyfurfuryl alcohol (PFA) resin (Mw = 118,959 g/mol) from furfuryl alcohol (FA) using a novel co-catalytic system. This approach surpasses the limitations of conventional single-catalyst methods, paving the way for sustainable and efficient production of high-performance PFA materials.
The co-catalytic system not only elevates the molecular weight of the PFA resin but also ensures excellent shelf life and broad applicability. The resulting material holds promise as a standalone moulded material or a valuable component in composites, coatings, adhesives, and even nanostructured carbons.

6. Prospect

Future research on furfuryl alcohol resins should prioritise sustainable advancements and eco-friendly processes. For example, exploring alternative milder acids beyond hydrochloric acid.

Supplementary Materials

The following supporting information can be downloaded at the website of this paper posted on Preprints.org.

Author Contributions

Conceptualization, Austine Ofondu Iroegbu; Methodology, Austine Ofondu Iroegbu; Software, Austine Ofondu Iroegbu; Validation, Austine Ofondu Iroegbu; Investigation, Austine Ofondu Iroegbu; Writing – original draft, Austine Ofondu Iroegbu; Writing – review & editing, Austine Ofondu Iroegbu and Reinout Meijboom; Supervision, Reinout Meijboom; Funding acquisition, Reinout Meijboom.

Institutional Review Board Statement

Not applicable.

Informed Consent Statement

Not applicable.

Data Availability Statement

The data presented in this study are available on request from the corresponding author.

Acknowledgments

The authors would like to acknowledge Susanne Tanner, Martin Luther University Halle-Wittenberg, for GPC/SEC, MALDI-TOF, and NMR-DOSY characterisation. We also acknowledge Lesego Maubane and Sharon Eggers for the Thermal and SEM characterisation, respectively. AOCI and RM would like to acknowledge the financial support from the University of Johannesburg, South Africa.

Conflict of Interests

The authors declare no conflicts of interest.

References

  1. Dunlop, A. P.; Peters, F. N. The Nature of Furfuryl Alcohol. Ind Eng Chem 1942, 34, 814–817. [Google Scholar] [CrossRef]
  2. Dunlop, A. P.; Peters, F. N. The Furans; Reinhold Publishing Corporation: United States, 1953. [Google Scholar]
  3. Conley, R. T.; Metil, I. An Investigation of the Structure of Furfuryl Alcohol Polycondensates with Infrared Spectroscopy. J Appl Polym Sci 1963, 7, 37–52. [Google Scholar] [CrossRef]
  4. Iroegbu, A. O.; Hlangothi, S. P. Effects of the Type of Catalyst on the Polymerisation Mechanism of Furfuryl Alcohol and Its Resultant Properties. Chemistry Africa 2018, 1, 187–197. [Google Scholar] [CrossRef]
  5. Hirasaki, T.; Meguro, T.; Wakihara, T.; Tatami, J.; Komeya, K. Effect of Ultrasonic Irradiation in the Polymerization of Furfuryl Alcohol, with Ethylene Glycol as a Pore-Forming Agent, on the Microstructure of the Derived Carbons. Carbon N Y 2008, 46, 1630. [Google Scholar] [CrossRef]
  6. Hoshi, K.; Akatsu, T.; Tanabe, Y.; Yasuda, E. Curing Properties of Furfuryl Alcohol Condensate with Carbonaceous Fine Particles under Ultrasonication. Ultrason Sonochem 2001, 8, 89–92. [Google Scholar] [CrossRef] [PubMed]
  7. Batista, P. dos S.; de Souza, M. F. Furfuryl Alcohol Polymerisation inside Capillaries. Synth Met 1999, 101, 635–636. [Google Scholar] [CrossRef]
  8. Barr, J. B.; Wallon, S. B. The Chemistry of Furfuryl Alcohol Resins. J Appl Polym Sci 1971, 15, 1079–1090. [Google Scholar] [CrossRef]
  9. Ünver, H.; Öktem, Z. Controlled Cationic Polymerization of Furfuryl Alcohol. Eur Polym J 2013, 49, 1023–1030. [Google Scholar] [CrossRef]
  10. Choura, M.; Belgacem, N. M.; Gandini, A. Acid-Catalyzed Polycondensation of Furfuryl Alcohol: Mechanisms of Chromophore Formation and Cross-Linking. Macromolecules 1996, 29, 3839–3850. [Google Scholar] [CrossRef]
  11. Rathi, A. K. A.; Chanda, M. Kinetics of Resinification of Furfuryl Alcohol in Aqueous Solution. J Appl Polym Sci 1974, 18, 1541–1548. [Google Scholar] [CrossRef]
  12. Krishnan, T. A.; Chanda, M. Kinetics of Polymerisation of Furfuryl Alcohol in Aqueous Solution. Die Angewandte Makromolekulare Chemie 1975, 43, 145–156. [Google Scholar] [CrossRef]
  13. Wewerka, E. M. Study of the γ-Alumina Polymerization of Furfuryl Alcohol. J Polym Sci A1 1971, 9, 2703–2715. [Google Scholar] [CrossRef]
  14. Hronec, M.; Fulajtárová, K.; Soták, T. Kinetics of High Temperature Conversion of Furfuryl Alcohol in Water. Journal of Industrial and Engineering Chemistry 2014, 20, 650–655. [Google Scholar] [CrossRef]
  15. Conley, R. T.; Metil, I. An Investigation of the Structure of Furfuryl Alcohol Polycondensates with Infrared Spectroscopy. J Appl Polym Sci 1963, 7, 37–52. [Google Scholar] [CrossRef]
  16. Kim, T.; Jeong, J.; Rahman, M.; Zhu, E.; Mahajan, D. Characterizations of Furfuryl Alcohol Oligomer/Polymerization Catalyzed by Homogeneous and Heterogeneous Acid Catalysts. Korean Journal of Chemical Engineering 2014, 31, 2124–2129. [Google Scholar] [CrossRef]
  17. Wewerka, E. M. An Investigation of the Polymerization of Furfuryl Alcohol with Gel Permeation Chromatography. J Appl Polym Sci 1968, 12, 1671–1681. [Google Scholar] [CrossRef]
  18. Ruelens, W.; Koolen, G.; Gricourt, B.; Willem van Vuure, A.; Smet, M. Co-Polymerisation of Furfuryl Alcohol for Furan Resins with Increased Toughness. Mater Lett 2022, 328, 133025. [Google Scholar] [CrossRef]
  19. Reyhani, A.; Allison-Logan, S.; Ranji-Burachaloo, H.; McKenzie, T. G.; Bryant, G.; Qiao, G. G. Synthesis of Ultra-high Molecular Weight Polymers by Controlled Production of Initiating Radicals. J Polym Sci A Polym Chem 2019, 57, 1922–1930. [Google Scholar] [CrossRef]
  20. Bai, Y.; He, J.; Zhang, Y. Ultra-High-Molecular-Weight Polymers Produced by the Immortal Phosphine-Based Catalyst System. Angewandte Chemie 2018, 130, 17476–17480. [Google Scholar] [CrossRef]
  21. Charles, E. Carraher Jr. Carraher’s Polymer Chemistry, 10th ed.; Taylor & Francis Group, LLC: Boca Raton, FL, United States, 2018. [Google Scholar]
  22. Billmeyer, F. W. Textbook of Polymer Science, 3rd ed.; Wiley-VCH: New York, 1962. [Google Scholar]
  23. KIM, Y.; PARK, H.; LEE, Y. Gas Separation Properties of Carbon Molecular Sieve Membranes Derived from Polyimide/Polyvinylpyrrolidone Blends: Effect of the Molecular Weight of Polyvinylpyrrolidone. J Memb Sci 2005, 251, 159–167. [Google Scholar] [CrossRef]
  24. Tsai, J.-S.; Lin, C.-H. The Effect of Molecular Weight on the Cross Section and Properties of Polyacrylonitrile Precursor and Resulting Carbon Fiber. J Appl Polym Sci 1991, 42, 3045–3050. [Google Scholar] [CrossRef]
  25. Morris, E. A.; Weisenberger, M. C.; Bradley, S. B.; Abdallah, M. G.; Mecham, S. J.; Pisipati, P.; McGrath, J. E. Synthesis, Spinning, and Properties of Very High Molecular Weight Poly(Acrylonitrile-Co-Methyl Acrylate) for High Performance Precursors for Carbon Fiber. Polymer (Guildf) 2014, 55, 6471–6482. [Google Scholar] [CrossRef]
  26. Iroegbu, A. O. C.; Ray, S. S. Bamboos: From Bioresource to Sustainable Materials and Chemicals. Sustainability (Switzerland) 2021, 13, 12200. [Google Scholar] [CrossRef]
  27. Iroegbu, A. O. C.; Ray, S. S. Biorenewables: Properties and Functions in Materials Application. In ACS Symposium Series; Pathania, D., Singh, L., Eds.; ACS Symposium Series, 2022; Vol. 1, pp 129–161. [CrossRef]
  28. Schmitt, C. R. Polyfurfuryl Alcohol Resins. Polym Plast Technol Eng 1974, 3, 121–158. [Google Scholar] [CrossRef]
  29. Wewerka, E. M.; Loughran, E. D.; Walters, K. L. A Study of the Low Molecular Weight Components of Furfuryl Alcohol Polymers. J Appl Polym Sci 1971, 15, 1437–1451. [Google Scholar] [CrossRef]
  30. Brian, C. Smith. Fundamentals of Fourier Transform Infrared Spectroscopy; Taylor and Francis Group, LLC: Boca Raton, FL, USA, 2011. [Google Scholar]
  31. Tondi, G.; Cefarin, N.; Sepperer, T.; D’Amico, F.; Berger, R. J. F.; Musso, M.; Birarda, G.; Reyer, A.; Schnabel, T.; Vaccari, L. Understanding the Polymerization of Polyfurfuryl Alcohol: Ring Opening and Diels-Alder Reactions. Polymers (Basel) 2019, 11, 2126. [Google Scholar] [CrossRef]
  32. D’Amico, F.; Musso, M. E.; Berger, R. J. F.; Cefarin, N.; Birarda, G.; Tondi, G.; Bertoldo Menezes, D.; Reyer, A.; Scarabattoli, L.; Sepperer, T.; Schnabel, T.; Vaccari, L. Chemical Constitution of Polyfurfuryl Alcohol Investigated by FTIR and Resonant Raman Spectroscopy. Spectrochim Acta A Mol Biomol Spectrosc 2021, 262, 120090. [Google Scholar] [CrossRef] [PubMed]
  33. Schmitt, C. R. Polyfurfuryl Alcohol Resins. Polym Plast Technol Eng 1974, 3, 121–158. [Google Scholar] [CrossRef]
  34. Wang, Z.; Lu, Z.; Huang, X.; Xue, R.; Chen, L. Chemical and Crystalline Structure Characterizations of Polyfurfuryl Alcohol Pyrolyzed at 600 °C. Carbon N Y 1998, 36, 51–59. [Google Scholar] [CrossRef]
  35. Guigo, N.; Mija, A.; Zavaglia, R.; Vincent, L.; Sbirrazzuoli, N. New Insights on the Thermal Degradation Pathways of Neat Poly(Furfuryl Alcohol) and Poly(Furfuryl Alcohol)/SiO2 Hybrid Materials. Polym Degrad Stab 2009, 94, 908–913. [Google Scholar] [CrossRef]
  36. Ahmad, E. E. M.; Luyt, A. S.; Djoković, V. Thermal and Dynamic Mechanical Properties of Bio-Based Poly(Furfuryl Alcohol)/Sisal Whiskers Nanocomposites. Polymer Bulletin 2013, 70, 1265–1276. [Google Scholar] [CrossRef]
  37. Chuang, I. S.; Gary E., Maciel; George, E. Myers. Carbon-13 NMR Study of Curing in Furfuryl Alcohol Resins. Macromolecules 1984, 17, 1087–1090. [Google Scholar] [CrossRef]
  38. Barr, J. B.; Wallon, S. B. The Chemistry of Furfuryl Alcohol Resins. J Appl Polym Sci 1971, 15, 1079–1090. [Google Scholar] [CrossRef]
  39. D’Amico, F.; Musso, M. E.; Berger, R. J. F.; Cefarin, N.; Birarda, G.; Tondi, G.; Bertoldo Menezes, D.; Reyer, A.; Scarabattoli, L.; Sepperer, T.; Schnabel, T.; Vaccari, L. Chemical Constitution of Polyfurfuryl Alcohol Investigated by FTIR and Resonant Raman Spectroscopy. Spectrochim Acta A Mol Biomol Spectrosc 2021, 262, 120090. [Google Scholar] [CrossRef]
  40. Gandini, A.; M. Lacerda, T. Furan Polymers: State of the Art and Perspectives. Macromol Mater Eng 2022, 307, 2100902. [Google Scholar] [CrossRef]
  41. Iroegbu, A. O. C.; Ray, S. S. On the Chemistry of Furfuryl Alcohol Polymerization: A Review. Journal of Polymer Science 2023. [Google Scholar] [CrossRef]
  42. Iroegbu, A. O.; Hlangothi, S. P. Furfuryl Alcohol a Versatile, Eco-Sustainable Compound in Perspective. Chemistry Africa 2019, 2, 223–239. [Google Scholar] [CrossRef]
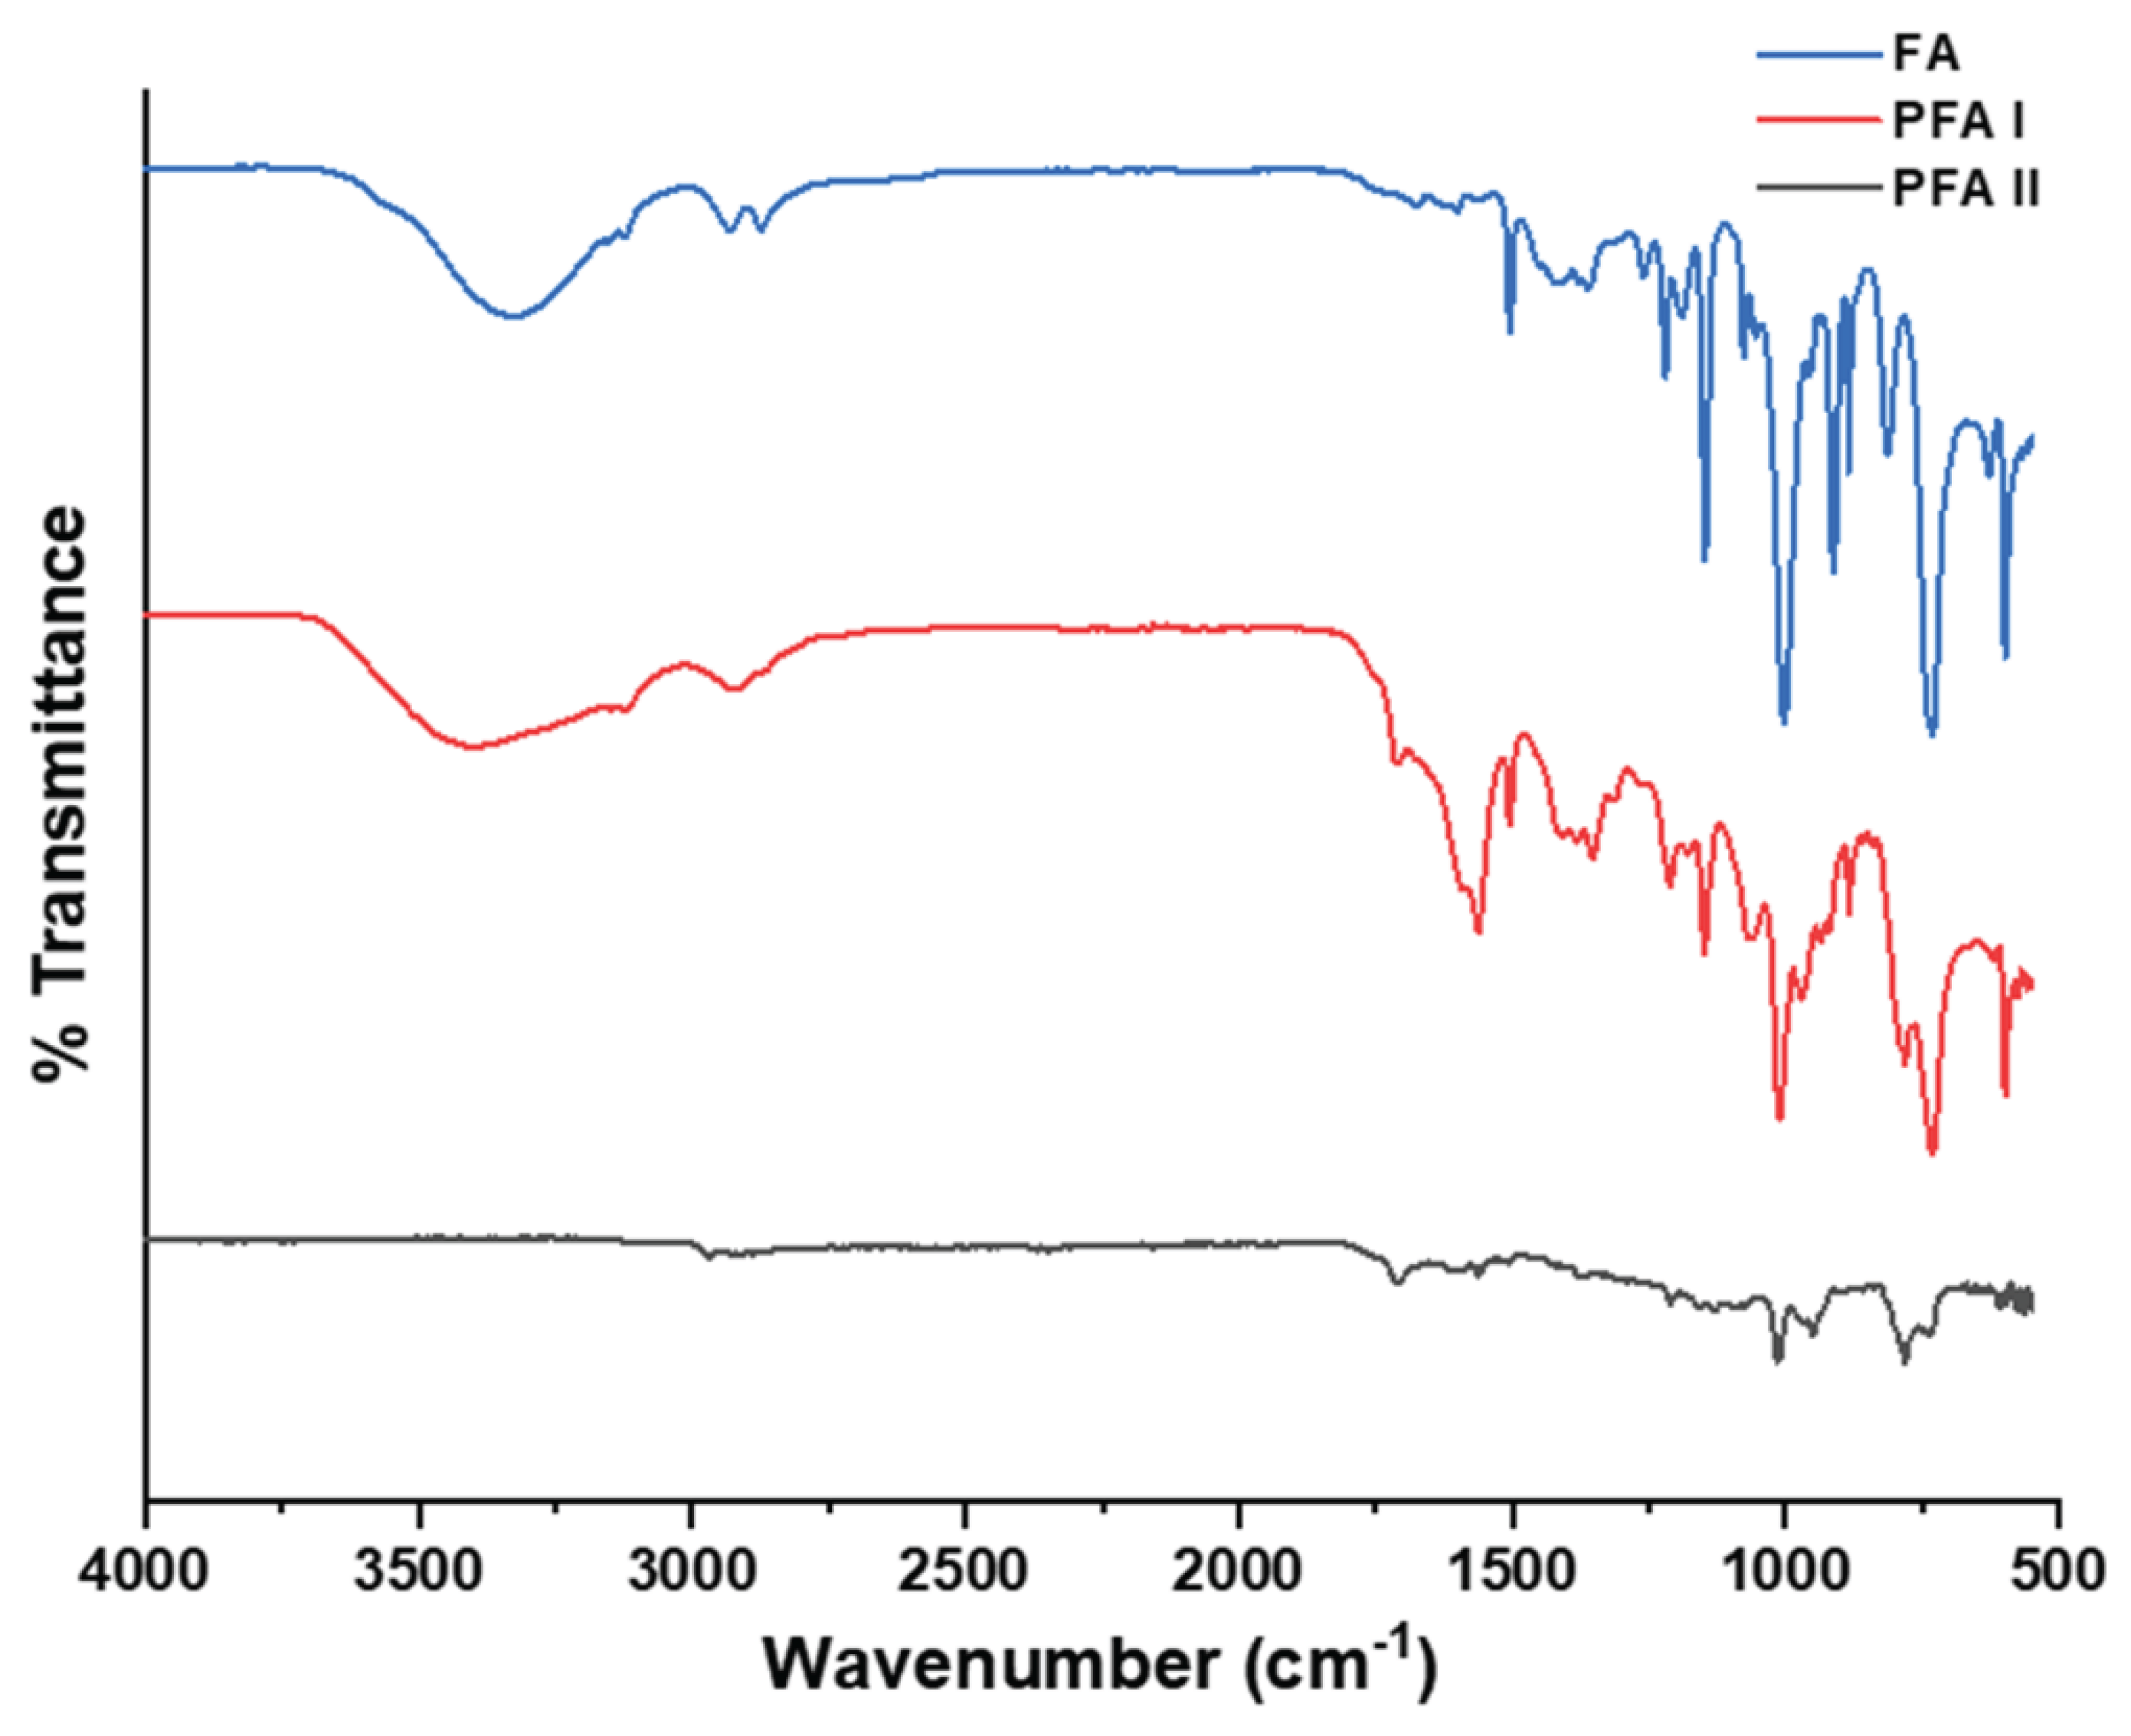
Figure 1. FTIR Spectra of FA (blue), PFA-I (Red), and PFA-II (greyish).
Preprints 103428 g001
Figure 2. TG/DTG curves for PFA-I (A) and PFA-II (B).
Preprints 103428 g002
Figure 3. DSC curves for PFA-I (A) and PFA-II (B).
Preprints 103428 g003
Figure 4. SEM micrographs of PFA-I (A) and PFA-II.
Preprints 103428 g004
Figure 5. 1H-NMR stacked spectra of FA, PFA-II, and PFA-III.
Preprints 103428 g005
Figure 6. 13C-NMR spectra of stacked FA, PFA-II, and PFA-II.
Preprints 103428 g006
Figure 7. DOSY spectra of stacked FA, PFA-I, and PFA-II.
Preprints 103428 g007
Figure 8. Macroscopical appearance of PFA-I and PFA-II after gradually heating in the oven @ 200 °C for 8 hours.
Preprints 103428 g008
Figure 9. High molecular weight offers several advantages regarding moldability and processability. PFA-II (A) is easily moldable, unlike PFA-I (B).
Preprints 103428 g009
Figure 10. Proposed structure of PFA-I with higher furanic system, regularity but lower Mw.
Preprints 103428 g010
Figure 11. Proposed structure of PFA-II with lesser furanic backbone, highly irregular chain, increased chain packing and high Mw.
Preprints 103428 g011
Scheme 1. Early stages of FA resinification to PFA [2,4].
Preprints 103428 sch001
Table 1. Summary of the GC/SEC results.
Samples
PFA-I PFA-II
Reaction condition Refluxed without acetic acid for 72 hours Refluxed with Acetic Acid for 72 hours
Mn (g/mol) 1 917 1 783
Mw (g/mol) 26 494 118 959
Polydispersity Index (PDI) 13 822 66 729
Disclaimer/Publisher’s Note: The statements, opinions and data contained in all publications are solely those of the individual author(s) and contributor(s) and not of MDPI and/or the editor(s). MDPI and/or the editor(s) disclaim responsibility for any injury to people or property resulting from any ideas, methods, instructions or products referred to in the content.
Copyright: This open access article is published under a Creative Commons CC BY 4.0 license, which permit the free download, distribution, and reuse, provided that the author and preprint are cited in any reuse.
Prerpints.org logo

Preprints.org is a free preprint server supported by MDPI in Basel, Switzerland.

Subscribe

© 2024 MDPI (Basel, Switzerland) unless otherwise stated