1. Introduction
The behavior of soil is highly time-dependent. The time-dependence of soil results in long-term ground settlement/deformation, which threatens the safety and serviceability of the buildings/ structures built in/on it, especially when the foundation is predominantly cohesive soils.
In previous studies [
1,
2,
3,
4,
5,
6,
7,
8,
9,
10,
15,
16,
17,
18,
19,
20,
28,
29,
31], undisturbed and reconstituted soil samples were tested to investigate their creep behaviors under different loading paths and stress levels, etc. Also, influential factors, such as temperature and strain rate, were identified [
11,
12,
13,
14]. Wang et al. [
15], Zeng et al. [
16], and Wu et al. [
17] conducted one-dimensional consolidation compression tests on different types of reconstituted soils. The results showed that the secondary consolidation deformation of soil samples was affected by different stress levels, void ratios of soil samples, and void ratios corresponding to liquid limits. Luo et al. [
18] conducted one-dimensional compression and triaxial compression tests on soft soil to explore the development law of soil deformation with time under different stress paths, drainage conditions, and stress levels, and then they established a Merchant model with fractional derivatives. Chen et al. [
19] conducted creep tests of marine-continental sedimentary soft soil under different loading paths, and studied the influence of pre-consolidation on the mechanical properties of soil samples. Zhou [
20] carried out triaxial shear creep tests on the undisturbed and reconstituted saturated clay samples in Hangzhou City under different deviatoric stress levels. It was found that the creep of the undisturbed soil sample was greater than that of reconstituted soil under the same deviatoric stress level, and the creep development time was longer, indicating that the soil structure affected its creep behaviors. Various empirical creep models were proposed to describe the rheological behaviors of cohesive soils [
21,
22,
23,
24,
25,
26,
27,
28]. For example, Yin [
25] proposed a widely employed logarithmic empirical model based on laboratory one-dimensional compression triaxial tests, and Singh et al. [
26] proposed a power function model. Mesri et al. [
27] proposed a modified Singh-Mitchell model. Xiao et al. [
28] proposed an empirical hyperbolic creep model based on the triaxial shear creep test of saturated clay in Hangzhou City, with a clear physical meaning of parameters and a good fitting effect. These studies demonstrate that laboratory tests are effective in studying the creep behaviors of soil, and it is of great value to establish the creep models through the creep tests under deviatoric stress conditions to guide the project construction.
The above studies show that although there have been many relevant results on creep properties of cohesive soil, the influence of loading steps under some specific loading path that may be related to the construction schedule and management is rarely involved. The relevant research results were also reported in the Proceedings of China-Europe Conference on Geotechnical Engineering [
29]. The study of Teresa M. Bodas Freitas et al. [
30] pointed out that a pre-loading on foundation or embankment may cause an increase in the undrained strength of the soil, but its influence on soil displacement is not clarified. Therefore, the time-dependent deformation characteristics of soil under different loading paths need to be further studied. The study of time-dependent deformation characteristics of soil under different loading paths is also the basis for investigating the soil creep model and its application. In this paper, the triaxial isotropic compression creep test and triaxial shear creep test under different pre-loading steps are performed on the silty clay in the Taizhou area. The time-dependent deformation characteristics of silty clay under different loading paths and the influence of grading loading are studied. The empirical model suitable for describing the creep behaviors of silty clay is discussed, and the distribution law and value suggestion of model parameters are further analyzed, which provides a basis for the deformation calculation of silty clay foundation.
2. Soil Characteristics and Specimen Preparation
The soil samples were taken from an excavation site in Taizhou located in Hangzhou Bay area of China, with depths between 20.0 m and 25.0 m. The characteristics of soil samples are given in
Table 1, and the soil is classified as silty clay according to GB/50007 or as low liquid-limit clay according to GB/T50145. The undisturbed soil samples are in a plastic state, and the specimens are reconstituted for tests in this study..
The tests are performed on cylindrical specimens with a diameter of 38 mm and a height of 78 mm, which are dynamically compacted in nine layers on the base of the triaxial cell. The specimens are prepared by the moist tamping method (dynamic compaction) [
12] to achieve better uniformity. Before testing, the specimens are pre-saturated by the vacuum saturation method. A back pressure of
uB=250 kPa is used in all tests to ensure full saturation of the soil specimens.
3. Test Program and Procedure
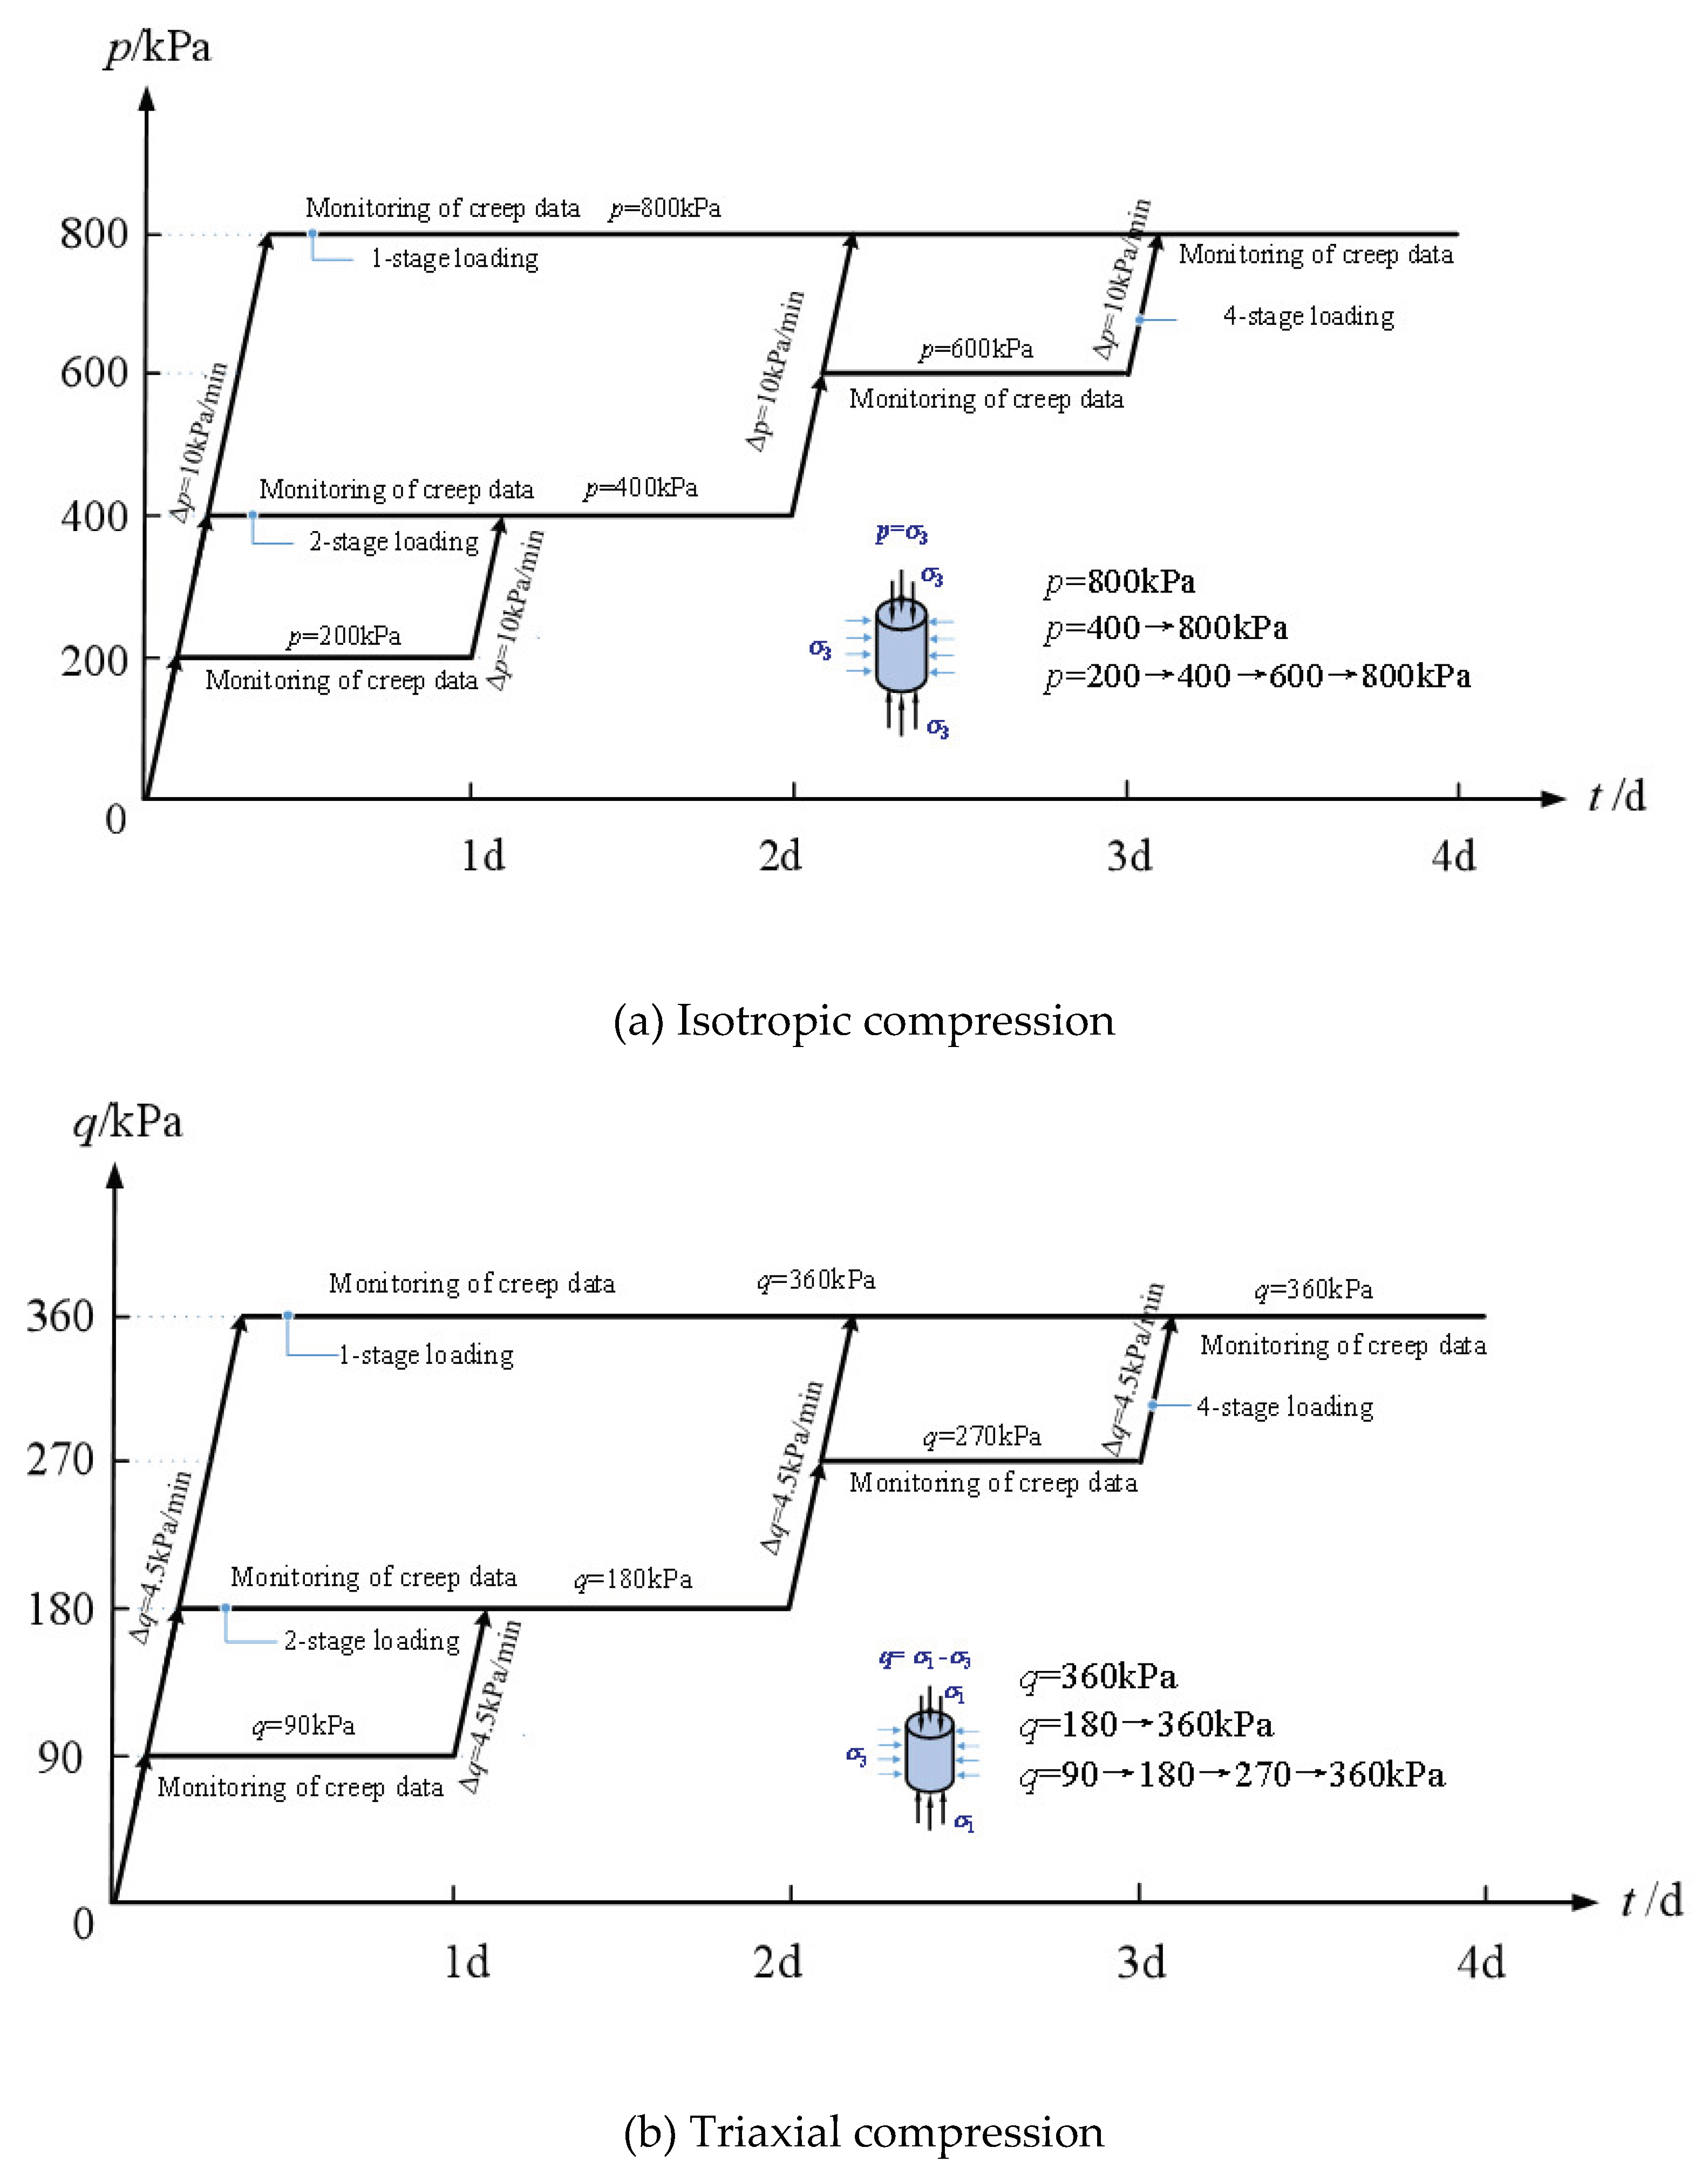
The primary objective of this study is to investigate the influence of pre-loading steps on the time-dependent deformation behavior of silty clay through a defined testing program. The reconstituted soil samples are tested under two loading paths: isotropic compression and triaxial shear creep tests, with all tests being conducted under drained conditions.
For the isotropic compression tests, the saturated specimens are compressed at a constant pressure rate of
Δp=10 kPa/min to the hydraulic pressure of
p=800 kPa. The stresses are applied in three different steps:
Δp=0→800kPa,
Δp=0→400→800kPa, and
Δp=0→200→400→ 600→800kPa. For each test, the hydraulic pressure is kept constant at
p=800 kPa for 96 h. The loading plan of the isotropic compression tests is shown in
Figure 1(a). At the end of the above processes, the specimens are all sheared to failure at a constant pressure rate of
Δq=4.5 kPa/min under undrained conditions.
For the triaxial compression tests, the saturated specimens are firstly consolidated under the all-around pressure of
p=800 kPa. Then, after the excess pore water pressure dissipates, they are vertically compressed at a constant pressure rate of
Δq=4.5 kPa/min to
q=
σ1-σ3=360 kPa. The deviatoric stresses are applied in three different steps:
Δq= Δσ1-Δσ3=0→360 kPa (96 h),
Δq=0→180 (48 h)→360 kPa (48 h), and
Δq= 0→90 (24 h)→180 (24 h)→270 (24 h) →360 kPa (24 h). The loading plan of the triaxial compression tests is displayed in
Figure 1(b). At the end of the above processes, the specimens are also sheared to failure at a constant pressure rate of
Δq = 4.5 kPa/min under undrained triaxial conditions.
All tests are performed in the GDS servo-controlled triaxial testing system. The laboratory temperature is controlled at 23±1°C throughout the testing to eliminate its influence on test results.
4. Creep under Total Stresses
4.1. Effect of Pre-Loading Steps on Silty Clay under Isotropic Compression
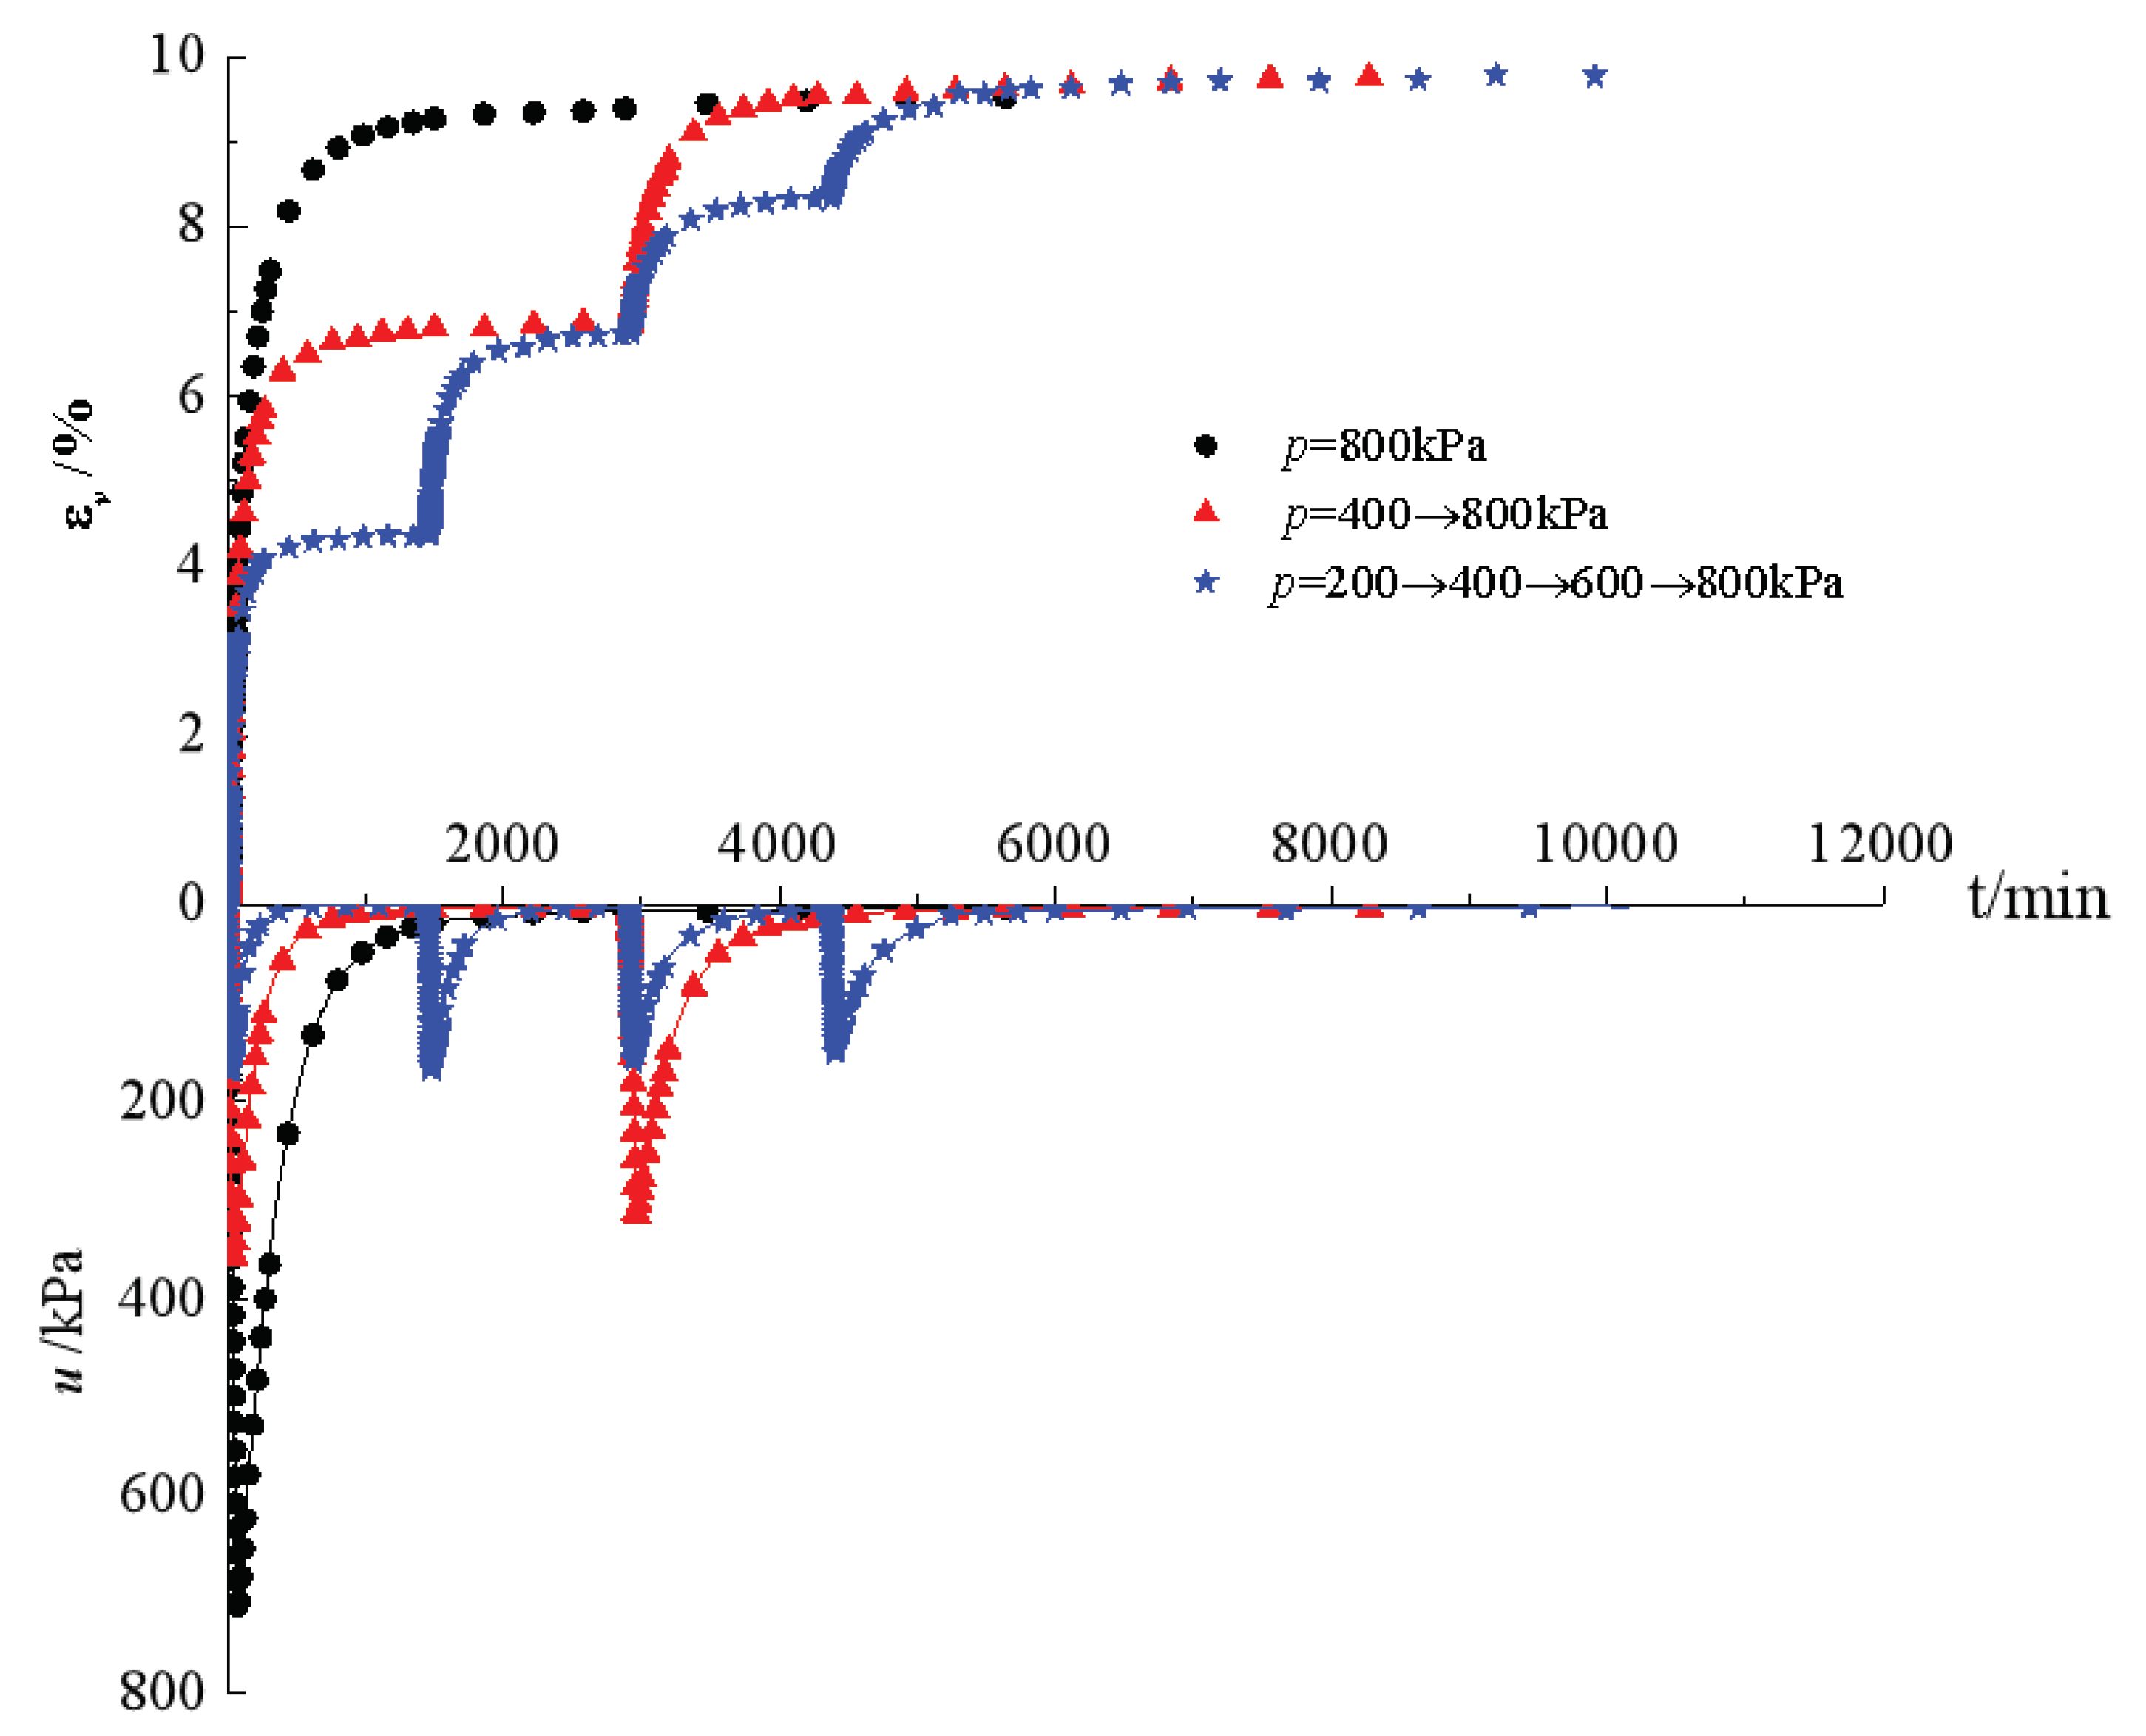
Figure 2 shows the development of volumetric strain (
εv) and the variation of pore water pressure (
u) with time under isotropic compression with different pre-loading steps. For each loading step, as the hydraulic pressure increases, the pore water pressure increases first and then dissipates over time during loading after the hydraulic pressure remains constant. For the specimens under different pre-loading steps, when the total stress of
p=800 kPa is applied, the total volumetric strains are almost the same, indicating that the pre-loading has little effect on the total deformation of reconstituted soil under isotropic compression. This may be due to the fact that the sample is in a three-dimensional spherical stress state during the isotropic compression process. No matter how the confining pressure pre-loading steps are, as long as the final confining pressure is the same, the direction and degree of structural adjustment of the soil are roughly the same, so the final volume strain generated by the sample is the same.
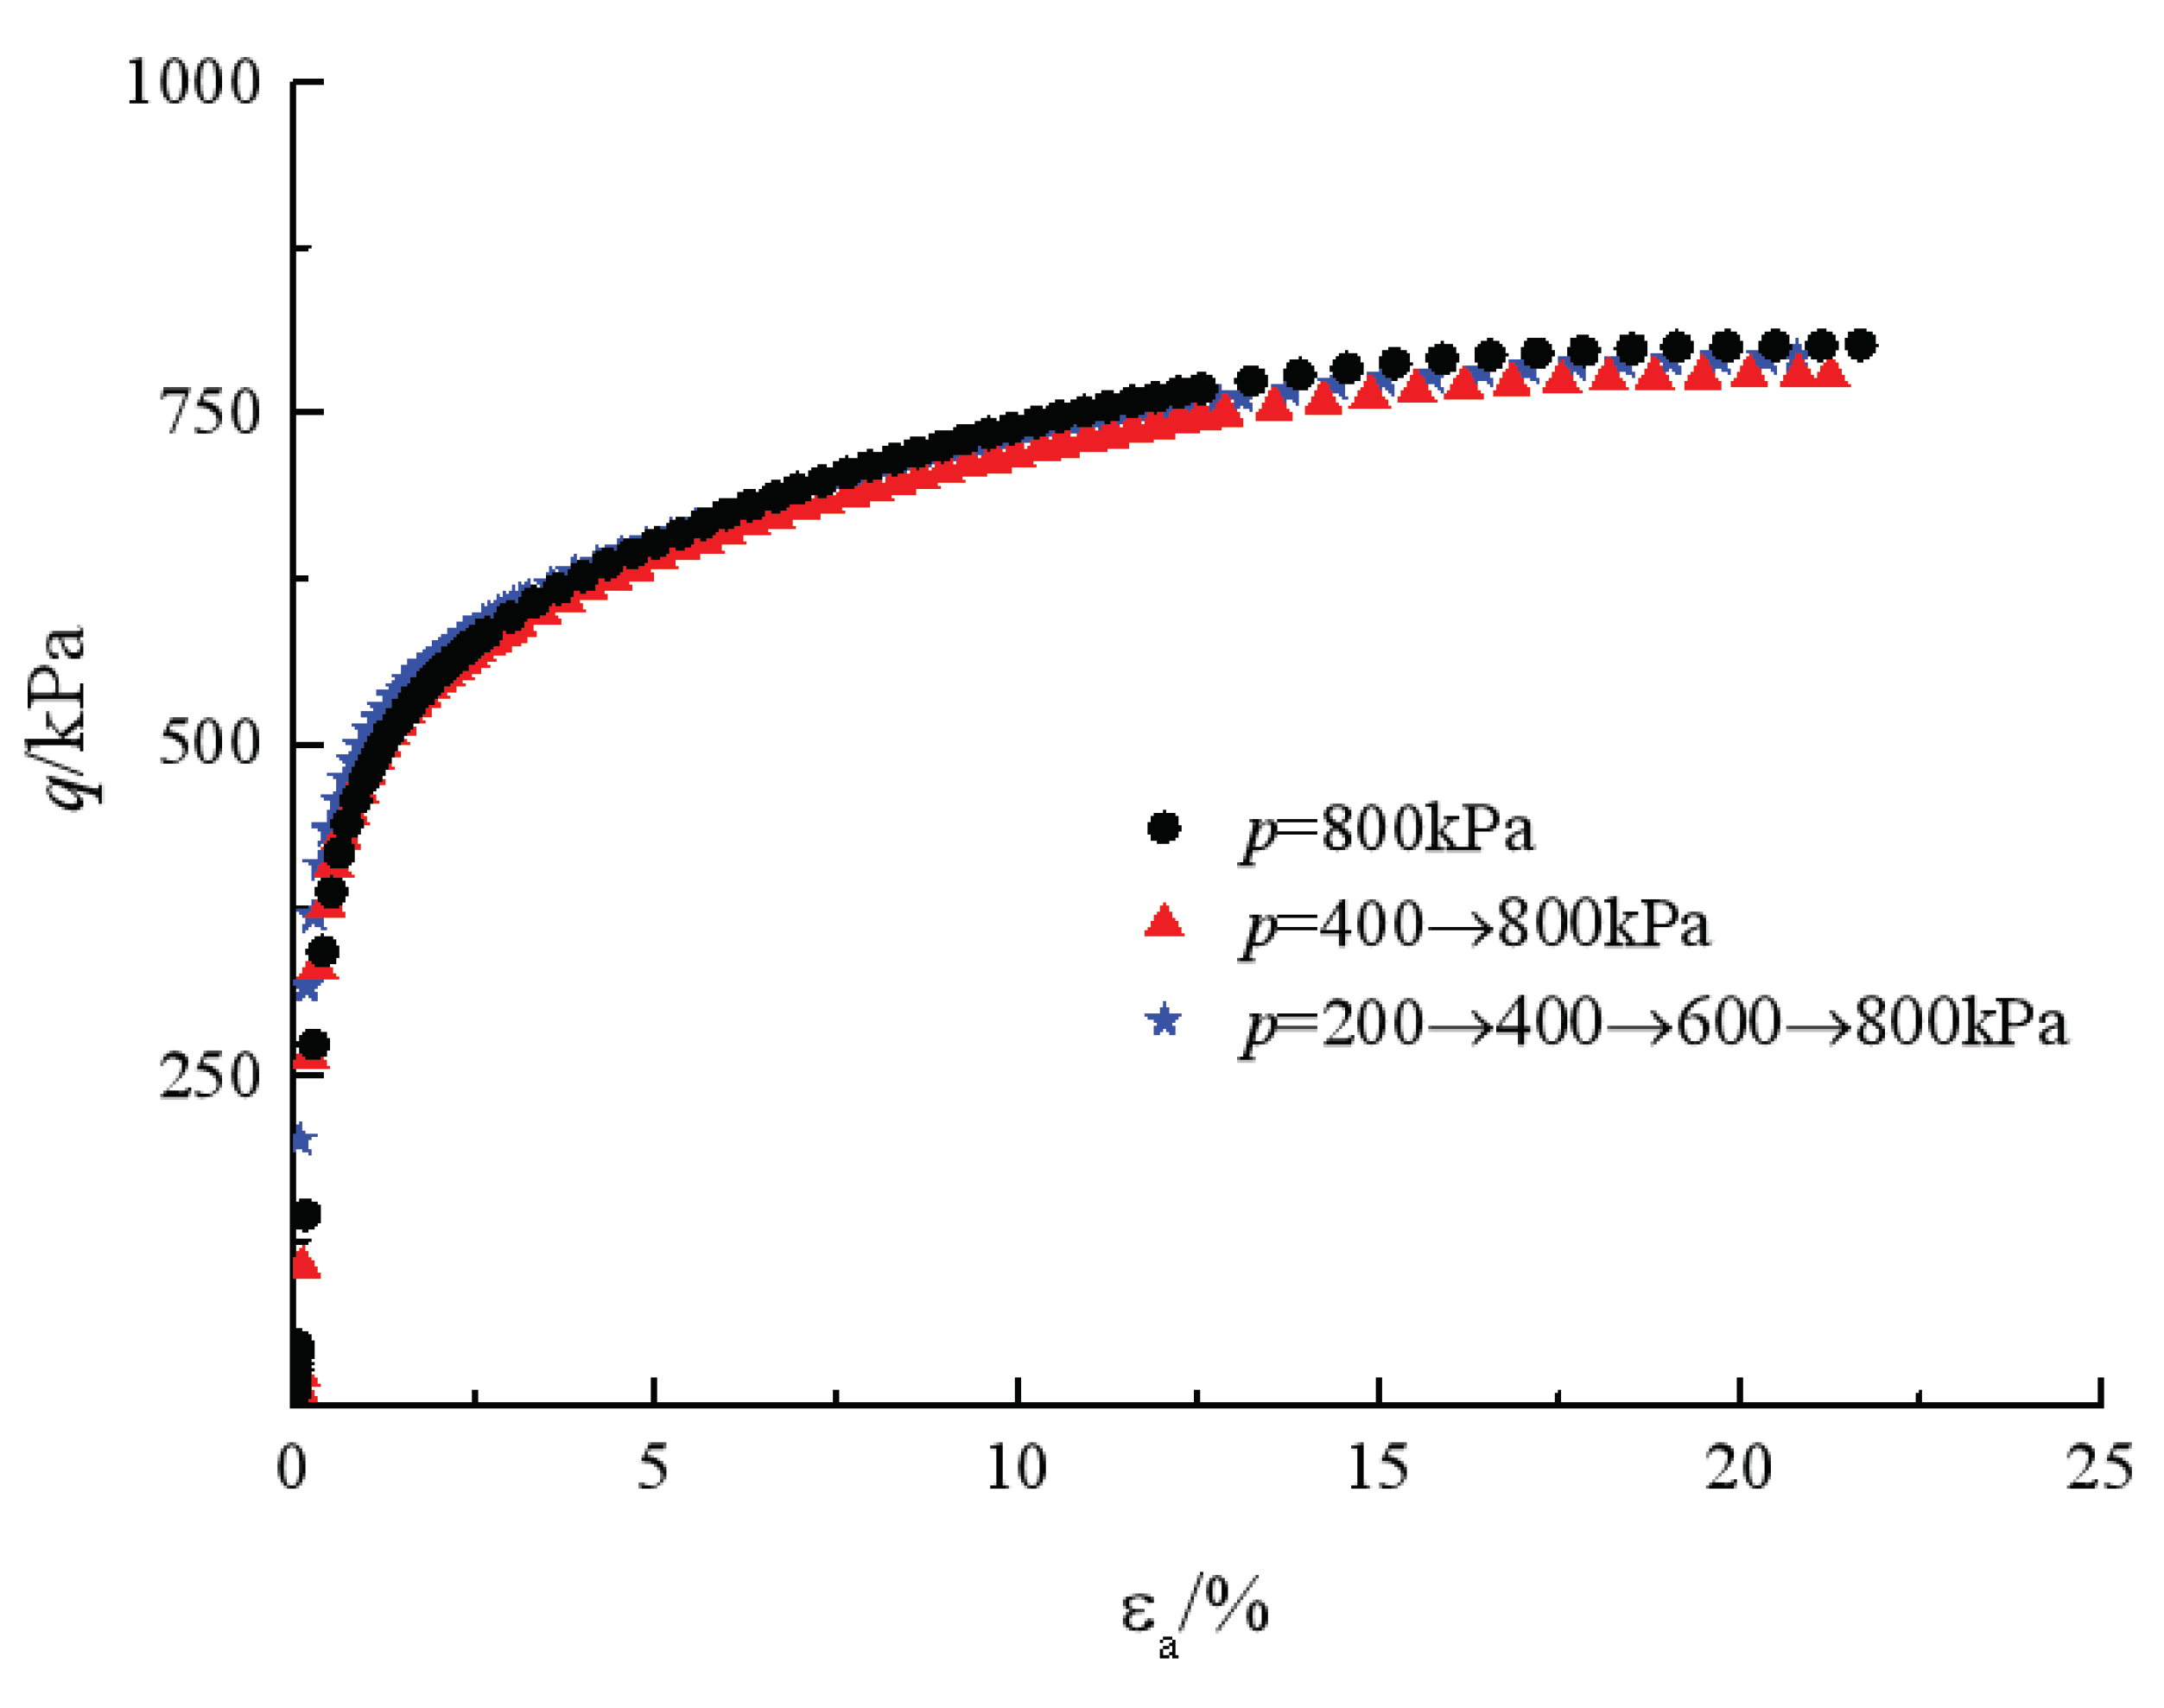
Figure 3 presents the results of the triaxial shear tests on specimens after creep under different pre-loading steps. In the case of approximately the same previous total volumetric strain, the specimens are consistently sheared to fail at about
qf= (
Δσ1-Δσ3)
f =750 kPa. It also shows that the pre-loading steps have little effect on the undrained shear strength of the specimen after creep.
4.2. Effect of Preloading Steps on Silty Clay under Triaxial Compression
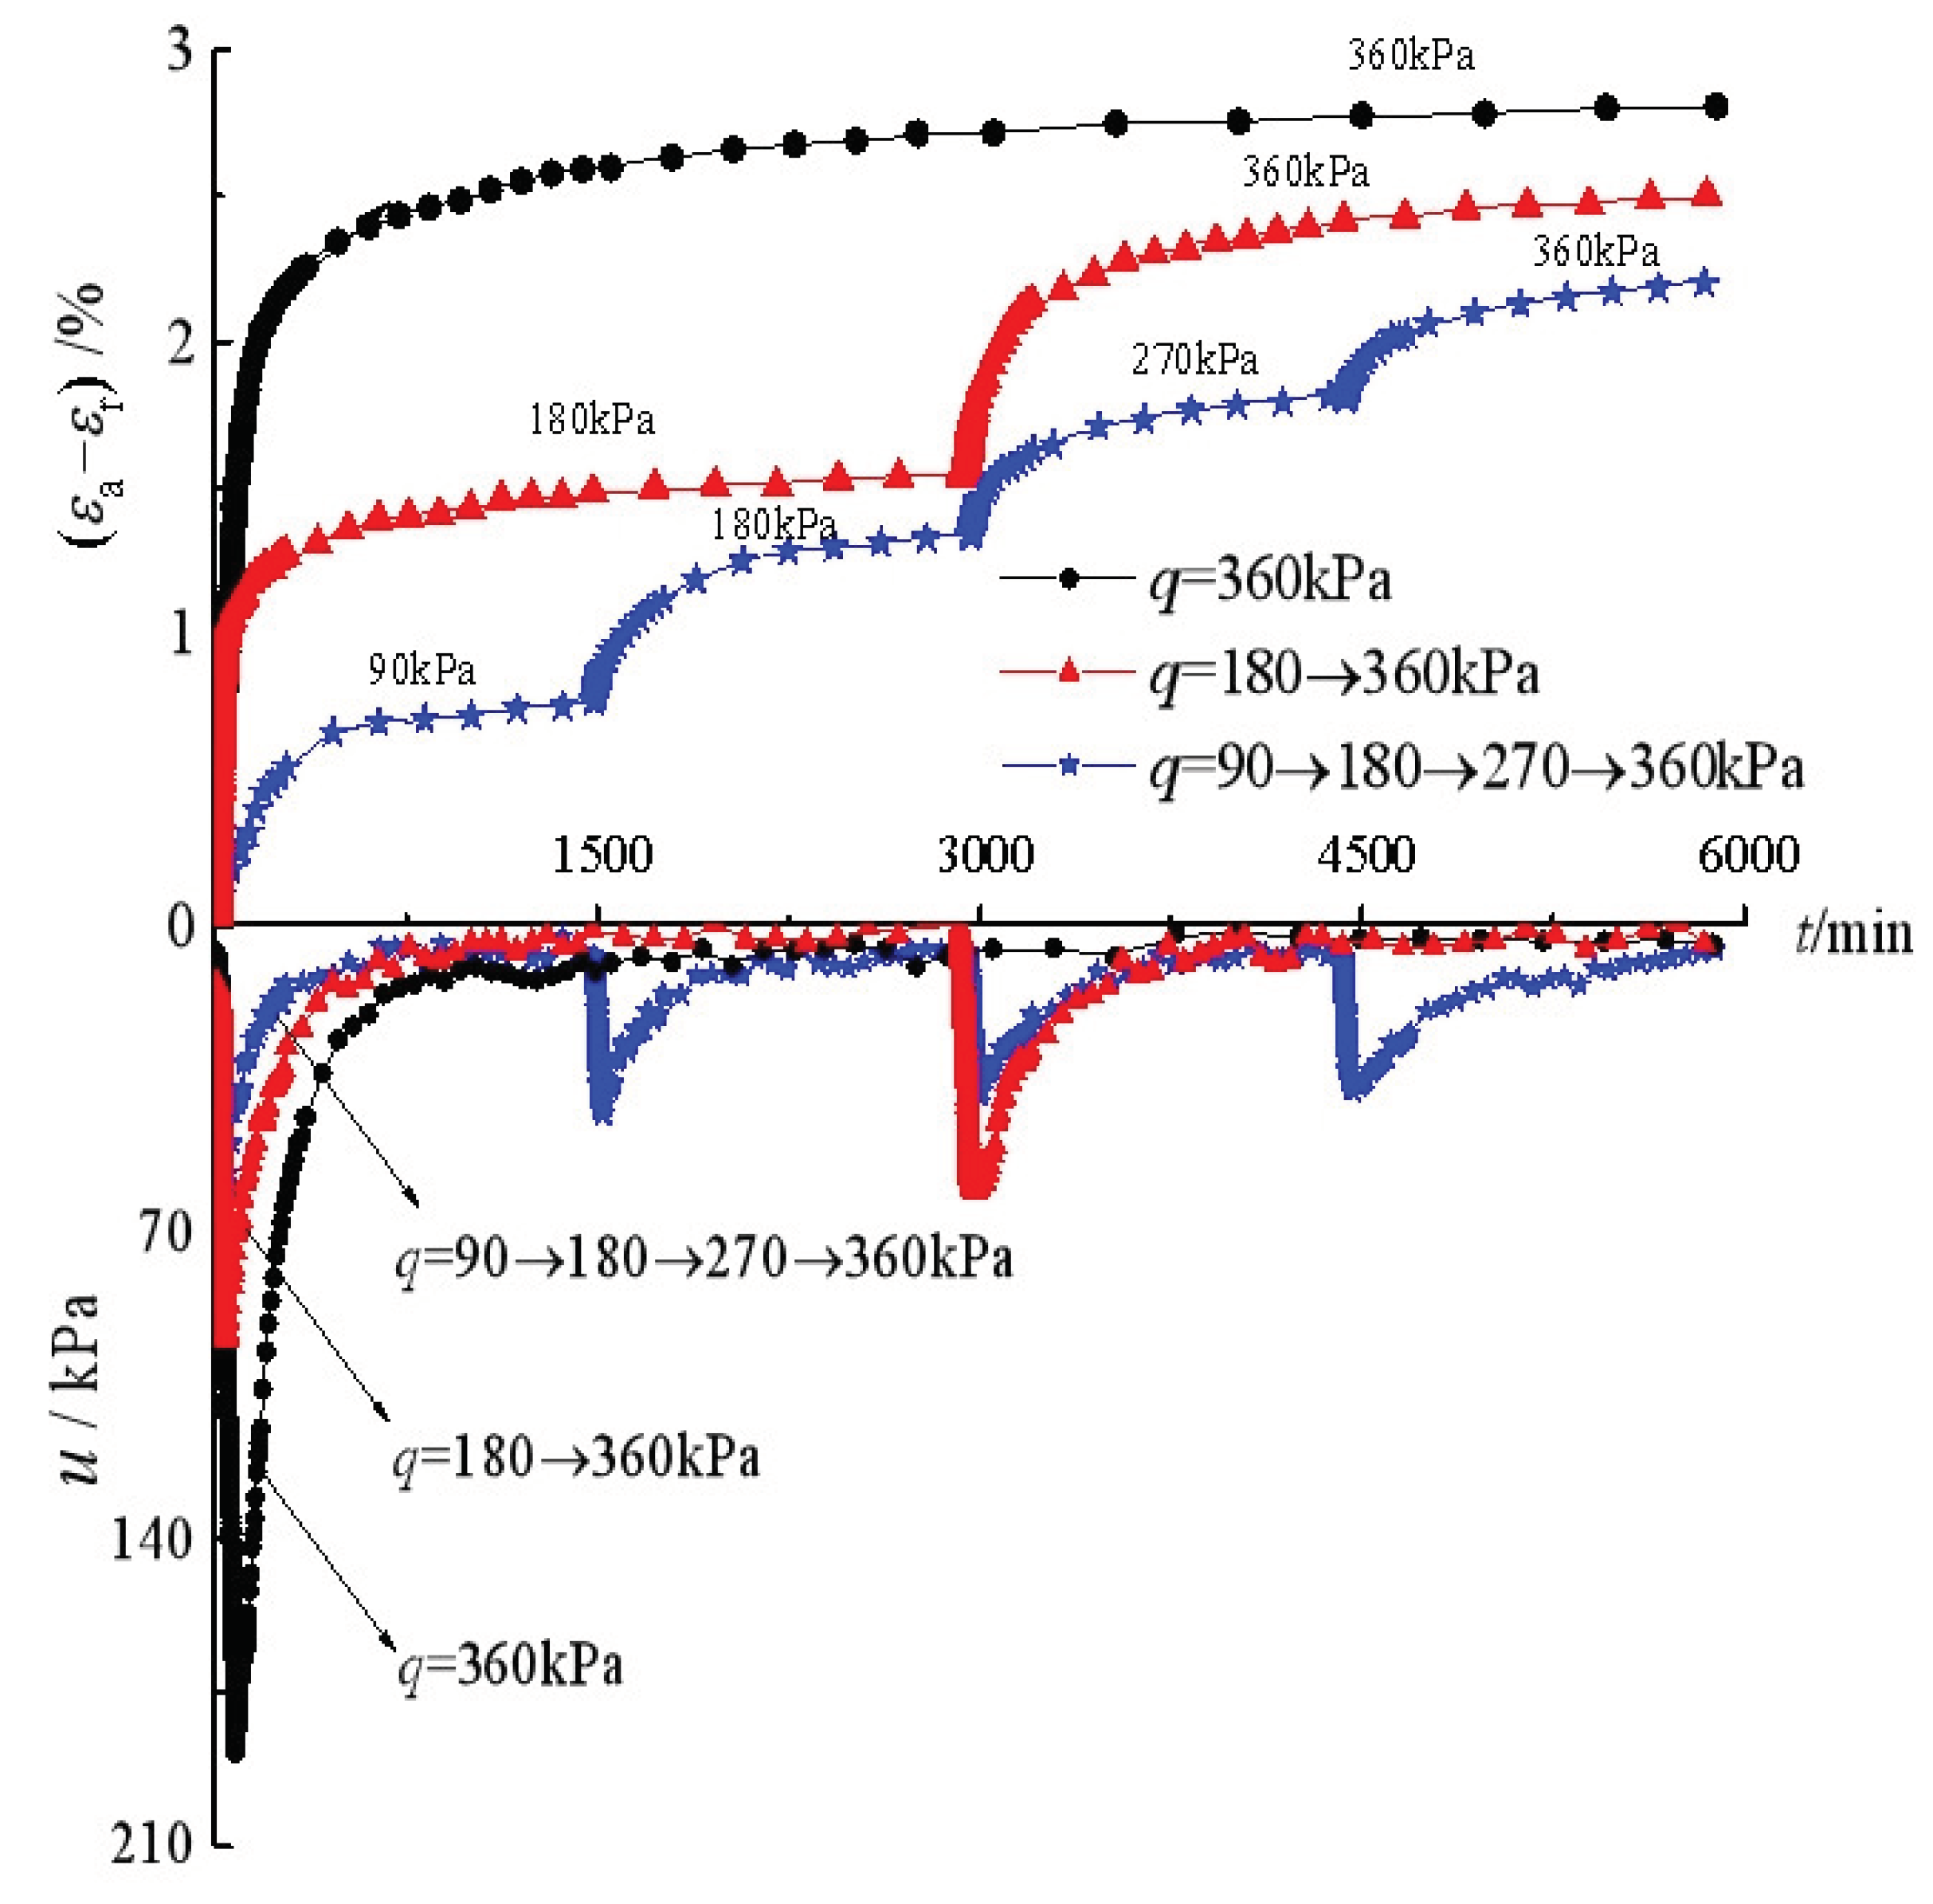
Figure 4 shows the development of deviatoric strain (
εa-εr) and the variation of pore water pressure with time under triaxial compression with three different pre-loading steps. For each loading step, as the vertical pressure increases, the pore water pressure increases first and then dissipates during loading after the total stresses remain unchanged. For the specimens under different pre-loading steps, the application of final stress of
q=
σ1-σ3=360 kPa produces different total deviatoric strains, and more pre-loading steps yield less deviatoric strains, indicating that the pre-loading helps to reduce the time-dependent shear deformation of reconstituted silty clay. This is in agreement with the observations from multi-stage consolidation tests on reconstituted silty clay conducted by Wu et.al. [
31].
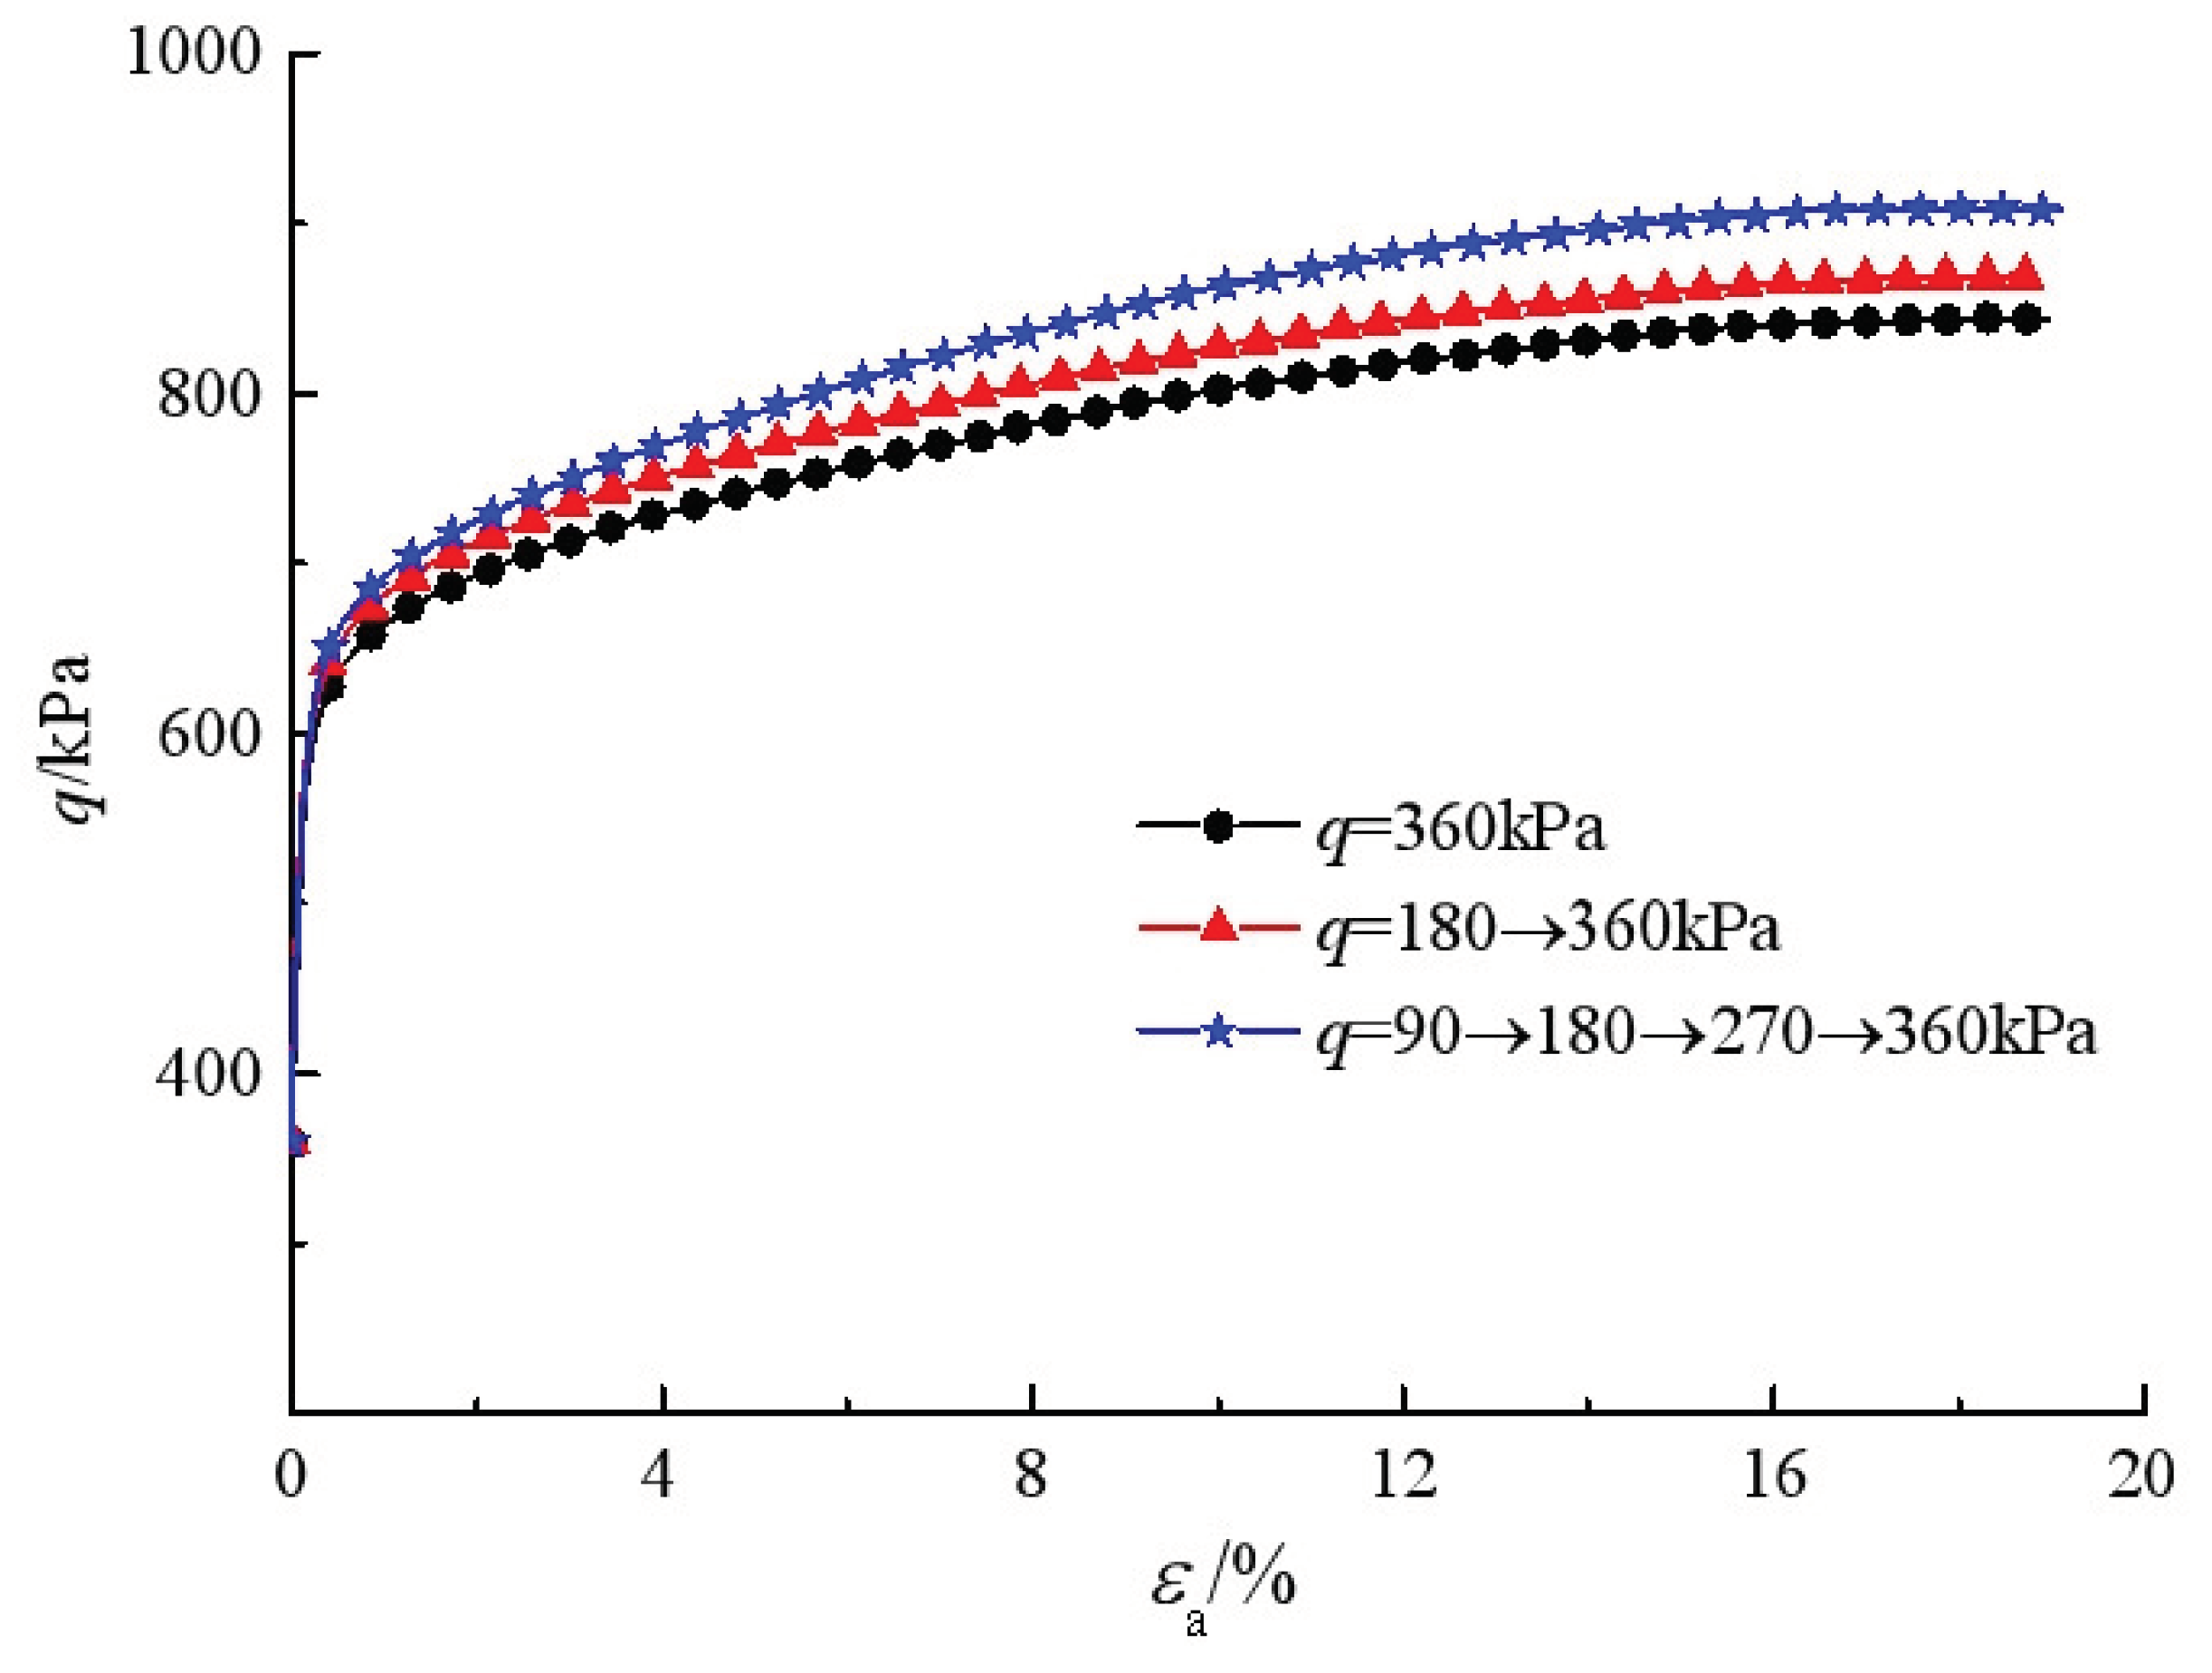
All specimens after creep are sheared at a deviatoric stress of
q=360 kPa under undrained condition.
Figure 5 gives the variation of the
q against the axial strain
εa. It is obvious that the preloaded specimens exhibit higher undrained strengths than those under less pre-loading steps. The triaxial undrained shear strength of the specimen after four-stage deviatoric stress creep is relatively high, followed by two-stage deviatoric stress creep, and finally, one-time applied deviatoric stress creep. The reason is that due to the existence of deviatoric stress in the shear creep process, the soil particles will be continuously adjusted to withstand the action of deviatoric stress. Different pre-loading steps will change the direction of particle adjustment, thus showing that the strength of the soil has changed macroscopically. This is in accordance with the findings by Teresa M. Bodas Freitas et al. [
30] studied the effect of the creep on the short-term bearing capacity of pre-loaded foundations, and pointed out that the time-dependence of soil was responsible for the significant increase in bearing capacity.
5. Soil Creep under Effective Stress
Based on the principle of effective stress, soil deforms and fails due to effective stresses applied to the skeleton of soil. For this consideration, creep (defined as secondary compression) of the soil may start when the excess pore water pressure dissipates. To determine the time at which specimen consolidation ends (
tEOP), reference can be made to the change curves of the pore water pressure displayed in Figs. 2 and 4. Before
tEOP, the specimens deform with the increasing effective stress; and after
tEOP, the specimens creep when the applied total stress is transformed into effective stress. In this study,
tEOP is determined when the pore water pressure dissipates more than 95% ((
u0 -u)
/u0=95%).
Table 2 gives the
tEOP values in the tests under different loading steps.
It can be seen that, for the isotropic compression test, the tEOP values at p=800 kPa are close to each other for different pre-loading histories; but for the triaxial compression test, the tEOP values at q=360 kPa vary considerably. This indicates that the higher the applied shear stress, the longer the time required for pore water pressure to dissipate. This suggests that the pre-loading has a greater effect on the sheared specimens than on the isotropic compressed ones.
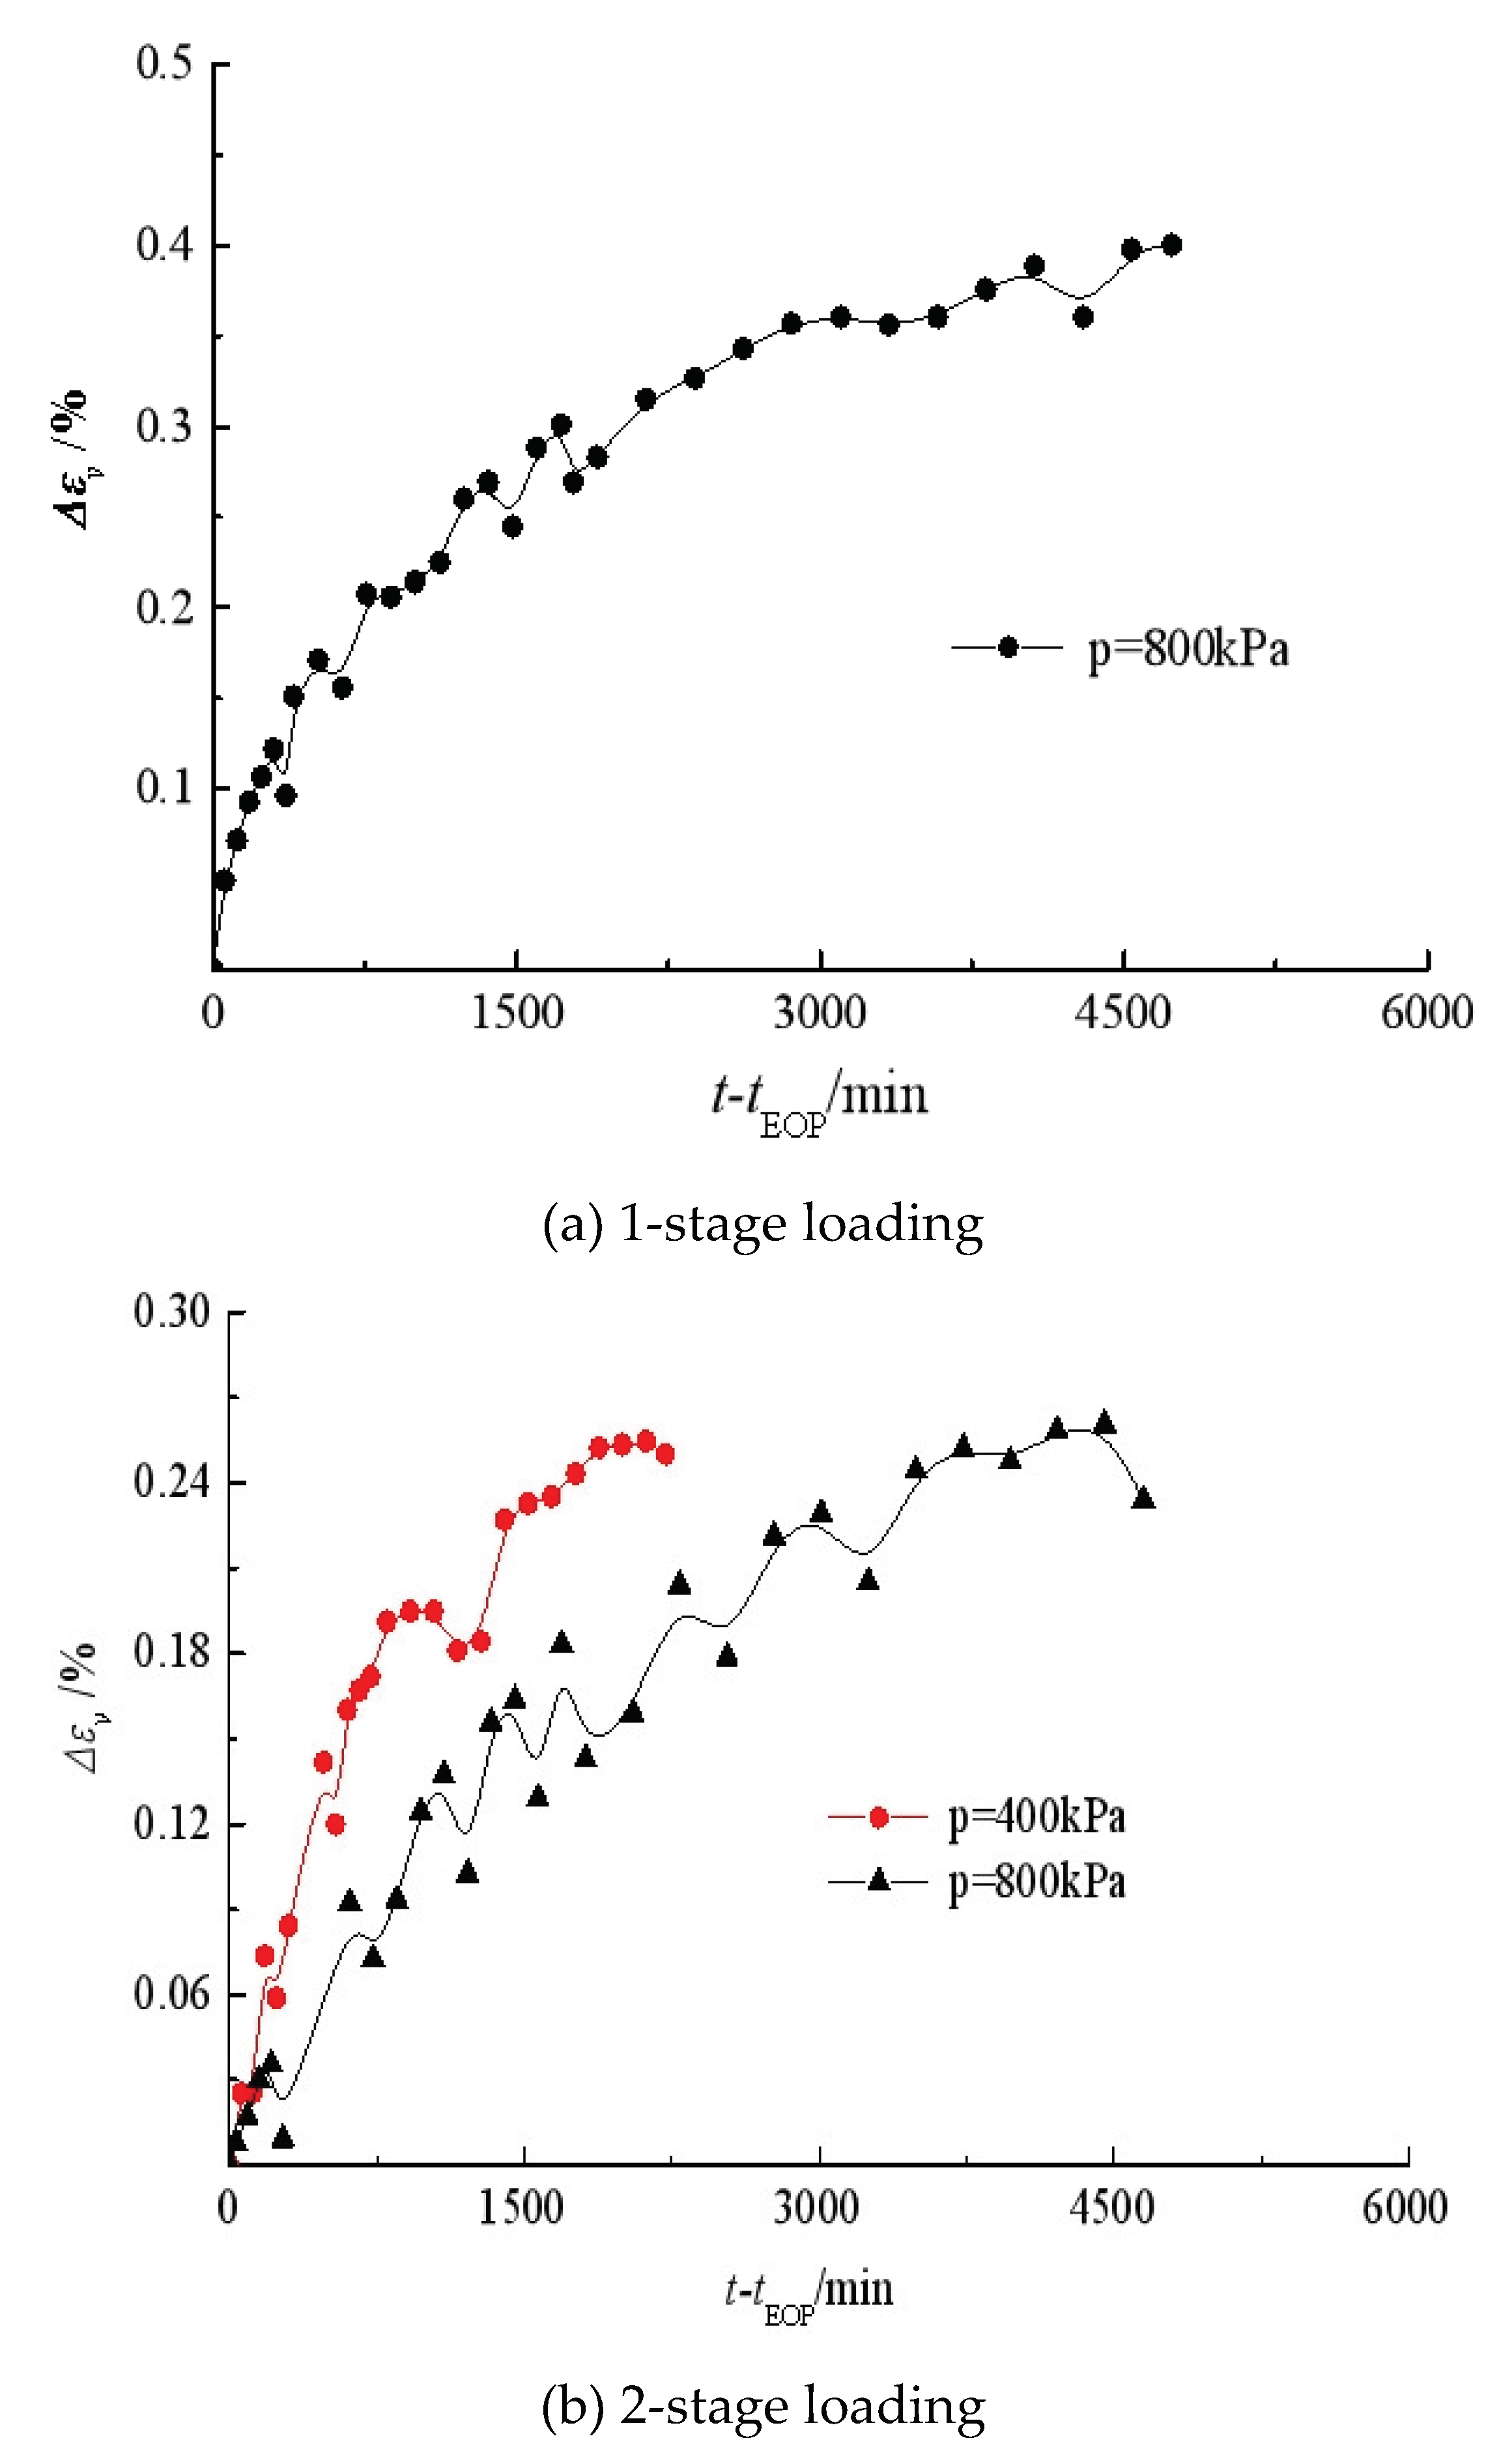
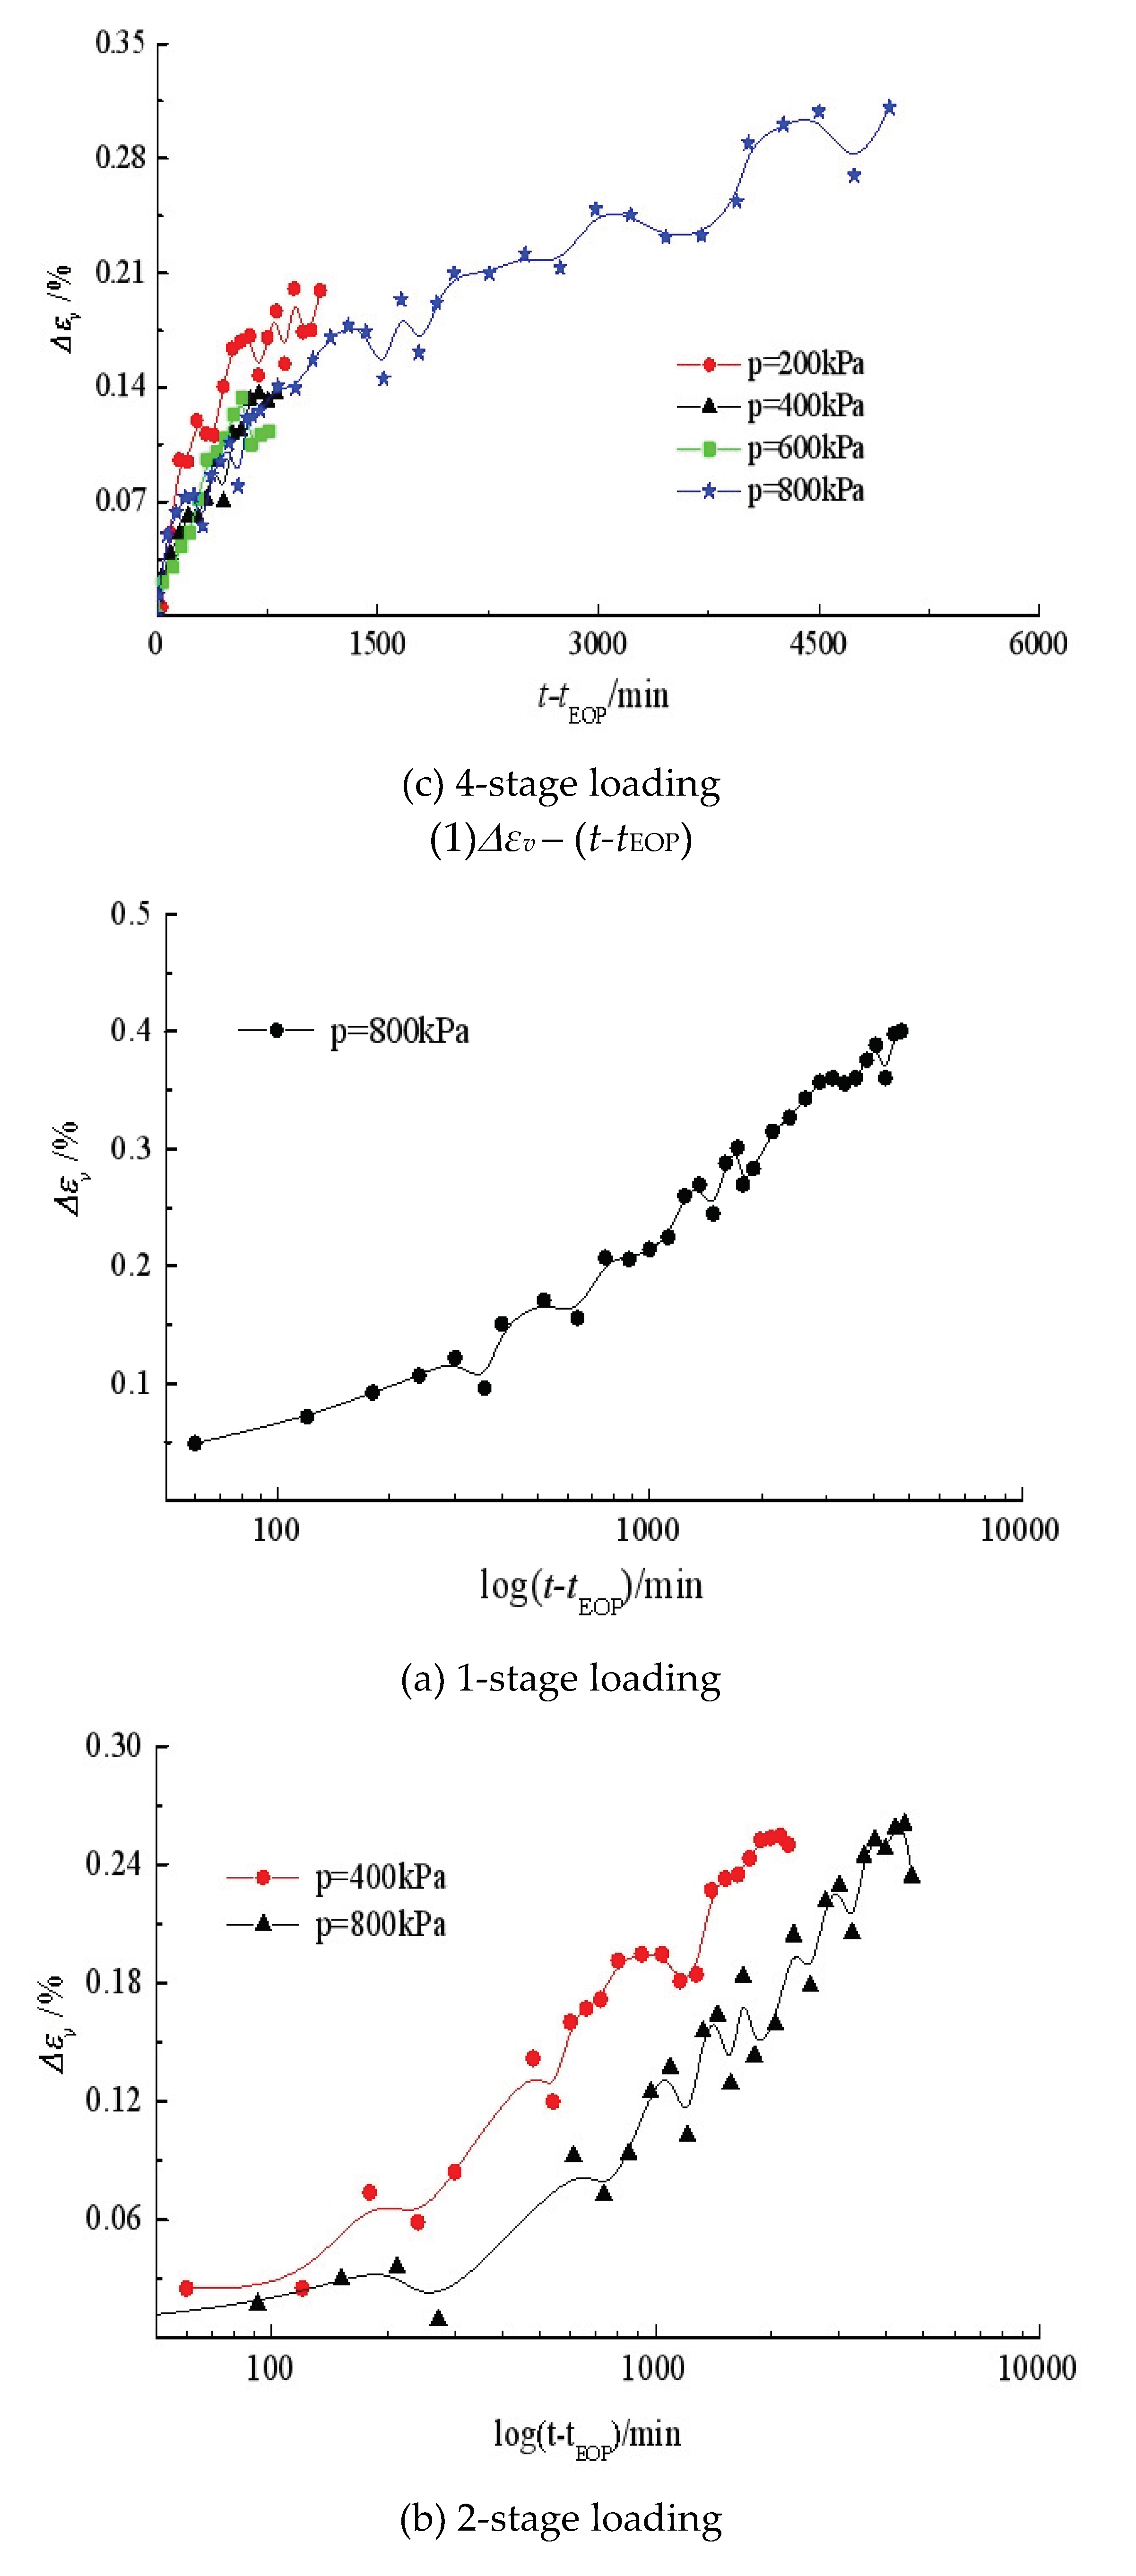
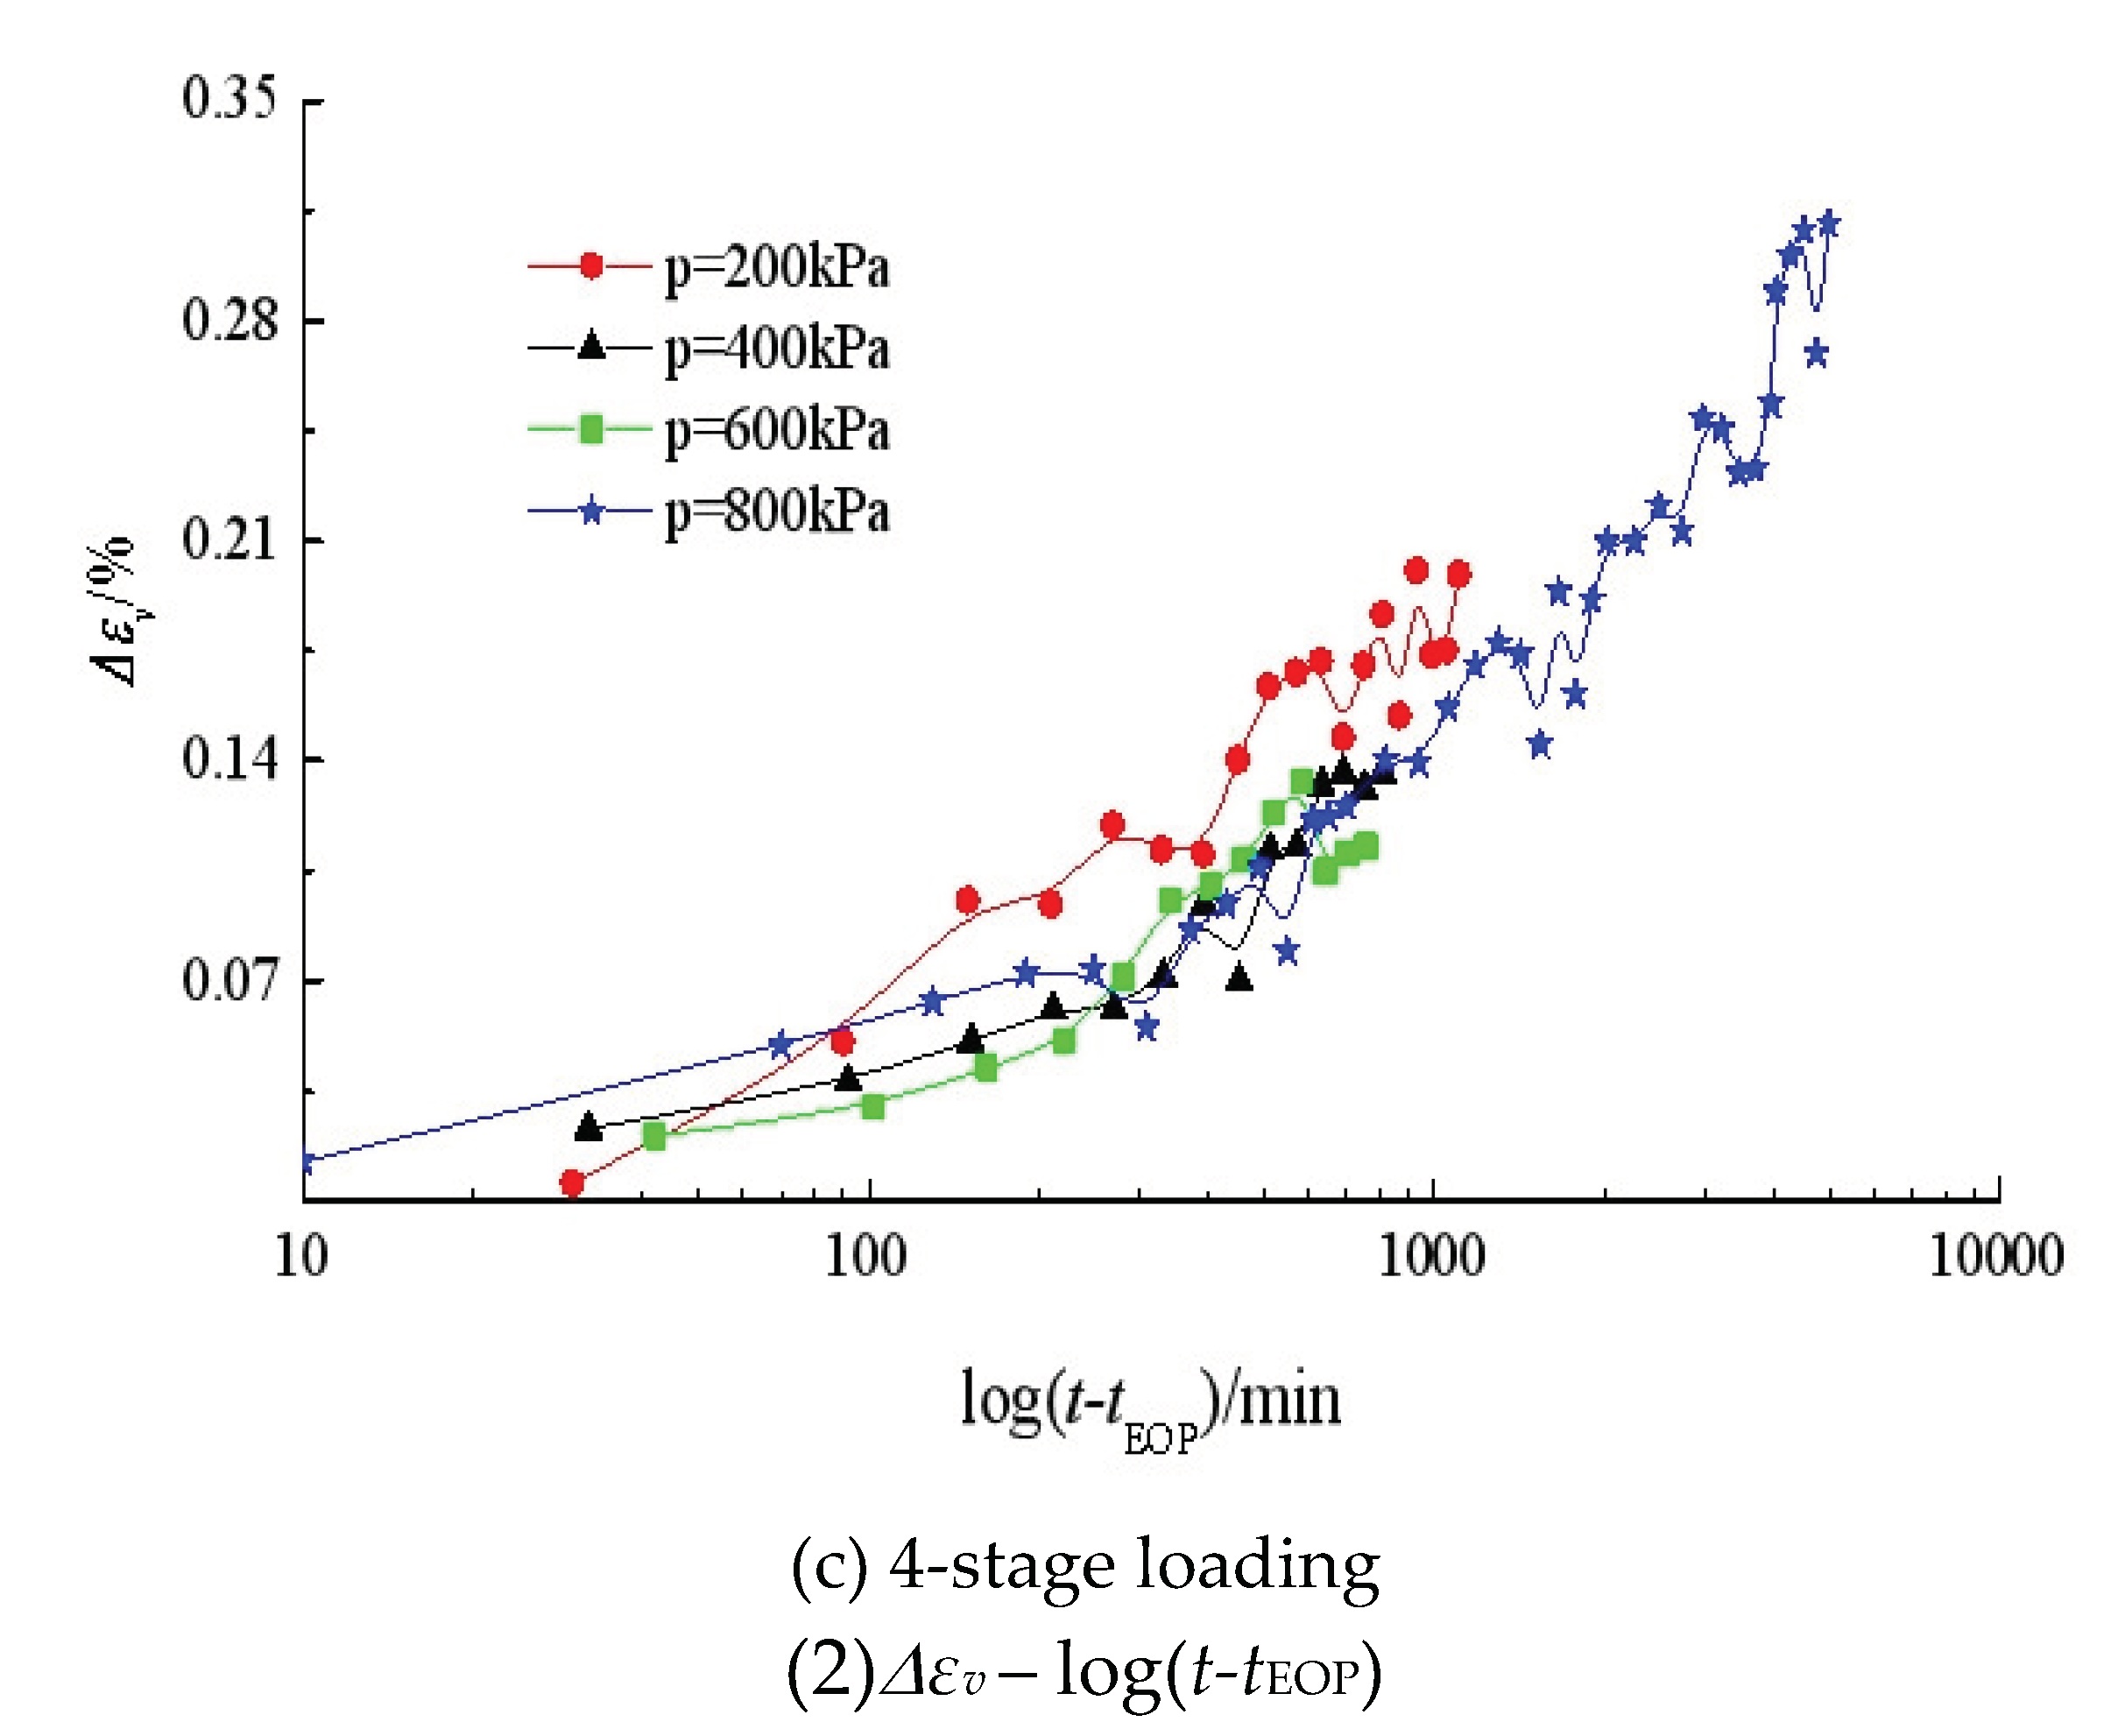
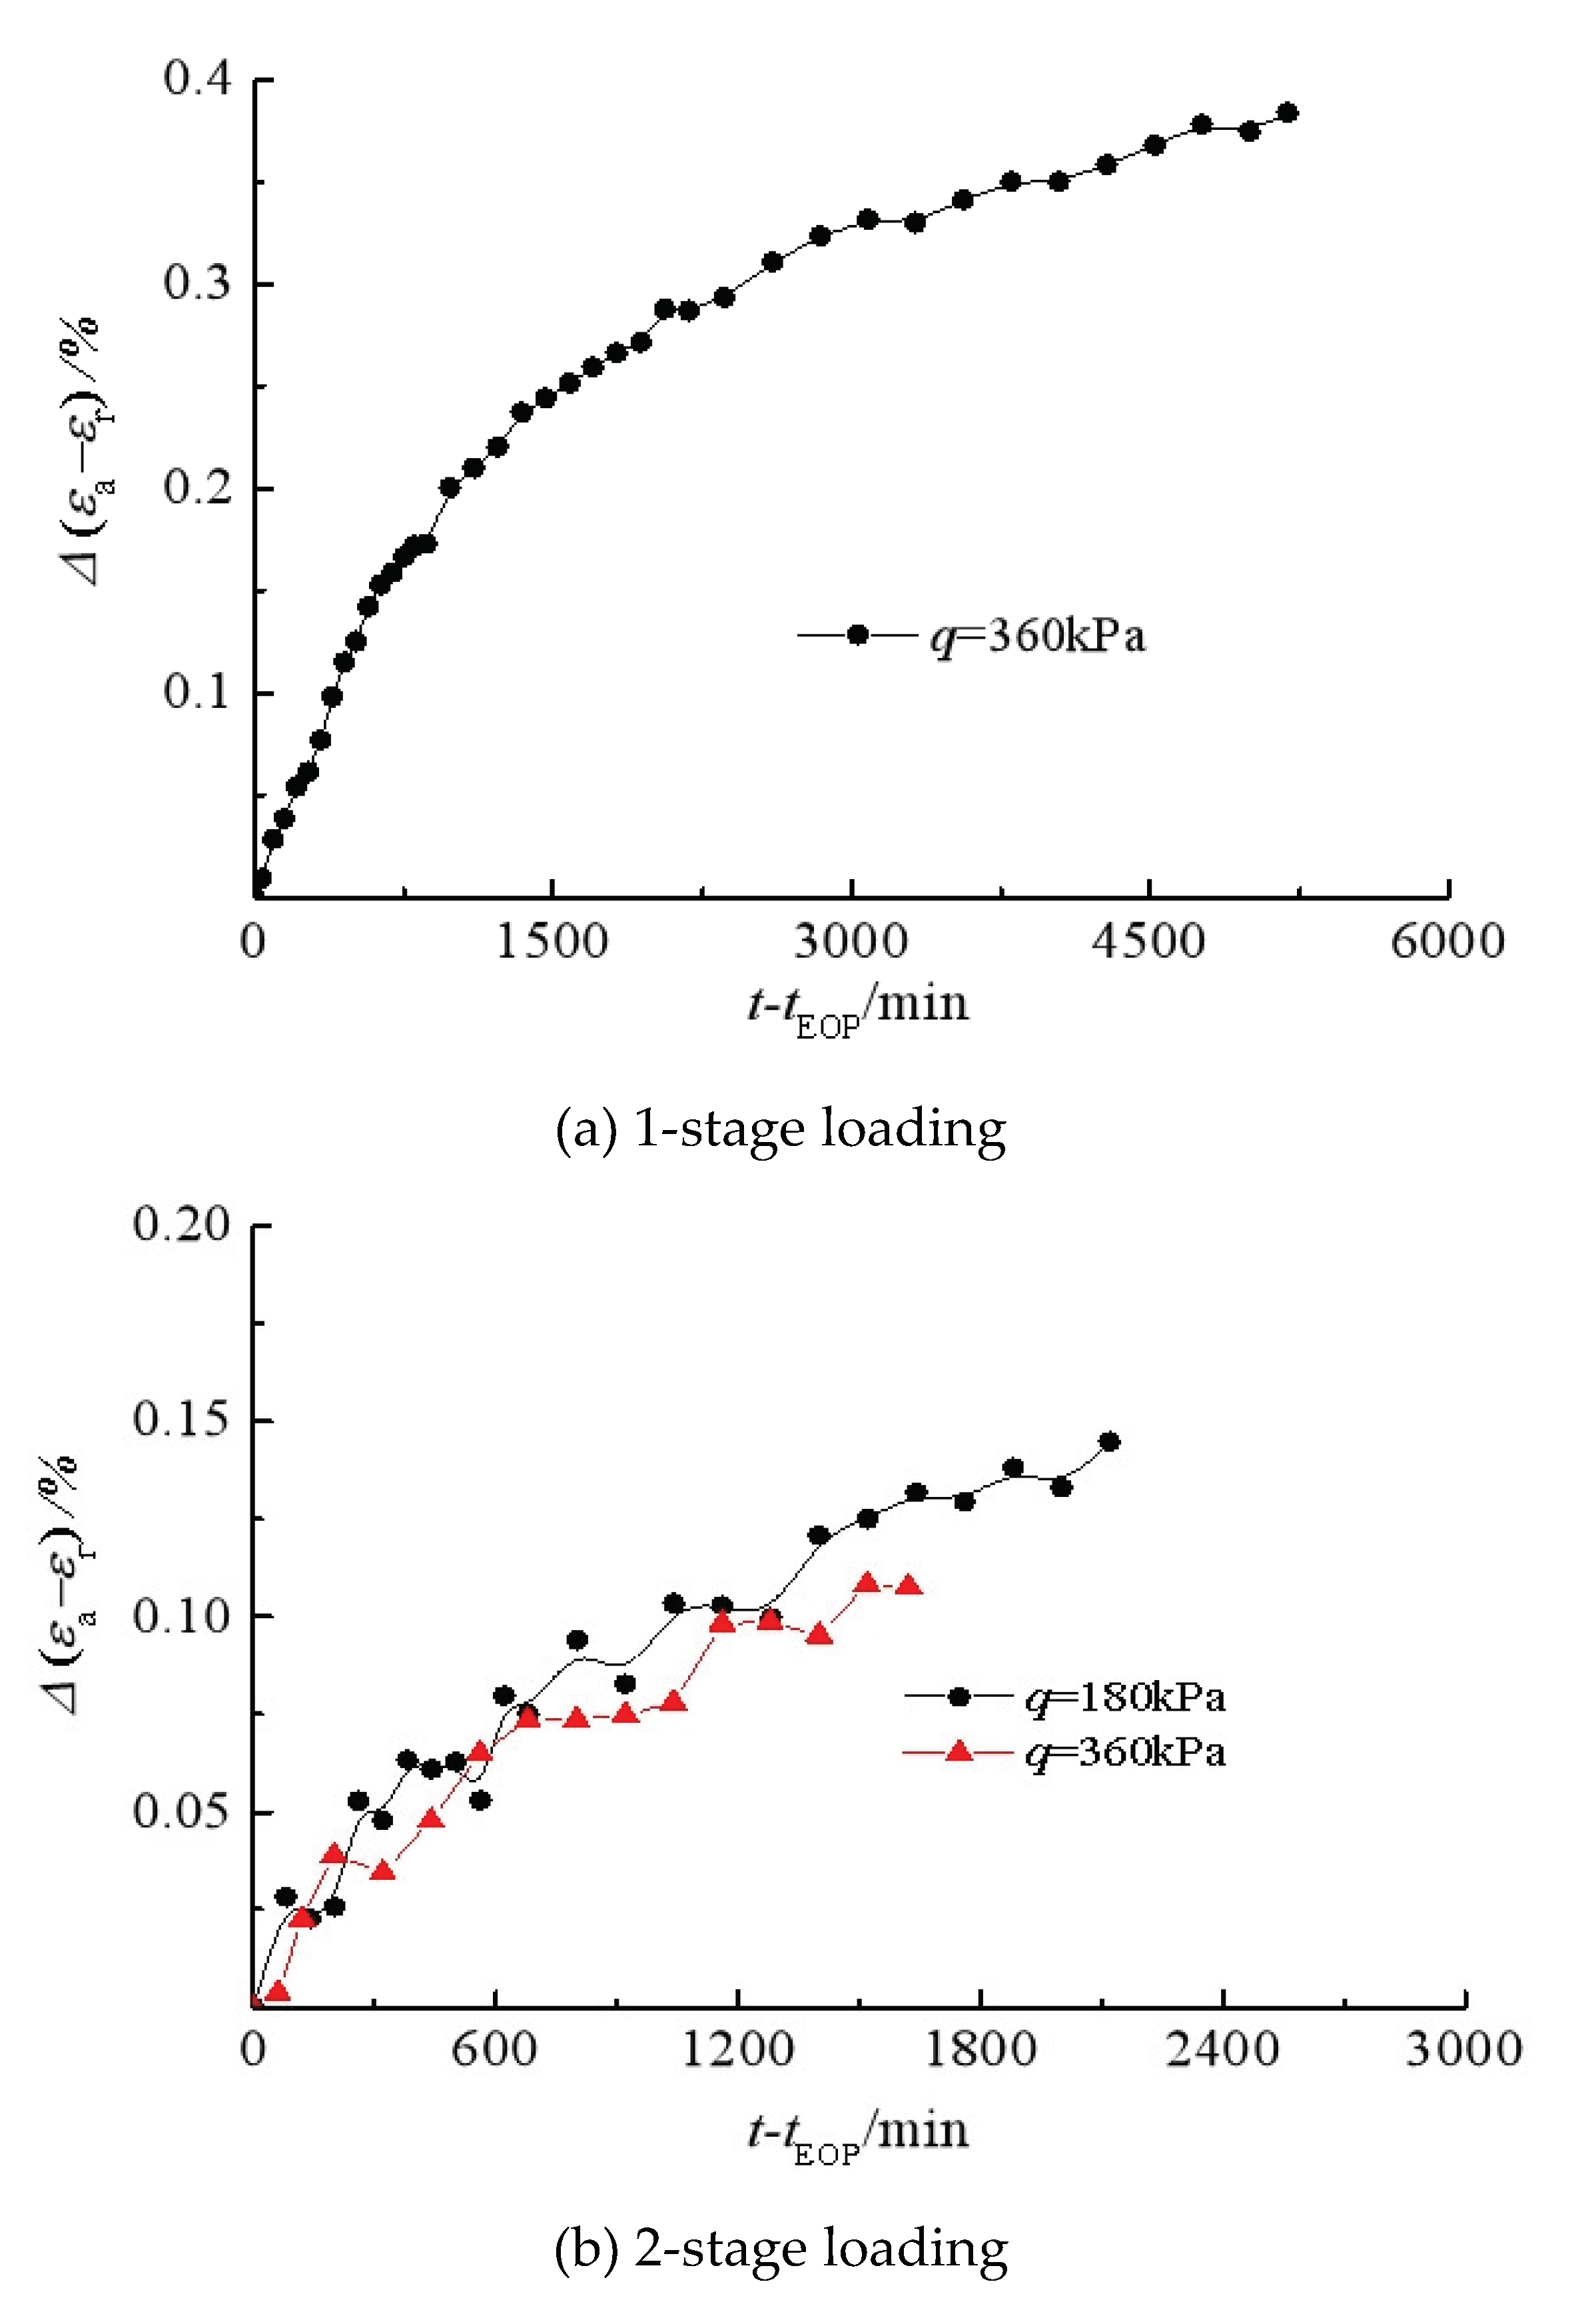
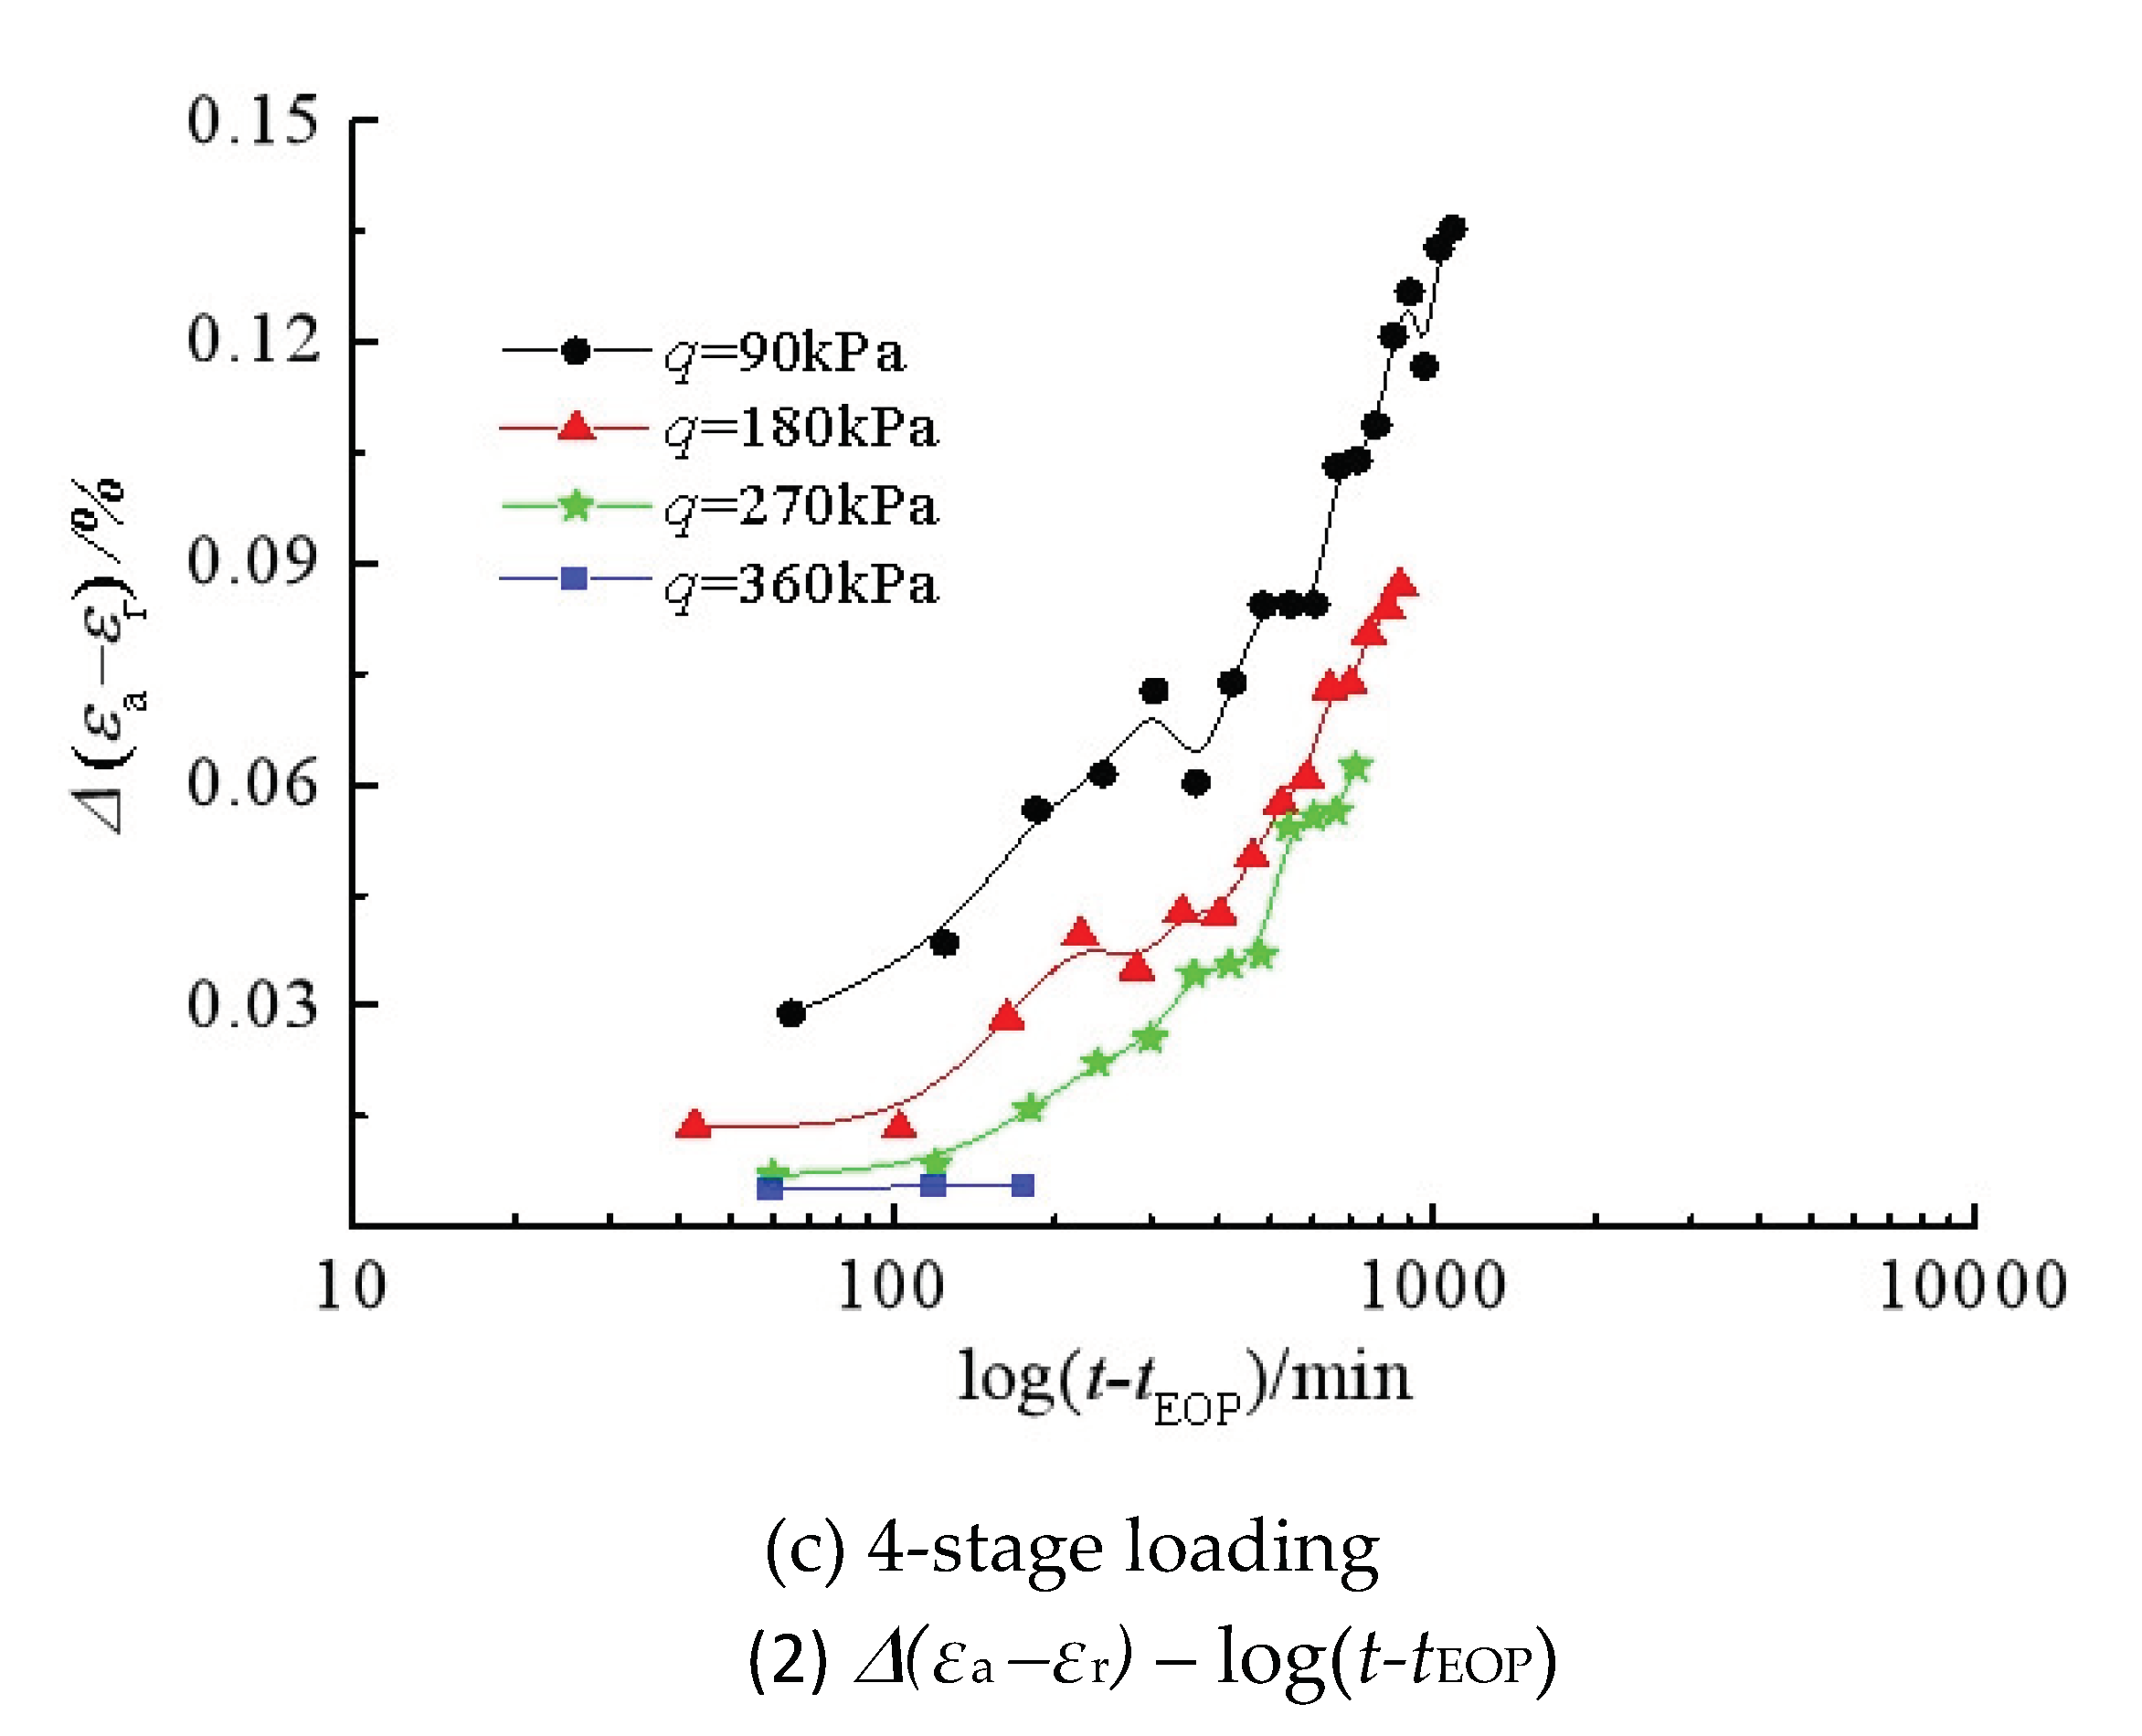
The creep curves of the reconstituted silty clay in isotropic compression and triaxial compression under effective stress are shown in
Figure 6 and
Figure 7, respectively. It is found from Figs. 6(a) and 7(a) that the creep strain evolves nonlinearly with time under different stress levels, and that the creep strain under the same
Δq increment obviously decreases if there is a preload. However, the preload in isotropic compression does not seem to have a significant effect on secondary volumetric creep strain. Figs. 6(b) and 7(b) present the variation of creep strain against logarithmic time. It is observed that the relationship is still nonlinear, but the later parts of the curves can be assumed to be linear.
As indicated in Figs. 6(c) and 7(c), the creep strains under 4-stage loading continuously increase within the constant stress duration. This suggests that, for soil creep study under an effective stress state and under several loading steps, the time interval for each loading step should be extended to cover the period in which the creep strain rate tends to level off.
The fluctuation of the creep curves indicates the influence of temperature and implies the importance of temperature control for testing soil creep. Maria Esther Soares Marques et al. [
11] detailed the effect of temperature on viscous behavior of soils.
6. Creep Model of Reconstituted Silty Clay
6.1. Non-Linear Logarithmic Creep Model
In engineering practice, the time-dependent behavior of soils is commonly characterized by the coefficient of secondary compression,
Cα, which can be calculated from consolidation tests by assuming a linear relation between the void ratio (or settlement) and the logarithm of time. However, this assumes that the creep develop infinitely with time. Based on consolidation tests on reconstituted marine clay, Yin[
25] proposed a non-liner logarithmic creep model, which can overcome the above problems, and it is expressed as:
where
and Δ
t are the vertical strain increment and the time increment, respectively;
and
are the total vertical strain and the total time, respectively;
and
are the vertical strain at the end of consolidation and the time, respectively;
and
are two creep parameters which can be determined according to the tests.
is related to the initial strain rate
Cα.
To use Yin’s non-linear creep model, the Eq. (1) can be rewritten as:
It can be further transformed as:
where
εv is the volumetric strain in the isotropic compression test.
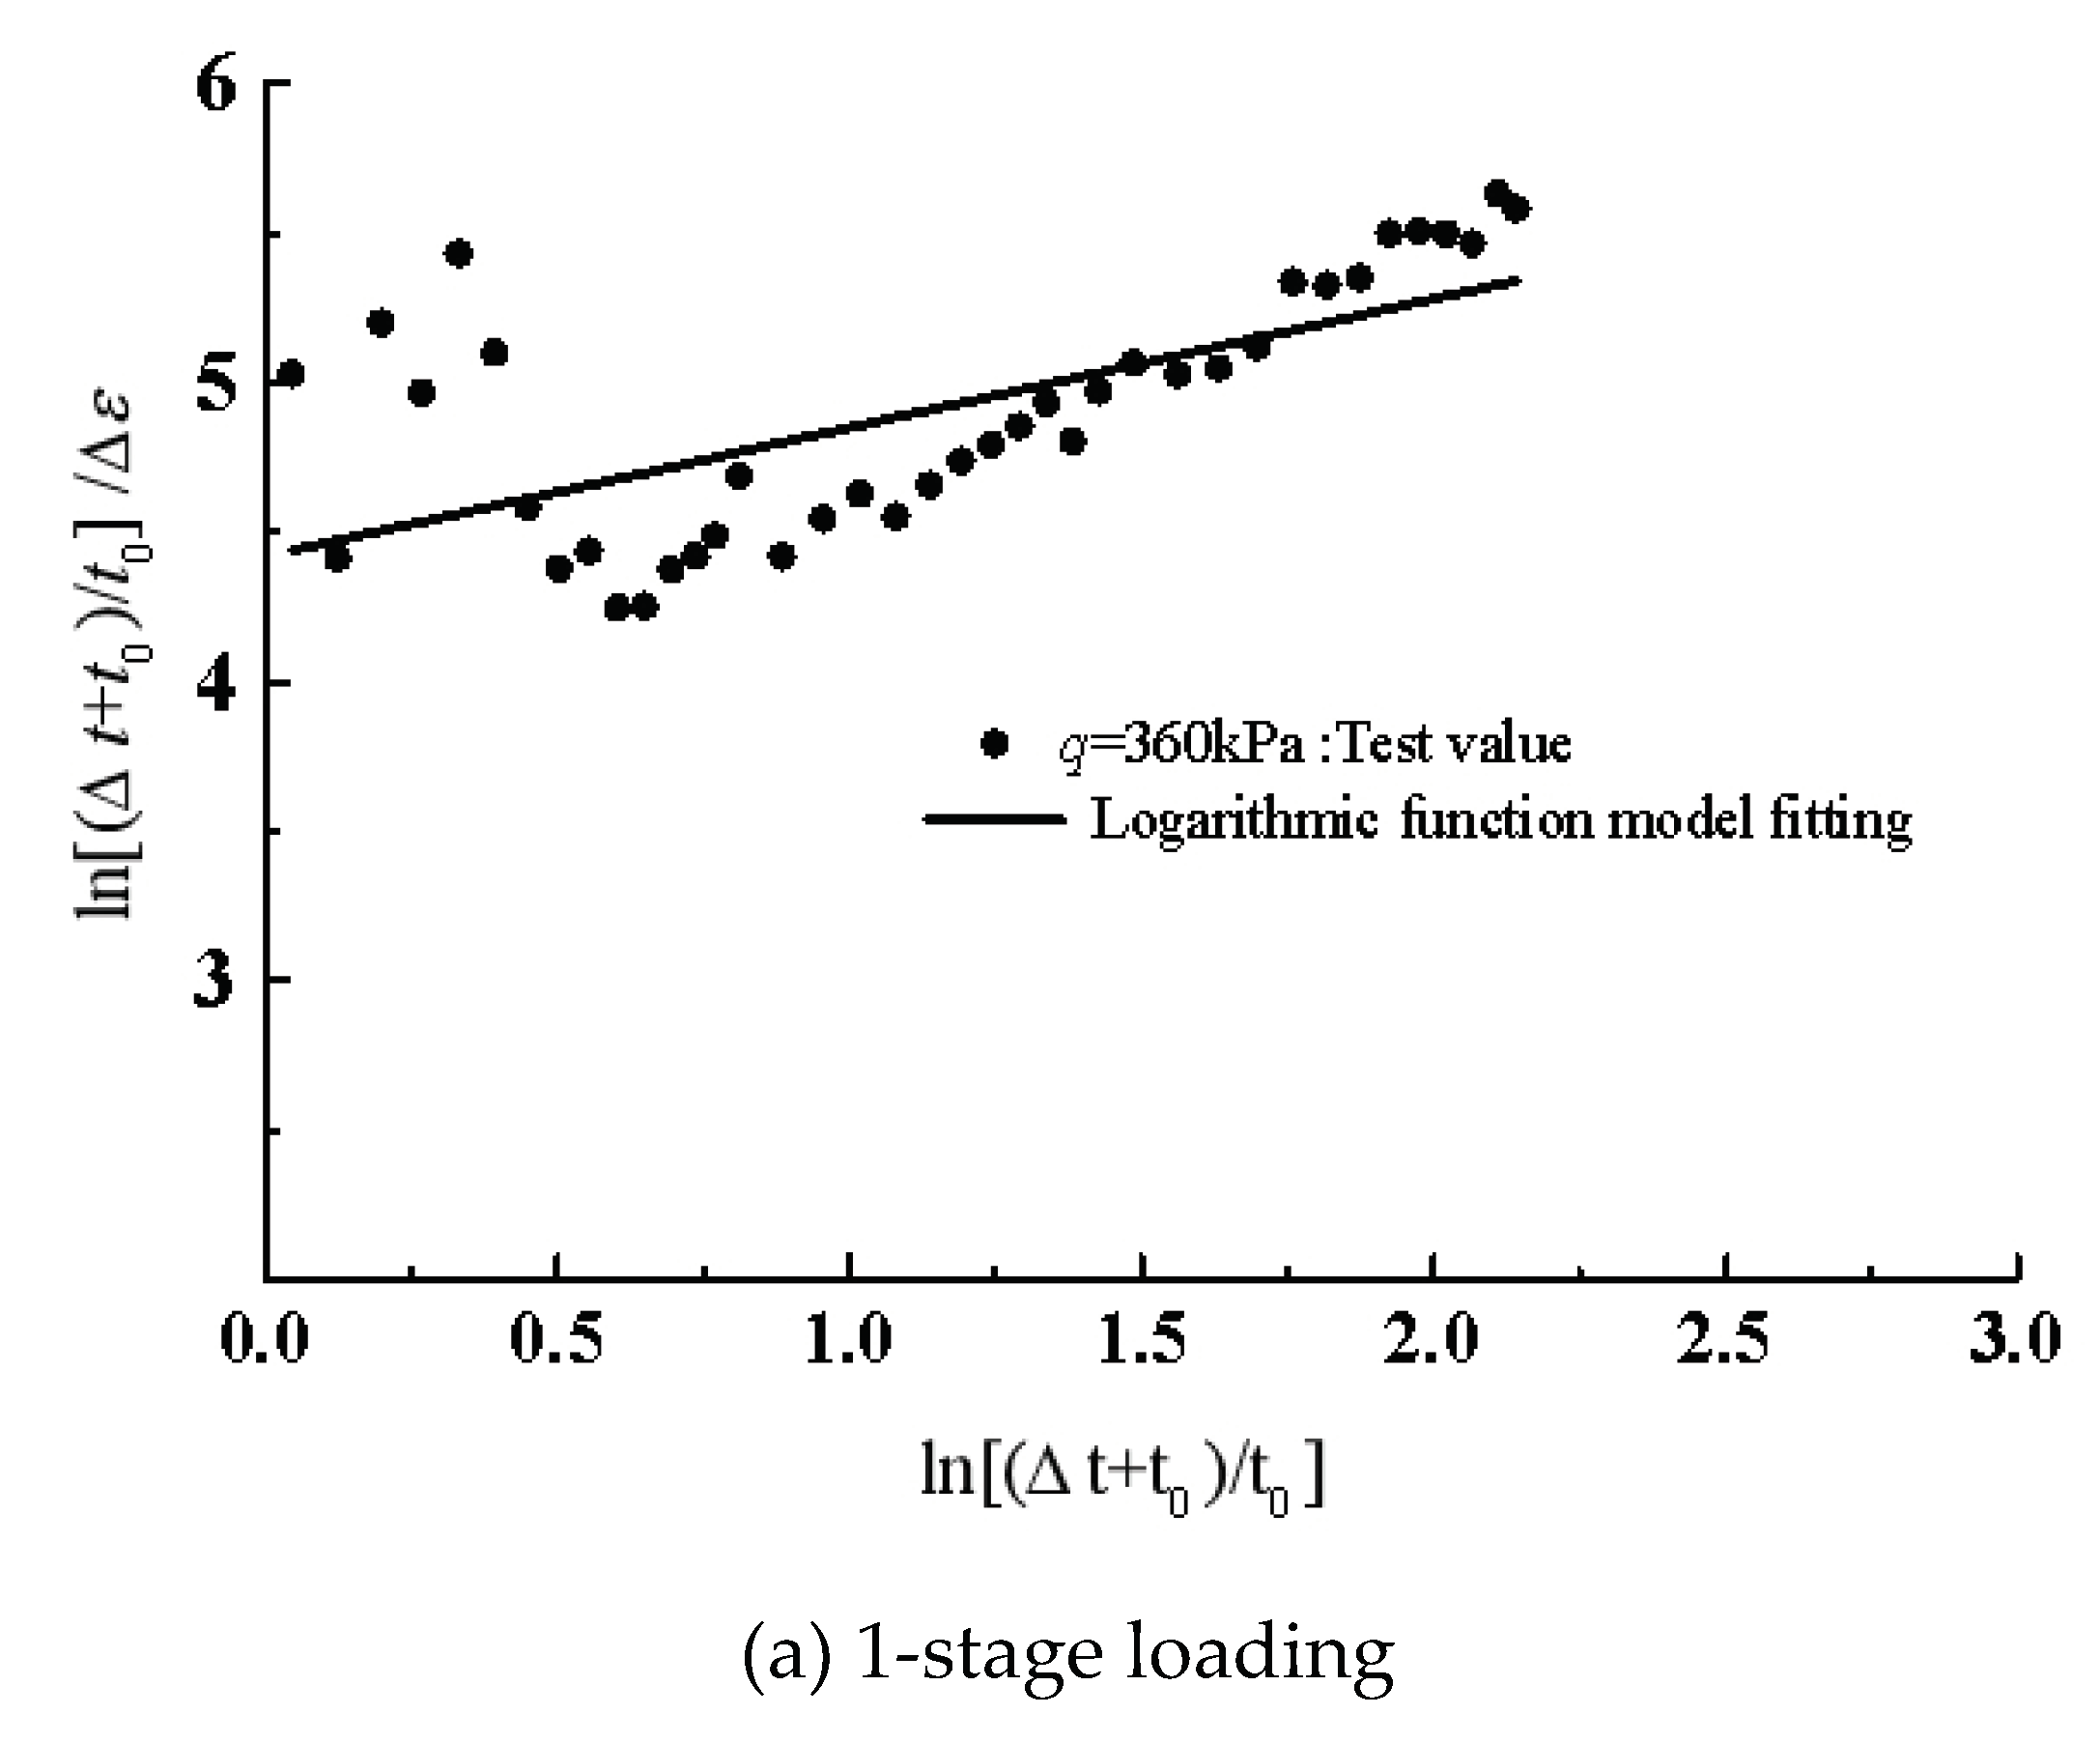
Figure 8 shows the best-fitting lines in double-logarithmic coordination for the creeps under isotropic compression.
Table 3 gives the parameters of the model. Even though the non-linear creep model doesn’t fit very well for the isotropic compression test, the fitted parameters
(0.2205-0.5875) and
(0.4804-0.8390) vary within narrow ranges for
p=800 kPa.
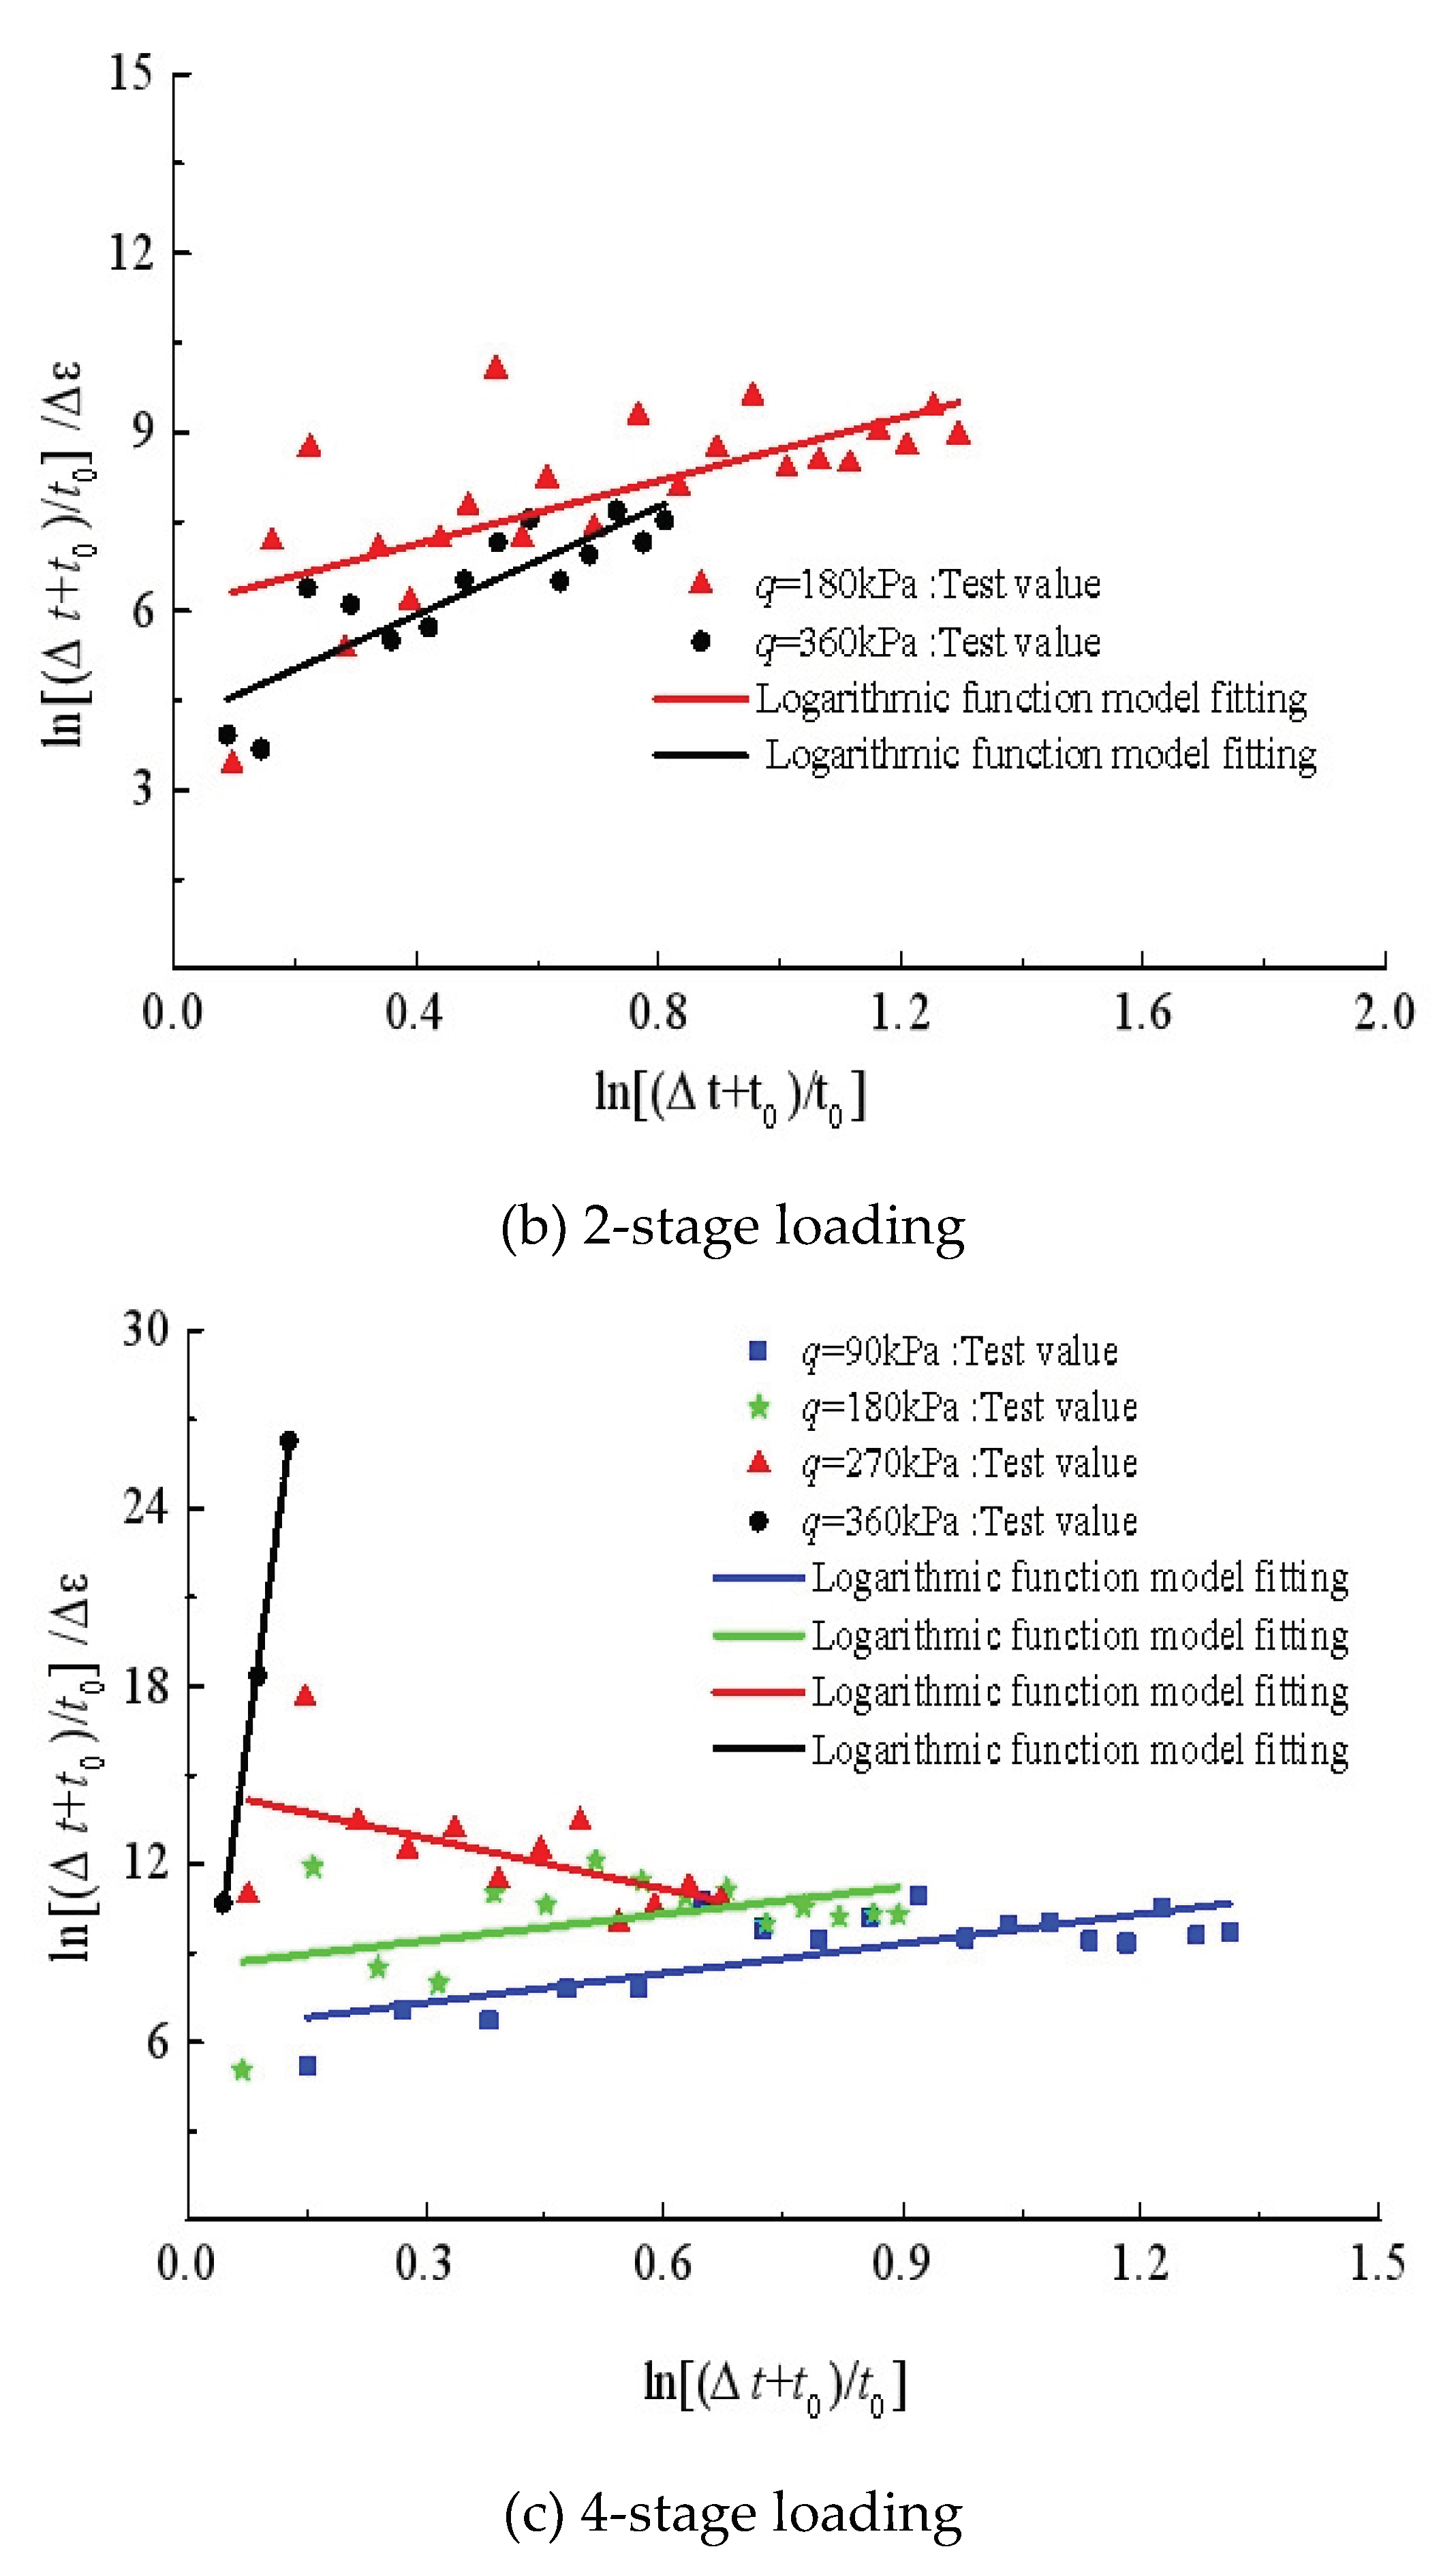
If substituting
to
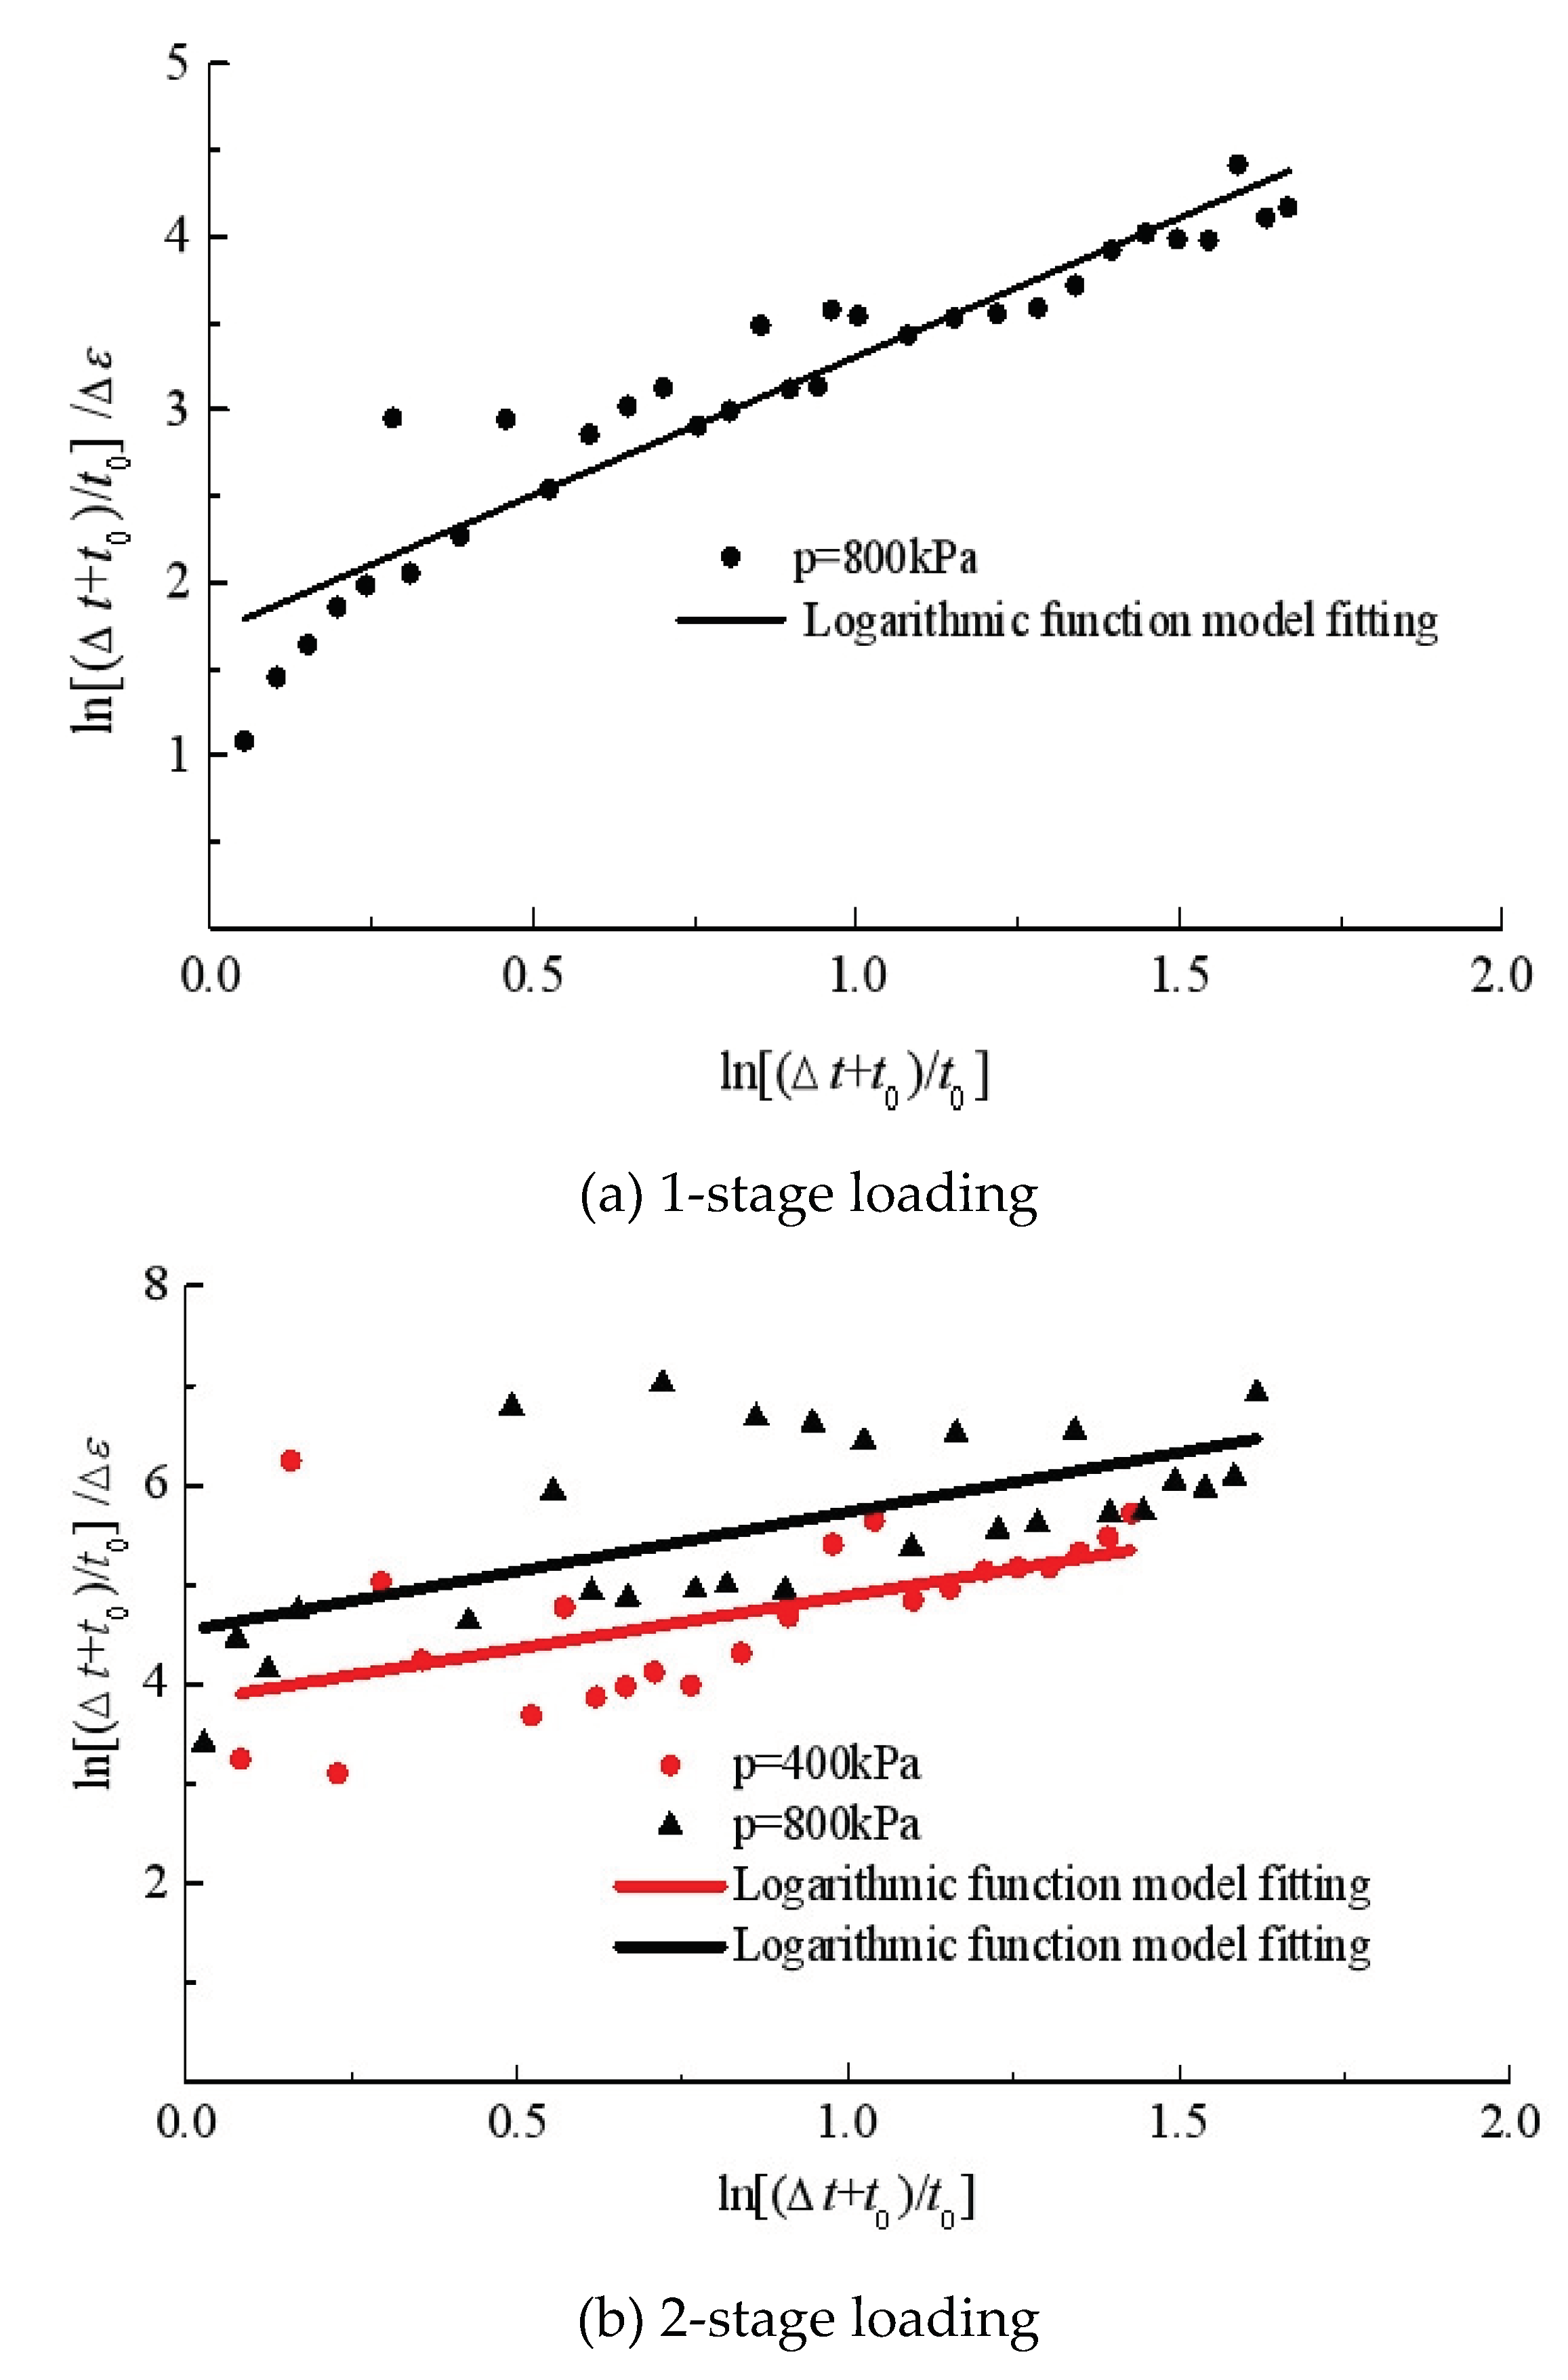
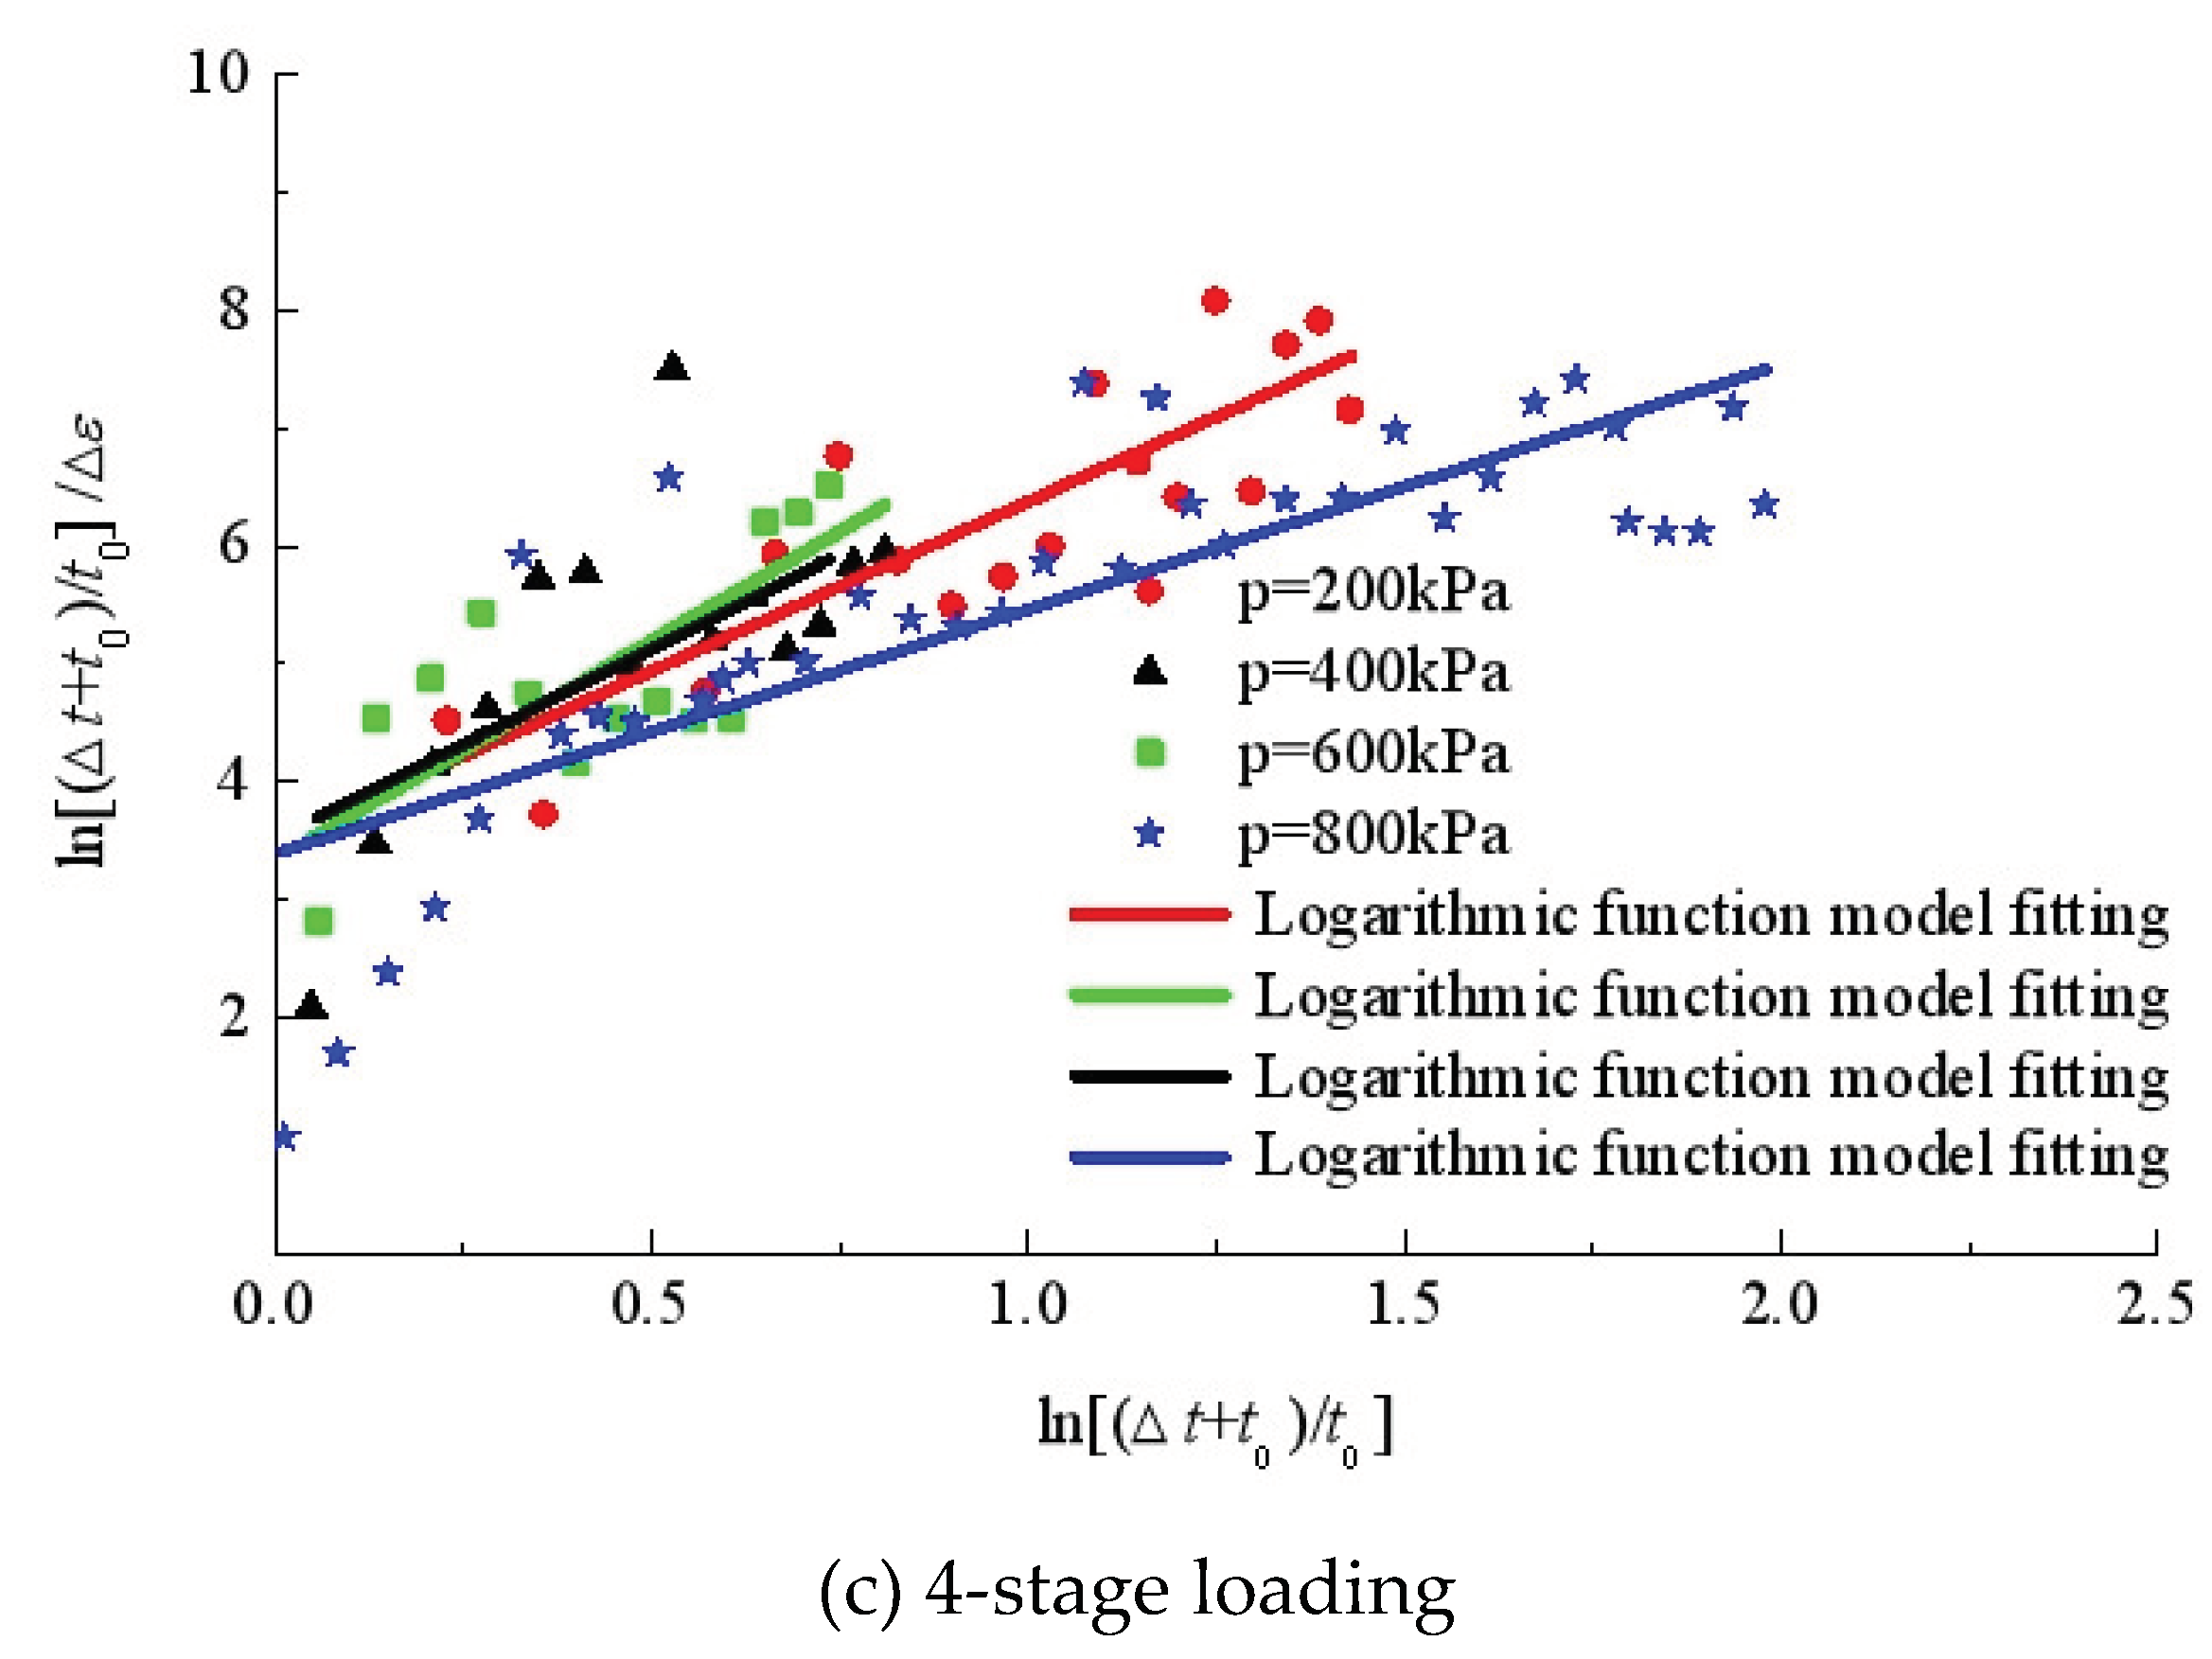
in Eq. (1), the non-linear creep model can be applied to the triaxial
compression tests, as shown in
Figure 9. The fitting parameters are given in
Table 3. Also, the non-linear creep model seems to be less consistent with the deviatoric strain development in the triaxial compression test, especially in the tests with preload. The parameters
(0.0053-2.3256) vary within a wide range for
q=360kPa.
6.2. Hyperbolic Model
According to Figs. 6(a) and 7(a), a non-linear hyperbolic model for isotropic compression is proposed as follows.
It can be transformed to:
where
a and
b are two parameters to be determined according to the test data of creep. Here,
a is assumed to be inverse to the initial strain rate of creep and
b can be inverse to an attenuation factor of strain rate with time.
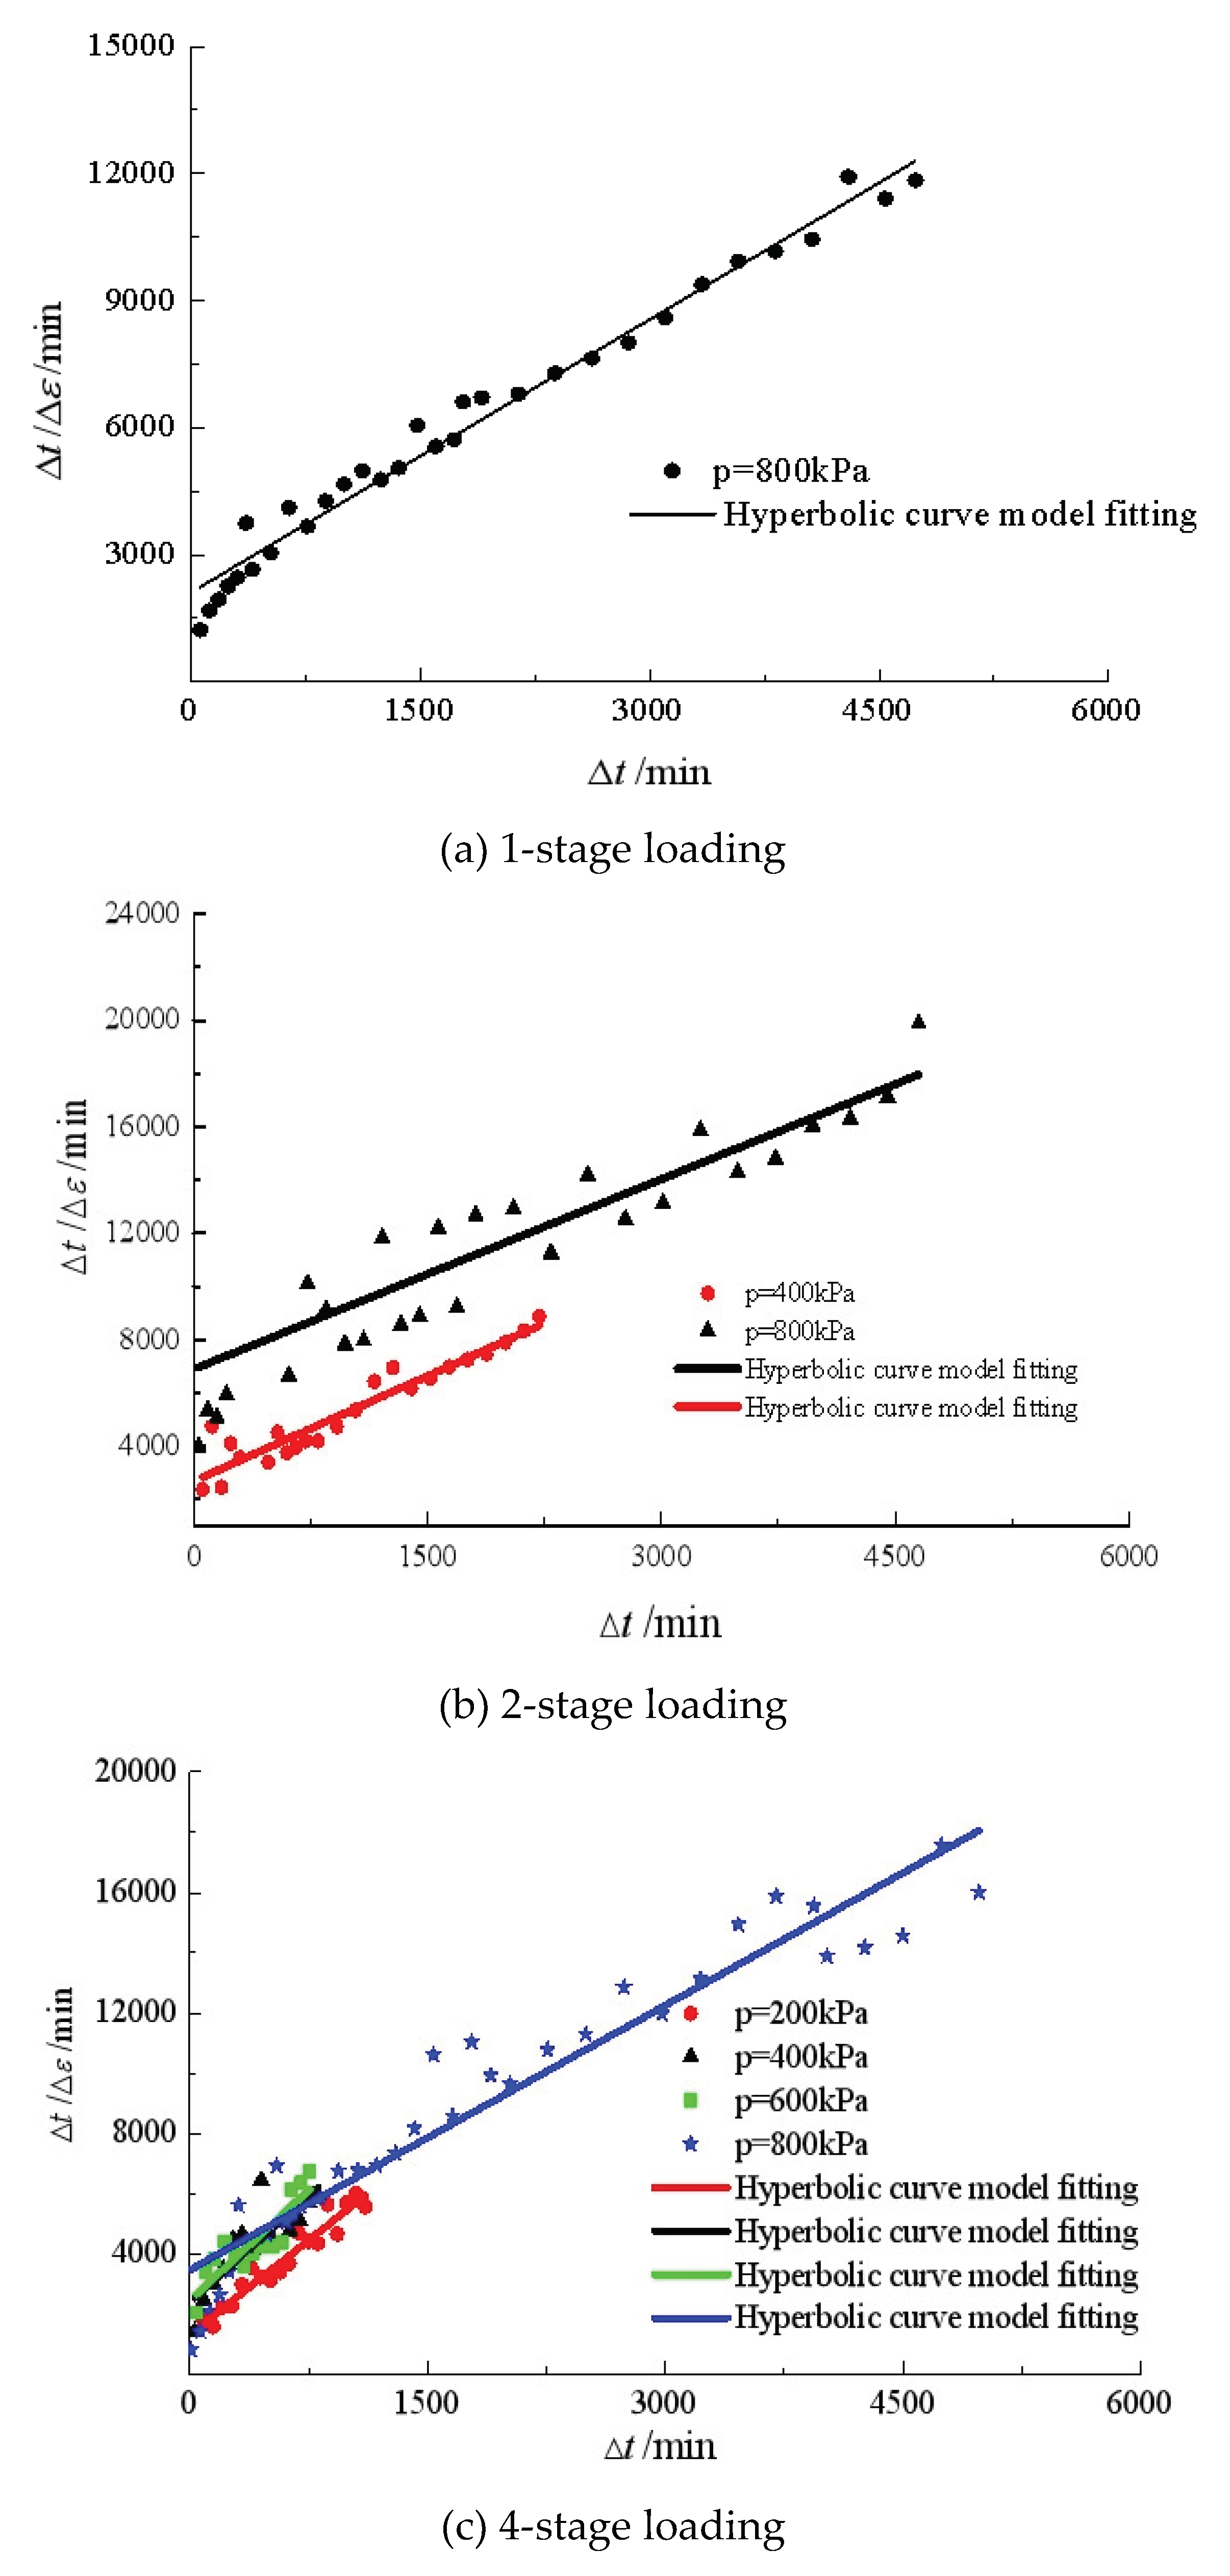
Figure 10 shows the fitting lines by the hyperbolic model to the creep curves under isotropic compression. It is observed that the hyperbolic model can better fit the creep curves under different loading steps than the nonlinear logarithmic model Eq. (3).
Table 4 gives the fitting parameters of the hyperbolic model. It indicates that the parameters
a and
b depend on the loading steps and need further studies.
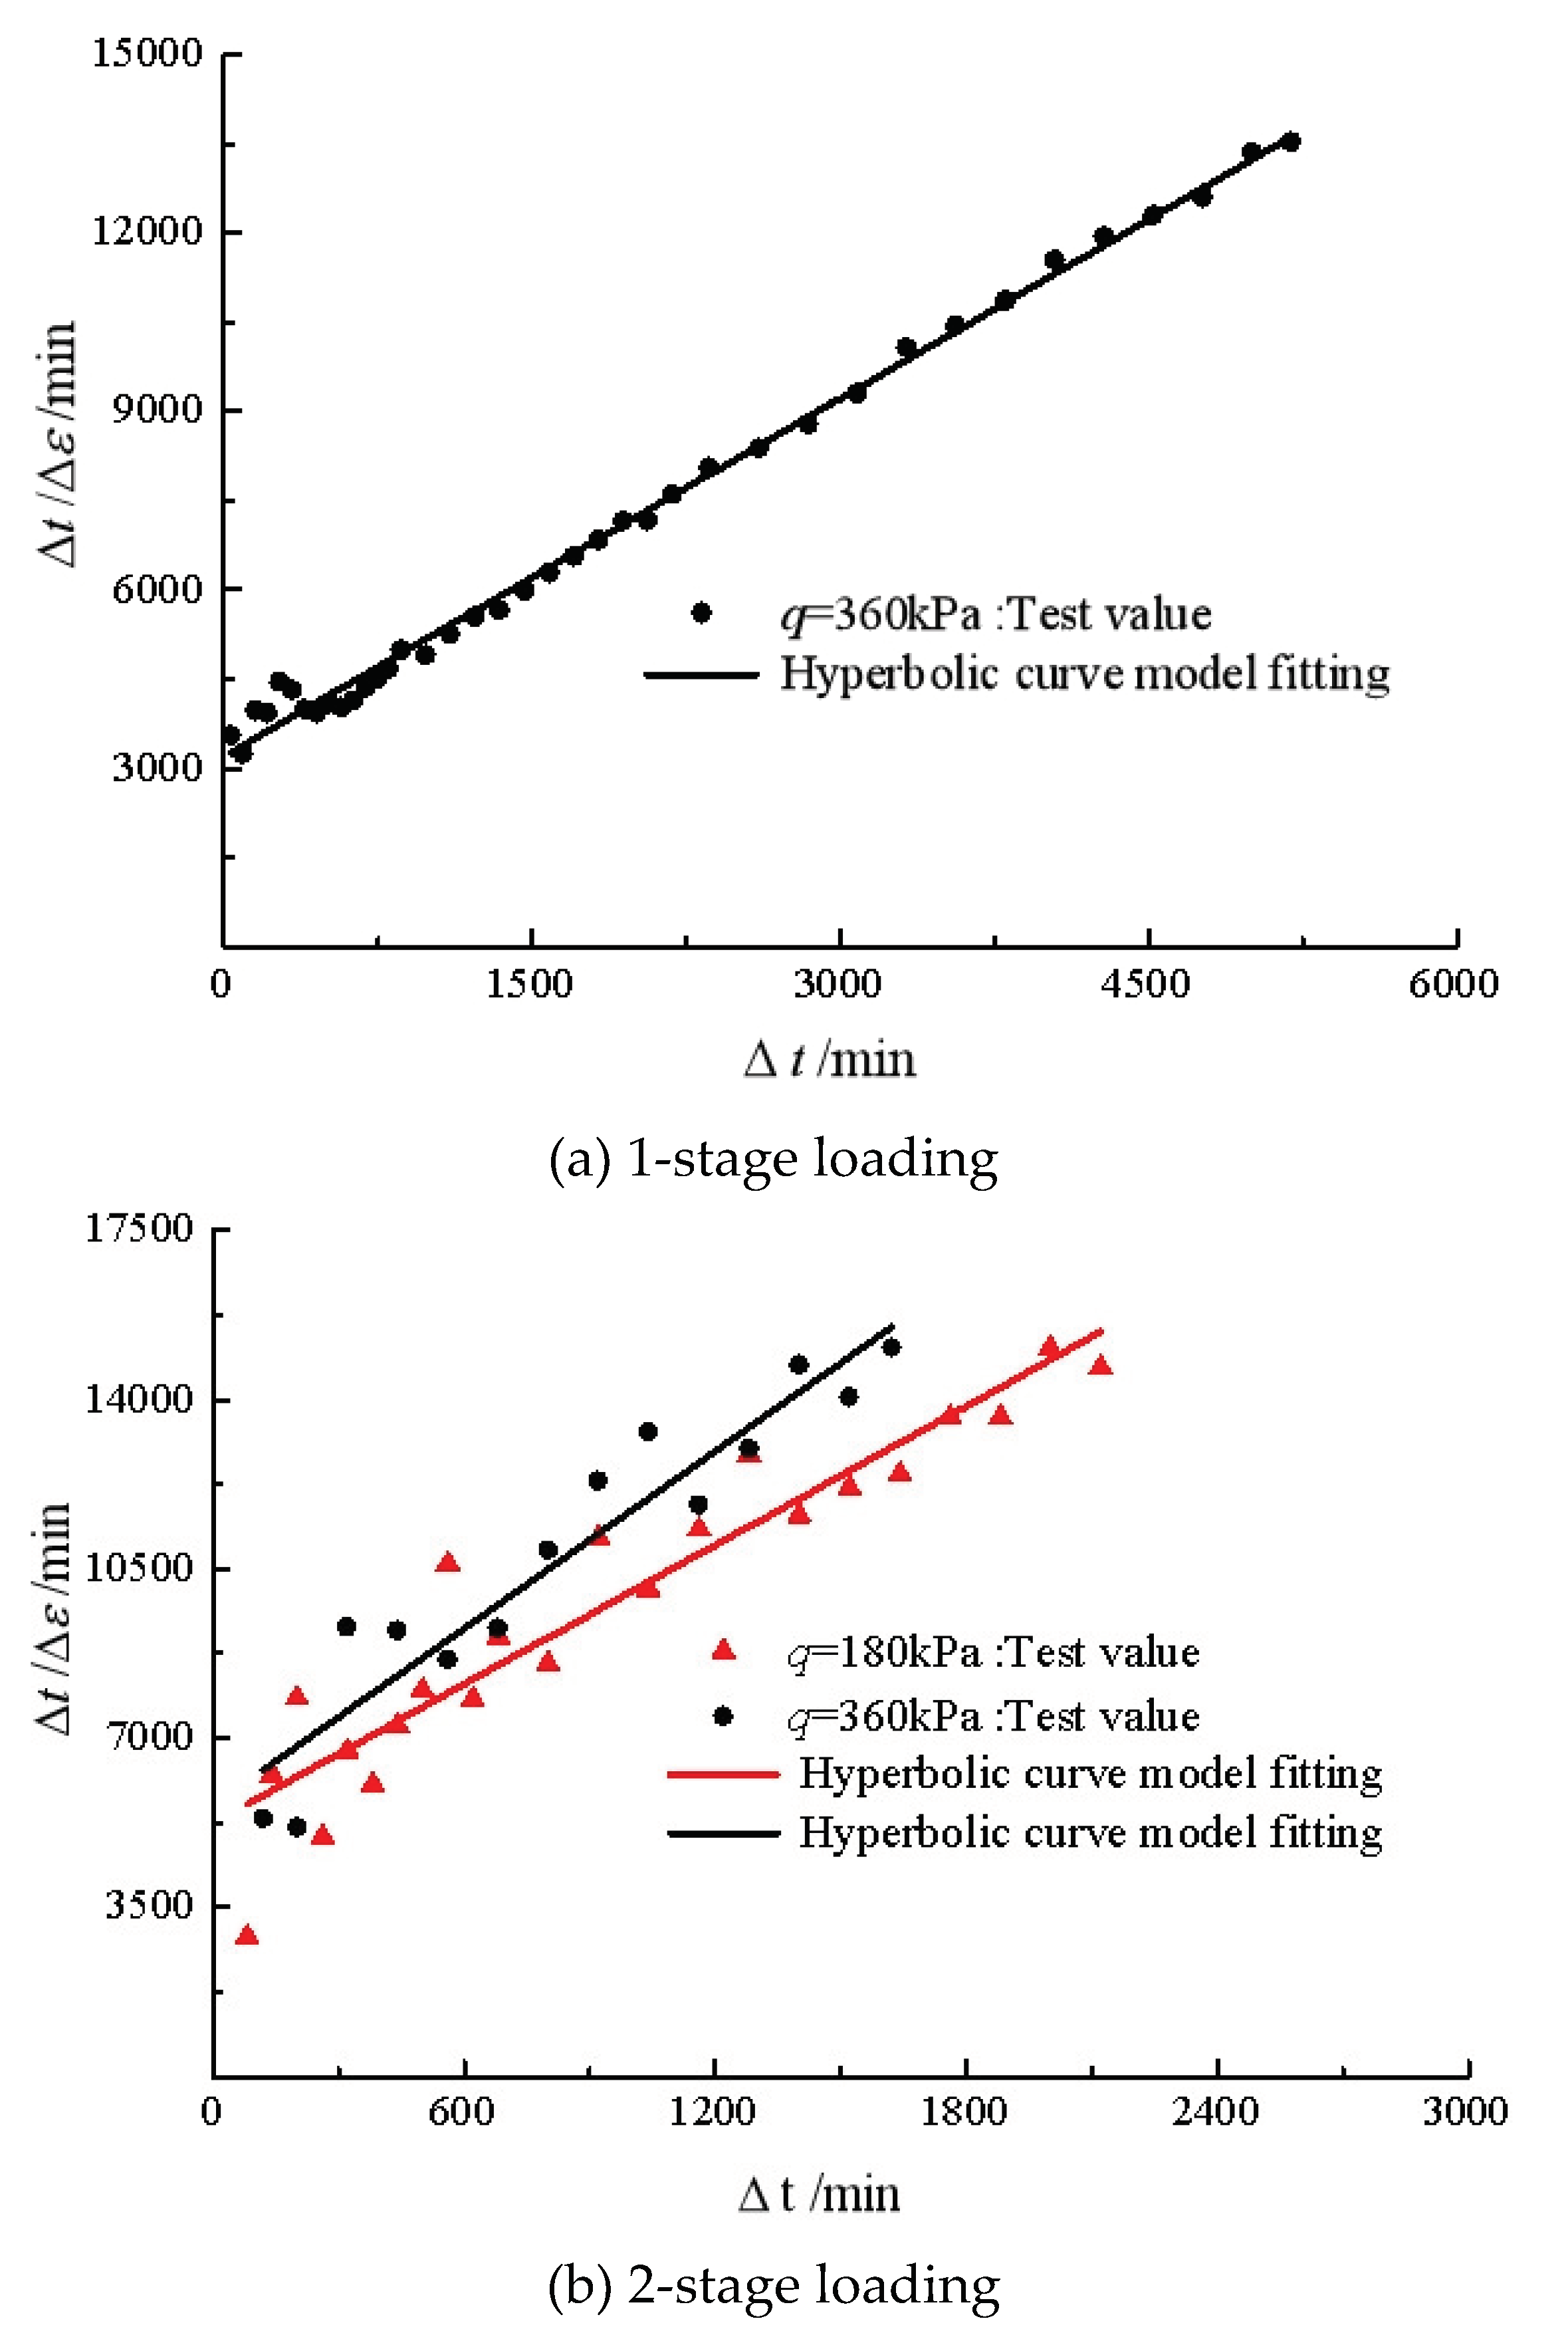
If substituting
to
in Eq. (7), this model can also be used for the triaxial compression test.
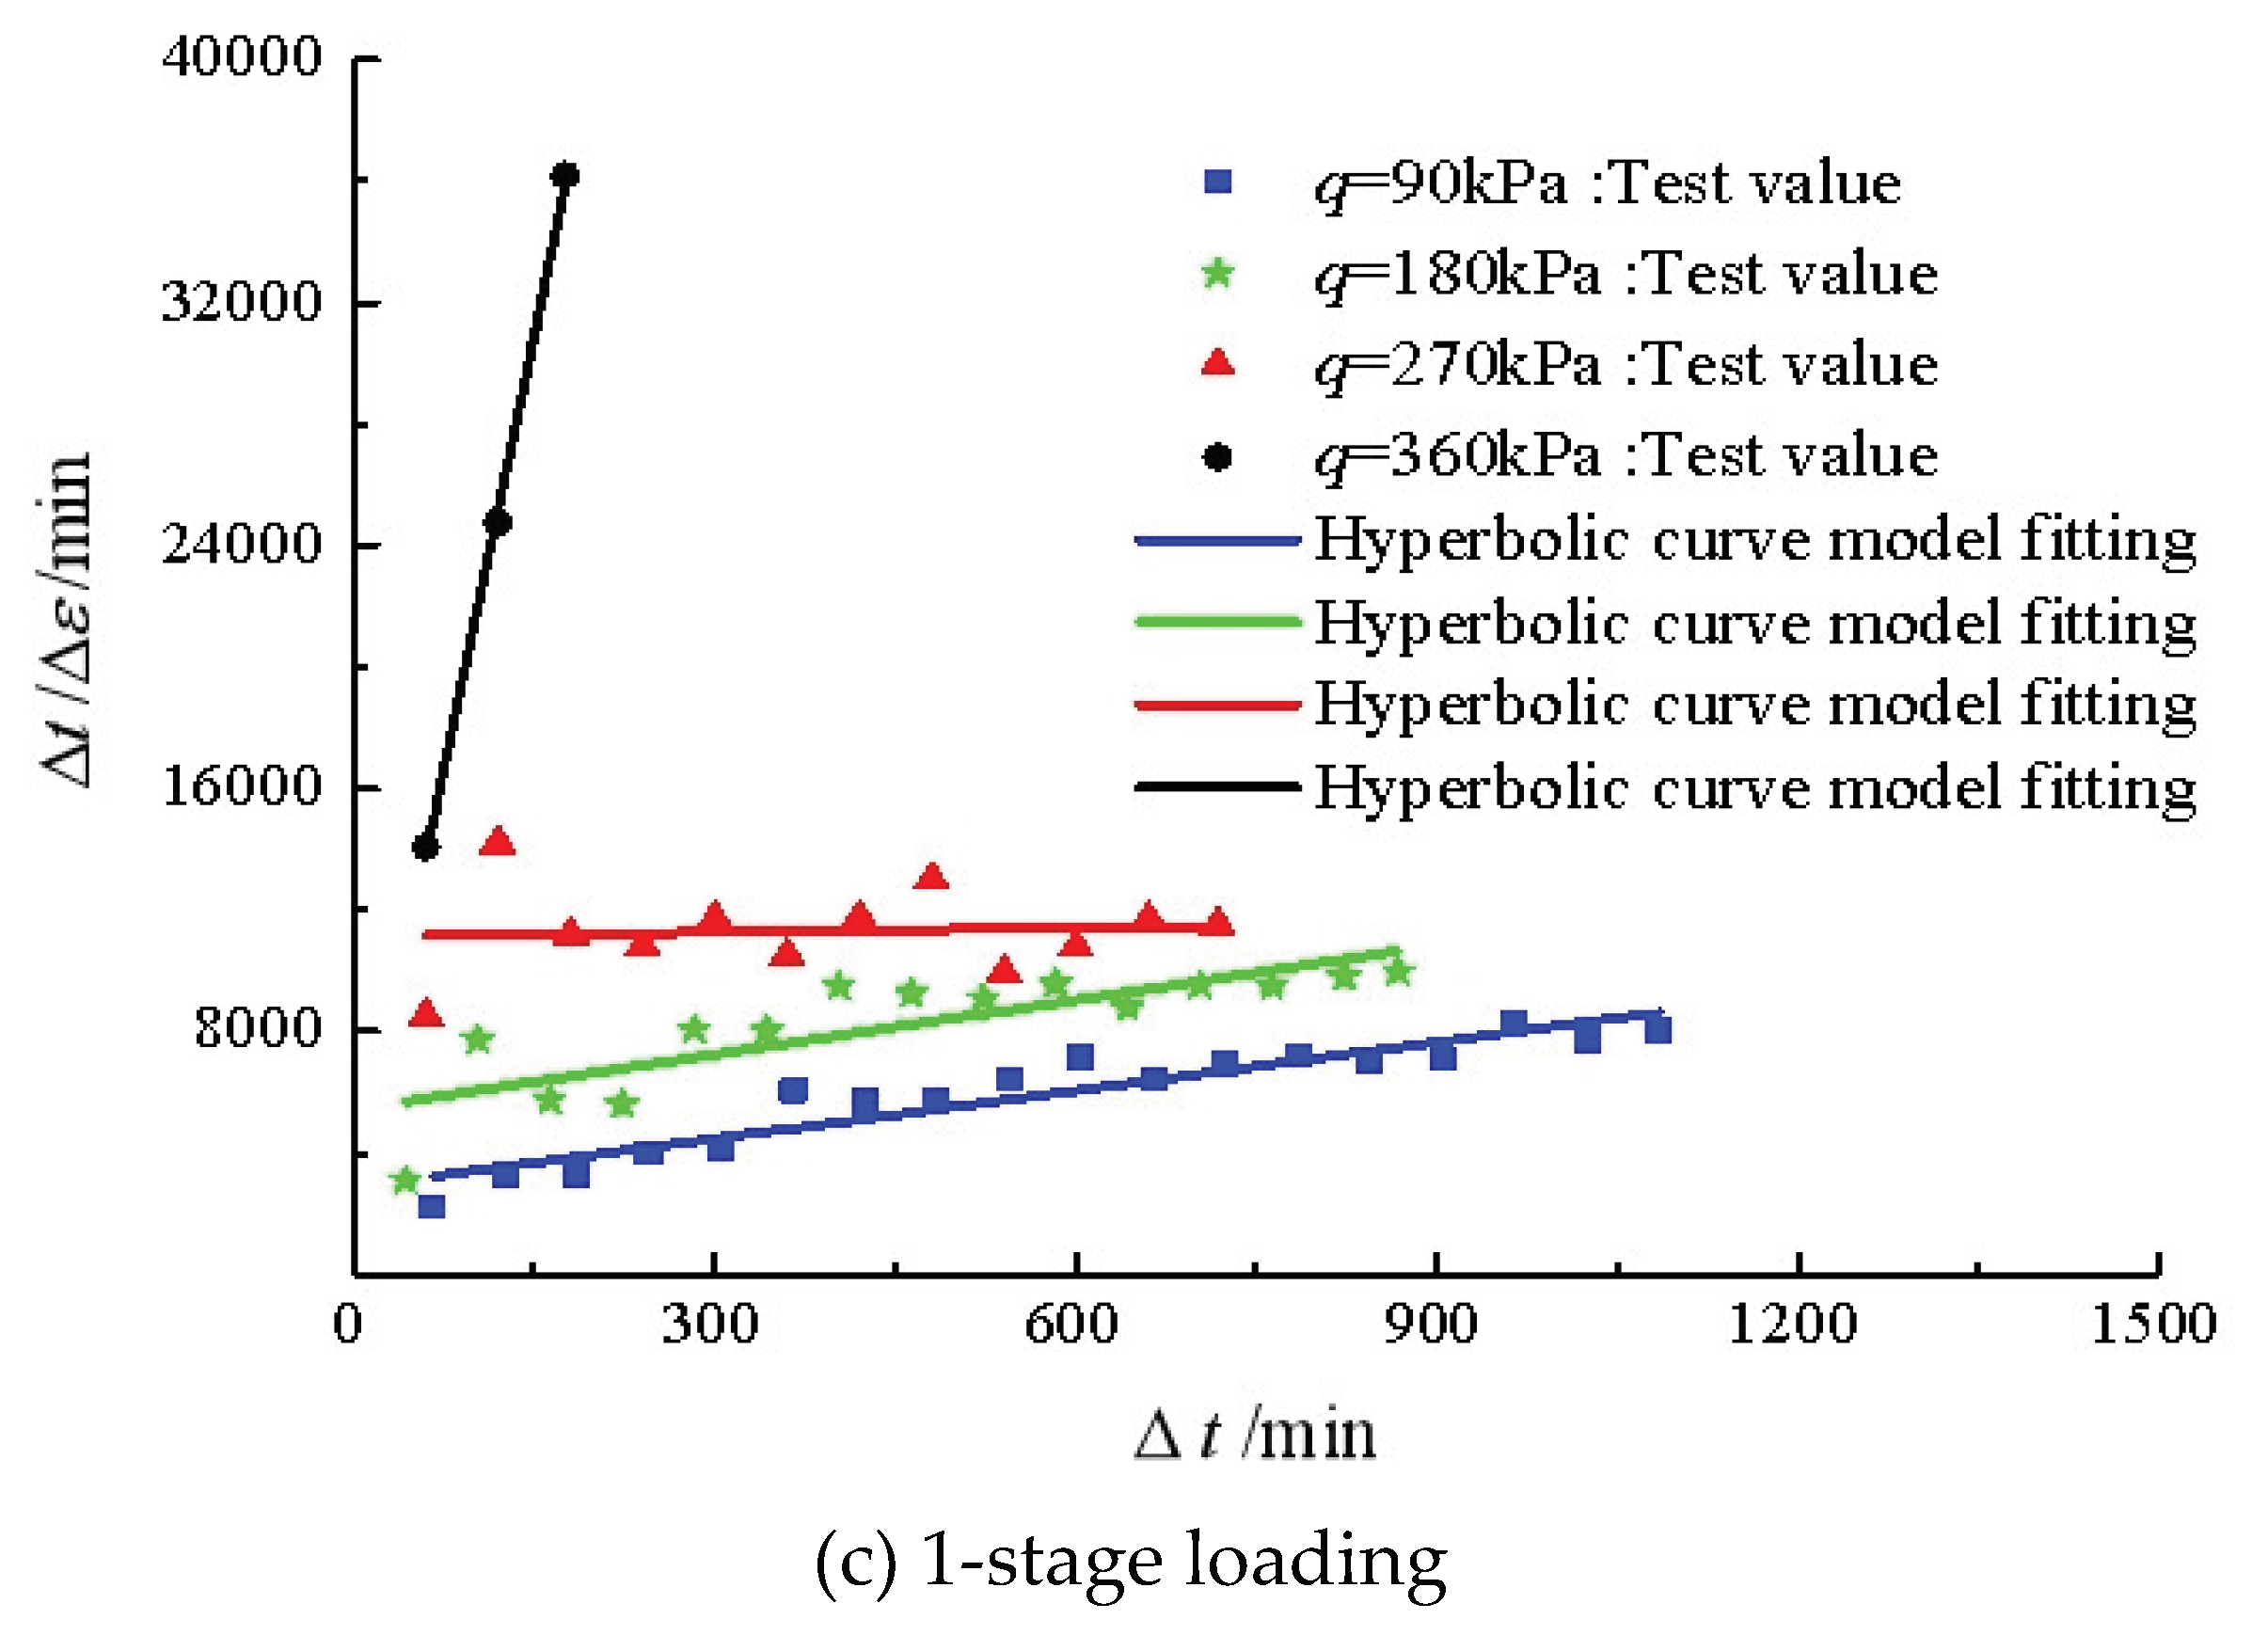
Figure 11 shows the fitting lines of the creep curves under triaxial compression. The results indicate that this hyperbolic model can better fit the triaxial compression curves. The fitting parameters of
a and
b are given in
Table 4. The parameter
b, which is assumed to inversely proportional to the attenuation factor of strain rate, varies from 2.005 to 190.04 for creep at
q=360 kPa, which indicates that the preload in triaxial compression may have a significant effect on the creep behavior of silty clay under shearing.
7. Discussions
7.1. Creep of Silty Clay
The time-dependence of soil involves the occurrence of creep under a constant stress state. In engineering practice, the stress state of a soil element can be considered to remain constant after construction/excavation. It seems sound to study soil’s creep behavior under a constant total stress state based on the condition that the soil material is assumed to be continuous, and the overall deformation of the soil is of interest.
In this study, Figs. 2 and 4 present the overall strain development with time. It is clear that the pre-loading steps have different effects on strain development under different loading paths. For isotropic compression, the overall volumetric strain of reconstituted silty clay specimen responds only to the total mean stresses but not to the pre-loading steps; while for triaxial compression, the overall deviatoric strain is sensitive to pre-loading steps.
However, due to the excess pore water pressure induced by the applied stresses in silty clay specimens, the effective stresses may change with the dissipation of the pore water pressure. Therefore, the overall deformation after the total stress being applied involves both consolidation compression and secondary compression (creep). The primary consolidation can be solved by the theory of soil consolidation, while the creep description in this study focuses on secondary compression.
7.2. The Determination of tEOP
For creep description, the division of the consolidation and the secondary compression are vital. It is supposed that the primary consolidation is controlled by the dissipation of the excess pore water pressure induced by loading; while the secondary compression is contributed to the skeleton adjustment of the soil after the total stresses are entirely transformed into effective stresses. However, in the real world, it is impossible to separate these two processes at one time. In a high degree of consolidation, i.e., u/u0<10%, the dissipation of pore pressure slows down and the skeleton adjustment controls the deformation rate, which in turn may affect the pore pressure dissipation. Taking this into consideration, the division time of the primary consolidation and the secondary compression can be selected before the pore pressure entirely dissipates.
In this study, the consolidation degree of 95% is used to determine tEOP, whose validity needs to be demonstrated by various creep models.
7.3. The Creep Models for Silty Clay
The characteristics of soil’s creep strain against time give the hint of a nonlinear model. Two models with simple parameters, i.e., the Non-linear logarithmic model proposed by Yin [
25] and the Hyperbolic model, are tested in this study. The comparison demonstrates that the Hyperbolic model shows a promising ability to creep description for reconstituted silty clay under both isotropic compression and triaxial compression. However, the parameters of the model vary over a wide range with loading steps, and the physical properties of the parameters are not clear for application. For these reasons, it is recommended that the nature of soil creep can be examined by micro-examination methods to provide a sound support for creep model and related parameters.
7.4. The Influence of Pre-Loading Steps on the Creep Behavior of Silty Clay
When a load is applied to the foundation, the induced stress state increment can be dissolved into two parts, i.e., mean stress increment Δp and differential stress increment Δq. If it is assumed that the responses of soil to these two stress states can be superposed, the creep behaviors under these two stress states need to be elucidated separately.
As shown in Figs. 2 and 4, the pre-loading steps have an obvious effect on the creep strain development under differential pressures, but have little effect on that under hydraulic pressure. It can be seen from
Table 2 that the pre-loading may prolong the consolidation time under triaxial compression, and that the consolidation time under isotropic compression at 800 kPa did not significantly change under different preloads.
Since the undrained strengths of reconstituted silty clay with creep with pre-shearing (
Figure 5) are higher than those without pre-shearing (
Figure 3), it can be deduced that the creep under deviatoric stress helps to improve the resistance of silty clay to failure and deformation when the loading path is similar to its pre-loading process. However, the creep under hydraulic pressure may not help to improve the soil resistance to failure.
The different responses of silty clay to isotropic compression and triaxial compression may relate to the structure evolution within the soil. For isotropic compression, the force between soil particles distributes uniformly in different directions, but for triaxial compression, the force distribution may have a dominant direction and induce a degree of anisotropy within the soil structure. This requires more work by discrete element method simulations.
8. Conclusions
Isotropic compression and triaxial compression are two typical loading paths for studying soil behaviors. In this study, the effect of preload on soil creep behaviors under these two loading paths is examined by a series of laboratory tests.
- (1)
The preload has an obvious influence on the creep behavior of reconstituted silty clay under triaxial shear creep tests, but has little influence on that under isotropic compression tests.
- (2)
The determination of tEOP is vital to develop a suitable creep model for silty clay. The method of using the dissipation of pore water pressure is effective, but the degree of dissipation related to tEOP needs further study.
- (3)
The hyperbolic model (Eq. 6) proposed in this study can better fit the testing data than the nonlinear logarithmic model, but the model parameters are pre-loading dependent for triaxial compression, and a further examination using micro-scale approaches is encouraged.
Acknowledgements
This research is financially supported by National Natural Science Foundation of China with Grant No. 51878616, the Fundamental Scientific Research Funds for Universities of Zhejiang Province with Grant No. FRF20QN001 and the Visiting Engineer program in Zhejiang Province with Grant No. FG2023341.
References
- Augustesen, A.; Liingaard, M.; Lade, P.V. Evaluation of time-dependent behavior of soils. International Journal of Geomechanics 2004, 4, 137–156. [Google Scholar] [CrossRef]
- Bishop, A.W.; Lovenbury, H.T. Creep characteristics of two undisturbed clays(C). In Proceedings of 7th International Conference of Soil Mechanics and Foundation Engineering 1969, 1, 29–37. [Google Scholar]
- Fodil, A.; Aloulou, W.; Hicher, P.Y. Viscoplastic behavior of soft clay. Geotechnique 1997, 47, 581–591. [Google Scholar] [CrossRef]
- Xiao, B. Study on creep characteristics and creep model of reconstituted clay [D]. Hangzhou: Zhejiang University of Technology, 2017.
- Hu, M.Y.; Xiao, B.; Wu, S.C. , et al. Research on creep characteristics and creep model of reconstituted rilty clay. Chinese Journal of Underground Space and Engineering 2018, 14, 332–340. (in Chinese). [Google Scholar]
- Leroueil, S.; Kabbaj, M.; Tavenas, F.; Bouchard, R. Stress strain-strain rate relation for the compressibility of sensitive natural clays. Geotechnique 1985, 35, 159–180. [Google Scholar] [CrossRef]
- Leroueil, S.; Kabbaj, M.; Tavenas, F.; Bouchard, R. Stress-strain-strain rate relation for the compressibility of sensitive naturalclays. Geotechnique 1985, 35, 159–180. [Google Scholar] [CrossRef]
- Mesri, G.; Godlewski, P.M. Time and stress-compressibility interrelationship. ASCE Journal of the Geotechnical Engineering Division 1977, 103, 417–430. [Google Scholar] [CrossRef]
- Vaid, Y.P.; Campanella, R.G. Time-dependent behavior of undisturbed clay. ASCE Journal of the Geotechnical Engineering Division 1977, 103, 693–709. [Google Scholar] [CrossRef]
- Vyalov, S.S.; Khamed, A.S. Creep and long-term strength of clayey soils in triaxial compression. Soil Mechanics and Foundation Engineering 1997, 34, 9–14. [Google Scholar] [CrossRef]
- Maria, E.; Soares, M.; Serge, L.; de Souza Soares de Almeida, M. Viscous behaviour of St-Roch-de-l’Achigan clay. Quebec, Can. Geotech 2004, 41, 25–38. [Google Scholar]
- Miao, L.; Zhang, J.; Wang, F.; Houston, S.L. Time-dependent deformation behavior of Jiangsu marine clay. Marine Georesources and Geotechnology 2008, 26, 86–100. [Google Scholar] [CrossRef]
- Mesri, G. Coefficient of secondary compression. J. Soil. Mech. Div. ASCE 1973, 123–137. [Google Scholar] [CrossRef]
- Newland, P.L.; Allely, B.H. A study of the consolidation characteristics of a clay. Geotechnique 1960, 10, 62–74. [Google Scholar] [CrossRef]
- Wang, Z.; Qiao, L.; LI Shucai. Research on the influence of load level and void ratio on soil secondary compression properties. Chinese Journal of Civil Engineering 2013, 46, 112–118. (in Chinese). [Google Scholar]
- Zeng, L.-l.; Hong, Z.-s.; Liu, S.-y.; et al. Variation law and quantitative evaluation of secondary consolidation behavior for remolded clays. Chinese Journal of Geotechnical Engineering 2012, 34, 1496–1500. (in Chinese). [Google Scholar]
- Wu, S.; Hu, M.; Zhang, Y. Experimental study on secondary consolidation characteristics of silty clay. Journal of Hydraulic Engineering 2015, 46, 338–342. [Google Scholar]
- Luo, Q.; Chen, X.; Wang, S.; et al. Experimental and empirical model research on deformation aging of soft clay. Rock and Soil Mechanics 2016, 37, 66–75. [Google Scholar]
- Chen, X. Consolidation effect of soft soil deposited by sea-land alternating facies. Chinese Journal of Geotechnical Engineering 2011, 33, 520–528. (in Chinese). [Google Scholar]
- Zhou, P. Experimental and model study on triaxial creep characteristics of saturated cohesive soil [D]. Hangzhou: Zhejiang University of Technology, 2018.
- Singh, A.; Mitchell, J.K. Creep potential and rupture of soils. Proc. 7th Int. Proc. 7th Int. Conf. Soil. Mech. Found. Eng. (Mexico) 1969, 379–384. [Google Scholar]
- Sekiguchi, H. Rheological characteristics of clays. Proc. 9th Int. Conf. Soil. Mech. Found. Eng. (Tokyo) 1977, 1, 289–292. [Google Scholar]
- Taylor, D.W.; Merchant, W.A. A theory of day consolidation accounting for secondary compressions. Journal of Mathematic sand Physics 1940, 19, 167–185. [Google Scholar]
- Tavenas, M.; Leroueil, F.; La Rochelle, P.; Roy, M. Creep behaviour of an undisturbed lightly overconsolidated clay. Can. Geotech 1978, 15, 402–423. [Google Scholar] [CrossRef]
- Yin J, H. Non-linear creep of soil in oedometer tests. Geotechnique 1999, 49, 699–707. [Google Scholar] [CrossRef]
- Singh, A.; Mitchell, J.K. General stress - strain-time function for soils. Journal of the Soil Mechanics and Foundation Division 1968, 94, 21–46. [Google Scholar] [CrossRef]
- Mesri, G.; Robres-Cordero, E.; Shiels, D.R. , et al. Shear stress-strain-time behavior of clays. Geotechnique 1981, 31, 537–552. [Google Scholar] [CrossRef]
- Xiao, B.; Hu, M.Y.; Zhou, P.J. , et al. Creep behavior of saturated clay in triaxial test and a hyperbolic model. Geofluids 2021, 2021, 1–12. [Google Scholar]
- Hu, M.; Xiao, B.; Wu, S.; Zhou, P.; Lu, Y. Creep of Reconstituted Silty Clay with Different Pre-loading(C). Proceedings of China-Europe Conference on Geotechnical Engineering, Springer Scienceand Business Media LLC, 2018, 1, 529–533. [Google Scholar]
- Bodas, F.T.M.; Potts, D.M.; Zdravkovic, L. The effect of creep on the short-term bearing capacity of pre-loaded footings. Computers and Geotechnics. 2012, 42, 99–108. [Google Scholar] [CrossRef]
- Wu, S.C.; Hu, M.Y.; Zhang, Y.; Xiao, B. The second compression of silty clay. Chinese Journal of Hydraulic Engineering 2015, 46, 338–342. [Google Scholar]
|
Disclaimer/Publisher’s Note: The statements, opinions and data contained in all publications are solely those of the individual author(s) and contributor(s) and not of MDPI and/or the editor(s). MDPI and/or the editor(s) disclaim responsibility for any injury to people or property resulting from any ideas, methods, instructions or products referred to in the content. |
© 2024 by the authors. Licensee MDPI, Basel, Switzerland. This article is an open access article distributed under the terms and conditions of the Creative Commons Attribution (CC BY) license (http://creativecommons.org/licenses/by/4.0/).
