Submitted:
09 April 2024
Posted:
10 April 2024
You are already at the latest version
Abstract
Keywords:
1. Introduction
2. Materials and Methods
2.1. Overview of the Study Area
2.1.1. Spain
2.1.2. California
2.2. Global Human Settlement Layer (GHSL)
2.3. Discrete Global Grid
2.4. Methods
3. Results
4. Discussion
5. Conclusions
Author Contributions
Funding
Conflicts of Interest
Abbreviations
References
- Senande-Rivera, M.; Insua-Costa, D.; Miguez-Macho, G. Spatial and temporal expansion of global wildland fire activity in response to climate change. Nature Communications 2022, 13, 1208. [Google Scholar] [CrossRef] [PubMed]
- Calkin, D.E.; Barrett, K.; Cohen, J.D.; Finney, M.A.; Pyne, S.J.; Quarles, S.L. Wildland-urban fire disasters aren’t actually a wildfire problem. Proceedings of the National Academy of Sciences 2023, 120, e2315797120. [Google Scholar] [CrossRef]
- González-Olabarria, J.R.; Mola-Yudego, B.; Coll, L. Different Factors for Different Causes: Analysis of the Spatial Aggregations of Fire Ignitions in Catalonia (Spain). Risk Analysis 2015, 35, 1197–1209. [Google Scholar] [CrossRef] [PubMed]
- Castro, A.C.M.; Nunes, A.; Sousa, A.; Lourenço, L. Mapping the Causes of Forest Fires in Portugal by Clustering Analysis. Geosciences 2020, 10, 53. [Google Scholar] [CrossRef]
- Marey-Pérez, M.F.; Fuentes-Santos, I.; Saavera-Nieves, P.; González-Manteiga, W. Non-parametric comparative analysis of the spatiotemporal pattern of human-caused and natural wildfires in Galicia. International Journal of Wildland Fire 2022, 32, 178–194. [Google Scholar] [CrossRef]
- Sari, F. Identifying anthropogenic and natural causes of wildfires by maximum entropy method-based ignition susceptibility distribution models. Journal of Forestry Research 2023, 34, 355–371. [Google Scholar] [CrossRef]
- Certini, G.; Nocentini, C.; Knicker, H.; Arfaioli, P.; Rumpel, C. Wildfire effects on soil organic matter quantity and quality in two fire-prone Mediterranean pine forests. Geoderma 2011, 167-168, 148–155. [Google Scholar] [CrossRef]
- Caon, L.; Vallejo, V.R.; Ritsema, C.J.; Geissen, V. Effects of wildfire on soil nutrients in Mediterranean ecosystems. Earth-Science Reviews 2014, 139, 47–58. [Google Scholar] [CrossRef]
- Agbeshie, A.A.; Abugre, S.; Atta-Darkwa, T.; Awuah, R. A review of the effects of forest fire on soil properties. Journal of Forestry Research 2022, 33, 1419–1441. [Google Scholar] [CrossRef]
- Levin, N.; Levental, S.; Morag, H. The effect of wildfires on vegetation cover and dune activity in Australia’s desert dunes: a multisensor analysis. International Journal of Wildland Fire 2012, 21, 459. [Google Scholar] [CrossRef]
- Foster, C.N.; Barton, P.S.; Robinson, N.M.; MacGregor, C.I.; Lindenmayer, D.B. Effects of a large wildfire on vegetation structure in a variable fire mosaic. Ecological Applications 2017, 27, 2369–2381. [Google Scholar] [CrossRef] [PubMed]
- Or, D.; Furtak-Cole, E.; Berli, M.; Shillito, R.; Ebrahimian, H.; Vahdat-Aboueshagh, H.; McKenna, S.A. Review of wildfire modeling considering effects on land surfaces. Earth-Science Reviews 2023, 245, 104569. [Google Scholar] [CrossRef]
- Schaffer, K.E.; Hedwall, S.J. ; Jr., W.F.L., Fire and animal interactions. In Fire in California´s ecosystems; Sugihara, N.G.; van Wagendonk, J.W.; Schaffer, K.E.; Fites-Kaufman, J.; Thode, A.E., Eds.; University of California, 2006; pp. 118–144.
- González, T.M.; González-Trujillo, J.D.; Muñoz, A.; Armenteras, D. Effects of fire history on animal communities: a systematic review. Ecological Processes 2022, 11, 11. [Google Scholar] [CrossRef]
- Jolly, C.J.; Dickman, C.R.; Doherty, T.S.; van Eeden, L.M.; Geary, W.L.; Legge, S.M.; Woinarski, J.C.Z.; Nimmo, D.G. Animal mortality during fire. Global Change Biology 2022, 28, 2053–2065. [Google Scholar] [CrossRef] [PubMed]
- Isaza, D.F.G.; Cramp, R.L.; Franklin, C.E. Fire and rain: A systematic review of the impacts of wildfire and associated runoff on aquatic fauna. Global Change Biology 2022, 28, 2578–2595. [Google Scholar] [CrossRef] [PubMed]
- Brown, D.J.; Baccus, J.T.; Means, D.B.; Forstner, M.R.J. Potential Positive Effects of Fire on Juvenile Amphibians in a Southern USA Pine Forest. Journal of Fish and Wildlife Management 2011, 2, 135–145. [Google Scholar] [CrossRef]
- Mercer, D.E.; Pye, J.M.; Prestemon, J.P.; Butry, D.T.; Holmes, T.P.; Wildfires, F. Economic Effects of Catastrophic Wildfires: Assessing the Effectiveness of Fuel Reduction Programs for Reducing the Economic Impacts of Catastrophic Forest Fire Events; 2000.
- Davis, E.J.; Moseley, C.; Nielsen-Pincus, M.; Jakes, P.J. The Community Economic Impacts of Large Wildfires: A Case Study from Trinity County, California. Society & Natural Resources 2014, 27, 983–993. [Google Scholar] [CrossRef]
- Molina, J.R.; González-Cabán, A.; y Silva, F.R. Wildfires impact on the economic susceptibility of recreation activities: Application in a Mediterranean protected area. Journal of Environmental Management 2019, 245, 454–463. [Google Scholar] [CrossRef] [PubMed]
- Kim, E.; Kwon, Y.J. Analyzing indirect economic impacts of wildfire damages on regional economies. Risk Analysis 2023, 43, 2631–2643. [Google Scholar] [CrossRef]
- Meier, S.; Elliott, R.J.R.; Strobl, E. The regional economic impact of wildfires: Evidence from Southern Europe. Journal of Environmental Economics and Management 2023, 118, 102787. [Google Scholar] [CrossRef]
- Luo, T. Labor market impacts of destructive California wildfires. Monthly Labor Review 2023. [Google Scholar] [CrossRef]
- Walls, M.A.; Wibbenmeyer, M. How Local are the Local Economic Impacts of Wildfires?
- Sfetsos, A.; Giroud, F.; Clemencau, A.; Varela, V.; Freissinet, C.; LeCroart, J.; Vlachogiannis, D.; Politi, N.; Karozis, S.; Gkotsis, I.; et al. Assessing the Effects of Forest Fires on Interconnected Critical Infrastructures under Climate Change. Evidence from South France. Infrastructures 2021, 6, 16. [Google Scholar] [CrossRef]
- Rad, A.M.; Abatzoglou, J.T.; Kreitler, J.; Alizadeh, M.R.; AghaKouchak, A.; Hudyma, N.; Nauslar, N.J.; Sadegh, M. Human and infrastructure exposure to large wildfires in the United States. Nature Sustainability 2023, 6, 1343–1351. [Google Scholar] [CrossRef]
- Park, H.; Nam, K.; Lim, H. Is critical infrastructure safe from wildfires? A case study of wildland-industrial and -urban interface areas in South Korea. International Journal of Disaster Risk Reduction 2023, 95, 103849. [Google Scholar] [CrossRef]
- Sayarshad, H.R.; Ghorbanloo, R. Evaluating the resilience of electrical power line outages caused by wildfires. Reliability Engineering & System Safety 2023, 240, 109588. [Google Scholar] [CrossRef]
- Papathoma-Köhle, M.; Schlögl, M.; Garlichs, C.; Diakakis, M.; Mavroulis, S.; Fuchs, S. A wildfire vulnerability index for buildings. Scientific Reports 2022, 12, 6378. [Google Scholar] [CrossRef] [PubMed]
- Kasraee, N.K.; Hawbaker, T.J.; Radeloff, V.C. Identifying building locations in the wildland–urban interface before and after fires with convolutional neural networks. International Journal of Wildland Fire 2023, 32, 610–621. [Google Scholar] [CrossRef]
- Radeloff, V.C.; Mockrin, M.H.; Helmers, D.; Carlson, A.; Hawbaker, T.J.; Martinuzzi, S.; Schug, F.; Alexandre, P.M.; Kramer, H.A.; Pidgeon, A.M. Rising wildfire risk to houses in the United States, especially in grasslands and shrublands. Science 2023, 382, 702–707. [Google Scholar] [CrossRef] [PubMed]
- Duff, T.J.; Penman, T.D. Determining the likelihood of asset destruction during wildfires: Modelling house destruction with fire simulator outputs and local-scale landscape properties. Safety Science 2021, 139, 105196. [Google Scholar] [CrossRef]
- Hawbaker, T.J.; Henne, P.D.; Vanderhoof, M.K.; Carlson, A.R.; Mockrin, M.H.; Radeloff, V.C. Changes in wildfire occurrence and risk to homes from 1990 through 2019 in the Southern Rocky Mountains, USA. Ecosphere 2023, 14, e4403. [Google Scholar] [CrossRef]
- Fitch, R.A.; Mueller, J.M.; Meldrum, J.; Huber, C. Estimating proximity effects to wildfire fuels treatments on house prices in Cibola National Forest, New Mexico, USA. Landscape and Urban Planning 2023, 238, 104838. [Google Scholar] [CrossRef]
- Costa, R.; Baker, J.W. A methodology to estimate postdisaster unmet housing needs using limited data: Application to the 2017 California wildfires. Risk Analysis 2023. [Google Scholar] [CrossRef]
- Coile, R.V.; Lucherini, A.; Chaudhary, R.K.; Ni, S.; Unobe, D.; Gernay, T. Economic Impact of Fire: Cost and Impact of Fire Protection in Buildings 2023.
- Fuentes-Santos, I.; Marey-Pérez, M.F.; González-Manteiga, W. Forest fire spatial pattern analysis in Galicia (NW Spain). Journal of Environmental Management 2013, 128, 30–42. [Google Scholar] [CrossRef] [PubMed]
- Elia, M.; Giannico, V.; Spano, G.; Lafortezza, R.; Sanesi, G. Likelihood and frequency of recurrent fire ignitions in highly urbanised Mediterranean landscapes. International Journal of Wildland Fire 2020, 29, 120. [Google Scholar] [CrossRef]
- Tuyen, T.T.; Jaafari, A.; Yen, H.P.H.; Nguyen-Thoi, T.; Phong, T.V.; Nguyen, H.D.; Le, H.V.; Phuong, T.T.M.; Nguyen, S.H.; Prakash, I.; et al. Mapping forest fire susceptibility using spatially explicit ensemble models based on the locally weighted learning algorithm. Ecological Informatics 2021, 63, 101292. [Google Scholar] [CrossRef]
- D’Este, M.; Ganga, A.; Elia, M.; Lovreglio, R.; Giannico, V.; Spano, G.; Colangelo, G.; Lafortezza, R.; Sanesi, G. Modeling fire ignition probability and frequency using Hurdle models: a cross-regional study in Southern Europe. Ecological Processes 2020, 9, 54. [Google Scholar] [CrossRef]
- Son, R.; Wang, S.Y.S.; Kim, S.H.; Kim, H.; Jeong, J.H.; Yoon, J.H. Recurrent pattern of extreme fire weather in California. Environmental Research Letters 2021, 16, 94031. [Google Scholar] [CrossRef]
- Fernández-Guisuraga, J.M.; Marcos, E.; Calvo, L. The footprint of large wildfires on the multifunctionality of fire-prone pine ecosystems is driven by the interaction of fire regime attributes. Fire Ecology 2023, 19, 32. [Google Scholar] [CrossRef]
- de Diego, J.; Fernández, M.; Rúa, A.; Kline, J.D. Examining socioeconomic factors associated with wildfire occurrence and burned area in Galicia (Spain) using spatial and temporal data. Fire Ecology 2023, 19, 18. [Google Scholar] [CrossRef]
- Uyttewaal, K.; Prat-Guitart, N.; Ludwig, F.; Kroeze, C.; Langer, E.R. Territories in Transition: how social contexts influence wildland fire adaptive capacity in rural Northwestern European Mediterranean areas. Fire Ecology 2023, 19, 13. [Google Scholar] [CrossRef]
- Trucchia, A.; Meschi, G.; Fiorucci, P.; Provenzale, A.; Tonini, M.; Pernice, U. Wildfire hazard mapping in the eastern Mediterranean landscape. International Journal of Wildland Fire 2023, 32, 417–434. [Google Scholar] [CrossRef]
- Rivière, M.; Lenglet, J.; Noirault, A.; Pimont, F.; Dupuy, J.L. Mapping territorial vulnerability to wildfires: A participative multi-criteria analysis. Forest Ecology and Management 2023, 539, 121014. [Google Scholar] [CrossRef]
- Pandey, P.; Huidobro, G.; Lopes, L.F.; Ganteaume, A.; Ascoli, D.; Colaco, C.; Xanthopoulos, G.; Giannaros, T.M.; Gazzard, R.; Boustras, G.; et al. A global outlook on increasing wildfire risk: Current policy situation and future pathways. Trees, Forests and People 2023, 14, 100431. [Google Scholar] [CrossRef]
- Zacharakis, I.; Tsihrintzis, V.A. Integrated wildfire danger models and factors: A review. Science of The Total Environment 2023, 899, 165704. [Google Scholar] [CrossRef] [PubMed]
- Pausas, J.G.; Keeley, J.E. Wildfires and global change. Frontiers in Ecology and the Environment 2021, 19, 387–395. [Google Scholar] [CrossRef]
- Li, S.; Banerjee, T. Spatial and temporal pattern of wildfires in California from 2000 to 2019. Scientific Reports 2021, 11, 8779. [Google Scholar] [CrossRef] [PubMed]
- Fernandez-Anez, N.; Krasovskiy, A.; Müller, M.; Vacik, H.; Baetens, J.; Hukic´, E.; Solomun, M.K.; Atanassova, I.; Glushkova, M.; Bogunovic´, I.; et al. Current Wildland Fire Patterns and Challenges in Europe: A Synthesis of National Perspectives. Air, Soil and Water Research 2021, 14, 117862212110281. [Google Scholar] [CrossRef]
- Richards, J.; Huser, R.; Bevacqua, E.; Zscheischler, J. Insights into the Drivers and Spatiotemporal Trends of Extreme Mediterranean Wildfires with Statistical Deep Learning. Artificial Intelligence for the Earth Systems 2023, 2. [Google Scholar] [CrossRef]
- Regos, A.; Pais, S.; Campos, J.C.; Lecina-Diaz, J. Nature-based solutions to wildfires in rural landscapes of Southern Europe: let’s be fire-smart! International Journal of Wildland Fire 2023, 32, 942–950. [Google Scholar] [CrossRef]
- Cohen, J.D. Preventing Disaster: Home Ignitability in the Wildland-Urban Interface. Journal of Forestry 2000, 98, 15–21. [Google Scholar] [CrossRef]
- Winter, G.J.; Fried, J.S. Estimating Contingent Values for Protection from Wildland Fire Using a Two-Stage Decision Framework. Forest Science 2001, 47, 349–360. [Google Scholar] [CrossRef]
- Asiyanbi, A.; Davidsen, C. Governing Wildfire Risk in Canada: The Rise of an Apparatus of Security. Annals of the American Association of Geographers 2023, 113, 1207–1223. [Google Scholar] [CrossRef]
- Bramwell, L. Understanding Wildfire in the Twenty-First Century: The Return of Disaster Fires. Environmental History 2023, 28, 467–494. [Google Scholar] [CrossRef]
- Beltrán-Marcos, D.; Calvo, L.; Fernández-Guisuraga, J.M.; Fernández-García, V.; Suárez-Seoane, S. Wildland-urban interface typologies prone to high severity fires in Spain. Science of The Total Environment 2023, 894, 165000. [Google Scholar] [CrossRef] [PubMed]
- Bento-Gonçalves, A.; Vieira, A. Wildfires in the wildland-urban interface: Key concepts and evaluation methodologies. Science of The Total Environment 2020, 707, 135592. [Google Scholar] [CrossRef]
- Intini, P.; Ronchi, E.; Gwynne, S.; Bénichou, N. Guidance on Design and Construction of the Built Environment Against Wildland Urban Interface Fire Hazard: A Review. Fire Technology 2020, 56, 1853–1883. [Google Scholar] [CrossRef]
- Taccaliti, F.; Marzano, R.; Bell, T.L.; Lingua, E. Wildland–Urban Interface: Definition and Physical Fire Risk Mitigation Measures, a Systematic Review. Fire 2023, 6, 343. [Google Scholar] [CrossRef]
- Tolhurst, K.; Duff, T.; Chong, D.M. From "Wildland-Urban Interface" to "Wildfire Interface Zone" using dynamic fire modelling. In Proceedings of the MODSIM2013 20th International Congress on Modelling and Simulation; 2013; pp. 1–6. [Google Scholar]
- Ganteaume, A.; Barbero, R.; Jappiot, M.; Maillé, E. Understanding future changes to fires in southern Europe and their impacts on the wildland-urban interface. Journal of Safety Science and Resilience 2021, 2, 20–29. [Google Scholar] [CrossRef]
- Short, K.C. Spatial wildfire occurrence data for the United States, 1992-2015 [FPA_FOD_20170508] (4th Edition). Fort Collins, CO: Forest Service Research Data Archive 2017. [CrossRef]
- Pesaresi, M.; Ehrlich, D.; Florczyk, A.; Freire, S.; Julea, A.; Kemper, T.; Soille, P.; Syrris, V. GHS-BUILT R2015B - GHS built-up grid, derived from Landsat, multitemporal (1975, 1990, 2000, 2014). European Commission, Joint Research Centre (JRC) 2015.
- The PostGIS Development Group. PostGIS 3.1.2dev Manual, 2020.
- Wang, W.; Zhou, H.; Zheng, S.; Lü, G.; Zhou, L. Ocean surface currents estimated from satellite remote sensing data based on a global hexagonal grid. International Journal of Digital Earth 2023, 16, 1073–1093. [Google Scholar] [CrossRef]
- Sahr, K. Central Place Indexing: Hierarchical Linear Indexing Systems for Mixed-Aperture Hexagonal Discrete Global Grid Systems. Cartographica: The International Journal for Geographic Information and Geovisualization 2019, 54, 16–29. [Google Scholar] [CrossRef]
- Mann, H.B. Nonparametric Tests Against Trend. Econometrica 1945, 13, 245. [Google Scholar] [CrossRef]
- Kendall, M.G. Rank correlation methods., 4 ed.; Charles Griffin: London, 1975.
- Lins, H.F.; Slack, J.R. Streamflow trends in the United States. Geophysical Research Letters 1999, 26, 227–230. [Google Scholar] [CrossRef]
- Wu, H.; Soh, L.K.; Samal, A.; Chen, X.H. Trend analysis of streamflow drought events in Nebraska. Water Resources Management 2008, 22, 145–164. [Google Scholar] [CrossRef]
- Yue, S.; Pilon, P. A comparison of the power of the t test, Mann-Kendall and bootstrap tests for trend detection. Hydrological Sciences Journal 2004, 49, 21–37. [Google Scholar] [CrossRef]
- Ljung, G.M.; BOX, G.E.P. On a measure of lack of fit in time series models. Biometrika 1978, 65, 297–303. [Google Scholar] [CrossRef]
- Hamed, K.H.; Ramachandra Rao, A. A modified Mann-Kendall trend test for autocorrelated data. Journal of Hydrology 1998, 204, 182–196. [Google Scholar] [CrossRef]
- Hamed, K.H. Enhancing the effectiveness of prewhitening in trend analysis of hydrologic data. Journal of Hydrology 2009, 368, 143–155. [Google Scholar] [CrossRef]
- Sa’adi, Z.; Shahid, S.; Ismail, T.; Chung, E.S.; Wang, X.J. Trends analysis of rainfall and rainfall extremes in Sarawak, Malaysia using modified Mann–Kendall test. Meteorology and Atmospheric Physics 2019, 131, 263–277. [Google Scholar] [CrossRef]
- Alashan, S. Combination of modified Mann-Kendall method and S¸ en innovative trend analysis. Engineering Reports 2020, 2, e12131. [Google Scholar] [CrossRef]
- Patakamuri, S.K.; O’Brien, N. modifiedmk: Modified Versions of Mann Kendall and Spearman’s Rho Trend Tests, 2021. R package version 1.6.
- Openshaw, S.; Taylor, P.J. The modifiable areal unit problem. Quantitative geography: a British view 1981. [CrossRef]
- Wong, D.W. Modifiable Areal Unit Problem. International Encyclopedia of Human Geography 2009, pp. 169–174. [CrossRef]
- Shi, K.; Touge, Y. Characterization of global wildfire burned area spatiotemporal patterns and underlying climatic causes. Scientific Reports 2022, 12, 644. [Google Scholar] [CrossRef]
- Yang, X.; Zhao, C.; Zhao, W.; Fan, H.; Yang, Y. Characterization of global fire activity and its spatiotemporal patterns for different land cover types from 2001 to 2020. Environmental Research 2023, 227, 115746. [Google Scholar] [CrossRef]
- Weber, K.T.; Yadav, R. Spatiotemporal Trends in Wildfires across the Western United States (1950–2019). Remote Sensing 2020, 12, 2959. [Google Scholar] [CrossRef]
- Li, H.; Vulova, S.; Rocha, A.D.; Kleinschmit, B. Spatio-temporal feature attribution of European summer wildfires with Explainable Artificial Intelligence (XAI). Science of The Total Environment 2024, 916, 170330. [Google Scholar] [CrossRef] [PubMed]
- Moreno, M.; Bertolín, C.; Arlanzón, D.; Ortiz, P.; Ortiz, R. Climate change, large fires, and cultural landscapes in the mediterranean basin: An analysis in southern Spain. Heliyon 2023, 9, e16941. [Google Scholar] [CrossRef] [PubMed]
- Schmidt, J. Defensible Space, Housing Density, and Diablo-North Wind Events: Impacts on Loss Rates for Homes in Northern California Wildfires 2023.
- Watson, G.L. On Model Determination, Prediction and Statistical Learning: The Case of Space-Time Data; 2021.
- Dwomoh, F.K.; Auch, R.F.; Brown, J.F.; Tollerud, H.J. Trends in tree cover change over three decades related to interannual climate variability and wildfire in California. Environmental Research Letters 2023, 18, 24007. [Google Scholar] [CrossRef]
- Ostertag, S.; Rice, M.; Qu, J.J. Investigating spatiotemporal trends of large wildfires in California (1950–2020). Advances in Cartography and GIScience of the ICA 2023, 4, 1–9. [Google Scholar] [CrossRef]
- MacDonald, G.; Wall, T.; Enquist, C.A.F.; LeRoy, S.R.; Bradford, J.B.; Breshears, D.D.; Brown, T.; Cayan, D.; Dong, C.; Falk, D.A.; et al. Drivers of California’s changing wildfires: a state-of-the-knowledge synthesis. International Journal of Wildland Fire 2023, 32, 1039–1058. [Google Scholar] [CrossRef]
- Bugallo, M.; Esteban, M.D.; Marey-Pérez, M.F.; Morales, D. Wildfire prediction using zero-inflated negative binomial mixed models: Application to Spain. Journal of Environmental Management 2023, 328, 116788. [Google Scholar] [CrossRef] [PubMed]
- Calheiros, T.; Nunes, J.P.; Pereira, M.G. Recent evolution of spatial and temporal patterns of burnt areas and fire weather risk in the Iberian Peninsula. Agricultural and Forest Meteorology 2020, 287, 107923. [Google Scholar] [CrossRef]
- Yadav, K.; Escobedo, F.J.; Thomas, A.S.; Johnson, N.G. Increasing wildfires and changing sociodemographics in communities across California, USA. International Journal of Disaster Risk Reduction 2023, 98, 104065. [Google Scholar] [CrossRef]
- Rodrigues, M.; Jiménez-Ruano, A.; de la Riva, J. Fire regime dynamics in mainland Spain. Part 1: Drivers of change. Science of The Total Environment 2020, 721, 135841. [Google Scholar] [CrossRef]
- Dong, L.; Leung, L.R.; Qian, Y.; Zou, Y.; Song, F.; Chen, X. Meteorological Environments Associated With California Wildfires and Their Potential Roles in Wildfire Changes During 1984–2017. Journal of Geophysical Research: Atmospheres 2021, 126, e2020JD033180. [Google Scholar] [CrossRef]
- Oliveira, S.; Rocha, J.; Sá, A. Wildfire risk modeling. Current Opinion in Environmental Science & Health 2021, 23, 100274. [Google Scholar] [CrossRef]
- Ríos-Pena, L.; Kneib, T.; Cadarso-Suárez, C.; Klein, N.; Marey-Pérez, M. Studying the occurrence and burnt area of wildfires using zero-one-inflated structured additive beta regression. Environmental Modelling & Software 2018, 110, 107–118. [Google Scholar] [CrossRef]
- Oliveira, S.; Gonçalves, A.; Zêzere, J.L. Reassessing wildfire susceptibility and hazard for mainland Portugal. Science of The Total Environment 2021, 762, 143121. [Google Scholar] [CrossRef]
- Prapas, I.; Kondylatos, S.; Papoutsis, I.; Camps-Valls, G.; Ronco, M.; Fernández-Torres, M.Á.; Guillem, M.P.; Carvalhais, N. Deep Learning Methods for Daily Wildfire Danger Forecasting 2021.
- Qiu, L.; Chen, J.; Fan, L.; Sun, L.; Zheng, C. High-resolution mapping of wildfire drivers in California based on machine learning. Science of The Total Environment 2022, 833, 155155. [Google Scholar] [CrossRef]
- Rodrigues, M.; Costafreda-Aumedes, S.; Comas, C.; Vega-García, C. Spatial stratification of wildfire drivers towards enhanced definition of large-fire regime zoning and fire seasons. Science of The Total Environment 2019, 689, 634–644. [Google Scholar] [CrossRef]
- Wang, S.S.C.; Wang, Y. Quantifying the effects of environmental factors on wildfire burned area in the south central US using integrated machine learning techniques. Atmospheric Chemistry and Physics 2020, 20, 11065–11087. [Google Scholar] [CrossRef]
- Woolford, D.G.; Martell, D.L.; McFayden, C.B.; Evens, J.; Stacey, A.; Wotton, B.M.; Boychuk, D. The development and implemen- tation of a human-caused wildland fire occurrence prediction system for the province of Ontario, Canada. Canadian Journal of Forest Research 2021, 51, 303–325. [Google Scholar] [CrossRef]
- Monjarás-Vega, N.A.; Briones-Herrera, C.I.; Vega-Nieva, D.J.; Calleros-Flores, E.; Corral-Rivas, J.J.; López-Serrano, P.M.; Pompa- García, M.; Rodríguez-Trejo, D.A.; Carrillo-Parra, A.; González-Cabán, A.; et al. Predicting forest fire kernel density at multiple scales with geographically weighted regression in Mexico. Science of The Total Environment 2020, 718, 137313. [Google Scholar] [CrossRef]
- Wang, X.; Zhao, H.; Zhang, Z.; Yin, Y.; Zhen, S. The Relationship between Socioeconomic Factors at Different Administrative Levels and Forest Fire Occurrence Density Using a Multilevel Model. Forests 2023, 14, 391. [Google Scholar] [CrossRef]
- Zhang, C.; Li, X. Land Use and Land Cover Mapping in the Era of Big Data. Land 2022, 11, 1692. [Google Scholar] [CrossRef]
- Malik, K.; Robertson, C.; Roberts, S.A.; Remmel, T.K.; Long, J.A. Computer vision models for comparing spatial patterns: understanding spatial scale. International Journal of Geographical Information Science 2023, 37, 1–35. [Google Scholar] [CrossRef]
- Diaz-Varela, E.R.; Marey-Pérez, M.F.; Rigueiro-Rodriguez, A.; Álvarez-Álvarez, P. Landscape metrics for characterization of forest landscapes in a sustainable management framework: Potential application and prevention of misuse. Annals of Forest Science 2009, 66, 301. [Google Scholar] [CrossRef]
- Díaz-Varela, E.R.; Marey-Pérez, M.F.; Riveiro-Valiño, J.A.; Alvarez-Lopez, C.J. Preservation of Spatial Information in Rasterization Processes: A Practical Approach Using Real Categorical Data and Landscape Metrics. GIScience & Remote Sensing 2010, 47, 425–442. [Google Scholar] [CrossRef]
- Parisien, M.A.; Moritz, M.A. Environmental controls on the distribution of wildfire at multiple spatial scales. Ecological Monographs 2009, 79, 127–154. [Google Scholar] [CrossRef]
- Thompson, M.P.; MacGregor, D.G.; Dunn, C.J.; Calkin, D.E.; Phipps, J. Rethinking the Wildland Fire Management System. Journal of Forestry 2018, 116, 382–390. [Google Scholar] [CrossRef]
- Chen, B.; Jin, Y. Spatial patterns and drivers for wildfire ignitions in California. Environmental Research Letters 2022, 17, 55004. [Google Scholar] [CrossRef]
- Galizia, L.F.; Curt, T.; Barbero, R.; Rodrigues, M. Understanding fire regimes in Europe. International Journal of Wildland Fire 2021, 31, 56–66. [Google Scholar] [CrossRef]
- Boubeta, M.; Lombardía, M.J.; Marey-Pérez, M.; Morales, D. Poisson mixed models for predicting number of fires. International Journal of Wildland Fire 2019, 28, 237. [Google Scholar] [CrossRef]
- Nieto, H.; Aguado, I.; García, M.; Chuvieco, E. Lightning-caused fires in Central Spain: Development of a probability model of occurrence for two Spanish regions. Agricultural and Forest Meteorology 2012, 162-163, 35–43. [Google Scholar] [CrossRef]
- Vecín-Arias, D.; Castedo-Dorado, F.; Ordóñez, C.; Rodríguez-Pérez, J.R. Biophysical and lightning characteristics drive lightning- induced fire occurrence in the central plateau of the Iberian Peninsula. Agricultural and Forest Meteorology 2016, 225, 36–47. [Google Scholar] [CrossRef]
- Viedma, O.; Urbieta, I.R.; Moreno, J.M. Wildfires and the role of their drivers are changing over time in a large rural area of west-central Spain. Scientific Reports 2018, 8, 17797. [Google Scholar] [CrossRef] [PubMed]
- Rodrigues, M.; Jiménez-Ruano, A.; Peña-Angulo, D.; de la Riva, J. A comprehensive spatial-temporal analysis of driving factors of human-caused wildfires in Spain using Geographically Weighted Logistic Regression. Journal of Environmental Management 2018, 225, 177–192. [Google Scholar] [CrossRef] [PubMed]
- Calviño-Cancela, M.; Chas-Amil, M.L.; García-Martínez, E.D.; Touza, J. Wildfire risk associated with different vegetation types within and outside wildland-urban interfaces. Forest Ecology and Management 2016, 372, 1–9. [Google Scholar] [CrossRef]
- Wong, S.D.; Broader, J.C.; Shaheen, S.A.; Org, E. Review of California Wildfire Evacuations from 2017 to 2019 2020. [CrossRef]
- Buechi, H.; Weber, P.; Heard, S.; Cameron, D.; Plantinga, A.J. Long-term trends in wildfire damages in California. International Journal of Wildland Fire 2021, 30, 757–762. [Google Scholar] [CrossRef]
- Chen, B.; Jin, Y.; Scaduto, E.; Moritz, M.A.; Goulden, M.L.; Randerson, J.T. Climate, Fuel, and Land Use Shaped the Spatial Pattern of Wildfire in California’s Sierra Nevada. Journal of Geophysical Research: Biogeosciences 2021, 126, e2020JG005786. [Google Scholar] [CrossRef]
- Schwartz, M.W.; Syphard, A.D. Fitting the solutions to the problems in managing extreme wildfire in California. Environmental Research Communications 2021, 3, 81005. [Google Scholar] [CrossRef]
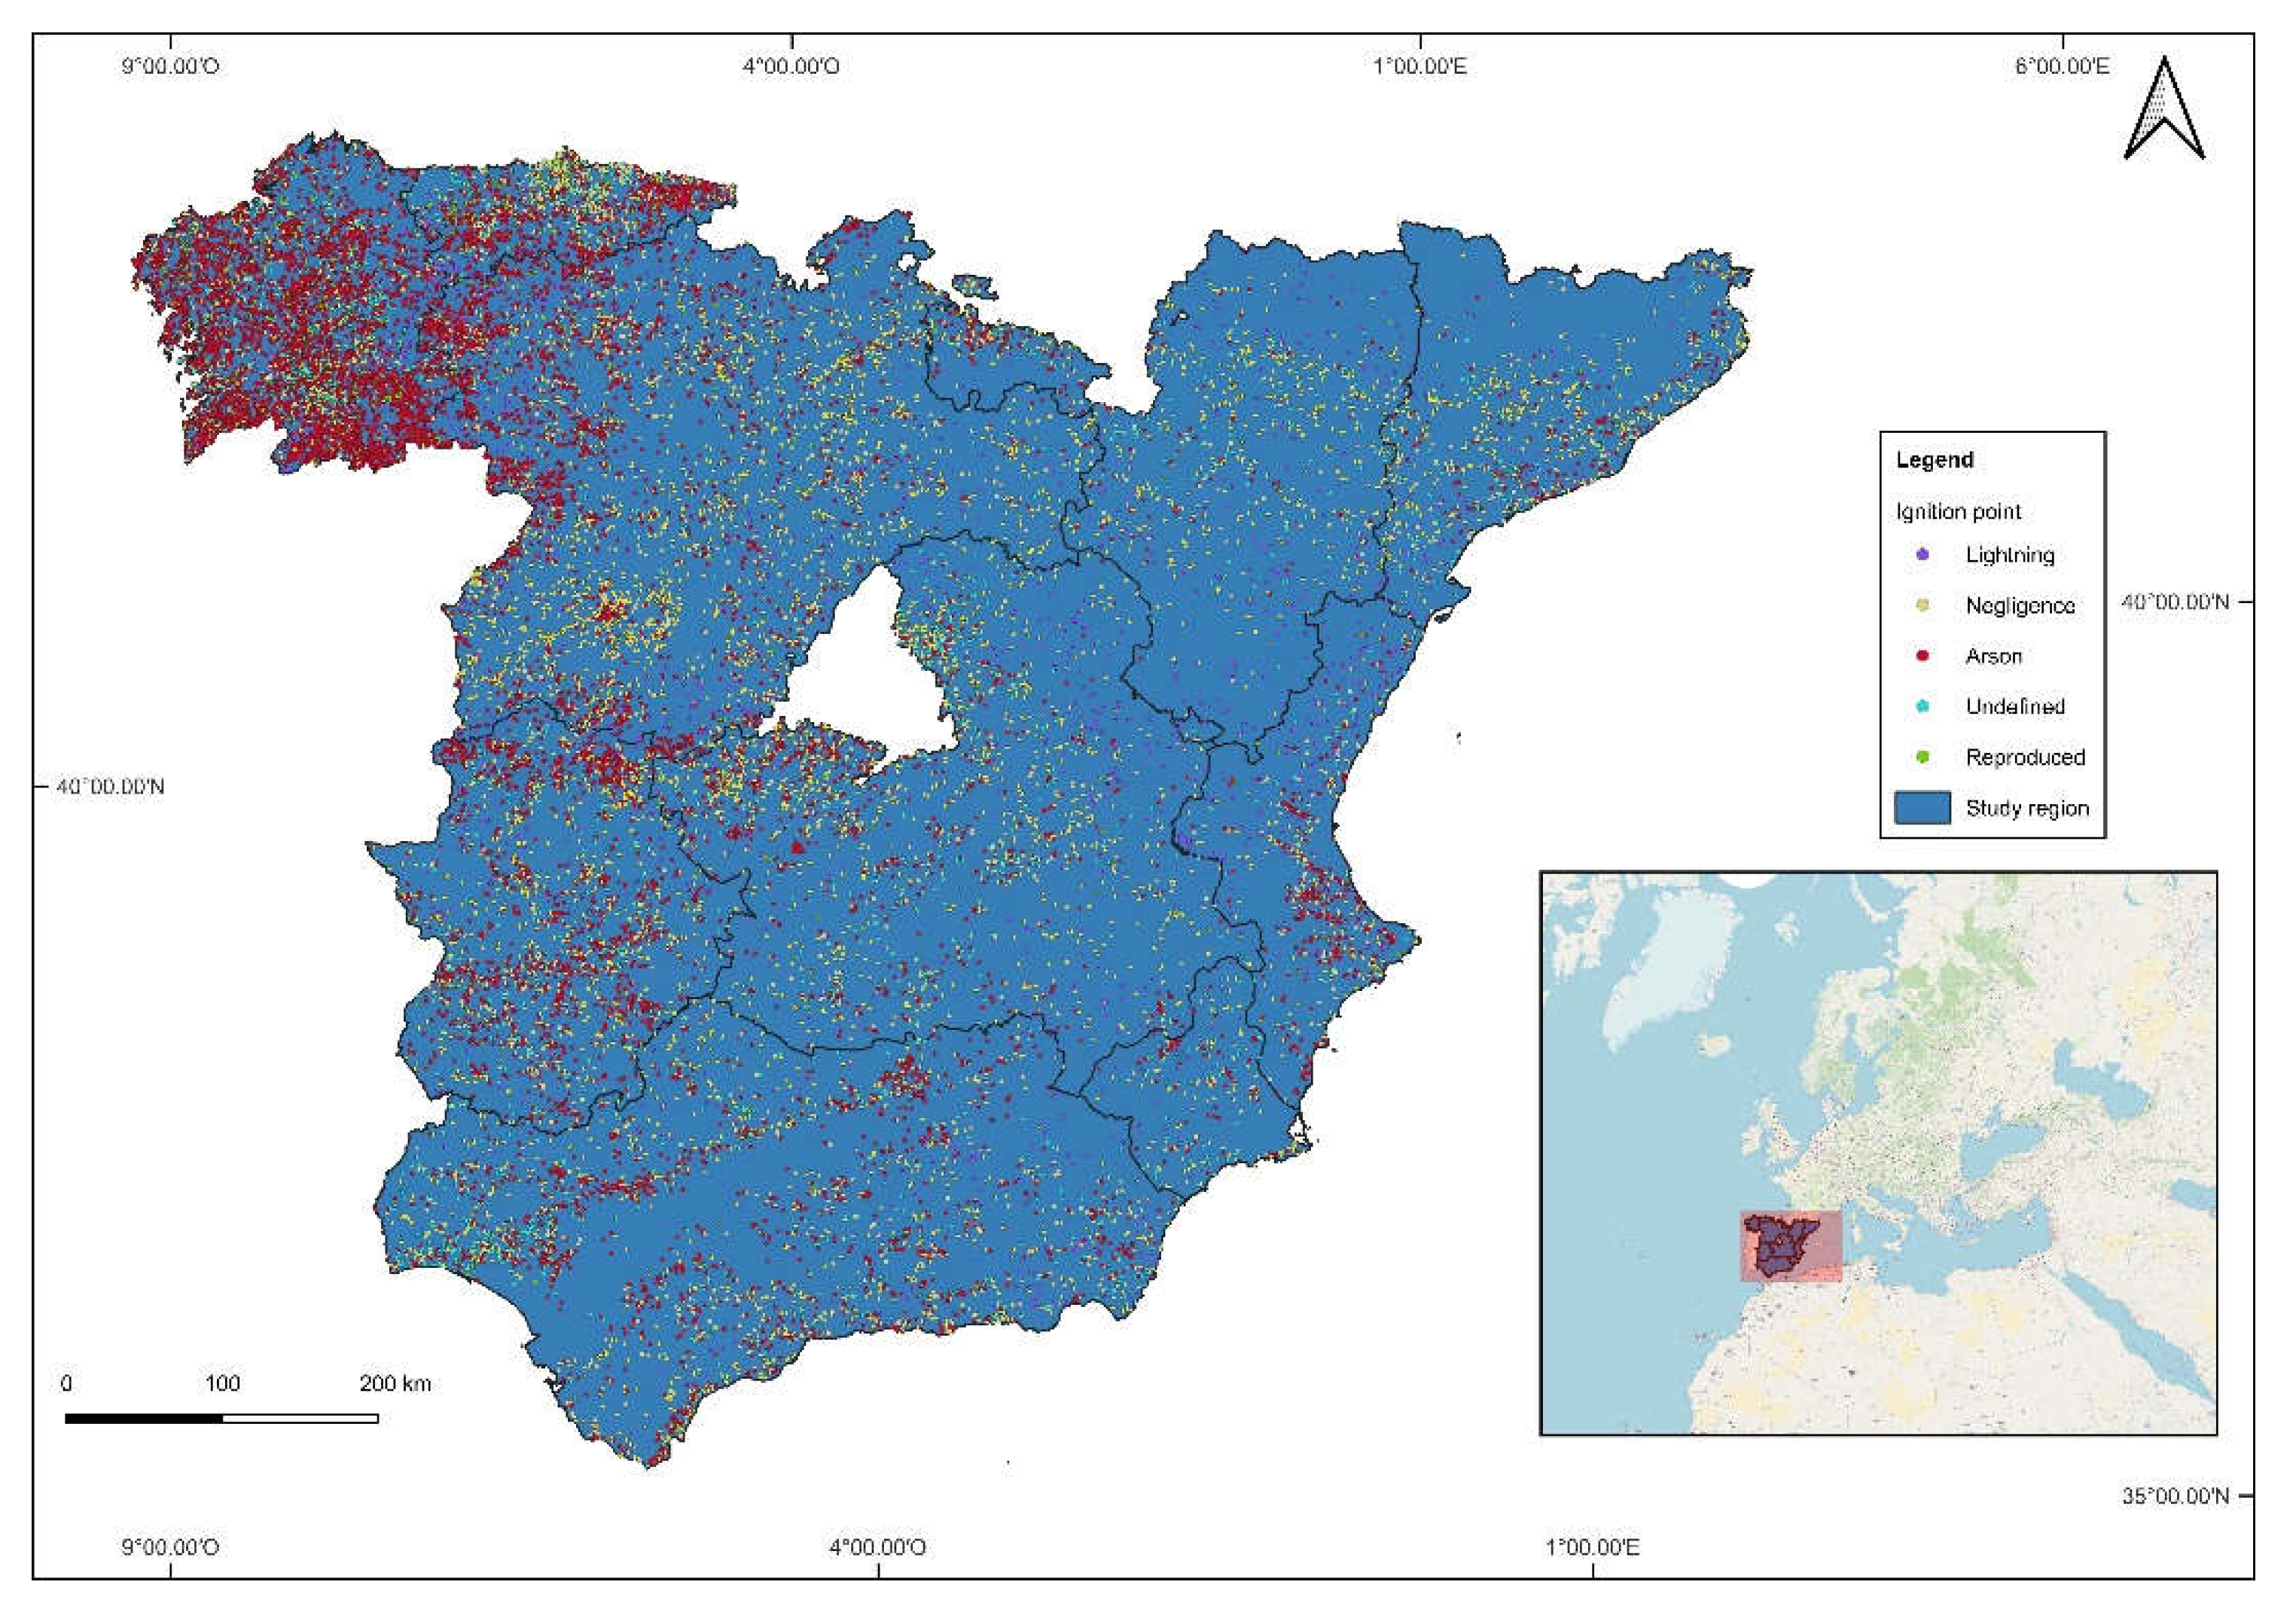
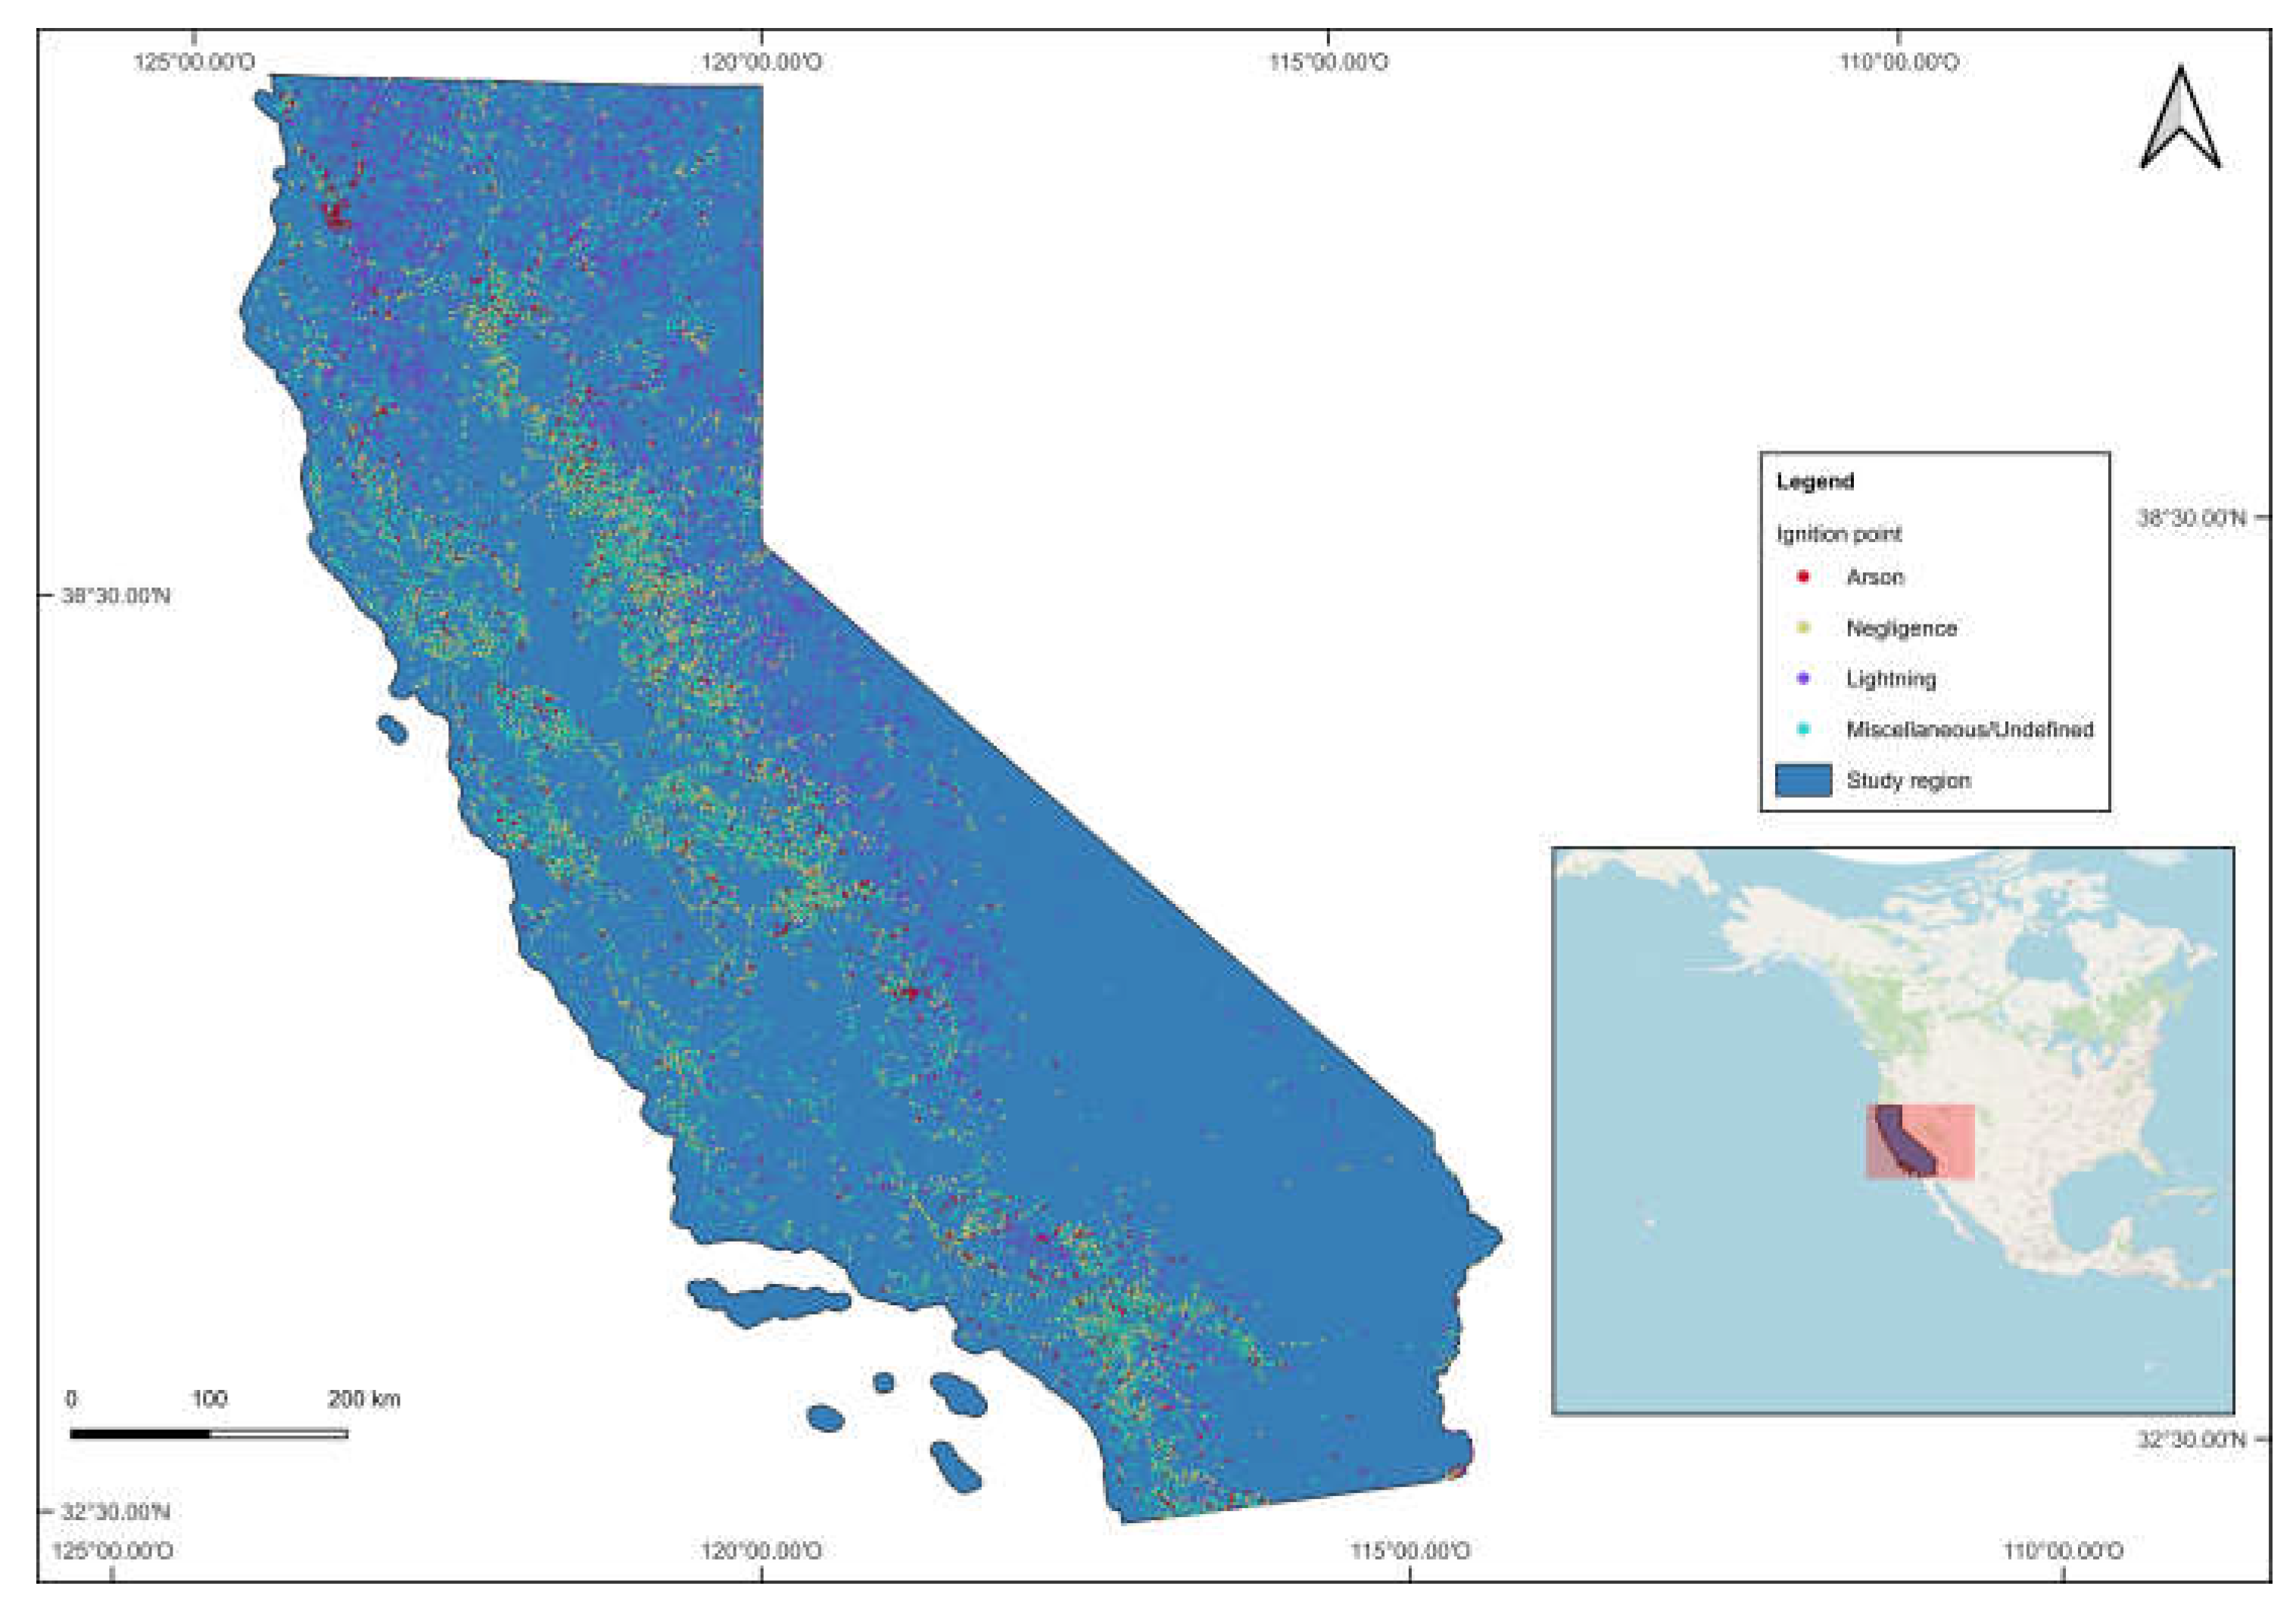
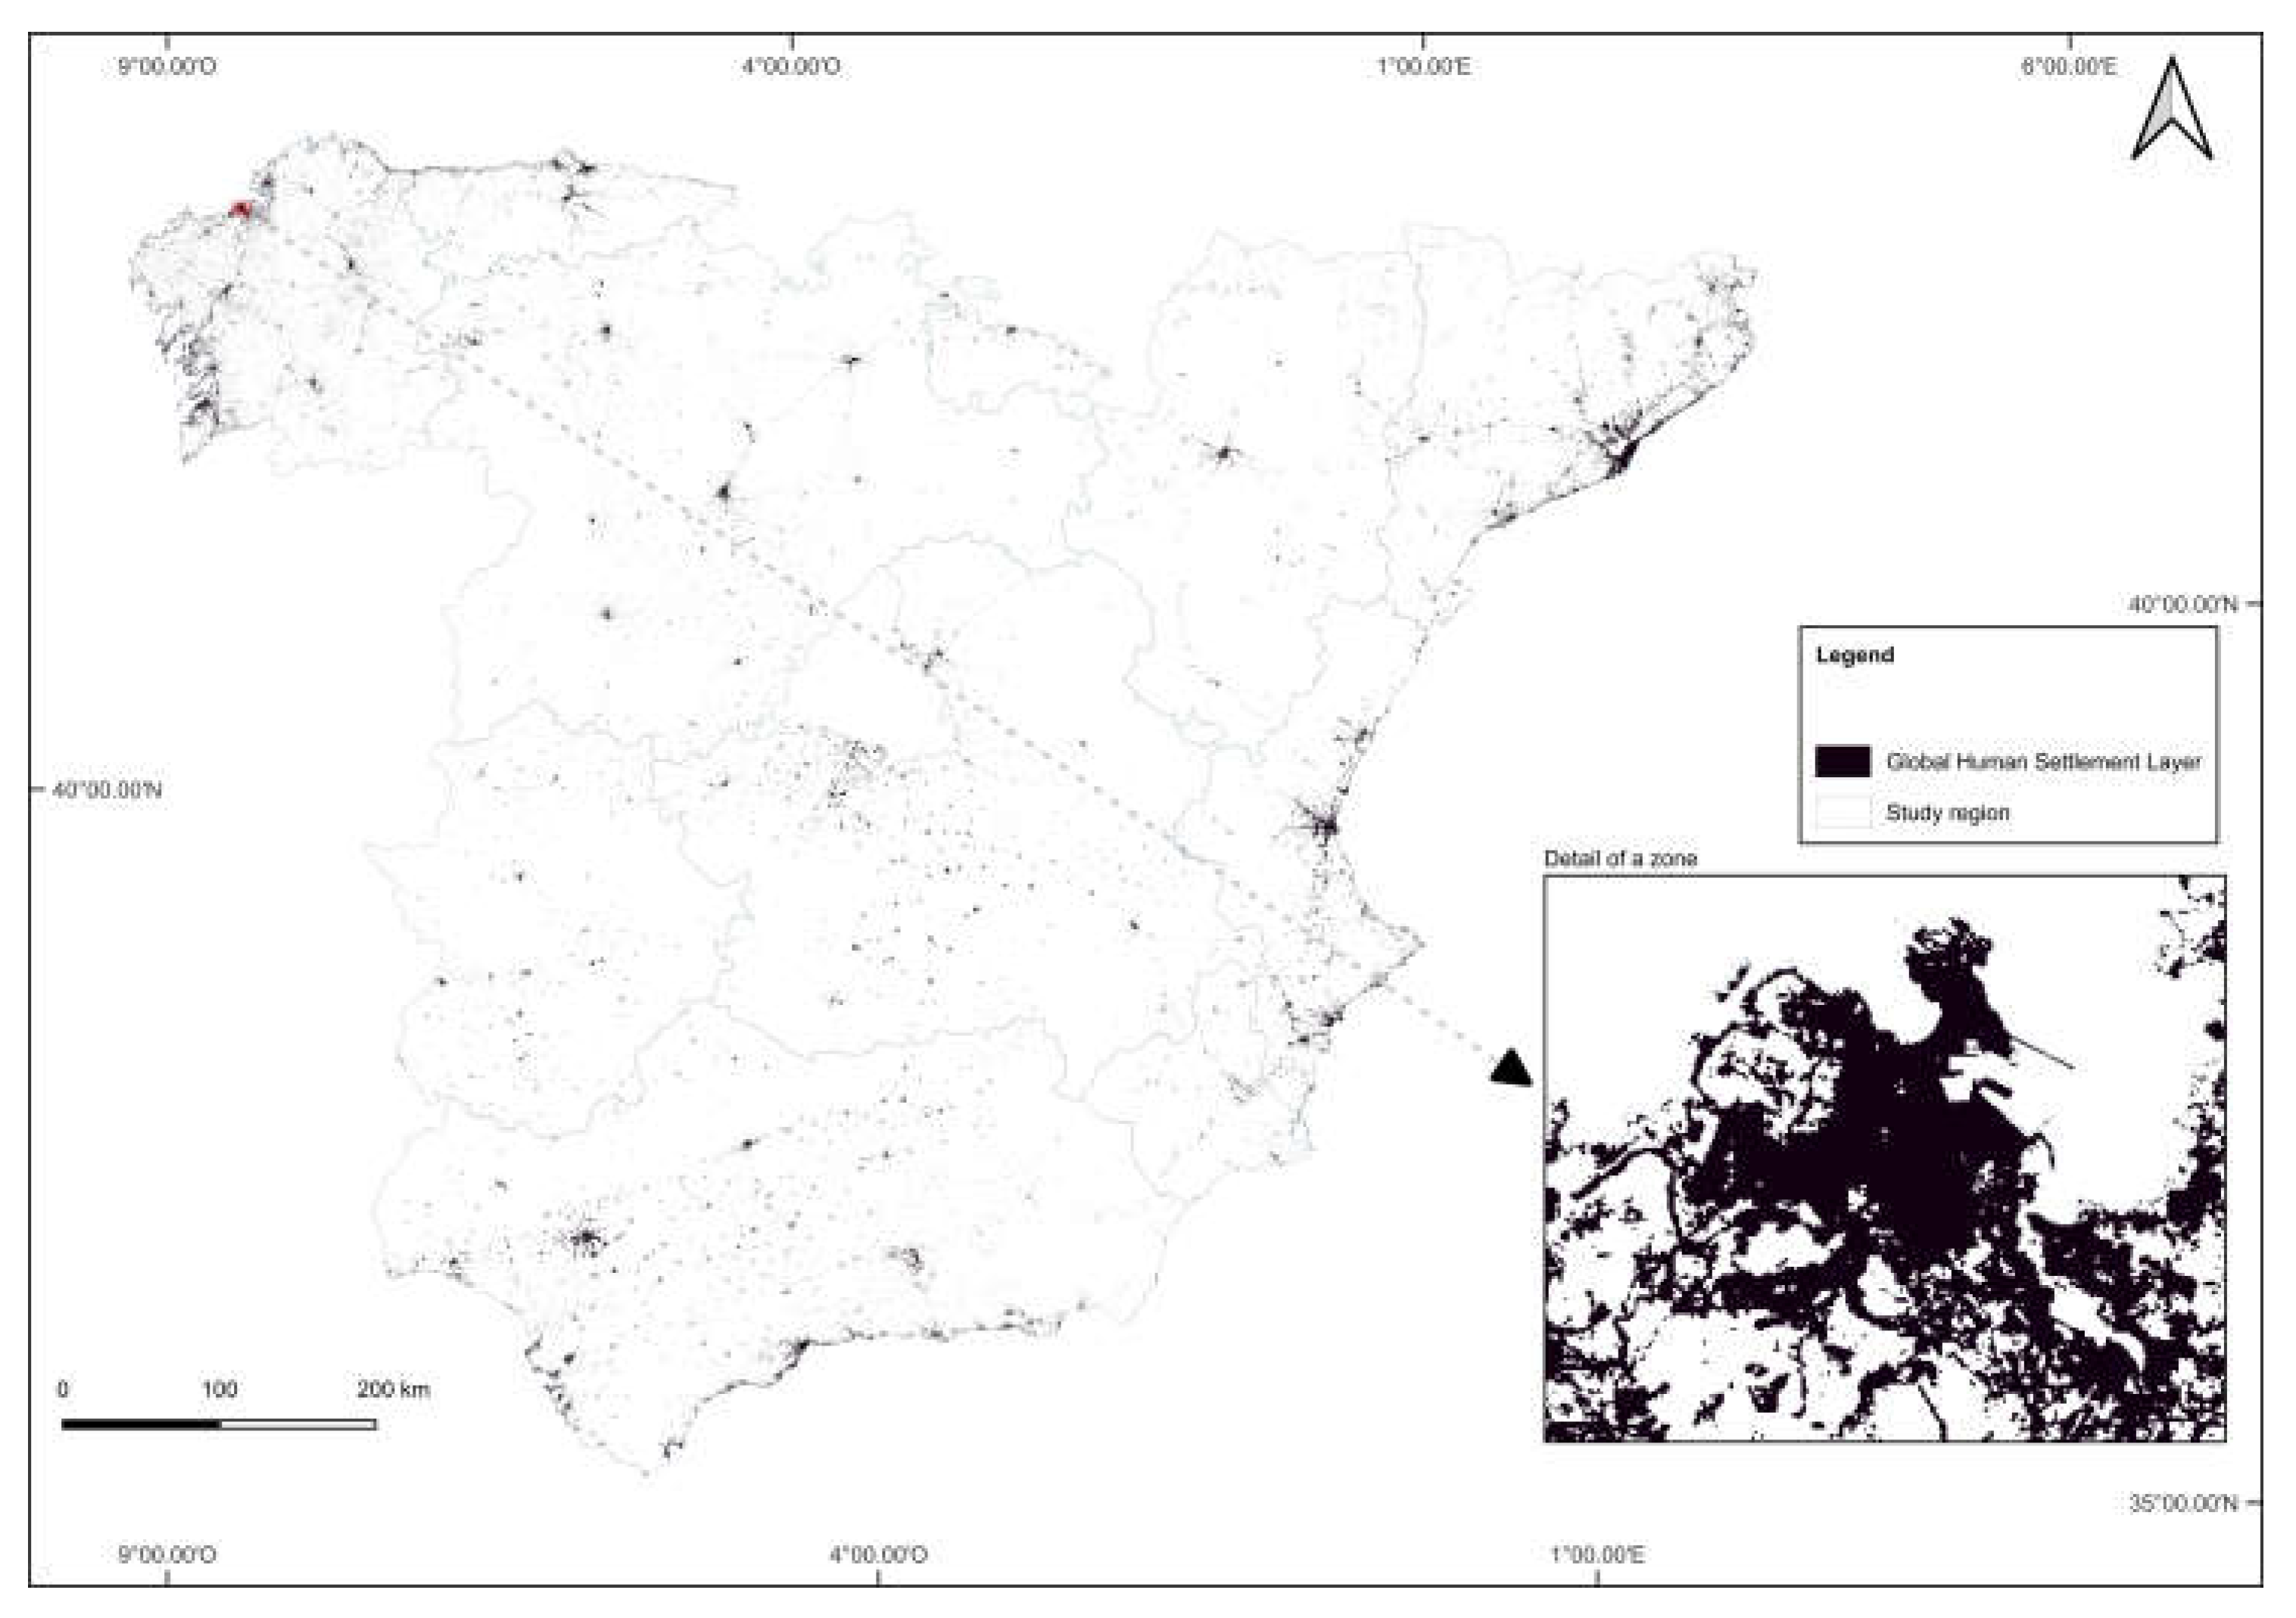

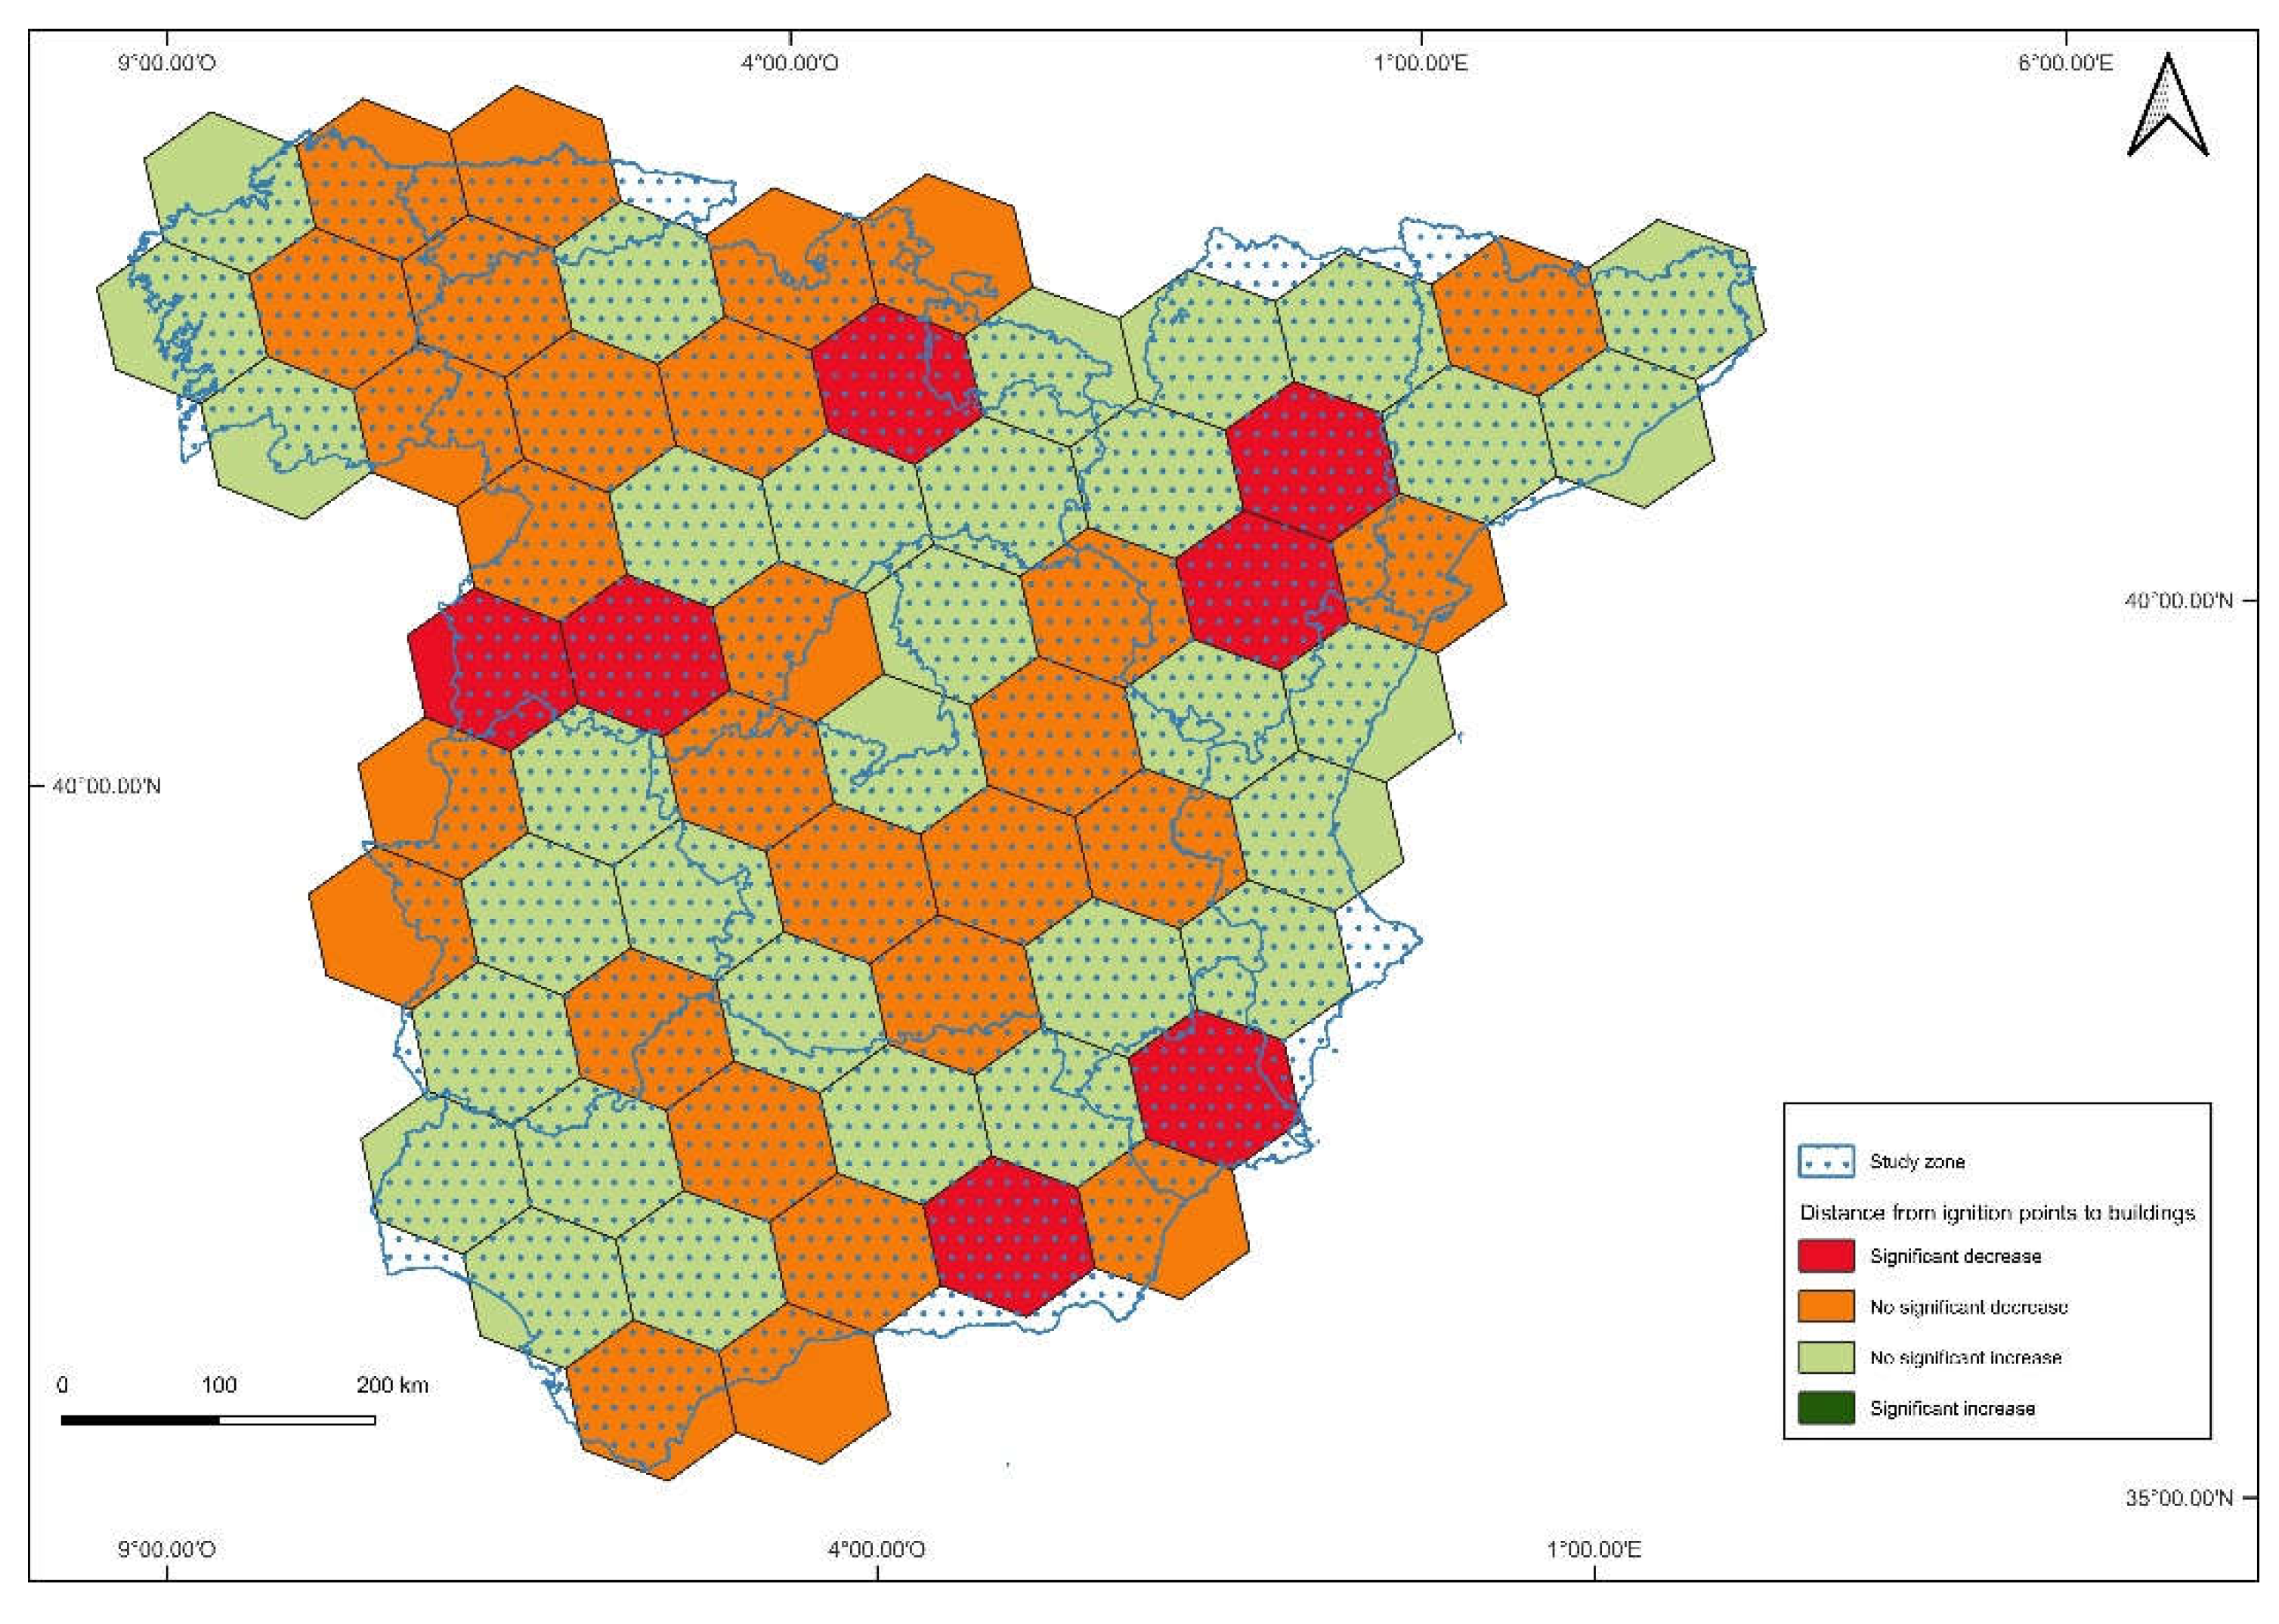
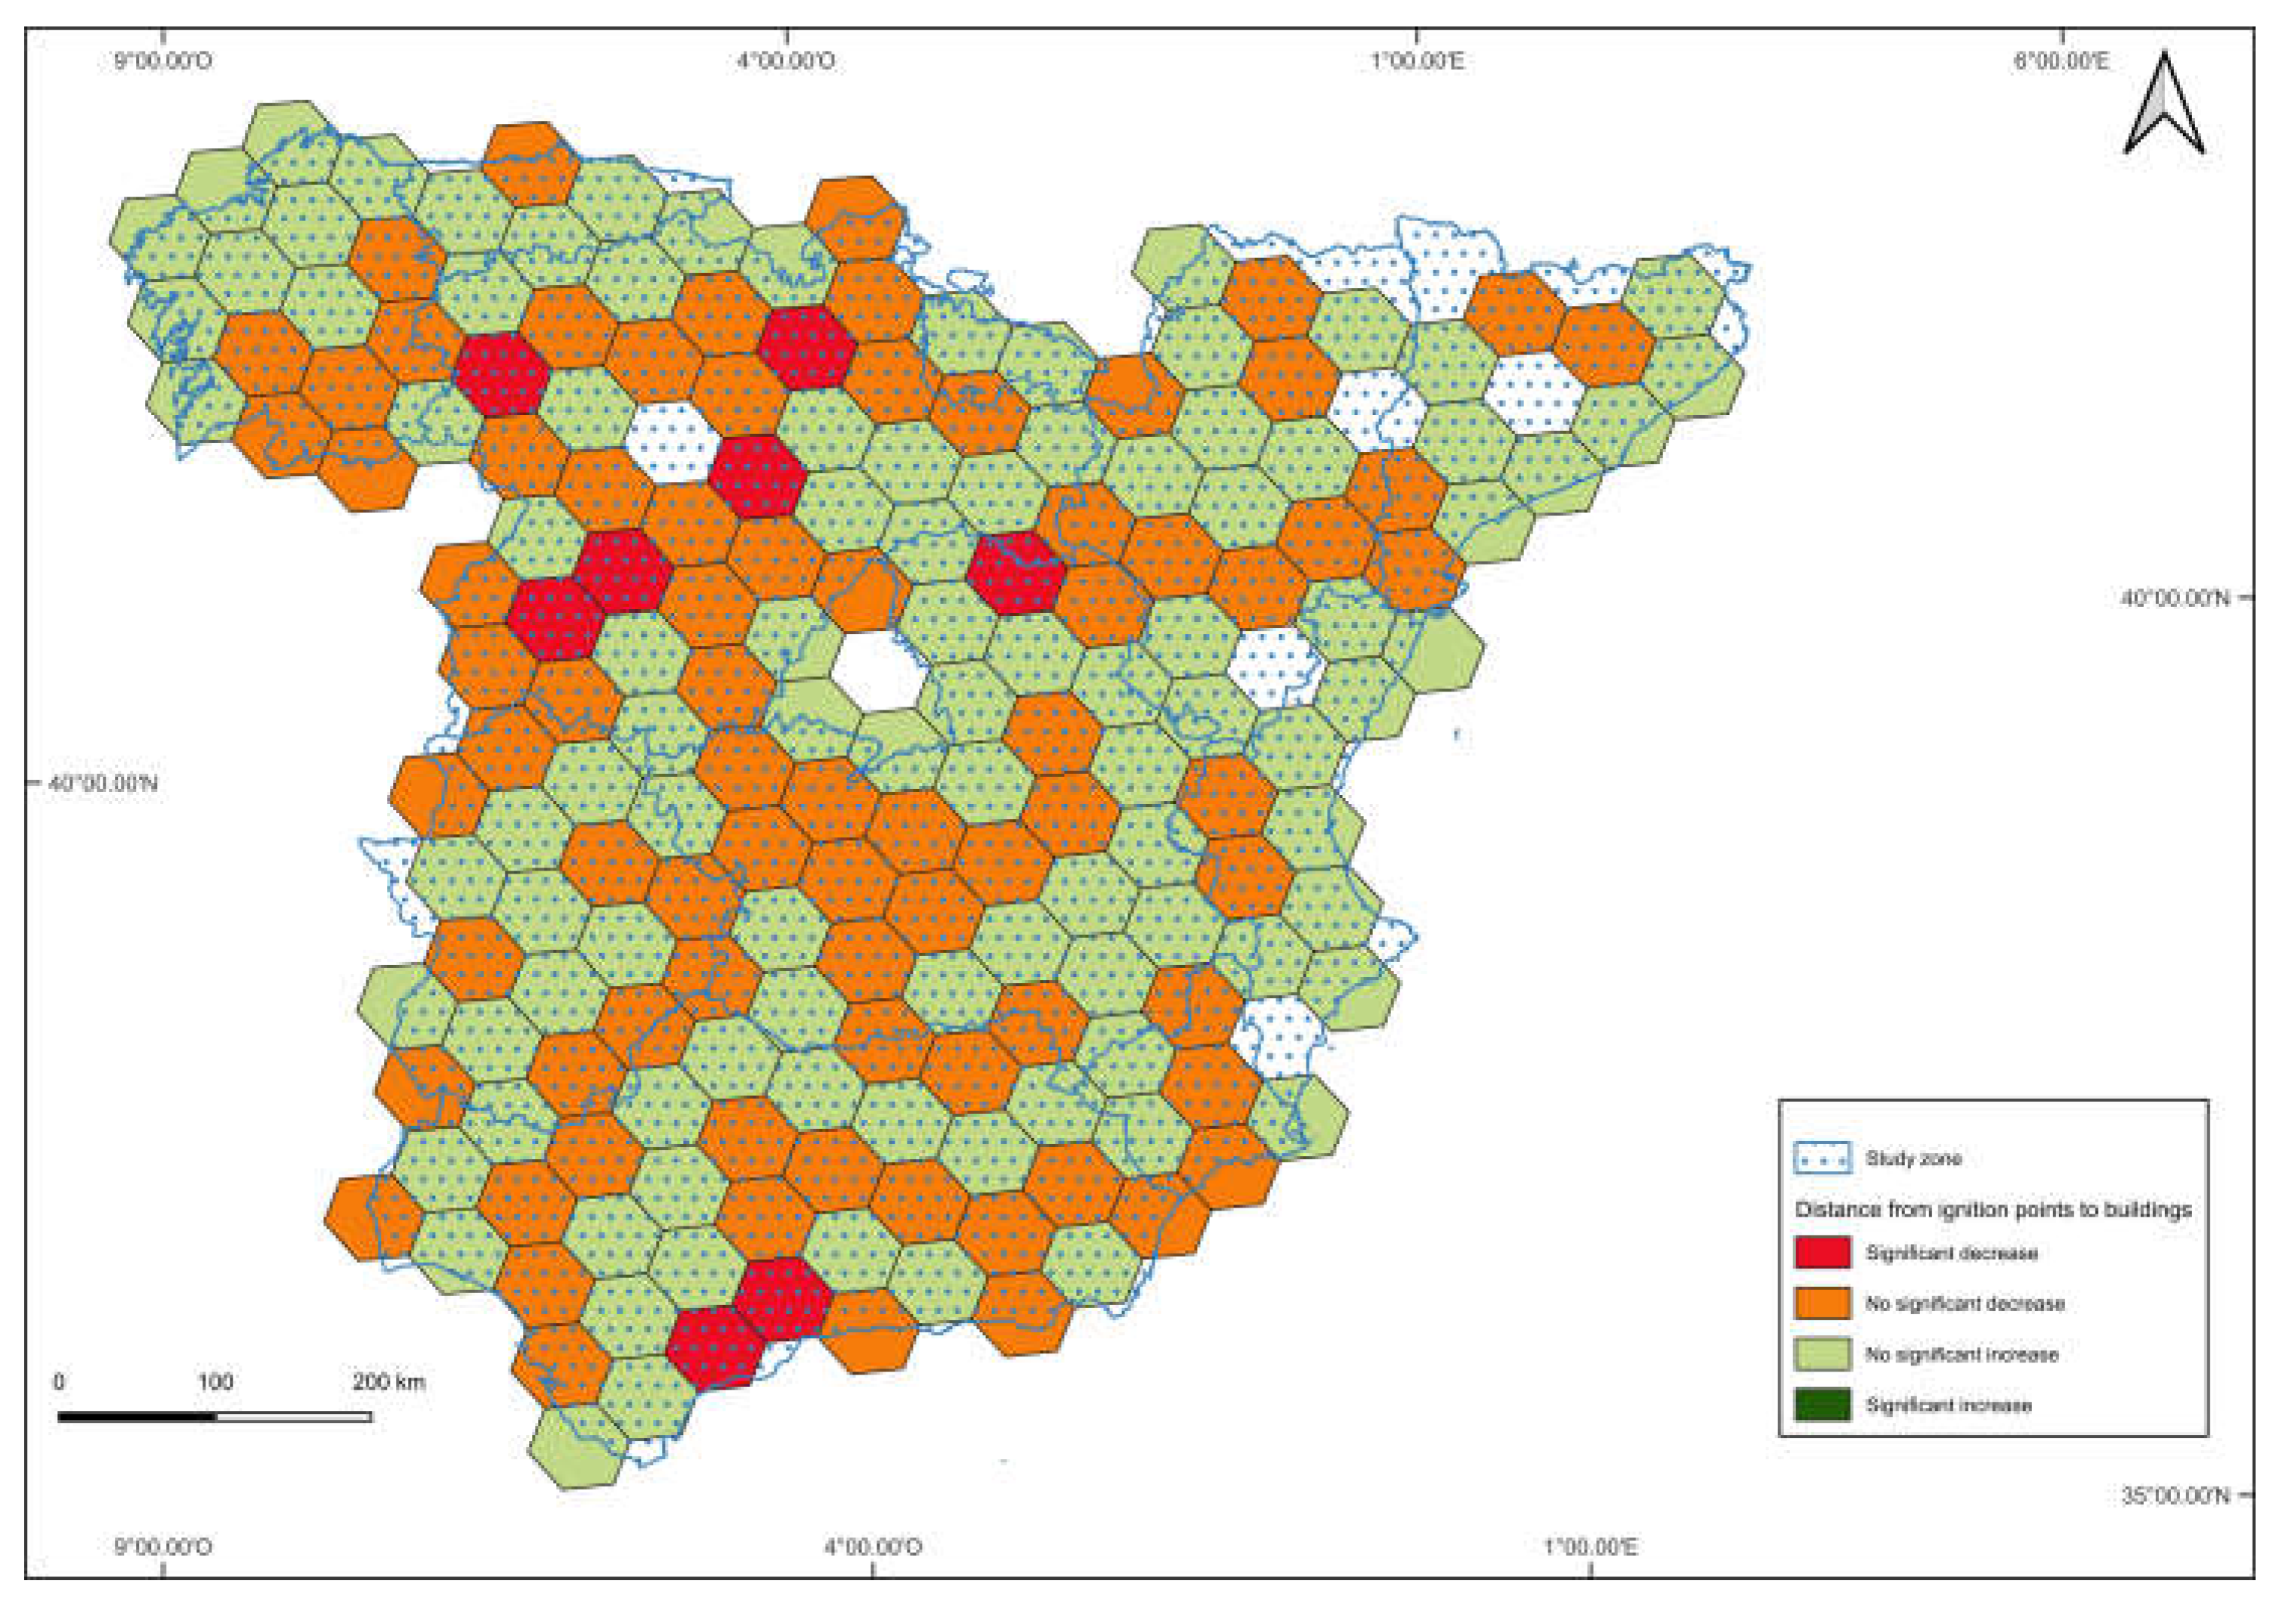
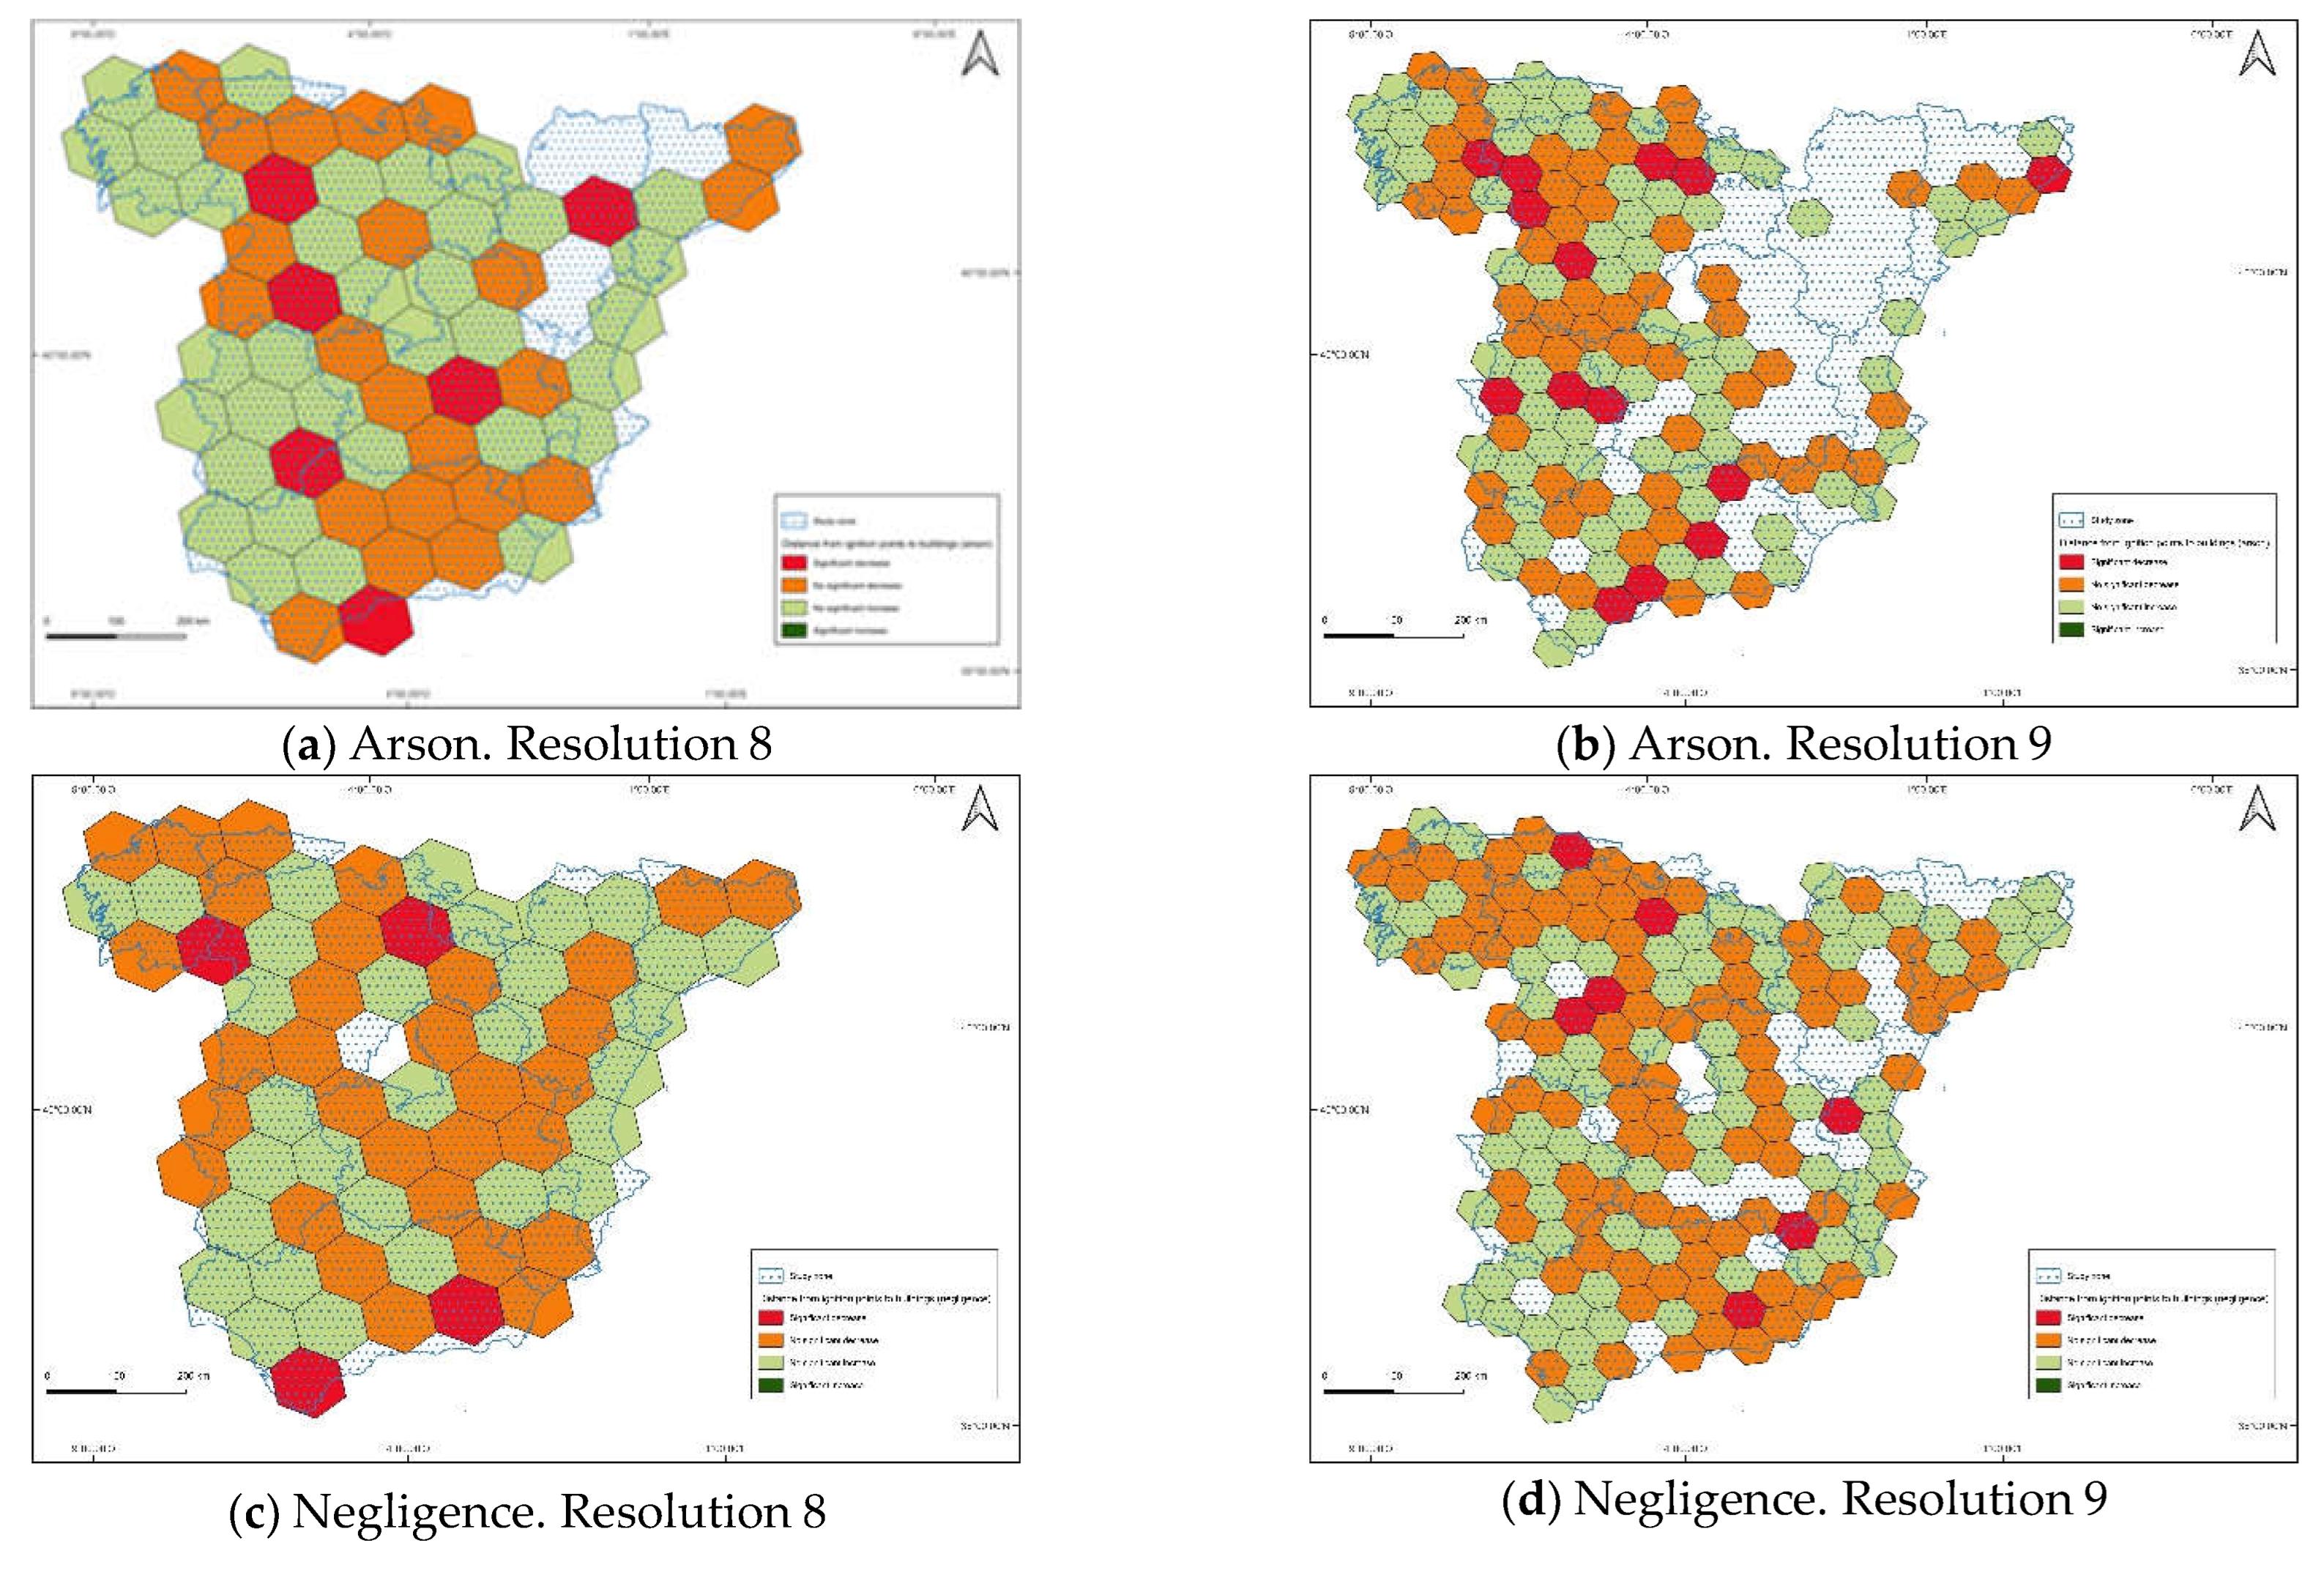
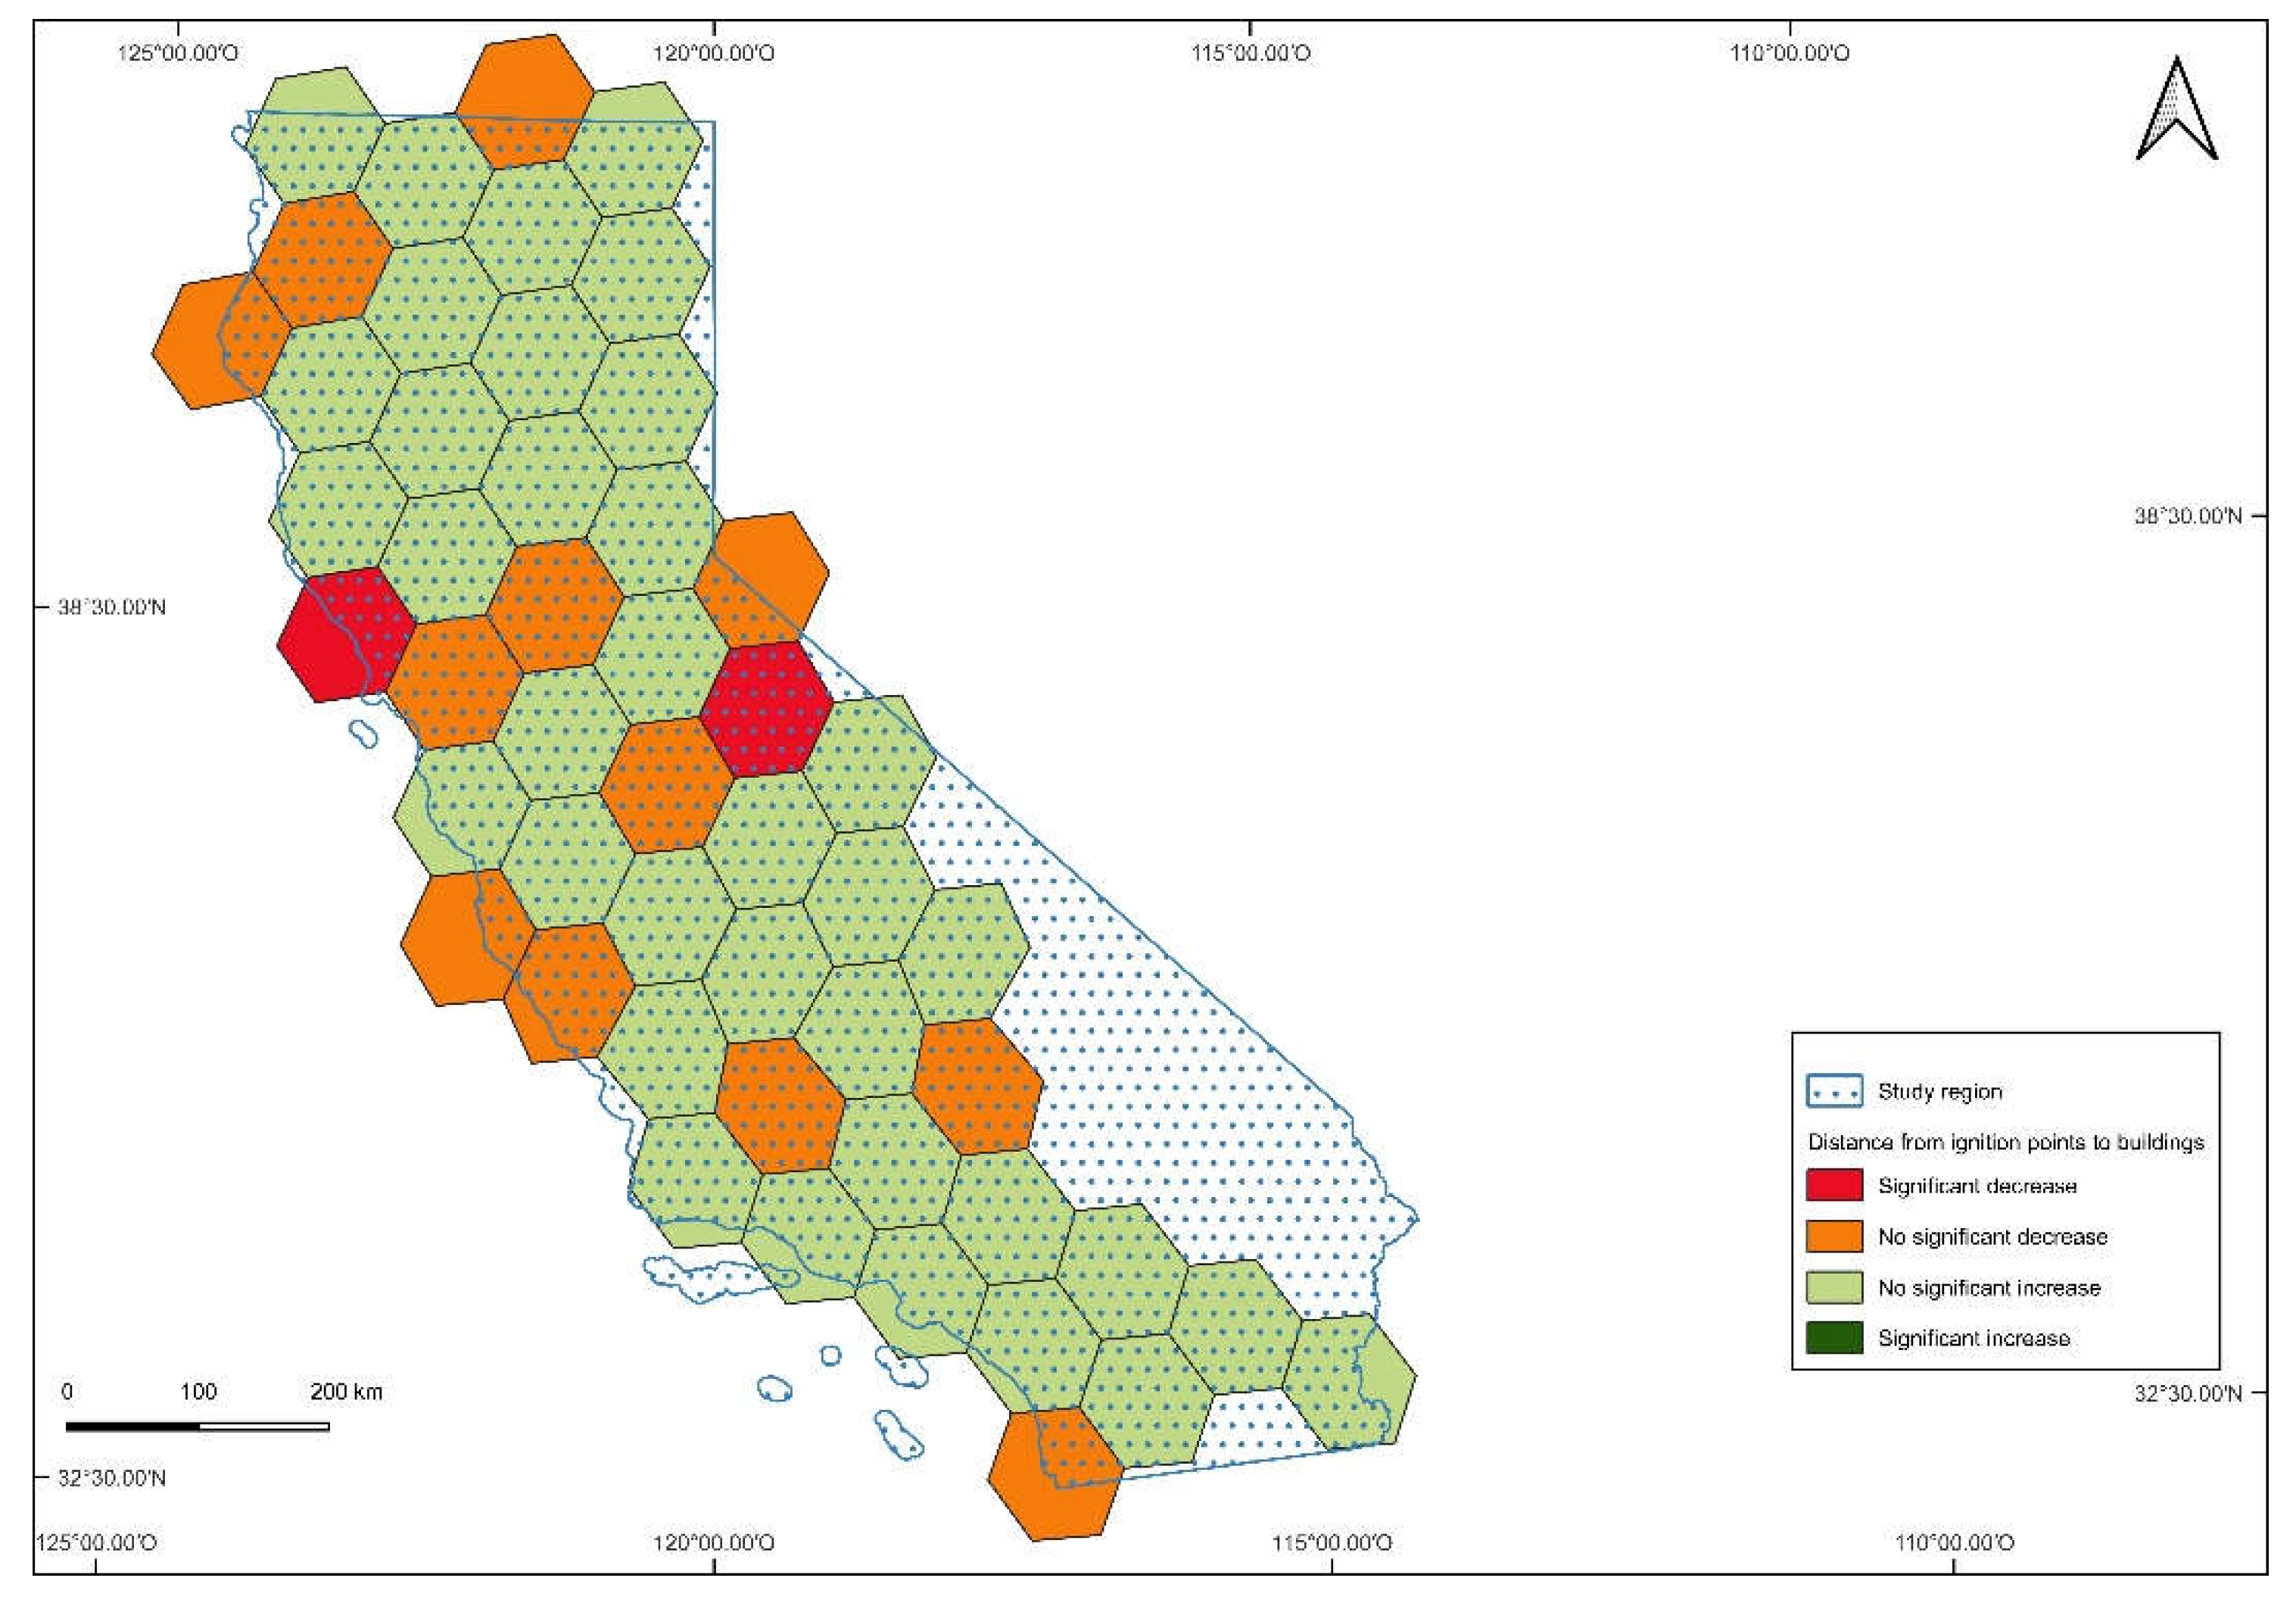
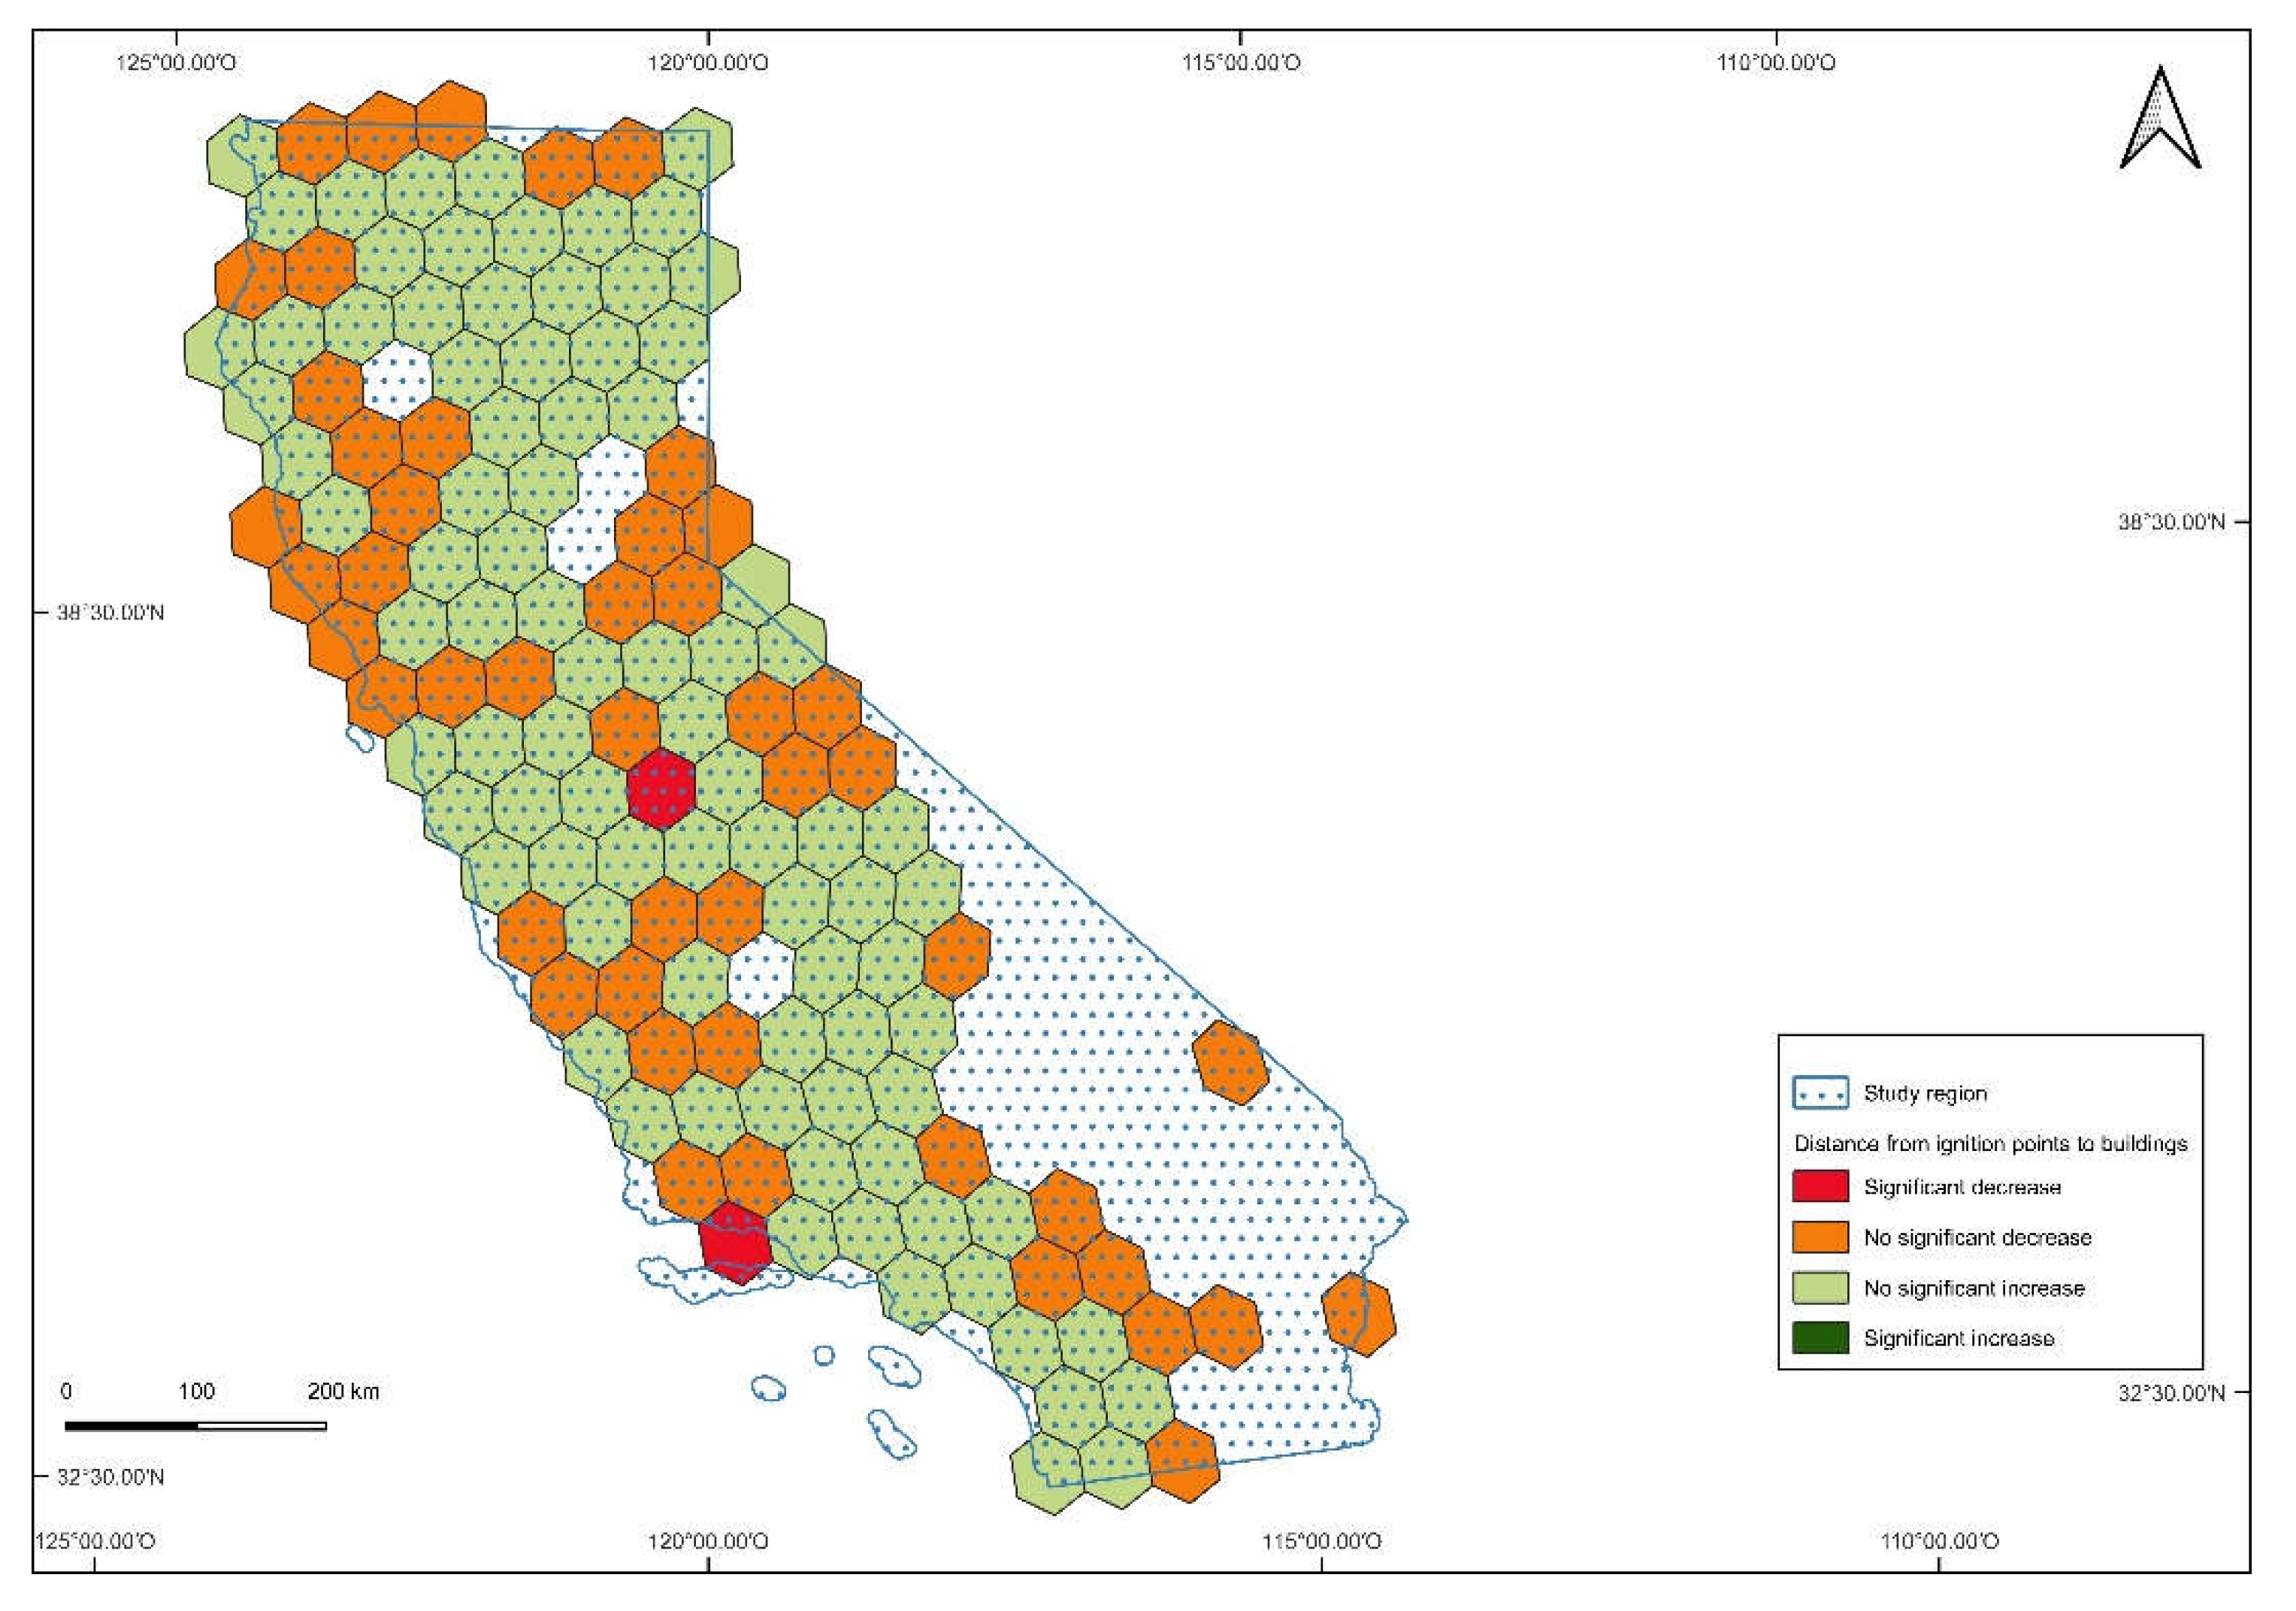
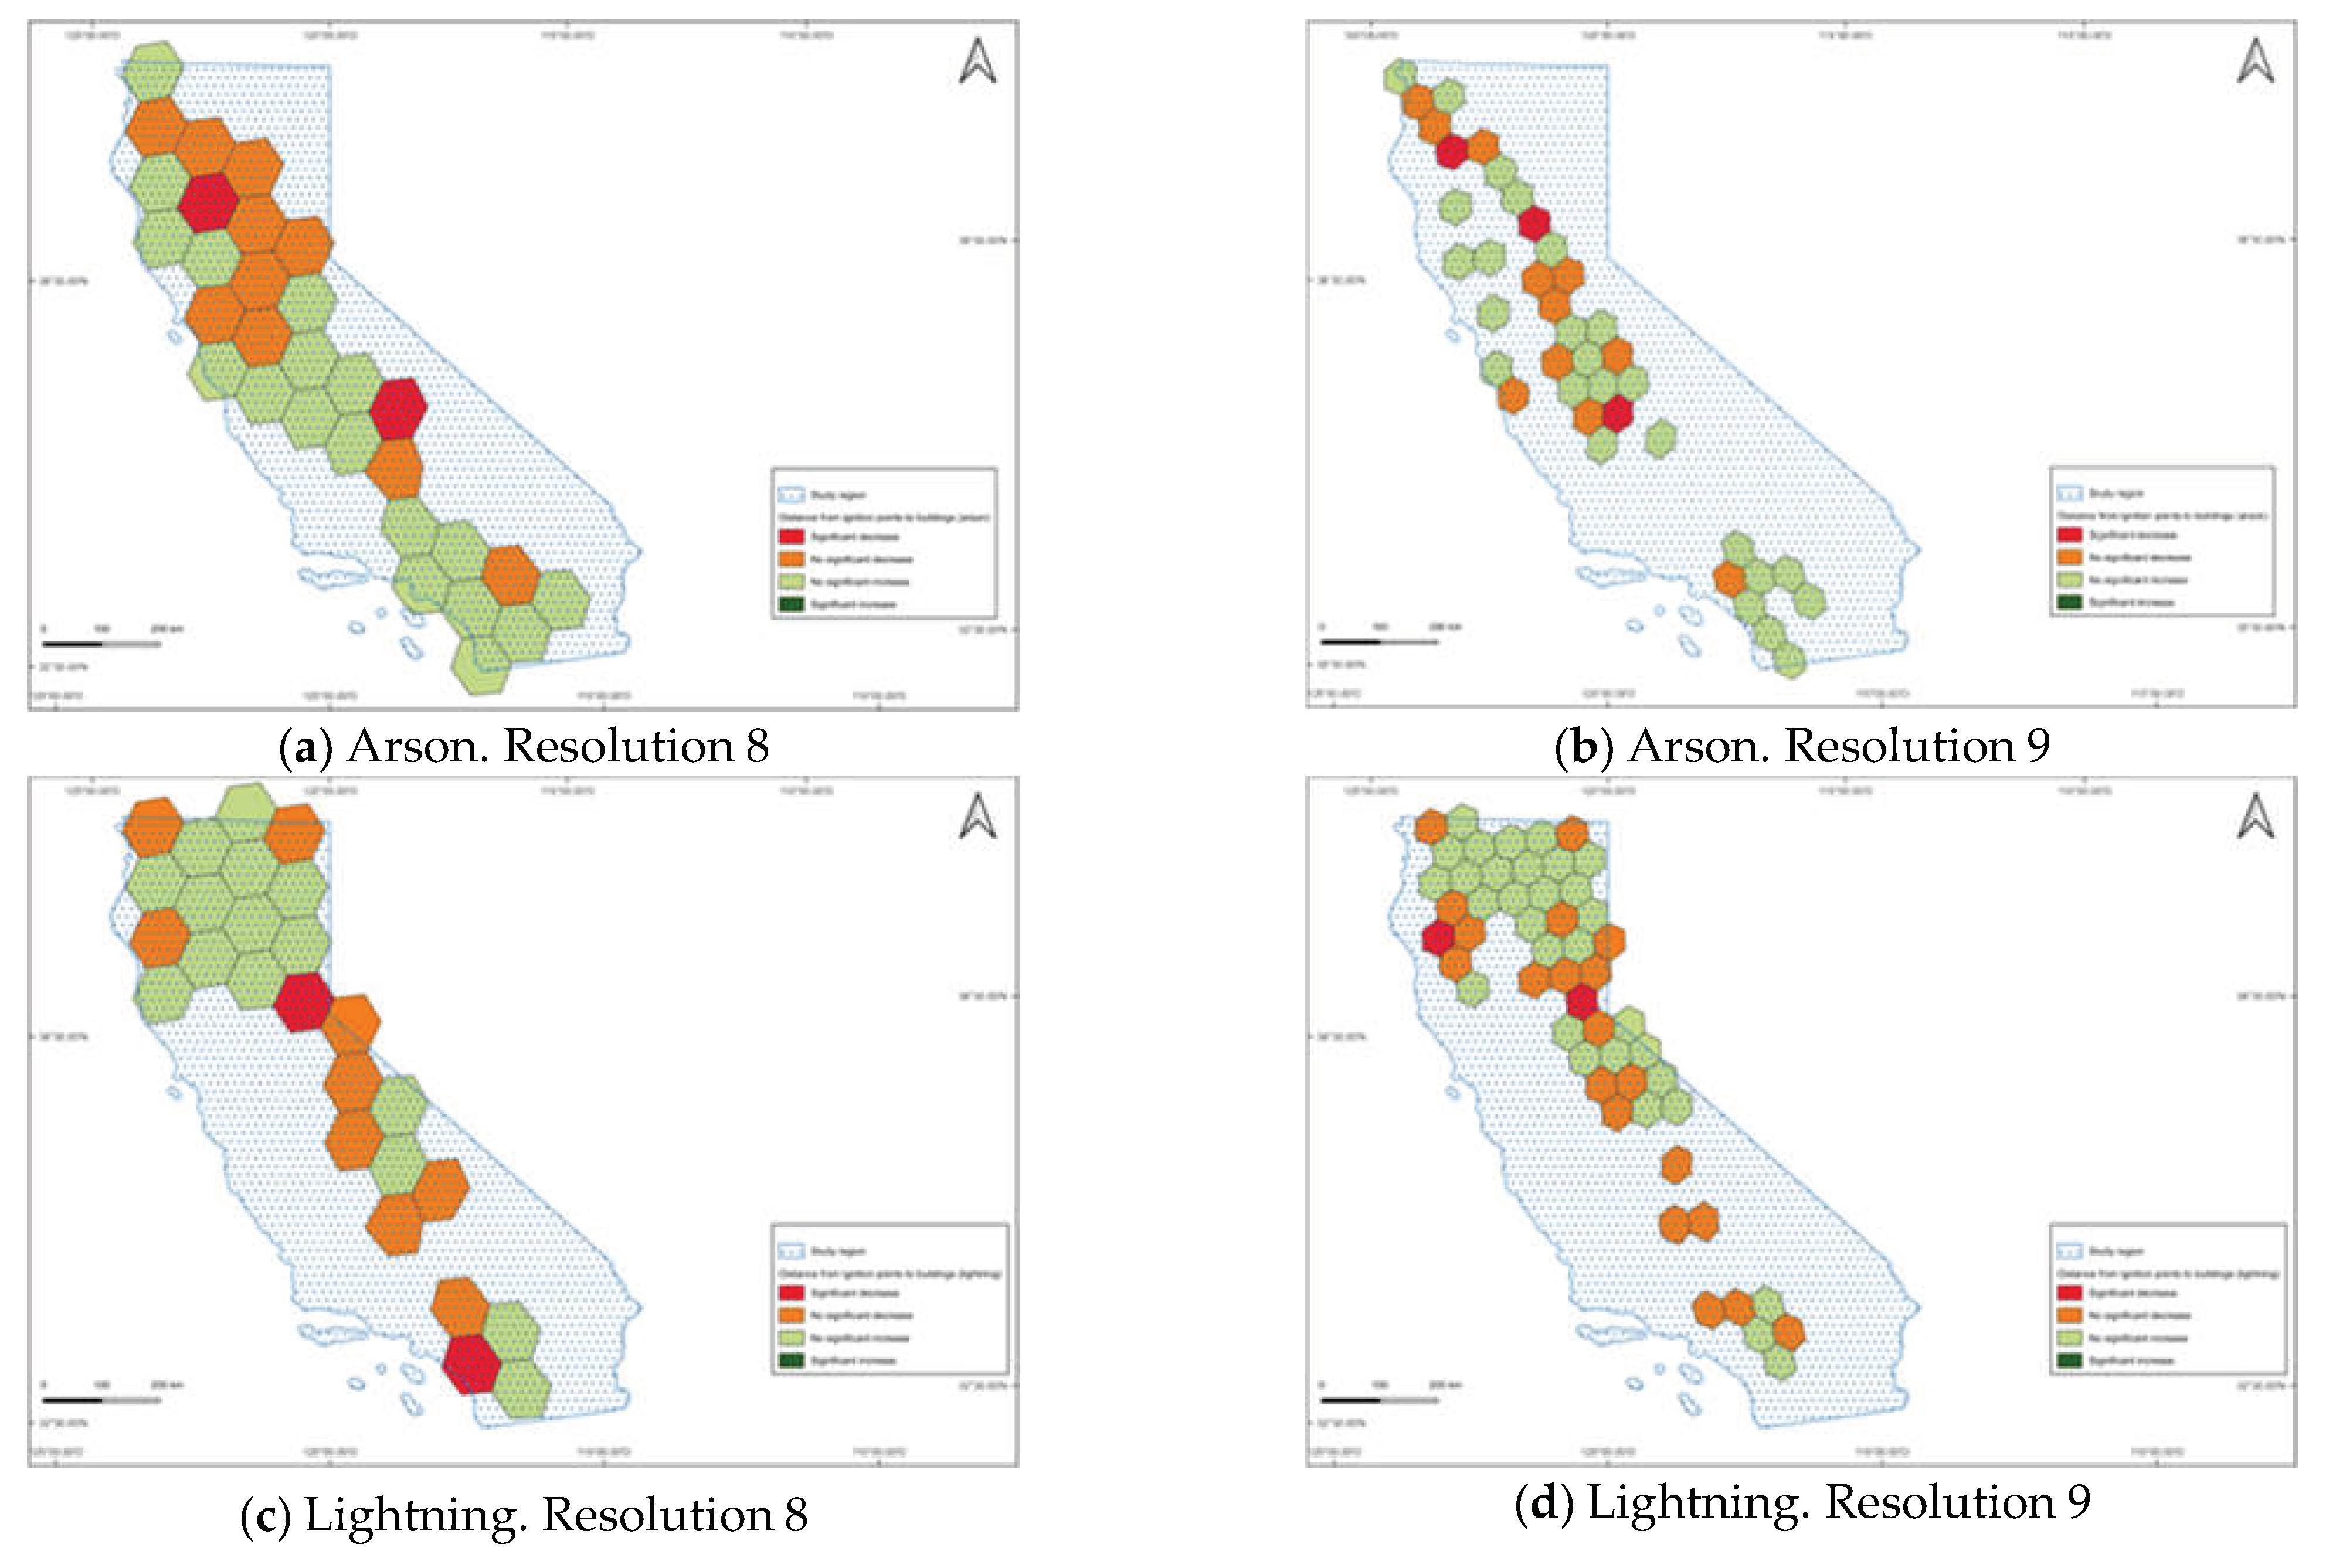
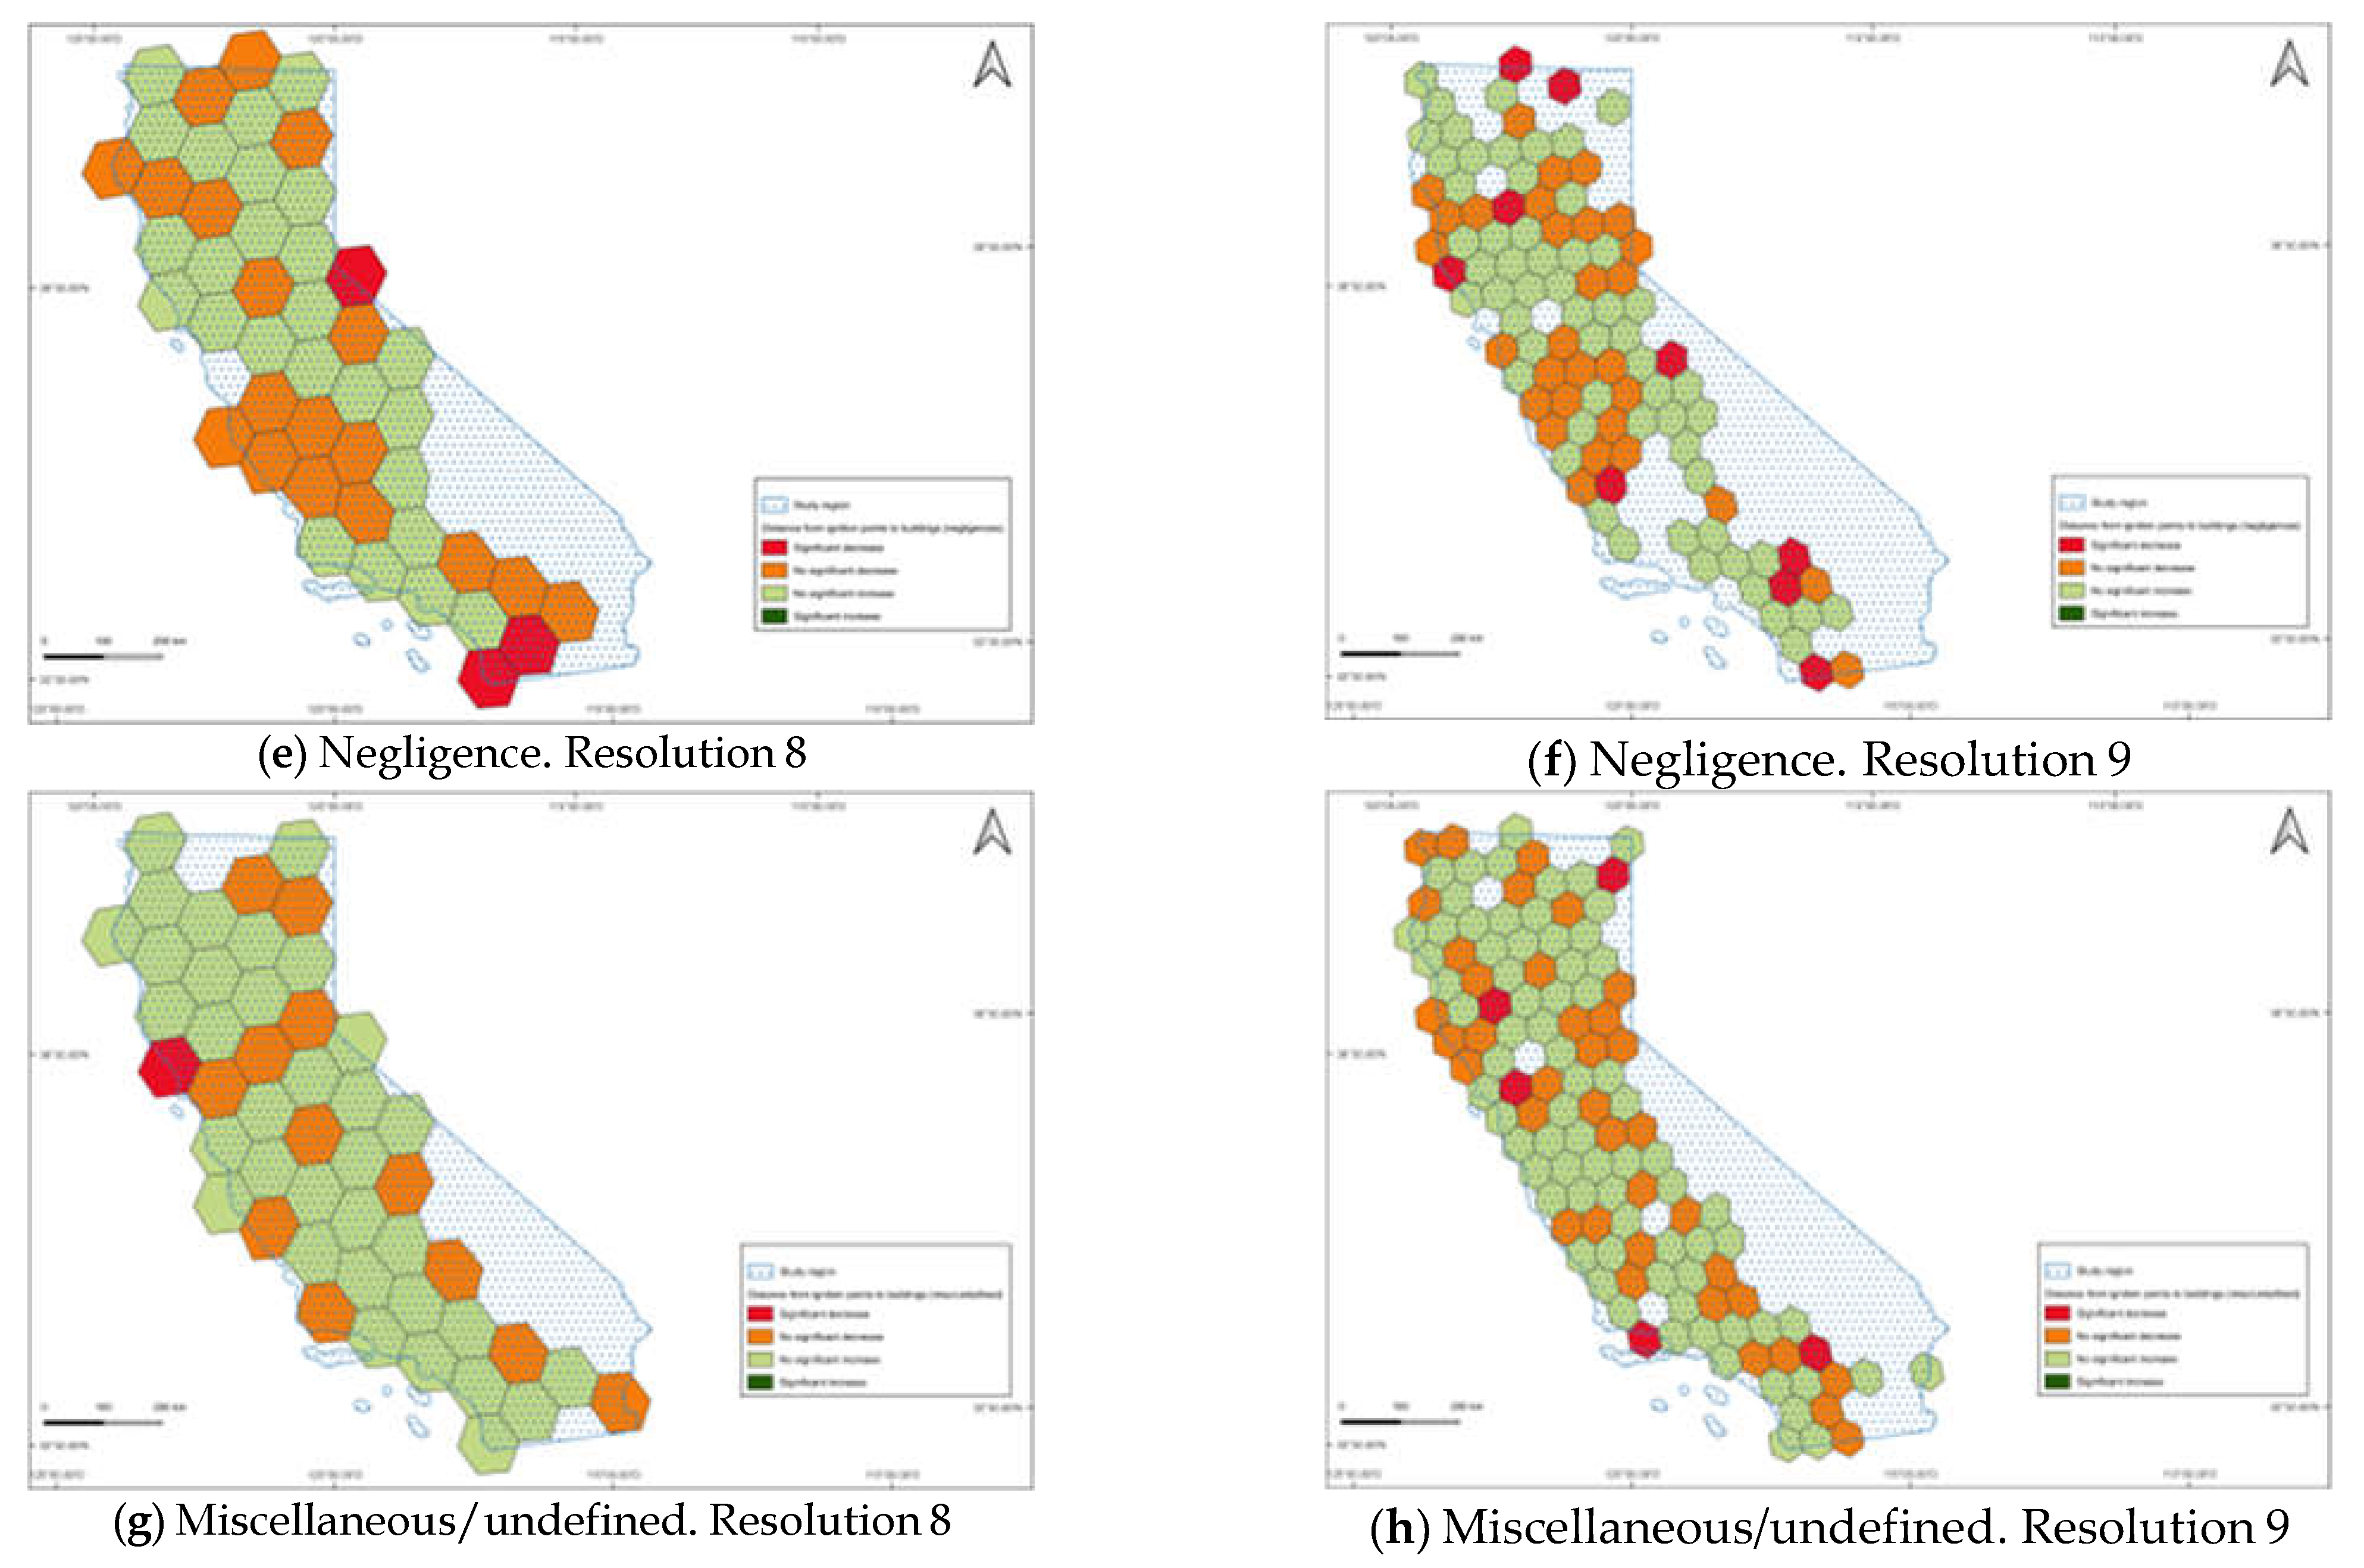
| Total number Year of fires |
Total burnt area (ha) | Number of fires June- October | Burnt area between June-October (ha) | % of total fires betweenJune-October | % of total area burnt between June and October |
| 2007 5590 | 53310 | 2801 | 39494 | 50.1 | 74.1 |
| 2008 6552 | 41870 | 2604 | 20825 | 39.7 | 49.7 |
| 2009 8953 | 119400 | 3977 | 88626 | 44.4 | 74.2 |
| 2010 6298 | 47179 | 3791 | 35479 | 60.2 | 75.2 |
| 2011 9893 | 93248 | 6369 | 71505 | 64.4 | 76.7 |
| 2012 9483 | 207508 | 3403 | 151693 | 35.9 | 73.1 |
| 2013 6023 | 61486 | 4351 | 52566 | 72.2 | 85.5 |
| 2014 5301 | 41391 | 2449 | 21708 | 46.2 | 52.4 |
| 2015 6716 | 108806 | 3521 | 77935 | 52.4 | 71.6 |
| Cause | Total number of fires | Total burnt area (ha) | Number of fires June-October | Burnt area between June-October (ha) |
| Arson | 37341 | 377102 | 18181 (48.7%) | 227841 (60.4%) |
| Lightning | 1669 | 43319 | 1489 (89.2%) | 40584 (93.7%) |
| Negligence | 18648 | 290440 | 9494 (50.9%) | 243027 (83.7%) |
| Reproduced | 1139 | 20555 | 818 (71.8%) | 15844 (77.1%) |
| Undefined | 6012 | 42782 | 3284 (54.6%) | 32533 (76.0%) |
| Total number Year of fires |
Total burnt area (ha) | Number of fires June- October | Burnt area between June-October (ha) | % of total fires between June-October |
% of total area burnt between June and October |
| 2007 5427 | 422788 | 3622 | 406816 | 66.7 | 96.2 |
| 2008 5231 | 578717 | 3740 | 548030 | 71.5 | 94.7 |
| 2009 4069 | 188592 | 2957 | 179186 | 72.7 | 95.0 |
| 2010 3300 | 48848 | 2792 | 45571 | 84.6 | 93.3 |
| 2011 4601 | 77683 | 3467 | 72879 | 75.4 | 93.8 |
| 2012 3868 | 307801 | 2700 | 303423 | 69.8 | 98.6 |
| 2013 4403 | 237287 | 2563 | 195918 | 58.2 | 82.6 |
| 2014 2828 | 221176 | 1766 | 206518 | 62.4 | 93.4 |
| 2015 3061 | 343332 | 2215 | 335022 | 72.4 | 97.6 |
| Cause | Total number of fires | Total burnt area (ha) | Number of fires June-October | Burnt area between June-October (ha) |
| Arson | 3075 | 121108 | 2307 (75.0%) | 118156 (97.6%) |
| Lightning | 3462 | 1055175 | 3293 (95.1%) | 1045989 (99.1%) |
| Misc/undefined | 18435 | 776272 | 13111 (71.1%) | 683524 (88.1%) |
| Negligence | 11816 | 473670 | 7111 (60.2%) | 445694 (94.1%) |
| Cause | % of area at resolution 8 | % of area at resolution 9 |
| All causes | 3.8 | 1.4 |
| Arson | 6.3 | 7.0 |
| Lightning | 7.4 | 3.5 |
| Misc/undefined | 2.0 | 4.2 |
| Negligence | 6.2 | 9.3 |
Disclaimer/Publisher’s Note: The statements, opinions and data contained in all publications are solely those of the individual author(s) and contributor(s) and not of MDPI and/or the editor(s). MDPI and/or the editor(s) disclaim responsibility for any injury to people or property resulting from any ideas, methods, instructions or products referred to in the content. |
© 2024 by the authors. Licensee MDPI, Basel, Switzerland. This article is an open access article distributed under the terms and conditions of the Creative Commons Attribution (CC BY) license (http://creativecommons.org/licenses/by/4.0/).


