1. Introduction
The rapid expansion of variable renewable energy generation and its integration into energy systems are indispensable measures to decarbonize many economies around the world and to keep the rising global temperature within the target of the Paris Agreement [
1]. This expansion leads to the increase in the variability of energy supply both in the long- and short-term, which can be addressed by various flexibility measures ranging from regulatory adjustments, infrastructure expansion, deployment of controllable generation or storage technologies [
2]. Driven by the motivation of financial savings, environmental protection, or improving the security of supply including by own-interest in the technologies, the adoption of PV-Battery systems by private consumers gains increasing momentum in the past years [
3,
4] In Europe, the new installed capacities of residential battery systems in 2021 amount to 2.3 GWh, a doubling increase from the previous year. Moreover, the average attachment rate between battery and PV increased to 27% from 23%. In Germany, Europe’s largest PV-Battery market, 70% of new residential PV systems are equipped with battery storage [
5]. [
5] project that the cumulative residential battery capacities will amount to 23–44 GWh by 2026. With the consideration of its prospective growth, residential battery storage (RBS) can be a key flexibility measure of decarbonizing energy systems.
The reasons for residential end-users to install battery storage are mainly to increase their self-sufficiency and independence from electricity grids; for example, according to a preference survey conducted in Australia, 70% of the respondents wish to be disconnected from the electricity grid [
6]. According to [?], the interest in battery storage also increases when end-users lack the trust in their energy utilities, or when the energy supply is unreliable. [?] studied the economic feasibility of residential PV-Battery systems in Germany. Among other factors, the improvement on self-sufficiency depends on the demand, PV-generation profile, and system sizing. On average, the self-sufficiency can improve from 38% for systems without storage to 65% in the early years and to 57% at the end of lifetime. The reducing performance is due to battery degradation. Beyond the perspective of end-users, battery storage can also benefit energy providers. In Ref. [
7], peak-shaving operation of battery storage in medium-voltage distribution grids can significantly reduce the grid reinforcement costs; however, this application is deemed economical at the battery price of 60–80€/kWh. For comparison, the battery price for small- and medium-sized customers in Germany in 2023 is approx. 600–800€/kWh [
8]. [?] found that the optimal siting and sizing of flow batteries can defer the expansion of low-voltage grids despite the increasing peak load from the adoption of heat pumps and electric vehicles. The utilization of RBS can also be shared among actors, namely, the PV customers, energy providers, and distribution network operators. While this multi-services operation model can improve the return on battery investments, its implementation in vertically-disintegrated systems must address the issues on regulations and on revenue allocation [
9]. Similarly, the investigation in Ref. [
10] demonstrates the technical feasibility of aggregated residential batteries providing frequency containment reserves without jeopardizing the self-sufficiency of end-users. Thus, the literature suggests that RBS is a valuable asset not only for the owner but also for providing services to the systems.
The literature on the benefits of RBS largely focuses on the asset owners and to some extent on the distribution grids. To the best of our research, the effects of increasing RBS adoption on energy markets or transmission grids are not well studied. Furthermore, the context of existing studies is on power systems with increasing share of variable renewable energy but not on energy systems undergoing the decarbonization. The aim of this work is to investigate benefits of RBS with different operation objectives on electricity markets and transmission grids of decarbonizing energy systems. The case study for this is Germany, whose target is to become fully decarbonized by the year 2045. Concretely, this paper addresses the following questions:
How do different operation objectives of residential battery storage—namely to react to spot market prices, to increase own self-consumption, and to reduce the regional peak load—affect the total generation costs of the system?
What are the impacts of residential battery storage operation on the regional self-sufficiency?
What are the effects of these operation objectives on the utilization and congestion of transmission grids?
To answer these questions, an economic dispatch model, i.e., a market model, is coupled to a transmission grid model. The geographic resolution of the models is NUTS-3 (Nomenclature of Territorial Units for Statistics) [
11] and each transmission nodes in Germany, respectively. [
21] provides the basis for the capacity expansion and electrification of heating-, transport-, and industrial sectors to achieve the decarbonization target.
2. Methodology
The method applied in this work combines an economic dispatch model (ENTIGRIS) with a transmission grid model for Germany (MILES). Both models are softly coupled to one another, i.e., the results from the dispatch model are passed onto the grid model without direct feedback.
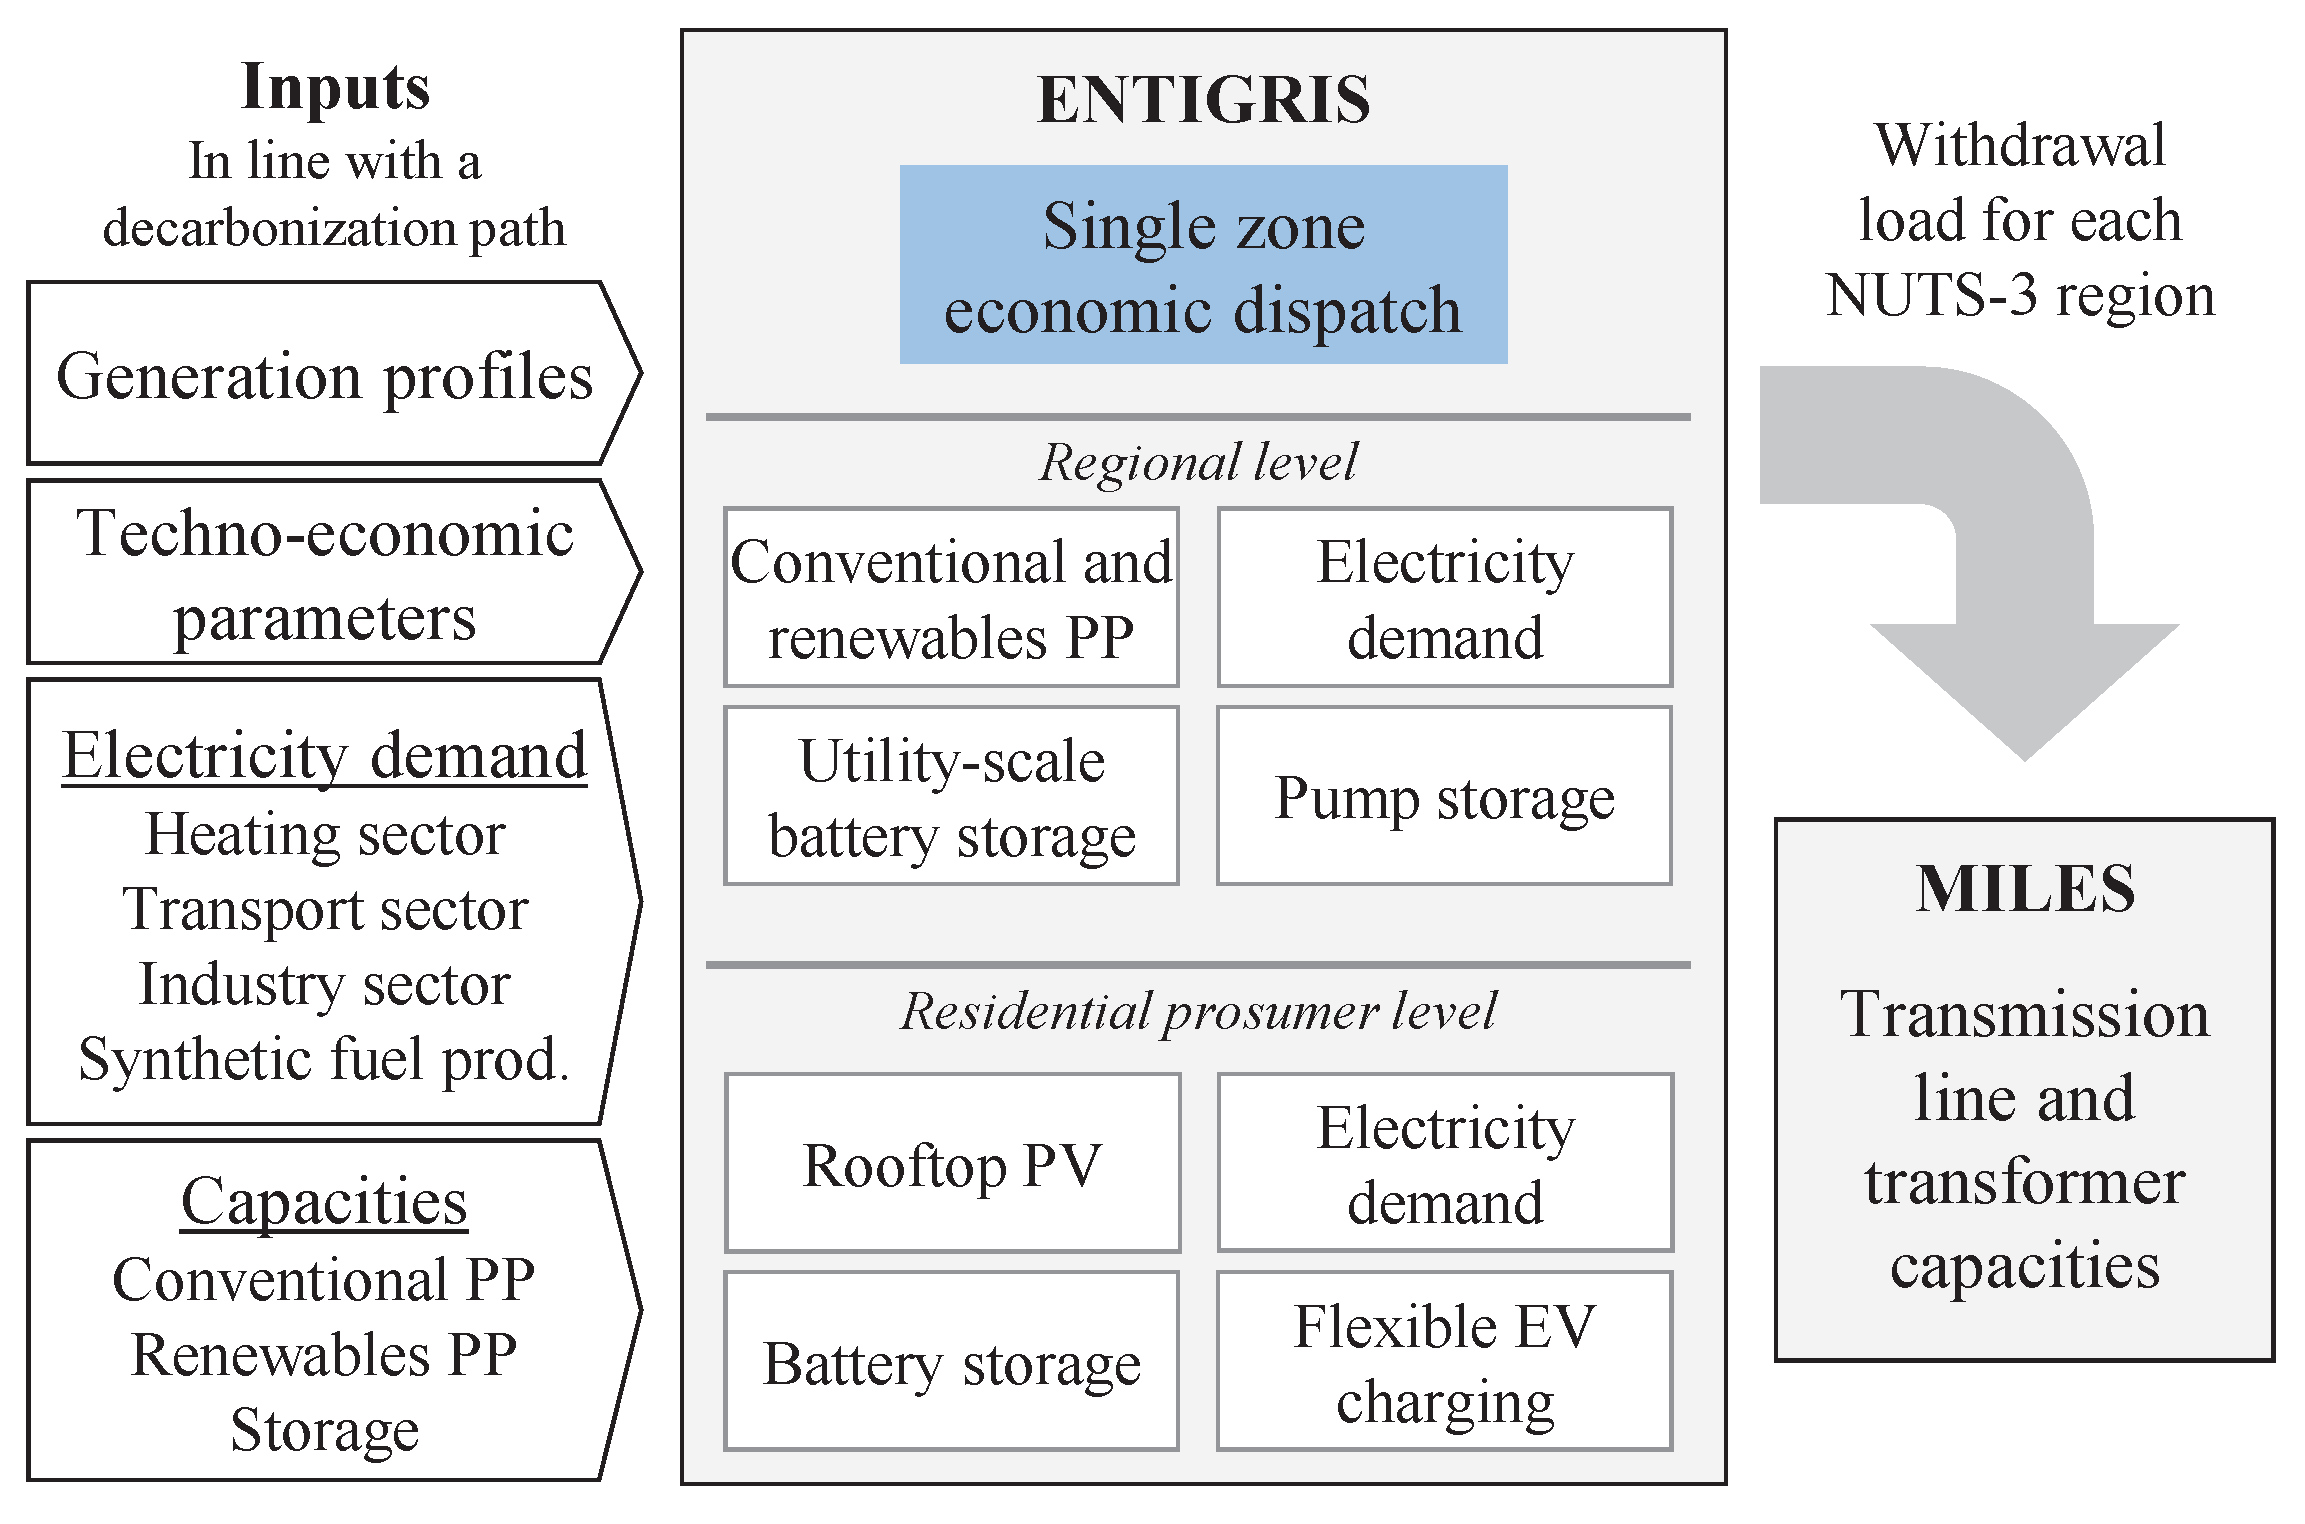
Figure 1 provides a high-level overview of the method. First, from left to right, the technology capacities, energy demand-, and variable renewable energy profiles from a national study on the transformation pathway for Germany is disaggregated for all NUTS-3 regions for each modeling year. Second, the dispatch model optimizes the time-resolved operation of all technologies with the objective to minimize the operative costs of the system. The resulting withdrawal load profiles of each region are fed into the grid model for the power flow optimization. This load is calculated by subtracting all electricity generation from the demand.
Section 2.1 and
Section 2.2 explain the dispatch and grid models, respectively.
2.1. Economic Dispatch Model
The model ENTIGRIS is a time-resolved and regionalized expansion and operation optimization model for an electricity sector [
12,
13]. It is formulated as a linear programming problem, and is implemented in the software GAMS [
14]. Its objective function is to minimize the total cost of electricity supply, which includes investment-, operation & maintenance-, fuel-, and emission costs. The model considers both the geographic regions and the market zones, which are defined as collections of regions. It accounts for the electricity demand from the residential- and non-residential sectors, electrification in the transport and industry sectors, and the electricity demand for the production of synthetic fuels. Technology components in the model include conventional power plants, (variable) renewable energy power plants, and electricity storages. Moreover, the capacity constraints and possible expansion of electricity grids between regions or between zones can be accounted for [
15].
For this work: regions are defined at the NUTS-3 level. This results in over 400 geographic regions. A single market zone is assumed. In order to manage the computational complexity, the technology expansion is disabled, i.e., the model optimizes the operation given externally-prescribed installed capacities for each year. Essentially, the model inputs for a given year are: hourly-resolved profiles of electricity demand, solar-, and wind energy generation including installed capacities for individual regions; and techno-economic parameters, such as operation efficiency, fuel-, and emission prices. And the outputs are the operation of each technology, withdrawal load for each region, and operative costs of the system.
The following presents equations of the model essential to the work. Parameters are written in darkgray to provide a contrast to the decision variables, written in black.
Eq.
1 describes the operation constraints of fuel-fired power plants. Hourly generation
of respective power plants
and regions
r is limited by its installed capacities
, and equals to fuel consumption
multiplied by efficiency
. As for the variable renewable energy
—PV, wind onshore, and wind offshore—the generation is limited by the normalized generation profile
multiplied by respective installed capacities, see Eq.
2. The model is able to constraint the ramp up and ramp down rate of conventional power plants; however, this feature is intentionally disable for the sake of computational simplicity. This is deemed justified as power plants in the future energy systems should be sufficiently flexible for an hourly-resolved optimization.
For storage technologies
, e.g., pumped hydro storage and battery, Eq.
3 constraints the charge
and discharge power
to the installed power capacity
. Similarly, Eq.
4 applies to the state-of-charge
. And Eq.
5 represents the storage balance;
is the charge-discharge efficiency. Flexibility from shifting the charging schedule of electric vehicles is modeled as virtual storage whose power and energy capacities are determined by a ratio of shiftable demand and a shiftable time period. Eq.
3-
5 also apply to the virtual storage. The modeling of flexible demand as a virtual storage is developed in Ref. [
16] and generalized in Ref. [
17].
Eq.
6 enforces the energy balance for each region; essentially, the withdrawal load
equals to the sum of electricity demand from all demand sectors
minus the regional energy generation including the storage charge and discharge. And in Eq.
7, the imbalance at the market zone level, i.e., the sum of withdrawal loads from all regions in the zone, must be met by import and export between market zones.
The objective function of the dispatch model is to minimize the total operative cost of the system’s energy supply, which is defined in Eq.
8. The total cost consists of: the fixed and variable operation & maintenance costs, the fuel costs including related emission costs, and the electricity import costs.
In its default setup, the model presents the
market-oriented scenario when all technologies including PV-battery work together to minimize the operative costs of the system. These operation scenarios are based on the research questions presented in
Section 1, and their interpretations are further elaborated in
Section 3.
Without directly coupling the transmission and distribution grid models with the economic dispatch model, the
peak-reduction scenario is implemented by introducing an additional peak reduction objective. That is Eq.
8 is appended with peak penalty costs, see Eq.
9. With the penalty, the model has the secondary incentive to flatten or curtail the withdrawal load of each region.
Lastly, the
self-consumption scenario when prosumers utilize their battery storage only in conjunction with own PV generation and demand is modeled by separating the dispatch problem into two stages. In the first stage, the operation of PV-Battery is optimized with the objective to reduce the prosumers’ electricity import. In the second stage, the operation of the residential prosumer level is fixed, and the model continues to optimize other technologies in the regional and market levels, see
Figure 1.
2.2. Transmission Grid Model
For the simulation of the German transmission grid, the Model of International Energy Systems (MILES) [?] is used. In general, MILES is used to determine pan-European current or future generation-load-cases and the resulting utilization of the transmission grid. Besides the simulation of the transmission grid, the model includes the regionalization of loads and RES capacities, the generation of the corresponding time series as well as a unit commitment.
In this paper the output data of the economic dispatch model from chapter 2.1 serves as input data for the subsequent simulation of the transmission grid. However, data at the node level
1 of the transmission grid is required to determine the grid status. Therefore, the hourly time series of all NUTS-3 regions are first distributed to the nodes of the transmission grid using a Voronoi approach. The nodes are used as centroids of the Voronoi cells. The distribution key then results from the intersection of the area of the NUTS-3 region with the areas of the Voronoi cells. In addition to the hourly time series of the NUTS-3 regions, trade exchanges with all neighboring countries are also taken into account. For each border, these cross-border flows are allocated to the individual cross-border interconnectors in proportion to their capacity, and assigned to the corresponding nodes on the German transmission grid side. In this way, hourly net capacities are available for each node of the transmission grid.
For a given grid load situation the corresponding grid’s system state is obtained either by solving the nonlinear network equations using the Newton-Raphson method (alternating-current (AC) load flow calculation) or by linearizing these equations (direct-current (DC) load flow calculation) if only active power flows are of interest. Both techniques are extensively described in the literature [?]. In this paper a multi-stage determination of the grid operating status is carried out based on [?]. First, direct-current load flow calculations are carried out to estimate the grid load. Based on the results of the load flow calculations, power flow-controlling equipment such as high-voltage direct current lines and phase shifting transformers are then optimized. The aim of the optimization is to reduce the utilization of overloaded alternating-current lines. In contrast to the approach in [?], the actual calculated grid losses are not allocated to individual power plant blocks. Instead, the losses are distributed to all NUTS-3 regions, i.e., the grid nodes assigned via the distribution key, in which conventional power plants are installed, in proportion to their maximum capacity.
3. Description of the Case
The German energy and climate policies aim to decarbonize its economy by 2045 with a primary reliance on variable renewable energy [
18]. It is expected that Germany requires significant short- and long term flexibility potentials to address the variability of supply [
19]; and flexibility from residential end-users holds high potentials to support the system [
20]. Therefore, Germany is chosen as the case study of the work.
In line with the research questions, three scenarios differentiating the operation of residential battery storage are considered, namely:
Market-oriented operation MK: Every energy storage, together with energy technologies, operates in unison to reduce the total generation costs of the system. This is conceptually equivalent to when residential prosumers receive dynamic electricity prices based on the market prices.
Self-consumption operation SC: Battery storage operates solely in response to the PV production and electricity demand of respective prosumers.
Peak-reduction operation PR: In addition to the generation cost reduction, all energy technologies are also operated to reduce the peak feed-in and withdraw of their respective regions.
For each scenario, the years 2020, 2030, and 2045—reference, intermediate, and target year—are calculated. In the following, any mention to scenarios is written in typewritter font.
Regarding the assumption for the transmission grid model: The status quo grid in 2020 was modeled based on the current expansion status of the grid. The assumptions for the grid model in 2030 are taken from the German Grid Development Plan created in 2019 [?]. As there are no openly available transmission grid assumptions for the year 2045, a heuristic was used to determine the expansion status based on the 2021 German Grid Development Plan [?] for the year 2035. The grid model consists of components of the 220 kV voltage level and above.
In the following:
Section 3.1 presents the assumptions of technology capacities and electricity demand. And
Section 3.2 explains the method to disaggregate these assumptions into the individual NUTS-3 regions.
3.1. Energy System Decarbonization Pathway
The decarbonization of the German energy system requires not only the expansion of energy technologies but also the electrification of heating-, transport-, and industrial sectors. The study “Paths to a Climate-Neutral Energy System: The German Energy Transition in its Social Context" [
21] is used as a foundation framework of the German decarbonization pathway towards the target year. This includes both the capacities of energy technologies and the transformation of energy consumption throughout the system. The study is conducted under the assumption of reaching the climate goal in 2045
2 with the heuristic least cost options using a time-resolved, sector-coupled energy system model. The techno-economic parameters as well as the results of the reference scenario are used in this work.
Table 1 presents the assumptions of power generation capacities, there is a rapid demand for the expansion of variable renewable energy sources in the observed period from 2020 to 2045. The expansion encompasses a capacity of 489 GW PV and 296 GW from wind turbines in 2045, of which offshore wind power plants contributing 76 GW and onshore wind power plants contributing 220 GW. Conventional generation technologies show declining trends. Nuclear power plants are phased out in 2023, and all lignite and hard coal power plants are to be decommissioned before 2038. Gas-fired power plants must be expanded to a total of 85 GW by 2030 in order to compensate for the fluctuating power supply and the declining base power generation. Gas power plants are then replaced by the expansion of hydrogen power plant capacities totaling 125 GW in 2045, of which 35 GW are converted gas turbines. The capacities of biomass and run-of-the-river power plants remain at an almost constant level of 2–4 GW and 4–5 GW, respectively, due to the limited potentials.
The capacities of energy storage technologies are provided in
Table 2. In order to counteract the increasing fluctuation of electricity supply, a rapid expansion of stationary batteries is needed, 70 GWh in 2030 and 117 GWh in 2045. It is expected that the majority of these batteries are owned by the residential prosumers together with the PV systems. The adoption of battery electric vehicles is essential to decarbonize the transport sector. The study shows that over 51 million vehicles are needed. These vehicles also provide flexibility for the system, be it from the system-oriented charging management or from the bi-directional charging. Lastly, the capacity of pumped hydro storage remains at a constant level of 40 GWh, as the potentials are largely exploited.
The considered electricity demand is from residential, industrial & commercial, transport, and synthetic fuel production (PtX) sectors.
Table 3 presents the total annual electricity demand. The 41% demand increase of the residential sector is due to the adoption of heat pumps, which counteracts the potential decrease from energy efficiency measures. Because of the electrification of process heat generation, the demand in the industry sector doubles. Due to the rapid electrification rate in passenger and freight transport, the electricity demand for the transport sector is projected to 215 TWh in 2045, a significant increase in comparison to the negligible demand in 2020. Furthermore, considerable electricity demand over 200 TWh p.a. is expected for the domestic production of hydrogen and PtX products. In summary, the decarbonization of the German energy system requires 2.7x increase in the total electricity demand. This presents new challenges for the power systems but also opportunities in terms of novel flexibility potentials.
While the reference study analyzed Germany as a single region, this work models the case study at the NUTS-3 level in order to analyze the regional self-sufficiency and the transmission grid utilization in detail. Therefore, the inputs from the reference study need to be disaggregated. This process is presented in the following
Section 3.2.
3.2. Disaggregation of Capacities and Demand
The information—installed capacities and energy demand—on the decarbonization pathway is on the national level without geographic differentiation. Therefore, the information is disaggregated onto the NUTS-3 regions using specific distribution keys.
Section 3.2.1,
Section 3.2.2 and
Section 3.2.3 explain the disaggregation of the installed capacities for the year 2030 and 2045. The capacity distribution of 2020 follows the real installed capacities according to the core energy market data register (MaStR, German:
Marktstammdatenregister) [
22].
Section 3.2.4,
Section 3.2.5,
Section 3.2.6 and
Section 3.2.7 present the distribution of electricity demand.
3.2.1. Renewable Energy Resources
The distribution of PV and onshore wind turbines for the years 2030 and 2045 onto the NUTS-3 regions is based on the renewable energy potentials from the scenario S3 of [
23]—the most restrictive scenario. an even penetration rate of each technology is assumed, i.e., if possible, all regions first assume the same capacity expansion rate up until respective potential limits. The algorithm then increases the expansion rates in regions with unexploited potentials to compensate the shortcoming until the target installed capacities are reached.
Offshore wind turbines are allocated to NUTS-3 regions based on their current grid feed-in points according to the MaStR [
22]. The capacity distribution in the subsequent years is done with respect to the current distribution. The distribution of the run-of-the-river power plants and biomass power plants is carried out in the same manner.
Regarding the generation profiles of variable renewable energy, the ERA-5 weather dataset provides the basis for the derivation of generation profiles of PV, onshore-, and offshore wind turbines for each region [
24]. For the sake of comparability, the weather year of 2020 is also applied for the subsequent years. The use of region-specific generation profiles allows the modeling of unique weather patterns in each region.
3.2.2. Fuel-fired Power Plants
The coal-, oil-, and nuclear power plants (PP) are expected to be decommissioned in the later years. The reduction of installed capacities is done at a uniform rate for all regions that current possess these technologies. The capacities of these PPs together with the existing gas-fired PPs in 2020 are used to define a distribution key for the gas-fired- and the hydrogen-fired PPs in the subsequent years. This key indicates not only the concentration of load, i.e., load centers, but also the location with existing electricity infrastructure. Moreover, the distribution also implies that the decommissioned gas-fired PPs from 2030 onward are uniformly replaced by hydrogen-fired PPs.
3.2.3. Energy Storage Technology
The distribution of the pumped hydro storage is based on Ref. [
22] and is unchanged for all years. It is assumed that stationary battery storage is expanded together with variable renewable energy capacities—PV and onshore wind turbines. This represents a
grid-friendly capacity expansion. The distribution of mobile storage, i.e., battery electric vehicles, is discussed in
Section 3.2.6.
3.2.4. Demand in the Residential Sector
The residential electricity demand consists of the base demand from household equipment and the demand from the electrified heating, e.g., from heat pumps. A standard load profile from the German Association of Energy and Water Industries (German:
Bundesverband der Energie- und Wasserwirtschaft e.V.) is used as a time-resolved basis for the base demand. The profile accounts for the variation of consumption pattern on weekdays, weekend, and public holidays [
25]. The time-resolved profile of electrified heating is extracted from [
21], in which, the underlying operation of heating technologies considers the weather pattern, the degree of building refurbishment, and conversion efficiency [
21,
26]. Once the aggregated national demand profile is processed, they are spatially distributed to the NUTS-3 regions according to the population distribution. The population data is provided by the “DemandRegio" project [
27].
3.2.5. Demand in the Industrial and Commercial Sectors
In [
21], the time-resolved electricity demand of the industrial- and commercial sectors is provided for the considered years. For the base demand in the year 2020: The industrial electricity demand is distributed onto the economic branches via the data on the energy consumption in each economic branches from the dataset “Environmental-Economic National Account" compiled by the Federal Statistics Office [
28]. Then, the demand is distributed onto the NUTS-3 regions using the statistics on the regional employment by economic branches from the “DemandRegio" project [
27].
The increase demand increase in 2030 and 2045, see
Table 3, is largely due to the electrification of process heat supply; thus, the increase is allocated on economic branches strongly characterized by high process heat demand. The allocation regards: 1) the proportion of process heat that can be electrified, which varies by the temperature level, 2) the potential energy efficiency achievable from the fuel switch, which is particularly relevant for branches with centralized low-temperature heating, and 3) the realistic electrification rate, e.g., heat pump adoption or technology readiness level specific to each branches.
The procedure results in time-resolved demand profiles for each NUTS-3 region and each economic branch. Lastly, demand is aggregated over the economic branch dimension, as modeling of individual industrial economic branches is not of interest for the work.
3.2.6. Demand in the Transport Sector
A distinction of the electricity demand in the transport sector is made between battery electric vehicles (BEV) and cargo transport. The demand from cargo transport is distributed to the NUTS-3 region based on the number of employees as a proxy for region-specific economic output. The corresponding charging profile from Ref. [
26] is used for all regions. The demand from BEVs, which is proportional to the BEV number, is geographically distributed using the population distribution. The study “Mobility in Germany" [
29] provides a time-resolved charging profile for seven specific region types ranging from a village area to a metropolitan region. These profiles are the basis for the regional BEV charging profiles.
3.2.7. Demand in the Synthetic Fuel Production
It is assumed that the synthetic fuel production (PtX) concentrates near either the variable renewable energy generation or the hydrogen demand from the selected industrial branches. In other words, the placement of PtX shall relieve the electricity and gas grids. [?] assess prospective energy-intensive companies in Germany for the adoption of synthetic fuel. All regions are scored by these two factors with an equal weight. Then, the PtX demand is assigned to 250 regions with the highest score. This restriction is introduced to prevent the too small PtX demand, which is unlikely to occur due to infeasibility of small projects. The demand profile from Ref. [
21] is applied for all regions.
4. Results
4.1. Generation Costs and Technology Utilization
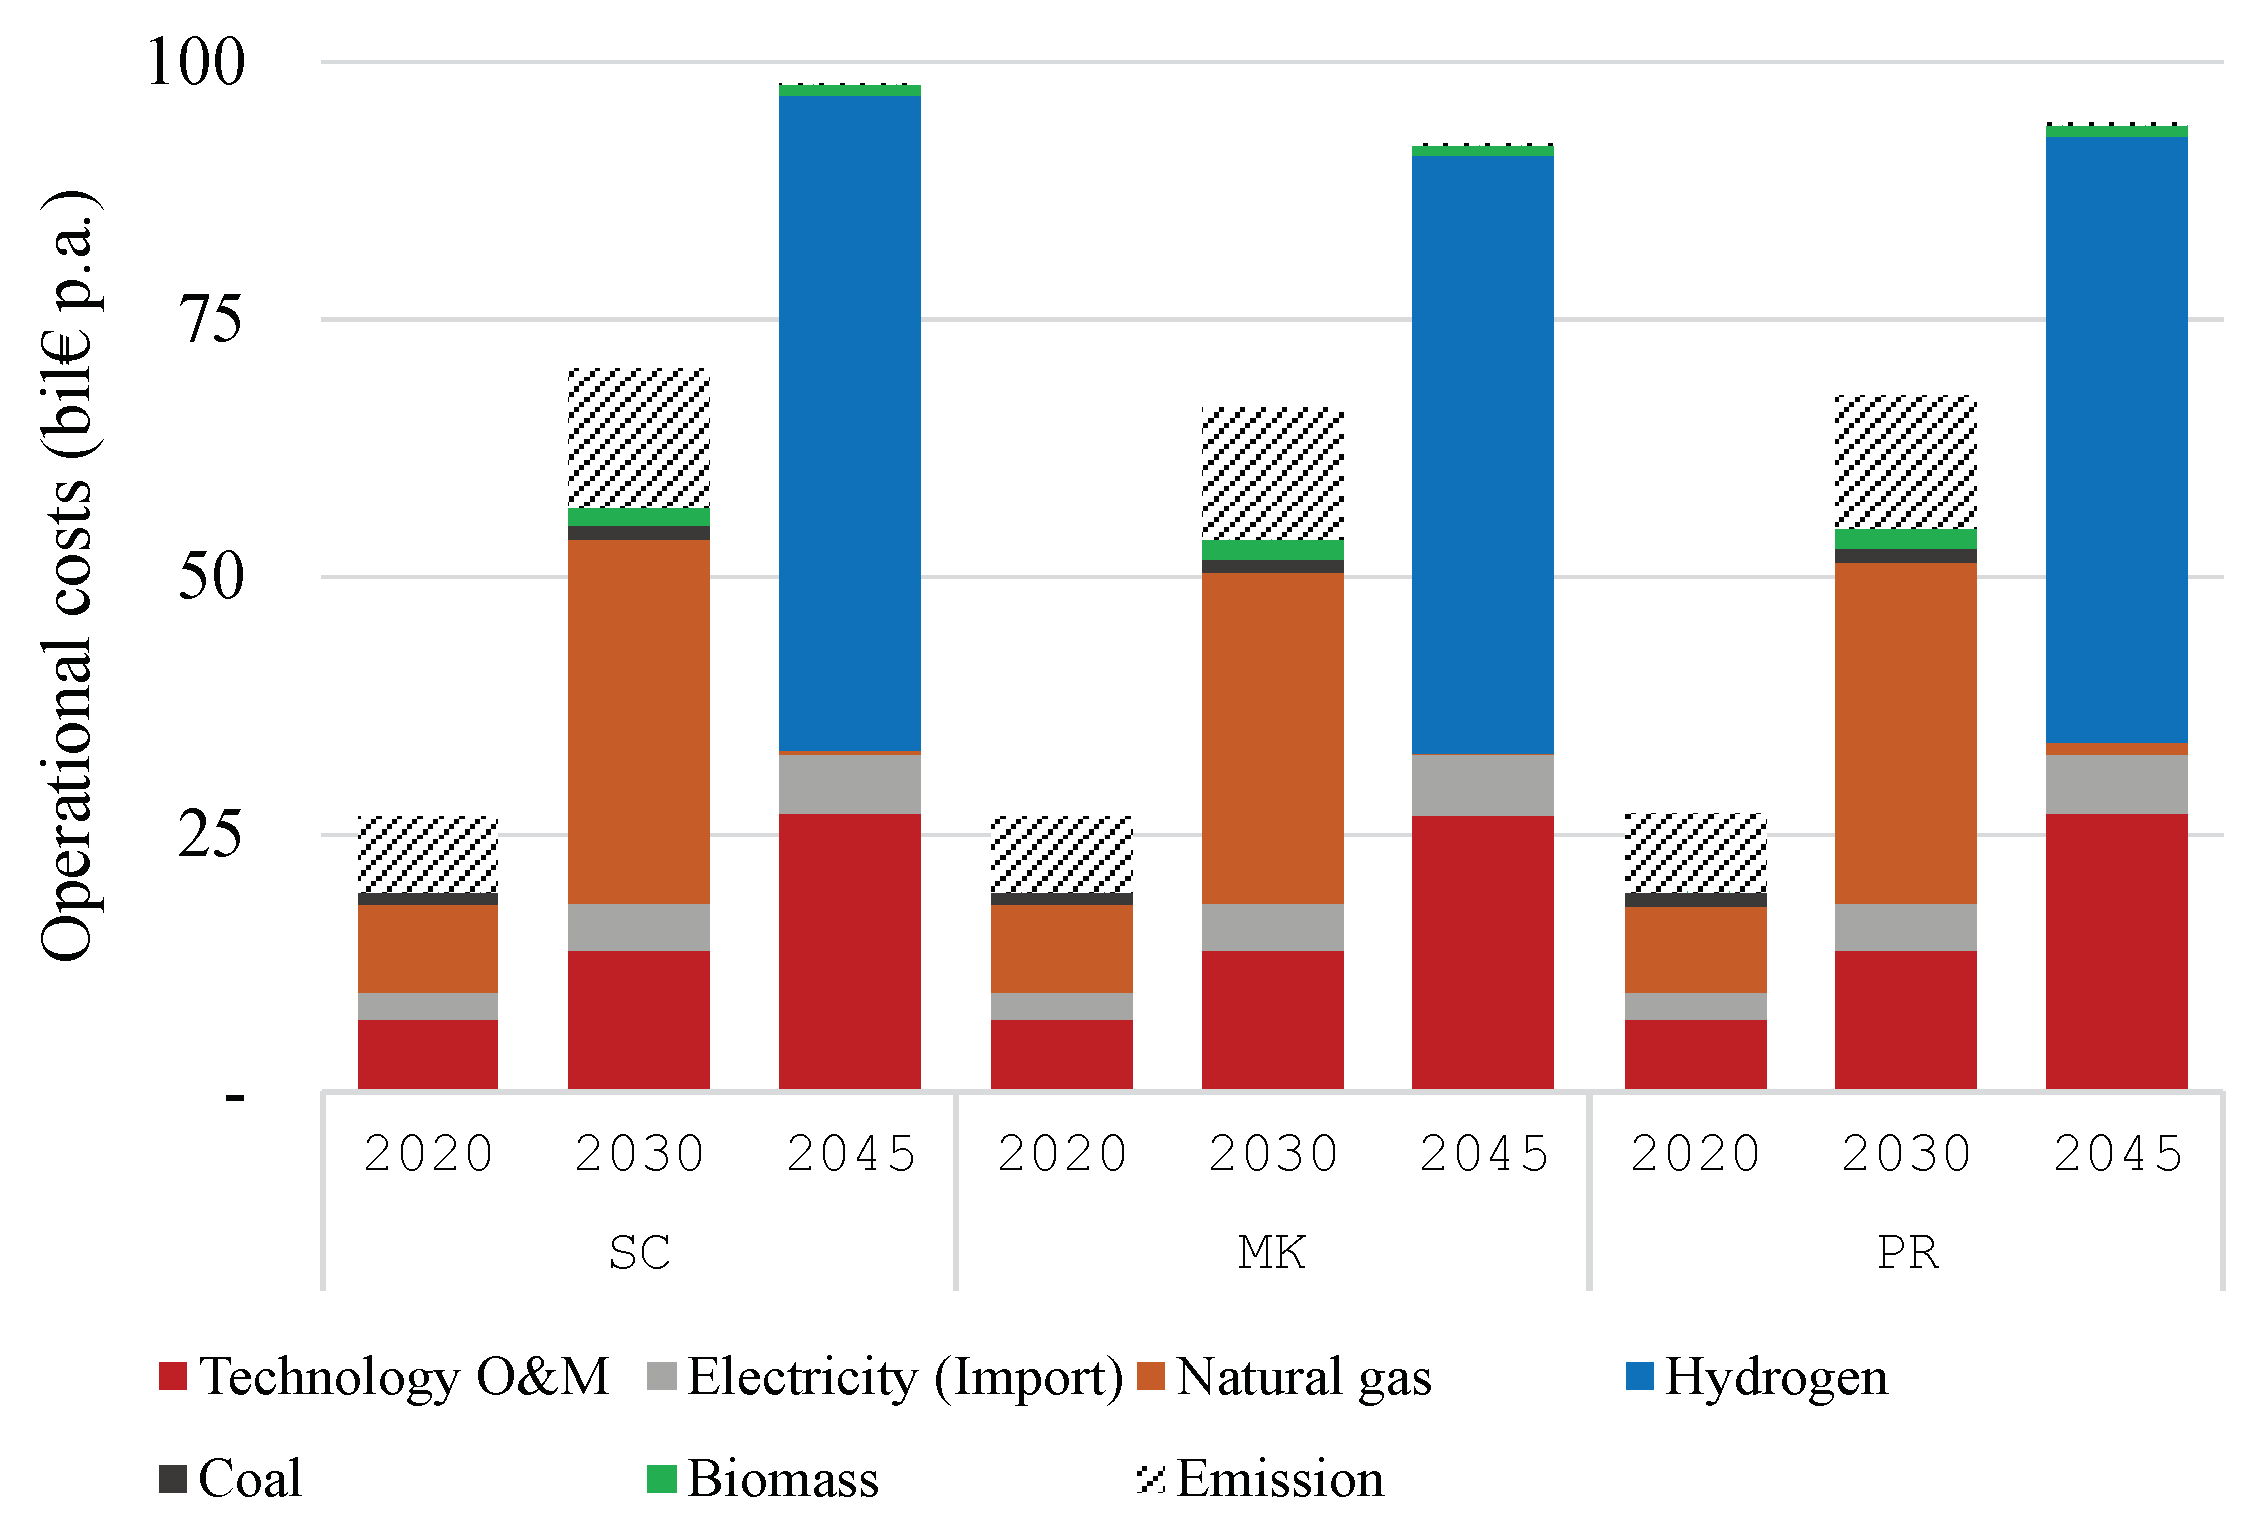
The annual operative (generation) costs are presented in
Figure 2 by scenarios. Across all scenarios, the total operative costs increase as time progresses. This is mainly due to the strong increase in electricity demand from the electrification of heating and transport end energy uses. In terms of the cost structure: the technologies’ operation and maintenance costs steadily increase. Fuel costs see a rapid jump between years because of the higher natural gas price and later the higher hydrogen price. The total operative costs in the
MK scenario are the lowest, and amount to € 91.9 billion p.a. in 2045. This is followed by € 94.1 and 97.8 billion in
PR and
SC, respectively. In other words, the costs in 2045 reduce by 6.1% when prosumer storage is utilizable by the system. In 2030, the cost reduction is slightly lower at 5.4%.
The scenario MK is also optimized completely without residential battery storage. The resulting generation costs are € 26.7, 68.4, and 98.0 billion p.a. in 2020, 2030, and 2045, respectively. That is, the presence of the battery storage can reduce the costs by 0.0, 2.9, and 6.2%, respectively, an increasing amount as the year progresses.
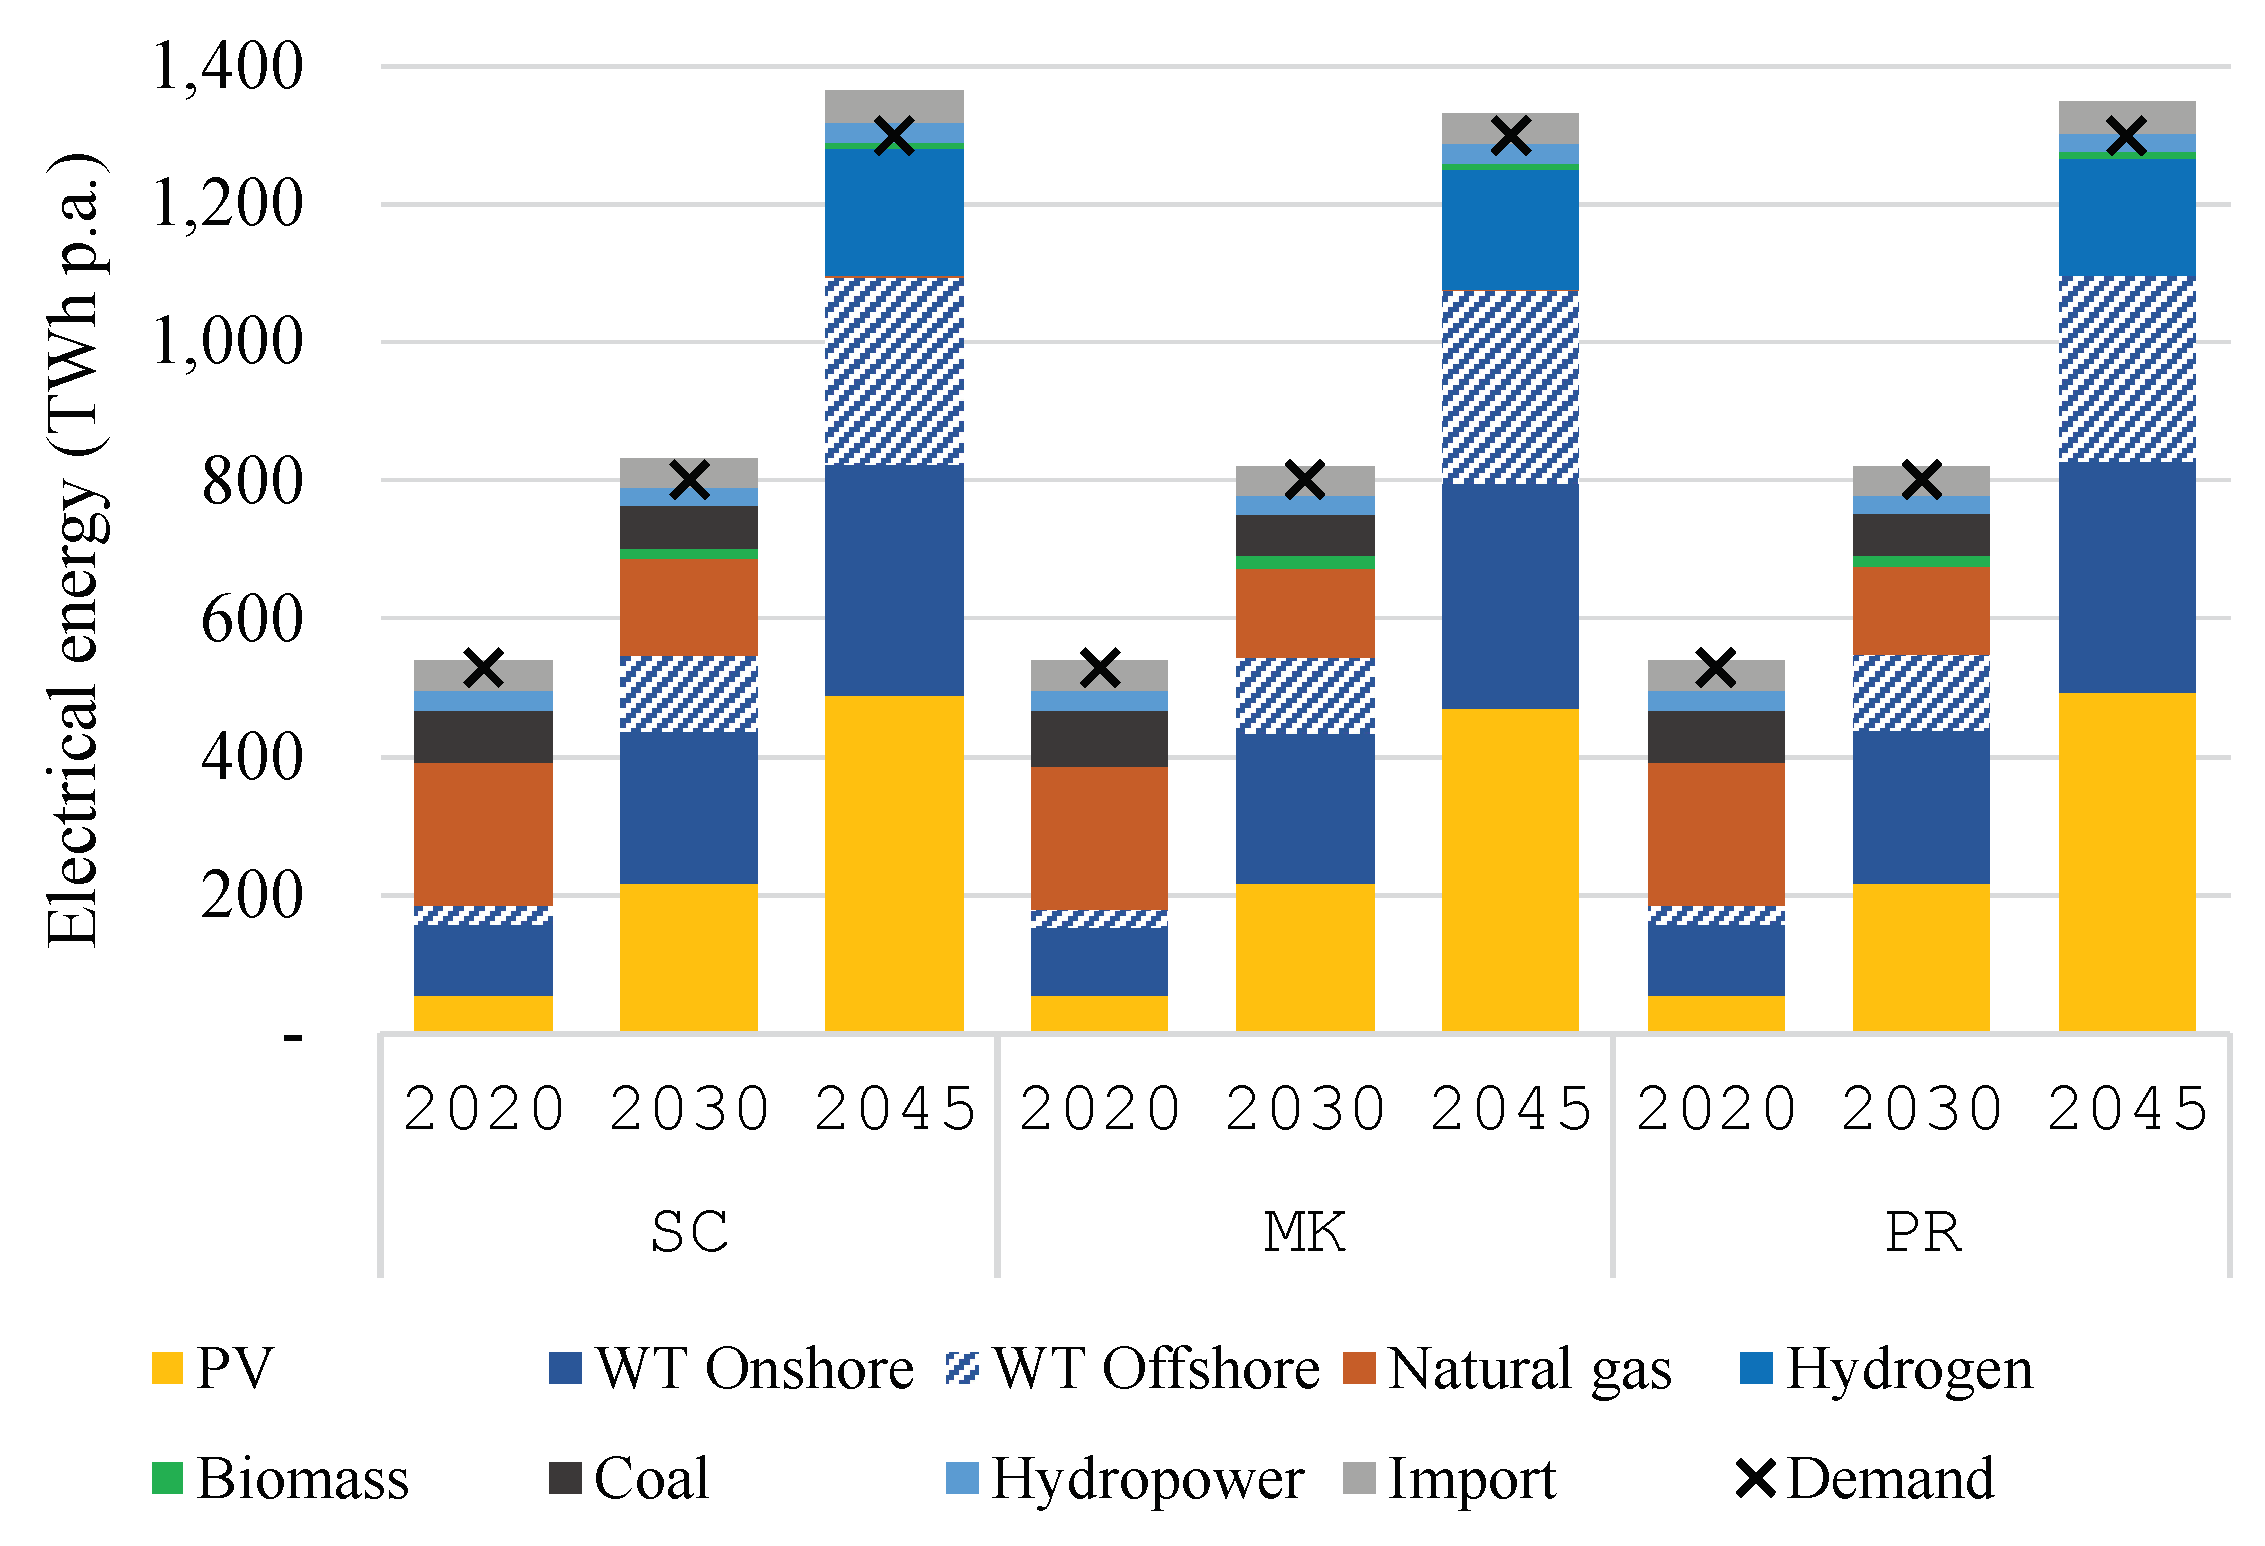
In
Figure 3, the volumes of electricity supply by sources and total demand are depicted. The share of variable renewable electricity generation (VRE) from solar and wind energy to the electricity demand increases from 34% in 2020 to 83% in 2045. That is, the electricity system strongly relies on VRE. The generation from coal-fired power plants stops after 2038, which is in line with the goal set by the federal government. Based on the assumed economic parameters, nuclear power plants were not dispatch. We deem this to be irrelevant, as the nuclear generation is planned to be phased out in the intermediate- and target- years, and as nuclear power plants would firmly serve the base load. Furthermore, the utilization of natural gas is phased out between 2030 to 2045 in order to decarbonize the system. Lastly, the electricity supply from biomass, hydropower, and the import from neighboring countries plays only a small part, less than 6%.
The difference in terms of energy supply between scenarios is small, and lies mostly on the utilization of gas- or hydrogen-fired power plants, which is complementary to the utilization of VRE. In 2045, the electricity production from hydrogen amounts to 172.1 in MK, 169.3 in PR, and 185.6 TWh p.a. in SC. That is, when prosumer storage is strictly reserved for PV self-consumption, the generation from peak power plants increases by 7.0% compared to MK. However, the level of peak generation in both scenario is similar.
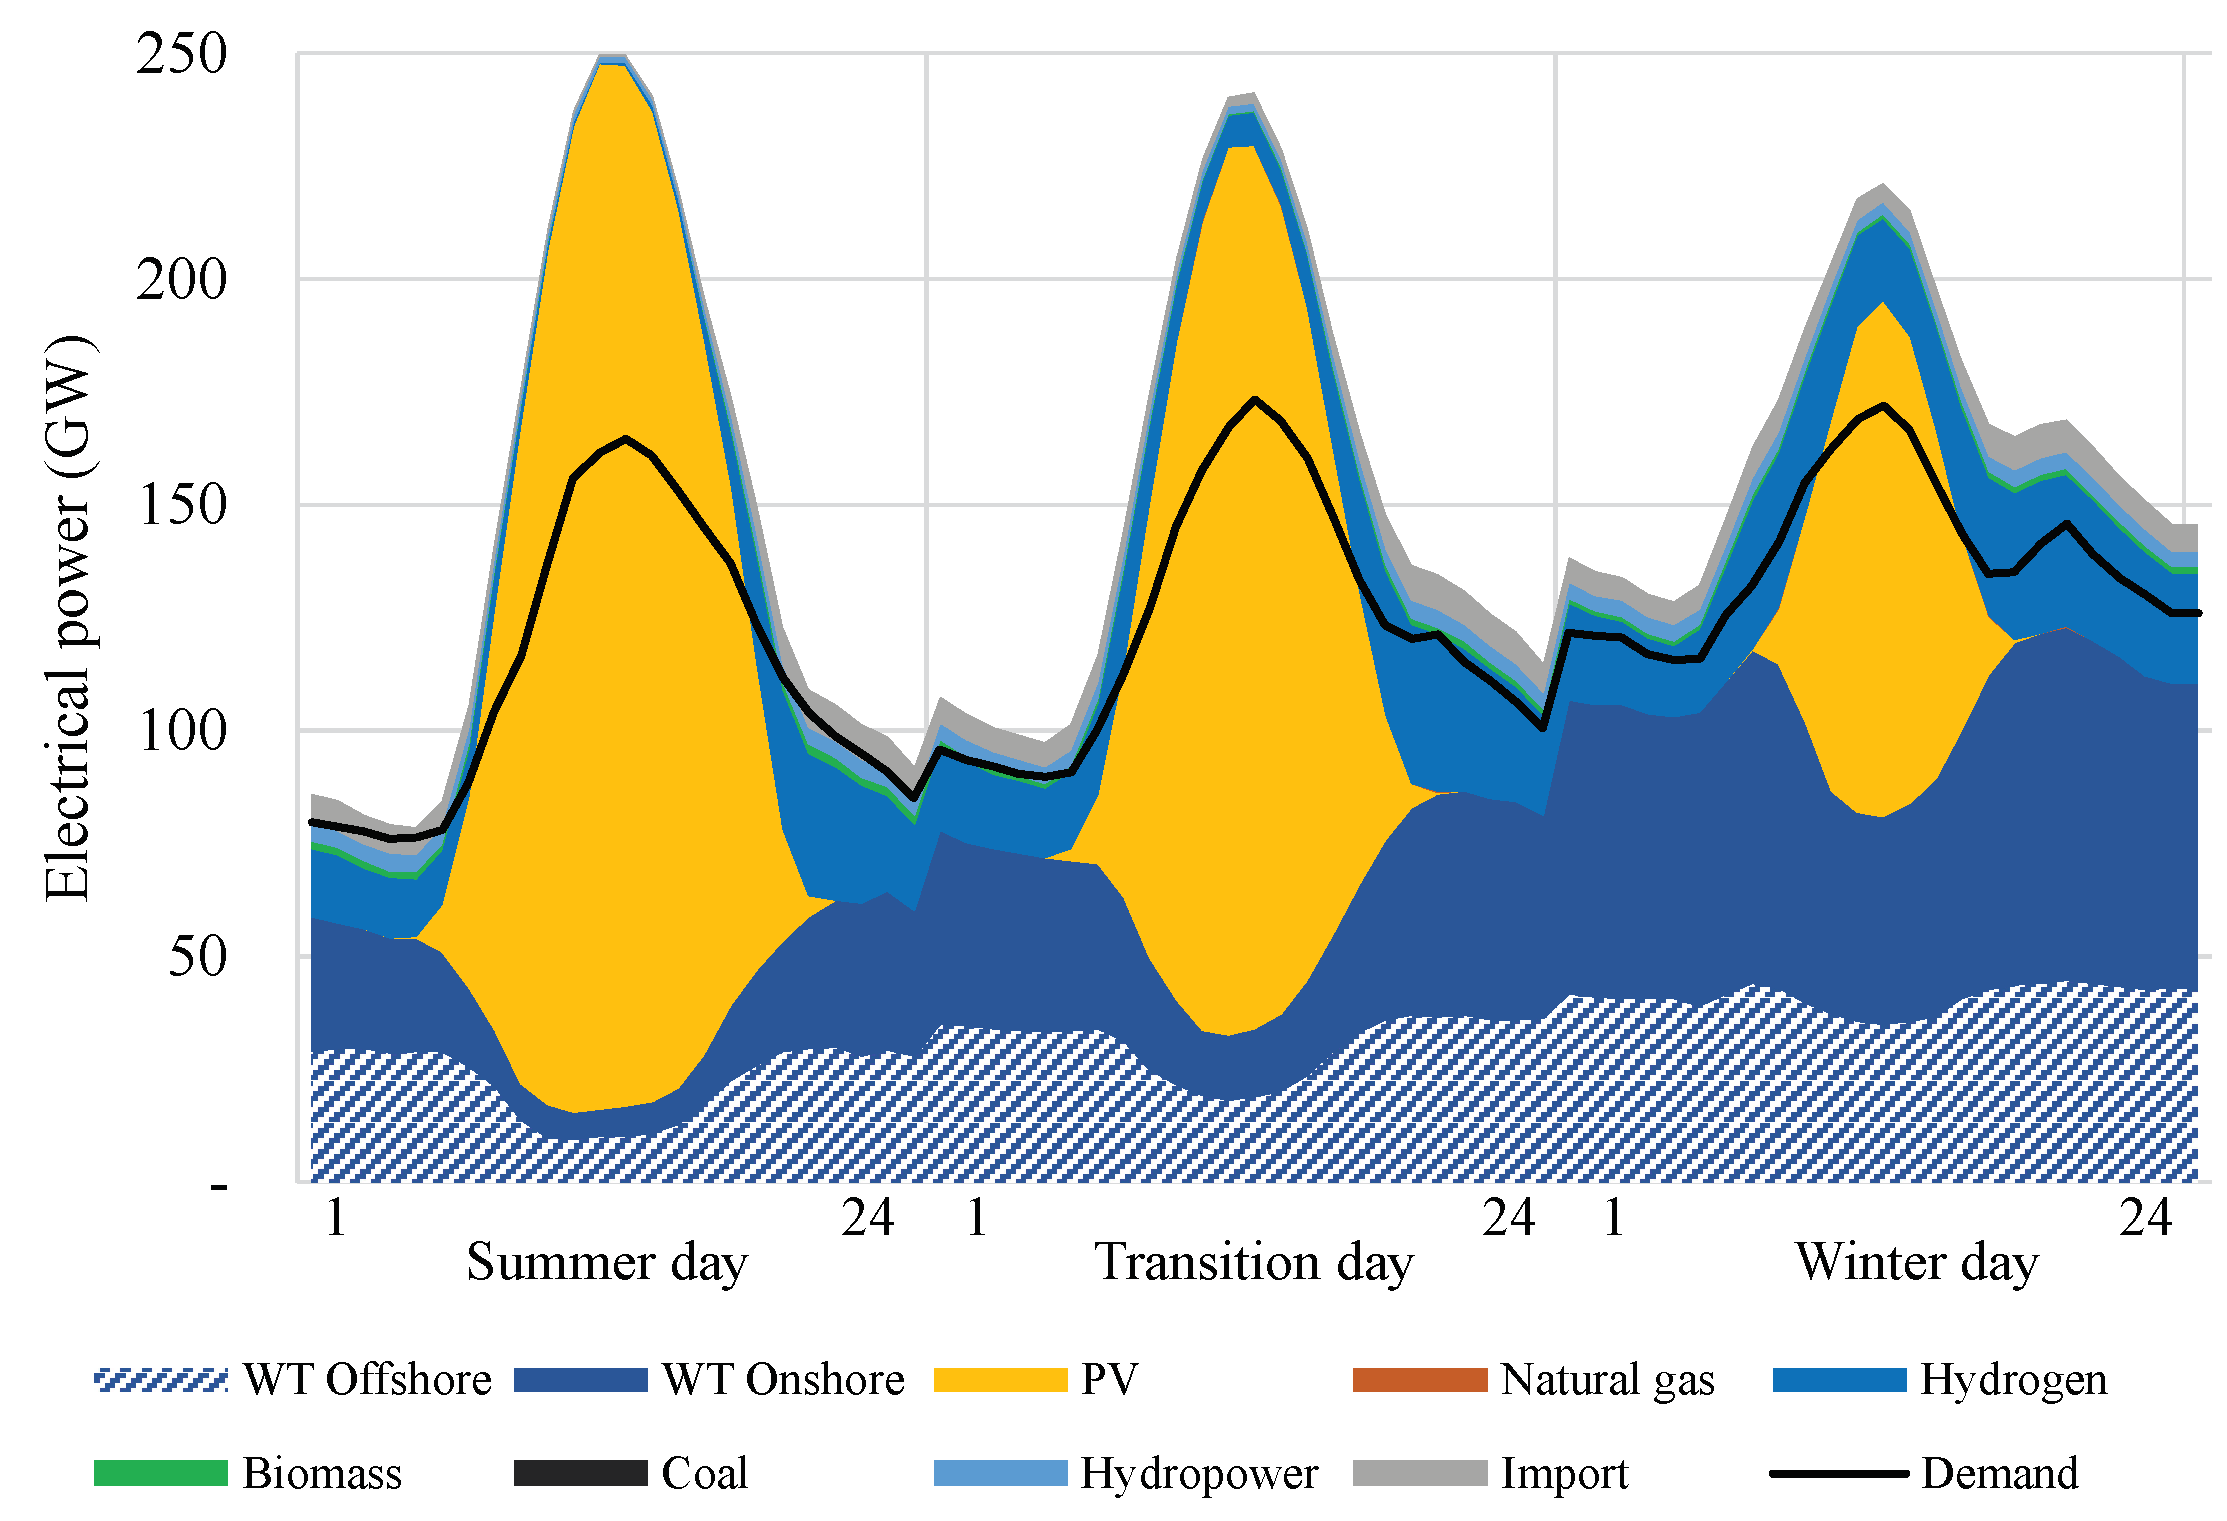
Regarding the operation,
Figure 4 presents the electricity supply of representative days in summer, transition, and winter periods of the scenario
MK-2045. The generation from offshore wind turbines is relatively constant throughout the day, whereas the generation from onshore wind turbines is strong during the night time. Generation from wind energy is at its highest during winter; this complements the generation from solar energy on the seasonal timescale. The electricity demand profile in 2045 is characterized by a large midday peak. This is due to the assumption that the electricity consumption from sector-coupling processes is partly flexible. The supply-demand gap is mainly bridged by hydrogen-fired power plants, and to some extent, by cross-border import.
The following presents results on the operation of energy storage.
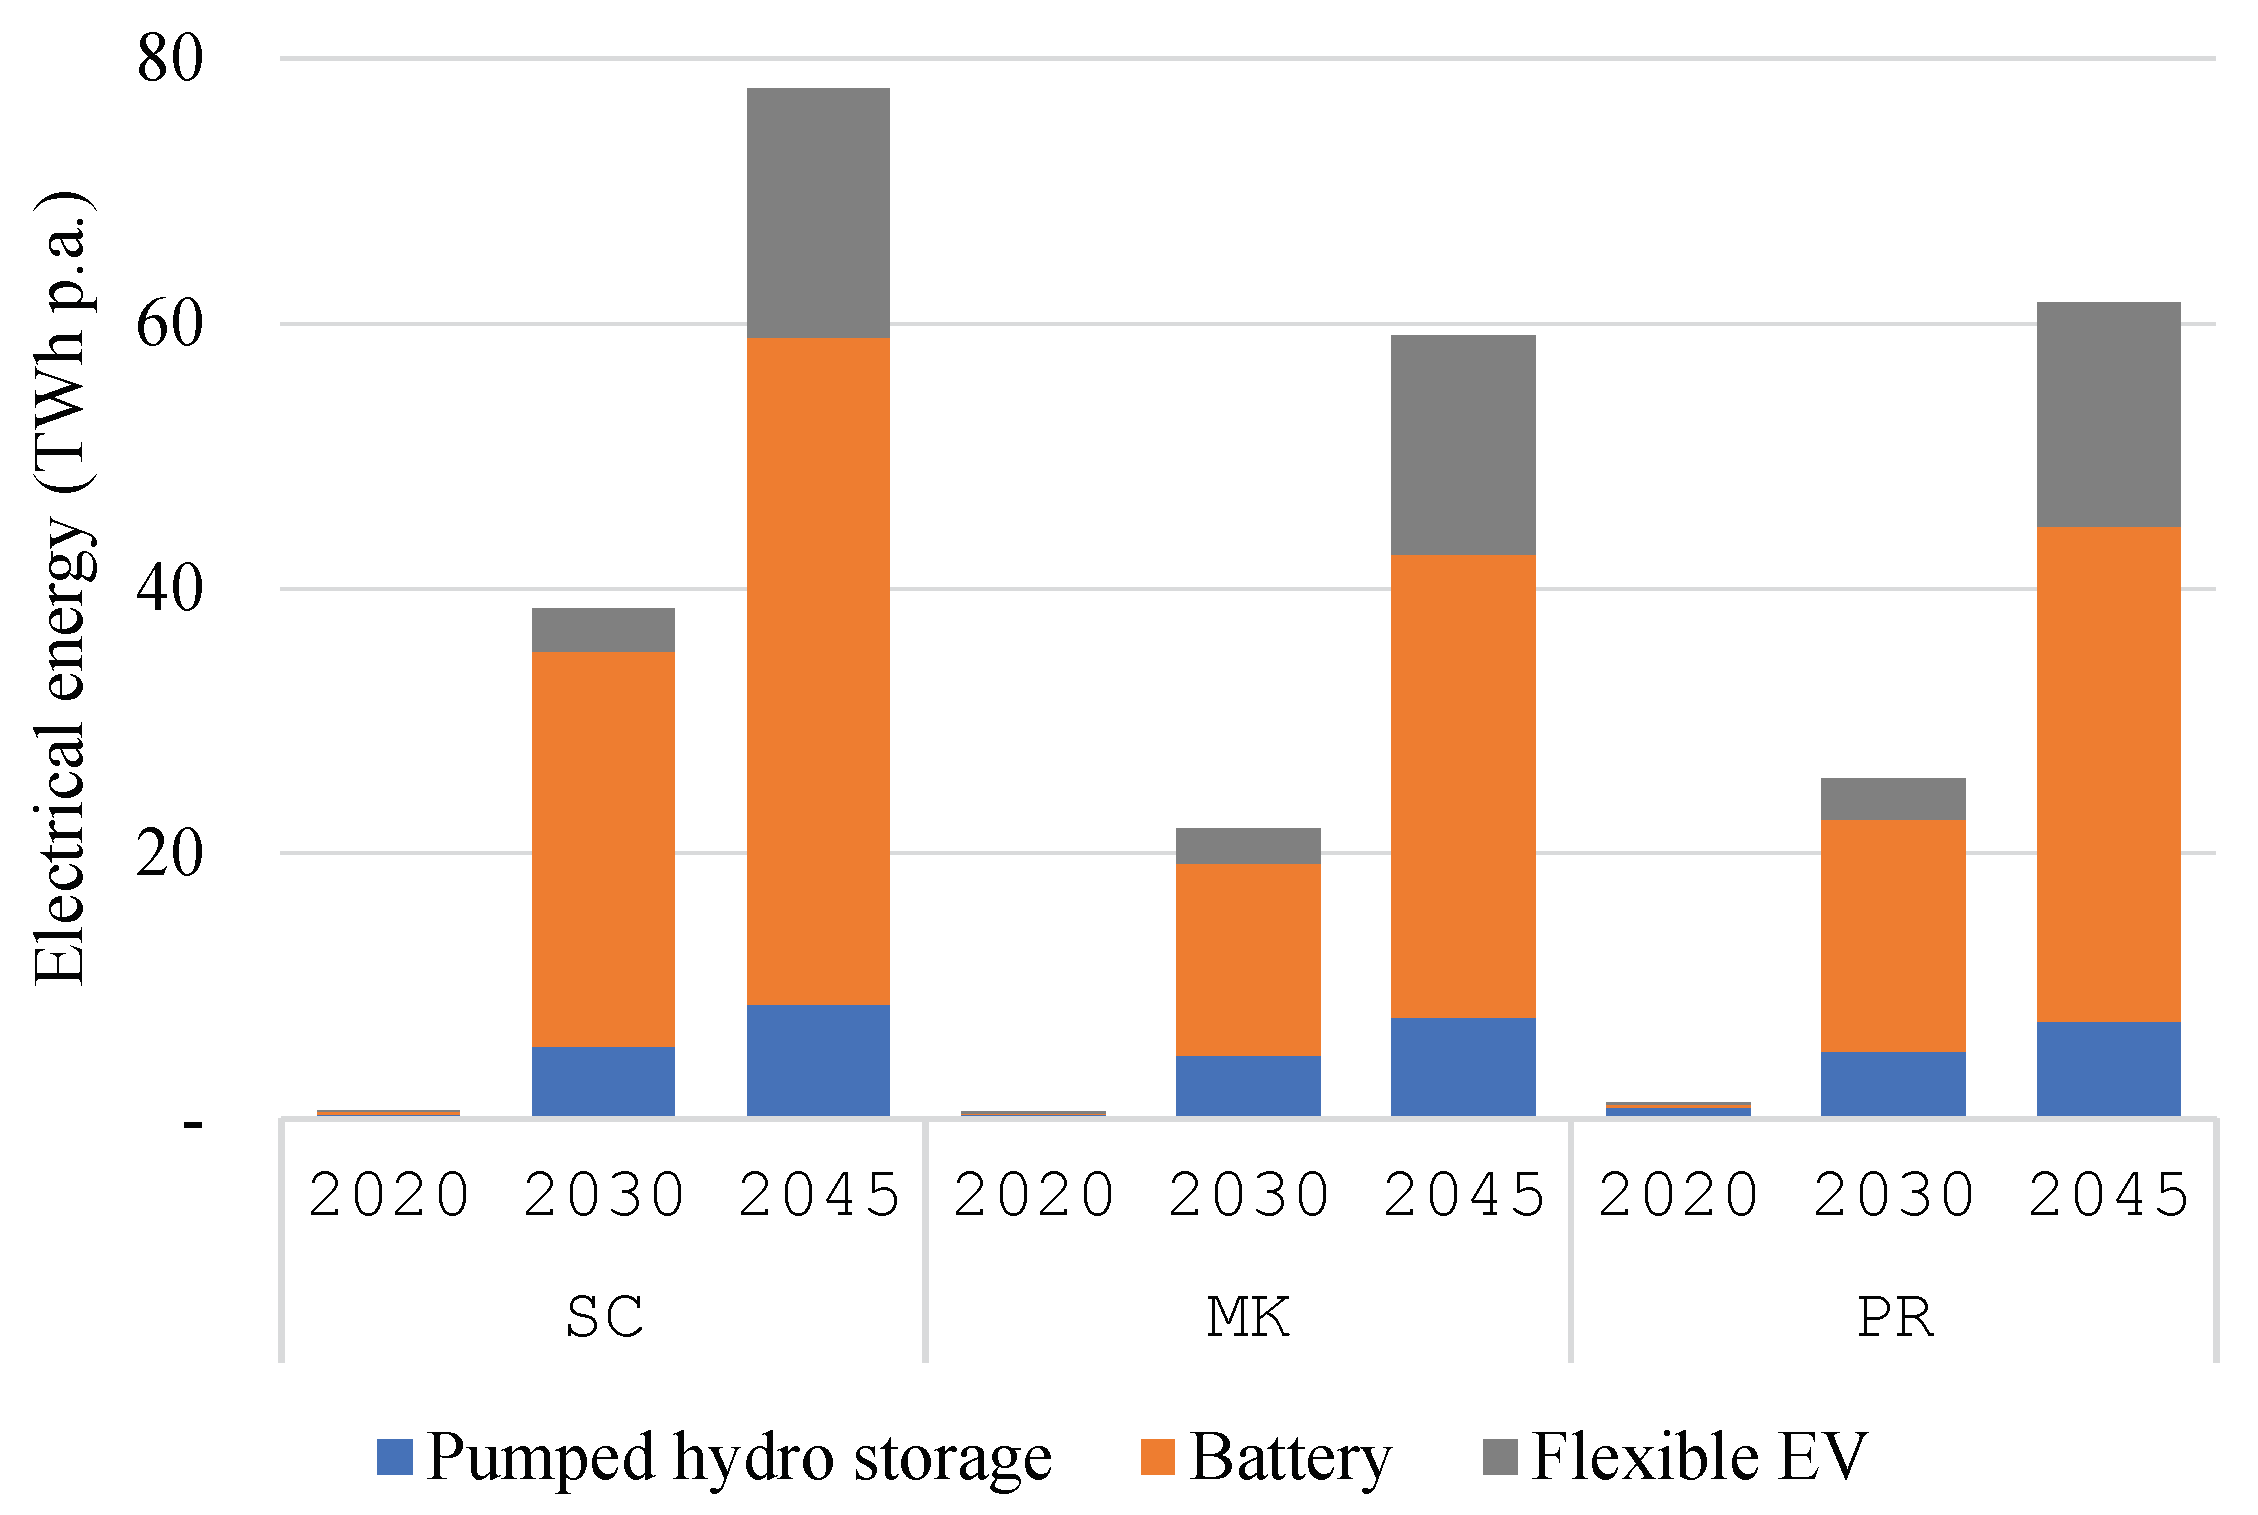
Figure 5 plot the utilization of pumped hydro storage, residential battery storage, and the management of flexible EV demand. The higher supply volatility and installed capacities on a year-on-year basis leads to the increase in flexibility utilization. Overall, the usage is lower in
MK compared to other scenarios; this is due to the averaging effect from the single market zone assumption. The additional objective to reduce the regional power peak in
PR incentives further storage utilization despite the additional costs related to energy losses. Lastly, this line of reasoning also explains the highest utilization rate in
SC, where the additional constraint forces residential battery storage to solely react to regional PV generation and demand profiles. Lastly, while being unaffected by the additional constraint, the utilization of pumped hydro storage and flexible EV in
SC is slightly higher.
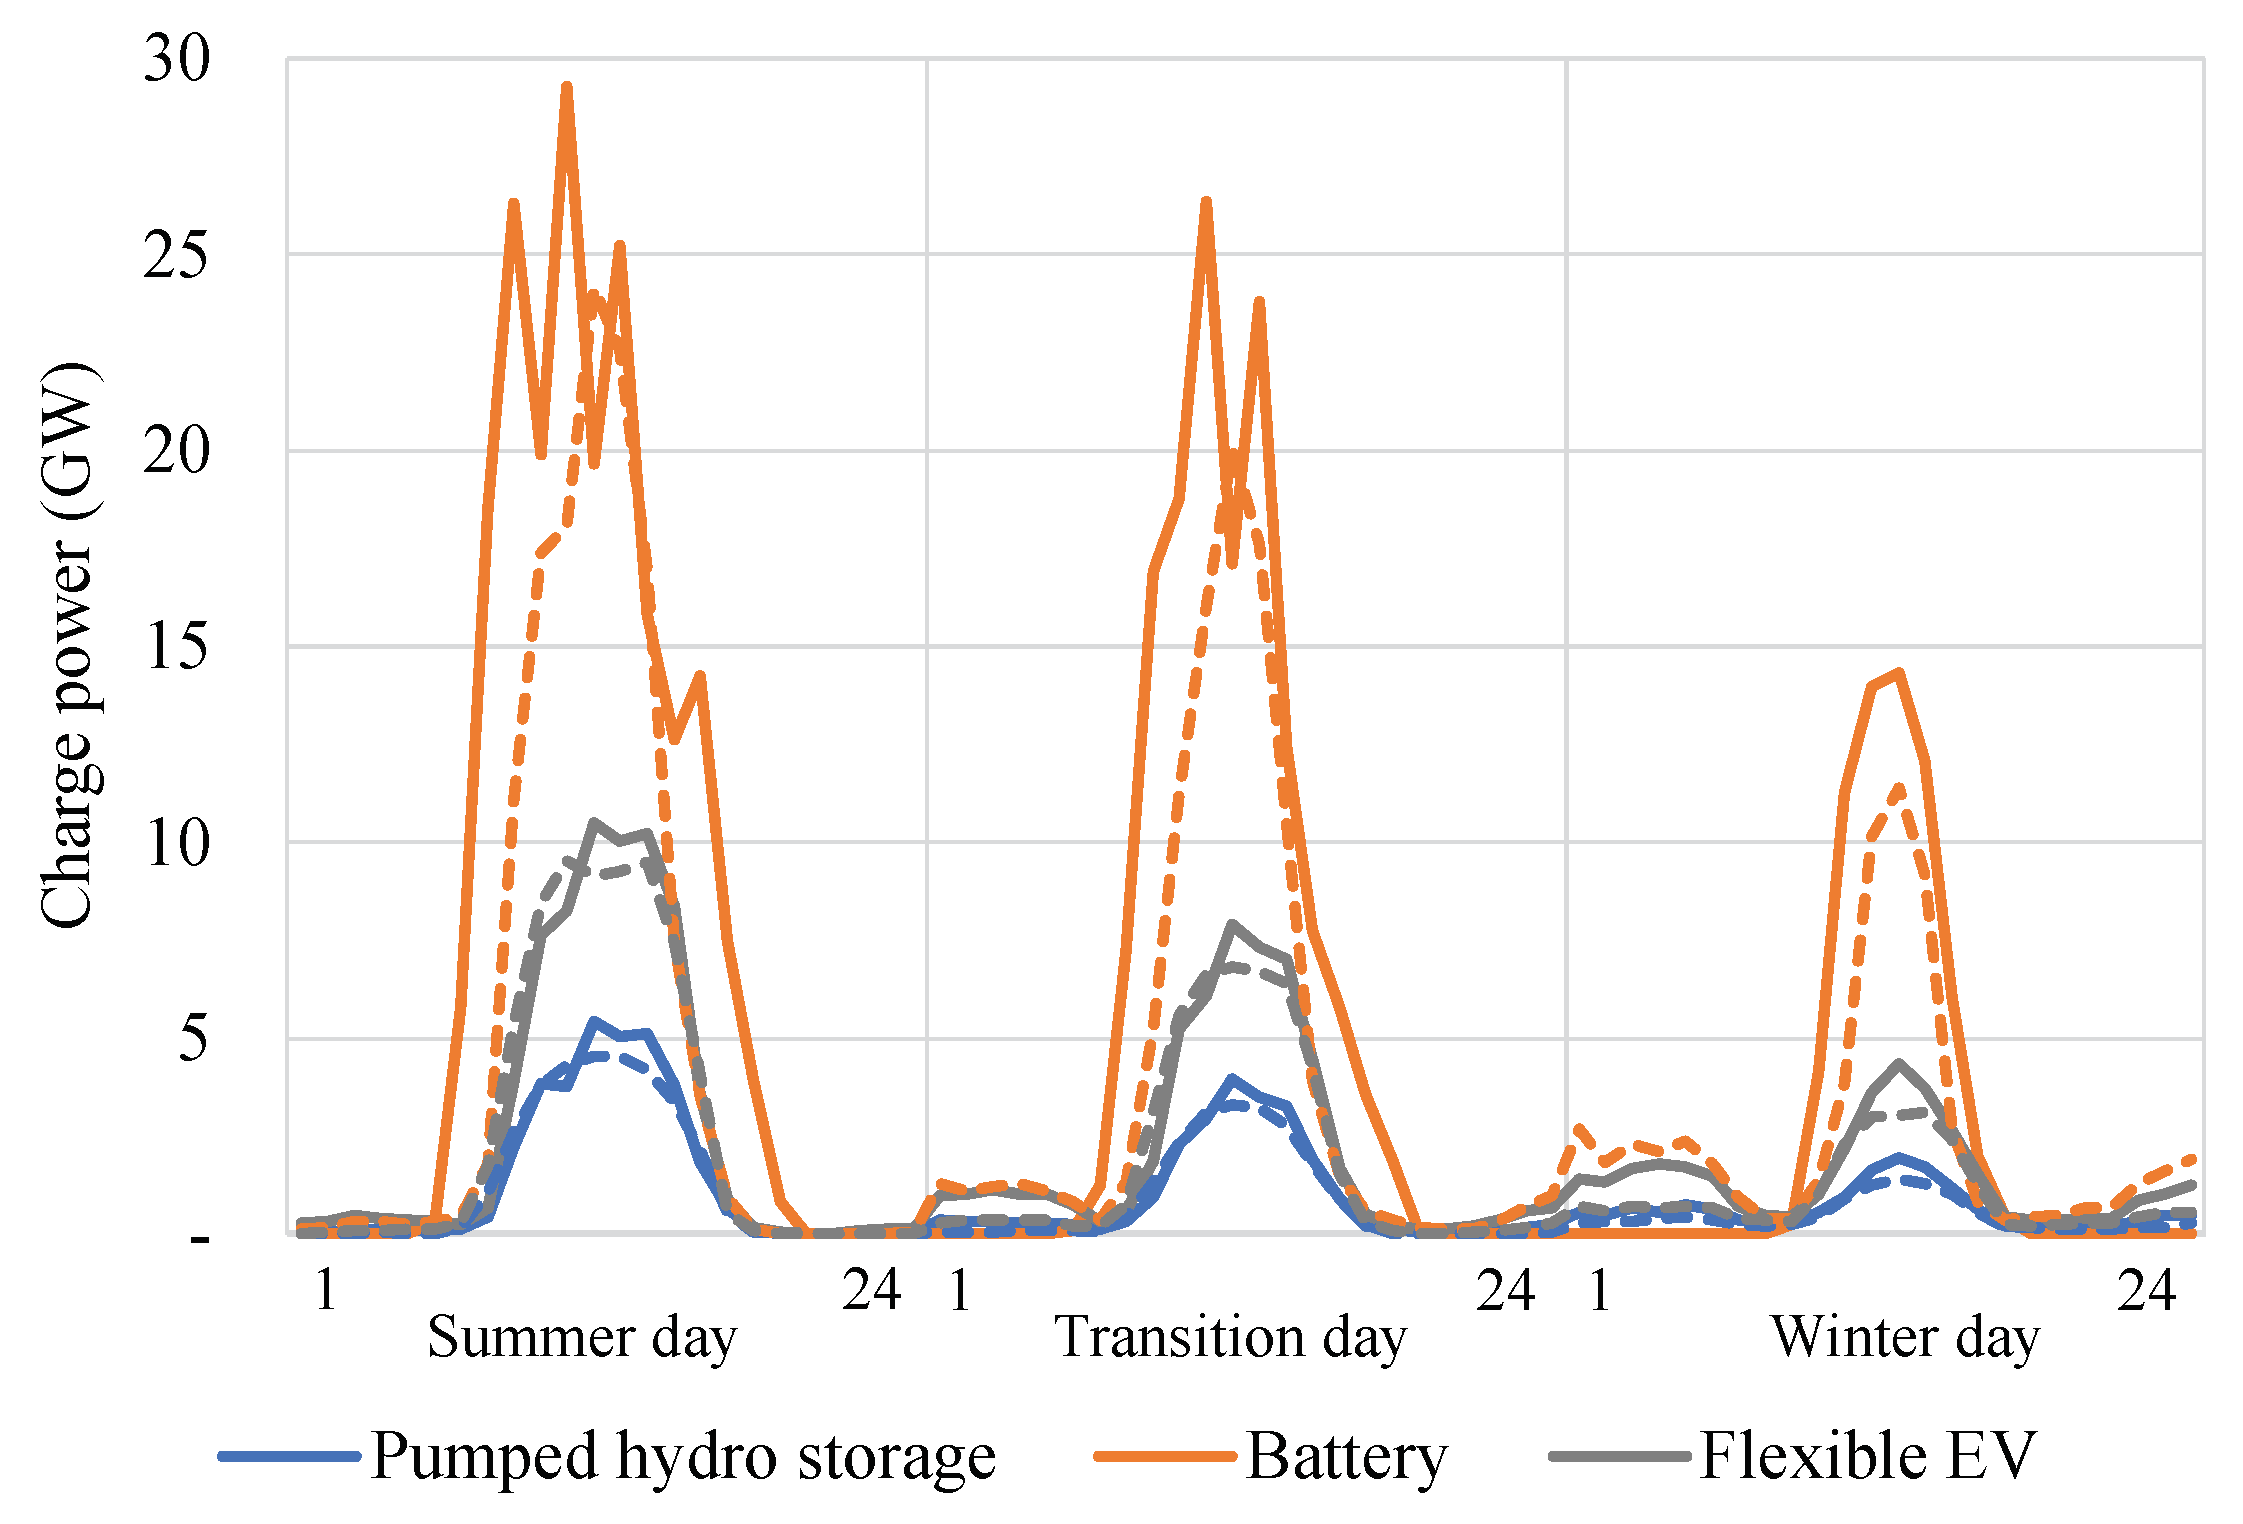
Figure 6 compares the operation profiles between the self-consumption (thick lines) and market-oriented (dashed lines) scenarios. In the former, residential battery storage is used to store surplus PV generation within respective regions, whereas in the latter, it is used in response to any surplus. This is observed by two charging periods, at night and during midday. In
SC, both the flexible EV and pumped hydro storage are utilized more, especially at night in winter, to compensate for the unavailability of residential battery storage to react to a system-oriented signal.
4.2. Regional Withdrawal Load and Self-Sufficiency
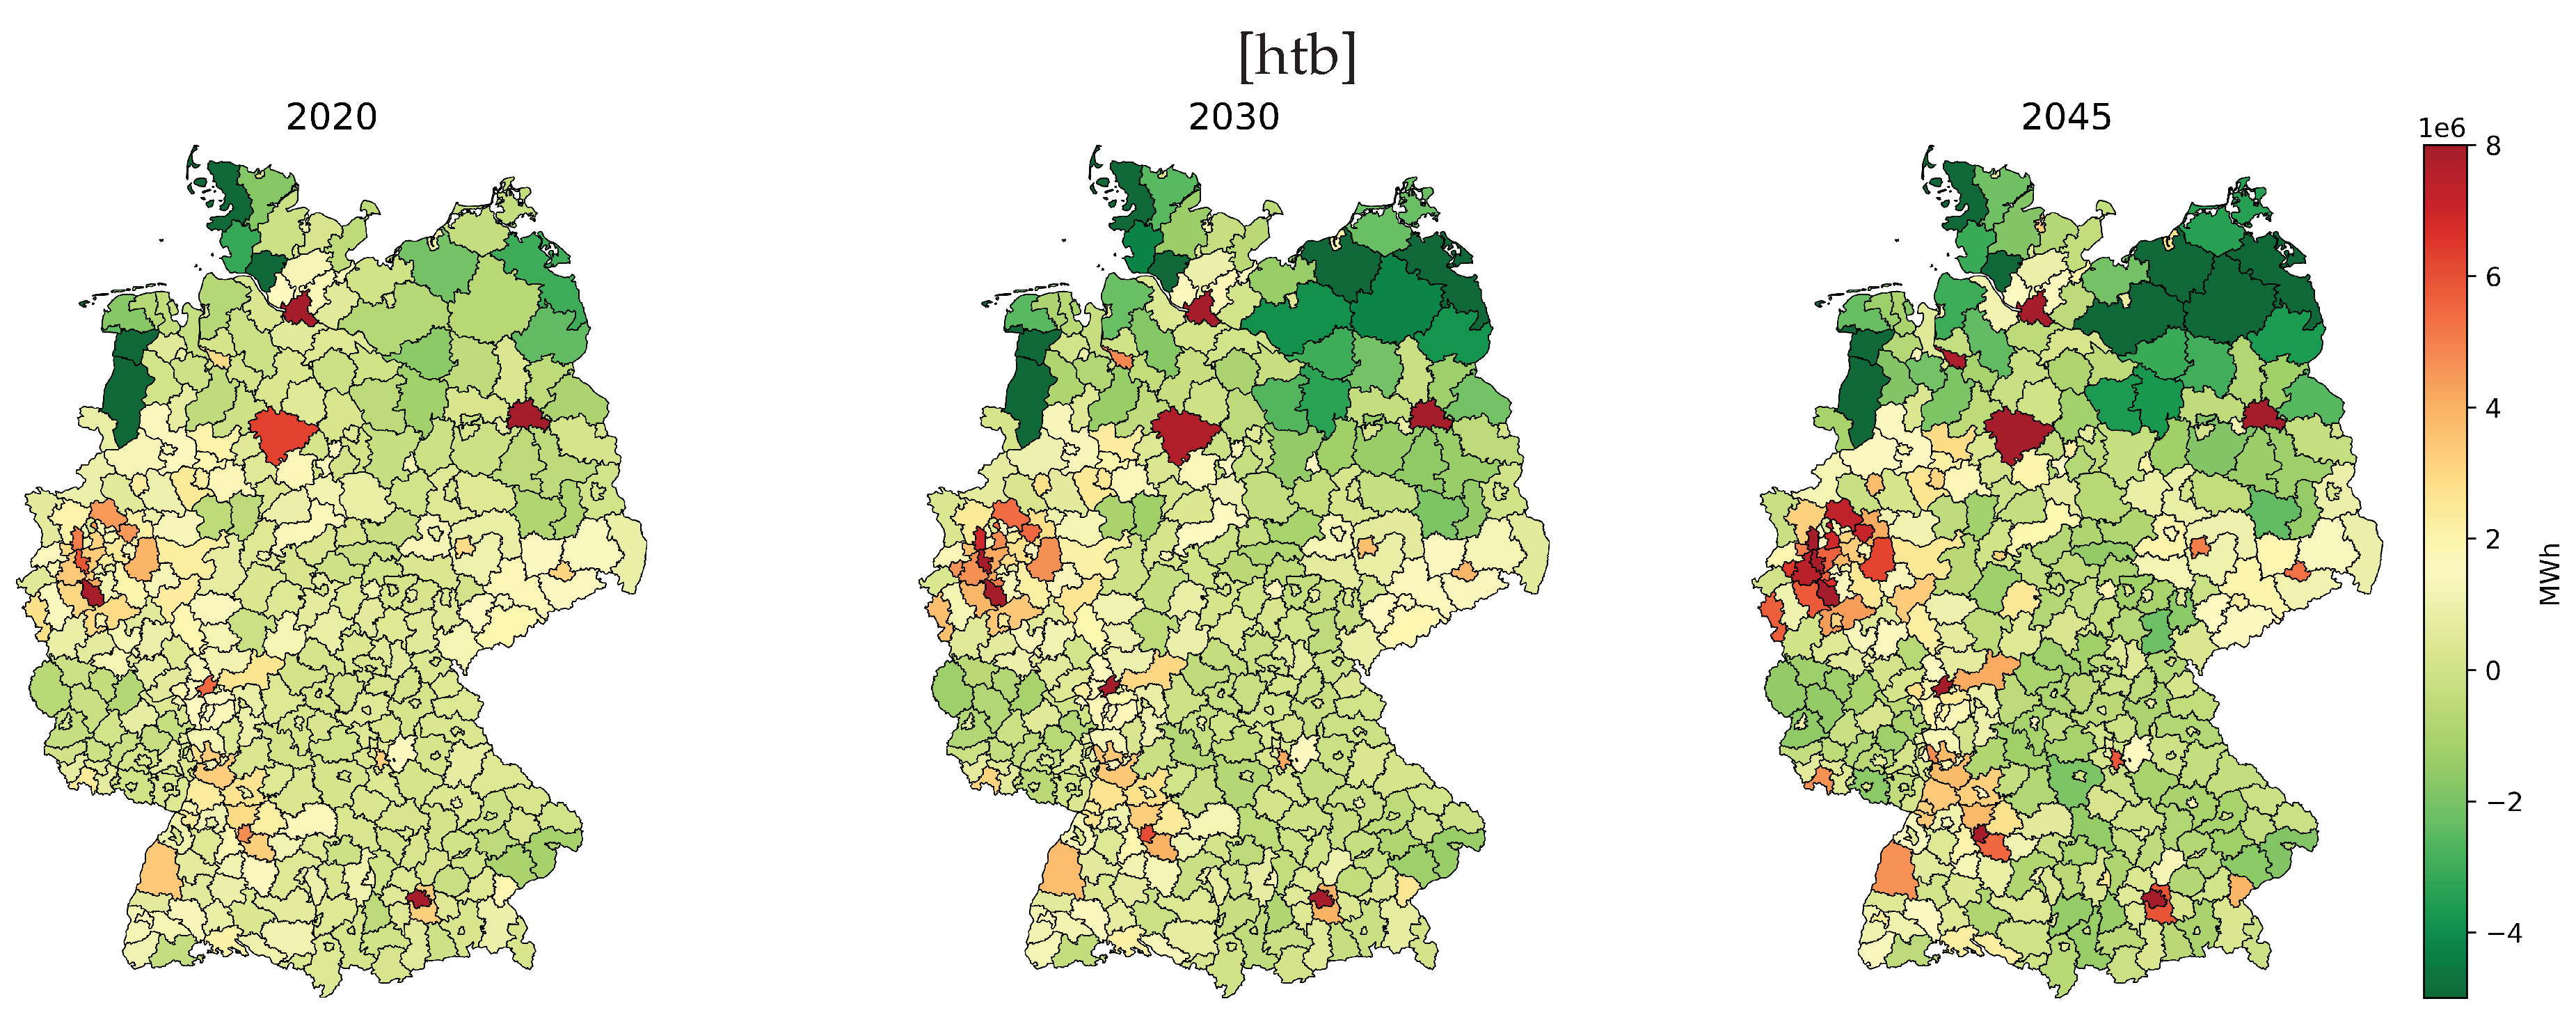
Figure 7 plots the balanced residual load
3 of all NUTS-3 regions in Germany for the years 2020, 2030, and 2045. There are notable differences in the coverage of the electricity demand in the various regions, particularly, between load centers, and between northern region and the rest of the country.
In 2020, only 67 regions were able to cover their total electricity demand from renewable energy generation. The federal states of Lower Saxony, Mecklenburg-Western Pomerania, and Schleswig-Holstein account for 59% of the electricity surplus from these 67 regions, which is from their superior wind generation potentials.
It can also be seen that conurbations such as Hamburg, Munich and Berlin have a high positive residual load, which indicates that the electricity demand is higher then the supply. This is based on the low availability of potential areas for wind and ground-mounted PV systems. Another contribution to the high residual load is the concentrated energy demand from the household, industrial, and commercial sectors. Even if all potentials for rooftop PV systems in the major cities are exploited from 2030 onwards, positive residual loads is to be expected due to the sharp rise in electricity demand in the household and transport sectors.
From a year-on-year comparison, the number of regions with generation surplus is increasing. Negative residual load is expected in 136 regions in 2030 and 161 regions in 2045. The number of federal states with a balanced electricity surplus is also increasing. On the federal state level, Brandenburg, Mecklenburg-Western Pomerania, Lower Saxony, Rhineland-Palatinate, Saxony, Saxony-Anhalt, and Thuringia will have a negative residual load balance in 2045, i.e., these states are expected to be a net exporter of renewable energy generation.
The balanced difference in residual load from 2020 to 2045 for Bavaria is halved, if the available potential for variable renewable energy (VRE) is used in the same proportion as in the other federal states. In contrast, the difference in residual load increases from 2020 to 2045 for Baden-Württemberg (+13%), Hessen (+34%), Nordrhein-Westfalen (+56%), and Saarland (+20%). Although an even penetration of the available VRE potential was assumed, the balanced electricity gap of the residual load cannot be closed completely. It can be deduced that these states must make greater efforts to utilize their available VRE potentials or promote energy efficiency, if the aim is to be less dependent on other federal states.
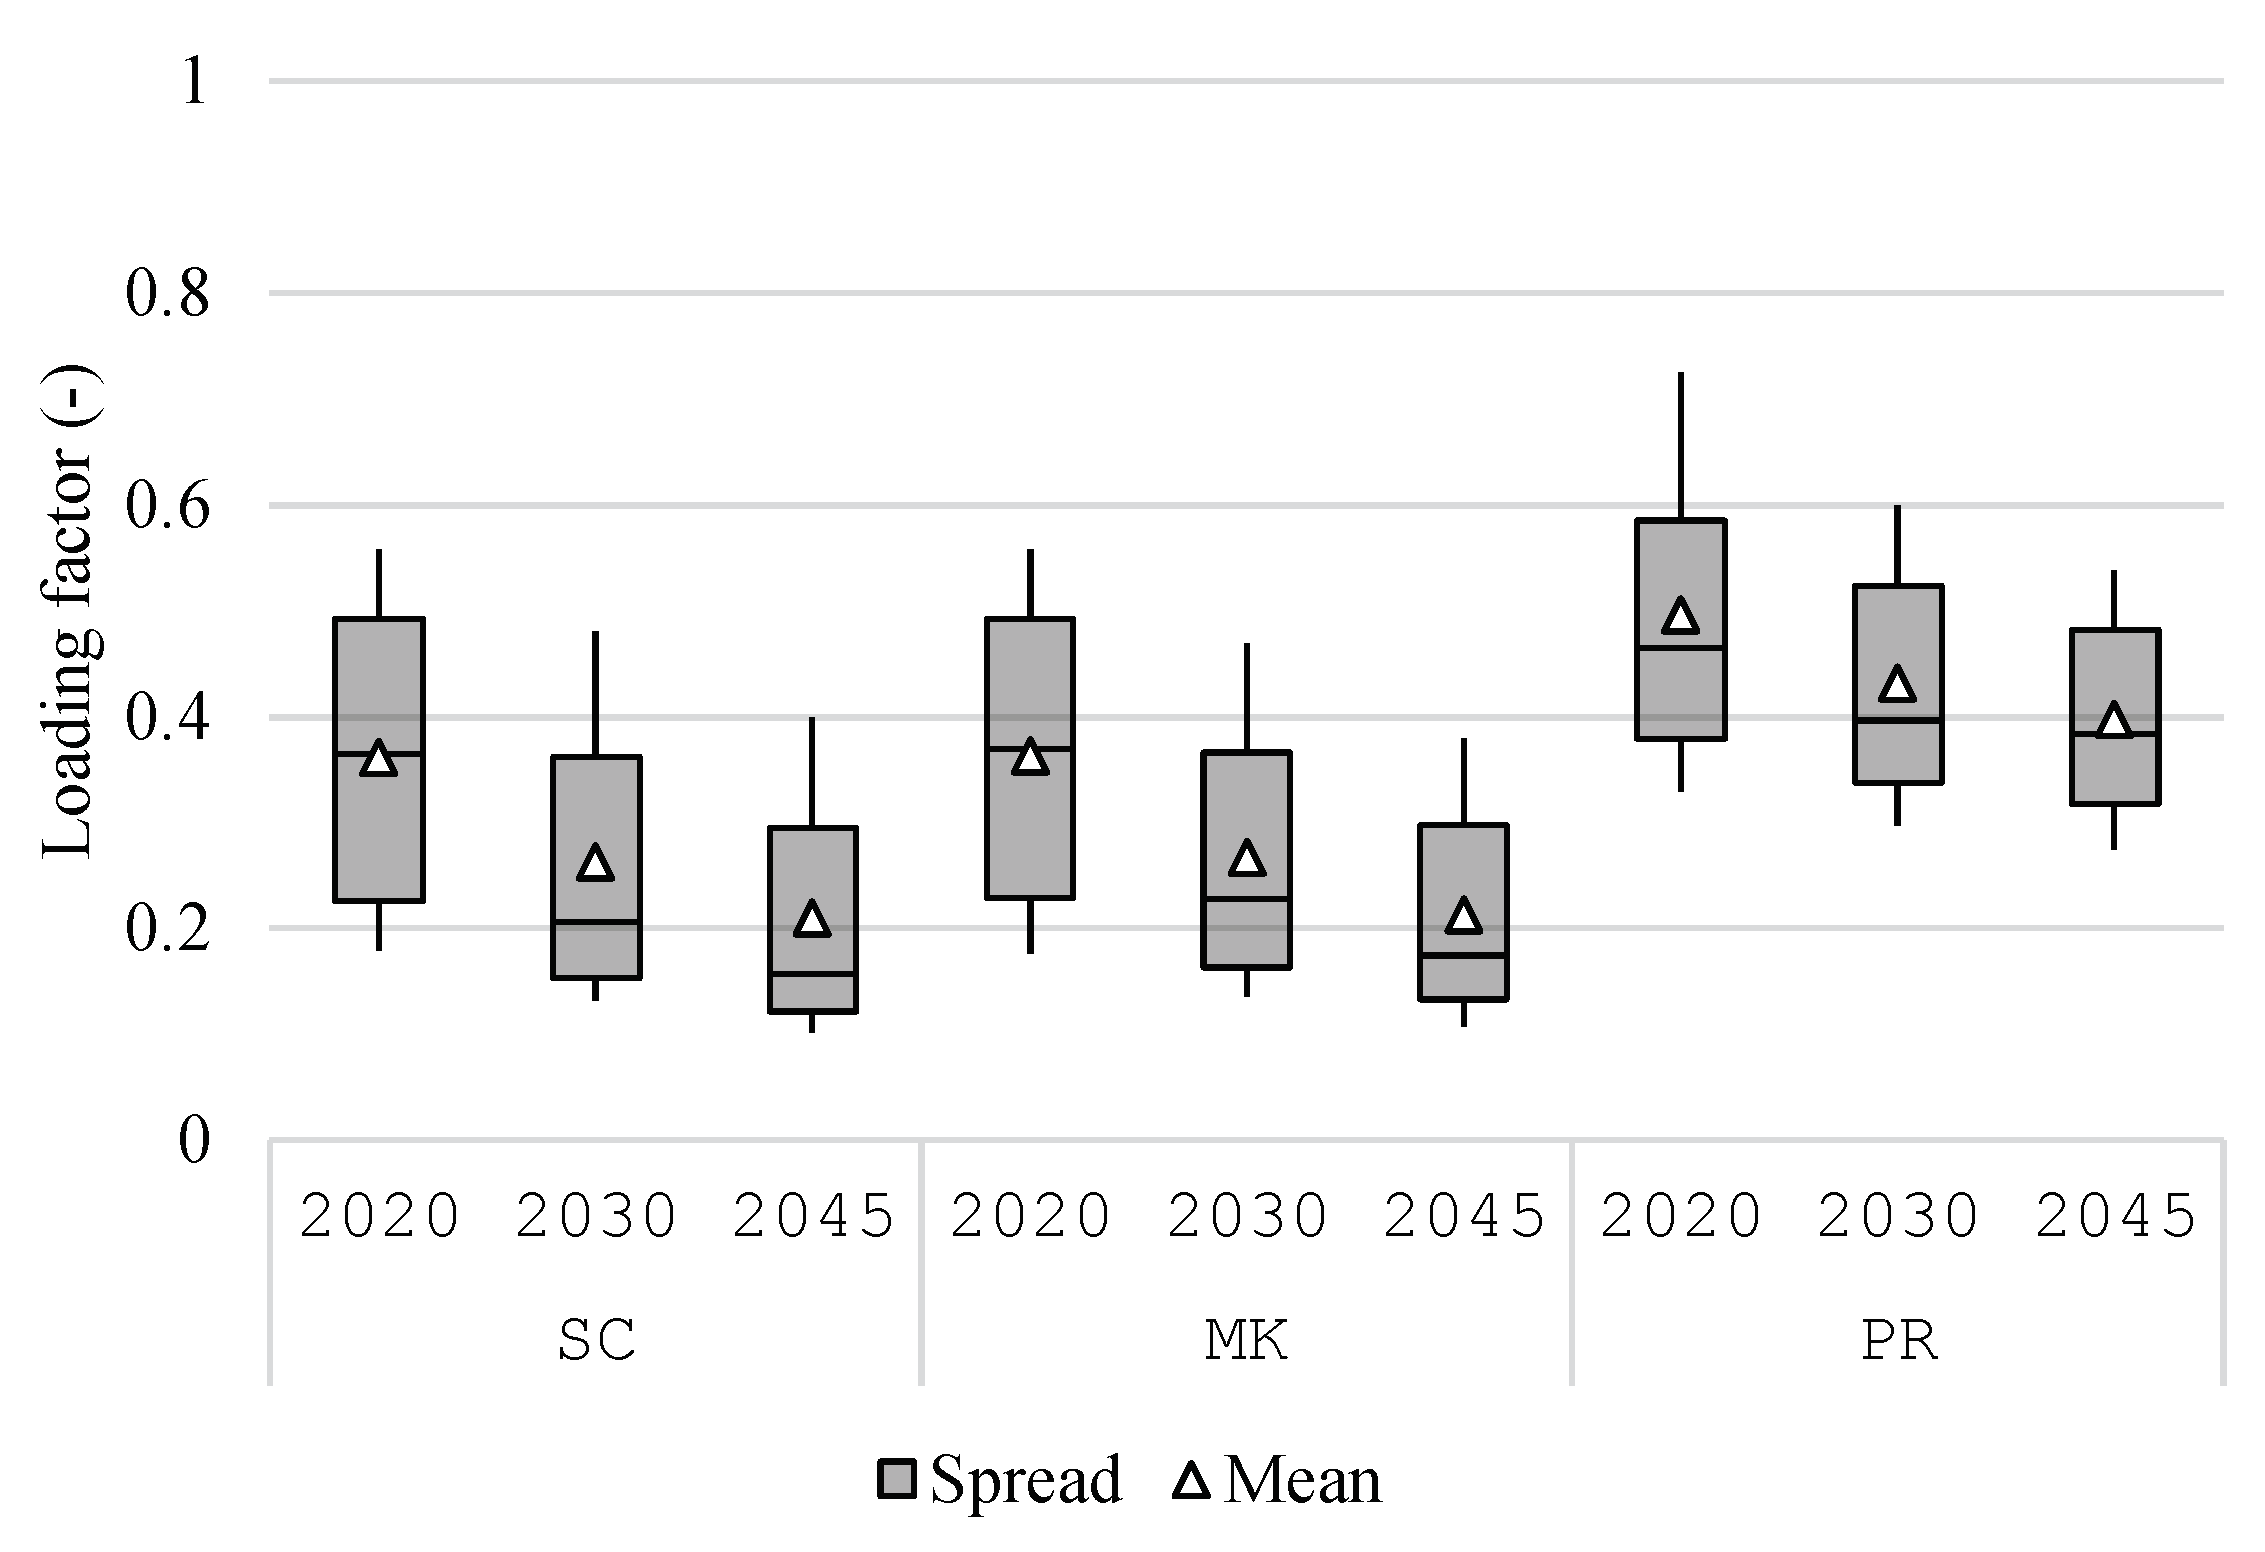
Figure 8 plots the distribution of loading factor, which is defined as the mean-to-max ratio of the absolute withdrawal load for respective regions over the year. A high value indicates a flattened withdrawal load profile, and with it, a high loading factor of main transformers. The loading factors decrease as the year progresses due to the higher regional variable renewable energy generation. The difference between 2045 and 2020 in the
MK scenario is approx. 17% points. Moreover, the effect of the peak reduction from the introduced penalty can be observed, i.e., the loading factor in the
PR scenario is higher than other scenarios, especially in 2045. The penalty also closes the difference between 2045 and 2020.
Regarding the overall self-sufficiency on the regional level,
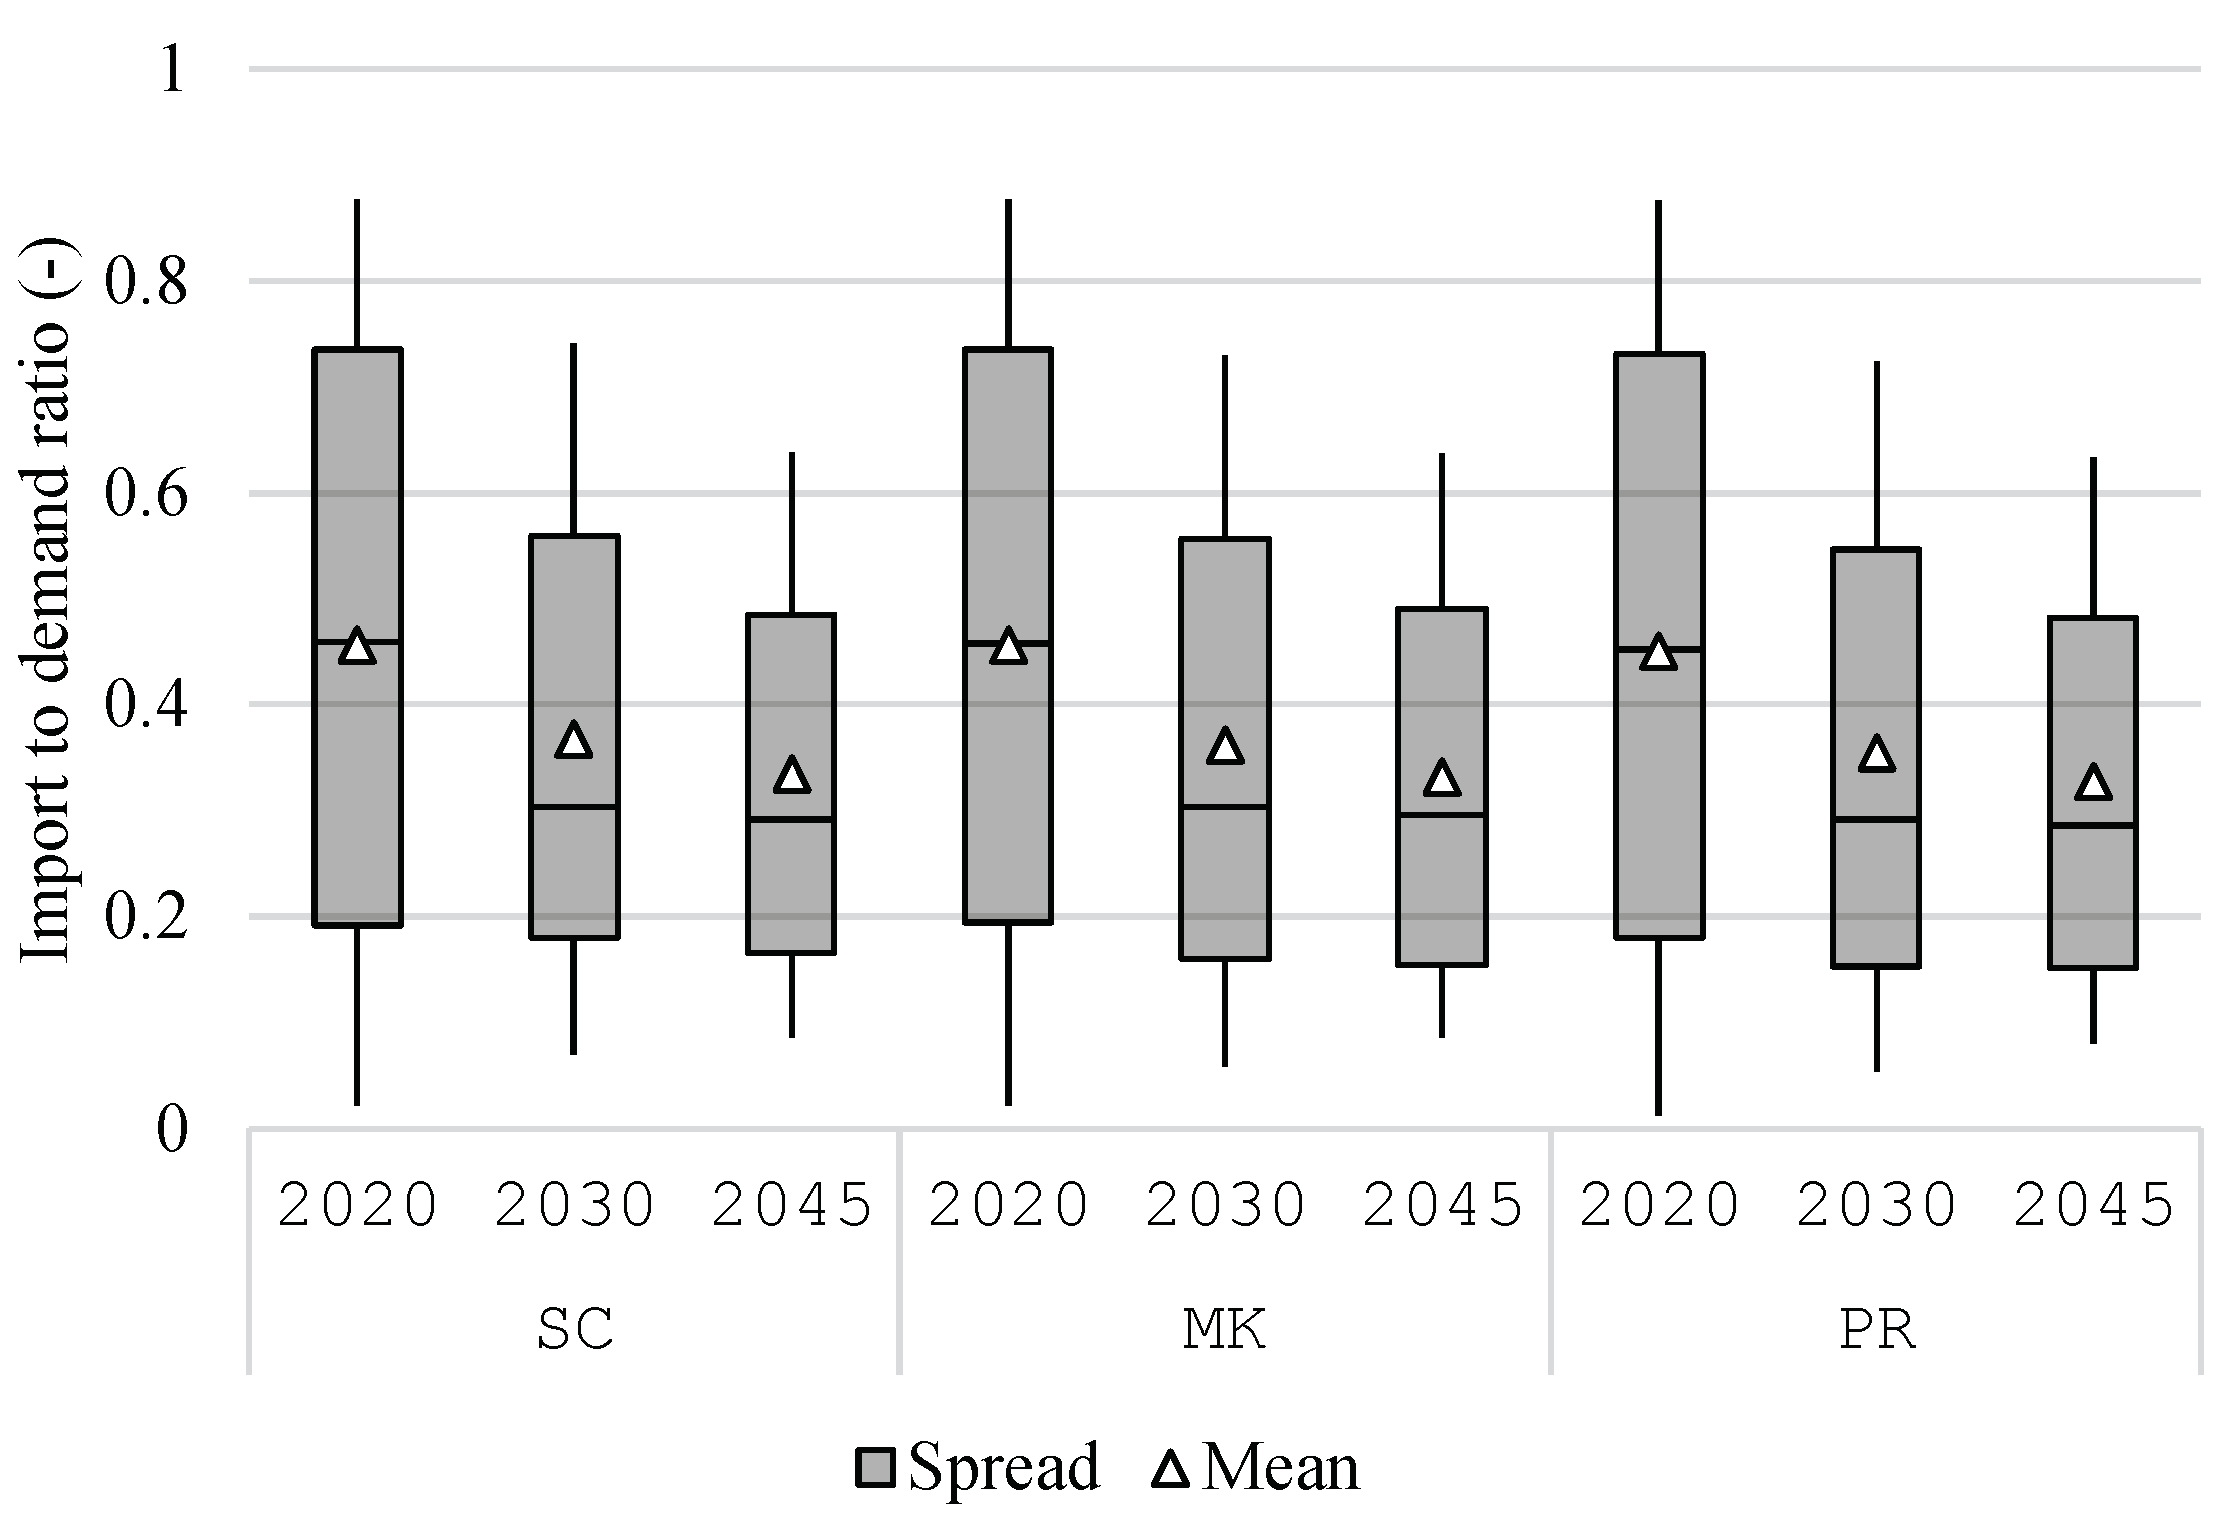
Figure 9 presents the distribution of electricity import-to-demand ratio. The lower this ratio is, the closer is a region in becoming self-sufficient. As more VRE potentials are exploited, each region imports less electricity from the national system. However, this trend stagnates during the later years, and no region becomes fully self-sufficient. This is due to the increase of electricity demand and the fluctuating nature of VRE. The latter means that a region can generate in surplus on an annual balance, but in some hours, it still need generation from external sources. Lastly, the average ratio over the three years in the
SC scenario is 38.6%, 38.4% in
MK, and 37.7% in
PR. The marginal difference between various operation of residential battery storage suggests that the choice of price signal hardly affects the self-sufficiency of the system.
4.3. Utilization of the Transmission Grids
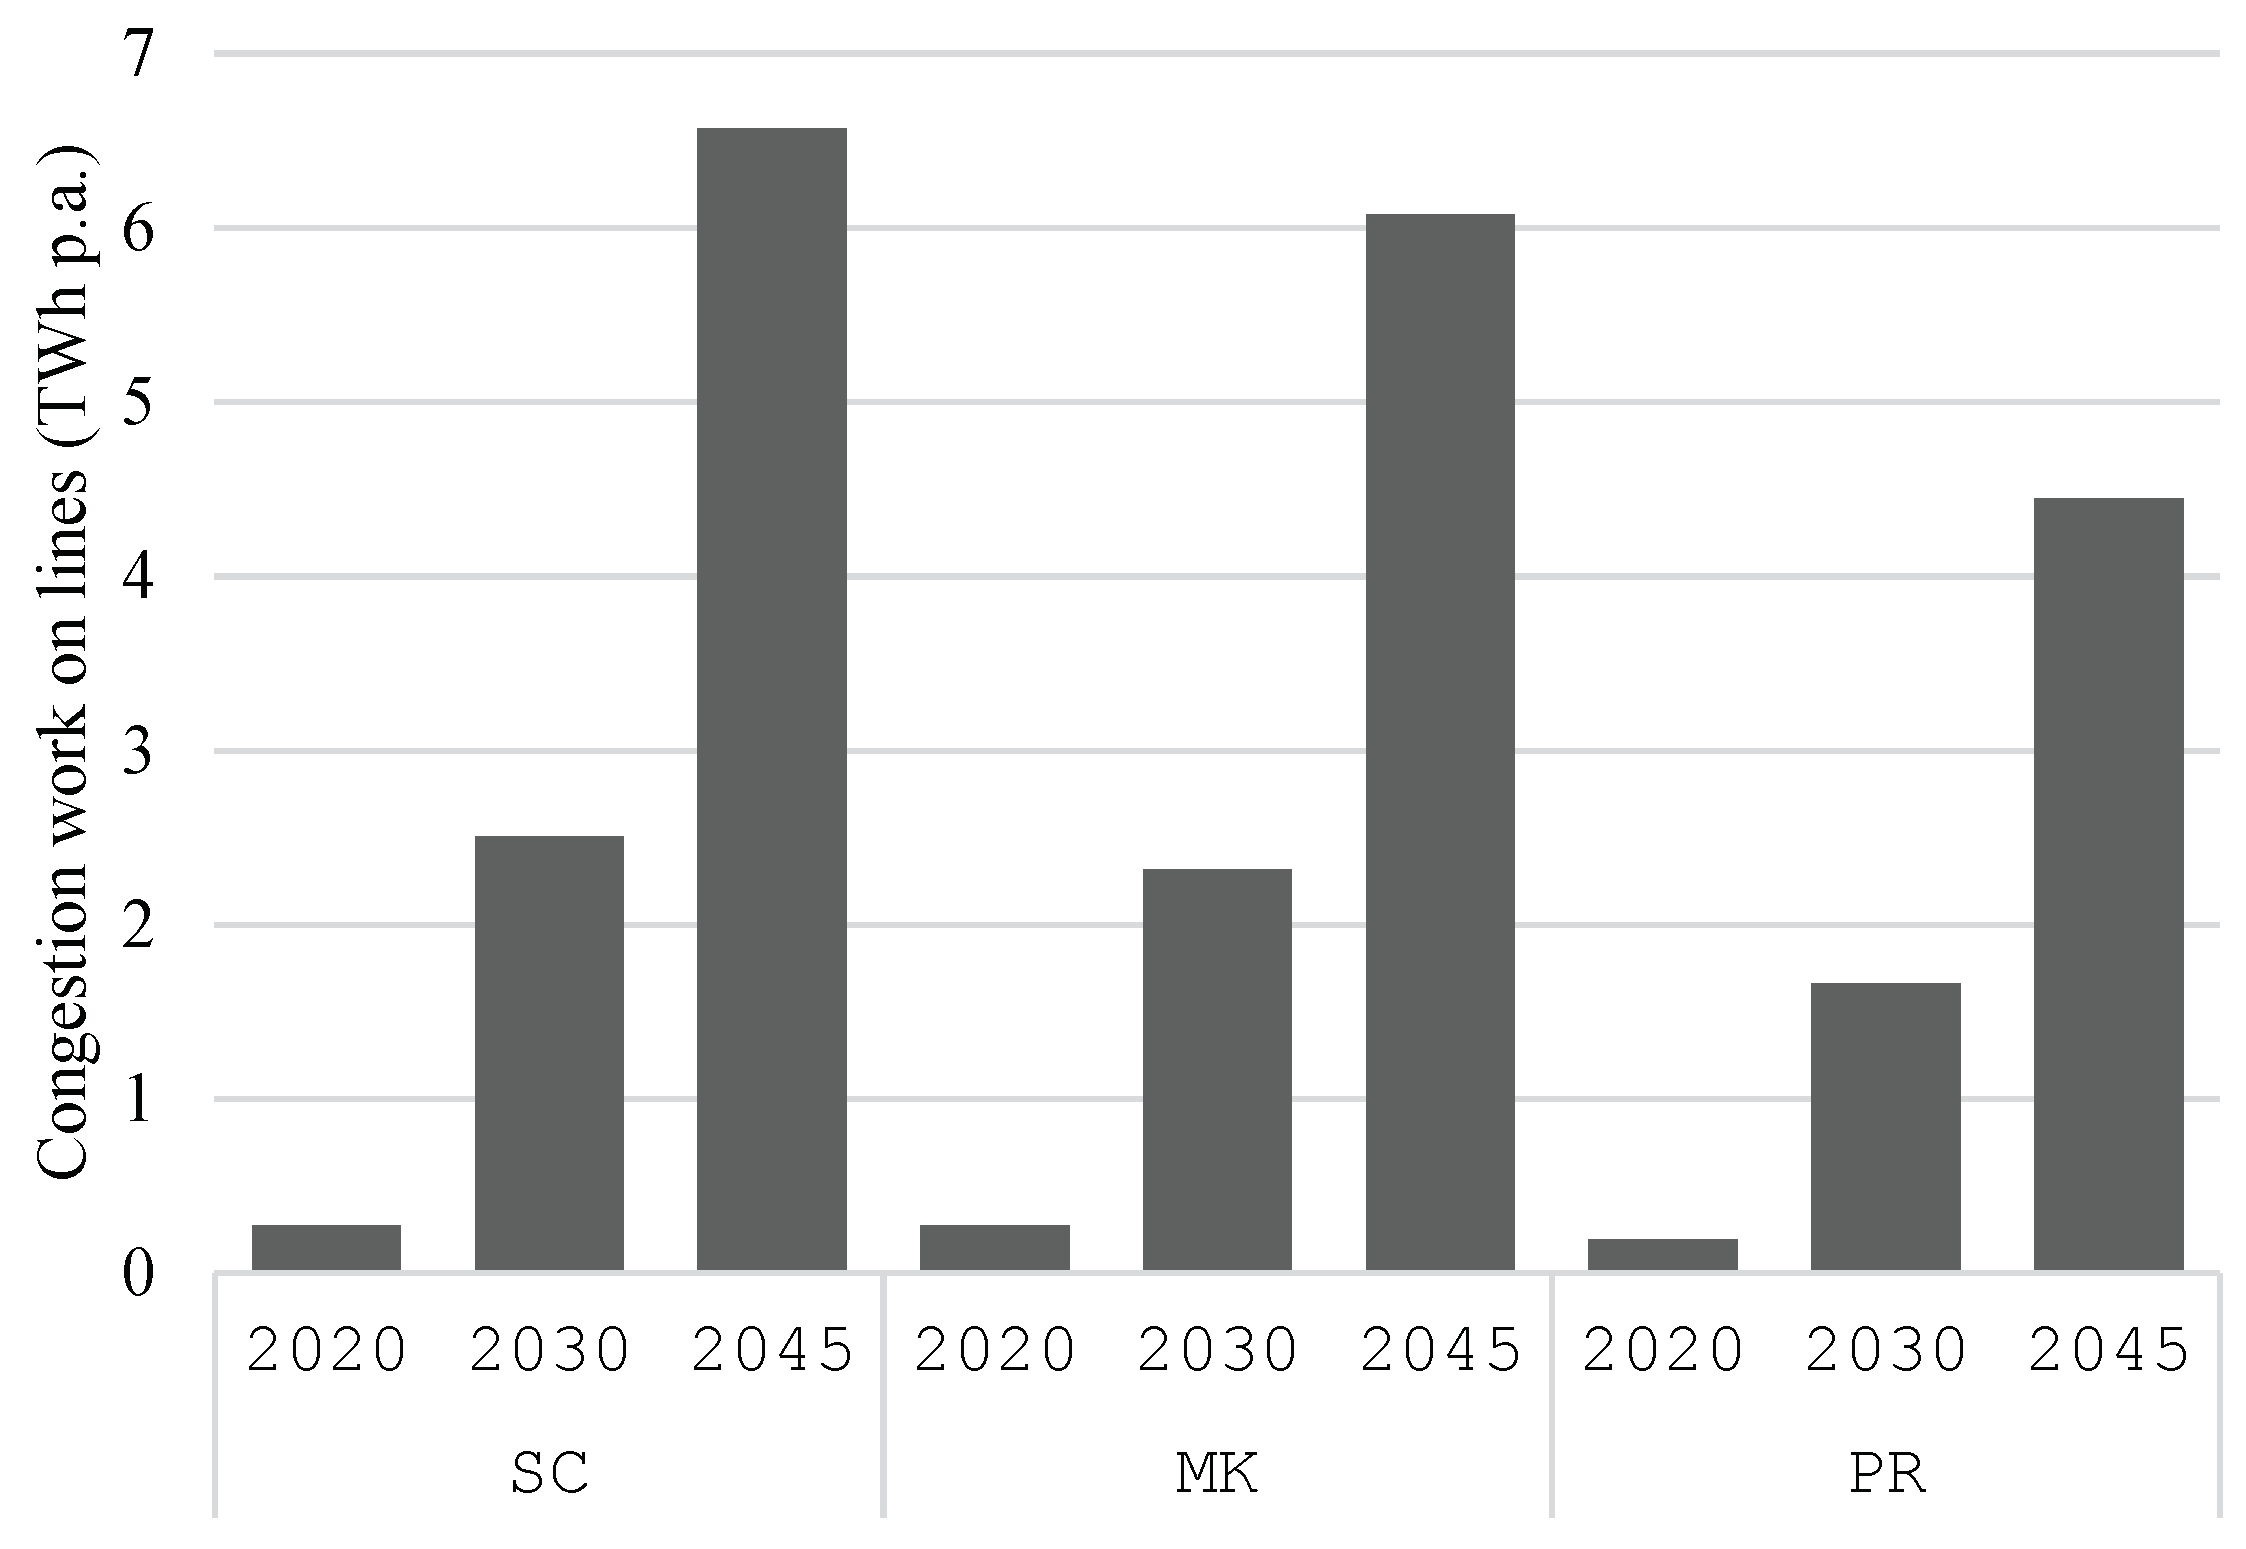
The annual congestion work on lines of 220 kV or higher is presented in
Figure 10 by scenarios. Note that congestions on transformers are not taken into account here as it is assumed that they are cheap to be replaced compared to overhead lines. Across all scenarios, the annual congestion work increases from around 0.5 TWh in 2020 over 2 TWh in 2030 to about 7 TWh in 2045. A reason for this is the strong increase in feed-in from variable renewable energy sources. While the annual congestion work in 2045 in scenarios
MK and
SC differs only slightly,
PR scenario shows a significantly lower congestion work of −27%. This is due to the assumption that residential battery storage and other flexibility in
PR scenario are also used to reduce the feed-in and withdraw peak of the NUTS-3 region they are installed in.
The higher congestion work across the years is caused by the increasing installed power of renewable energy sources. As discussed in
Section 4.2, while photovoltaic power plants are mainly installed in the southern part of Germany, wind power plants are built close to the coastal area and the northern regions. As the feed-in from these sources is very volatile, these regional disparities lead to transmission needs from north to south and vice versa.
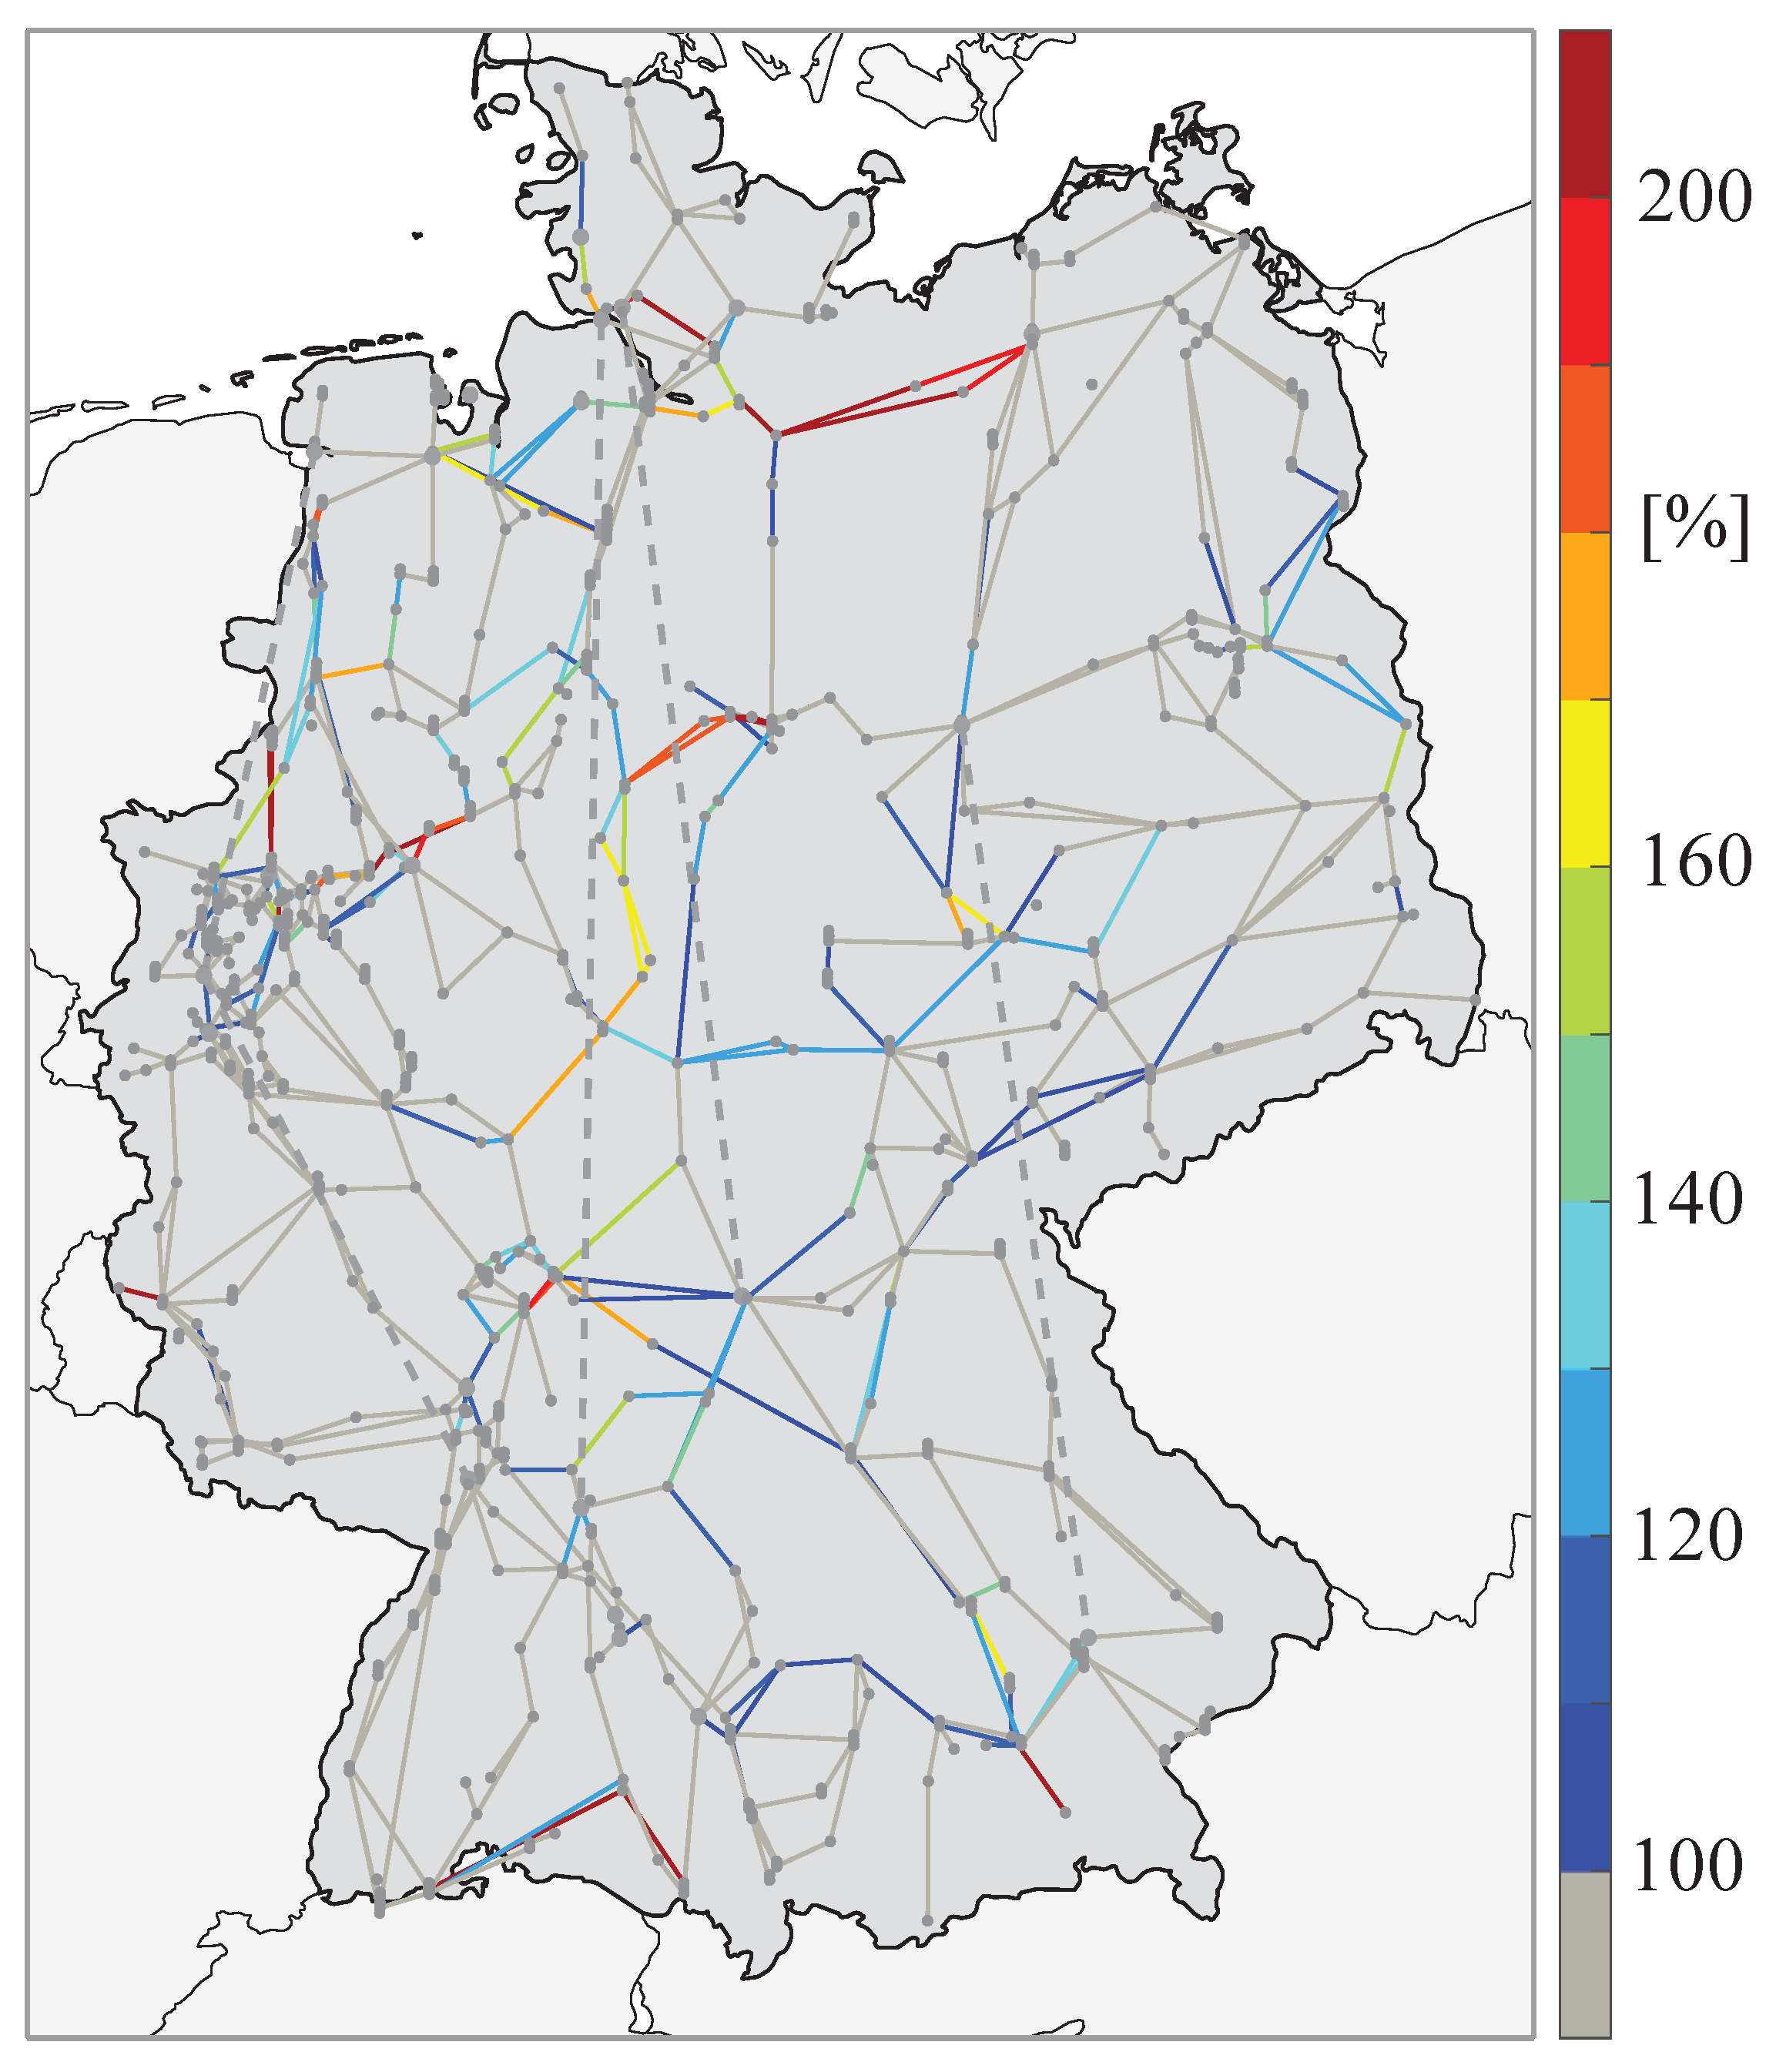
Figure 11 shows the annual maximal line loading exemplary for the scenario
MK-2030. It can be seen that lines on the north-south connection are heavily utilized. In addition, the lines near the start and end nodes of the HVDC lines (dashed lines) are highly utilized, which indicates heavy use of the HVDC lines to transport energy from north to south. Similar results are observed in other scenarios.
5. Discussion
Regarding the research questions in
Section 1: The results show that when residential battery storage (RBS) is operated in the market-oriented manner, the total generation costs can be reduced by 6% compared to the operation strictly reserved for self-consumption. The additional constraint to reduce the regional peak power placed on the RBS can increase the costs by 2%. The significant expansion of distributed energy resources over the years improves the regional self-sufficiency; however, a large discrepancy between NUTS-3 regions can still be observed. Namely, northern regions generate electricity in large surplus, whereas conurbations have significant generation deficit due to low renewable energy potentials and higher demand concentration. The latter is exacerbated via the electrification of heating processes and the transport sector. The results also show that the RBS operation assumption has marginal impacts on the regional self-sufficiency. Lastly, the transmission grid congestion is highest when the RBS is operated in the market-oriented manner or to increase the self-consumption. The peak reduction operation can improve the regional loading factor and reduce transmission grid congestion. However, it does not eliminate the need for grid expansion. Some lines, particularly in northern Germany, can reach very high loading.
The comparison between different phases of the decarbonization shows that the benefits of RBS are slightly higher in the year 2045, i.e., in the fully decarbonized phase, than in 2030. The higher benefits in future years are likely due to the higher surplus generation, the higher installed capacities of RBS, and the higher price of renewable hydrogen. It also stands to reason that the improvement between different operation assumptions is small as the future energy systems have other short-term flexibility resources at their disposal, namely flexible electricity demand from the heating- and transport sectors.
The results present the economic benefits for the system when RBS is operated in a market-oriented manner, e.g., responding to electricity prices from the market. However, this operation does not lead to the highest charge-discharge cycle, see
Figure 5. This notion together with
Figure 6 suggests that the benefits of RBS do not entirely depend on the volume of shifted energy, but also on the period of the shift. Moreover, from the perspective of a single market system, battery storage is less necessary when the surplus PV generation can be transmitted to and utilized by neighboring buildings or regions. Thus, the higher RBS operation in the self-consumption scenario can result in unnecessary energy losses from the conversion. This insight should be considered in the design of price-based incentive schemes, e.g., time-varying electricity tariffs, such that they do not over-encourage unnecessary charge-discharge cycles.
The utilization of distributed RBS resources must also address the design of the coordination mechanism as well as the allocation of costs and benefits. The shared asset utilization can be especially challenging in vertically-disintegrated systems [
9]. While price-based incentives are not always adequate in dealing with grid congestion, they are highly effective in mobilizing distributed flexibility resources according to market prices [
30]. Fortunately, these resources indirectly mitigate grid congestion to some extent and promote the decarbonization by avoiding the utilization of fossil-fired power plants. Lastly, as long as the coordination mechanisms also respect the primary purpose to increase own self-consumption, the impacts of the operation mode on the asset owners are minimal [
31].
Noteworthy novelties of the work are: the benefit analysis from the system perspective, i.e., beyond the scope of individual prosumers, the consideration of a fully-decarbonized energy system, and the detail level of the geographic resolution. The former is essential for the justification of a nation-wide policy implementation, e.g., on price-based incentives for residential battery storage. And on the modeling resolution, the developed method considers regional characteristics of renewable energy generation as well as demand concentration in detail. The limitations of the work include: the exclusion of technology expansion in the optimization problem. This disconnects the effects of operation strategy from the optimal sizing of RBS. However, one can argue that the RBS sizing mainly concerns with PV capacity and demand; therefore, the RBS capacities in reality should be the same in all scenarios. Furthermore, this work assumes a perfect information foresight and focuses only on the operative benefits of RBS based on the day-ahead energy market. Indeed, these resources are useful in dealing with stochastic generation and can participate in auxiliary markets, e.g., to provide a frequency containment reserve [
32].
6. Conclusion
The growing public interest in self-sufficiency, government subsidies, and decreasing PV prices drive the expansion of residential battery storage (RBS). In the literature, the benefits of RBS from the perspective of asset owners and distribution grids are well investigated. This work studies the operative benefits in terms of generation cost reduction and congestion mitigation on the system level. Germany is chosen as a case study of an energy system undergoing decarbonization. The coupling of an economic dispatch model with the geographic resolution of NUTS-3 and a transmission grid model enables comprehensive analyses of the case study in the year 2020, 2030, and 2045. The dispatch model is modified to analyze different operation strategies of RBS—market-oriented, self-consumption, and peak-reduction. The results show that the generation costs are highest, when storage is operated only to increase the PV self-consumption. These costs are reduced by over 6% in 2045, if storage can serve the system as a whole, e.g., when the spot market price signal is passed on to residential customers. In both scenarios, the regional infrastructure loading declines due to increasing adoption of variable renewable energy, and the grid congestion level increases over time. These metrics are improved when peak reduction is introduced as an additional operation objective at the expense of a slight generation cost increase.
The use of RBS beyond increasing the self-consumption of asset owners improves the economic efficiency of the generation and the infrastructure utilization factor of the distribution- and transmission grids. The challenge lies in the design of coordination mechanisms that ensure fair cost-benefit allocations among actors and efficient asset utilization, i.e., to increase to use of RBS in winter. For this, it is recommended that an introduction of a time-varying price signal based on spot market prices together with a possible intervention from distribution grid operators should be considered. Arguably, the cost saving is reduced once the additional transactional costs are considered, e.g., investment and operational costs of intelligent energy management systems. Costs related to different operation schemes including grid expansion and utilization costs should be examined further to establish the best use of RBS for future energy systems. Furthermore, the system-benefits of RBS compared to other short-term flexibility resources and the effects on the optimal sizing should be studied.
Author Contributions
Conceptualization by all authors; methodology, software, validation, formal analysis, investigation, data curation, visualization, and writing—original draft by N.W., N.O., and C.T.; writing—review & editing by all authors; supervision by N.W., C.K., and C.R.; project administration and funding acquisition by C.K. and C.R.
Acknowledgments
This work was conducted in the research project MAPSEN, which was sponsored by the Federal Ministry for Economic Affairs and Climate Action of Germany (Bundesministerium für Wirtschaft und Klimaschutz BMWK) under the grant 03EI1014A. The authors would like to thank Sven Längle for his contribution in the data preparation.
References
- International Renewable Energy Agency IRENA. World Energy Transitions Outlook 2023: 1.5°C Pathway, 2023.
- Cochran, J.; Miller, M.; Zinaman, O.; Milligan, M.; Arent, D.; Palmintier, B.; Mueller, S. Flexibility in 21st Century Power Systems.
- Alipour, M.; Irannezhad, E.; Stewart, R.A.; Sahin, O. Exploring residential solar PV and battery energy storage adoption motivations and barriers in a mature PV market. Renewable Energy 2022, 190, 684–698. [Google Scholar] [CrossRef]
- Ugulu, A.I. Barriers and motivations for solar photovoltaic (PV) adoption in urban Nigeria. International Journal of Sustainable Energy Planning and Management 2019, 21. [Google Scholar] [CrossRef]
- Gorremans, J.; Lits, C.; Rossi, R.; Schmela, M. European Market Outlook for Residential Battery Storage 2022-2026, 2022.
- Agnew, S.; Dargusch, P. Consumer preferences for household-level battery energy storage. Renewable and Sustainable Energy Reviews 2017, 75, 609–617. [Google Scholar] [CrossRef]
- Mateo, C.; Reneses, J.; Rodriguez-Calvo, A.; Frías, P.; Sánchez, Á. Cost–benefit analysis of battery storage in medium–voltage distribution networks. IET Generation, Transmission & Distribution 2016, 10, 815–821. [Google Scholar] [CrossRef]
- PEC. Comparison of the costs of residential battery storage systems in 2023: Vergleich der Stromspeicher Kosten im Jahr 2023, 2023.
- Keck, F.; Lenzen, M. Drivers and benefits of shared demand-side battery storage – an Australian case study. Energy Policy 2021, 149, 112005. [Google Scholar] [CrossRef]
- Hollinger, R.; Diazgranados, L.M.; Braam, F.; Erge, T.; Bopp, G.; Engel, B. Distributed solar battery systems providing primary control reserve. IET Renewable Power Generation 2016, 10, 63–70. [Google Scholar] [CrossRef]
- EUROSTAT. NUTS - Nomenclature of Territorial Units for Statistics, 2021.
- Fraunhofer ISE. ENTIGRIS: Power System Model for expansion planning and unit-commitment, 2024.
- Kost, C. Renewable energy in North Africa: Modeling of future electricity scenarios and the impact on manufacturing and employment. Phd dissertation, 2014.
- GAMS Software GmbH. General Algebraic Modeling System v38.3.0.
- Senkpiel, C.; Hauser, W. Systemic Evaluation of the Effects of Regional Self-Supply Targets on the German Electricity System Using Consistent Scenarios and System Optimization. Energies 2020, 13, 4695. [Google Scholar] [CrossRef]
- Katz, J.; Balyk, O.; Hevia-Koch, P. The impact of residential demand response on the costs of a fossil-free system reserve.
- Wanapinit, N.; Thomsen, J.; Kost, C.; Weidlich, A. An MILP model for evaluating the optimal operation and flexibility potential of end-users. Applied Energy 2021, 282, 116183. [Google Scholar] [CrossRef]
- German Federal Government. Bundes-Klimaschutzgesetz (Federal Climate Change Act): KSG, 2023.
- Agora Energiewende. Climate-neutral power system 2035: How the German power sector can become climate-neutral by 2035.
- Agora Energiewende.; Forschungsstelle für Energiewirtschaft e.V.. Haushaltsnahe Flexibilitäten nutzen: Wie Elektrofahrzeuge, Wärmepumpen und Co. die Stromkosten für alle senken können.
- Sterchele, P.; Brandes, J.; Heilig, J.; Wrede, D.; Kost, C.; Schlegl, T.; Bett, A.; Henning, H.M. Paths to a Climate-Neutral Energy System: The German Energy Transition in its Social Context.
- Bundesnetzagentur. Marktstammdatenregister (MaStR), 2023.
- Risch, S.; Maier, R.; Du, J.; Pflugradt, N.; Stenzel, P.; Kotzur, L.; Stolten, D. Potentials of Renewable Energy Sources in Germany and the Influence of Land Use Datasets. Energies 2022, 15, 5536. [Google Scholar] [CrossRef]
- C3S. ERA5 hourly data on single levels from 1940 to present. [CrossRef]
- BDEW. Standard electricity load profile (Standardlasprofile - Strom).
- Palzer, A. Sektorübergreifende Modellierung und Optimierung eines zukünftigen deutschen Energiesystems unter Berücksichtigung von Energieeffizienzmaßnahmen im Gebäudesektor. [CrossRef]
- Gotzens, F.; Gillessen, B.; Burges, S.; Hennings, W.; Müller-Kirchenbauer, J.; Seim, S.; Verwiebe, P.; Schmid, T.; Jetter, F.; Limmer, T. Harmonization and development of methods for modelling of energy demands in spatial and temporal resolutions (DemandRegio).
- Statistisches Bundesamt. Classification of Economic Activities (WZ 2008).
- Nobis, C.; Follmer, R.; Herter, M.; Bäumer, M. Mobility in Germany 2023.
- Wanapinit, N.; Thomsen, J.; Weidlich, A. Find the balance: How do electricity tariffs incentivize different system services from demand response? Sustainable Energy, Grids and Networks 2022, 32, 100948. [Google Scholar] [CrossRef]
- Fett, D.; Fraunholz, C.; Keles, D. Diffusion and system impact of residential battery storage under different regulatory settings. Energy Policy 2021, 158, 112543. [Google Scholar] [CrossRef]
- Martins, J.; Miles, J. A techno-economic assessment of battery business models in the UK electricity market. Energy Policy 2021, 148, 111938. [Google Scholar] [CrossRef]
| 1 |
At the high-voltage and extra-high-voltage level, grid stations, substations or busbars are referred to as grid nodes. |
| 2 |
Total energy-related CO2 emissions are kept under 7.8 Gt |
| 3 |
A residual load refers to the remaining demand not covered by variable renewable energy generation, which differs from a withdrawal load. |
|
Disclaimer/Publisher’s Note: The statements, opinions and data contained in all publications are solely those of the individual author(s) and contributor(s) and not of MDPI and/or the editor(s). MDPI and/or the editor(s) disclaim responsibility for any injury to people or property resulting from any ideas, methods, instructions or products referred to in the content. |
© 2024 by the authors. Licensee MDPI, Basel, Switzerland. This article is an open access article distributed under the terms and conditions of the Creative Commons Attribution (CC BY) license (http://creativecommons.org/licenses/by/4.0/).
