Supplementary material for preprint on figshare:
Chigarev, Boris (2024). Supplementary material for preprint "Analyzing the Possibilities of Using the Scilit Platform to Identify Current Energy Efficiency and Conservation Issues". figshare. Dataset.
https://doi.org/10.6084/m9.figshare.25574058.v1
In the archive there is a file ‘Energy_Efficiency-En.html’ with active links for convenience to find the full content of the tables used in this preprint. Files included in the archive are italicized and single-quoted in the text.
Brief Literature Review
In the Scilit system itself, there are very few publications analyzing the platform itself. The query ‘Scilit’ without additional restrictions yielded only 54 entries. At the same time, I could find only two papers revealing the work of the platform itself, but without specifying the peculiarities of the data exported from it.
Thus, the article [10.12688/wellcomeopenres.10210.2] discusses the reasons for the creation of SciLite, which was developed with the support of Europe PMC, combines bibliometric data from various sources and links literature to the underlying data.
The purpose of the study [10.12688/f1000research.19427.1] was to improve the quality and reach of text-processed annotations within the existing infrastructure to better serve the curatorial community. To this end, the Elixir platform has been developed to support scalable monitoring of public biological data resources by retrieving and aggregating text processing results from various vendors via APIs such as SciLite.
Given the above, the openness of the SciLite platform and the wide coverage of bibliometric data presented in it motivated me to analyze the possibility of using SciLite to identify current energy efficiency and energy conservation issues.
Particularly considering that the query ‘scilit AND “energy efficiency”’ returned just one result in the form of an Editorial Note [10.30991/ijmlnce.2019v03i03] indicating that the journal is indexed in Scilit and has a publication with the title “Energy Efficient Algorithms.”
Overall description of the sample as defined by Scilit's Analytics view
The content of research area versus number of publications with the highest number of publications is shown in
Table 1, the file
‘Analytics - Subject - Publications.csv’ contains the full number of records in the table (64).
In full agreement with the filters applied in the Scilit database query, the dominant fields of study are Industrial Engineering→29772, Energy and Fuel Technology→9812, Manufacturing Engineering→9186. Other areas of study in the table are also relevant to Engineering and Industry.
The median citation of a publication in a particular research area can be used to estimate the expected citations of a corresponding article (see
Table 2), the full version is available in the file:
‘Analytics - Subject - Median Average Citations.csv’ that has 64 records).
Note: it can be assumed that articles related to more particular fields of research are more frequently cited.
Table 3 shows the distribution of the number of publications related to the topic under consideration by publishers. The full version of the table is posted in the file
‘Analytics - Publisher - Publications.csv’ → it has 100 entries. The publishers of the articles with the highest medial citations are on file:
‘Analytics - Publisher - Avg Citations (median).csv’
Note: MDPI AG Publishing provides open access to the full texts, making it easier to collect publications for a more detailed analysis of the selected topics. Why Elsevier BV Publishing is in third place in terms of the number of publications on our query requires a separate study.
Table 4 shows the distribution of the number of publications related to the topic under consideration by journal. The full version of the table is placed in the file
‘Analytics - Source Title - Publications.csv’ → it has 100 entries.
‘Analytics - Source Title - Avg Citations (median).csv’ → file containing a list of 100 journals whose articles have the highest medial citation.
Note: Energies, IEEE Access, Sustainability, Applied Sciences, Materials, Sensors, Electronics journals have open access to full text, which facilitates analysis of the topics covered.
Table 5 shows the distribution of the number of publications related to the topic under consideration by institution. The full version of the table is located in the file
‘Analytics - Institute - Publications.csv’ and contains 100 records.
File ‘Analytics - Institute - Avg Citations (median).csv’ contains a list of institutions whose publications have the highest medial citation.
Section 2: Overall characteristics of CSV file records exported from Scilit
Total number of 30,000 exported records without deduplication.
Technical notes: peculiarity of records in CSV files is that the separator of authors is ‘\r\n’, so it is better to replace this separator with ‘; ’ otherwise there may be problems in further processing of files.
Another problem may be the presence of complex markup (e.g. formulas) in header or annotation texts, which it is better to get rid of immediately.
Deduplication of records → out of 30000 records, 29736 were unique, 264 were duplicated. I did not have this problem with the time sort on the export, but I did not do a detailed analysis. In the future it will be more rational to use other methods to overcome the limitation of the number of exported records (10000), for example, by using the "Publisher" filter, then it will be possible to export all the data by selecting the sorting by publication time.
Analyzing unique DOIs yields 29733 records out of 29736 total. Detailed analysis of records revealed three problematic publications:
‘
Towards Trusted Green Computing for Wireless Sensor Networks: Multi Metric Optimization Approach‘,
https://irep.ntu.ac.uk/id/eprint/47768 in ‘
Investigation of the Effects of Fuel Cells on V-Q & V-P Characteristics‘ → DOI ‘
10.18196/jrc.v3i4.14855‘ exists in Scilit but the record was exported incorrectly. Separately, the record can be exported normally.
‘Wireless Charging of Large-Scale Energy Storage Systems: A Hybridized Ad-Hoc Approach for High Efficiency’, in Scilit this article can be found by title, but DOI: 10.1109/TPEL.2023.3302298 is not spelled out.
Number of empty fields in CSV file records:
Publication Keywords→1059 Publisher→30 Source Title→115 Authors→60 Publication Title→0
Incompleteness of the ‘Publisher’ or ‘Source Title’ fields may occur if the article, for example, is published in a collection and filling in is incomplete.
Publication Keywords→100*1059/29733=3.56%. From my observations it is a small percentage, for example in The Lens the percentage is larger.
In this paper, CSV and RIS files are analyzed separately because CSV data were used for keyword co-occurrence analysis using VOSviewer, and RIS was used for clustering of title and annotation texts using GSDMM and NMF algorithms.
Section 3: Example of bibliometric analysis of keyword co-occurrence using VOSviewer
Separate exported files containing 1000 records were merged into a file with 30000 bibliometric records: ‘all_publications-2024-03-14.tsv’. Note: the \t delimiter in TSV is more convenient in some cases, for example, when applying regular expressions to strings.
A file containing 29736 deduplicated bibliometric records was used in the analysis ‘all_publications-2024-03-14_dedupl.tsv’.
To analyze publication topics based on clustering by keyword co-occurrence using VOSviewer [10.1007/s11192-009-0146-3] (
https://www.vosviewer.com/) it is sufficient to have the fields Year, Cited by, Author, Keywords, when using data from Scopus. Our file retains similar fields from Scilit and renames them according to Scopus fields, making them suitable for loading into VOSviewer. To improve the quality of clustering, all keywords were subjected to lemmatization based on a dictionary of lemmas collected on GitHub. Year field is left as in Scopus, removing the time entry from the Scilit data. The delimiter between keywords in Scilit has been replaced by ‘; ’ as in Scopus.
File ‘4_vosviewer_author_keywords_lemmas.tsv’, in which keyword lemmatization was performed, was further used for loading into VOSviewer.
Keyword clustering results
The default parameters for VOSviewer were used in this work.
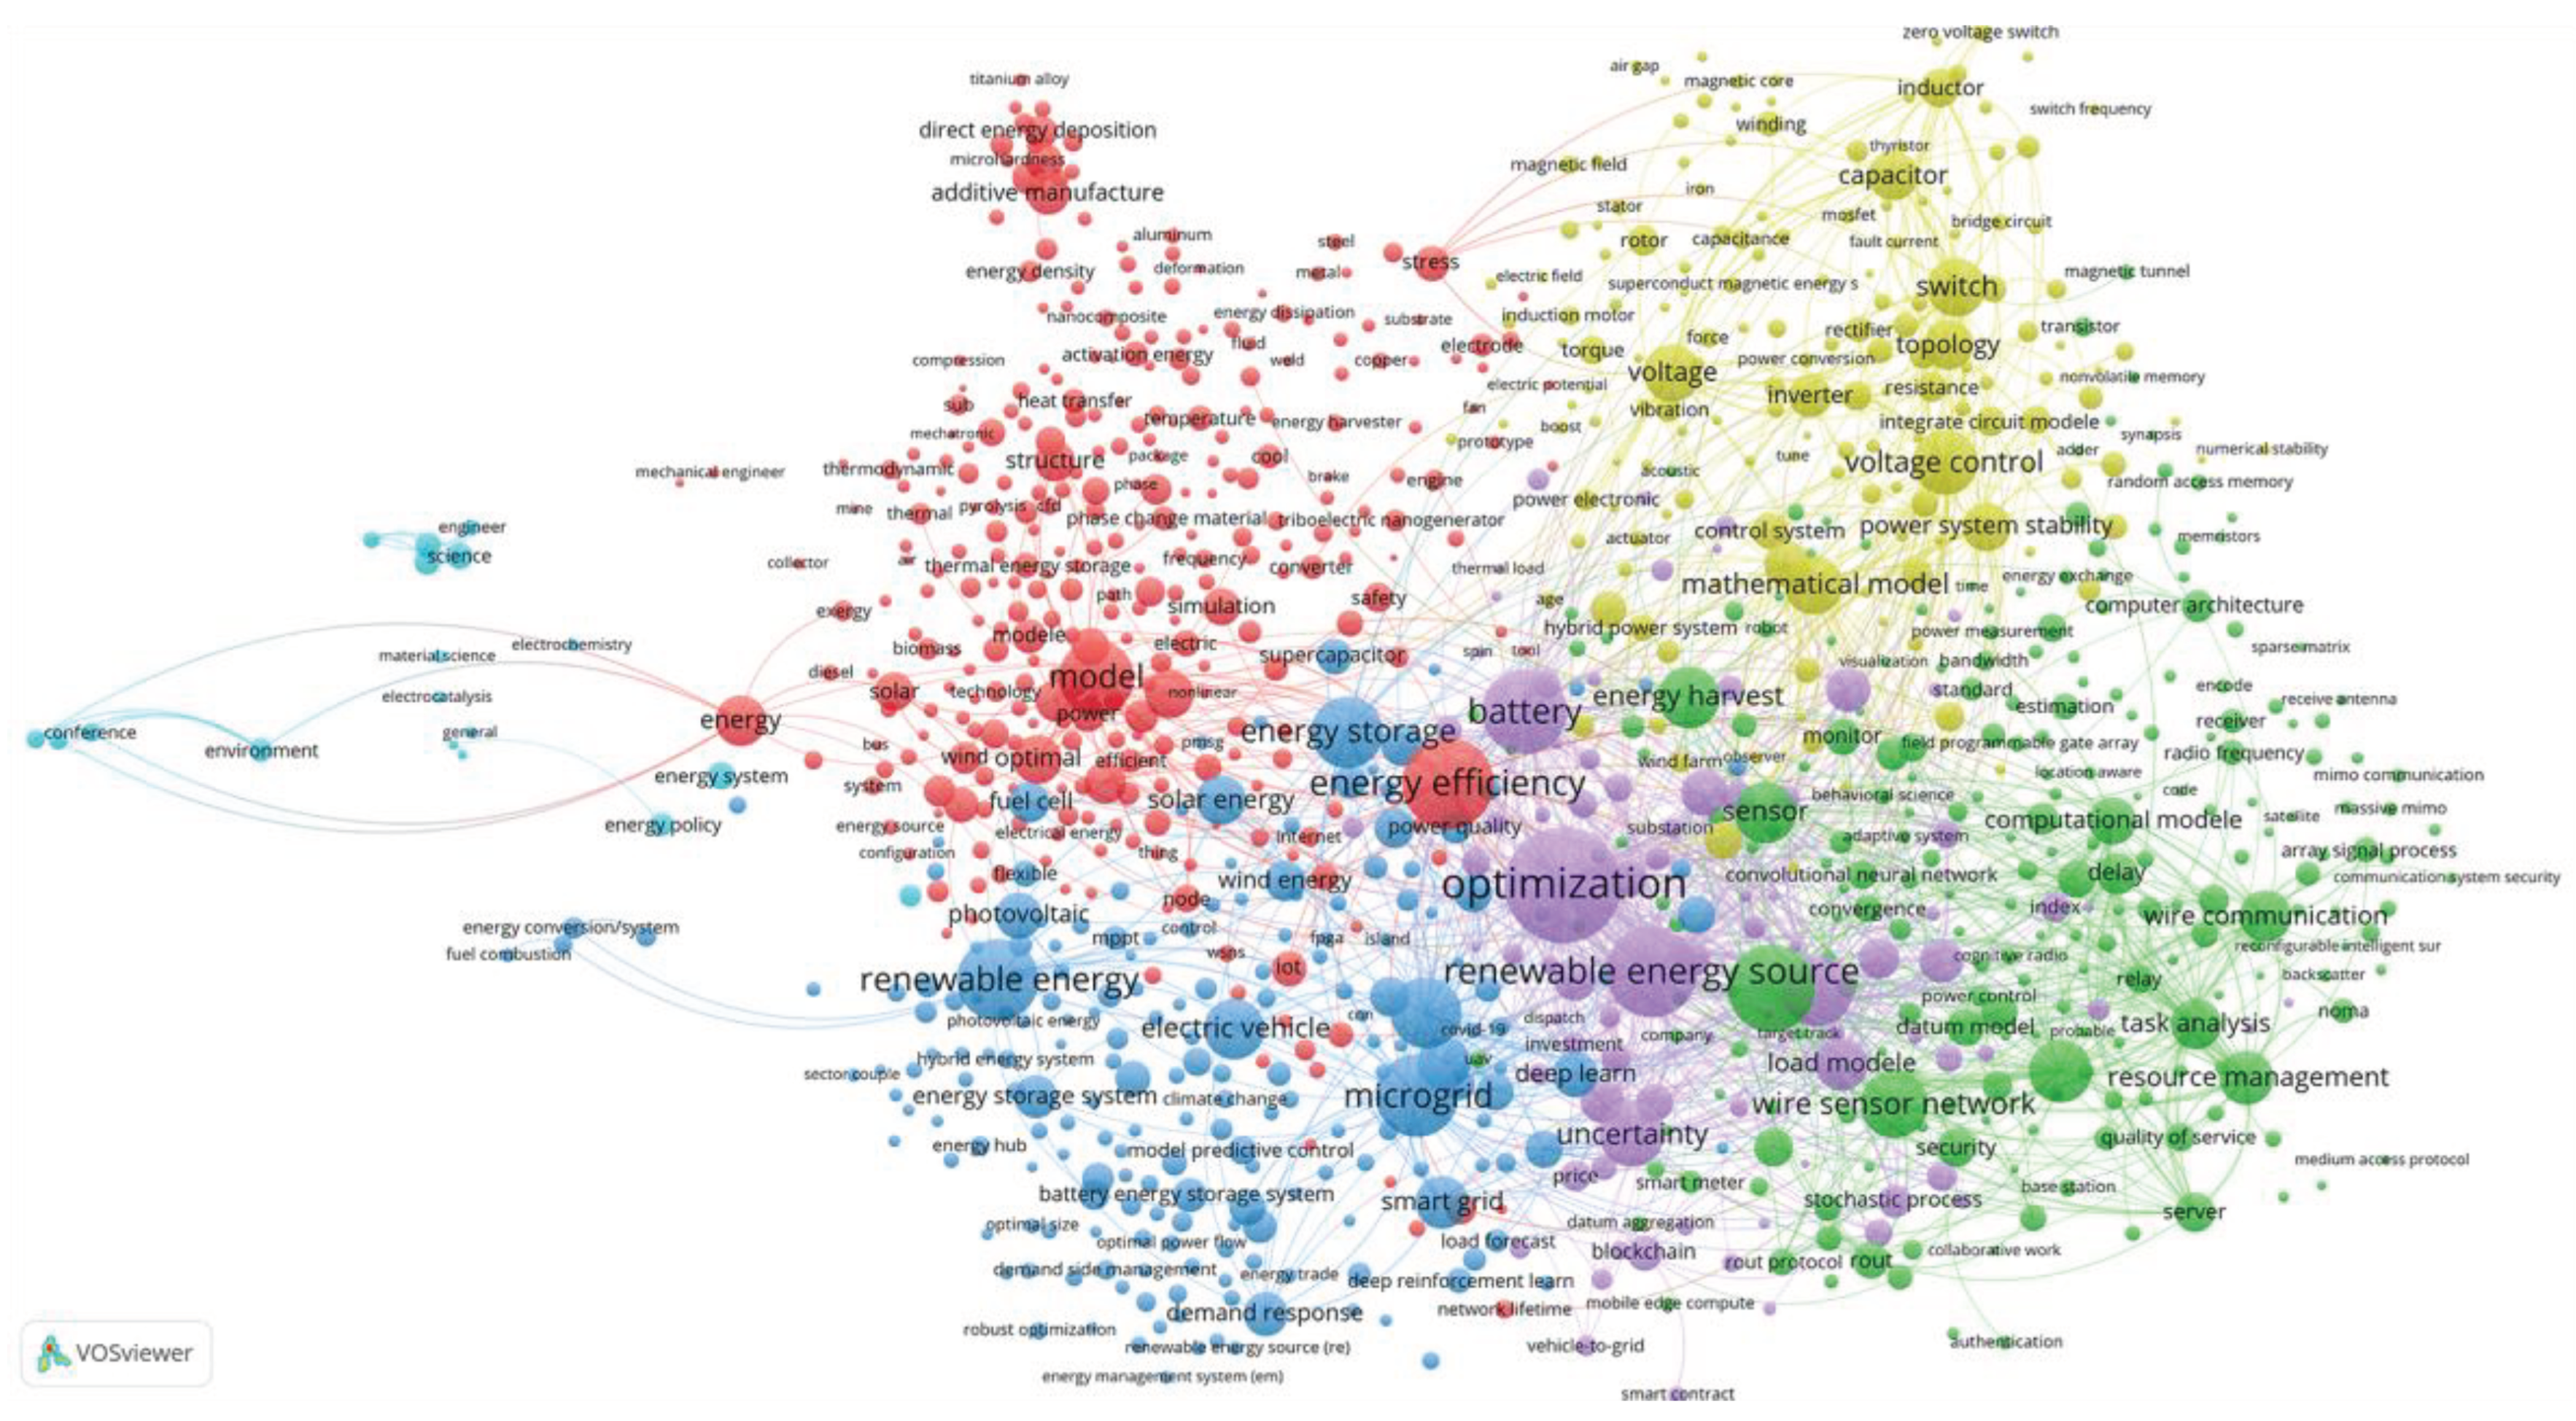
After importing the data, 56905 keywords are obtained, out of which 4066 meet 5 or more times. The graph was built on 1000 keywords with the highest total link strength. It was obtained 6 clusters, the sixth one was small, only 5 clusters will be discussed in more detail below.
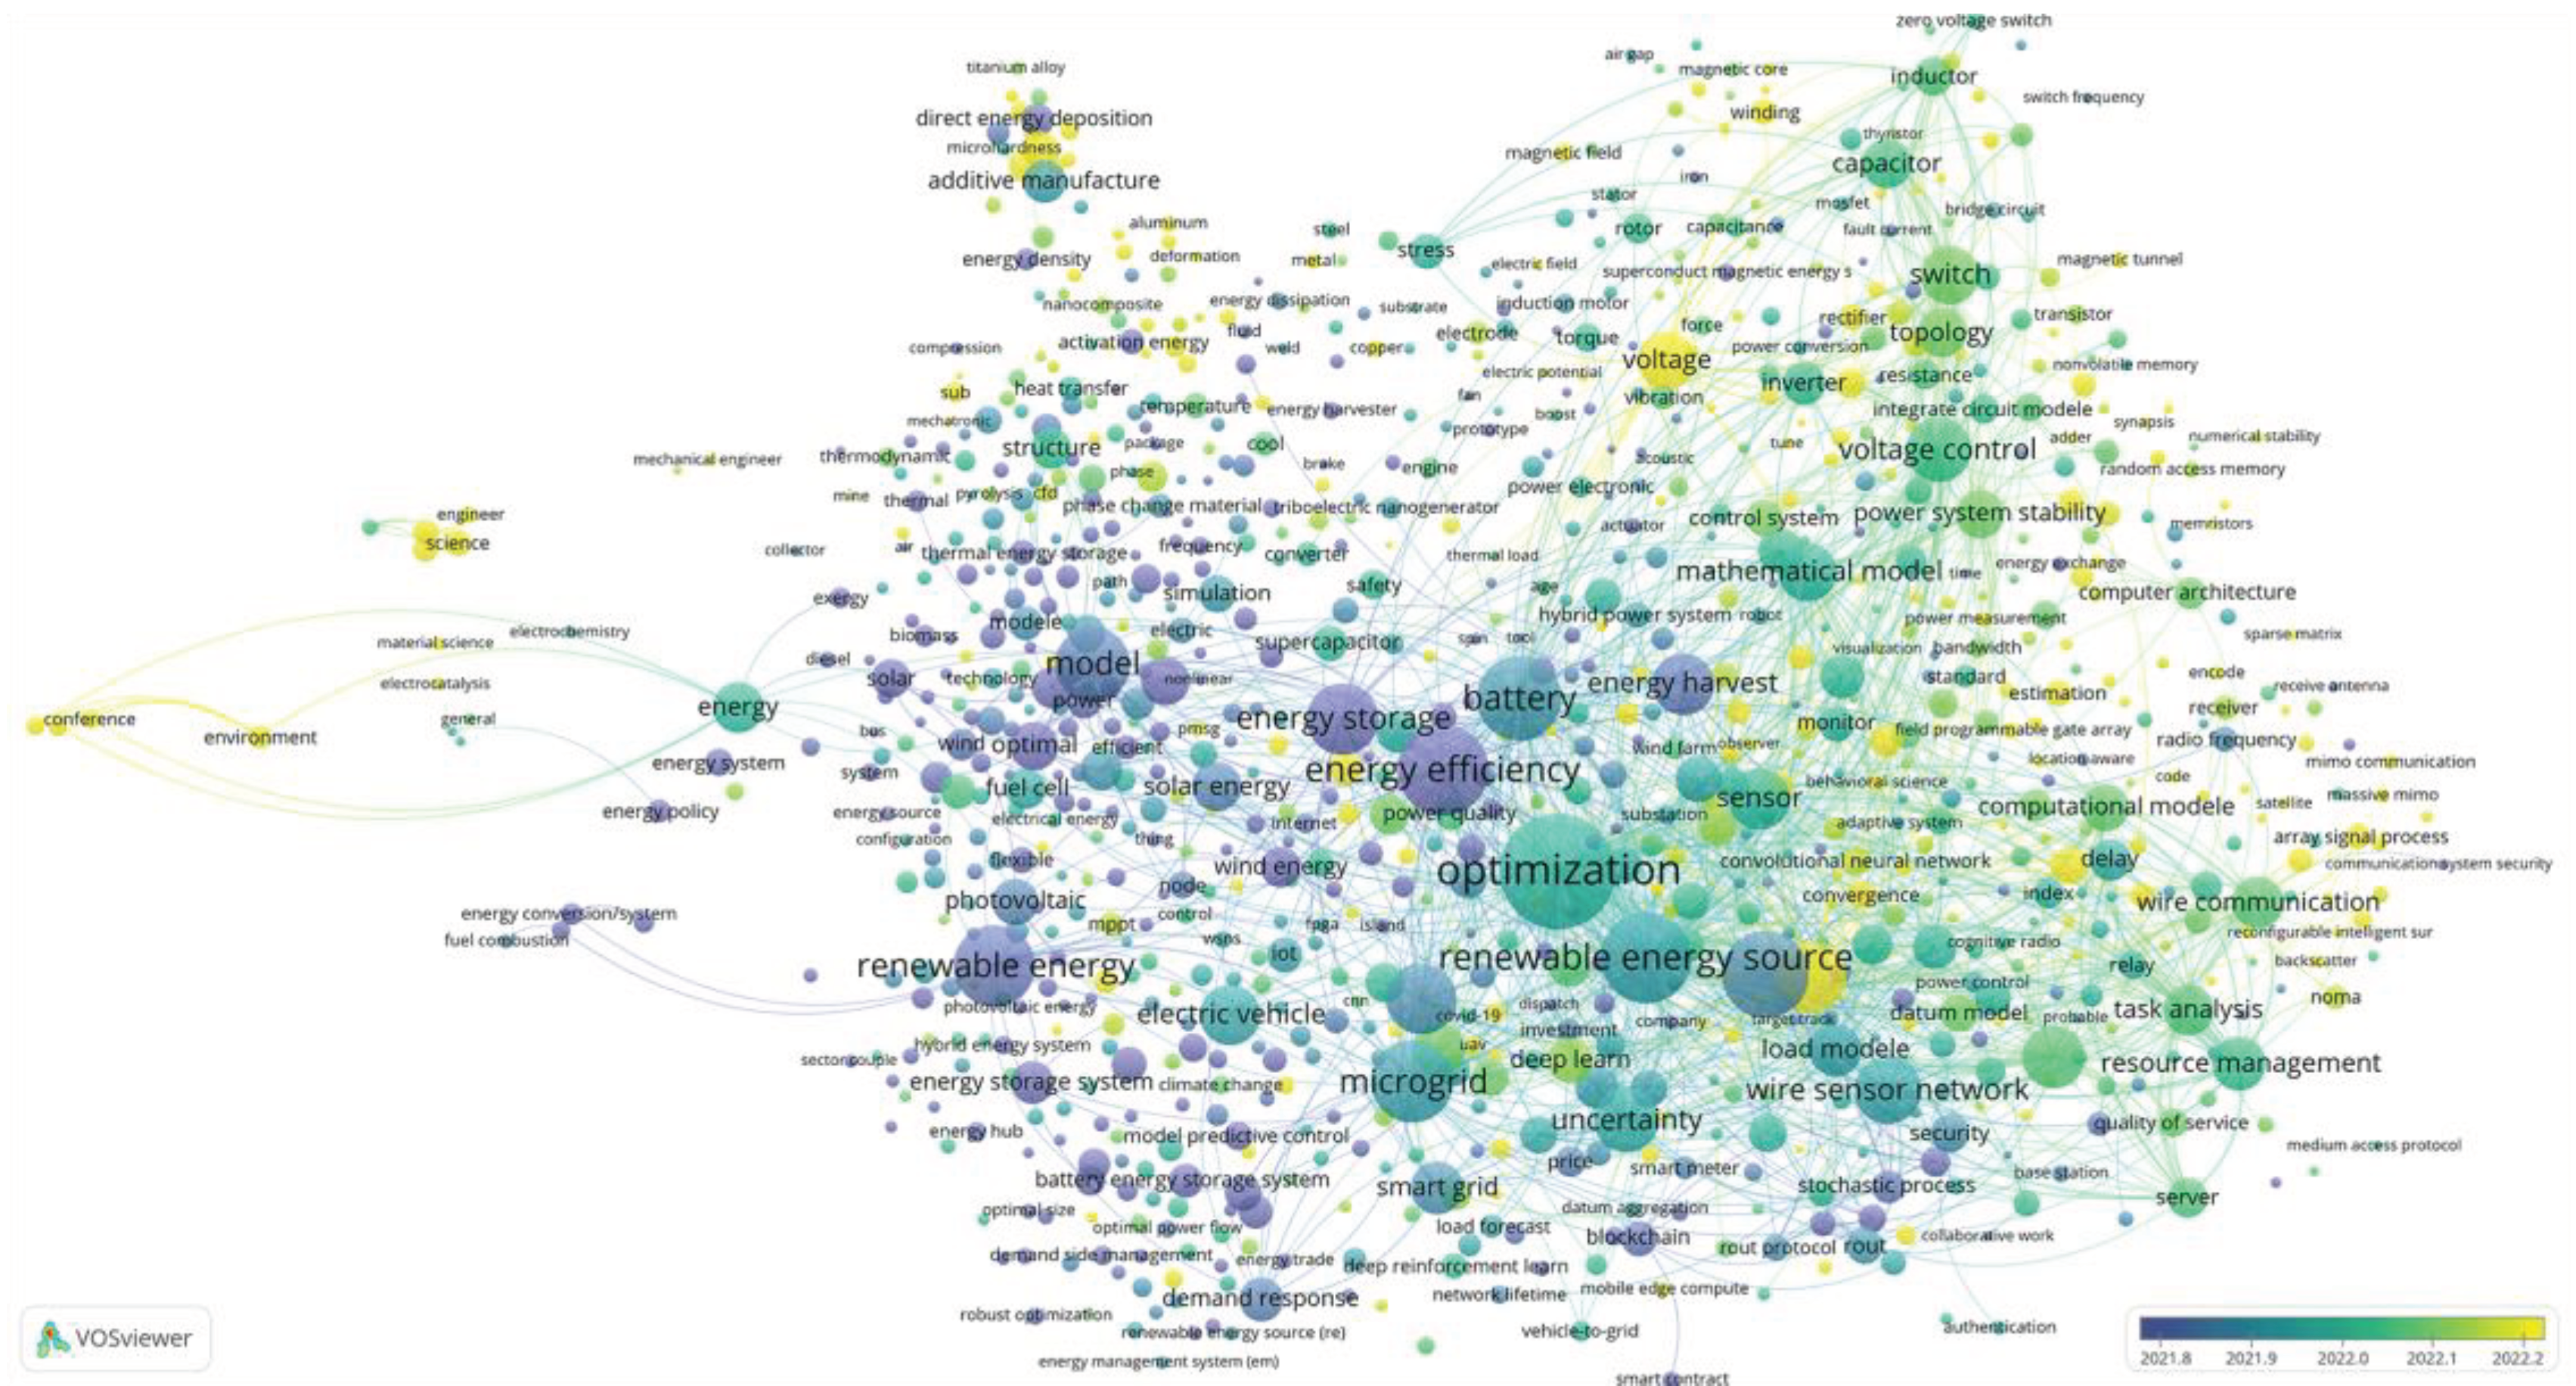
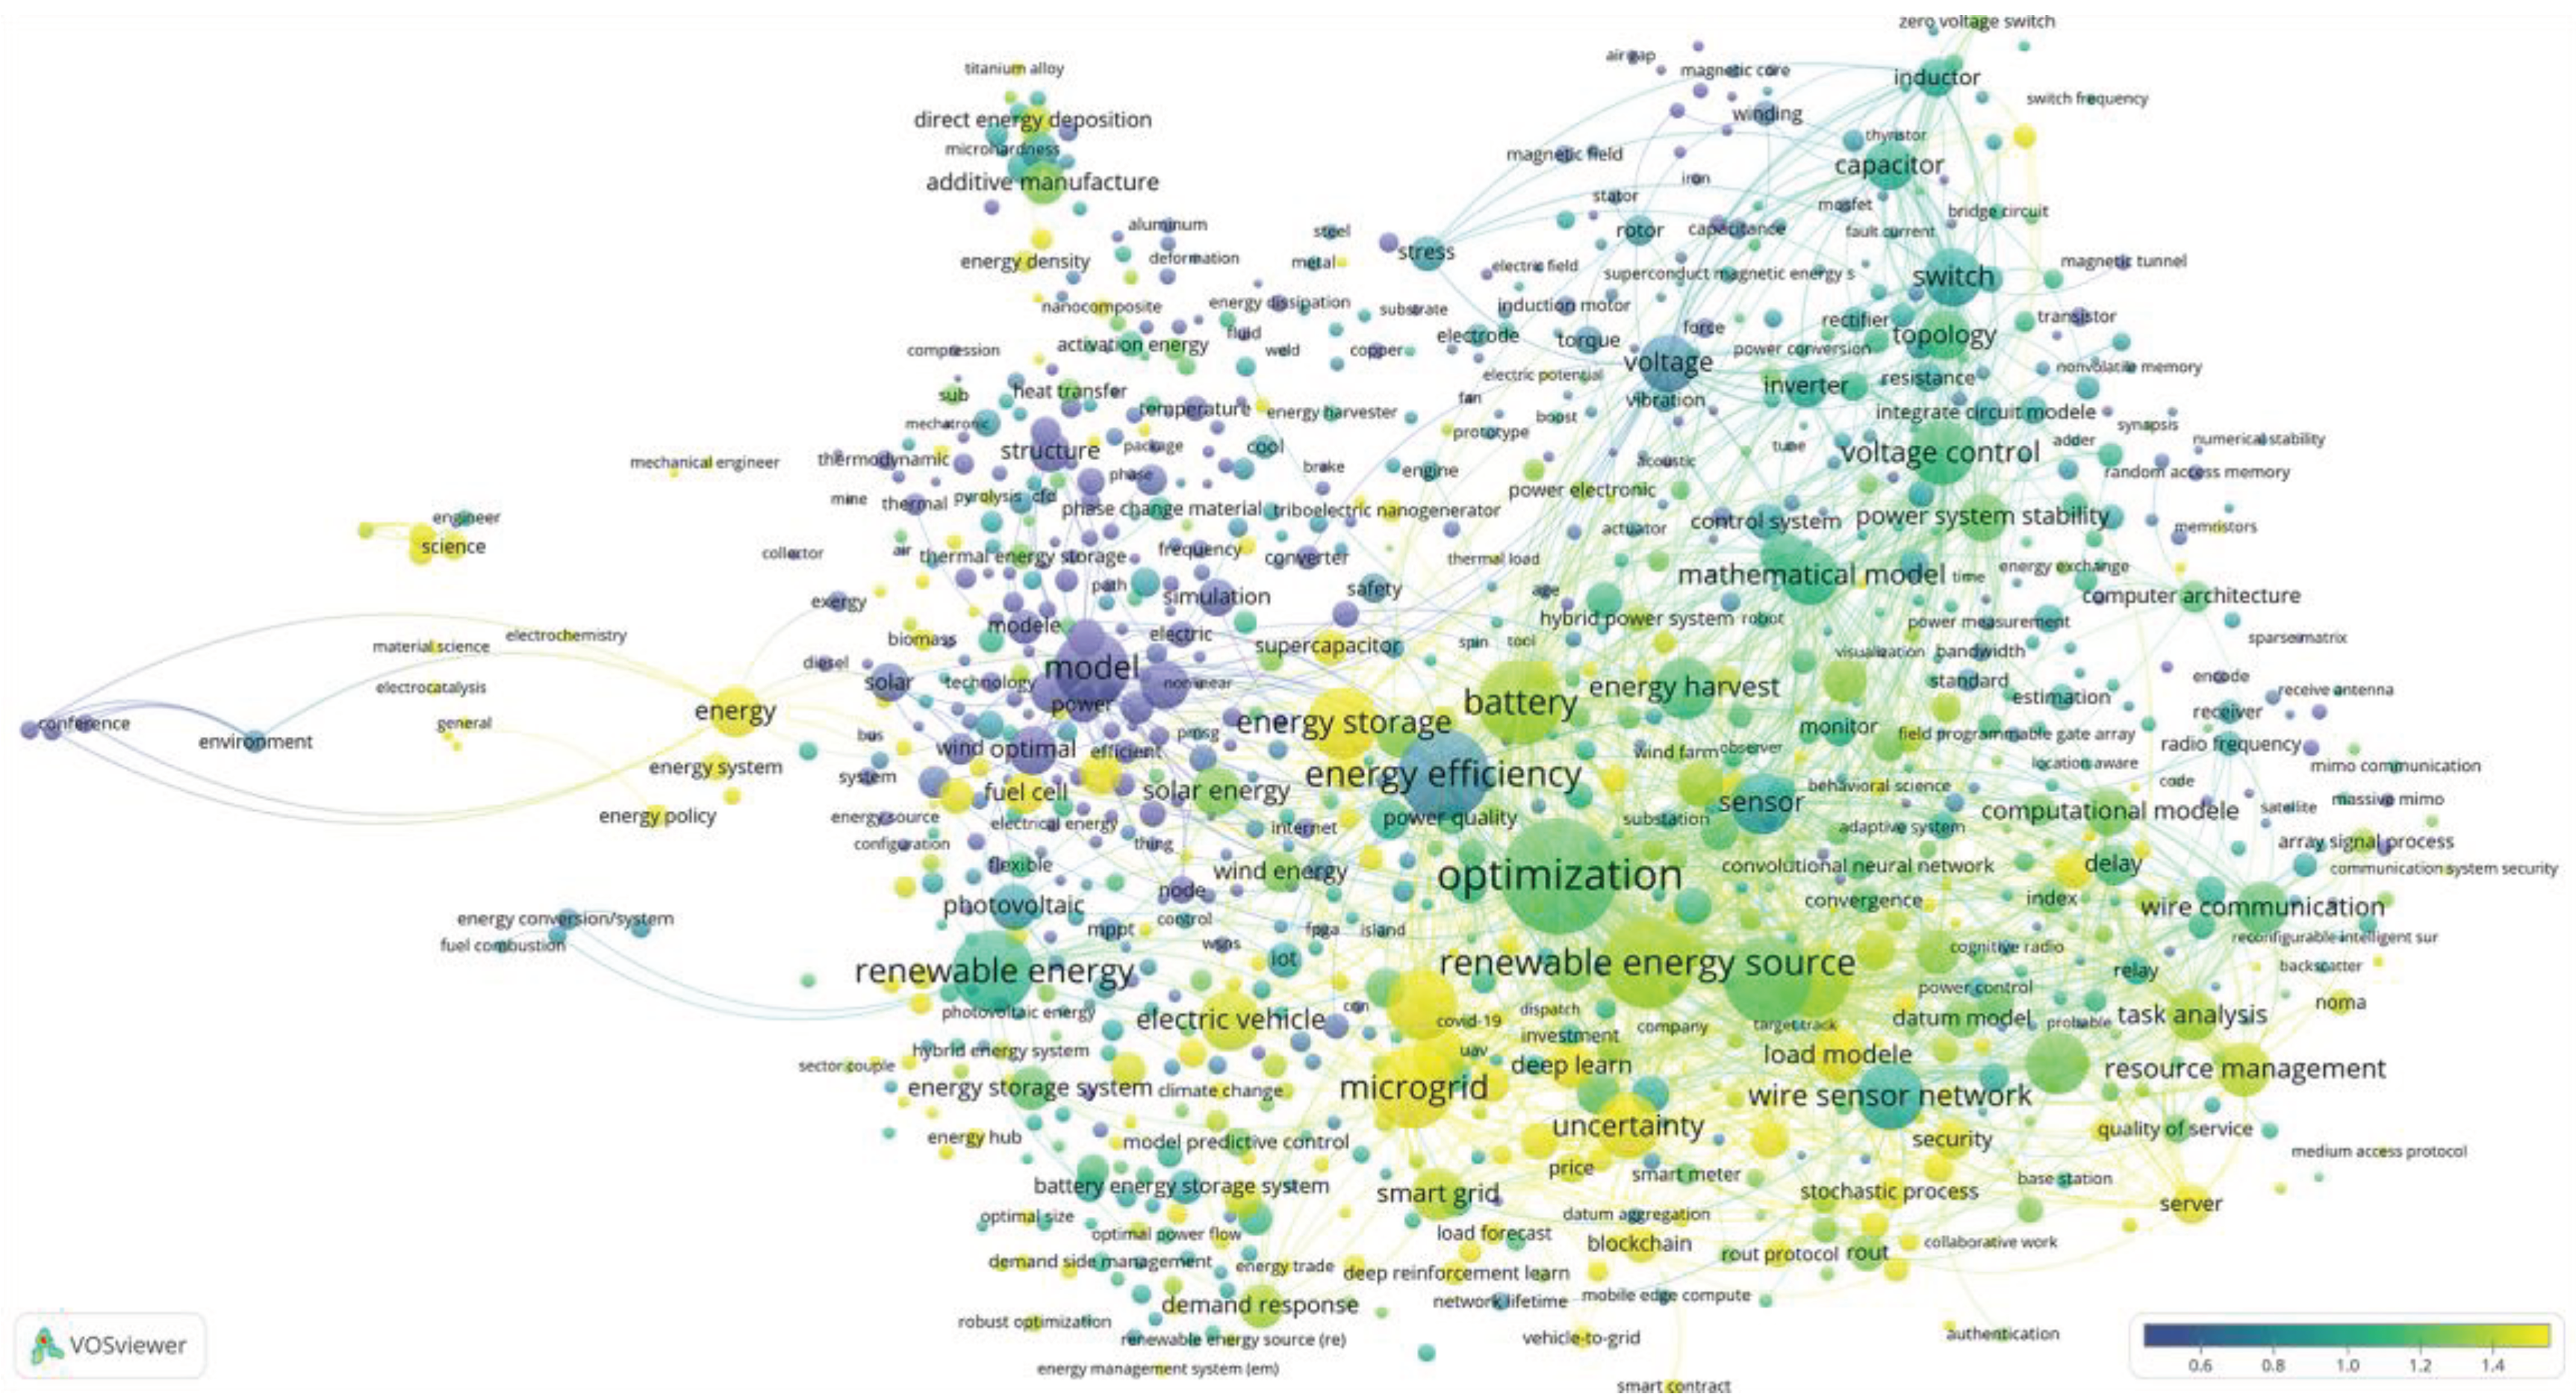
For a more detailed review of the above figures, you can use the file
‘KWs_co-occurrence_Net.json’, exported from VOSviewer and import it into the online application
https://app.vosviewer.com/. Note: in the online version, switching between the above pictures is implemented via the View.Items.Color parameter. The data exported from VOSviewer can also be used in other programs. For example, using the free program Scimago Graphica [10.3145/epi.2022.sep.02] (
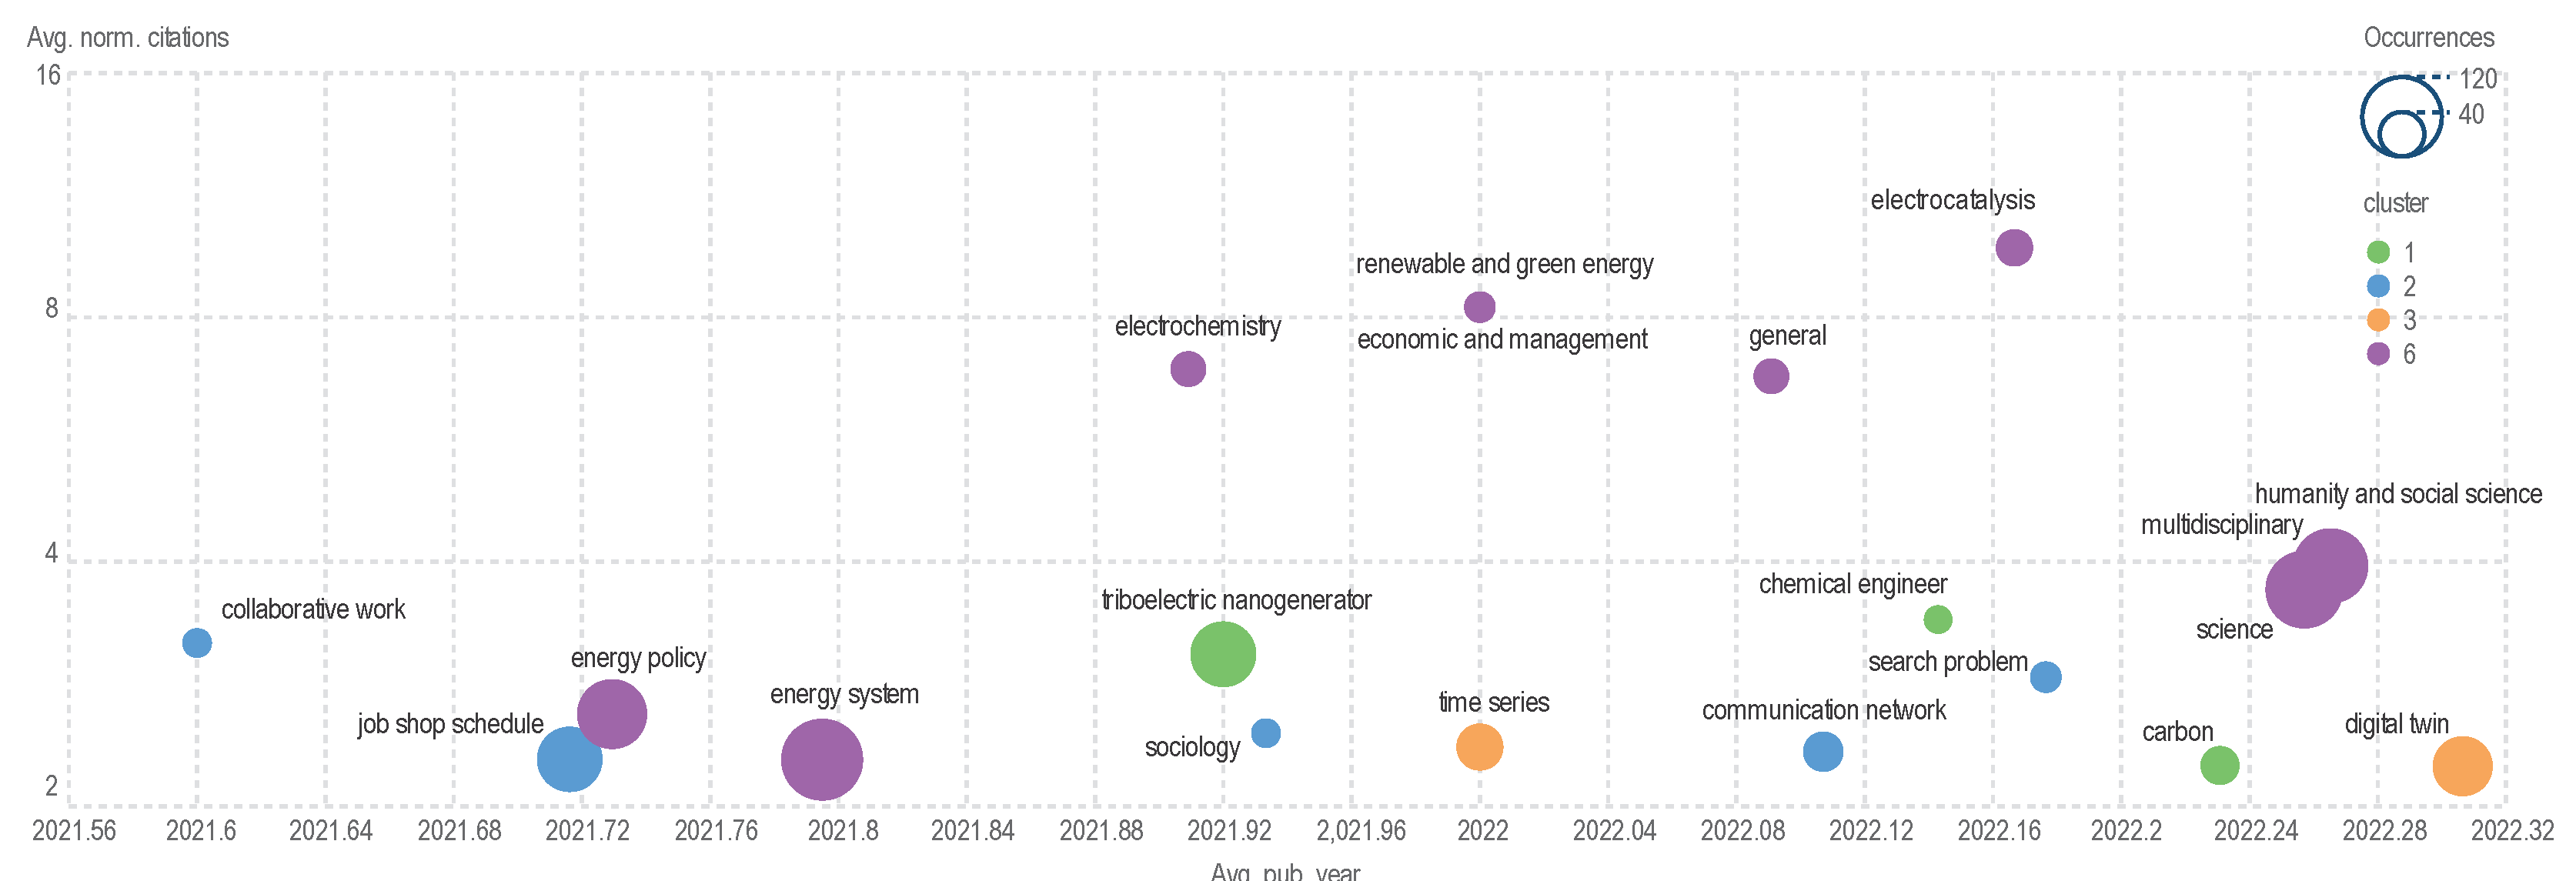
https://www.graphica.app/) and you can plot the occurrence of keywords in the coordinates average time of publication - average normalized citations, the color will highlight the clusters to which the term refers, and the size of the bubble reflects the occurrence of the term. The selection of terms can be varied depending on the task at hand.
Figure 4 is constructed using the file
‘top_20_id_label_cluster_Total-link-strength_Occurrences_Avg-pub-year_Avg-norm-citations.gph’, which can be opened in the program Scimago Graphica, then exported in SVG format and further corrected, for example, in Inkscape or simply in a text editor by adjusting the location of inscriptions, font size and type.
The ordinate in the figure is given in logarithmic format on base 2 to better visualize the distribution of bubbles in the diagram.
The term ‘digital twin’ appears widely in new publications, articles with the keyword ‘electrocatalysis’ are highly cited, and the interdisciplinary topic of ‘humanity and social science’ has recently attracted increasing research attention.
Section 4: Example of clustering bibliometric records using GSDMM and NMF algorithms applied to title and annotation texts extracted from RIS files
The file ‘all_citations-2024-03-14.ris’ contains 30000 bibliometric records in RIS format exported from Scilit. 29996 records have DOIs. 29780 is the total number of unique DOIs, slightly more than in the CSV files. 29987 records have annotations. All records have a title text.
GSDMM clustering algorithm was applied to the preprocessed merged texts of titles and annotations. The DOI field was used as an index to return to the original bibliometric data. Four records do not have DOIs, but this is not critical for understanding the subject matter of the publications, nor is the lack of annotations for 13 records. The user can independently exclude these entries and analyze the title and annotation texts without them.
Since the purpose of this paper was to assess the feasibility of using Scilit platform data on Energy Conservation and Energy Efficiency topic and to initially identify key research issues rather than to conduct a detailed analysis, all 30,000 records were used. Trial experiments with deleting repeated entries did not bring any big changes, probably due to their small number. A more significant impact came from compiling a dictionary for the GSDMM algorithm, a list of stop words, and editing lines containing, for example, LaTeX formulas that caused difficulties in analyzing the text.
The analysis was carried out using the file ‘title_year_abstract_keywords_doi.tsv’ containing title, year, abstract, keyword, and DOI fields derived from all_citations-2024-03-14.ris file.
Preprocessing was performed in the following sequence: combining title and annotation texts in one field, conversion to lower case, lemmatization (the same as for CSV file). Then there was manual editing: formulas were removed first, then markup in the form of tags, abbreviations and explanations in parentheses, hyphen was replaced by underscore to avoid changes when removing stop words, etc.
As the texts were analyzed, shortcomings of the lemmatizer were identified and corrected for future use, e.g., TES stands for Thermal energy storage systems, but the lemmatizer can tes convert to te. For clustering it may not be critical, but the readability of the obtained results will deteriorate. The use of the vocabulary lemmatizer enables such changes to be done easily.
The final file used for GSDMM was: ‘title_abstract_doi_4_GSDMM.txt’.
The dictionary file ‘dictionary4GSDMM.txt’ used by the GSDMM algorithm was composed of keywords having Total Link Strength >= 100, (see file ‘KWs_TotalLinkStrength_more_100_times.csv’).
GSDMM was used with the most common parameters found in the literature: -a 0.1 -b 0.1 -m 100 -k (100 OR 50 OR 20).
The algorithm is quite fast; using a large number of iterations (-m 100) allowed us to verify the stability of a finite number of clusters.
At k=100 (k is the given number of clusters), 79 non-empty clusters were obtained, at k=20 - all clusters were non-empty, at k=50, clusters #38 and #7 contained only two records, while clusters #38, #22 cluster #10 were empty.
Next, in order to subjectively assess the feasibility of using the GSDMM algorithm, the results obtained when k=50 were analyzed, which can be found in files: ‘out_title_abstract_common_doi_labels.csv’ and ‘out_title_abstract_common_doi_cluster_descriptions.txt’.
The records of the first 10 non-empty clusters (0-6, 8, 9,11) were analyzed in more detail. Carrot2 demo with Lingo 3G algorithm was used, which can be accessed here: (Lingo3G document clustering engine (carrotsearch.com)) and the Clustering APP application, available here: (
https://ml-clustering.ew.r.appspot.com/). Detailed descriptions of how to use these programs are available at the addresses listed.
Results of analyzing the records of 10 clusters
The files used for the analysis were: 4_Carrot2_cl_0.csv ... 4_Carrot2_cl_cl_11.csv, which were loaded into the Carrot2 demo version with the parameters:
{
"algorithm": "Lingo3G",
"language": "English",
"parameters": {
"clusters": {
"minClusterSize": 0.1,
"maxClusterSize": 0.3,
"preciseDocumentAssignment": true
},
"hierarchy": {
"clusterCountBase": 3
},
"labels": {
"minLabelWords": 2
}
}
}
One can upload these files by himself and use them with other Carrot2 settings.
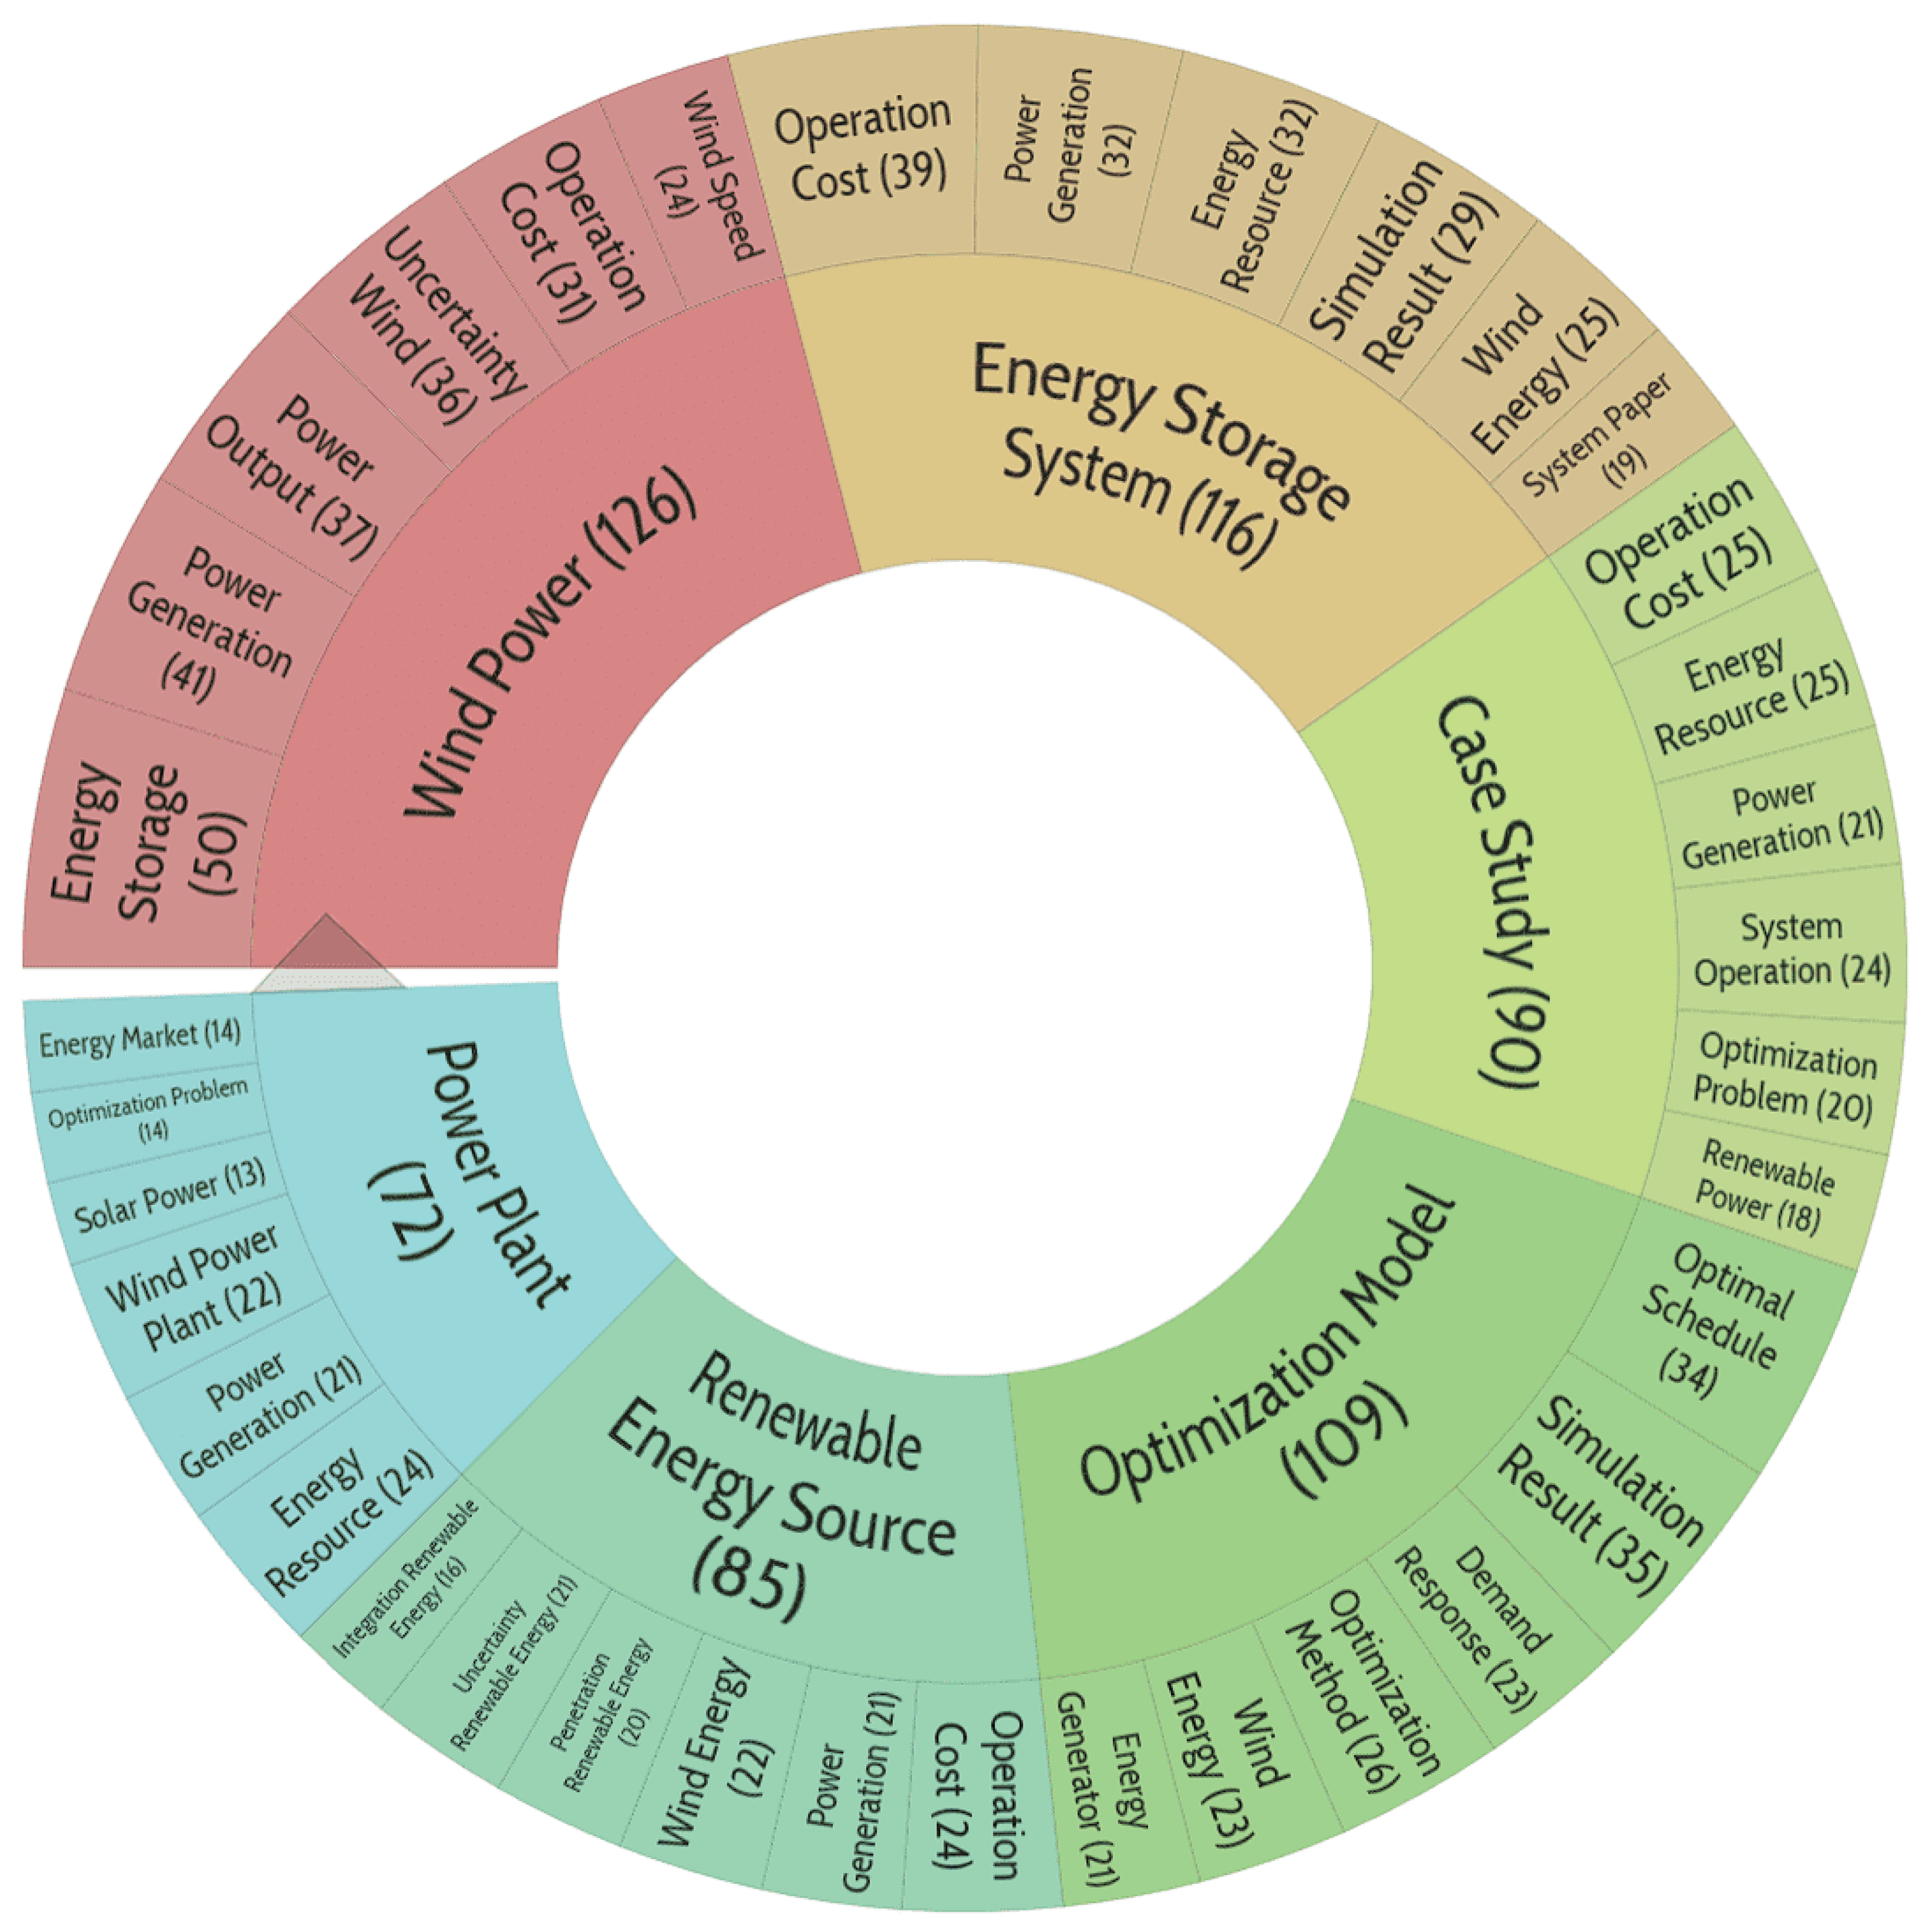
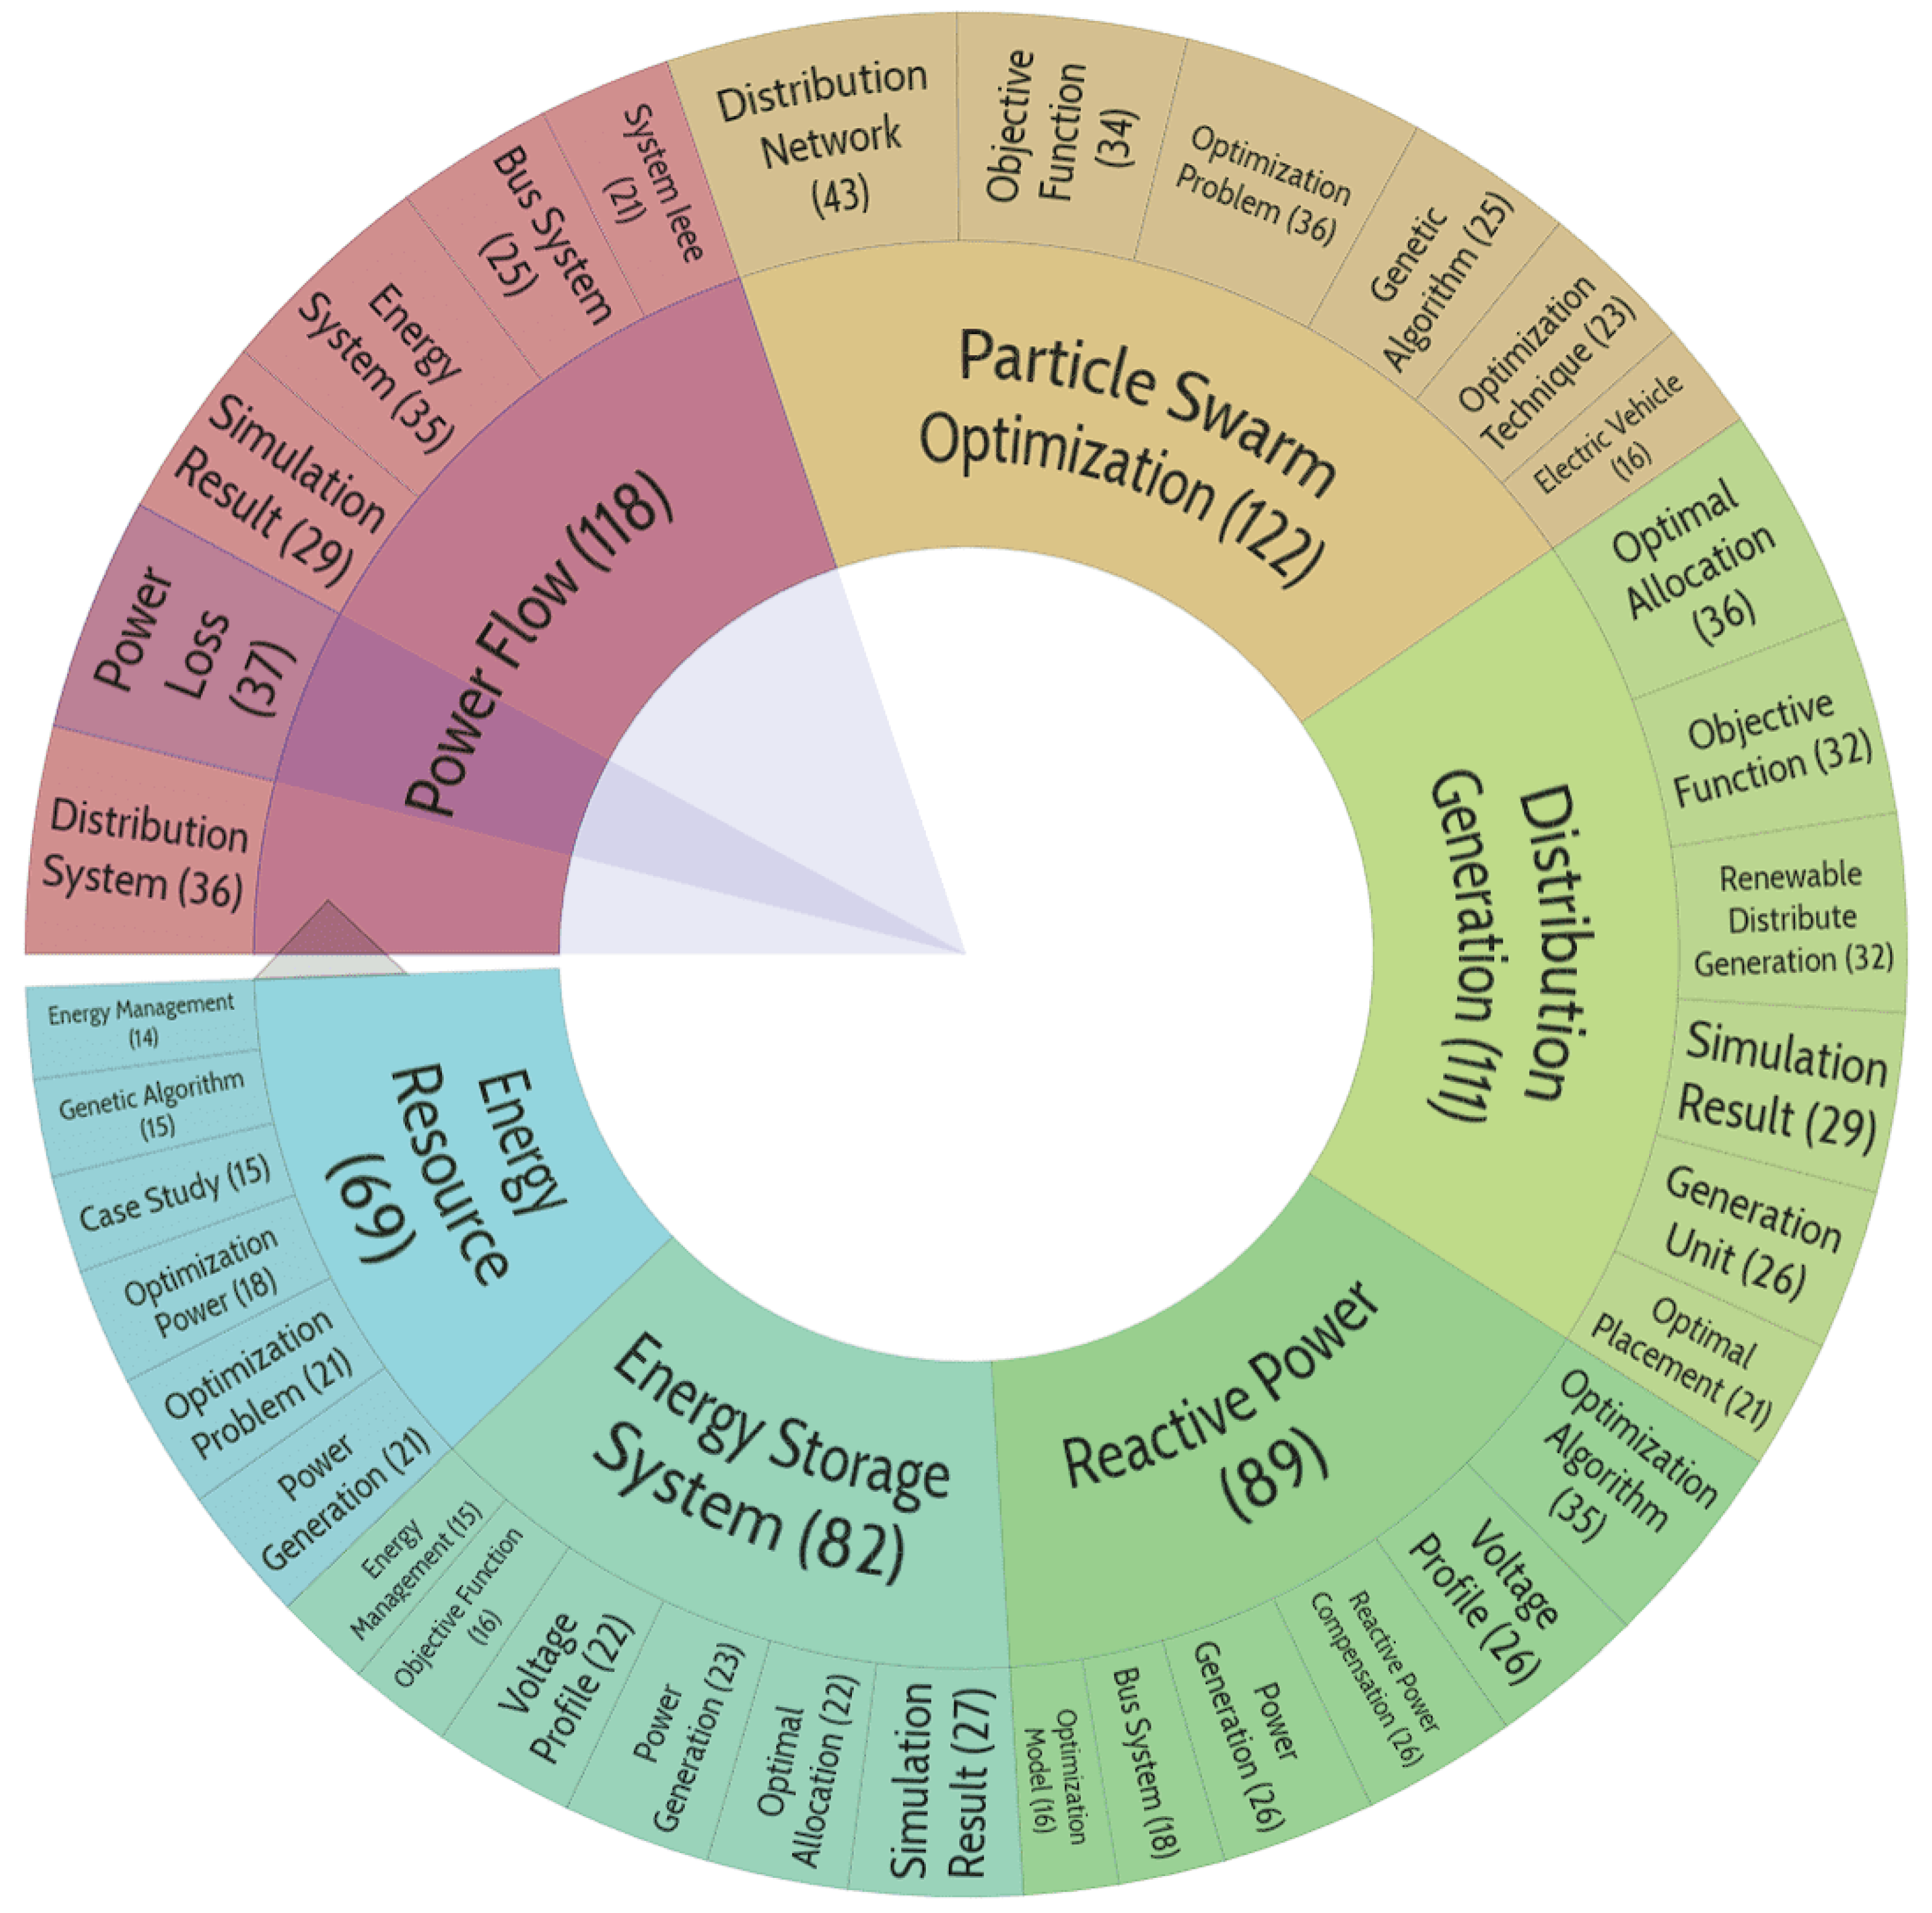
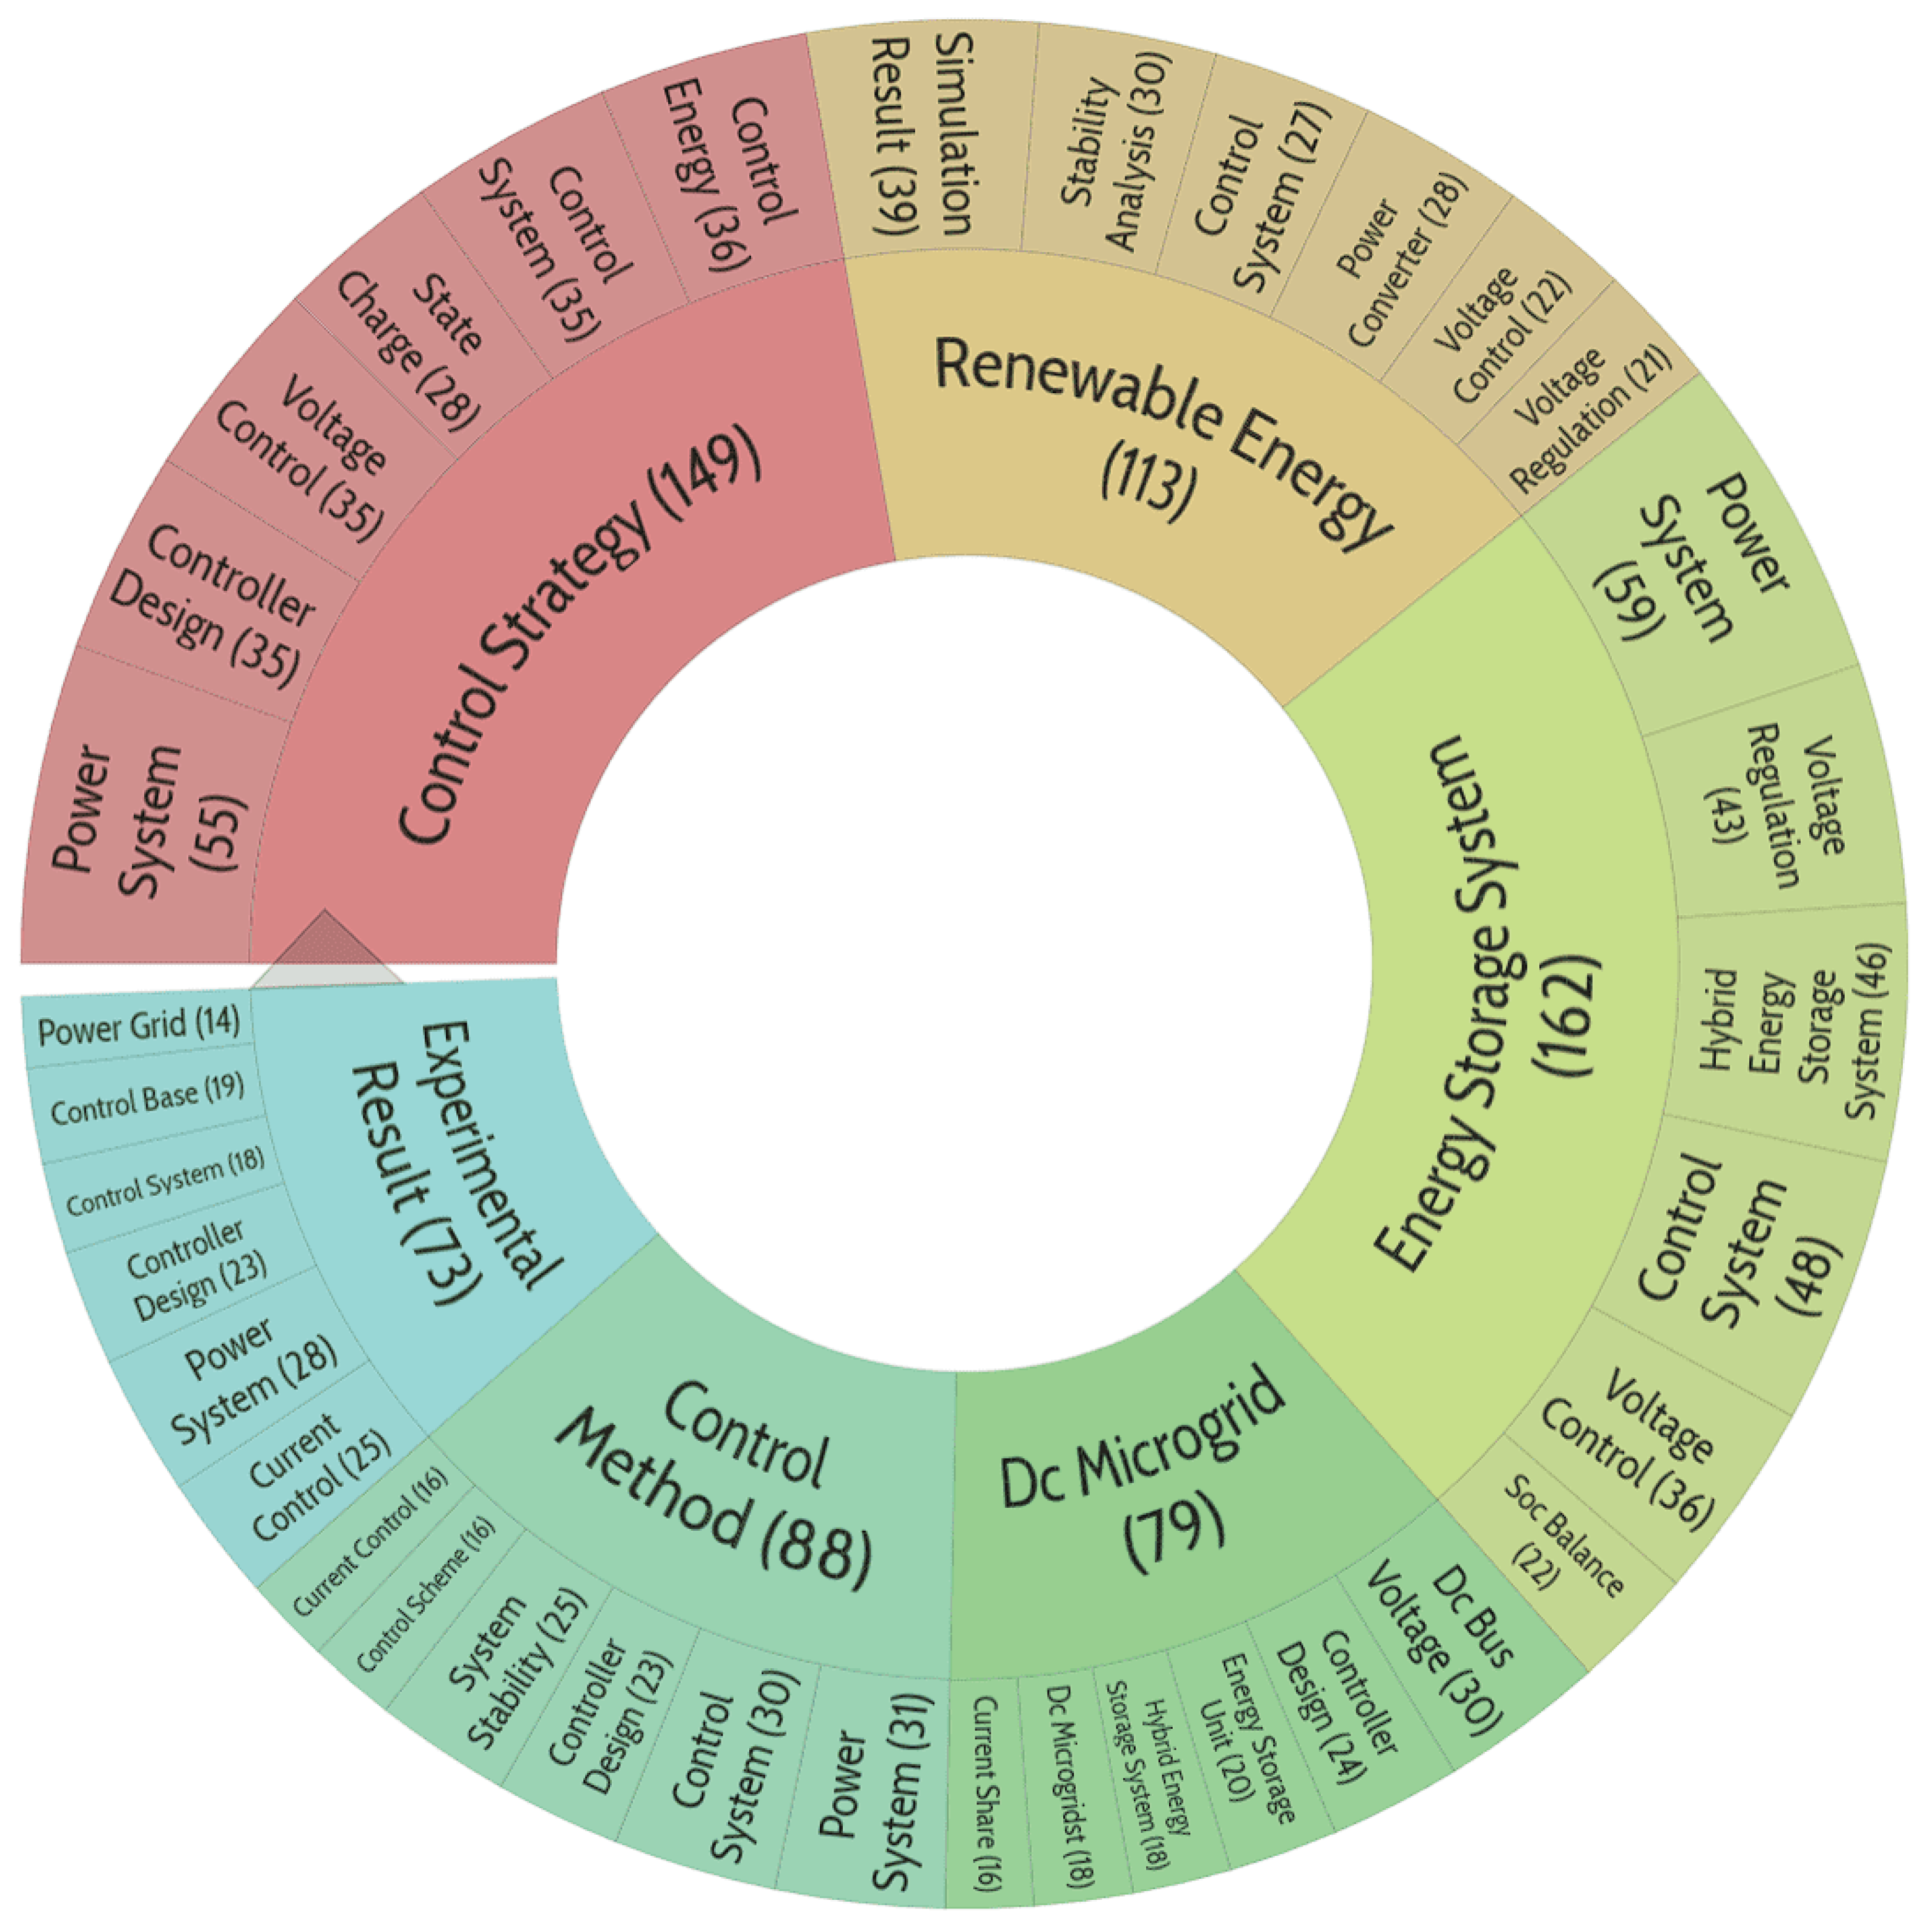
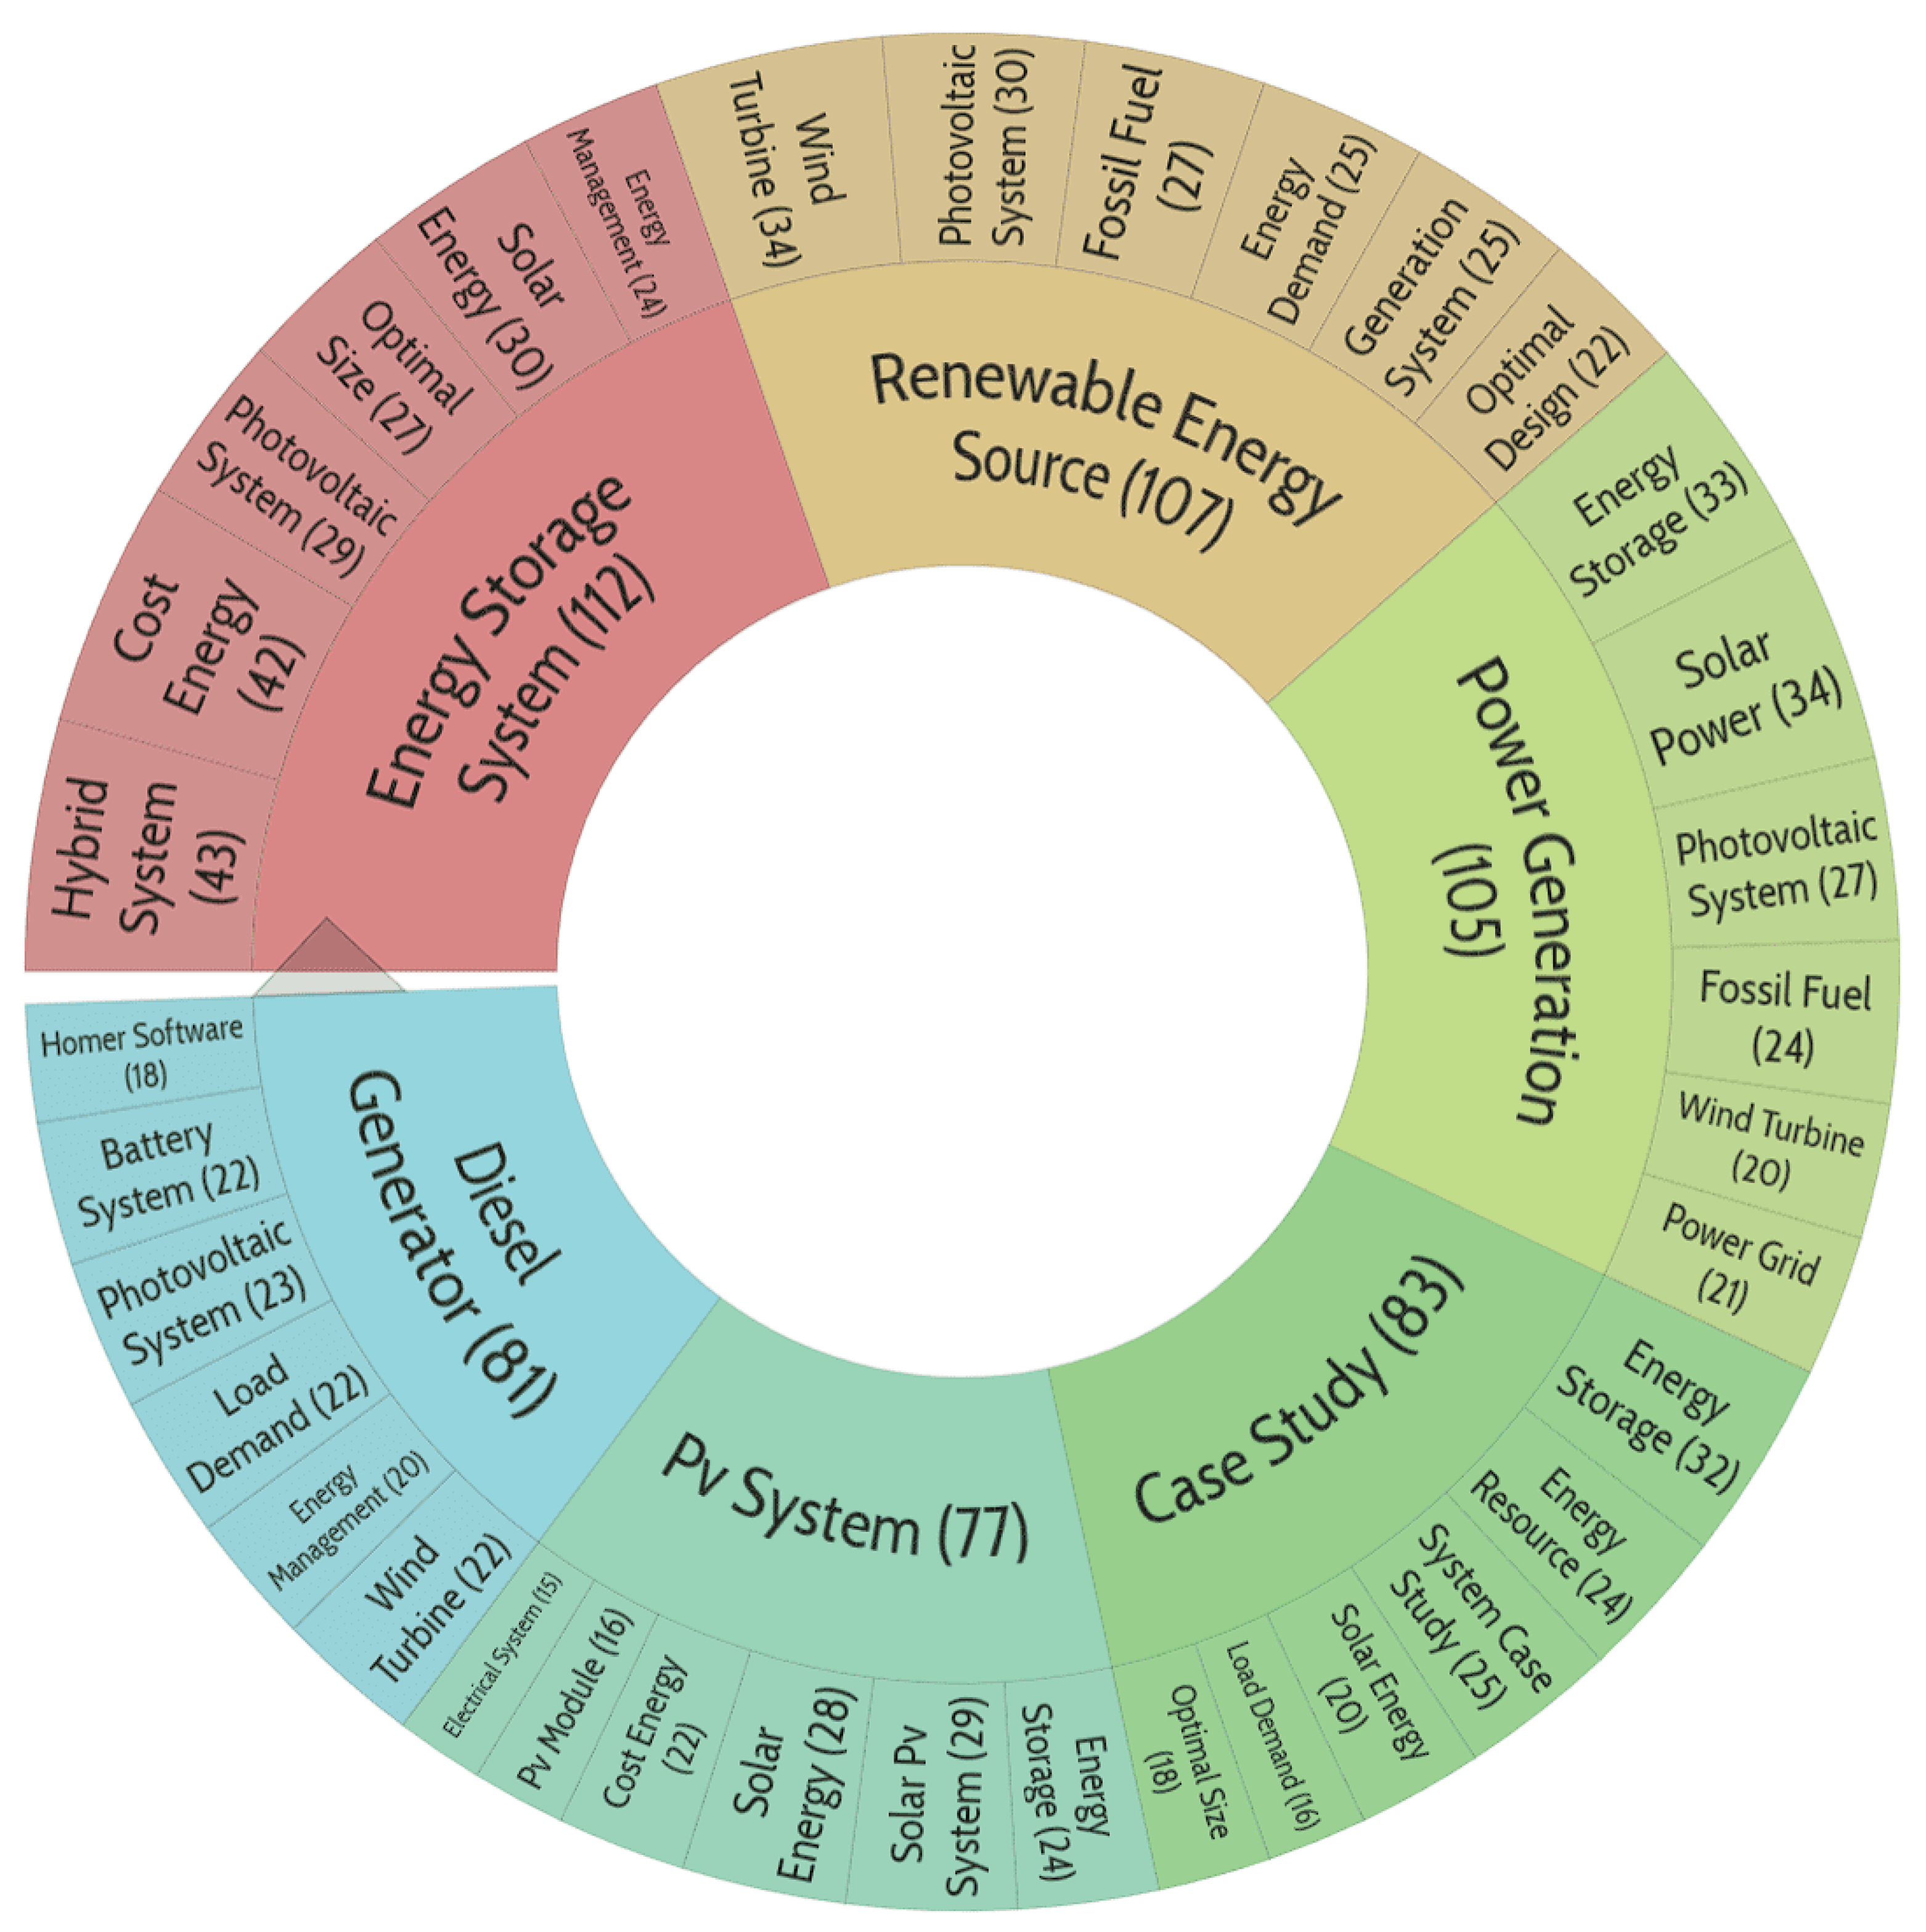
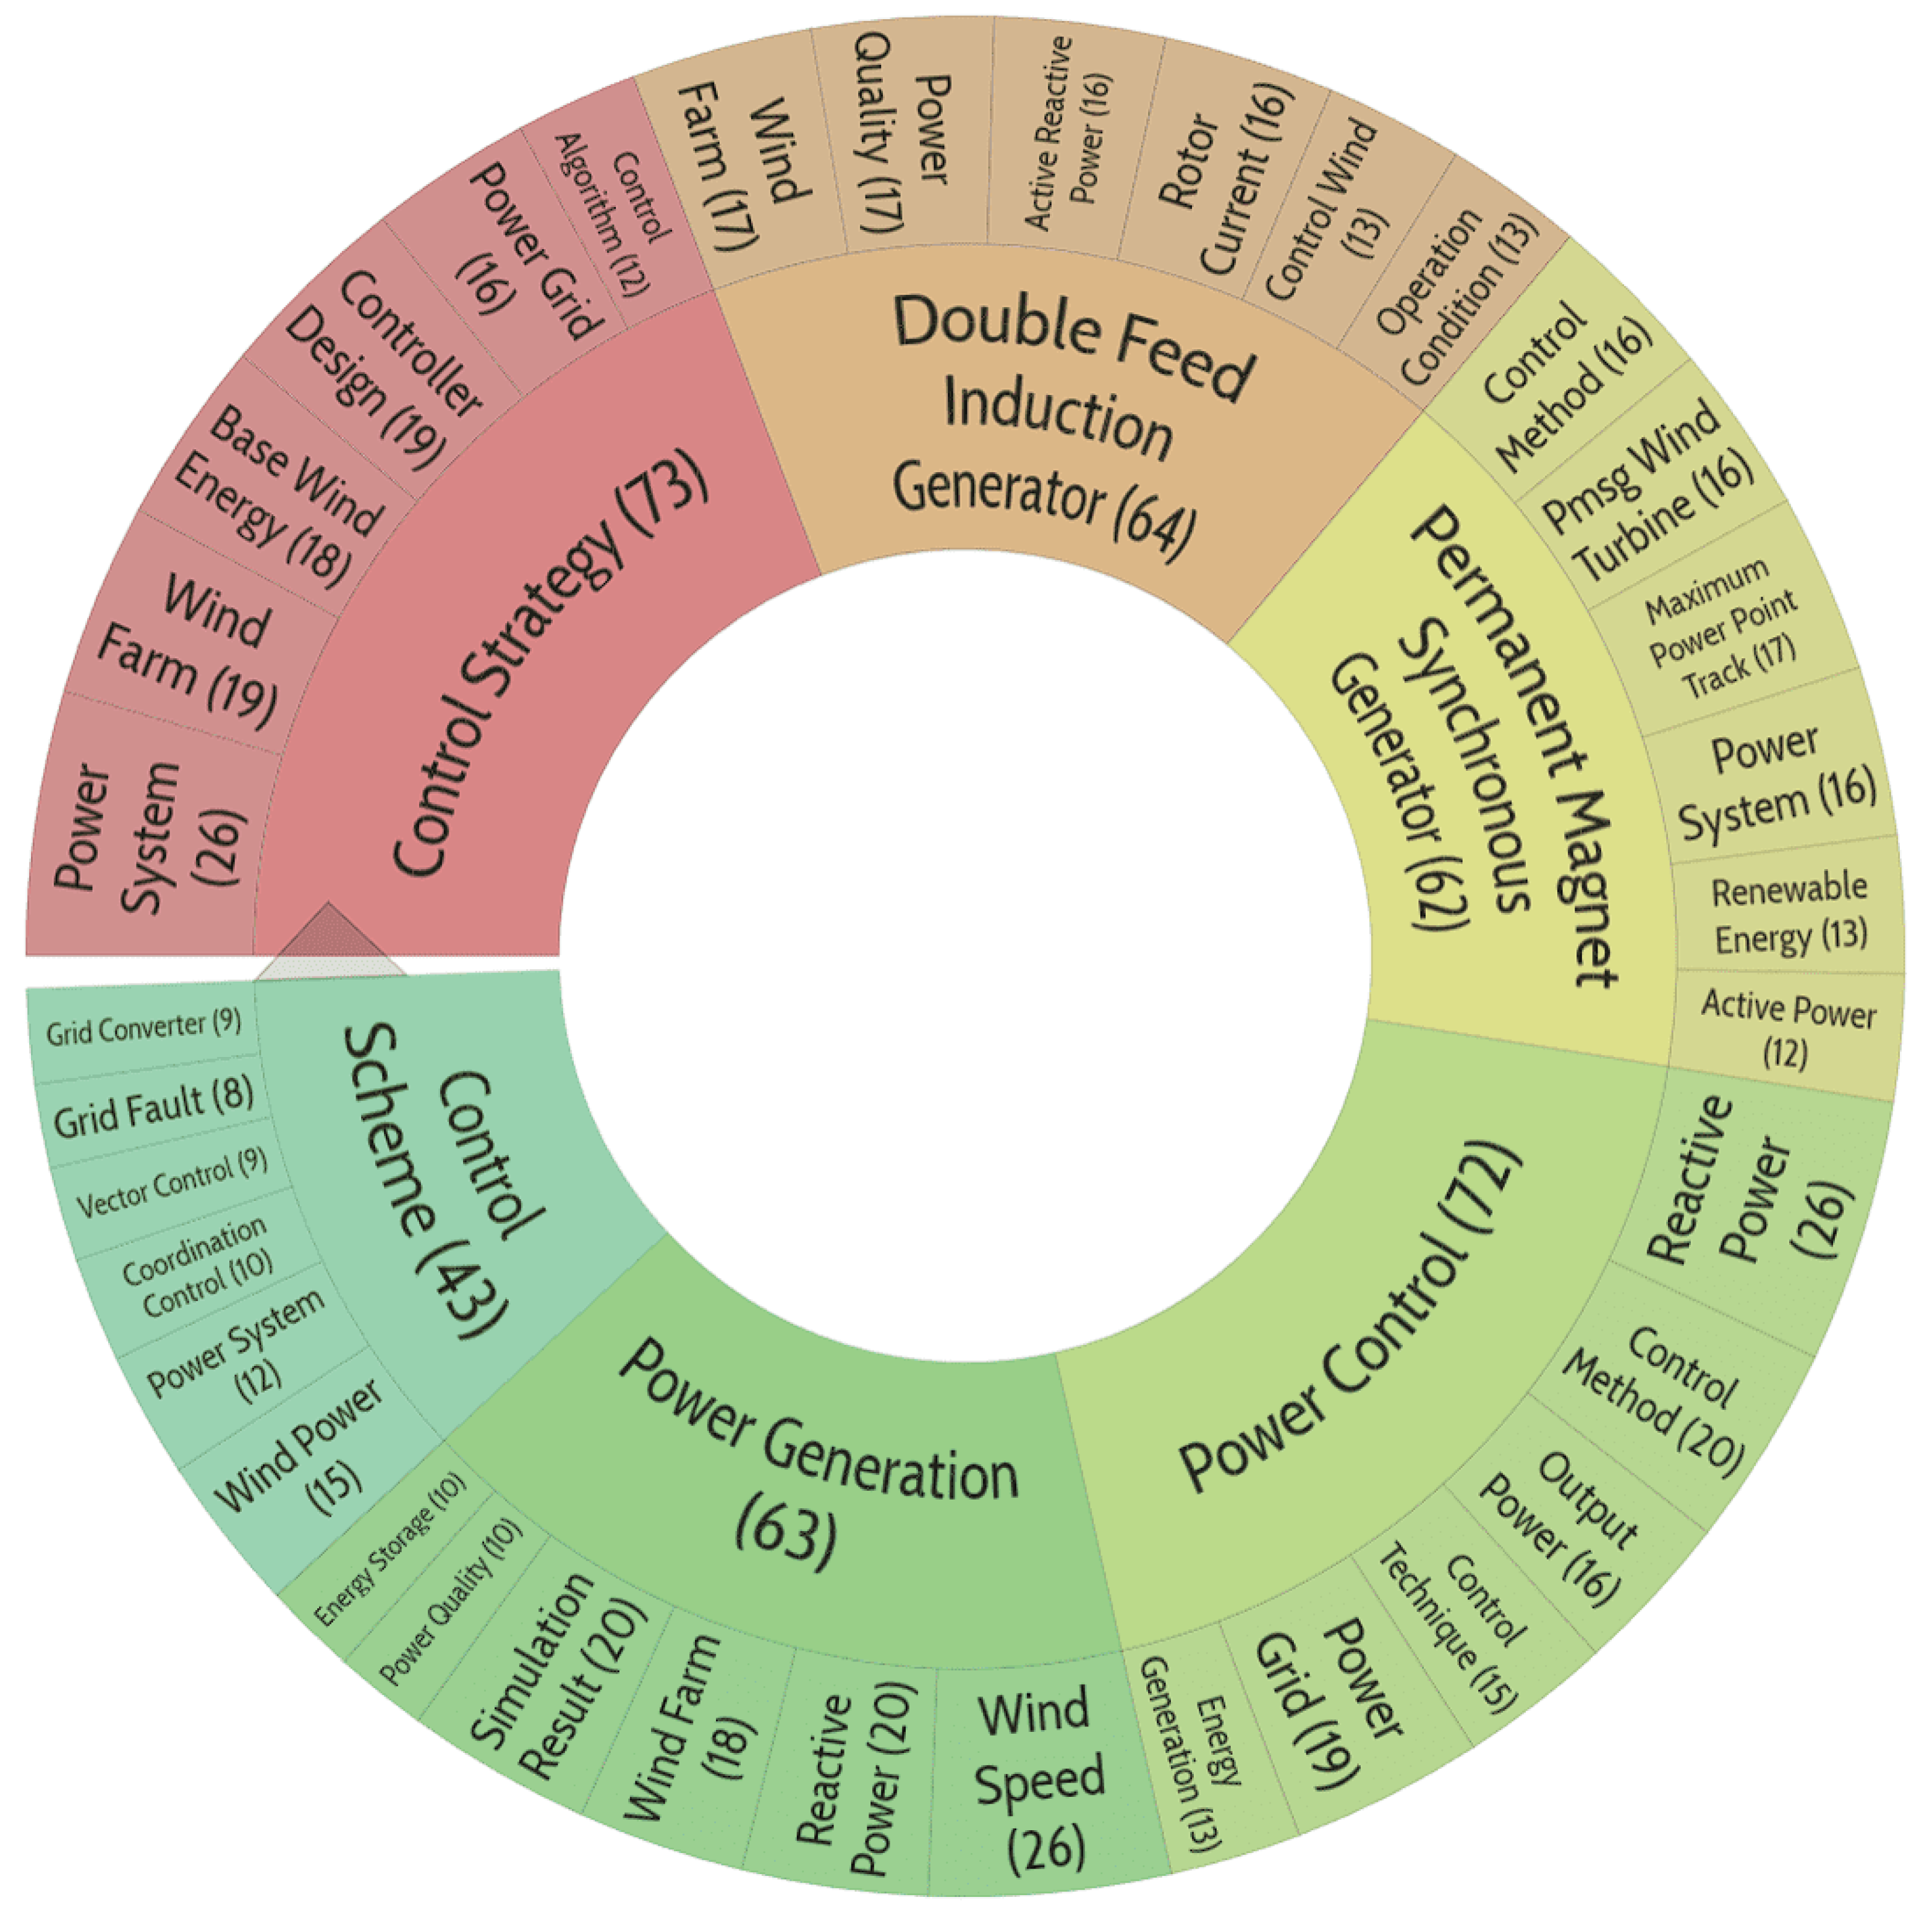
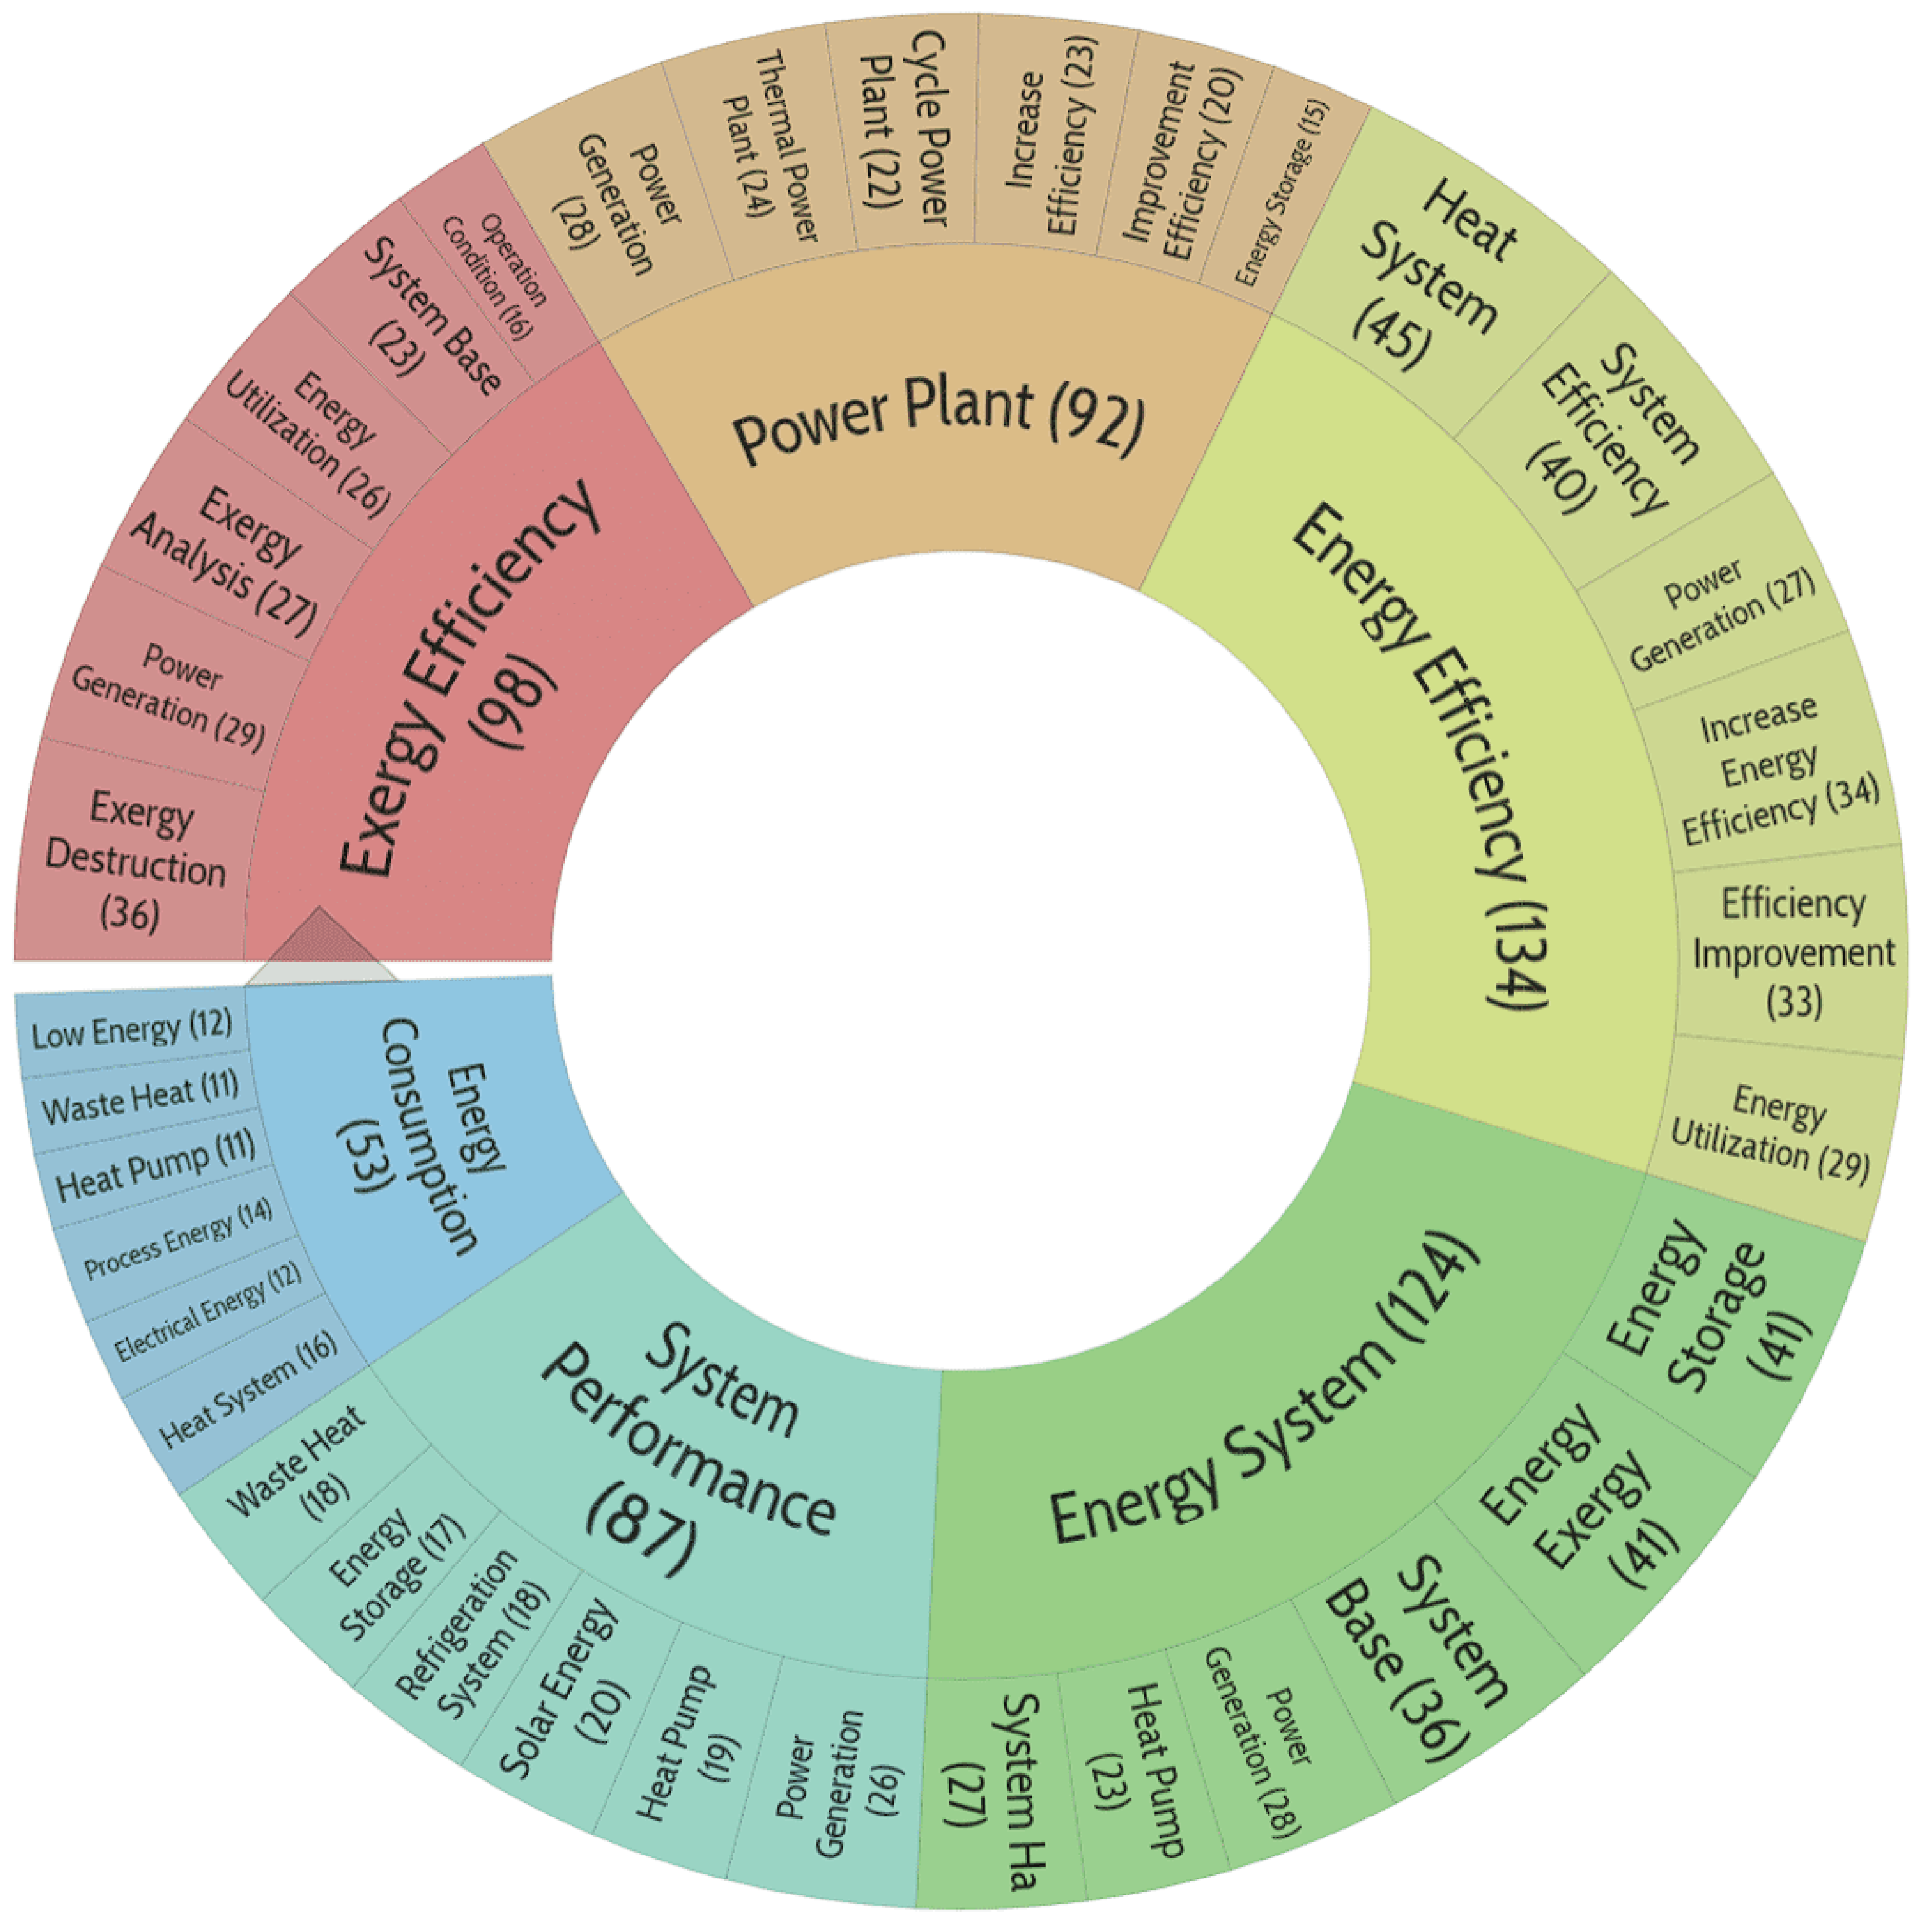
The files 4_Carrot2_cl_0.png ... 4_Carrot2_cl_11.png, shown in
Figure 5,
Figure 6,
Figure 7,
Figure 8,
Figure 9,
Figure 10,
Figure 11,
Figure 12,
Figure 13 and
Figure 14, were exported from Carrot2 and edited slightly to reduce their size.
The files: ‘Clustering App_clustering_data (cl_0 10-3-10.txt ... cl_11 10-3-10).txt’ exported from
https://ml-clustering.ew.r.appspot.com/, pulled from the same files 4_Carrot2_cl_0.csv ... 4_Carrot2_cl_11.csv. Links to the files are given before each picture from Carrot2.
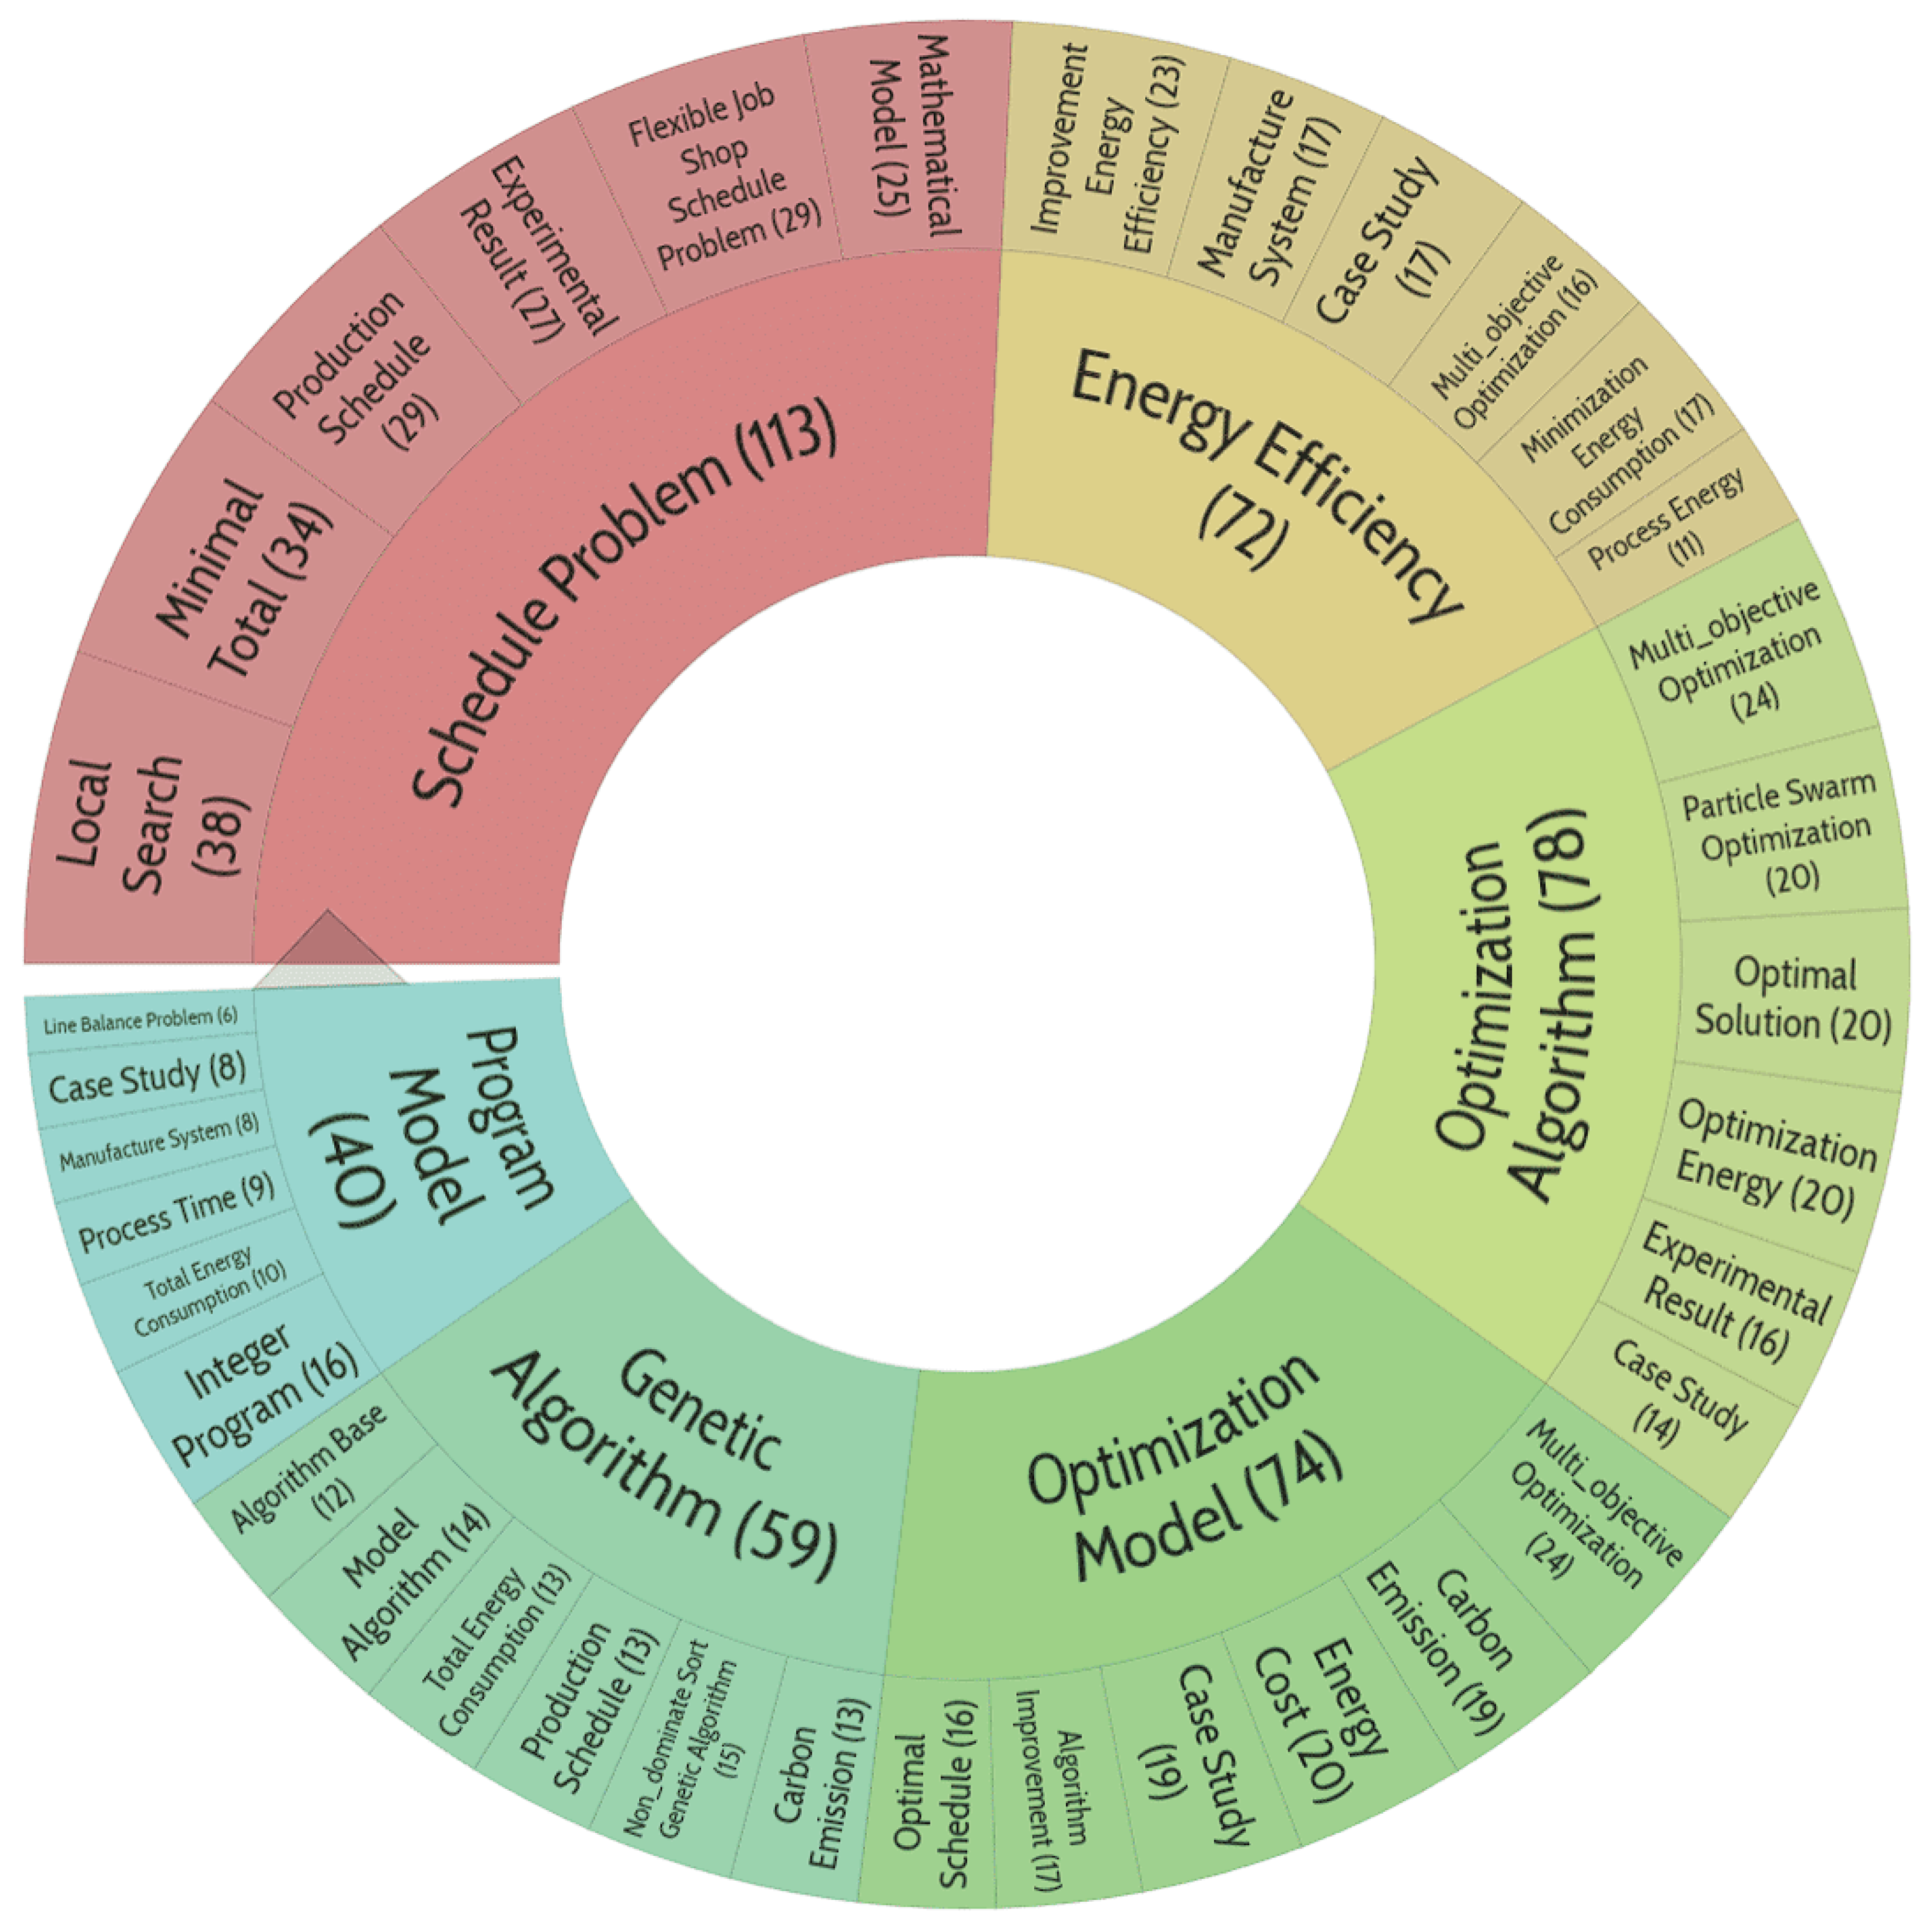
Cluster 0.
‘4_Carrot2_cl_0.csv’, ‘Clustering App_clustering_data (cl_0 10-3-10).txt’
Publications in this cluster mostly focus on optimization issues and algorithms of its implementation, particularly for scheduling problems.
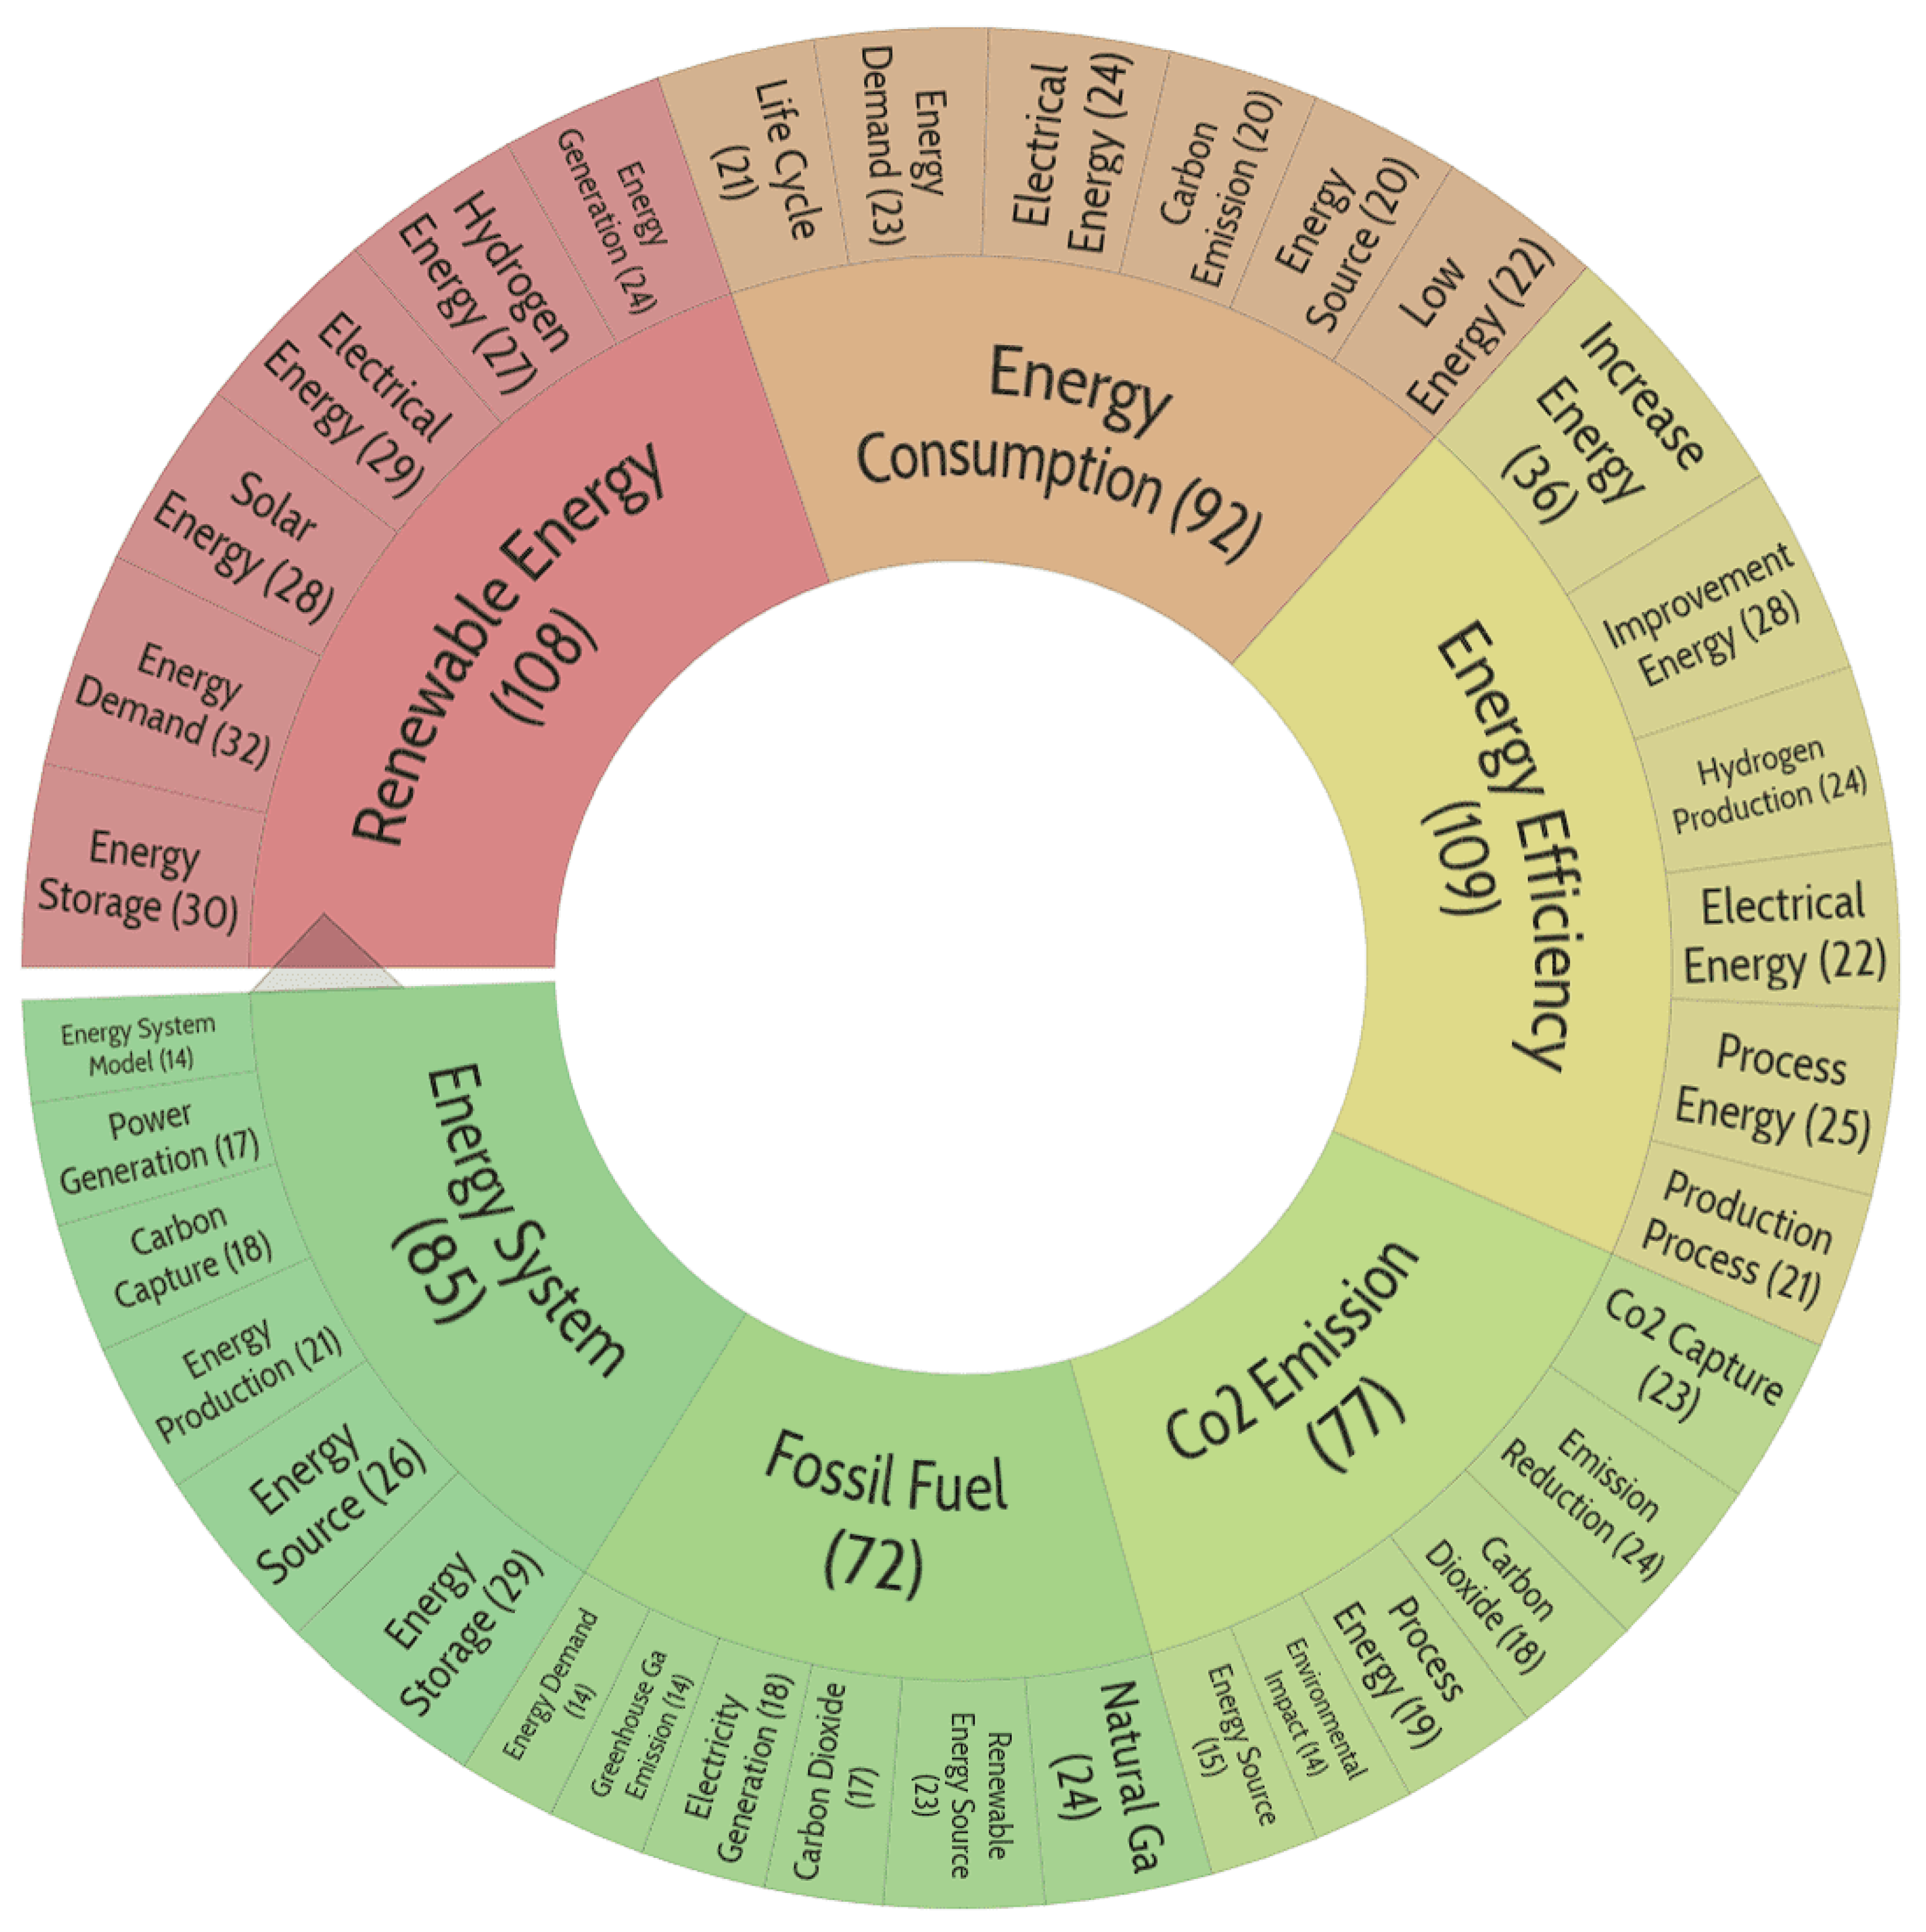
Cluster 1
‘4_Carrot2_cl_1.csv’, ‘Clustering App_clustering_data (cl_1 10-3-10).txt’
The theme "Renewable Energy → Energy Consumption → Energy Systems → CO2 Emissions → Fossil Fuels" can be seen as a cross-cutting subject for the promoted energy transition program.
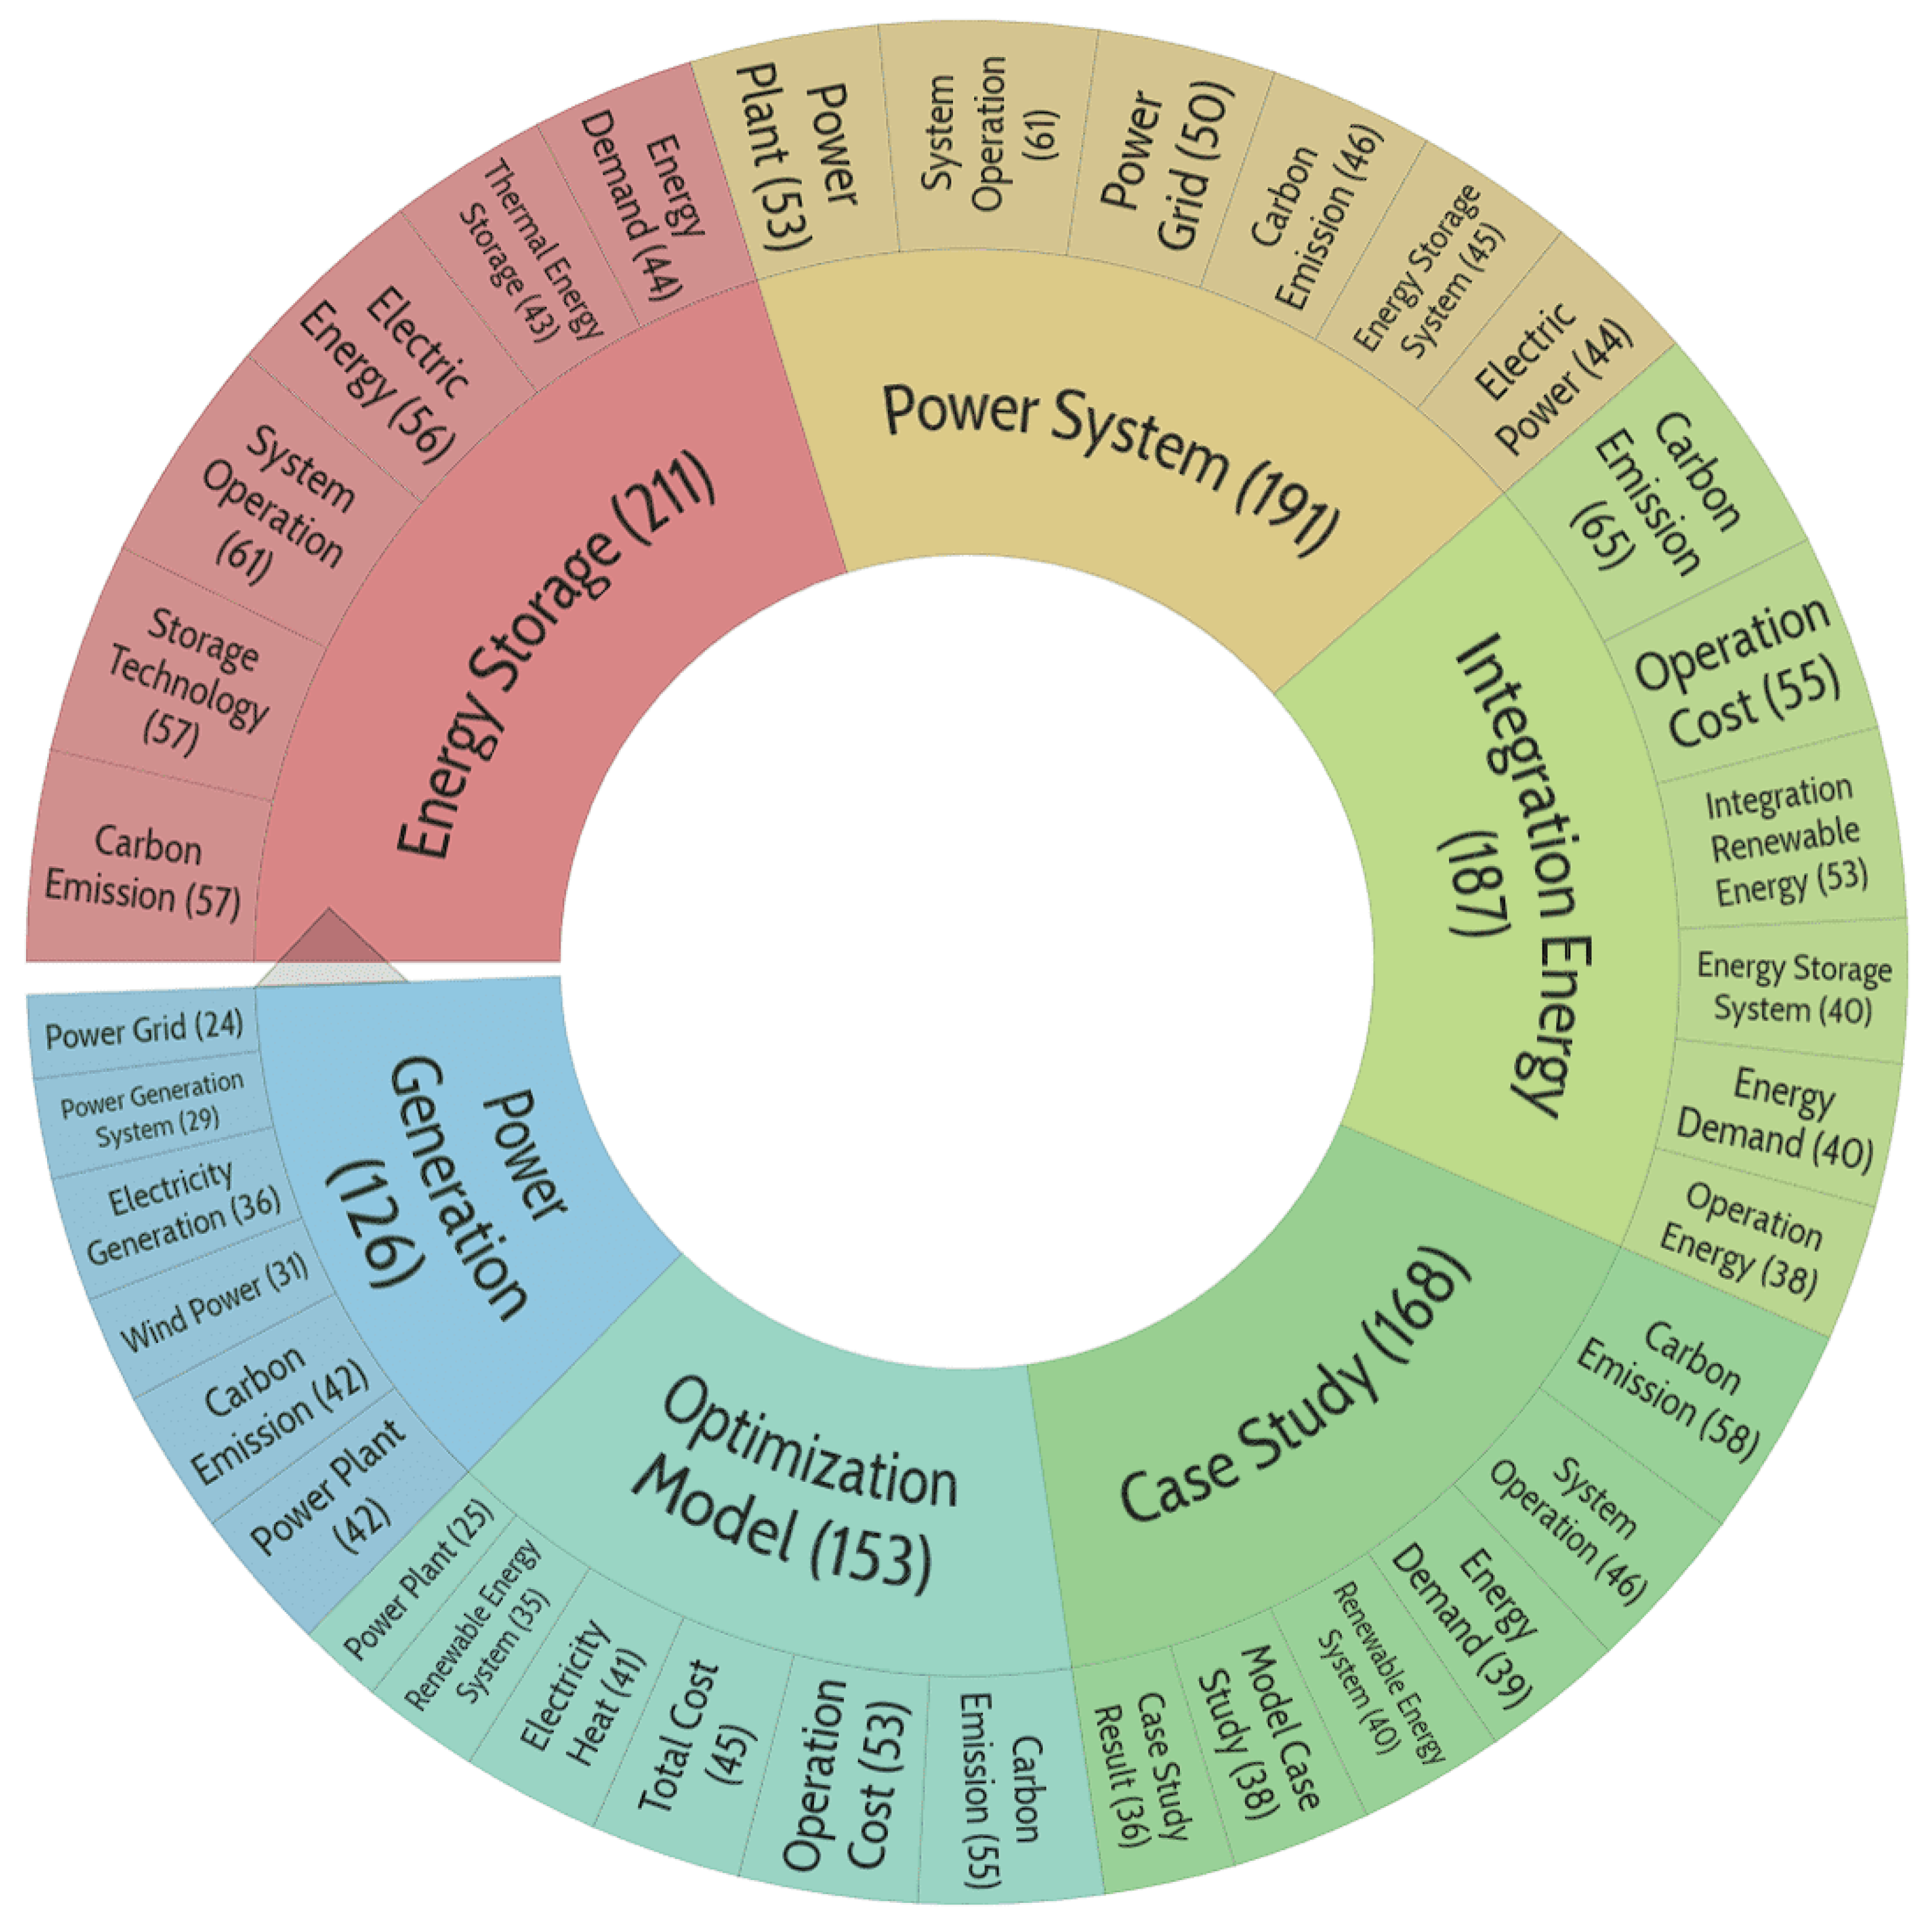
Cluster 2
‘4_Carrot2_cl_2.csv’, ‘Clustering App_clustering_data (cl_2 10-3-10).txt’
Energy storage issues for power systems become particularly important when renewable sources are added to the system, increasing its complexity. Optimization models and implementation examples are therefore of critical importance.
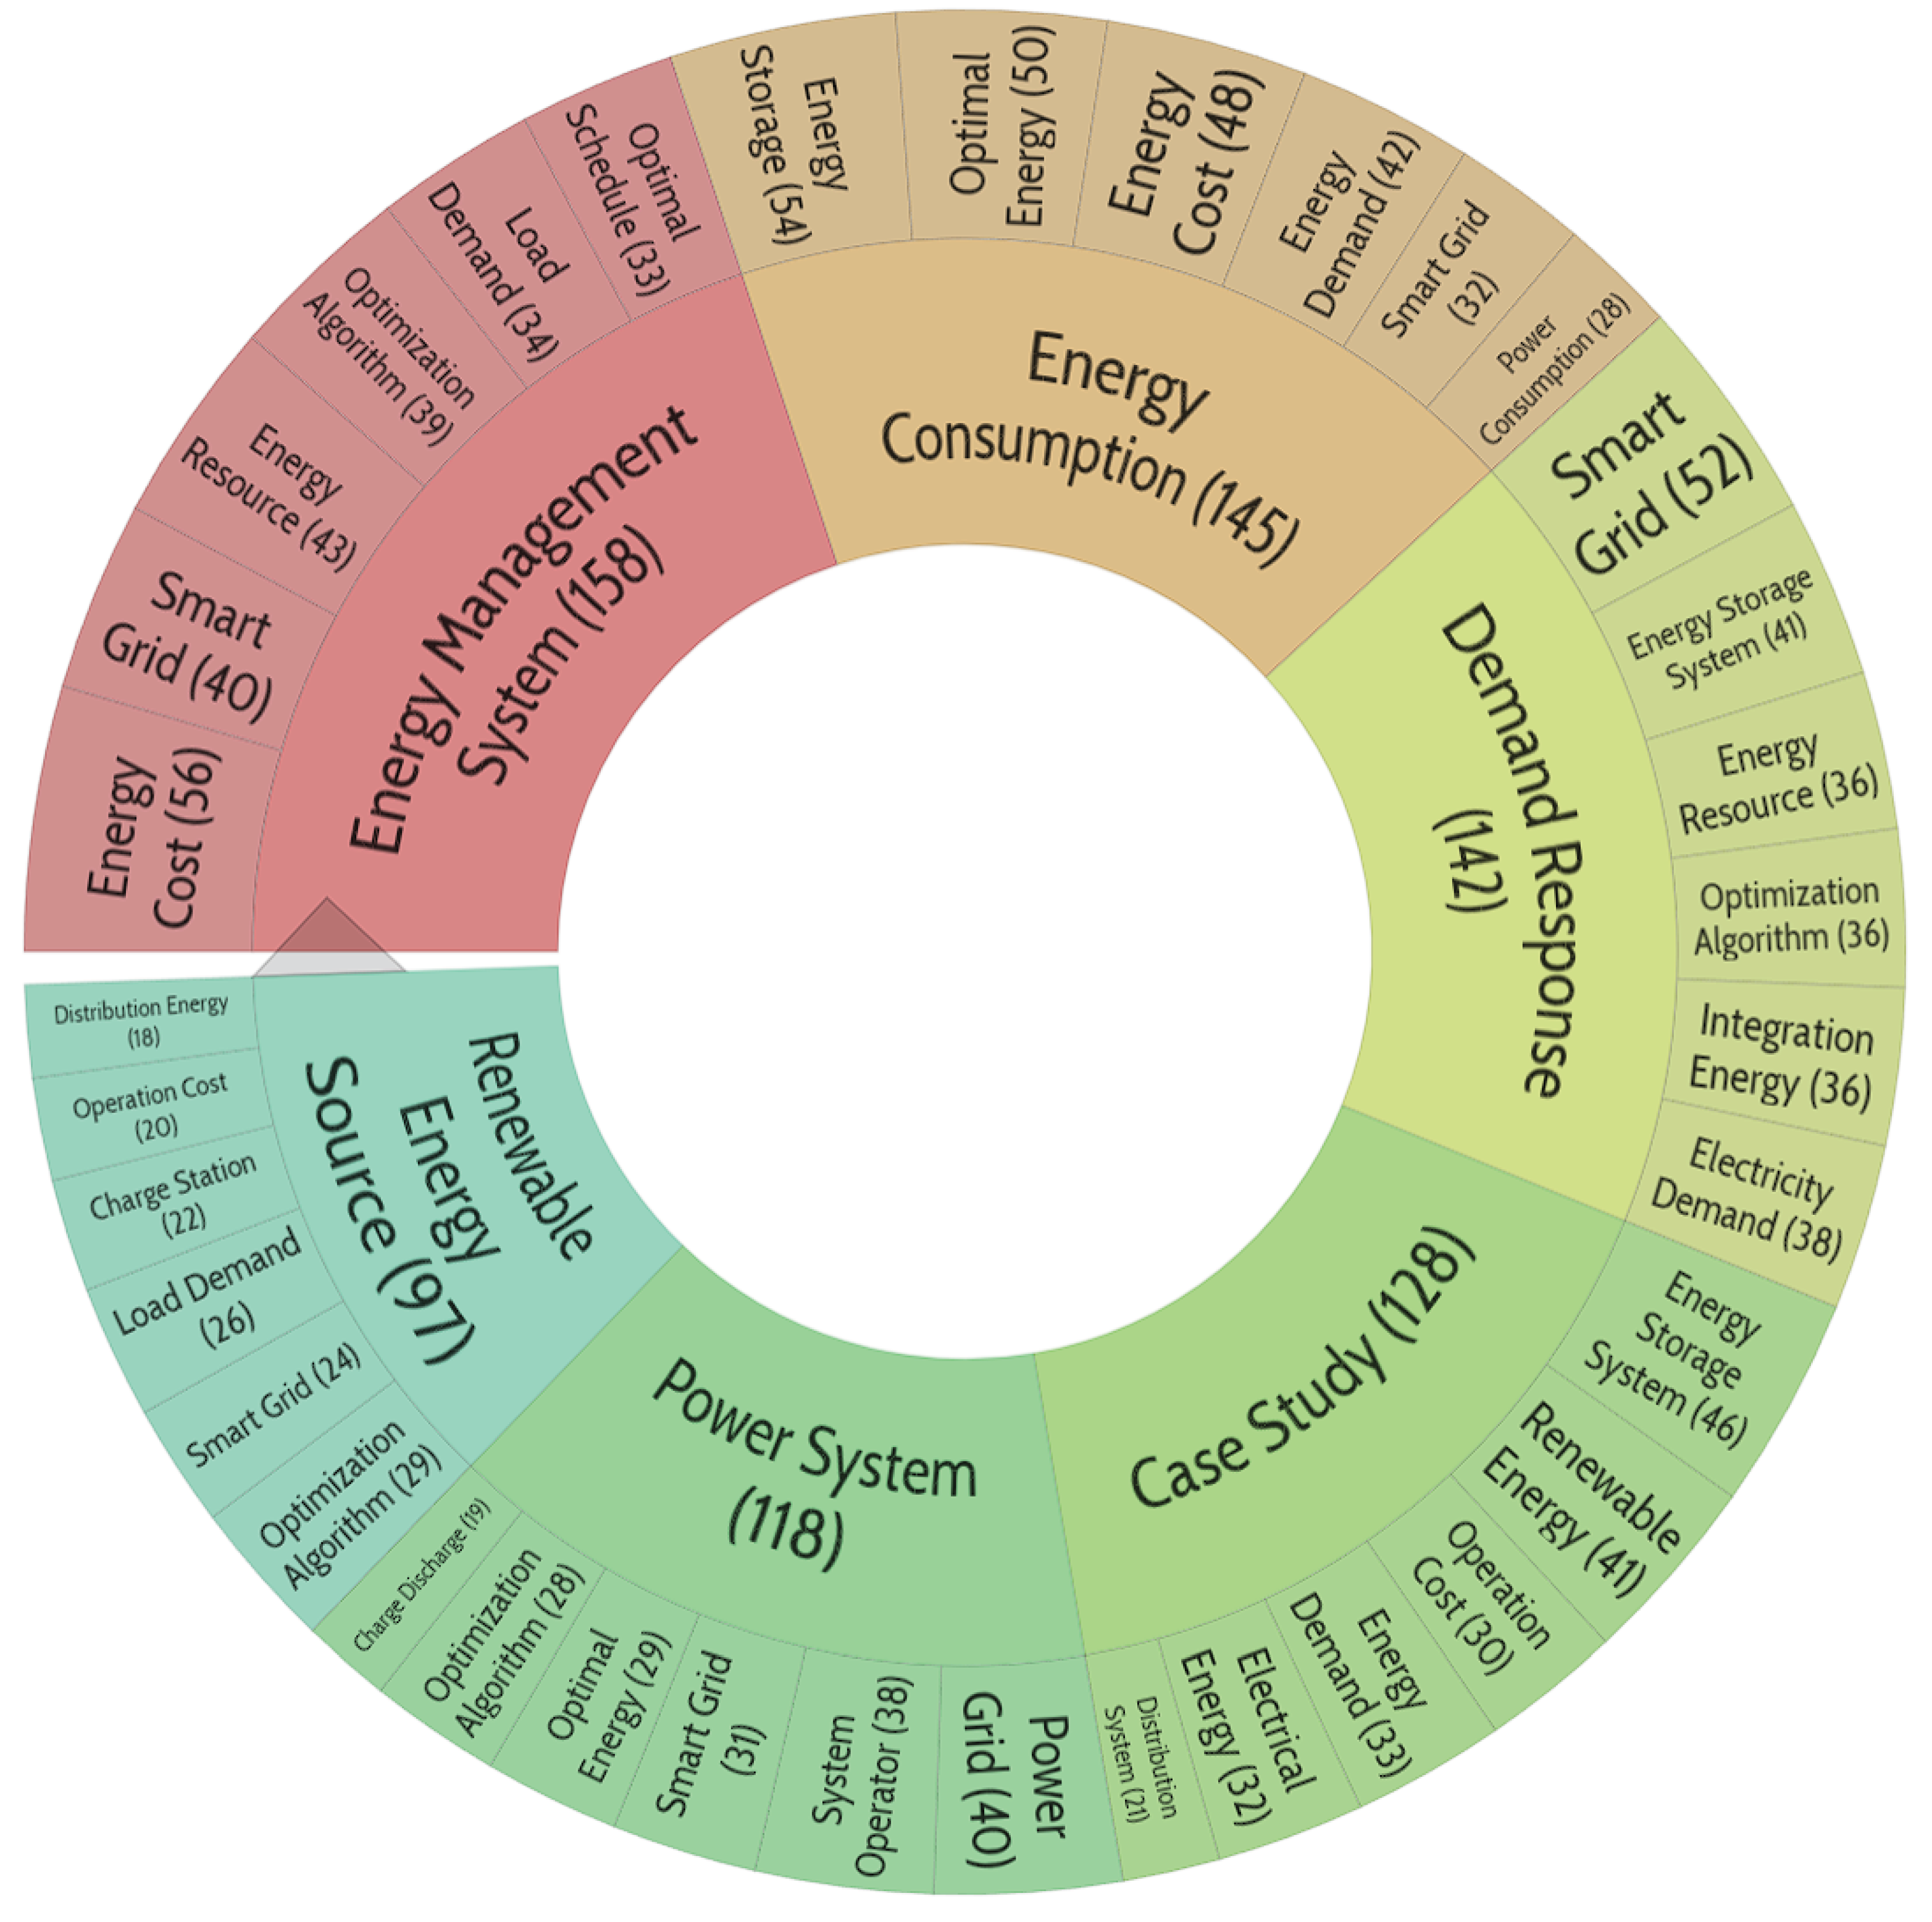
Cluster 3
‘4_Carrot2_cl_3.csv’, ‘Clustering App_clustering_data (cl_3 10-3-10).txt’
The theme of this cluster can be seen as an affirmation of the importance of renewable energy demand management issues.
Cluster 4
‘4_Carrot2_cl_4.csv’, ‘Clustering App_clustering_data (cl_4 10-3-10).txt’
Typical renewable energy issues, largely related to wind generation, are addressed in this case.
Cluster 5
‘4_Carrot2_c5_1.csv’, ‘Clustering App_clustering_data (cl_5 10-3-10).txt’
Particle Swarm Optimization (PSO) is a computational method inspired by social behavior in nature. In the context of power flow allocation, generation and reactive power management, PSO can be used to optimize the use of energy resources, ensuring efficient energy allocation and distribution.
Cluster 6
‘4_Carrot2_c6_1.csv’, ‘Clustering App_clustering_data (cl_6 10-3-10).txt’
A control strategy for renewable systems, energy storage, and DC microgrid involves the implementation of a coordinated and adaptive approach to manage the generation, distribution, and consumption of power — this is the major theme of the publications in this cluster.
Cluster 8
‘4_Carrot2_cl_8.csv’, ‘Clustering App_clustering_data (cl_8 10-3-10).txt’
The topics of publications in this cluster are similar to cluster No. 4, only in this case photovoltaic rather than wind systems are considered.
Cluster 9
‘4_Carrot2_cl_9.csv’, ‘Clustering App_clustering_data (cl_9 10-3-10).txt’
The publications in this cluster address a variety of generating capacity control issues, including those involving Permanent Magnet Synchronous Generators and Doubly-fed Induction Generators.
Note: The term ‘Double Feed Induction Generato’ has been misspelled instead of ‘Doubly Fed Induction Generator’ due to the lemmatization procedure: Doubly→Double, Fed→Feed. The clustering may not have suffered much since the four-word phrase has been retained in the cluster name, but this problem points to the need for a phraseological dictionary on the topic of energy conservation and energy efficiency, the terms of which will not be lemmatized.
Cluster 11
‘4_Carrot2_cl_11.csv’, ‘Clustering App_clustering_data (cl_11 10-3-10).txt’
Energy efficiency of energy systems, including exergy efficiency issues, is the main topic of these publications.
Note: It draws attention to the fact that most of the topical problems considered in the publications of all mentioned clusters are systemic in nature, so it seems appropriate to conduct a separate bibliometric analysis of the research topic "Energy Systems".
The tables and graphs used in this paper are collected in a ZIP archive. The file index.html repeats the text of this paper and contains working links to the used table and graph files.
Conclusion
Scilit, a comprehensive content aggregator platform for scientific publications, provides open access to a large number of bibliometric data on the subject "Energy Efficiency and Energy Conservation".
Data exported from the Scilit platform requires additional preprocessing, which is not difficult to implement.
The prepared data can be used by such widely used programs as VOSviewer, Carrot2, Scimago Graphica and text clustering algorithms GSDMM and NMF to identify relevant topics of publications.
The brief thematic analysis conducted reflected a large number of relevant research tasks, and the background and intermediate data attached to the article allow other researchers to use them to their advantage, for example, when writing analytical reviews on the topic of "Energy Efficiency and Energy Conservation".
The Scilit platform is constantly evolving, for example, Affiliation and Abstract fields are reserved in exported CSV files, which will make Scilit an even more attractive data source for bibliometric research.
The author of this paper suggests that a possible approach that would be valuable to improve the use of Scilit platform data for bibliometric research is to export large volumes of records in their native system format, such as JSON, as is done on The Lens platform. Using a native storage format can reduce the load on the platform associated with reformatting the data and thereby increase the available number of exported records.
References
- Venkatesan, A.; Kim, J.-H.; Talo, F.; Ide-Smith, M.; Gobeill, J.; Carter, J.; et al. SciLite: a platform for displaying text-mined annotations as a means to link research articles with biological data. Wellcome Open Res 2017, 1, 25. [Google Scholar] [CrossRef] [PubMed]
- Venkatesan, A.; Karamanis, N.; Ide-Smith, M.; Hickford, J.; McEntyre, J. Understanding life sciences data curation practices via user research. F1000Res 2019, 8, 1622. [Google Scholar] [CrossRef]
- Solanki, V.K.; Garcia Diaz, V. IJMLNCE Editorial Note Volume No 03, Issue No 03. IJMLNCE 2019, 03, 0–0. [Google Scholar] [CrossRef]
- Van Eck, N.J.; Waltman, L. Software survey: VOSviewer, a computer program for bibliometric mapping. Scientometrics 2010, 84, 523–38. [Google Scholar] [CrossRef] [PubMed]
- Hassan-Montero, Y.; De-Moya-Anegón, F.; Guerrero-Bote, V.P. SCImago Graphica: a new tool for exploring and visually communicating data. EPI 2022, e310502. [Google Scholar] [CrossRef]
Figure 1.
Clustering of keywords based on their co-occurrence.
Figure 1.
Clustering of keywords based on their co-occurrence.
Figure 2.
Occurrence of keywords over time (by date of article publication).
Figure 2.
Occurrence of keywords over time (by date of article publication).
Figure 3.
Average normalized citation rate of publications containing the keyword.
Figure 3.
Average normalized citation rate of publications containing the keyword.
Figure 4.
Graph exported from Scimago Graphica in SVG format, with edited arrangement of inscriptions.
Figure 4.
Graph exported from Scimago Graphica in SVG format, with edited arrangement of inscriptions.
Figure 5.
Distribution of topics of publications included in cluster No. 0.
Figure 5.
Distribution of topics of publications included in cluster No. 0.
Figure 6.
Distribution of topics of publications included in cluster No. 1.
Figure 6.
Distribution of topics of publications included in cluster No. 1.
Figure 7.
Distribution of publication topics included in cluster No. 2.
Figure 7.
Distribution of publication topics included in cluster No. 2.
Figure 8.
Distribution of publication topics included in cluster No. 3.
Figure 8.
Distribution of publication topics included in cluster No. 3.
Figure 9.
Distribution of publication topics included in cluster No. 4.
Figure 9.
Distribution of publication topics included in cluster No. 4.
Figure 10.
Distribution of publication topics included in cluster No. 5.
Figure 10.
Distribution of publication topics included in cluster No. 5.
Figure 11.
Distribution of publication topics included in cluster No. 6.
Figure 11.
Distribution of publication topics included in cluster No. 6.
Figure 12.
Distribution of publication topics included in cluster No. 8.
Figure 12.
Distribution of publication topics included in cluster No. 8.
Figure 13.
Distribution of publication topics included in cluster No. 9.
Figure 13.
Distribution of publication topics included in cluster No. 9.
Figure 14.
Distribution of publication topics included in cluster No. 11.
Figure 14.
Distribution of publication topics included in cluster No. 11.
Table 1.
Top 20 subject by publications.
Table 1.
Top 20 subject by publications.
| Subject |
Publications |
| Industrial Engineering |
29772 |
| Energy and Fuel Technology |
9812 |
| Manufacturing Engineering |
9186 |
| Thermodynamics |
2084 |
| Information and Library Science |
1228 |
| Transportation Science and Technology |
505 |
| Hardware and Architecture |
465 |
| Characterization and Testing of Materials |
248 |
| Operations Research and Management Science |
208 |
| Applied Chemistry |
176 |
| Telecommunications |
153 |
| Automotive Engineering |
137 |
| Computer Science |
119 |
| Coatings and Films |
111 |
| Petroleum Engineering |
102 |
| Environmental Engineering |
84 |
| Industrial Relations |
59 |
| Aerospace Engineering |
52 |
| Computation Theory and Mathematics |
51 |
| Imaging Science |
51 |
Table 2.
20 fields of research whose articles have the highest medial citations.
Table 2.
20 fields of research whose articles have the highest medial citations.
| Subject |
Avg Citations (median) |
| Analytical Chemistry |
24 |
| Geological Engineering |
23 |
| Metallurgy and Metallurgical Engineering |
21 |
| Environmental Studies |
12 |
| Environmental Sciences |
10.5 |
| Paper and Wood |
9.5 |
| Crystallography |
9 |
| Chemical Engineering |
8 |
| Thermodynamics |
8 |
| Petroleum Engineering |
6.5 |
| Applied Chemistry |
6 |
| Asian Studies |
6 |
| Automotive Engineering |
6 |
| Microscopic Research |
6 |
| Atomic, Molecular and Chemical Physics |
5.5 |
| Energy and Fuel Technology |
5.34 |
| Polymer Science |
5 |
| Optics |
4.5 |
| Artificial Intelligence |
4 |
| Information Systems |
4 |
Table 3.
20 Publishers with the largest number of publications on the topic under review.
Table 3.
20 Publishers with the largest number of publications on the topic under review.
| Publisher |
Publications |
| MDPI AG |
12978 |
| Institute of Electrical and Electronics Engineers (IEEE) |
9067 |
| Elsevier BV |
5088 |
| Springer Science and Business Media LLC |
4580 |
| Hindawi Limited |
1641 |
| Emerald |
1091 |
| American Chemical Society (ACS) |
977 |
| Frontiers Media SA |
873 |
| Taylor & Francis Ltd |
765 |
| Wiley |
570 |
| ASME International |
550 |
| The Electrochemical Society |
518 |
| Computers, Materials and Continua (Tech Science Press) |
350 |
| Pleiades Publishing Ltd |
291 |
| Trans Tech Publications, Ltd. |
277 |
| Royal Society of Chemistry (RSC) |
264 |
| Walter de Gruyter GmbH |
184 |
| Allerton Press |
169 |
| SAGE Publications |
169 |
| IOP Publishing |
160 |
Table 4.
20 journals with the largest number of publications on the topic under review.
Table 4.
20 journals with the largest number of publications on the topic under review.
| Source Title |
Publications |
| Energies |
3912 |
| IEEE Access |
1842 |
| Sustainability |
1200 |
| Applied Sciences |
942 |
| Materials |
917 |
| Sensors |
783 |
| Electronics |
707 |
| Frontiers in Energy Research |
645 |
| Metals |
566 |
| IEEE Internet of Things Journal |
498 |
| IEEE Transactions on Smart Grid |
459 |
| IEEE Transactions on Power Systems |
438 |
| IEEE Transactions on Industry Applications |
425 |
| Processes |
406 |
| Applied Energy |
373 |
| Energy |
370 |
| IEEE Transactions on Power Electronics |
369 |
| ACS Applied Materials & Interfaces |
334 |
| ECS Meeting Abstracts |
331 |
| Fuel |
319 |
Table 5.
20 Institutes with the largest number of publications on the topic under review.
Table 5.
20 Institutes with the largest number of publications on the topic under review.
| Institute |
Publications |
| Tsinghua University |
600 |
| Xi'an Jiaotong University |
498 |
| North China Electric Power University |
451 |
| Zhejiang University |
450 |
| Huazhong University of Science and Technology |
402 |
| Southeast University |
394 |
| Northeastern University |
381 |
| Chongqing University |
374 |
| Harbin Institute of Technology |
374 |
| Shanghai Jiao Tong University |
358 |
| Tianjin University |
342 |
| Beijing Institute of Technology |
317 |
| Aalborg University |
310 |
| Shandong University |
309 |
| Hunan University |
242 |
| University of Electronic Science and Technology of China |
238 |
| Nanyang Technological University |
232 |
| Northwestern Polytechnical University |
232 |
| South China University of Technology |
231 |
| Nanjing University of Aeronautics and Astronautics |
229 |
|
Disclaimer/Publisher’s Note: The statements, opinions and data contained in all publications are solely those of the individual author(s) and contributor(s) and not of MDPI and/or the editor(s). MDPI and/or the editor(s) disclaim responsibility for any injury to people or property resulting from any ideas, methods, instructions or products referred to in the content. |
© 2024 by the authors. Licensee MDPI, Basel, Switzerland. This article is an open access article distributed under the terms and conditions of the Creative Commons Attribution (CC BY) license (http://creativecommons.org/licenses/by/4.0/).
