Preprint
Article

Application of the HILIC-MS Novel Protocol to Study the Metabolic Heterogeneity of Glioblastoma Cells

Altmetrics

Downloads

170

Views

83

Comments

0

A peer-reviewed article of this preprint also exists.

Submitted:

09 April 2024

Posted:

11 April 2024

You are already at the latest version

Alerts
Abstract
Glioblastoma is a highly malignant brain tumor consisting of heterogeneous cellular population. The transformed metabolism of glioblastoma cells supports their growth and division on the background of their milieu. One might hypothesize that the transformed metabolism of a primary glioblastoma could be well adapted to limitations in the variety and number of substrates imported into the brain parenchyma and present it their microenvironment. Additionally, the phenotypic heterogeneity of cancer cells could promote the variations among their metabolic capabilities regarding the utilization of available substrates and release of metabolic intermediates. With the aim to identify the putative metabolic footprint of different types of glioblastoma cells, we exploited the possibility for separation of polar and ionic molecules present in culture media or cell lysates by hydrophilic interaction liquid chromatography (HILIC). The mass spectrometry (MS) was then used to identify and quantify the eluted compounds. The introduced method allows the detection and quantification of more than 150 polar and ionic metabolites in single run, those may be present either in culture media or cell lysates and provide data for polaromic studies within metabolomics. The method was applied to analyze the culture media and cell lysates derived from two types of glioblastoma cells, T98G and U118. The analysis revealed that even the both types of glioblastoma cells share several common metabolic aspects, they also exhibit differences in their metabolic capability. This finding agrees with the hypothesis about metabolic heterogeneity of glioblastoma cells. Furthermore, the combination of both analytical methods, HILIC-MS, provides a valuable tool for metabolomic studies based on the simultaneous identification and quantification of a wide range of polar and ionic metabolites - polaromics.
Keywords: 
Subject: Biology and Life Sciences  -   Biochemistry and Molecular Biology

1. Introduction

Glioblastoma is a highly malignant brain tumor that is characterized by its invasive growth and resistance to current therapies [1,2]. Metabolomics, the study of small molecule metabolites in biological systems, has emerged as a powerful tool for understanding the metabolic alterations in glioblastoma cells and identifying potential therapeutic targets. Studies in metabolomics, including those focusing on glioblastoma, have identified several altered or dysregulated metabolic pathways in comparison to healthy cells [3,4,5,6,7,8]. Examples of these alterations include changes in glucose and amino acid metabolism. Glioblastoma cells have been shown to rely on glucose and several amino acids to support their high energy demands [9,10,11,12,13,14], as well as to utilize their carbon skeletons for anabolic processes such as lipid [15,16] and nucleotide synthesis [17]. Despite the genetic and cellular heterogeneity observed in glioblastoma cells within tumor [4], as well as heterogeneity in their metabolism [18,19,20], targeting metabolic pathways has emerged as a promising therapeutic strategy. Therefore, further studies focusing on and revealing the metabolic aspects of cancer cells could provide the valuable knowledge.
Recent methodological approaches capitalize on advanced analytical techniques and methods capable of sensitive, comprehensive, and robust analysis. In this regard, liquid chromatography (LC) is a state-of-the-art analytical technique used for the separation, purification, or concentration of compounds from complex mixtures [21]. Chromatographic retention of molecules is based on differences in their physical and chemical properties, such as polarity and solubility. The majority of LC applications currently exploit reliable and reproducible separation of non-polar compounds through reversed-phase LC [22]. However, since a significant part of metabolites bear polar or ionic group, their separation by reversed-phase liquid chromatography often requires chemical modification through derivatization or relies on ion pairing [23,24]. Therefore, it seems to be demanding to introduce more simple methods for the separation of polar and ionic compounds by LC without prior derivatization, if possible.
Indeed, recent focus on the practical application of polar and ionic resins as the stationary phase has allowed for more effective separation of polar and ionic metabolites [25]. In this respect, hydrophilic interaction chromatography (HILIC) has become more widely used in metabolic studies, due to its capability to separate polar and ionic compounds such as amino acids, sugars, nucleotides, and peptides. Combining HILIC with the mass spectrometry (MS) could provide the method with high sensitivity and specificity. HILIC-MS can be exploited for quantitative analysis of a large number of polar and ionic metabolites simultaneously, even a small volume of biological sample is needed [26]. Indeed, HILIC-MS has also enabled the development of high-throughput and automated analytical methods for the analysis of complex samples and can provide “polaromics” data in field of metabolomics (Šofranko et al. in preparation).
Therefore, we adopted HILIC-MS for simultaneous quantitative analysis of polar and ionic compounds present in biological matrixes such as culture media or cell lysates. We utilized this method in a metabolic study focused on identification putative metabolic differences between two types of cultured glioblastoma cell lines. The adopted HILIC-MS method allows to quantify more than 150 metabolites in a single run without derivatization. By applying this method to analyze the culture media and cell lysates, we revealed differences between two types of glioblastoma cells to in metabolizing some of the substrates present in their media, as well as differences in the levels of their intracellular metabolites. These results confirm the presence of metabolic heterogeneity among glioblastomas and demonstrate the potential of employing HILIC-MS analysis for metabolic profiling of cultured cells and for identifying potential targets for either new therapeutic or diagnostic strategies.

2. Materials and Methods

Acetonitrile was obtained from Honeywell. Dulbecco’s modified Eagle’s medium (DMEM) and fetal bovine serum were purchased from Gibco. Antibiotics, penicillin G, and streptomycin sulfate were from PAA Laboratories GmbH. The DC protein assay kit was purchased from Bio-Rad. All other chemicals and materials were sourced from Sigma-Aldrich in highest available purity.

Preparation of External Standards Spiked with Internal Standard

External standards were dissolved in water at a mass concentration of 1 g/L. A maximum of 10 individual standard solutions were pooled together to create the mixtures with mass concentration of each molecule in mixture at level 100 mg/L. These mixtures were again pooled together and further diluted to the desired mass concentrations. The final dilution of mixture of external standard was performed in ratio 1:10 with acetonitrile, which was pre-spiked with internal standard, i.e., isotopically labeled leucine (13C6, 15N).

Collection of Cell Culture Media and Lysates

Two types of glioblastoma cell lines, T98G and U-118 MG, were cultured in Dulbecco’s modified Eagle’s medium (DMEM) supplemented with 10% (v/v) fetal bovine serum, 100 I.U./mL penicillin, and 0.1 mg/mL streptomycin sulfate under conditions as previously described [10,27,28]. The cell culture medium was refreshed 24 hours prior to the experiment. As a control, an aliquot of fresh medium was saved for further LC-MS analysis to establish the initial level of metabolites at time 0.

Media for Analysis and Lysates Preparation

For medium analysis, 10 µl of culture medium was added to 200 µl of ice-cold mixture of acetonitrile enriched with 1 mg/L of isotopically labeled leucine (13C6, 15N). After brief vortexing, the mixture was kept at -20 °C for 30 minutes. Subsequently, samples were clarified by centrifugation at 10,000 x g for 10 minutes. Supernatants were transferred into new tubes and either directly used for LC-MS analysis or stored at -20 °C for short time prior further analysis.
To obtain samples from cellular lysates, adhered cells were rinsed twice with phosphate-buffered saline (PBS) and subsequently lysed in 200 µl of ice-cold lysis solution composing from 90 % (vol/vol) acetonitrile and 10 % (vol/vol) H2O, spiked with 1 mg/L of isotopically labeled leucine (13C6, 15N). After scraping the cells with a rubber policeman, the suspension was quantitatively transferred into tubes. The supernatants prepared by centrifugation of lysates at 10,000 x g for 10 minutes were collected and further analyzed by LC-MS or stored for a short time at -20 °C. The pellets were air-dried and subsequently dissolved for protein estimation.

LC-MS Analysis

For LC-MS analysis, we used LCMS-IT-TOF (Shimadzu, Japan) setup. Four chromatographic columns were tested for the chromatographic separation of polar and ionic compounds: Sequant® ZIC®-cHILIC (3 µm, 100 A, 150 × 2.1 mm; Sigma Aldrich, Germany), Sequant® ZIC® pHILIC (5 µm, 150 × 2.1 mm; Sigma Aldrich, Germany), YMC-Triart-Diol-HILIC (1.9 µm, 150 × 2.1 mm; YMC, Germany), and Raptor Polar X 2.7 µm, 100 × 2.1 mm; Restek, USA). During chromatographical separation the columns were tempered to 40° C except for Raptor Polar X, for which 30 °C was applied.
For separation on Sequant® ZIC® cHILIC and pHILIC columns, one of mobile phases consisted of 20 mM ammonium formate solution in water (mobile phase A) and second of 100 % acetonitrile (mobile phase B; Honeywell, USA). Initial conditions were 90 % (vol/vol) of acetonitrile to 10% (vol/vol) of ammonium formate in water at a flow rate of 0.2 mL/minute, and the sample injection volume was 2 µl. The gradient then changed to 20 % (vol/vol) acetonitrile over 24 minutes, followed by a return to initial conditions over 6 minutes, with an additional 2 minutes for column conditioning.
Chromatographic separation performed on YMC-Triart-Diol-HILIC used the same mobile phases as for separation on ZIC® columns. Gradient started with the same initial conditions, decreased to 40 % mobile phase B (vol/vol) over 13 minutes and then returned to original conditions in 7 minutes. Columns was equilibrated with 90 % B for an additional 3 minutes. Total flow was 0.2 mL/minute. The sample injection volume was 2 µl.
The composition of mobile phases for separation on the Raptor Polar X column differed from the previous ones. Mobile phase A consisted of 0.5 % formic acid (Santa Cruz Biotechnology, USA) in water, while mobile phase B consisted of acetonitrile and 20 mM ammonium formate in water, with a pH of 3, in a ratio of 9:1. The separation was executed using the following gradient: initiation with 88 % of phase B maintained for 3 minutes, followed by a transition to 30 % B over 4.5 minutes, then an abrupt return to 88 % of B. The column was then equilibrated for an additional 2 minutes under initial conditions. The total flow rate was 0.5 mL/minute. The sample injection volume was 2 µl.
The ion spray voltage was set to 4.5 kV for positive and -3.5 kV for negative mode, respectively. Heat block and capillary desolvation line were both at 200 °C. Nitrogen nebulizing gas flow was at 1.5 L/minute and drying gas pressure was set at 200 kPa. The ion accumulation time in the ion trap was set to 40 ms, and the range for data acquisition was 100 – 600 m/z. Data were acquired in both positive and negative mode using LabSolutions v 3.81 software (Shimadzu).

Processing of Spectra

Acquired spectra were directly converted to mzXML format using LabSolutions v 3.81 post-run analysis and imported to Skyline (MacCross Lab Software), an open source software for LC-MS data processing (https://skyline.ms). Peaks of individual metabolites were extracted to obtain information such as mass-to-charge ratio (m/z), retention time (tR), peak areas and the full width at half maximum (FWHM) of peak. Metabolite identification was based on confirmation of its retention time and m/z by compound from our internal library, acquired using analytical standards, or with online libraries such as Pubchem (https://pubchem.ncbi.nlm.nih.gov/) and mzCloud (https://www.mzcloud.org/). Peak resolution was calculated using retention time of analytes and the full width at half maximum of their peaks, according to formula:
Rs = 1.18 × [(tR2-tR1 )/(w0.5h1+w0.5h2)],
where tR2 is retention time of later eluting analyte, and tR1 retention time of early eluting analyte. The parameter w0.5h1 represents a width at half maximum of peak of early eluting analyte and w0.5h2 is a width at half maximum of peak of later eluting analyte.

Quantification of Metabolites

For quantification purpose, the area of each identified metabolite was normalized with the internal standard, and the concentration was calculated using external standards, for which areas were normalized as well.

Protein Quantification

Protein concentration in individual samples was determined using a commercially available DC protein assay kit, which is based on a modified Lowry assay [29]. The bovine serum albumin was used as a standard protein for generation of calibration curve.

Statistical Analysis

Data are reported as mean ± standard error of the mean (SEM) from three independent trials. Statistical analysis was performed using the web browser application Metabolite Autoplotter (https://mpietzke.shinyapps.io/AutoPlotter/). Comparison between two groups, different cell lines, was performed using Student’s t-test, and a p-value lower than 0.05 was considered statistically significant. Moreover, Metabolite Autoplotter was used for a principal component analysis to visually confirm differences between the metabolisms of the two cell lines. Heatmaps were created using web browser application MetaboAnalyst 6.0 (https://dev.metaboanalyst.ca/MetaboAnalyst/).

3. Results

This section may be divided by subheadings. It should provide a concise and precise description of the experimental results, their interpretation, as well as the experimental conclusions that can be drawn.

3.1. Design and Testing of LC-MS

In our effort to separate and quantify the polar and ionic molecules related to cellular metabolism, we applied mass spectrometry detection techniques to compounds eluted from chromatographic columns with zwitterionic stationary phases. Four columns: Raptor Polar X, ZIC® pHILIC, ZIC® cHILIC, and Diol-HILIC underwent examination to discern their efficacy in separating selected compounds.
A primary criterion for column selection was its capability to effectively separate structural isomers of branched-chain amino acids, i.e., leucine and isoleucine (Figure 1), along with pairs of amino acids sharing similar mass, like glutamine and lysine (Table 1). Notably, all four columns provided capability to separate lysine and glutamine isomers, and in addition, they separated molecules of leucine and isoleucine to certain extent (Figure 1). Based on the obtained values of parameters for peak of leucine and isoleucine the peak resolution values could be calculated (Table 2). The highest peak resolution value was established for separation on Sequant® ZIC®-cHILIC column and reach a value of 1.28.
In subsequent testing, we assessed the columns abilities to distinguish between branched-chain 2-oxo acids: α-ketoisocaproic acid (KIC), α-keto-β-methylvaleric acid (KMV) and α-ketoisovaleric (KIV), cognate 2-oxo acids of leucine, isoleucine, and valine, respectively. Only ZIC® columns were able to retain all branched-chain 2-oxo acids, but none of tested columns separated molecules of KIC and KMV. YMC-Triart column was able to retain only KIC and KIV (Figure 1).
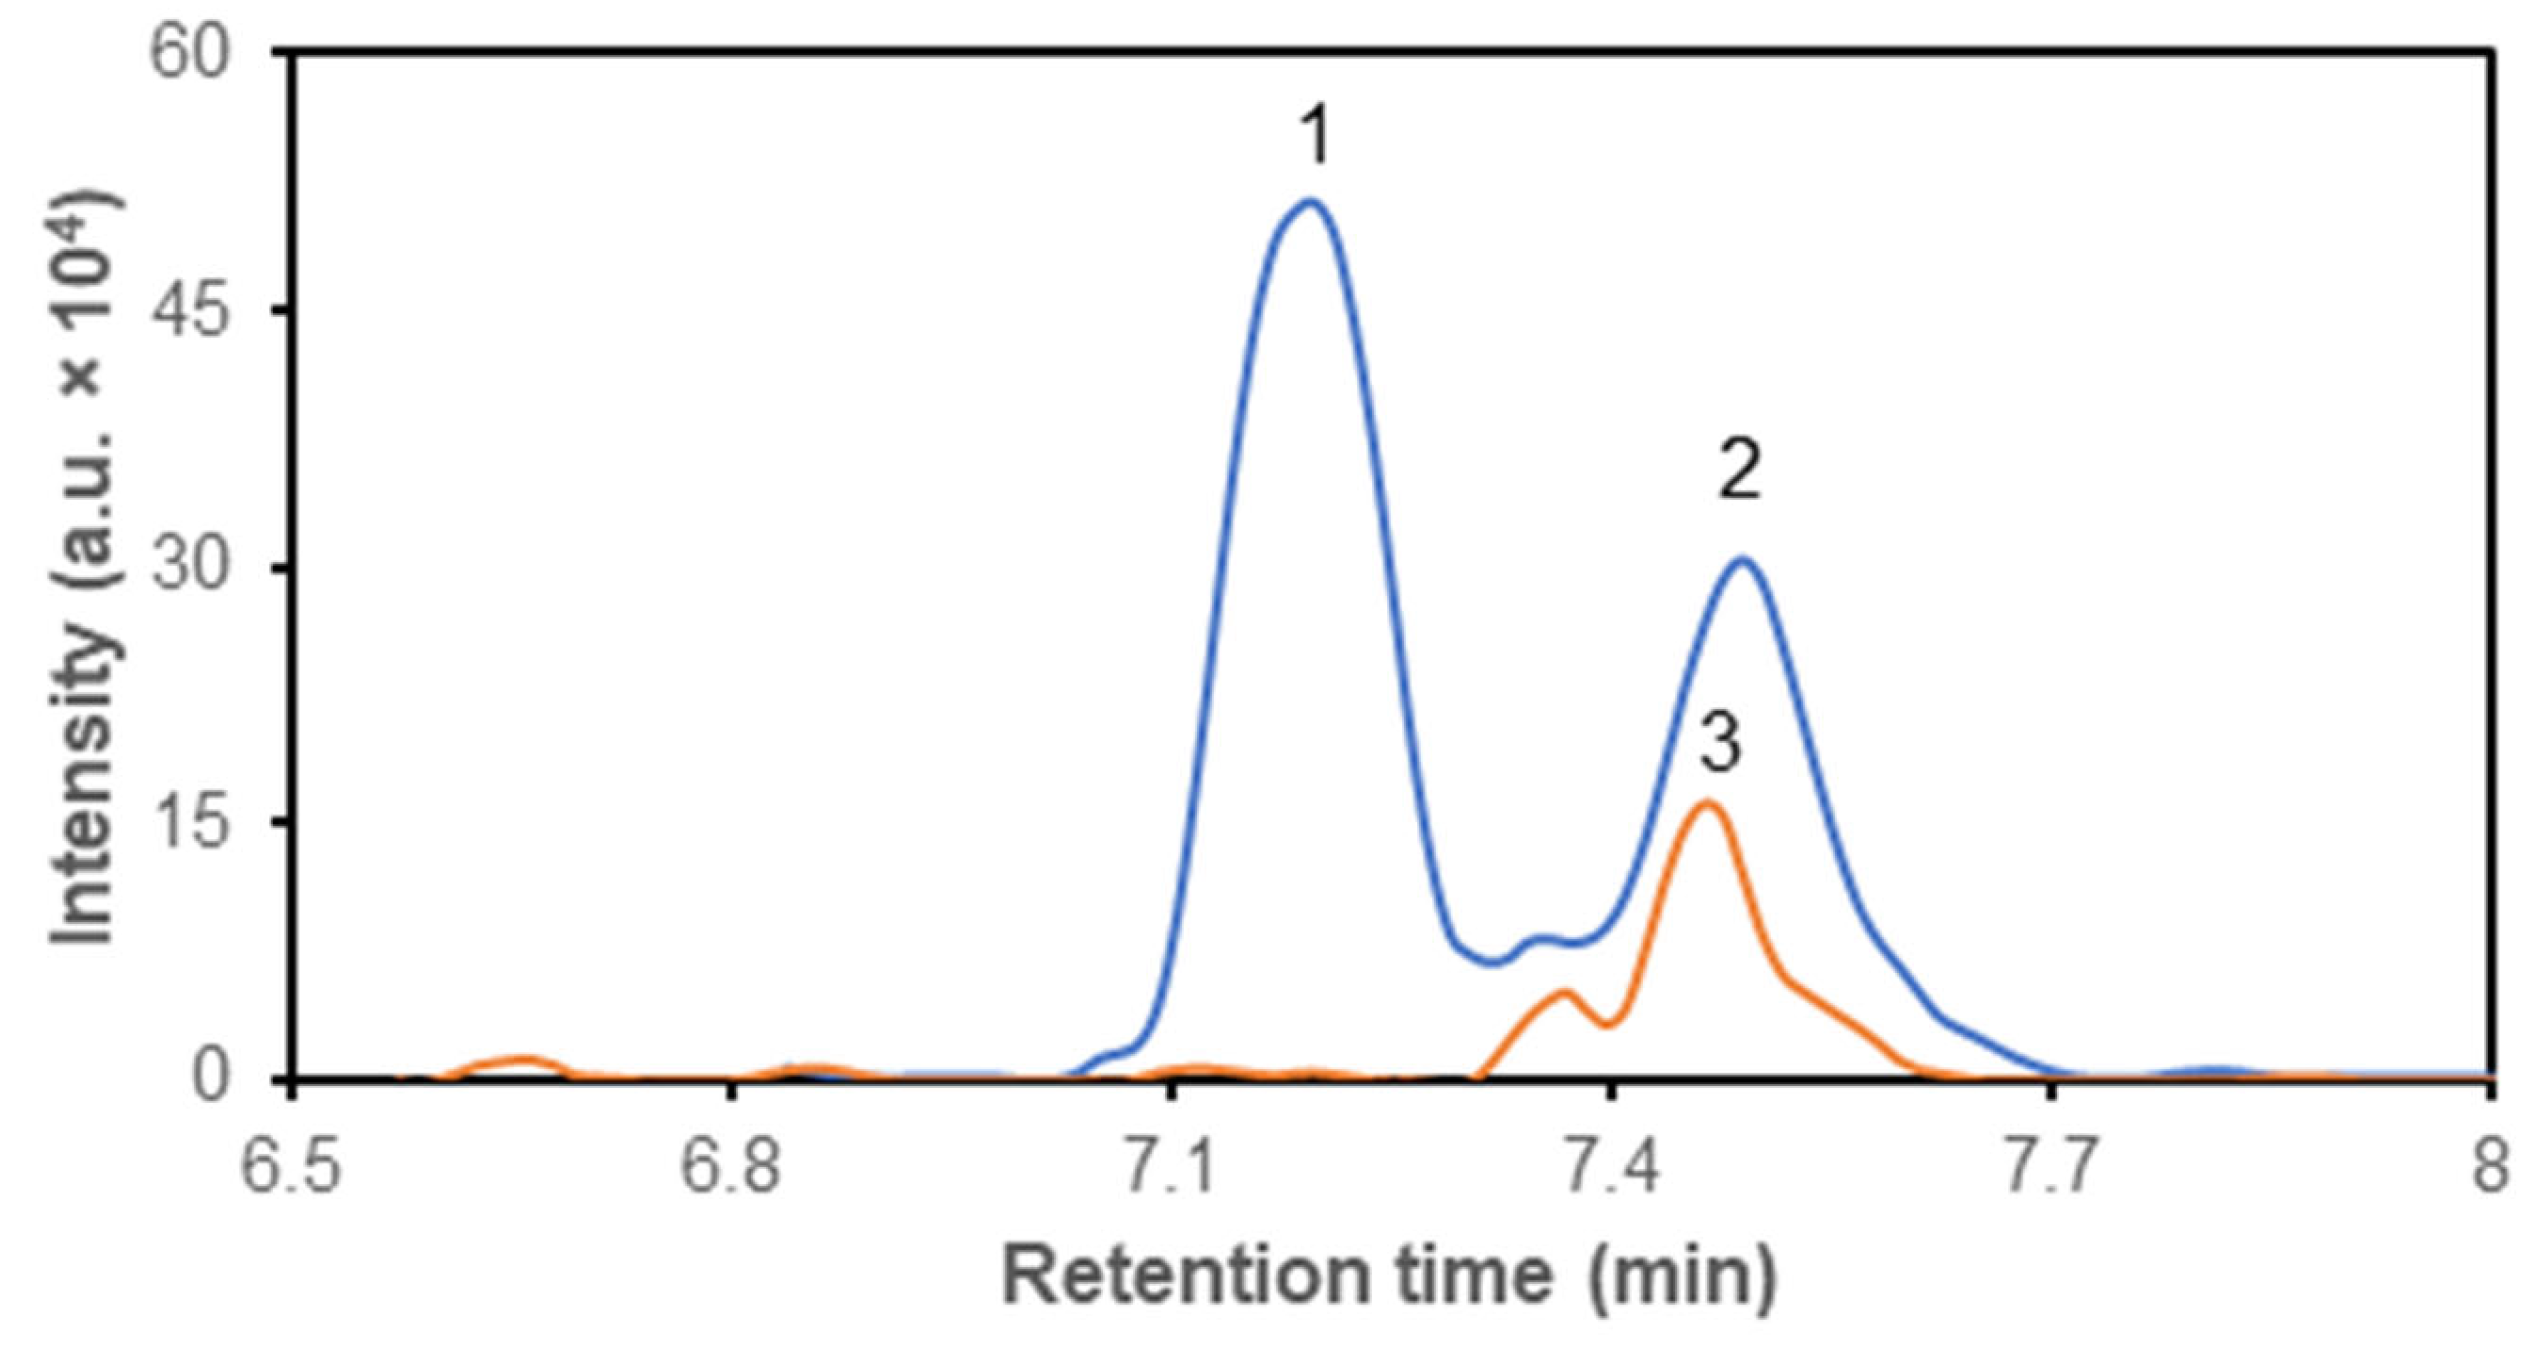
Based on these inclusion criteria, the Sequant® ZIC® cHILIC column was selected for further experiments. Standard solutions and their mixtures, prepared from purchased compounds (Table 1), were supplemented with 13C6-leucine as an internal standard (Figure 2). Subsequently, the acquired spectra were processed using Shimadzu software or Skyline to derive values for the area under the curve (AUC). Calibration curves were generated for selected metabolites, and estimated values of linearity (R2), linearity range and precision were determined (Table 3).
The majority of tested polar and ionic compounds were successfully separated on the cHILIC column and subsequently detected by MS. Retention times and m/z values were assigned to each detected compound, laying the groundwork for metabolic analysis.

Identification and Quantification of Metabolites in Media

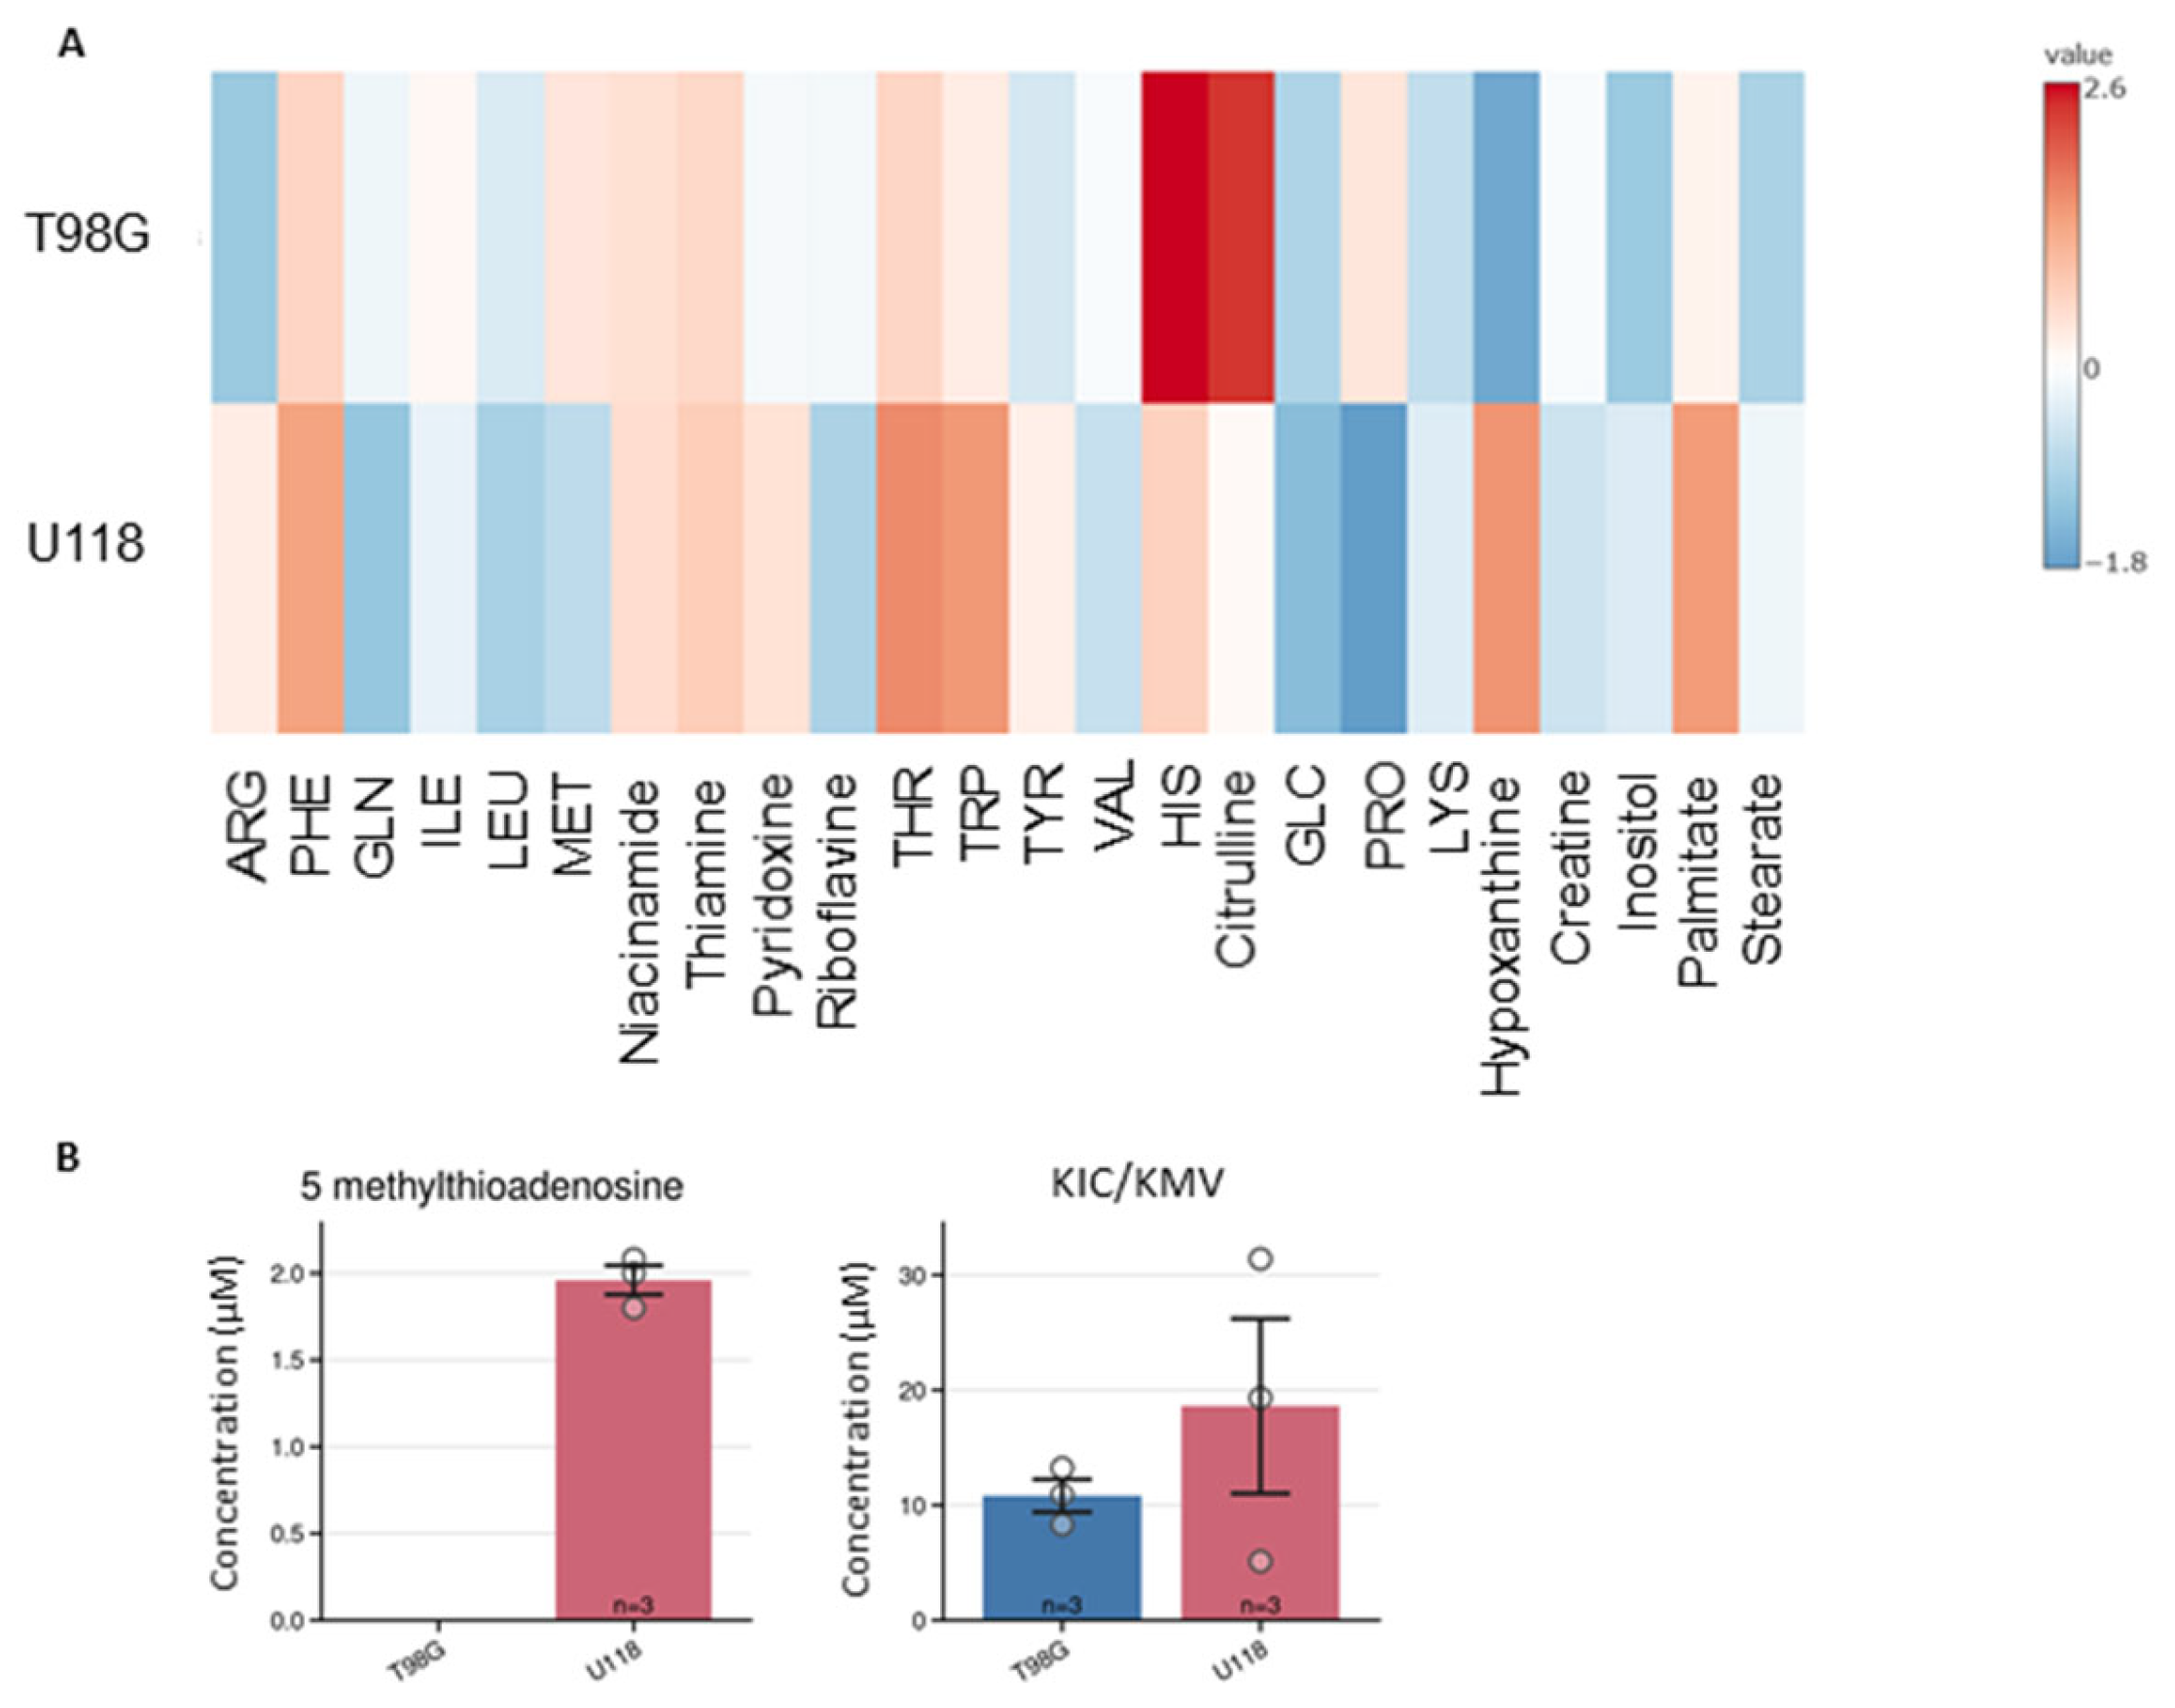
The method was applied on culture media from two lines of glioblastoma cell lines, i.e., T98G and U118. The change of the media composition was analyzed after 24-hour cultivation. By LC-MS analysis total of 26 metabolites was quantified in culture media (Figure 3). The text continues here (Figure 2 and Table 2).
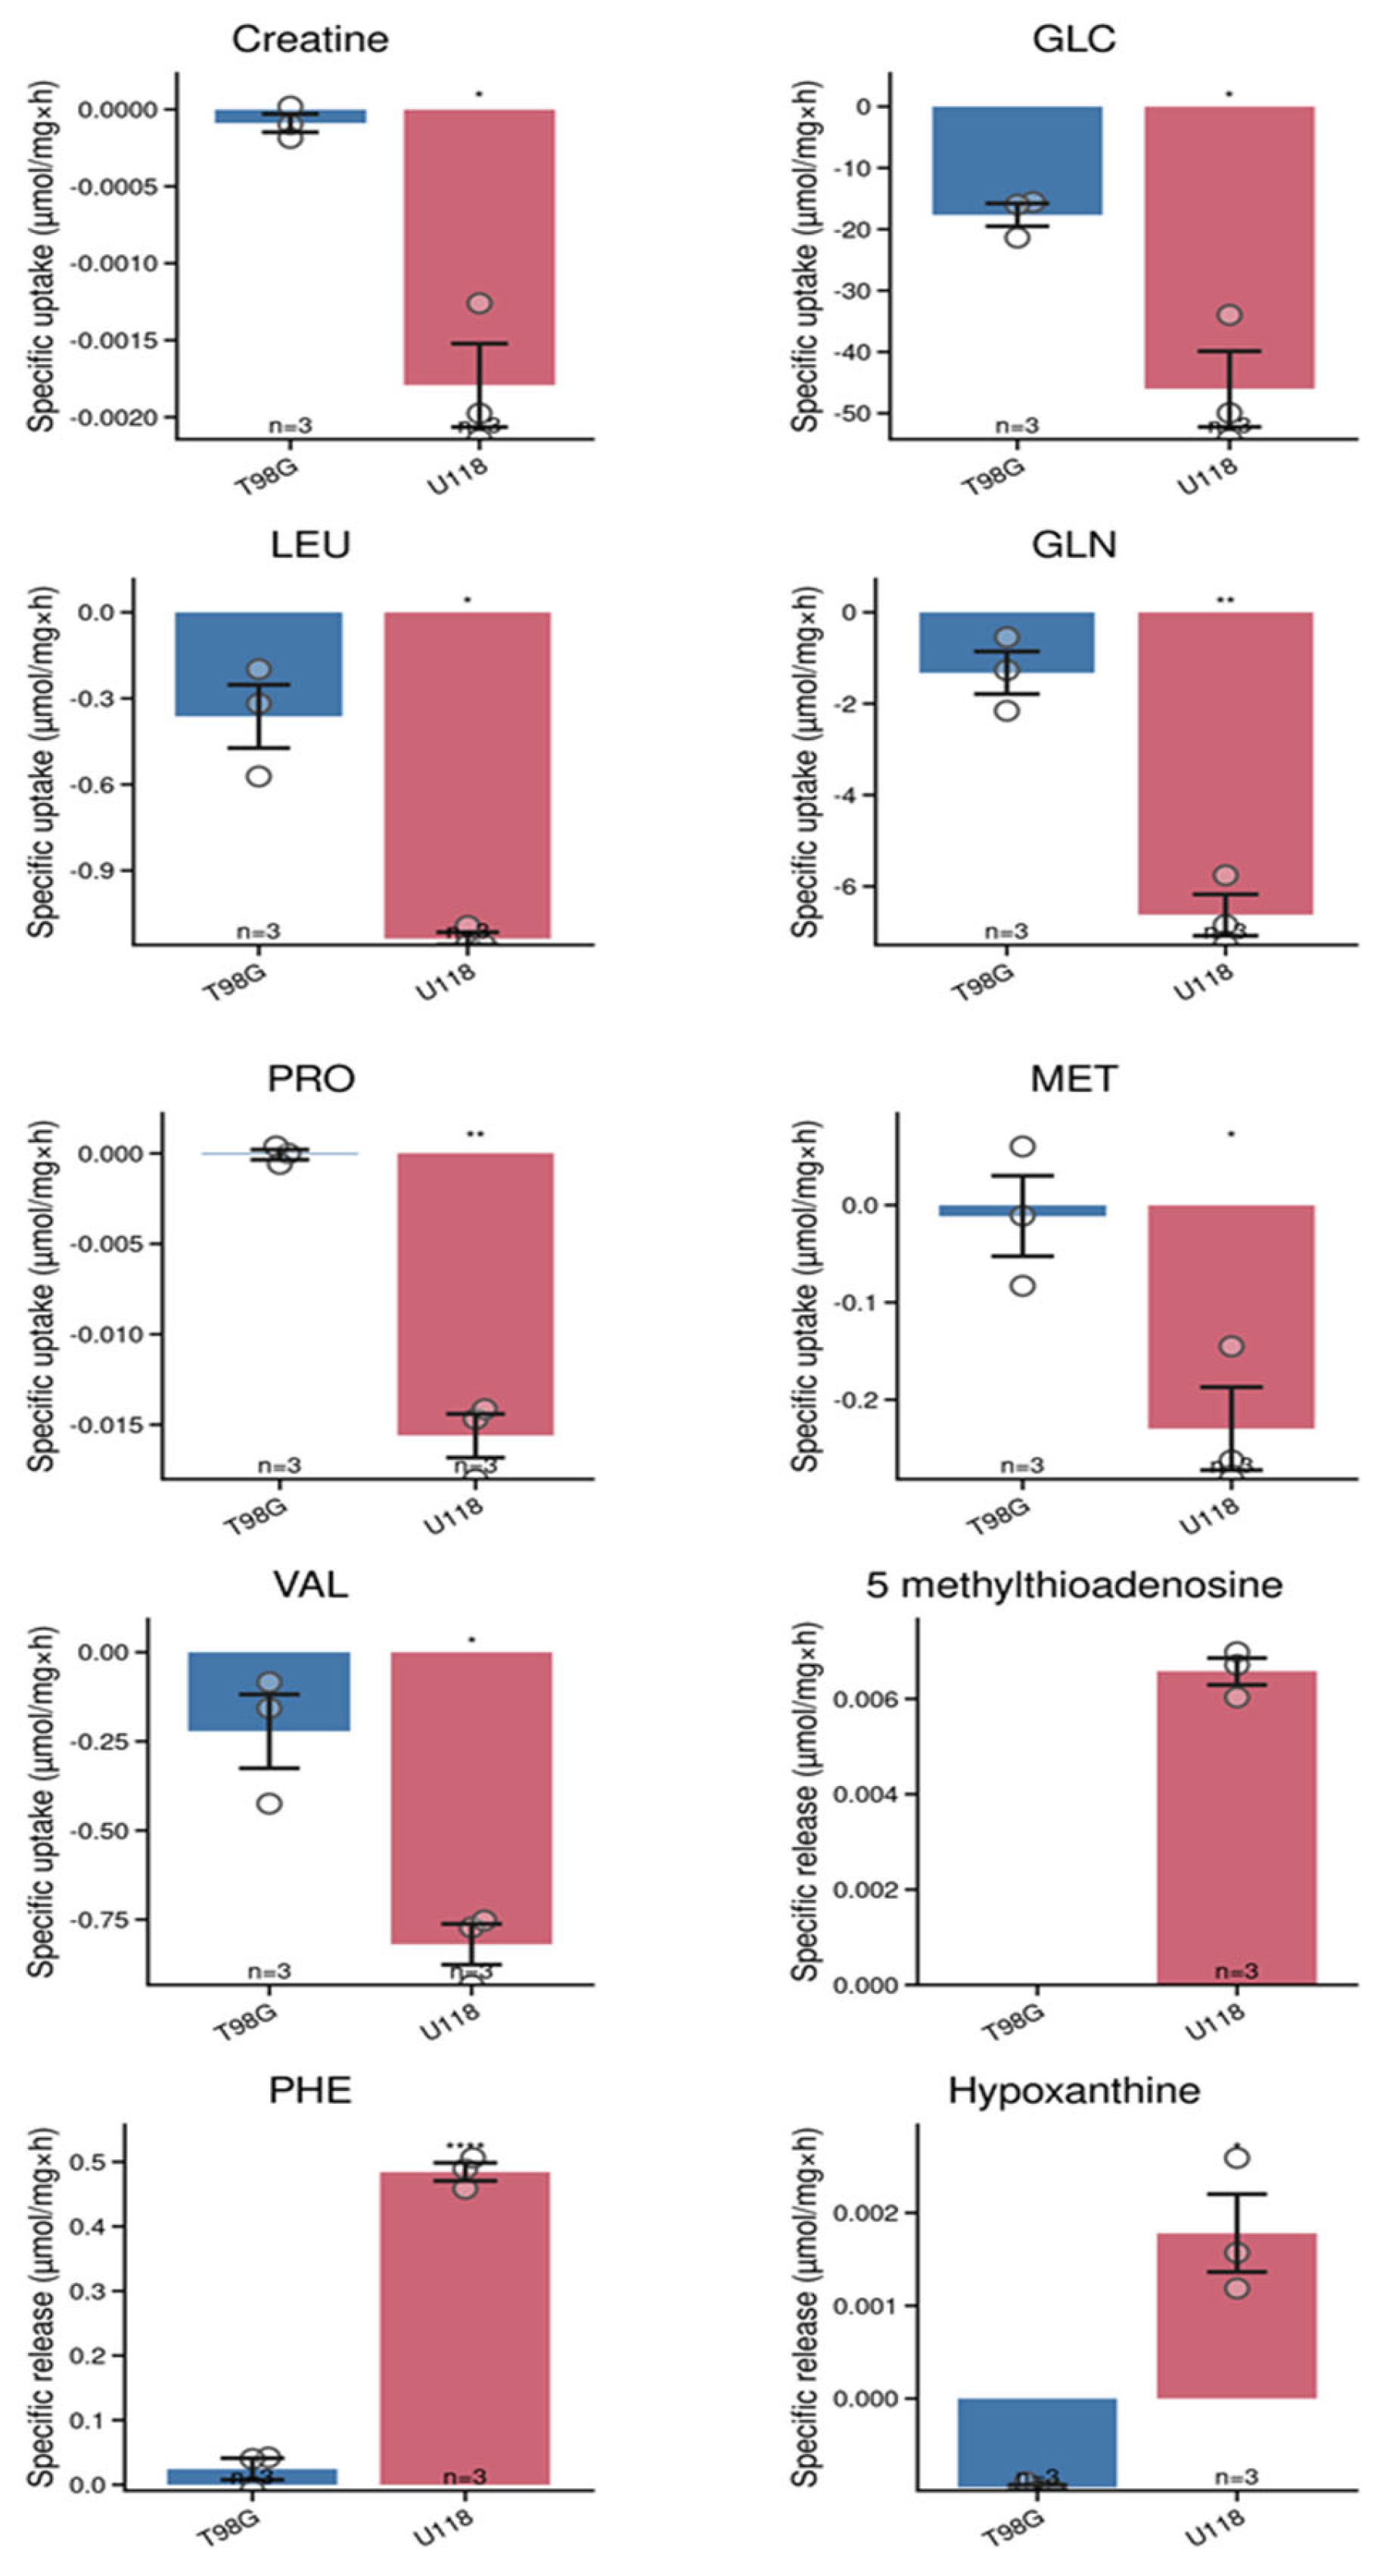
The glioblastoma cells affected the level of 10 metabolites due to uptake or release. The specific uptake and release have been calculated by dividing amount of substance in medium by amount of proteins in cell lysates and time of incubation.
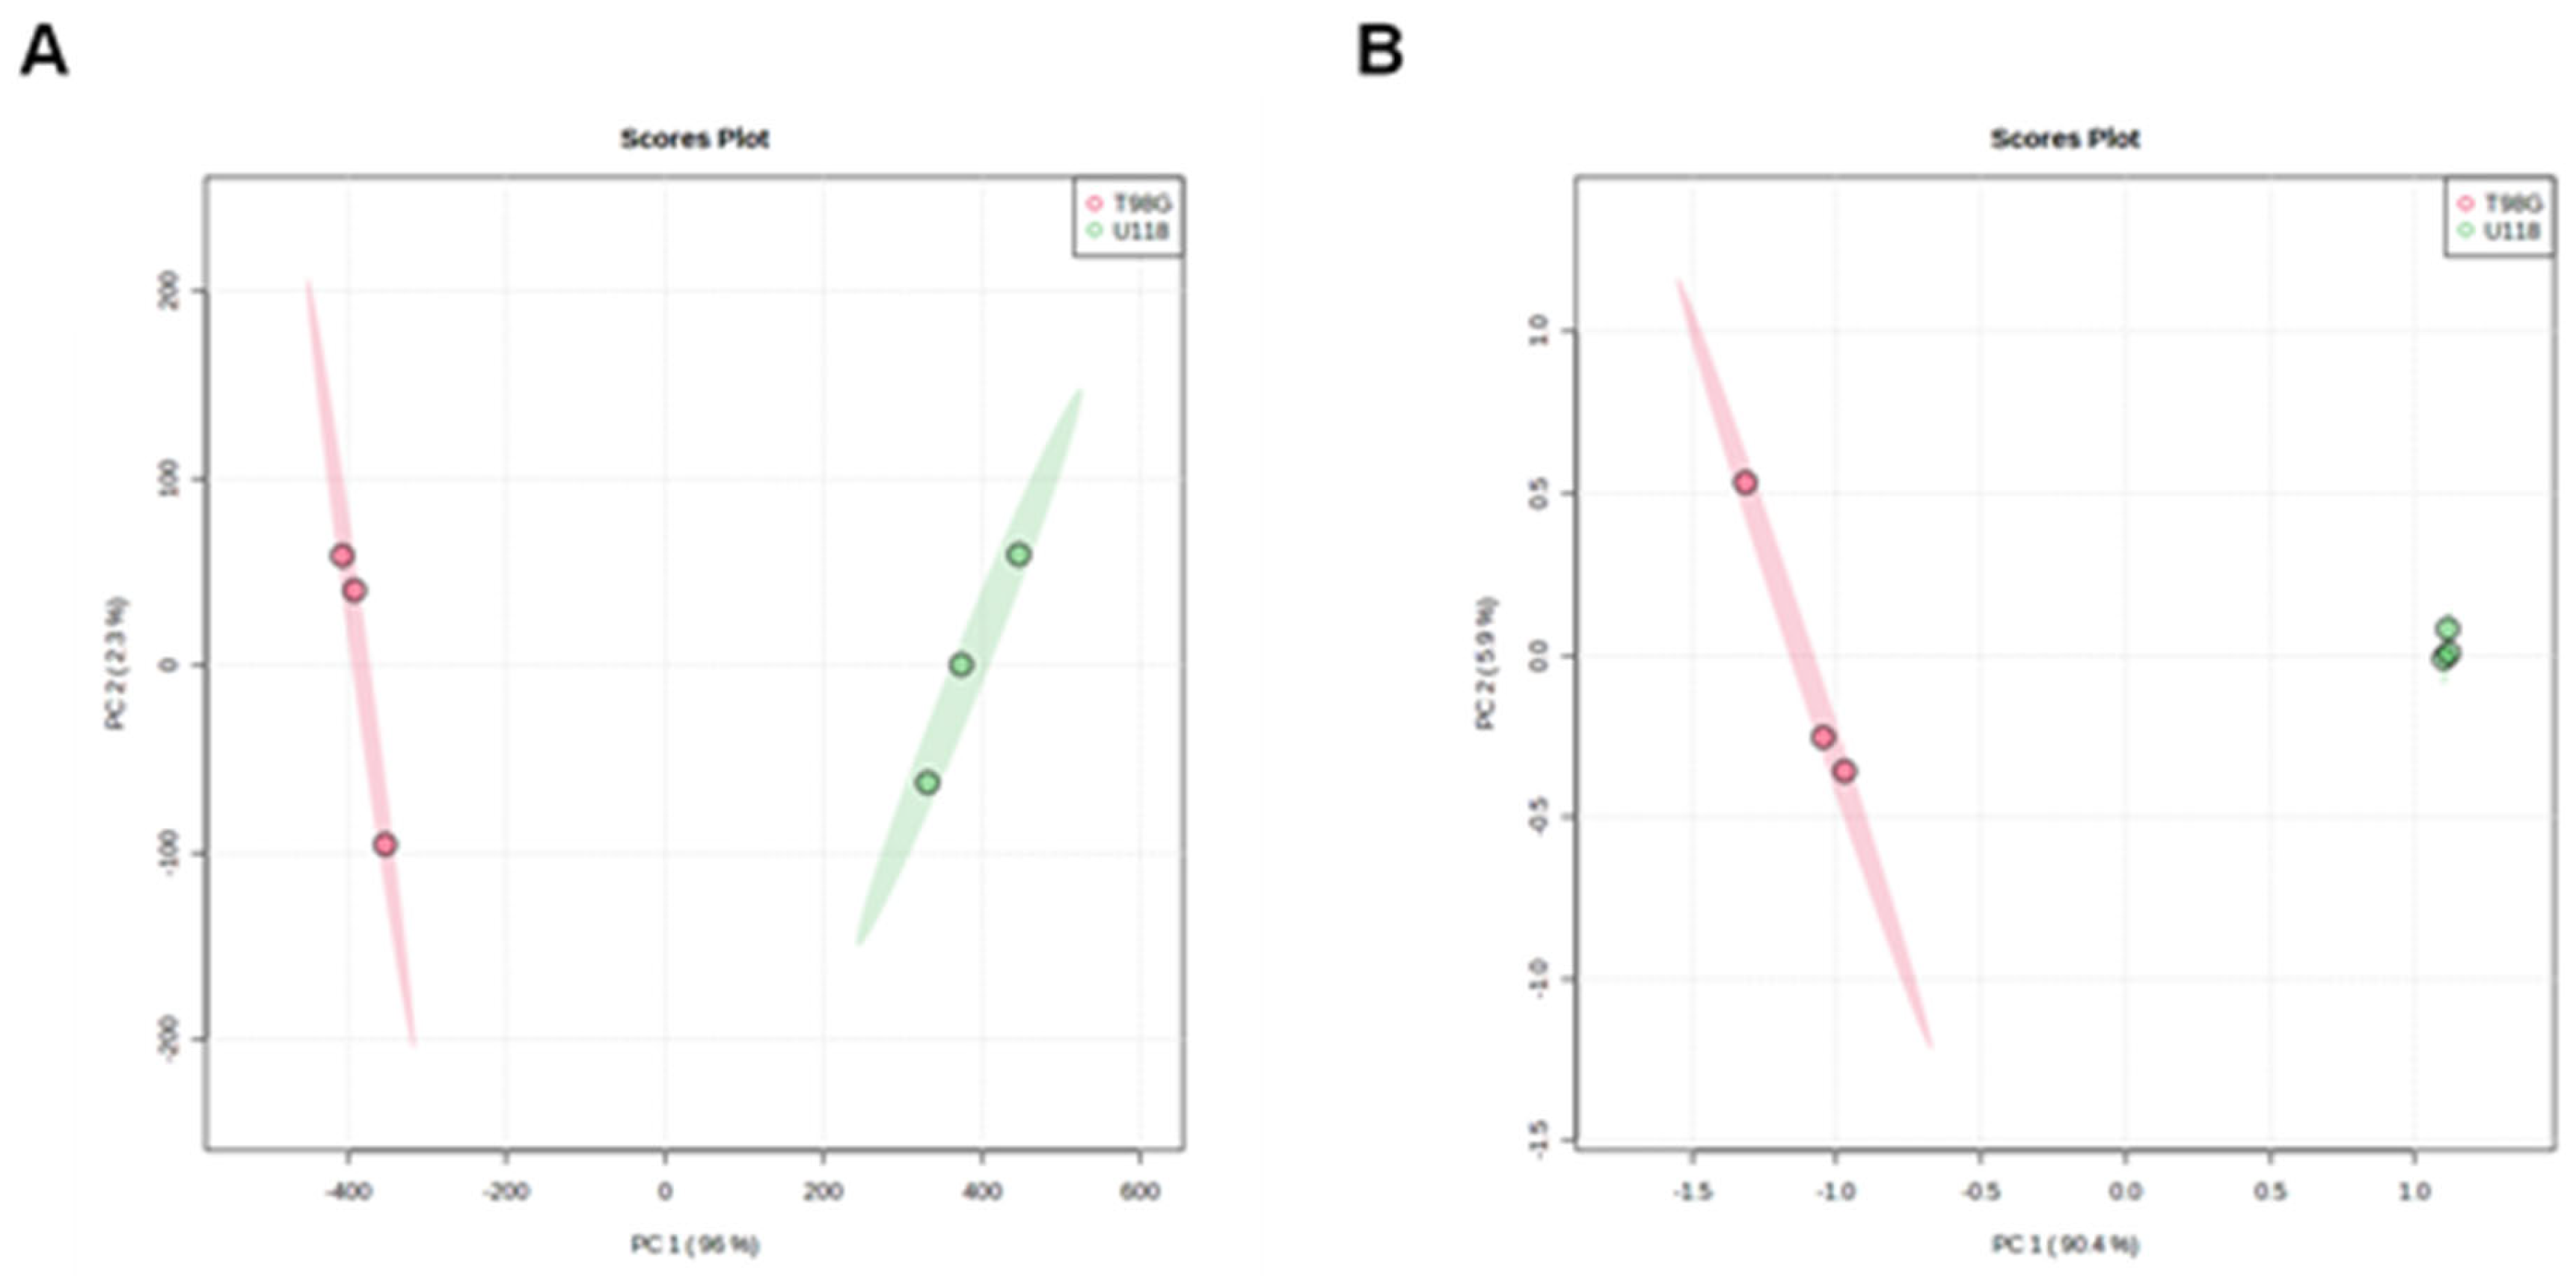
The differences between tested types of glioblastoma cells are in capability to remove or release creatine, glucose, leucine, glutamine, proline, methionine, valine, 5-methylthioadenosine, phenylalanine and hypoxanthine. We identified ten compounds, which levels in media differed significantly after incubation depending on the type of glioblastoma cells (Figure 4). For example, U118 glioblastoma cells tend to excrete 5-methylthioadenosine in contrast to T98G cells, which released substantial amount of citrulline. The estimated differences for metabolic capacity of U118 and T98G cells were tested by PCA analysis, which results clearly indicate distinctions between their metabolisms (Figure 5A).

Identification and Quantification of Metabolites in Lysates

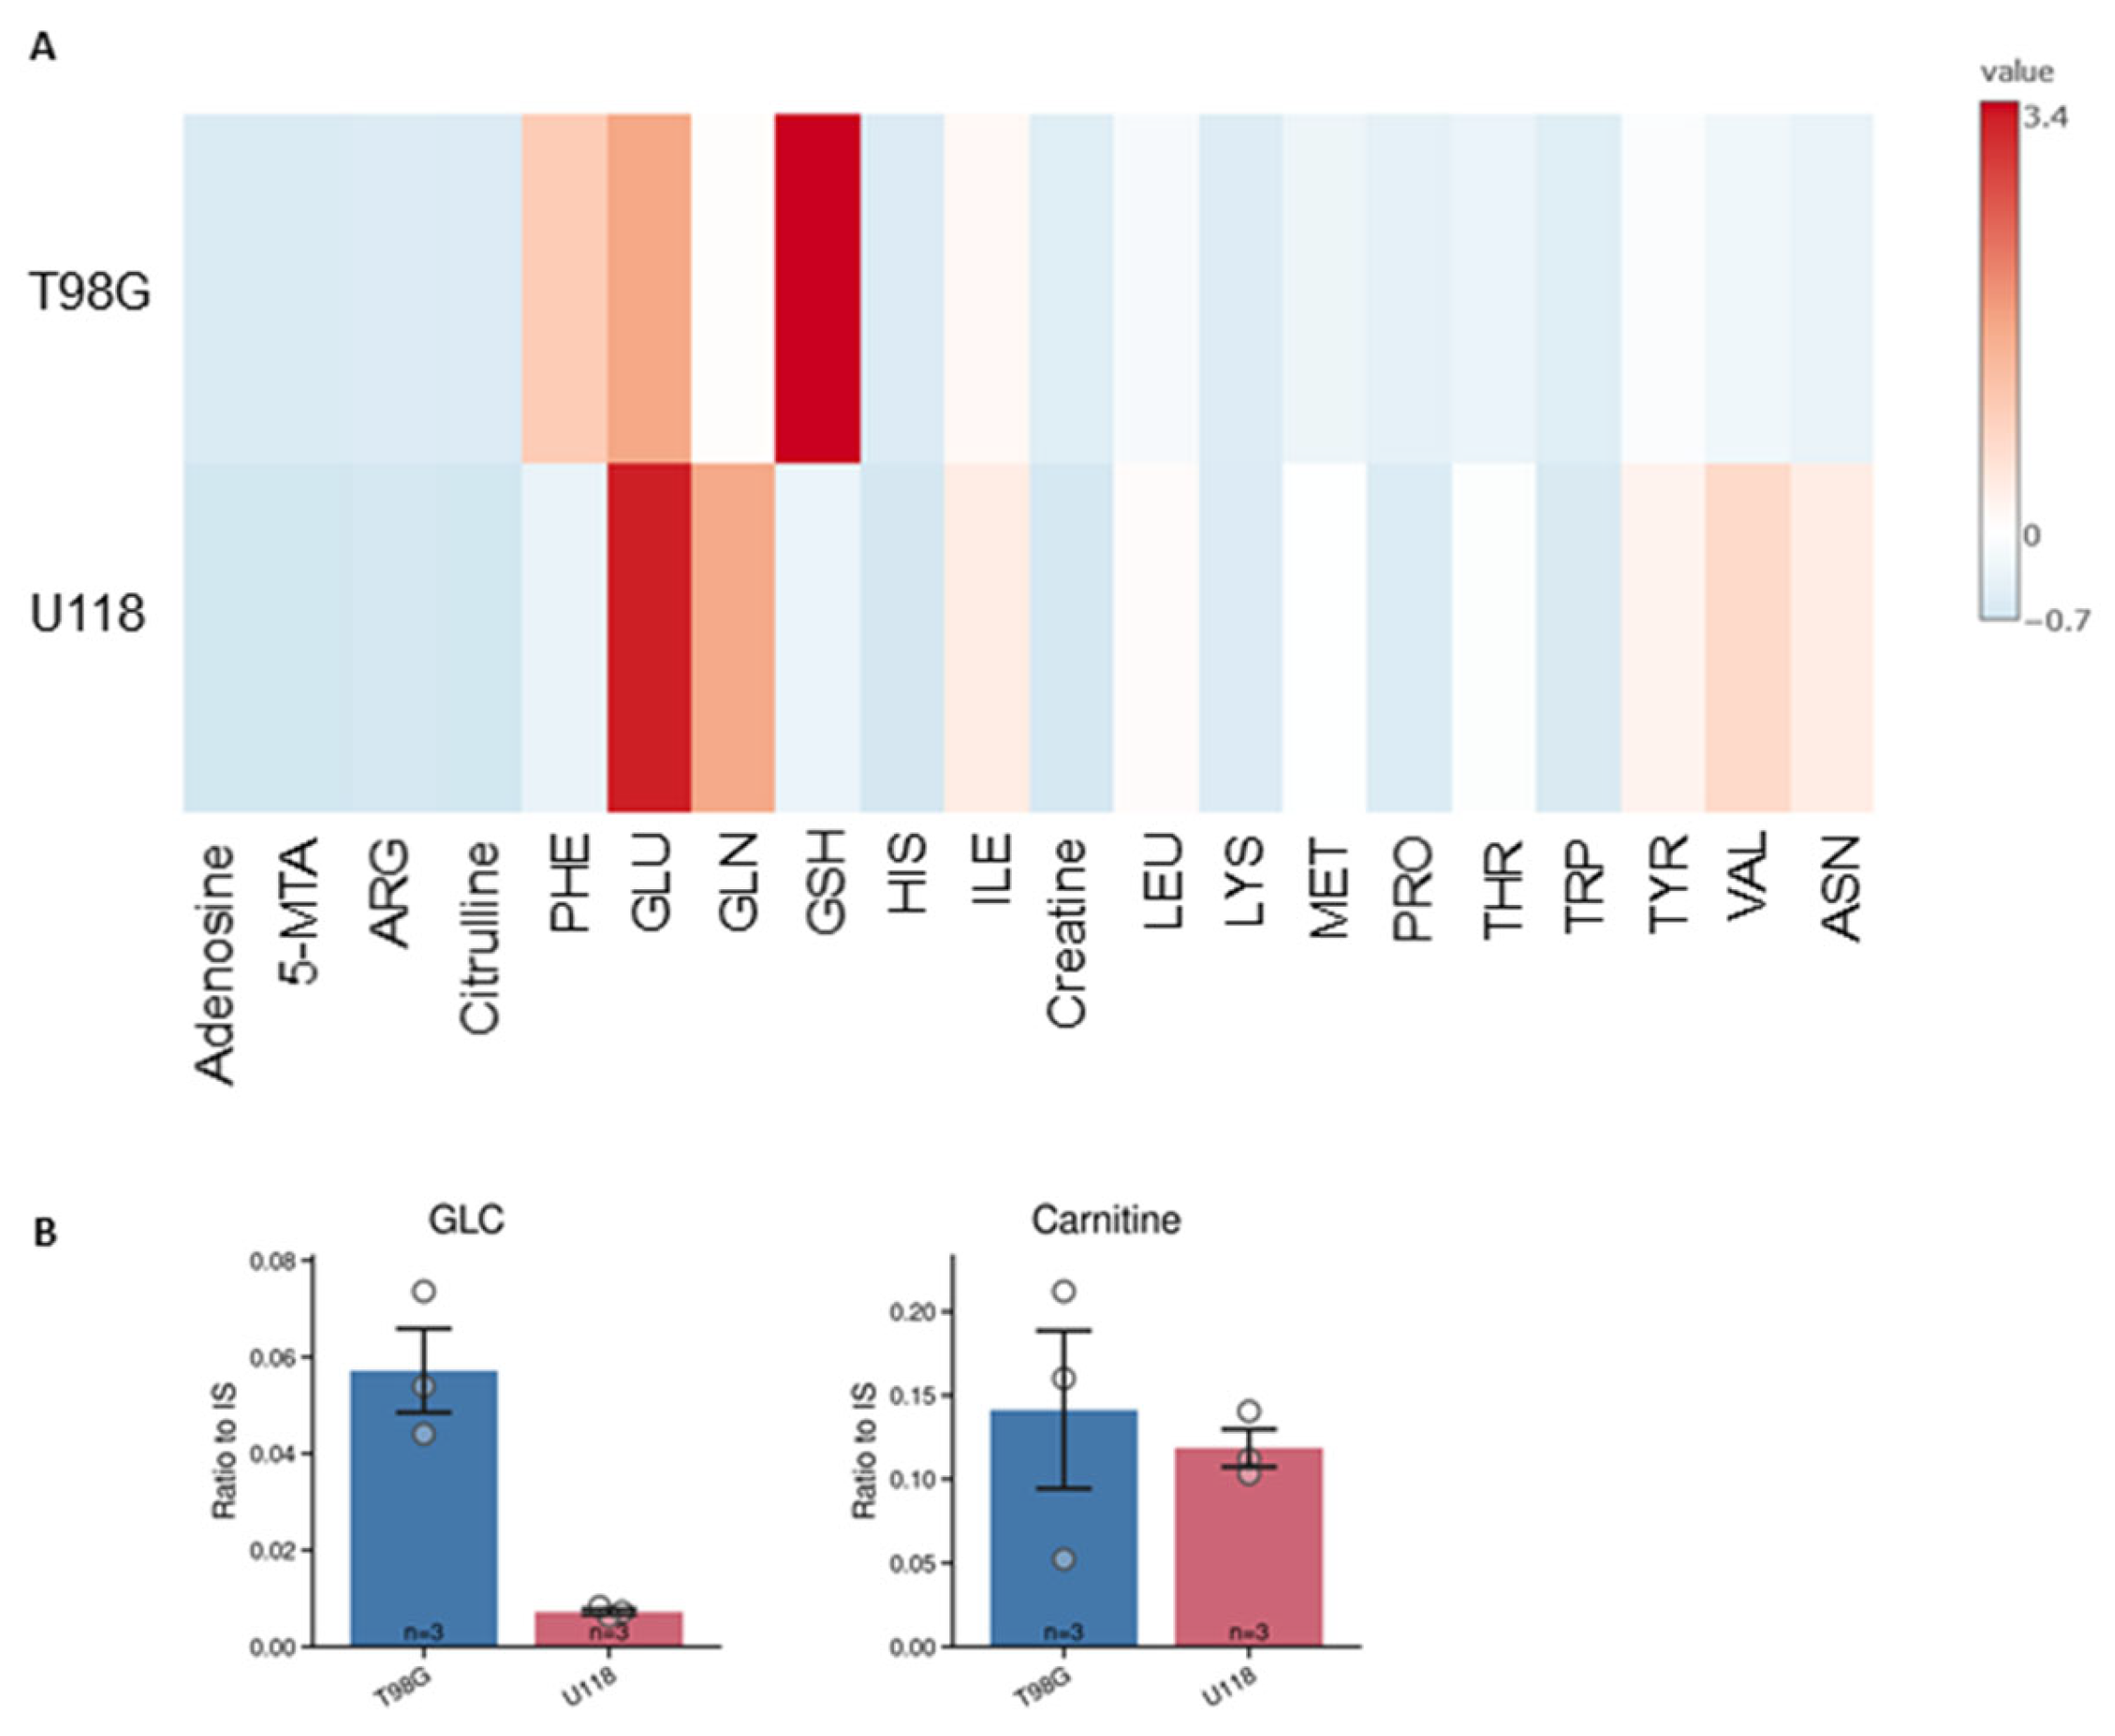
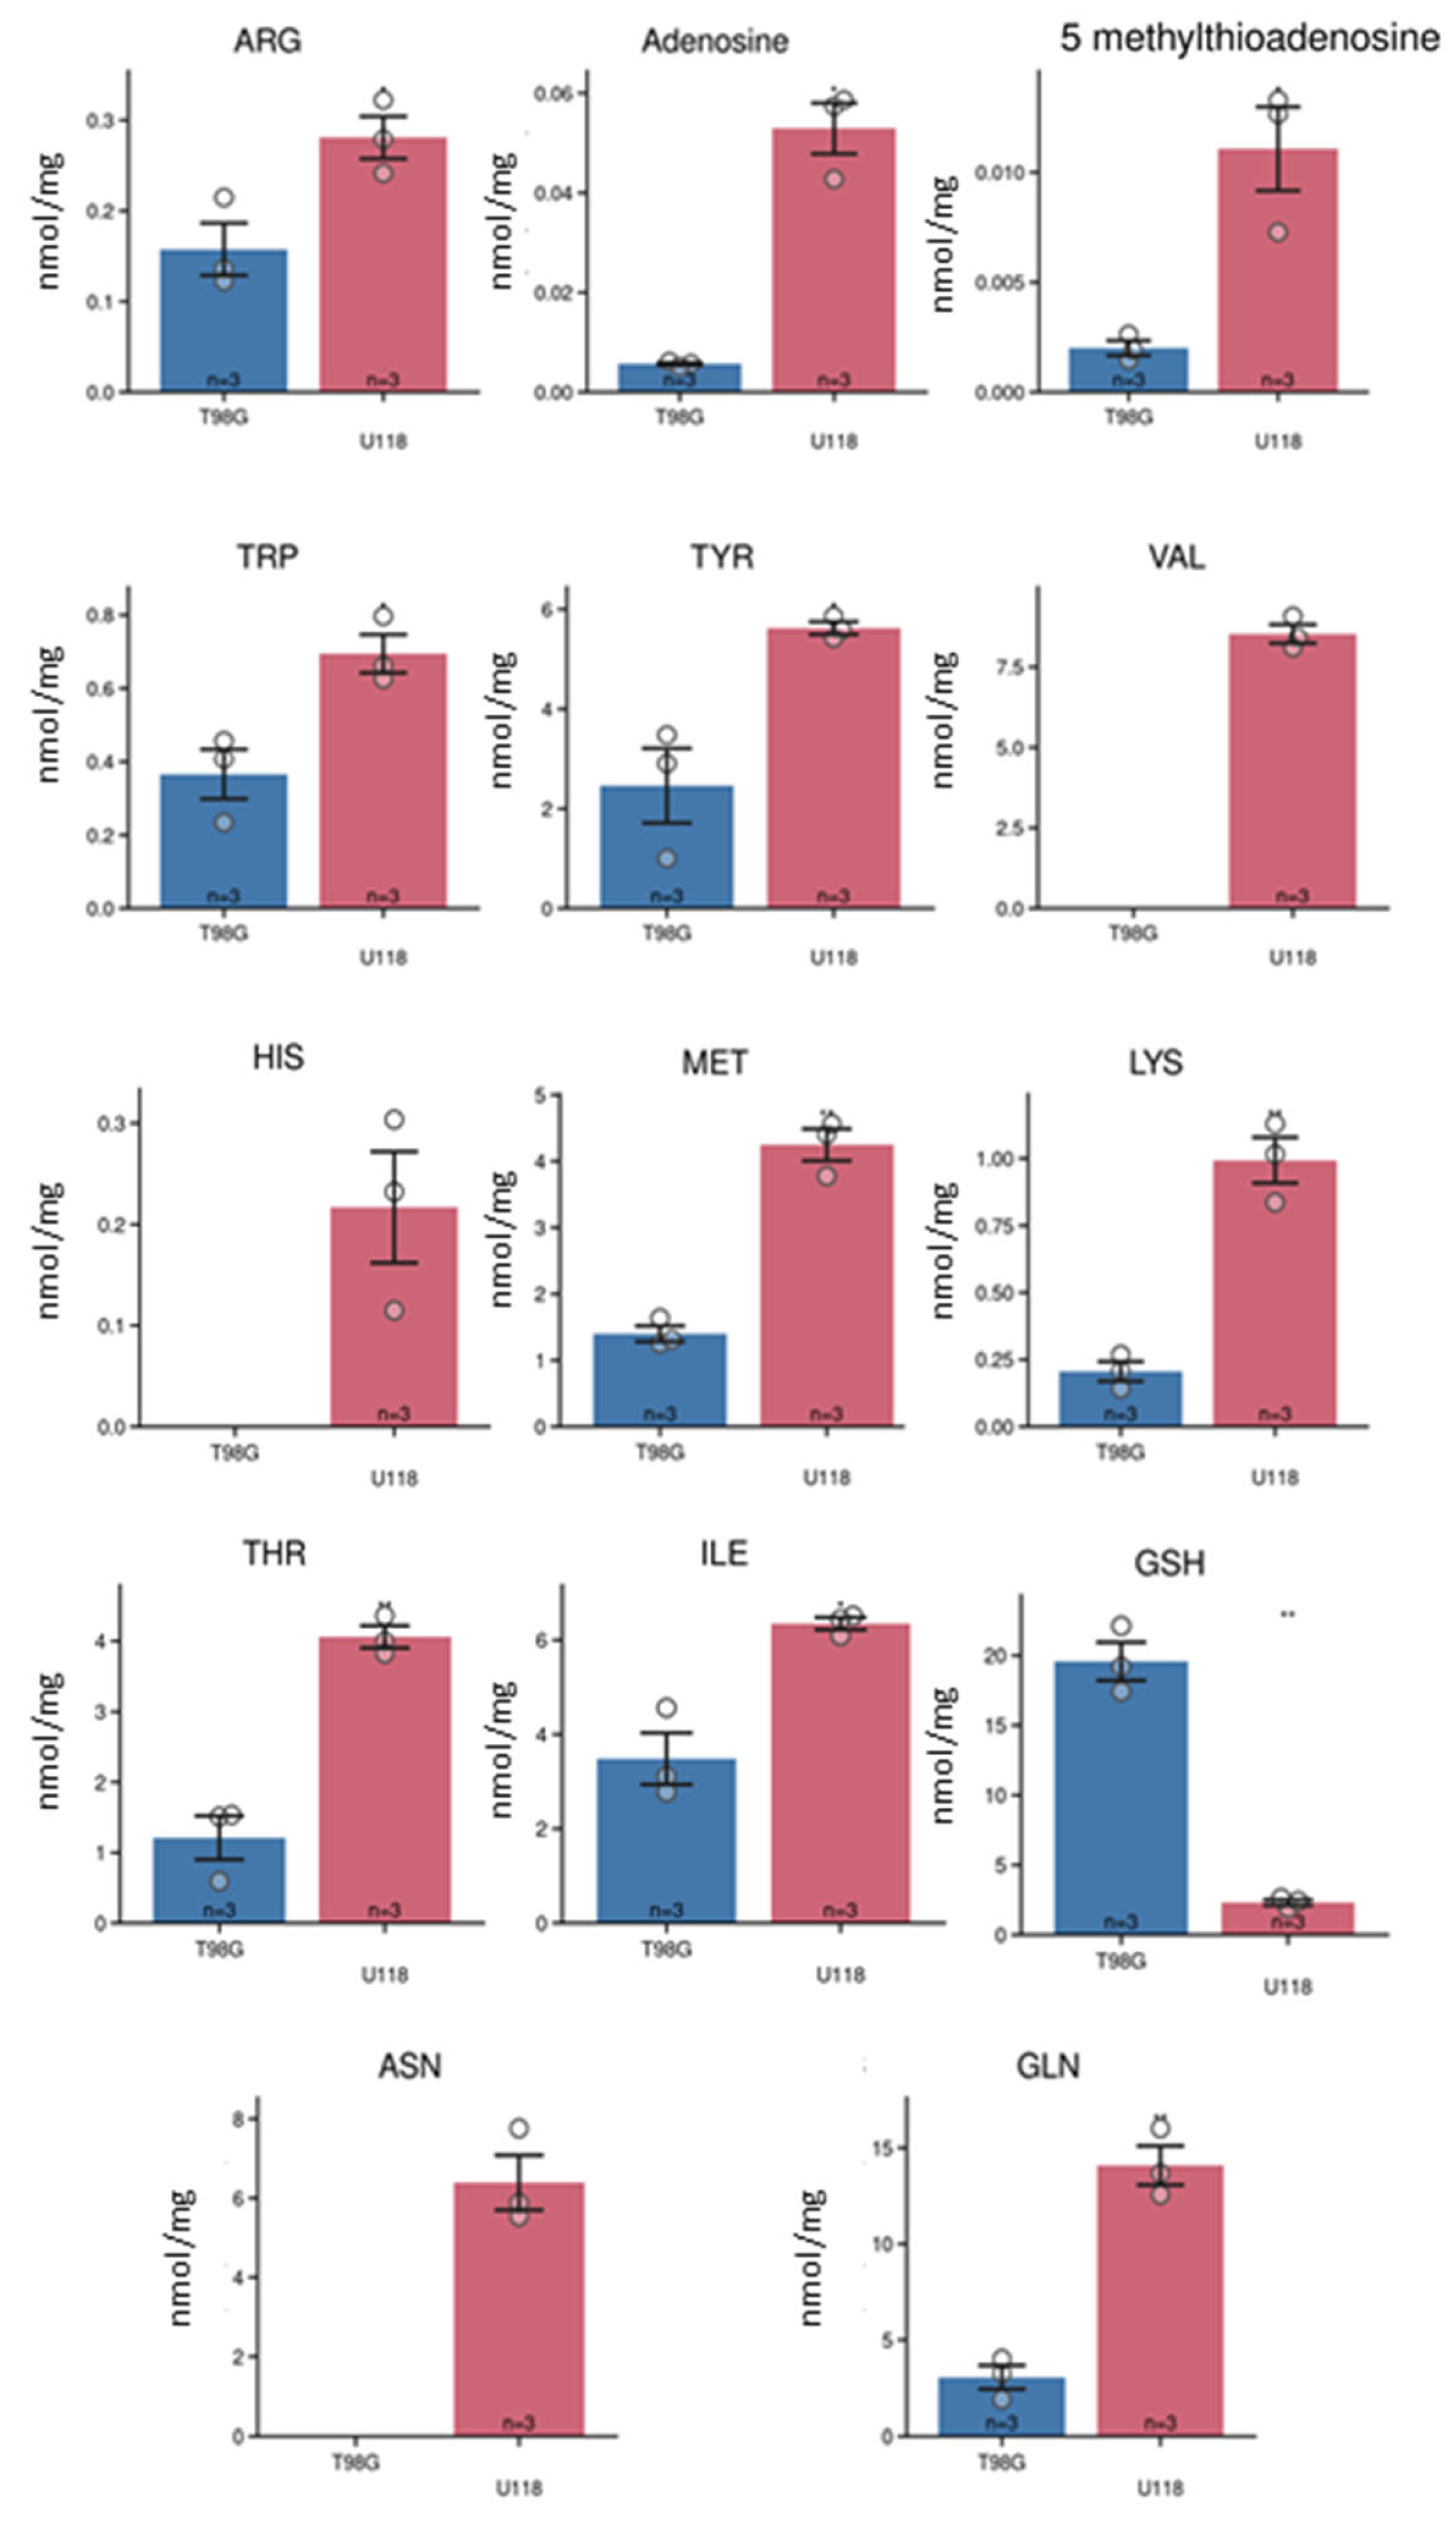
We applied current method also for quantification of intracellular metabolites. The LC-MS analysis of cell lysates allowed for quantification of 20 metabolites (Figure 6), which levels were standardized to protein content of cells lysates.
Out of them, the intracellular content of 14 metabolites differed between tested types of glioblastoma cells (Figure 7). Asparagine, histidine, and valine were not detected in lysates of the T98G cell line. Such differences were used to generate the PCA score plot (Figure 5B) that clearly illustrates the metabolomic differences between U118 and T98G glioblastoma cells.

4. Discussion

In the present study we exploited the possibility of the newly adapted LC-MS method for quantification of ionic and polar compounds in culture media and cell lysates of cultured, human glioblastoma cells. The results of LC-MS analysis revealed that glioblastoma cells T98G and U118 differ in their capability to withdraw some of the compounds from culture media and to release metabolites into their milieu.
HILIC-MS is commonly used for the analysis of polar metabolites, such as amino acids, nucleotides, sugars, and organic acids. HILIC – MS has found numerous applications in various fields, including pharmaceuticals, proteomics, metabolomics, and environmental science. In metabolomics studies, it is becoming a tool for the quantification of polar or ionic molecules in biological samples, characterization of metabolic nuances and for the identification of putative biomarkers and drug metabolites. We tested around 150 polar and ionic compounds of interest (Table 2) and evaluated the possibility of their separation on polar columns and subsequent detection and quantification by MS. Based on the previously published results that revealed the capability of glioblastoma cells to readily dispose from culture media glucose and branched-chain amino acids [3,5,9,10,11,12,13,14,17], we focused on possibility to separate, detect and quantify amino acids in biological matrices by LC-MS. Since leucine and isoleucine are constitutive isomers with identical m/z, we selected for LC separation cHILIC column [10], which is capable to sufficiently separate these two amino acids. The cHILIC separation leads to elution of leucine and isoleucine molecules in two discrete peaks for molecules with identical m/z values but with different retention times (Figures 1A and 2). For definite estimation of separation capacity of the column we used mixtures consisting of isoleucine and leucine molecules, which in their structure contained lighter isotopes 12C and 14N or heavier 13C and 15N. The additional advantage of separation on HILIC column is that the compounds are separated on presence of polar and charged moieties of molecules that allows for separation of compounds without prior derivatization [21,22,26].
The analysis of culture media by novel LC-MS protocol was sufficiently sensitive to quantify 26 metabolites and to estimate their specific metabolic rates. In addition, the number of compounds was quantified in cell lysates. Our presented results provide evidence that in addition to common metabolic features among tested types of glioblastoma cells, there are metabolites whose quantity is altered depending on the investigated type of glioblastoma cells. We identified 5-methylthioadenosine, proline, methionine and hypoxanthine, as the compounds which metabolism is most different. Uptake rates of branched chain amino acids – leucine and valine, were significantly higher in U118 cell line. Based on obtained data we can postulate that provided protocol for LC-MS analysis is a useful tool for studies on glioblastoma metabolism and may be used to identify metabolic heterogeneity among cultured glioblastoma cell types. Metabolic heterogeneity of glioblastoma cells in their capability to metabolize glucose is a subject for the recent scientific research [3,8,18,19,20].
The limitations in supplementation of glioblastoma cells with glucose in situ, together with assumption that transformed metabolism of glioblastoma cells can also engage other substrates, including amino acids [3,9,10,11,12,13], are bases for postulating the question about metabolic heterogeneity of glioblastoma cells regarding substrates other than glucose. Indeed, our results confirm that glioblastoma cells remove some of amino acids from their milieu. However, the increase in level of phenylalanine, which is essential amino acid, points to a possibility that also glioblastoma cells can rely on extracellular proteins as the source of amino acids [30].
Glioblastoma is a highly malignant brain tumor that is characterized by its invasive growth and resistance to current therapies. Metabolomics, the study of the small molecule metabolites in biological systems, has emerged as a powerful tool for understanding the metabolic alterations that occur in glioblastoma cells and for identifying potential targets for therapy. Metabolomics studies of glioblastoma have also identified potential metabolic biomarkers that can be used for diagnosis or monitoring of the disease. For example, studies have identified 2-hydroxyglutarate as an oncometabolite, which level is elevated not only in patients with 2-hydroxyglutaric aciduria but also in the biological fluids of patients with glioblastoma [31,32,33,34,35,36].
Overall, metabolomics studies based on LC-MS have emerged as a valuable tool for understanding the metabolic alterations that occur in glioblastoma cells and for identifying potential targets for therapy. Further research in this area is needed to fully exploit the potential of metabolomics for the development of new therapies for glioblastoma.

5. Conclusions

In conclusion, the application of HILIC-MS to investigate the metabolic heterogeneity of cultured glioblastoma cells has provided valuable insights into the transformed metabolism of polar and ionic compounds. Specifically, the analysis of amino acids using HILIC-MS has appeared to be particularly informative, as it has revealed significant alterations in the levels of various amino acids, which might play the critical roles in tumor growth and proliferation. So, in addition, to common dysregulated metabolic pathways among different types of glioblastoma cells, which can be exploited as potential therapeutic targets, the use of HILIC-MS for studying the metabolic heterogeneity of glioblastoma cells is a promising approach for advancing our understanding of this complex disease and expansion of the possible spectrum for the therapeutic approaches.

Author Contributions

All coauthors participated on conceptualization, methodology, validation, formal analysis, investigation, data curation, and writing—review and editing. Resources and funding acquisition R.M., and E.G.; writing—original draft preparation, supervision, and project administration, R.M. All authors have read and agreed to the published version of the manuscript.

Funding

This research was funded by the grant agency of the Ministry of Education, Research, Development and Youth of the Slovak Republic, grant number VEGA 1/0042/24.

Institutional Review Board Statement

Not applicable.

Informed Consent Statement

Not applicable.

Data Availability Statement

The research data are available after request.

Acknowledgments

The authors are very grateful to Katarina Dibdiaková and Jozef Hatok from Comenius University in Bratislava, Jessenius Faculty of Medicine in Martin, Slovakia, for their valuable discussions and excellent technical help.

Conflicts of Interest

The authors declare no conflicts of interest.

References

  1. Hanif F, Muzaffar K, Perveen kahkashan, et al (2017) Glioblastoma Multiforme: A Review of its Epidemiology and Pathogenesis through Clinical Presentation and Treatment. APJCP 18:. [CrossRef]
  2. Lapointe S, Perry A, Butowski NA (2018) Primary brain tumours in adults. The Lancet 392:432–446. [CrossRef]
  3. Bernhard C, Reita D, Martin S, et al (2023) Glioblastoma Metabolism: Insights and Therapeutic Strategies. IJMS 24:9137. [CrossRef]
  4. Zarzuela L, Durán RV, Tomé M (2023) Metabolism and signaling crosstalk in glioblastoma progression and therapy resistance. Molecular Oncology 1878–0261.13571. [CrossRef]
  5. Pavlova NN, Zhu J, Thompson CB (2022) The hallmarks of cancer metabolism: Still emerging. Cell Metabolism 34:355–377. [CrossRef]
  6. Kim J, DeBerardinis RJ (2019) Mechanisms and Implications of Metabolic Heterogeneity in Cancer. Cell Metabolism 30:434–446. [CrossRef]
  7. Tong Y, Gao W-Q, Liu Y (2020) Metabolic heterogeneity in cancer: An overview and therapeutic implications. Biochimica et Biophysica Acta (BBA) - Reviews on Cancer 1874:188421. [CrossRef]
  8. Demicco M, Liu X-Z, Leithner K, Fendt S-M (2024) Metabolic heterogeneity in cancer. Nat Metab 6:18–38. [CrossRef]
  9. Xu E, Ji B, Jin K, Chen Y (2023) Branched-chain amino acids catabolism and cancer progression: focus on therapeutic interventions. Front Oncol 13:1220638. [CrossRef]
  10. Gondáš E, Kráľová Trančíková A, Baranovičová E, et al (2022) Expression of 3-Methylcrotonyl-CoA Carboxylase in Brain Tumors and Capability to Catabolize Leucine by Human Neural Cancer Cells. Cancers 14:585. [CrossRef]
  11. Lieu EL, Nguyen T, Rhyne S, Kim J (2020) Amino acids in cancer. Exp Mol Med 52:15–30. [CrossRef]
  12. Chen J, Cui L, Lu S, Xu S (2024) Amino acid metabolism in tumor biology and therapy. Cell Death Dis 15:42. [CrossRef]
  13. Chen S, Jiang J, Shen A, et al (2022) Rewired Metabolism of Amino Acids and Its Roles in Glioma Pathology. Metabolites 12:918. [CrossRef]
  14. Wei Z, Liu X, Cheng C, et al (2021) Metabolism of Amino Acids in Cancer. Front Cell Dev Biol 8:603837. [CrossRef]
  15. Cheng C, Geng F, Cheng X, Guo D (2018) Lipid metabolism reprogramming and its potential targets in cancer. Cancer Communications 38:1–14. [CrossRef]
  16. Kou Y, Geng F, Guo D (2022) Lipid Metabolism in Glioblastoma: From De Novo Synthesis to Storage. Biomedicines 10:1943. [CrossRef]
  17. Vettore L, Westbrook RL, Tennant DA (2020) New aspects of amino acid metabolism in cancer. Br J Cancer 122:150–156. [CrossRef]
  18. Badr CE, Silver DJ, Siebzehnrubl FA, Deleyrolle LP (2020) Metabolic heterogeneity and adaptability in brain tumors. Cell Mol Life Sci 77:5101–5119. [CrossRef]
  19. Griguer CE, Oliva CR, Gillespie GY (2005) Glucose Metabolism Heterogeneity in Human and Mouse Malignant Glioma Cell Lines. J Neurooncol 74:123–133. [CrossRef]
  20. Hensley CT, Faubert B, Yuan Q, et al (2016) Metabolic Heterogeneity in Human Lung Tumors. Cell 164:681–694. [CrossRef]
  21. Coskun O (2016) Separation Tecniques: CHROMATOGRAPHY. North Clin Istanbul. [CrossRef]
  22. Holčapek, M, Byrdwell, WmC (2017) Handbook of Advanced Chromatography /mass Spectrometry Techniques.
  23. Moldoveanu S, David V (2022) Other HPLC separations performed on hydrophobic stationary phases. In: Essentials in Modern HPLC Separations.
  24. Zhang T-Y, Li S, Zhu Q-F, et al (2019) Derivatization for liquid chromatography-electrospray ionization-mass spectrometry analysis of small-molecular weight compounds. TrAC Trends in Analytical Chemistry 119:115608. [CrossRef]
  25. Spagou K, Tsoukali H, Raikos N, et al (2010) Hydrophilic interaction chromatography coupled to MS for metabonomic/metabolomic studies. J of Separation Science 33:716–727. [CrossRef]
  26. Tang D, Zou L, Yin X, Ong CN (2016) HILIC-MS for metabolomics: An attractive and complementary approach to RPLC-MS. Mass Spectrometry Reviews 35:574–600. [CrossRef]
  27. Gondáš E, Kráľová Trančíková A, Dibdiaková K, et al (2023) Immunodetection of Pyruvate Carboxylase Expression in Human Astrocytomas, Glioblastomas, Oligodendrogliomas, and Meningiomas. Neurochem Res 48:1728–1736. [CrossRef]
  28. Gondáš E, Kráľová Trančíková A, Majerčíková Z, et al (2021) Expression of pyruvate carboxylase in cultured human astrocytoma, glioblastoma and neuroblastoma cells. gpb 40:127–135. [CrossRef]
  29. Lowry OH, Rosebrough NJ, Farr AL, Randall RJ (1951) Protein measurement with the Folin phenol reagent. 2: J Biol Chem 193.
  30. Commisso C, Davidson SM, Soydaner-Azeloglu RG, et al (2013) Macropinocytosis of protein is an amino acid supply route in Ras-transformed cells. Nature 497:633–637. [CrossRef]
  31. Xu W, Yang H, Liu Y, et al (2011) Oncometabolite 2-Hydroxyglutarate Is a Competitive Inhibitor of α-Ketoglutarate-Dependent Dioxygenases. Cancer Cell 19:17–30. [CrossRef]
  32. Wanders RJA, Mooyer P (1995) d-2-Hydroxyglutaric acidaemia: identification of a new enzyme,d-2-hydroxyglutarate dehydrogenase, localized in mitochondria. J Inherit Metab Dis 18:194–196. [CrossRef]
  33. Du X, Hu H (2021) The Roles of 2-Hydroxyglutarate. Front Cell Dev Biol 9:651317. [CrossRef]
  34. Carbonneau M, M. Gagné L, Lalonde M-E, et al (2016) The oncometabolite 2-hydroxyglutarate activates the mTOR signalling pathway. Nat Commun 7:12700. [CrossRef]
  35. Gondáš E, Baranovičová E, Bystrický P, et al (2024) Both Enantiomers of 2-Hydroxyglutarate Modulate the Metabolism of Cultured Human Neuroblastoma Cells.
  36. Yang M, Soga T, Pollard PJ (2013) Oncometabolites: linking altered metabolism with cancer. J Clin Invest 123:3652–3658. [CrossRef]
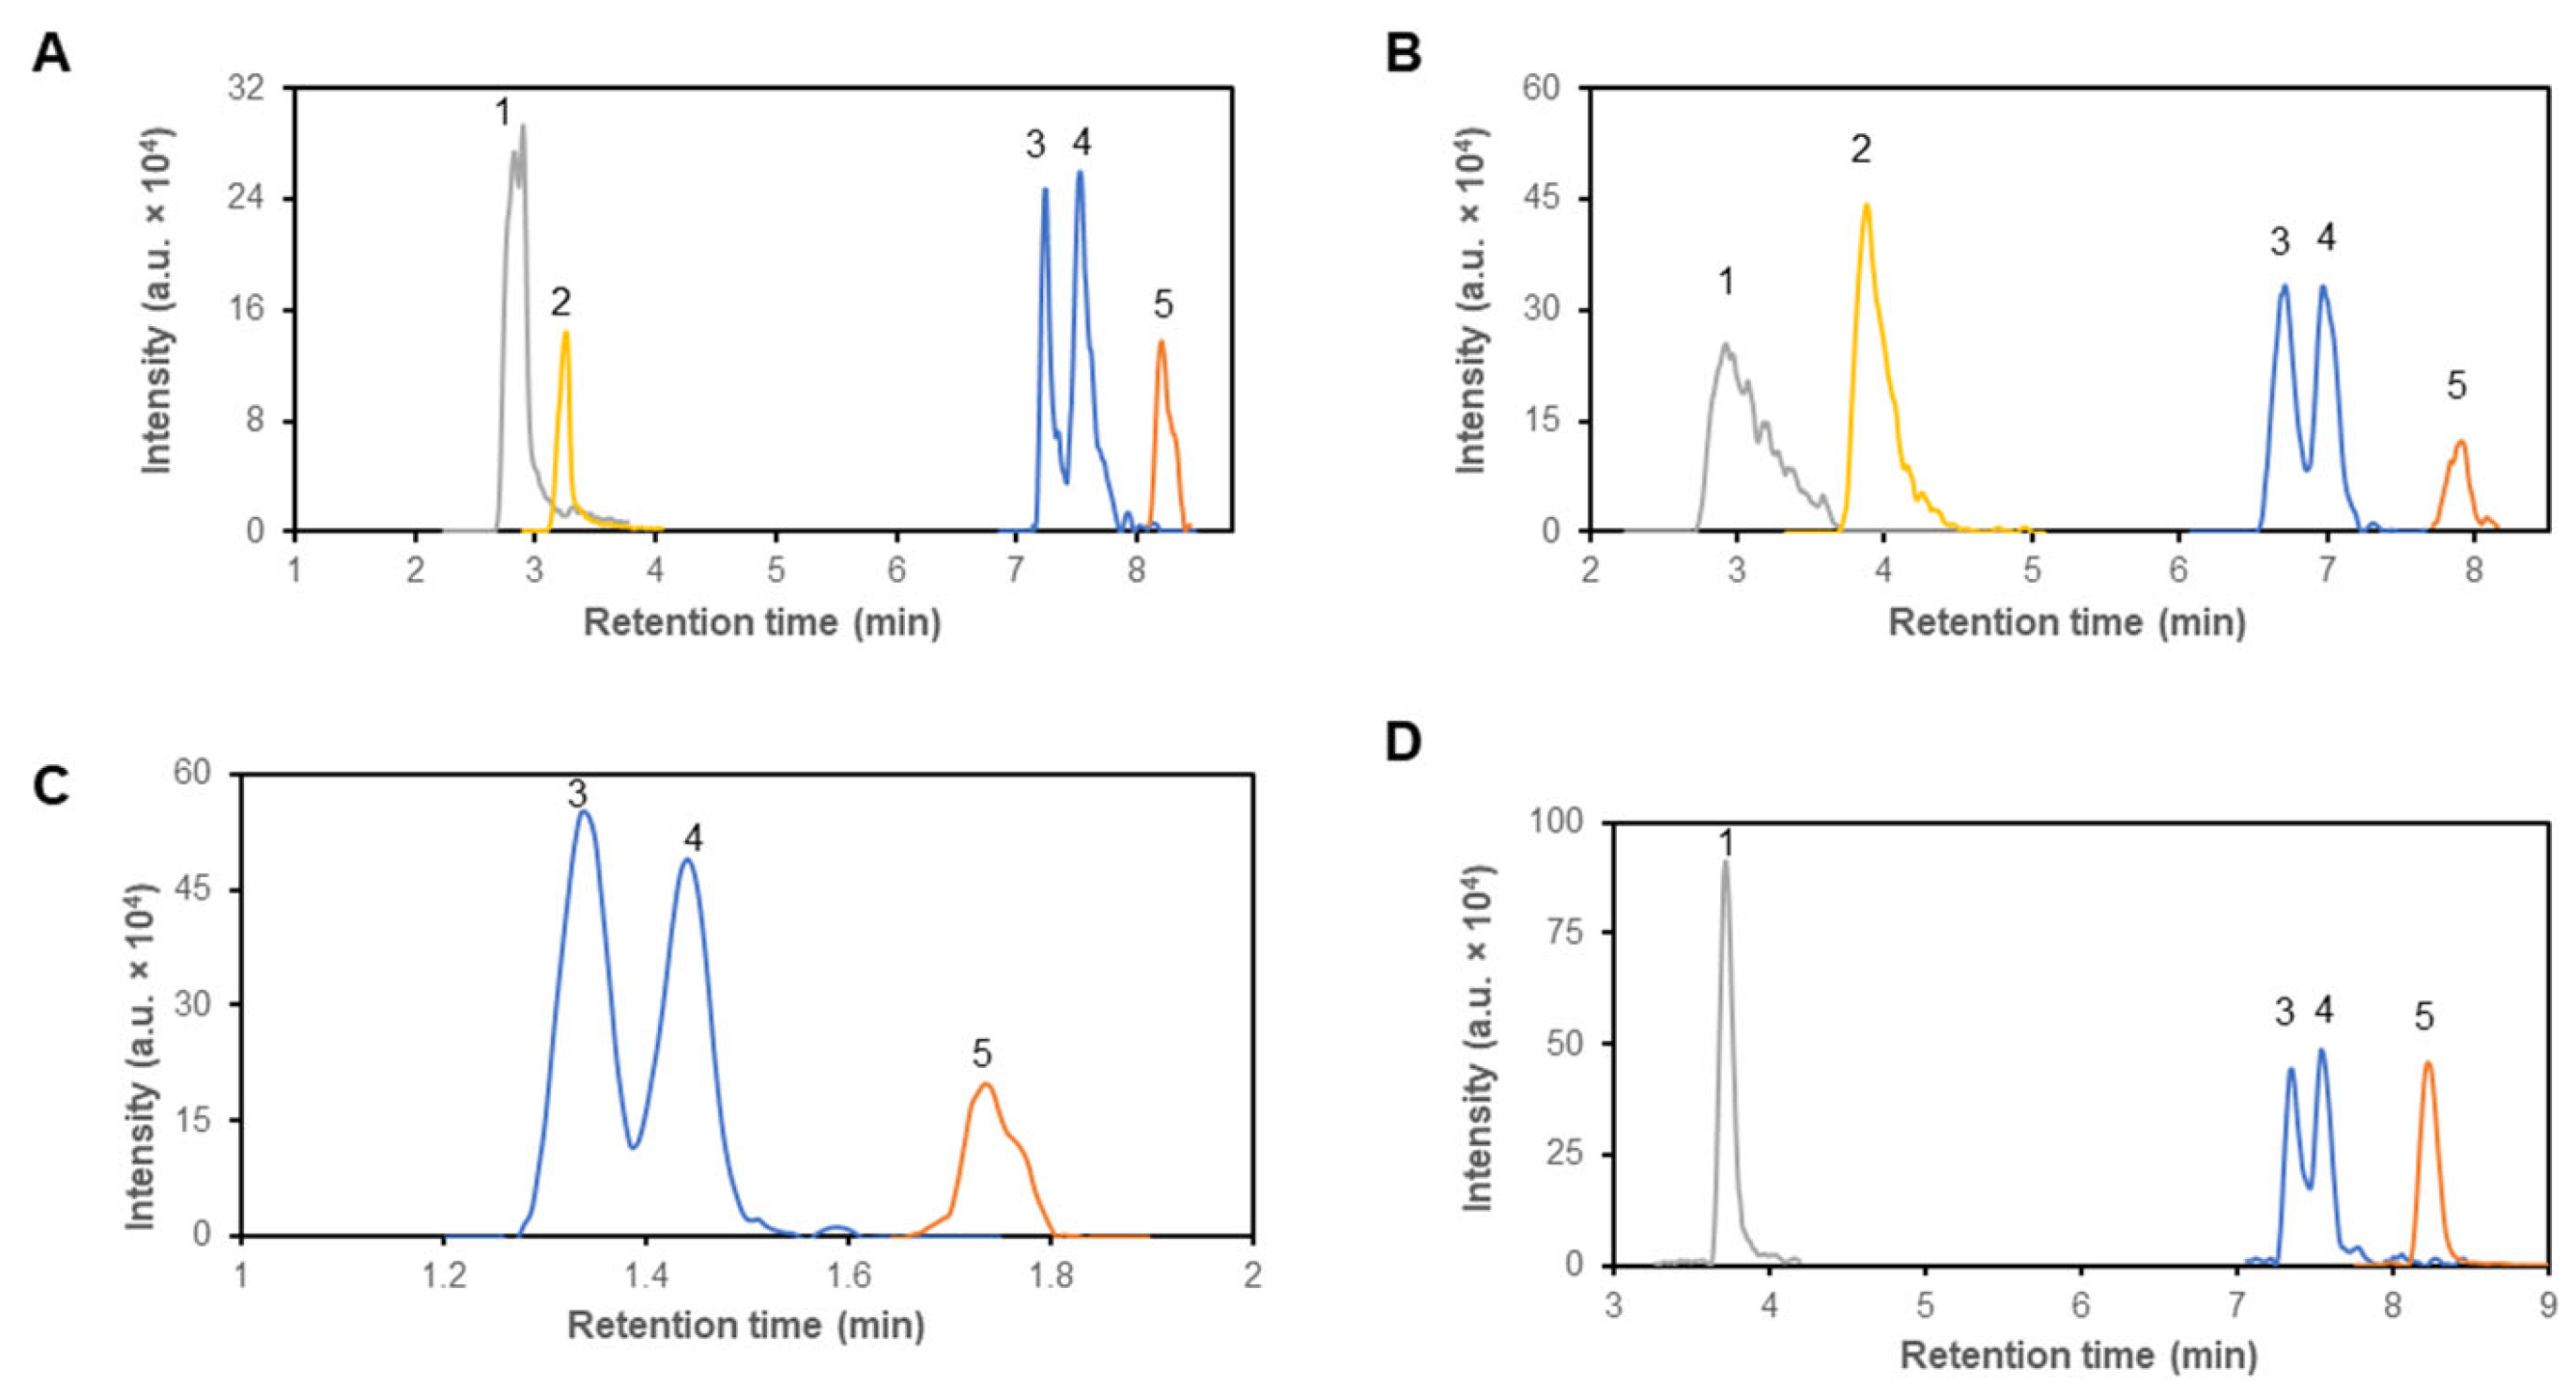
Figure 1. Representative chromatogram of of α-ketoisocaproic acid (1), α-keto-β-methylvaleric acid (2), isoleucine (3), leucine (4) and valine (5), on four different columns – Sequant® ZIC® cHILIC (A), Sequant® ZIC® pHILIC (B), Raptor polar X (C) and YMC-triart Diol-HILIC (D). Compounds were detected according to their m/z values. Mass concentration of all compounds was 1 μg/mL.
Preprints 103518 g001
Figure 2. Representative chromatogram of isoleucine (1), leucine (2) and isotopically labeled 13C6,15N-leucine (3) separation on Sequant® ZIC® cHILIC column. The m/z values were used for identification after elution.
Preprints 103518 g002
Figure 3. Metabolic changes in culture medium of two glioblastoma cell lines (T98G and U118) incubated for 24 h. (A) Heat map, where data are expressed as average of fold change of metabolites in medium without cells and metabolites in medium after incubation. Metabolites depicted with blue color are taken up from medium and metabolites depicted with red color are released to medium. (B) Increase of 5-methylthioadenosine and 4-methyl-2-oxopentanoate/3-methyl-2-oxopentanoate in culture medium after incubation. These are depicted here in separate graphs because it was not possible to calculate fold change, since the two were not detected in medium without cells. Blue color represents T98G cell line, and red U118 cell line. Numbers of replicates for each sample is three (n = 3). Error bars are expressed as SEM.
Preprints 103518 g003
Figure 4. Changes of metabolites in culture medium of T98G (blue) and U118 (red) cell lines. Bar graphs of metabolites indicating specific uptake or release after 24 hours of incubation. Numbers of replicates for each sample is three (n = 3). Error bars are expressed as SEM.
Preprints 103518 g004
Figure 5. Principal component analysis (PCA) score plot of three replicates of two different groups, from all metabolites detected in collected culture media (A) or cell lysates (B) of both types of glioblastoma cells, T98G (red) or U118 (green).
Preprints 103518 g005
Figure 6. Intracellular content of metabolites in two types of glioblastoma cells, T98G and U118. (A) Heatmap represents the estimated average amount of substance in micromole per mg of lysate proteins. (B) The relative levels of glucose and carnitine are presented on separate graphs since their content was quantify only relatively as the signal of the compound to peak area of internal standard. Two cell lines were compared -T98G (blue) and U118 (red). Relative quantification is expressed as ratio of peak area of analyte to peak area of internal standard. Numbers of replicates for each sample is three (n = 3). Error bars are expressed as SEM.
Preprints 103518 g006
Figure 7. Estimation of the intracellular levels of metabolites in cultured T98G (blue column) and U118 (red) glioblastoma cells by LC-MS. The metabolites were quantified in lysates derived from culture cells. Bar graphs representing the molar amount of substance standardized per one mg of lysates proteins. Numbers of replicates for each sample is three (n = 3). Error bars are expressed as SEM.
Preprints 103518 g007
Table 1. The list of compounds detected by LC-MS. The common and IUPAC names for detected compounds with a value of m/z and retention time (tR) which were used for identification of the compound chromatogram obtained after separation on Sequant® ZIC®-cHILIC column.
Common name IUPAC name m/z tR (min)
Acetoacetate 3-Oxobutanoic acid 101.0258 5.5
Acetylcarnitine 3-Acetyloxy-4-trimethylammonio-butanoate 204.1230 13.3
Acetyl-CoA O1-{(3R)-4-[(3-{[2-(Acetylsulfanyl)ethyl]amino}-3-oxopropyl)amino]-3-hydroxy-2,2-dimethyl-4-oxobutyl} O3-{[(2R,3S,4R,5R)-5-(6-amino-9H-purin-9-yl)-4-hydroxy-3-(phosphonooxy)oxolan-2-yl]methyl} dihydrogen diphosphate 404.0488 12.3
Acetylcholine 2-Acetoxy-N,N,N-trimethylethanaminium 146.174 8.0
N-Acetylcysteine 2-Acetamido-3-sulfanylpropanoic aci 164.0914 6.3
Adenosine 2-(6-Amino-9H-purin-9-yl)-5-(hydroxymethyl)oxolane-3,4-diol 268.1022 3.7
ADP [(2R,3S,4R,5R)-5-(6-Aminopurin-9-yl)-3,4-dihydroxyoxolan-2-yl]methyl phosphono hydrogen phosphate 426.0137 11.2
AICA Riboside-5-phosphate 1-(5-Amino-4-carbamoyl-1H-imidazol-1-yl)-1,4-anhydro-D-ribitol 5-(dihydrogen phosphate) 339.0685 10.8
ALA-GLY 2-(2-Aminopropanoylamino)acetic acid 218.1135 5.5
Alanine 2-Aminopropanoic acid 90.055 7.3
β-Alanine 3-Aminopropanoic acid 161.0909 15.6
Alanyl-Glutamine 5-Amino-2-[[(2S)-2-aminopropanoyl]amino]-5-oxopentanoic acid 218.1508 5.7
γ-Aminobutyric acid 4-Aminobutanoic acid 104.0706 4.6
Arachidonic acid Icosa-5,8,11,14-tetraenoic acid 303.2324 1.7
Arachidonic acid methyl ester Methyl-icosa-5,8,11,14-tetraenoic acid 319.2225 1.7
Arginine 2-Amino-5-(diaminomethylideneamino)pentanoic acid 175.119 15.9
Ascorbic acid 3,4-Dihydroxy-5-((S)- 1,2-dihydroxyethyl)furan-2(5H)-one 175.0238 12.7
Asparagine 2,4-Diamino-4-oxobutanoic acid 133.0596 10.4
Aspartic acid 2-Aminobutanedioic acid 134.0476 10.9
ATP [[(2R,3S,4R,5R)-5-(6-Aminopurin-9-yl)-3,4-dihydroxyoxolan-2-yl]methoxy-hydroxyphosphoryl] phosphono hydrogen phosphate (-)505.9805 14.0
507.9996 14.0
Betaine 2-(Trimethylazaniumyl)acetate 118.0863 1.6
Biopterin 2-Amino-6-(1,2-dihydroxypropyl)-1H-pteridin-4-one (-)236.0804 7.2
238.1131 7.2
Biotin 2-Oxohexahydro-1H-thieno[3,4-d]imidazol-4-yl]pentanoic acid 245.0954 8.8
Butyrylcarnitine 3-Butanoyloxy-4-(trimethylazaniumyl)butanoate 232.1543 10.8
Caffeine 1,3,7-Trimethyl-3,7-dihydro-1H-purine-2,6-dion 195.0937 1.8
cAMP (4aR,6R,7R,7aS)-6-(6-Aminopurin-9-yl)-2-hydroxy-2-oxo-4a,6,7,7a-tetrahydro-4H-furo[3,2-d][1,3,2]dioxaphosphinin-7-ol (-)328.0414 9.7
330.0603 9.7
Carnitine 3-Hydroxy-4-(trimethylazaniumyl)butanoate 227.1125 12.1
162.1125 15.6
Carnosine 2-(3-Aminopropanamido)-3-(3H-imidazol-4-yl)propanoic acid 227.1125 12.1
Cervonic acid Docosa-4,7,10,13,16,19-hexaenoic acid 327.2330 2.2
Citric acid 2-Hydroxypropane-1,2,3-tricarboxylic acid 191.0197 21.6
Citrulline 2-Amino-5-(carbamoylamino)pentanoic acid[ 176.1029 10.3
Coenzyme A [[(2R,3S,4R,5R)-5-(6-Aminopurin-9-yl)-4-hydroxy-3-phosphonooxyoxolan-2-yl]methoxy-hydroxyphosphoryl] [(3R)-3-hydroxy-2,2-dimethyl-4-oxo-4-[[3-oxo-3-(2-sulfanylethylamino)propyl]amino]butyl] hydrogen phosphate 357.0813 5.3
Creatine 2-[Carbamimidoyl(methyl)amino]acetic acid 132.0768 2.4
Creatinine 2-Amino-1-methyl-5H-imidazol-4-one 114.0662 8.5
Cystathionine S-((R)-2-Amino-2-carboxyethyl)-L-homocysteine 223.0742 13.1
Cytosine 4-Aminopyrimidin-2(1H)-one 112.0497 6.4
Decanoylcarnitine 3-Decanoyloxy-4-(trimethylazaniumyl)butanoate 316.2482 7.6
7,8-Dihydrobiopterin 2-Amino-6-(1,2-dihydroxypropyl)-7,8-dihydro-1H-pteridin-4-one 240.1149 7.5
Dimethylarginine (2S)-5-(Diaminomethylideneamino)-2-(dimethylamino)pentanoic acid 203.1491 10.3
Dimethyllysine 2-Amino-6-(dimethylamino)hexanoic acid 175.1428 17.7
Dodecanoylcarnitine 3-Decanoyloxy-4-(trimethylazaniumyl)butanoate 344.2795 7.4
Dopamine 4-(2-Aminoethyl)benzene-1,2-diol 154.0863 2.3
EDTA 2-[2-[Bis(carboxymethyl)amino]ethyl-(carboxymethyl)amino]acetic acid (-)291.0769 12.1
293.0982 12.1
EGTA 2-[2-[2-[2-[Bis(carboxymethyl)amino]ethoxy]ethoxy]ethyl-(carboxymethyl)amino]acetic acid 381 10.0
Folic acid 2-[[4-[(2-Amino-4-oxo-1H-pteridin-6-yl)methylamino]benzoyl]amino]pentanedioic acid 440.1324 8.7
Fructose-6-phosphate 6-O-Phosphono-α-D-fructofuranose 259.0217 11.7
Fumaric acid (E)-But-2-enedioic acid 115.0037 17.6
Gabapentin 2-[1-(Aminomethyl)cyclohexyl]acetic acid 172.1332 1.7
Glucose (3R,4S,5S,6R)-6-(Hydroxymethyl)oxane-2,3,4,5-tetrol 179.0561 7.8
Glucose-6-phosphate Glucopyranose 6-phosphate 259.0224 19.4
L-Glutamic acid (2S)-2-Aminopentanedioic acid 148.0604 10.2
L-Glutamine (2S)-2,5-Diamino-5-oxopentanoic acid 147.0764 9.8
Glutaric acid Pentanedioic acid 131.0346 12.1
Glutathione (2S)-2-Amino-5-[[(2R)-1-(carboxymethylamino)-1-oxo-3-sulfanylpropan-2-yl]amino]-5-oxopentanoic acid 308.0906 11.4
Glycerol 1-phosphate 2,3-Dihydroxyprop yl dihydrogen phosphate 171.008 10.9
Guanine 2-Amino-1,9-dihydro-6H-purin-6-one 152.0563 7.1
GMP [(2R,3S,4R,5R)-5-(2-Amino-6-oxo-1H-purin-9-yl)-3,4-dihydroxyoxolan-2-yl]methyl dihydrogen phosphate 362.0501 11.2
Hexanoylcarnitine 3-Hexanoyloxy-4-(trimethylazaniumyl)butanoate 260.1856 8.9
Histamine 2-(1H-Imidazol-4-yl)ethanamine 112.0869 11.4
Histidine 2-Amino-3-(1H-imidazol-5-yl)propanoic acid 156.0768 14.1
Homocarnosine 2-(4-Aminobutanoylamino)-3-(1H-imidazol-5-yl)propanoic acid 241.1278 12.2
Homocysteine 2-Amino-4-sulfanylbutanoic acid 136.0427 9.8
α-Hydroxyglutaric acid 2-Hydroxypentanedioic acid 147.0293 12.0
3-Hydroxybutyric acid 3- Hydroxypentanedioic acid 103.0401 2.4
D-2-Hydroxyglutaric acid (2R)-2-Hydroxypentanedioic acid 147.0314 11.4
L-2-Hydroxyglutaric acid (2S)-2-Hydroxypentanedioic acid 147.0314 11.4
3-Hydroxyisobutyric acid 3-Hydroxy-2-methylpropanoic acid 103.0401 2.4
Hydroxyproline 4-Hydroxypyrrolidine-2-carboxylic acid 132.0998 10.0
Hypoxanthine 1,9-Dihydro-6H-purin-6-one 135.0375 5.7
Inosine 3,4-Dihydroxy-5-(hydroxymethyl)oxolan-2-yl]-6,9-dihydro-3H-purin-6-one 269.0858 6.9
Inosine 5′-monophosphate [3,4-bis(trimethylsilyloxy)-5-(6-trimethylsilyloxypurin-9-yl)oxolan-2-yl]methyl bis(trimethylsilyl) phosphate (-)347.041 10.7
349.1287 10.7
Inositol Cyclohexane-1,2,3,4,5,6-hexol 179.0521 8.9
Isocitrate 1-Hydroxypropane-1,2,3-tricarboxylic acid 191.0197 21.6
Isoleucine 2-Amino-3-methylpentanoic acid 132.1019 7.3
Isovaleryl-CoA S-{(9R)-1-[(2R,3S,4R,5R)-5-(6-Amino-9H-purin-9-yl)-4-hydroxy-3-(phosphonooxy)tetrahydro-2-furanyl]-3,5,9-trihydroxy-8,8-dimethyl-3,5-dioxido-10,14-dioxo-2,4,6-trioxa-11,15-diaza-3λ5,5λ5- diphosphaheptadecan-17-yl} 2-methylpropanethioate 850.1486 11.1
Itaconic acid Methylidenebutanedioic acid 129.0219 10.2
α-Ketoisocaproic acid 4-Methyl-2-oxopentanoic acid (-)129.0582 1.9
α-Ketoisovaleric acid 3-Methyl-2-oxobutanoic acid (-)115.0428 2.3
α-Keto-β-methylvaleric acid 2-formylpentanoic acid (-)129.0582 1.9
Kynurenine 2-Amino-4-(2-aminophenyl)-4-oxo-butanoic acid 209.0921 11.2
Lactic acid 2-Hydroxypropanoic acid 89.0244 2.0
Leucine 2-Amino-4-methylpentanoic acid 132.1019 7.5
γ-Linolenic acid Octadeca-6,9,12-trienoic acid 277.2173 2.2
Linoleic acid Octadeca-9,12-dienoate 279.233 2.3
Lysine 2,6-Diaminohexanoic acid 147.1128 15.8
Malic acid 2-Hydroxybutanedioic acid 133.0142 17.5
Methionine 2-Amino-4-(methylthio)butanoic acid 150.0583 8.8
3-Methyladenine 3-Methyl-7H-purin-6-imine 157.0774 2.4
Methylcrotonyl-CoA 3′-O-Phosphonoadenosine 5′-[(3R)-3-hydroxy-2-methyl-4-{[3-({2-[(3-methylbut-2-enoyl)sulfanyl]ethyl}amino)-3-oxopropyl]amino}-4-oxobutyl dihydrogen diphosphate] 850.1654 11.3
(-)848.1336 11.3
5-Methylcytosine 4-Amino-5-methylpyrimidin-2(1H)-one 126.0617 4.2
6-O-Methylguanine 6-Methoxy-9H-purin-2-amine 166.0703 3.6
7-Methylguanine 2-Amino-7-methyl-1,7-dihydro-6H-purin-6-one 166.071 5.5
5-Methylthioadenosine 5′-S-Methyl-5′-thioadenosine 298.0958 1.9
Trimethyllysine (5-Amino-5-carboxypentyl)-trimethylazanium 189.1598 8.5
NAD+ 5-(6-Aminopurin-9-yl)-3,4-dihydroxyoxolan-2-yl]methoxy-hydroxyphosphoryl] [(2R,3S,4R,5R)-5-(3-carbamoylpyridin-1-ium-1-yl)-3,4-dihydroxyoxolan-2-yl]methyl hydrogen phosphate 665.1215 16.8
NADH 5-(6-Aminopurin-9-yl)-3,4-dihydroxyoxolan-2-yl]methoxy-oxidophosphoryl] [(2R,3S,4R,5R)-5-(3-carbamoylpyridin-1-ium-1-yl)-3,4-dihydroxyoxolan-2-yl]methyl phosphate 666.1337 16.4
Neopterin 2-Amino-6-(1,2,3-trihydroxypropyl)pteridin-4(1H)-one 252.0678 8.9
Neopterin 2-Amino-6-(1,2,3-trihydroxypropyl)pteridin-4(1H)-one 254.1203 8.9
Niacinamide Pyridine-3-carboxamide 123.057 1.8
N-Methyl-D-aspartic acid 2-(Methylamino)butanedioic acid (-)146.0484 7.1
148.0605 7.1
N-Methyllysine [(5S)-5-Carboxy-5-(methylamino)pentyl]azanium 161.1273 16.2
N-Methyl phenylalanine 2-(Methylamino)-3-phenylpropanoic acid 180.1015 7.2
Octanoylcarnitine 3-Octanoyloxy-4-(trimethylazaniumyl)butanoate 288.2169 8.0
Ornithine 2,5-Diaminopentanoic acid 133.0972 15.5
2-Oxoglutarate 2-Oxopentanedioic acid 145.0142 16.0
Palmitic acid Hexadecanoic acid 255.2330 2.3
Palmitoylcarnitine 3-hexadecanoyloxy-4-(trimethylazaniumyl)butanoate 400.3421 7.0
Pantothenic acid 2,4-Dihydroxy-3,3-dimethylbutanamido]propanoic acid (-)218.0983 7.4
220.1334 7.4
Phenylalanine 2-Amino-3-phenylpropanoic acid 166.9863 7.2
Phenylbutyric acid 4-Phenylbutanoic acid 163.076 2.2
Phosphocreatine N-Methyl-N-(phosphonocarbamimidoyl)glycine 210.0258 12.2
Phosphoenolpyruvate 2-(Phosphonooxy)prop-2-enoic acid 169.1011 1.4
Proline Pyrrolidine-2-carboxylic acid 116.0706 8.5
Pyridoxine 4,5-Bis(hydroxymethyl)-2-methylpyridin-3-ol 170.0941 2.7
Pyroglutamic acid 5-Oxopyrrolidine-2-carboxylic acid 130.0449 10.2
Retinol 3,7-Dimethyl-9-(2,6,6-trimethylcyclohex-1-en-1-yl)nona-2,4,6,8-tetraen-1-ol 285.2224 3.9
Riboflavin 7,8-Dimethyl-10-[(2S,3S,4R)-2,3,4,5-tetrahydroxypentyl]benzo[g]pteridine-2,4-dione 377.1488 4.0
Ribose 5-(Hydroxymethyl)oxolane-2,3,4-triol 149.047 9.9
Serotonin 3-(2-Aminoethyl)-1H-indol-5-ol 177.1002 3.2
Stearic acid Octadecanoic acid 283.2643 2.3
Succinyl-CoA 4-{[1,3-Dihydroxy-1,3-dioxo-3-(3′-O-phosphonoadenosin-5′-O-yl)-1λ5,3λ5-diphosphoxan-1-yl]oxy}-3,3-dimethylbutanamido]propanamido}ethyl)sulfanyl]-4-oxobutanoic acid 117.0198 11.8
Taurine 2-Aminoethanesulfonic acid 126 10.0
Tetradecanoylcarnitine 3-Tetradecanoyloxy-4-(trimethylazaniumyl)butanoate 372.3108 7.2
Tetrahydrobiopterin 2-Amino-6-[(1R,2S)-1,2-dihydroxypropyl]-5,6,7,8-tetrahydropteridin-4(1H)-one 242.1244 7.9
Thiamine 2-[3-[(4-Amino-2-methylpyrimidin-5-yl)methyl]-4-methyl-1,3-thiazol-3-ium-5-yl]ethanol 265.1181 12.8
Threonine 2-Amino-3-hydroxybutanoic acid 120.0655 7.7
Tocopherol 2,5,7,8-Tetramethyl-2-[(4R,8R)-4,8,12-trimethyltridecyl]-3,4-dihydro-2H-1-benzopyran-6-ol 429.3738 2.2
Tryptophane 2-Amino-3-(1H-indol-3-yl)propanoic acid 205.0972 7.8
Tyrosine 2-Amino-3-(4-hydroxyphenyl)propanoic acid 182.0812 20.1
Valine 2-Amino-3-methylbutanoic acid 118.0863 7.7
Vitamin D 9,10-Secocholesta-5,7,10(19)-trien-3-ol 383.3319 3.0
Vitamin K 3,7,11,15-Tetramethylhexadec-2-enyl]naphthalene-1,4-dione 449.3425 4.3
Xanthine 3,7-Dihydro-1H-purine-2,6-dione 151.0285 5.8
(-) – detection of compound in negative mode.
Table 2. Retention time (tR) values estimated for leucine and isoleucine on tested columns with estimated peak resolution value.
Column tR(ILE)
(min)
tR(LEU)
(min)
Peak resolution
Sequant® ZIC®-cHILIC 7.3 7.5 1.28
Sequant® ZIC® pHILIC 6.7 7.0 1.08
Raptor Polar X 1.3 1.4 1.25
YMC-Triart-Diol-HILIC 7.4 7.5 0.55
Table 3. Concentration ranges, linearity, and precision for selected analytes. The linearity represents the value of R2 that was estimated by regression analysis for fit between relative area and analyte concentration. Coefficient of variation for precision was calculated from 5 measurements of standard sample and is expressed as relative standard error.
Analyte Concentration range (nM) Linearity Precision (%)
Adenosine 3.7 – 375 0.9920 5.4
Arginine 27.7 – 574 0.9664 19.2
Asparagine 7.5 – 751 0.9615 13.8
Glutamate 34 – 680 0.9734 13.5
Glutamine 68.4 – 685 0.9824 8.6
Glutathione - reduced 3.3 – 325 0.9820 15.9
Histidine 64.4 – 644 0.9923 30.5
Hypoxanthine 7.3 – 735 0.9857 8.4
Isoleucine 76.2 – 762 0.9690 8.7
Leucine 76.2 – 762 0.9637 8.2
Methionine 6.7 – 670 0.9718 29.7
5-Methylcytosine 40 – 800 0.9922 7.6
5-Methylthioadenosine 3.4 – 335 0.9978 10.2
Phenylalanine 6.1 – 605 0.9768 8.2
Threonine 8.4 – 840 0.9735 15.0
Tryptophan 4.9 – 490 0.9905 13.3
Disclaimer/Publisher’s Note: The statements, opinions and data contained in all publications are solely those of the individual author(s) and contributor(s) and not of MDPI and/or the editor(s). MDPI and/or the editor(s) disclaim responsibility for any injury to people or property resulting from any ideas, methods, instructions or products referred to in the content.
Copyright: This open access article is published under a Creative Commons CC BY 4.0 license, which permit the free download, distribution, and reuse, provided that the author and preprint are cited in any reuse.
Prerpints.org logo

Preprints.org is a free preprint server supported by MDPI in Basel, Switzerland.

Subscribe

© 2024 MDPI (Basel, Switzerland) unless otherwise stated