Submitted:
09 April 2024
Posted:
11 April 2024
You are already at the latest version
Abstract
We present a case report of a young patient with pectus carinatum who experienced a small right apex pneumothorax and exhibited Brugada patterns on electrocardiogram tracing. This is the first clinical case reporting Brugada pattern presentation in both a patient with pectus carinatum and a small pneumothorax. We conducted a clinical, anatomical, and electrocardiographic analysis to explore a physiopathological explanation for these findings, considering our patient had no history or clinical signs of Brugada Syndrome. We conclude that: 1. Pectus carinatum may create a window that facilitates the less resistive measurement of cardiac action potentials; 2. Small pneumothoraces can induce modifications in the cardiac electrical signal detected by surface electrodes, and pectus carinatum could unmask these modifications; and 3. Surface electrodes may measure subepicardial potentials that include and are modified by adjacent pericardial tissues, potentially resulting in alterations in transmural potential differences, thus producing fictitious Brugada patterns. Similarly, there is a possibility that the right ventricular outflow tract may be included within the subendocardial potentials.
Keywords:
Brugada Syndrome
; Brugada phenocopies
; Brugada patterns
; pectus carinatum
; pneumothorax
; subepicardium
I. Introduction
Brugada phenocopies (BrP) have recently gained recognition as separate clinical entities, with distinct etiologies compared to the ion channel dysfunctions described in Brugada Syndrome (BrS). Both conditions manifest with electrocardiographic patterns resembling BrS, but BrP is triggered by various factors that do not constitute a channelopathy in itself. Some of these factors include myocardial ischemia, pericarditis, myocarditis, metabolic disturbances, and mechanical mediastinal compression [1].
Mechanical mediastinal compression refers to conditions in which the heart experiences compression due to structural abnormalities in the thoracic region. For example, previous studies have identified Brugada electrocardiographic patterns in patients diagnosed with pectus excavatum, a sternal and costal structural condition that predisposes to mediastinal compression [2]. Furthermore, severe pneumothoraces and tension pneumothoraces have been linked to Brugada patterns. Consequently, the electrocardiographic manifestations of these conditions may be regarded as BrP. The effects of cardiac compression are one of the proposed mechanisms for these types of severe pneumothoraces [3,4,5].
Pectus excavatum, which comprises 90% of anterior chest wall deformities, is characterized by a concave depression of the sternum extending from the manubrium to the xiphoid process. It appears that the BrP arises from compression of the right ventricular outflow tract (RVOT) by the anterior chest wall [2,6,7]. Consequently, it seems logical that Brugada patterns would not be observed in the opposite deformity, known as pectus carinatum. To date, there are no reported instances of Brugada patterns in patients with pectus carinatum, regardless of whether it is BrS or BrP.
While the occurrence of Brugada patterns in patients with pectus excavatum is well-documented in scientific literature, a notable gap persists in our understanding regarding its presence in the contrasting thoracic deformity, pectus carinatum. This gap is primarily due to the absence of reported cases to date. Bridging this knowledge gap is crucial for achieving a comprehensive understanding of the range of electrocardiographic manifestations associated with chest wall deformities.
Pneumothorax, on the other hand, induces electrocardiographic alterations involving modifications in depolarization and repolarization; some of which have replicated Brugada patterns. However, these patterns have only been described in severe and tension pneumothoraces, which entail mediastinal compression that, as known, can manifest as BrP [3,4,5,8,9].
In this study, we present an analysis of the first instance of Brugada electrocardiographic patterns observed in a patient diagnosed with pectus carinatum, who was also diagnosed with a small right apex pneumothorax. We will explore the possible pathophysiological bases that may have contributed to the manifestation of Brugada patterns in our patient, considering that pectus carinatum has not been previously identified as an association with BrP and that pneumothoraces associated with reported BrP cases have been severe thus far.
II. Clinical Case Description
A 16-year-old male presented to the Urgency Department with costal pain that was exacerbated by respiratory movements, lasting for a week. He had no history of syncope or family history of sudden death; neither did he have a history of palpitations or vagal episodes. Physical examination revealed a malformation of the anterior chest wall consistent with pectus carinatum, with no other clinical findings suggesting acute organic pathology in any system. The diagnosis of pectus carinatum had been previously established prior to our examination and is documented in his medical record.
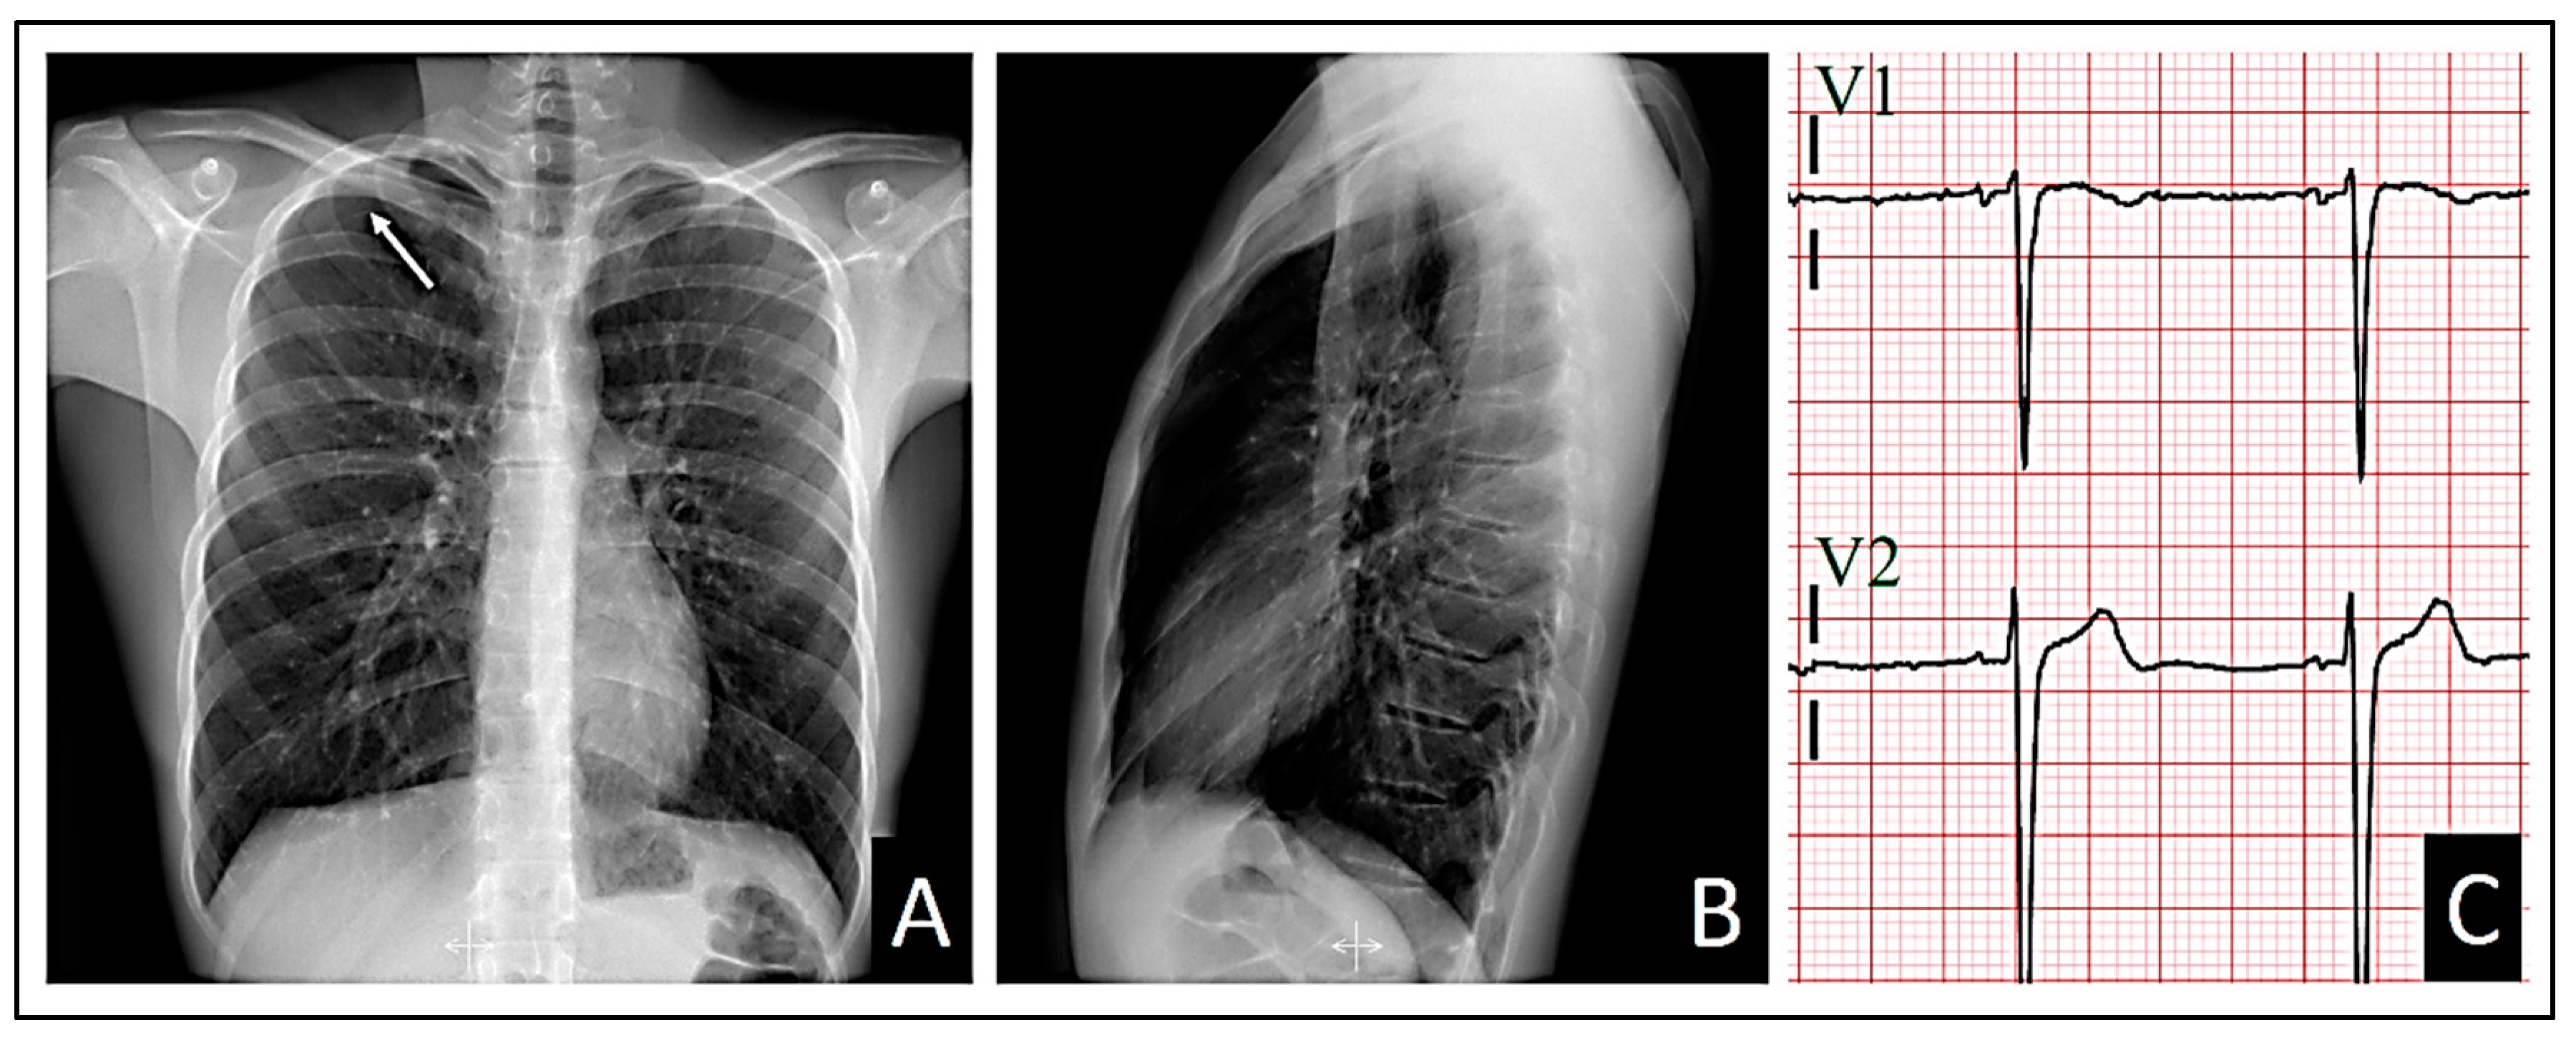
All the patient’s vital signs were within normal ranges. A posteroanterior and lateral chest X-ray, along with an electrocardiogram, were ordered. Although the pulmonary auscultation did not yield typical findings suggestive of any pulmonary parenchymal or pleural cavity pathology, the posteroanterior chest X-ray revealed a small pneumothorax at the right apex (Figure 1A). Consequently, the patient was referred to the Hospital Urgency Department, and an urgent consultation with Thoracic Surgery was requested.
In addition, the lateral chest X-ray showed no radiological signs of cardiac compression due to the sternocostal structural anomaly (Figure 1B).
The standard 12-lead electrocardiogram, performed with precordial electrodes in their typical positions (V1 and V2 is in the fourth intercostal space), showed a type 2 Brugada pattern in V2 and a type 3 pattern in V1, with a β angle [10,11,12] measuring over 58º (Figure 2). We also confirmed the QRS axis in the frontal plane to be 85º-90º.
When we displaced two intercostal spaces below their normal positions, the observed patterns vanished (Figure 3).
When we assessed the right precordial leads using V1 and V2 two intercostal spaces above the normal position, that is, at the level of the second intercostal space, the pattern in V2 shifted to a type 3 pattern, while the pattern in V1 persisted, albeit with a less pronounced morphology upon visual inspection (Figure 4). The right precordial leads were evaluated in search of patterns at those levels. However, no pathological changes in repolarization were evident from V3R to V6R.
The left leads with V1 and V2 at the third intercostal space showed an intermediate morphology between the morphologies observed at the second intercostal space and the normal position (Figure 5).
Both the chest X-ray and electrocardiogram were repeated at 48 hours, revealing an improvement in the pneumothorax with a halving of the pleural space volume, alongside the disappearance of Brugada patterns displaying appropriate morphology for identification. In lead V1, a tendency toward β angle formation persists, while in V2, a 1 mm elevation of the J point is evident with T-wave morphology tending to notch at its center. Nonetheless, no curves exhibit morphology of sufficient quality to suggest a pattern visually.
The QRS axis of our patient in this latest electrocardiogram remained within the same range as the previous one: 85º-90º.
Figure 6.
At 48 hours. A: Posteroanterior chest X-ray demonstrating improvement of the pneumothorax. B: Lateral chest X-ray still demonstrating absence of cardiac compression due to the patient’s thoracic morphology. C: Loss of Brugada patterns with the required quality for consideration.
Figure 6.
At 48 hours. A: Posteroanterior chest X-ray demonstrating improvement of the pneumothorax. B: Lateral chest X-ray still demonstrating absence of cardiac compression due to the patient’s thoracic morphology. C: Loss of Brugada patterns with the required quality for consideration.
In the hospital, our patient underwent a comprehensive blood analysis, which produced normal results.
III. Discussion
III.1. Pectus Carinatum and Brugada Patterns
Pectus carinatum is a structural deformity of the chest wall affecting nearly 1 in every 1000 adolescents. It consists of a congenital deformation characterized by an outward protrusion of the sternum or rib cage. While many cases are asymptomatic, some patients may experience tenderness at the protrusion site, reduced lung function, or even respiratory symptoms [2,6,12].
Unlike pectus excavatum, pectus carinatum typically does not involve cardiac compression due to the deformity, and to date, there is no evidence of Brugada patterns in this type of patients. Possibly, the lack of evidence of these electrocardiographic patterns may be because we believe that the absence of compression on the RVOT should not generate a Brugada pattern [2,6,12]. Therefore, patients with pectus carinatum are not candidates for the detection of such electrocardiographic abnormalities.
The type 1 Brugada patterns are the classic indicators, providing an immediate diagnosis of BrS, characterized by ST segment elevation from V1 to V3 [13] or in the inferior leads [14]. A distinguishing feature is the presence of an r’ wave followed by a slightly concave or straight ST segment. This descending ST segment crosses the isoelectric line and is followed by a negative and symmetric T-wave. On the other hand, we have type 2 pattern, which is a “saddleback” pattern with ST elevation, and type 3, characterized by the same “saddleback” pattern but with absence of ST elevation [11,12,13,14,15].
Previously, both type 2 and type 3 patterns were categorized as type 2 pattern or as “saddleback” pattern. The division of the type 2 pattern into two was necessary to conduct a more detailed analysis and facilitate differentiation of Brugada patterns with “saddleback” pattern without ST elevation; these are similar to other non-Brugada patterns, such as incomplete right bundle branch blocks [11,12,13]. While ST segment elevation is evident at first glance in a type 2 “saddleback” pattern, the type 3 pattern may raise doubts.
To correctly discriminate the presence of a type 3 pattern, the calculation of the β angle is necessary. This angle is precisely the angle formed between the ascending slope of the S wave and the descending slope of the r’ wave. For proper discrimination and diagnosis of a type 3 pattern, the β angle must be greater than 58°; a smaller angle suggests the presence of an incomplete right bundle branch block [14,15].
In our patient, initial identification of the type 2 pattern in V2, when electrodes were positioned at the fourth intercostal space, was straightforward. However, precise discernment of the type 3 pattern required β angle measurement. β angle measurements consistently exceeded 58° in all cases where visual indications of this pattern were noted. This facilitated confirmation that we were indeed observing a type 3 Brugada pattern rather than an incomplete right bundle branch block. It was interesting to observe in Figure 1 that in V2, the type 2 pattern tended towards a type 3 pattern with each recorded QRS-T complex, while the T wave decreased in amplitude. Since the ST elevation persisted, we still consider it a type 2 pattern. This observation might be attributed to the electrode positioned on the chest wall detecting an augmented subepicardial voltage relative to the subendocardial voltage. Consequently, this disparity in voltage during the phase 3 repolarization of the action potential [13] may be diminished, resulting in a reduction in T wave amplitude.
The observed patterns were most clearly visualized in the right precordial leads, specifically in V1 and V2. This finding suggests a possible direct involvement of the electrical signals captured by the electrodes closest to the right ventricle, influenced or not by the thoracic deformity in the form of pectus carinatum. It is not possible to ascertain or rule out that the thoracic deformity leads to the appearance of Brugada patterns when focusing electrode measurement in the region of the RVOT. However, when we moved the electrodes up and down from the third and fourth intercostal spaces, the characteristic morphology of the Brugada patterns was lost, suggesting a possible involvement of the RVOT in the genesis of these patterns. This is visually confirmed in the lateral radiograph where it can be observed that indeed the third and fourth intercostal spaces are closer to the likely radiographic location of the RVOT (Figure 7).
Contrary to the assertions made in scientific literature [1,2,6], the proposal of a cardiac compressive explanation at the right ventricular level to elucidate the Brugada patterns observed in our patient lacks logical coherence. This assertion is supported by radiological studies represented in Figure 1 and Figure 6, which revealed an absence of evident compression attributable to the thoracic disposition of pectus carinatum.
III.2. Small Pneumothorax and Brugada Patterns
We must add another factor to our discussion, as the electrocardiograms of patients with pneumothorax can undergo modifications and, in the most severe cases, even produce Brugada patterns [3,4,5,7,8,16]. We will need to analyze why our patient presented a Brugada pattern with a small apical right pneumothorax, which disappeared as the pneumothorax improved.
Armen and Frank [8] in 1949 studied forty-five cases with serial electrocardiograms of patients with pneumothorax. They indicated that the electrocardiographic patterns of patients with right pneumothorax are primarily the tendency for axis deviation towards the right, depression of the QRS in lead DI, and depression of P waves in limb leads. T-wave inversion was absent. Alternatively, electrocardiograms in patients with left pneumothorax were more evident, with lower voltage in QRS complexes of DI, flattening of T waves in DI, change in the contour of QRS complexes in chest leads, and definite inversion of T waves in chest leads; with these T-wave inversions being the most constant and conspicuous of all variables. It appears that the heart is more affected by left compressions than by right compressions. This is likely due to the heart’s anatomical arrangement from right to left, which protrudes more prominently towards the left hemithorax. Our patient had a small right apical pneumothorax, which, if causing electrocardiographic abnormalities, would likely manifest those described for right pneumothoraces by Armen and Frank. We did not find rightward deviation of the QRS axis, nor did we observe depression of the P wave in limb leads. However, we did observe a decrease in QRS amplitude in lead DI (Figure 1). Armen and Frank [8] proposed that the electrocardiographic manifestations described previously were the result of heart rotation and the presence of air between the heart and the chest wall. However, our patient shows some contradiction with this observation. While the presence of retrosternal air is evident (Figure 1), the right precordial lead V2 at the fourth intercostal space exhibited a type 2 Brugada pattern, which is more typical pattern of the type 3 pattern seen in V1. On the other hand, when moving the electrodes towards the third intercostal space, “Brugada pattern resolution” was lost, shifting from type 2 to type 1 pattern, with type 1 pattern maintained in V1 albeit less apparent. Considering that there is more cardiac empty space behind the third intercostal space than behind the fourth intercostal space, this suggests that probable physical contact of cardiac tissue with retrosternal tissue is necessary to trigger Brugada patterns. Additionally, it appears that the amount of air does indeed have an influence, but in our case, it seems to have a negative impact on the appearance and maintenance of the patterns.
The RVOT is directly implicated in the emergence of Brugada patterns. Although in our patient it is located just behind the third intercostal space and directly behind lead V2 when placed in this space, type 2 Brugada patterns are better visualized with the V2 electrode positioned in the fourth intercostal space, where sternocardiac contiguity is present. This close relationship between the heart and the sternum at the sternocardiac junction is due to the presence of the inferior sternopericardial ligament, which promotes direct physical contact between the apical cardiac tissue and the sternum, as opposed to what happens in the tissue adjacent to the RVOT, where there is more air interposed. The inferior sternopericardial ligament contributes to maintaining the sternopericardial junction even in supine positions, which are typical for electrocardiogram recordings. Furthermore, in the supine position, the amount of retrosternal air in the third intercostal space may increase; this is not the case in the fourth intercostal space, where there is more tendency for direct sternocardiac attachment due to the mentioned ligament. This allows us to extend the anatomical reasoning applied in anteroposterior and lateral chest X-rays to the electrocardiographic analysis of leads. The superior sternopericardial ligament is longer and more “movable”. It generally extends from the cardiac base to the manubrium of the sternum, and for the purposes of our investigation, its presence is not significant (Figure 8).
Walston et al. [3] conducted an analysis of seven patients with spontaneous left pneumothorax, wherein they observed a rightward deviation of the frontal QRS axis, decreased voltage of precordial R waves, diminished QRS complex amplitude, and inversion of precordial T waves. Notably, no elevation of the ST segment or presence of pathological Q waves were noted. This is in relation to the reports by Armen and Frank [8]. On their part, Villar et al. [16] presented the case of a sixty-nine-year-old male with acute respiratory failure requiring intubation and mechanical ventilation. Bilateral tension pneumothorax developed due to cannulation of the right and left subclavian veins, leading to significant hemodynamic compromise, critical hypoxia, and manifested ST segment elevation in inferior leads. Additionally, other electrocardiographic changes were observed, including decreased QRS amplitude and precordial R wave voltage. Interestingly, after evacuation of air from the right pleural space, all electrocardiographic signs resolved and returned to normal without the need for electrical or enzymatic myocardial necrosis assays. It appears that the elevation of the ST segment could be dependent on the magnitude of air in the pleural cavity, regardless of the presence of Brugada patterns. The extent of cardiac compression caused by pleural air could certainly contribute to these repolarization alterations. However, evidence from published studies suggests that for the repolarization in phase 2 of the action potential to be significantly affected, resulting in ST segment elevation [13], the pneumothorax must be of considerable severity.
The first documented case confirming a Brugada pattern associated with a pneumothorax was reported by Barcos et al. [5] in 2016; they reported a patient with severe left pneumothorax. Subsequent observations have linked the occurrence of these phenocopies to various factors, including right ventricular deformation, mechanical compression of the heart itself, cardiac rotation, and even coronary ischemia. However, BrP occurrences have been documented in both left and right tension pneumothoraces. Lancini et al. [4] in 2020 have proposed that acute pressure overload and deformation of the right ventricle represent the most probable mechanisms for non-lateralizing changes in the BrP observed in tension pneumothorax. The first two Brugada patterns manifest with ST segment elevation, which is a consequence of a greater difference in transmural subepicardial potentials relative to subendocardial potentials in phase 2 of the cardiac action potential [13]. Again, we see that what is published is that these electrocardiographic alterations occur in tension or severe pneumothoraces.
In Figure 6, we observe that the reduction of the pneumothorax correlates with the disappearance of the Brugada patterns (V1 and V2 at the fourth intercostal space), and it is intriguing that precisely in Figure 5, we see that when we moved the electrodes V1 and V2 to the third intercostal space, an electrocardiogram with an almost identical morphology is manifested. In terms of cardiac electrical activity in our patient, the reduction of the pneumothorax was equivalent to moving the electrodes V1 and V2 to a position where more air was interposed between the chest wall and the RVOT.
III.3. Pectus Carinatum, Small Pneumothorax, and Brugada Patterns
Our patient had a small pneumothorax, which does not imply the possibility of cardiac compression. Therefore, the pneumothorax alone, mediated solely by compression, does not explain the appearance of the Brugada pattern. Although it is assumed to be related, given that the electrocardiographic pattern disappeared with the improvement of the pneumothorax.
The presence of pectus carinatum, despite being a thoracic deformity, represents precisely the opposite deformity to those reported as BrP (pectus excavatum). In our patient, according to the presented radiological analysis, it is not possible to suggest the presence of a deformity that conditions a variation in retrosternal anatomy such that it increases the “vacuum” space between the anterior chest wall and the heart. Therefore, we dismiss the possibility of extending pathophysiological reasoning beyond regarding pectus carinatum as evidence of the absence of cardiac compression by the thoracic wall.
Additionally, it is known that in patients with pectus carinatum, the lengths of the costal cartilages are longer and the lengths of the ribs are shorter than in individuals without the deformity [17], which could result in increased electrical conductivity since cartilage is more conductive than bone. Articular cartilage consists of two distinct phases: a fluid phase composed of water and electrolytes, and a solid phase composed of chondrocytes, collagen fibrils, proteoglycans, and other glycoproteins. Typically, 60-80% of the total wet weight of articular cartilage is the fluid phase [18,19]. It is noteworthy that this tissue exhibits a lower electrical resistance when compared to bone, which typically possesses a resistivity of 160 Ω in a radial disposition [20].
Taking this into account, the electrocardiographic alterations evidenced in our patient’s small pneumothorax could have been “better seen” by the electrodes.
We propose that the pneumothorax present in our patient conditioned the appearance of the Brugada patterns, but it was possibly the conditions of the sternochondral tissue in our patient that made these alterations visible. However, we cannot consider that the pneumothorax conditioned the appearance of the Brugada patterns through a mechanism of mediastinal compression; we need to analyze what non-compressive cardiac changes occur in the presence of our patient’s pneumothorax that could explain the appearance of the Brugada patterns. We reason that it must be related to the amount of pleural air itself or to the decrease in the amount of lung air. To determine to what extent this amount of air influences the electrocardiogram, we conducted an analysis of the electrocardiographic patterns during inspiration and expiration, two opposing ventilatory phenomena that could shed light on our analysis, or not. Under this premise, the electrocardiographic patterns should be modified in relation to the volume of inspired air.
III.4. Changes in the Type 2 Brugada Pattern with Respiration
We analyze the electrical signal captured by lead V2 from Figure 2 in relation to the patient’s respiration. Taking into account that the thorax is a conductive material and that the tissue around the heart is mainly pulmonary tissue, we must evaluate how this pericardial-pulmonary tissue could affect the cardiac electrical signal in our patient. As a premise, we propose a better thoracic electrical window due to the lower electrical resistance caused by increased costosternal cartilage.
Different biological tissues have varying electrical resistance to current flow, which can vary with environmental conditions such as temperature; we know that an increase in temperature would result in a decrease in resistance. Additionally, the amount of air in the lungs also influences the resistance of this tissue. A lung in expiration has a resistance of 12.5 Ω, while a lung in inspiration has a resistance of 25 Ω. This is logical considering that air acts as an element with high resistance to current flow. Furthermore, lung tissue alone has an electrical resistance that is five times greater than the rest of the intrathoracic soft tissues [20]; therefore, we consider it to be the limiting factor in the dissipation of cardiac electrical flow towards the thoracic cavity.
The presence of pathological pleural air also produces changes in pulmonary electrical resistance. A pneumothorax could lead to an increase in electrical resistance at sites where air pockets occur within the pleural cavity [21]; however, the loss of lung filling capacity due to pneumothorax could result in the opposite phenomenon: pulmonary tissue, having less air volume, experiences less resistance.
Ohm’s Law states:
where V is the voltage, I is the current intensity, and R is the resistance. For constant currents, an increase in resistance implies an increase in voltage.
Taking into account now that the electrocardiogram recording is the result of the transmural electrical potential difference between subendocardial and subepicardial layers [21], we believe that changes in electrical resistances due to the ventilatory cycle could likely be observed.
Analyzing lead V2 of Figure 2, we can identify the QRS-T complexes during the inspiratory state, which is relatively easy considering that inspiration physiologically leads to an increase in heart rate [22,23] (Figure 9).
In Figure 9, a notable trend emerges during inspiration: the gradual disappearance of the type 2 Brugada pattern in each successive complex. This observation leads to the hypothesis that the augmentation of pulmonary air volume during the ventilatory cycle tends to mitigate the presence of the Brugada pattern, akin to the effect observed when relocating electrodes to the third intercostal space, where air volume is more substantial. Considering that this pattern alteration correlates with a reduction in the amplitude of the positive T wave, we can infer that the heightened pericardial pulmonary resistance, as dictated by Ohm’s Law, results in a progressive elevation in the pericardial electrical potential difference. This phenomenon could be “interpreted” by the thoracic surface electrode as an augmentation in the subepicardial potential value during phase 3 of the cardiac action potential.
In the fourth intercostal space, where there is contiguous thoracic-cardiac alignment mediated by the inferior sternopericardial ligament, there is less electrical resistance and, according to Ohm’s Law, less voltage. This makes the Brugada pattern more visible.
We reason that in areas where voltage is lower, the pattern becomes more evident, which is consistent with studies showing that cardiac compression in pectus excavatum generates these Brugada patterns [1,2,6]. It is also logical in our patient if we consider that the decrease in intrapulmonary air towards the anterior wall due to pneumothorax is less, leading to lower voltage. We believe that the subepicardial cardiac potential measured on thoracic surface electrodes may be modified by the influence of pericardial pulmonary voltage variability and, consequently, would be measured as a whole, as a subepicardial potential. This makes sense when considering that thoracic surface electrodes are unable to differentiate throughout the tissue where the subepicardium reaches. This would explain why Brugada patterns are generated in situations with extracardiac tissues of lower voltages, and would also explain why these patterns tend to disappear with inspiration. Also, it would explain the appearance of Brugada patterns during fever with a theory independent of temperature changes in the molecules that make up the channels affected in BrS. Thus, fever would decrease “subepicardial” resistance and manifest with a lower subepicardial electrical potential.
Furthermore, we could also assume that the measured subendocardial potential may have contributions not only from the subendocardium of the anterior surface of the heart but also from the subendocardium adjacent to the RVOT (Figure 10).
The modifications observed in the electrocardiographic tracing depicted in Figure 9 can be explained for our patient by considering alterations in subepicardial and subendocardial voltages. Upon revisiting Figure 9, there is a clear trend towards T-wave negativization as inspiration progresses. This phenomenon could be attributed to a prolongation of the action potential during phase 3 repolarization in the subepicardium. As mentioned earlier, the anatomo-electrical changes in the thorax of a patient with pectus carinatum may enhance the detection by electrodes of the cardiac electrical signals modified by the pneumothorax. Therefore, we searched the existing literature to determine if there was evidence supporting the prolongation of cardiac repolarization due to pneumothoraces.
There is evidence that a right pneumothorax can affect the right stellate ganglion, resulting in prolonged QTc intervals [24]. This is mainly due to the disruption of the balance maintained between the influences of the right and left sympathetic nerves, which can lead to an abnormal repolarization pattern and, therefore, a prolonged QTc interval [25]. In an animal model, it was demonstrated that the decrease in the relative contribution of the right stellate ganglia influences myocardial repolarization, leading to QTc prolongation [26]. On the other hand, there is also evidence that acute pneumothoraces result in changes in ventricular repolarization, with significant prolongation of the QT segment observed in several cases analyzed [27]. Interestingly, in this latest study, the electrocardiographic changes were found to be unrelated to the site and extent of the pneumothorax. It is suggested that this discrepancy may be attributed to the presence of a reflex mechanism affecting the autonomic nervous system.
Study Limitations
Our findings represent preliminary data. Although no clinical or epidemiological evidence suggestive of Brugada Syndrome was identified in our patient’s family members or personal history, pharmacological provocation studies to unmask type 1 patterns are crucial to conclusively rule out Brugada Syndrome and bolster the validity of the discussed findings. Furthermore, the physiopathological theory proposed here remains hypotheses, and higher-quality scientific studies are needed to generalize these findings to the rest of the population. Our results lay the groundwork for the development of such studies. Currently, our patient is undergoing hospital follow-up via outpatient consultations.
Conclusions
- The pectus carinatum may create a window that facilitates the less resistive measurement of cardiac action potentials.
- Small pneumothoraces may induce modifications in the cardiac electrical signal detected by surface electrodes, and pectus carinatum could unmask these modifications.
- Surface electrodes may measure subepicardial potentials that include and are modified by adjacent pericardial tissues, potentially resulting in alterations in transmural potential differences, thus producing fictitious Brugada patterns. Similarly, there is a possibility that the right ventricular outflow tract may be included within the subendocardial potentials.
References
- Awad SF, Barbosa-Barros R, Belem Lde S, Cavalcante CP, Riera AR, Garcia-Niebla J, Anselm DD, Baranchuk A. Brugada phenocopy in a patient with pectus excavatum: systematic review of the ECG manifestations associated with pectus excavatum. Ann Noninvasive Electrocardiol. 2013 Sep;18(5):415-20. PMID: 24047484; PMCID: PMC6932653. 10.1111%2Fanec.12082. [CrossRef]
- Eftychios Siniorakis, Spyridon Arvanitakis, Panagiotis Tzevelekos, Stamatia Panta, Apostolos Balanis, Fotini Aivalioti, Sotiria Limberi. Pectus excavatum: Right ventricular compromise with orthostatic syndrome and Brugada phenocopy. Journal of the Saudi Heart Association. Volume 29, Issue 3. 2017. Pages 223-226. ISSN 1016-7315. [CrossRef]
- Walston, A. B. E., Brewer, D. L., Kitchens, C. S., & Krook, J. E. (1974). The electrocardiographic manifestations of spontaneous left pneumothorax. Annals of Internal Medicine, 80(3), 375-379. [CrossRef]
- Daniel Lancini, Rajesh Shetty, Tension pneumothorax: a Brugada phenocopy and ST-elevation myocardial infarction mimic, European Heart Journal, Volume 41, Issue 23, 14 June 2020, Page 2163. [CrossRef]
- Barcos JC, Tello Santacruz IA, Monié CC, Fernández Recalde ML, Humphreys JD. Brugada phenocopy induced by severe pneumothorax. J Electrocardiol. 2018 Mar-Apr;51(2):343-345. Epub 2017 Oct 28. https://pubmed.ncbi.nlm.nih.gov/29242054/. [CrossRef] [PubMed]
- Kataoka, H. Electrocardiographic patterns of the Brugada syndrome in 2 young patients with pectus excavatum. J Electrocardiol. 2002 Apr;35(2):169-71. [CrossRef] [PubMed]
- Chevallier S, Forclaz A, Tenkorang J, Ahmad Y, Faouzi M, Graf D, Schlaepfer J, Pruvot E. New electrocardiographic criteria for discriminating between Brugada types 2 and 3 patterns and incomplete right bundle branch block. J Am Coll Cardiol. 2011 Nov 22;58(22):2290-8. [CrossRef] [PubMed]
- Armen, R. N., & Frank, T. V. (1949). Electrocardiographic patterns in pneumothorax. Diseases of the Chest, 15(6), 709-719. https://www.sciencedirect.com/science/article/abs/pii/S0096021715340085.
- Minotti B, Brenner R, May Desbiolles L, Osterwalder J, Schoch O, Ammann P. Electrocardiographic alterations by pneumothorax: a case-control study with review of the literature. Swiss Med Wkly [Internet]. 2021 Aug. 3 [cited 2024 Apr. 5];151(3132):w30041. Available from: https://smw.ch/index.php/smw/article/view/3048.
- Bayés de Luna A, Brugada J, Baranchuk A, Borggrefe M, Breithardt G, Goldwasser D, Lambiase P, Riera AP, Garcia-Niebla J, Pastore C, Oreto G, McKenna W, Zareba W, Brugada R, Brugada P. Current electrocardiographic criteria for diagnosis of Brugada pattern: a consensus report. J Electrocardiol. 2012 Sep;45(5):433-42. Erratum in: J Electrocardiol. 2013 Jan-Feb;46(1):76. [CrossRef] [PubMed]
- Ohkubo K, Watanabe I, Okumura Y, Ashino S, Kofune M, Nagashima K, Nakai T, Kunimoto S, Kasamaki Y, Hirayama A. A new criteria differentiating type 2 and 3 Brugada patterns from ordinary incomplete right bundle branch block. Int Heart J. 2011;52(3):159-63. [CrossRef] [PubMed]
- McHam B, Winkler L. Pectus Carinatum. 2023 Jul 31. In: StatPearls [Internet]. Treasure Island (FL): StatPearls Publishing; 2024 Jan–. PMID: 31082165. https://pubmed.ncbi.nlm.nih.gov/31082165/. [PubMed]
- Brugada J, Campuzano O, Arbelo E, Sarquella-Brugada G, Brugada R. Present Status of Brugada Syndrome: JACC State-of-the-Art Review. J Am Coll Cardiol. 2018 Aug 28;72(9):1046-1059. https://pubmed.ncbi.nlm.nih.gov/30139433/. [CrossRef] [PubMed]
- Bermejo Valdés, A.J.; Iglesias Gutiérrez, S.; Teja Ruiz, B. First Description of a Mixed Brugada Pattern in Inferior Leads. Preprints 2023, 2023051778. [Google Scholar] [CrossRef]
- Brugada R, Campuzano O, Sarquella-Brugada G, Brugada J, Brugada P. Brugada syndrome. Methodist Debakey Cardiovasc J. 2014 Jan-Mar;10(1):25-8. PMID: 24932359; PMCID: PMC4051330. https://pubmed.ncbi.nlm.nih.gov/24932359/. [CrossRef]
- Villar, J. M., Bergés, D. F., Fraga, R. J. A., Veiga, M. D., López, A. C., & Díaz, G. C. (2000). Elevación del ST y neumotórax a tensión. Revista Española de Cardiología, 53(3), 467-470. https://www.sciencedirect.com/science/article/abs/pii/S0300893200751116.
- Park CH, Kim TH, Haam SJ, Jeon I, Lee S. The etiology of pectus carinatum involves overgrowth of costal cartilage and undergrowth of ribs. J Pediatr Surg. 2014 Aug;49(8):1252-8. Epub 2014 Feb 17. https://pubmed.ncbi.nlm.nih.gov/25092085/. [CrossRef] [PubMed]
- Abdul Razzaq Farooqi, Rainer Bader, and Ursula van Rienen. Numerical Study on Electromechanics in Cartilage Tissue with Respect to Its Electrical Properties. Tissue Engineering Part B: Reviews 2019 25:2, 152-166. https://www.liebertpub.com/doi/10.1089/ten.teb.2018.0214.
- Mow VC, Guo XE. Mechano-electrochemical properties of articular cartilage: their inhomogeneities and anisotropies. Annu Rev Biomed Eng. 2002;4:175-209. Epub 2002 Mar 22. https://pubmed.ncbi.nlm.nih.gov/12117756/. [CrossRef] [PubMed]
- Riera, J., Riu, P. J., Casan, P., & Masclans, J. R. (2011). Tomografía de impedancia eléctrica en la lesión pulmonar aguda. Medicina intensiva, 35(8),509-517. https://scielo.isciii.es/scielo.php?script=sci_arttext&pid=S0210-56912011000800009&lng=es&nrm=iso&tlng=es.
- Costa EL, Chaves CN, Gomes S, Beraldo MA, Volpe MS, Tucci MR, Schettino IA, Bohm SH, Carvalho CR, Tanaka H, Lima RG, Amato MB. Real-time detection of pneumothorax using electrical impedance tomography. Crit Care Med. 2008 Apr;36(4):1230-8. https://pubmed.ncbi.nlm.nih.gov/18379250/. [CrossRef] [PubMed]
- Hayano J, Yasuma F, Okada A, Mukai S, Fujinami T. Respiratory sinus arrhythmia: a phenomenon improving pulmonary gas exchange and circulatory efficiency. Circulation. 1996; 94: 842–847. https://www.ahajournals.org/doi/full/10.1161/01.CIR.94.4.842.
- T aylor EW, Jordan D, Coote JH. Central control of the cardiovascular and respiratory systems and their interactions in vertebrates. Physiol Rev. 1999; 79: 855–916. https://journals.physiology.org/doi/full/10.1152/physrev.1999.79.3.855.
- Saks MA, Griswold-Theodorson S, Shinaishin F, Demangone D. Subacute tension hemopneumothorax with novel electrocardiogram findings. West J Emerg Med. 2010 Feb;11(1):86-9. PMID: 20411085; PMCID: PMC2850863. https://www.ncbi.nlm.nih.gov/pmc/articles/PMC2850863/.
- Kounis NG, Zavras GM, Kitrou MP, Soufras GD, Constantinidis K. Unusual electrocardiographic manifestations in conditions with increased intrathoracic pressure. Acta Cardiol. 1988;43(6):653-61. PMID: 3266413. https://pubmed.ncbi.nlm.nih.gov/3266413/. [PubMed]
- Rogers MC, Abildskov JA, Preston JB. Cardiac effects of stimulation and block of the stellate ganglion. Anesthesiology. 1973 Nov;39(5):525-33. https://pubmed.ncbi.nlm.nih.gov/4746057/. [CrossRef] [PubMed]
- Avonto L, Pozzi R, Greco-Lucchina P. Modificazioni della ripolarizzazione ventricolare associate a pneumotorace spontaneo acuto [Change in ventricular repolarization associated with acute spontaneous pneumothorax]. Minerva Med. 1981 Jun 23;72(25):1653-6. Italian. PMID: 7254617. https://pubmed.ncbi.nlm.nih.gov/7254617/. [PubMed]
Figure 1.
A: Posteroanterior chest X-ray showing the small pneumothorax at the right apex (the white arrow indicates the pleural edge). B: Lateral chest X-ray, where it is evident that the patient’s sternocostal disposition does not cause cardiac compression.
Figure 1.
A: Posteroanterior chest X-ray showing the small pneumothorax at the right apex (the white arrow indicates the pleural edge). B: Lateral chest X-ray, where it is evident that the patient’s sternocostal disposition does not cause cardiac compression.
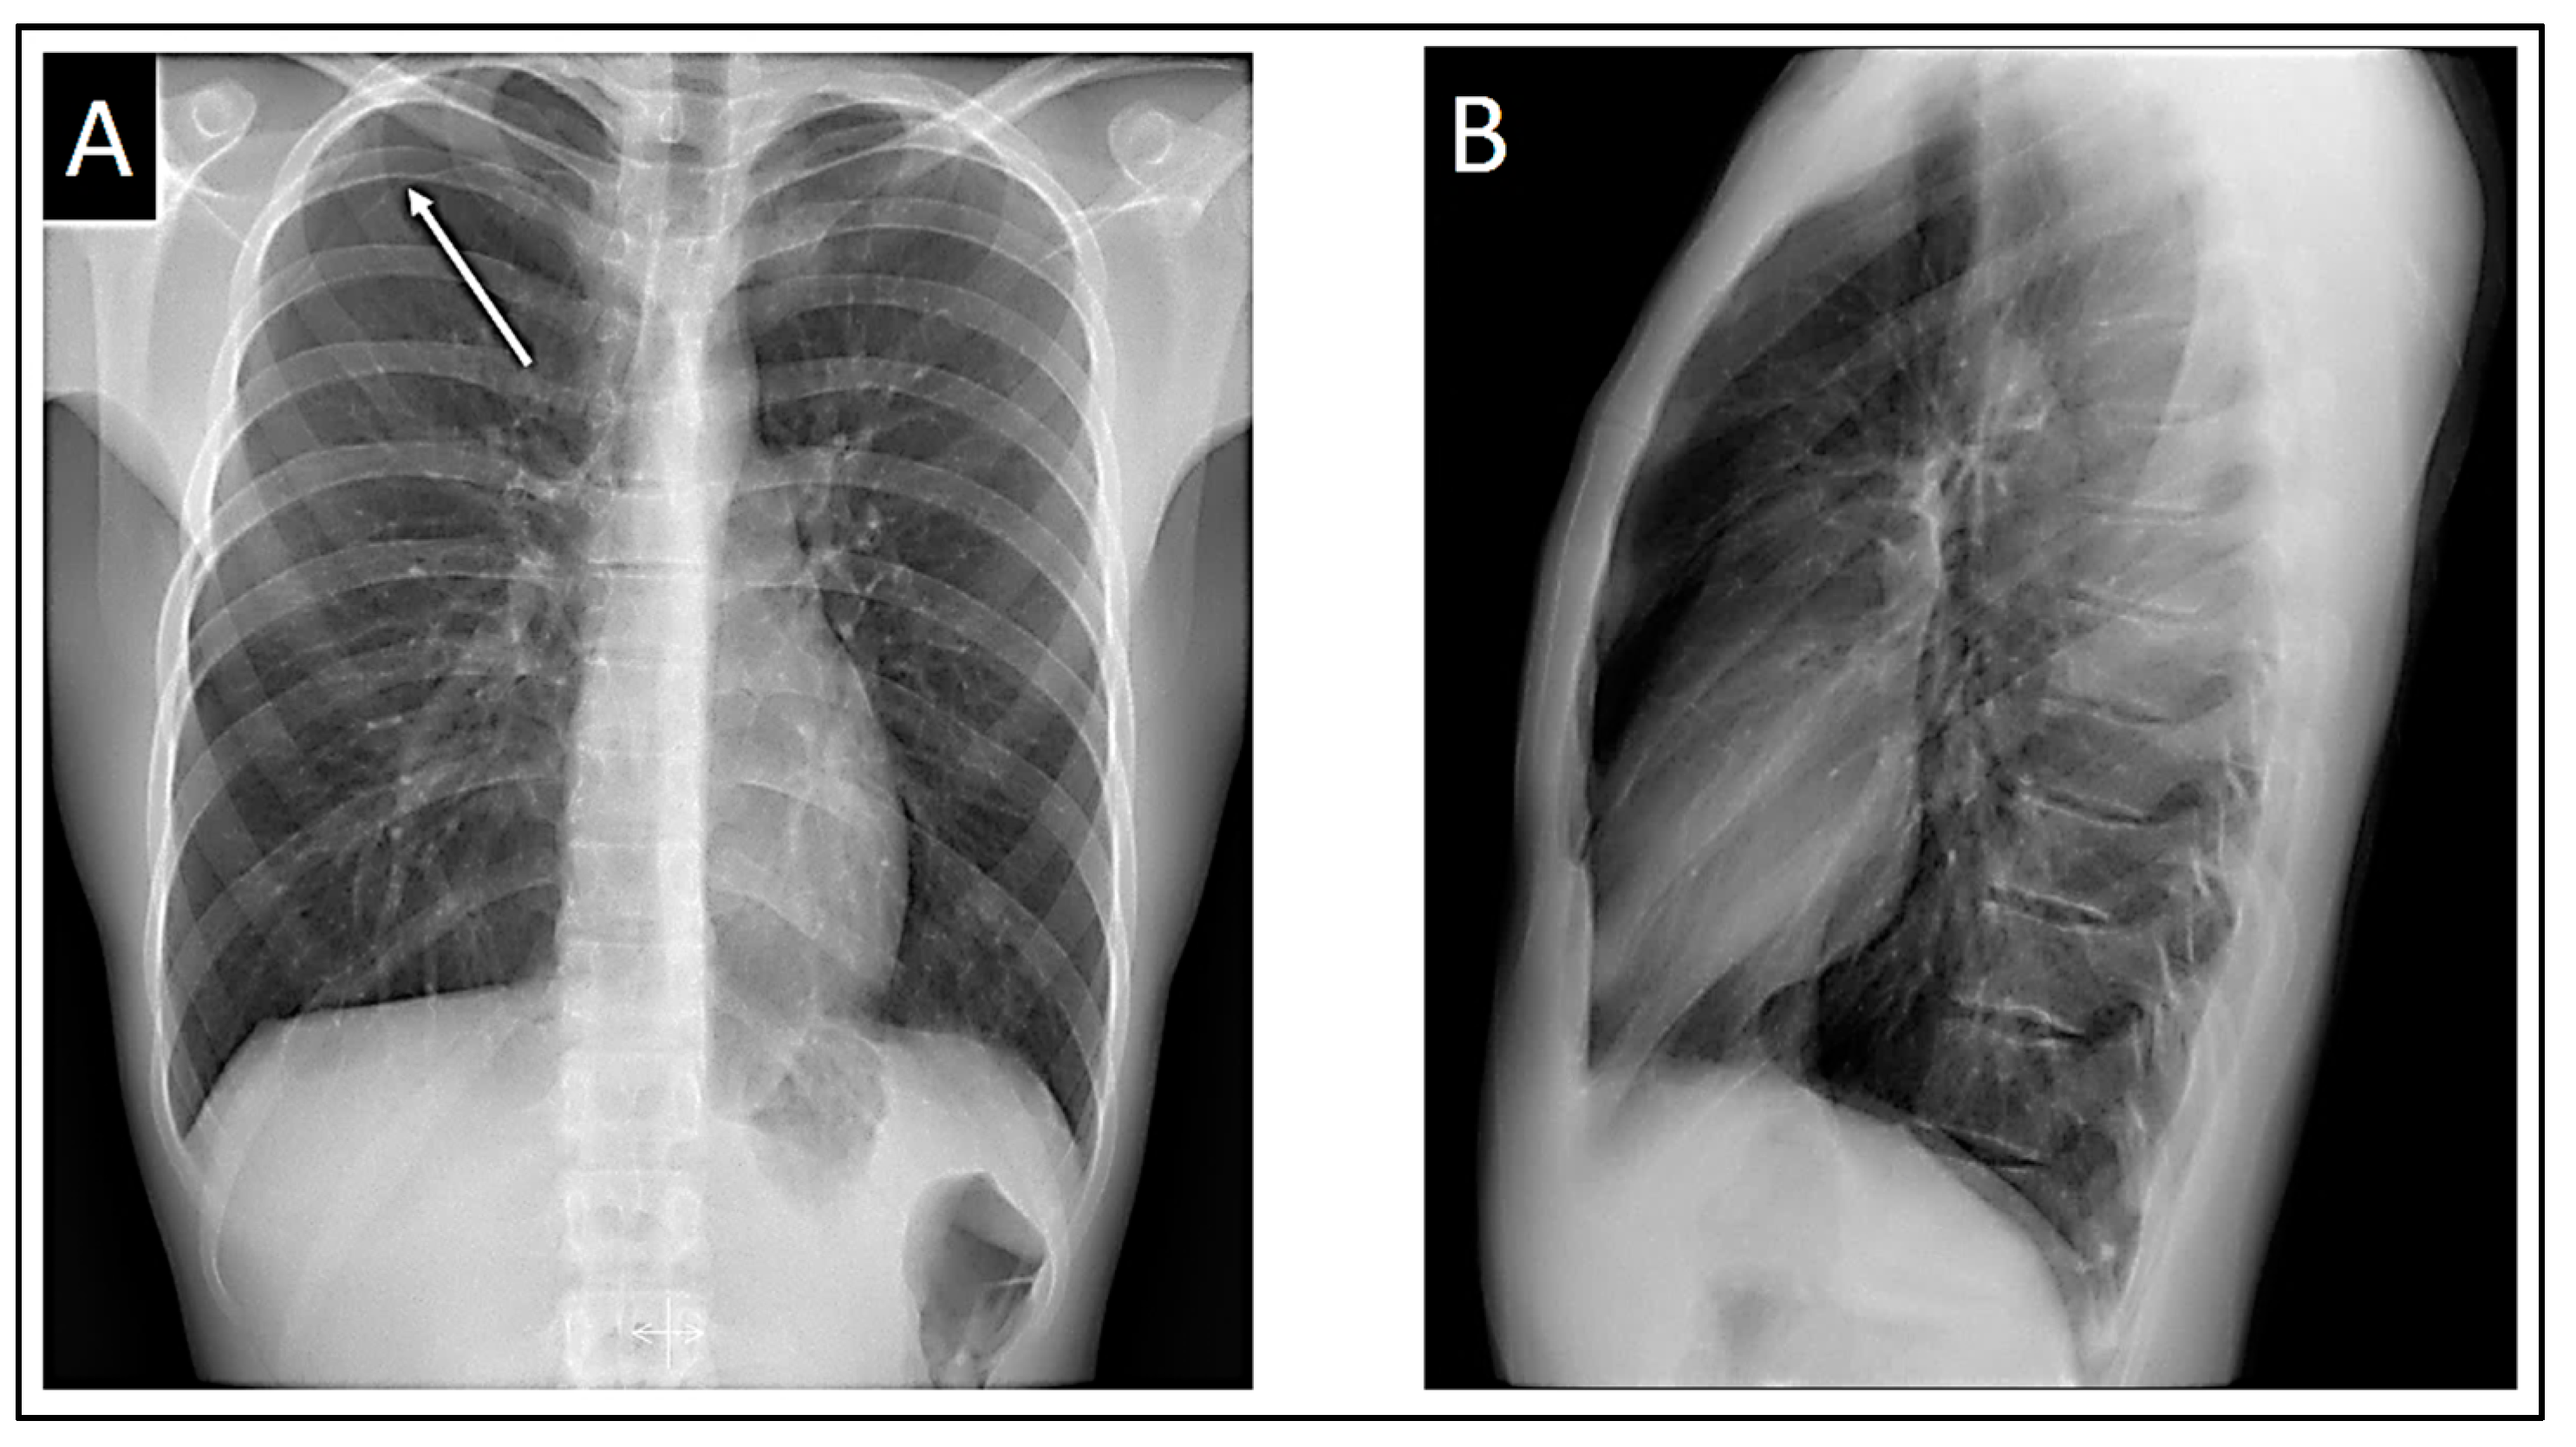
Figure 2.
Presenting a 12-lead electrocardiogram, demonstrating a type 3 Brugada pattern in V1 with a β angle greater than 58º (A magnification of one of the QRS-T complexes is shown above and to the right of the electrocardiogram.). Additionally, in V2, a typical “saddleback” type 2 Brugada pattern is observed, with a 1 mm elevation of the ST segment.
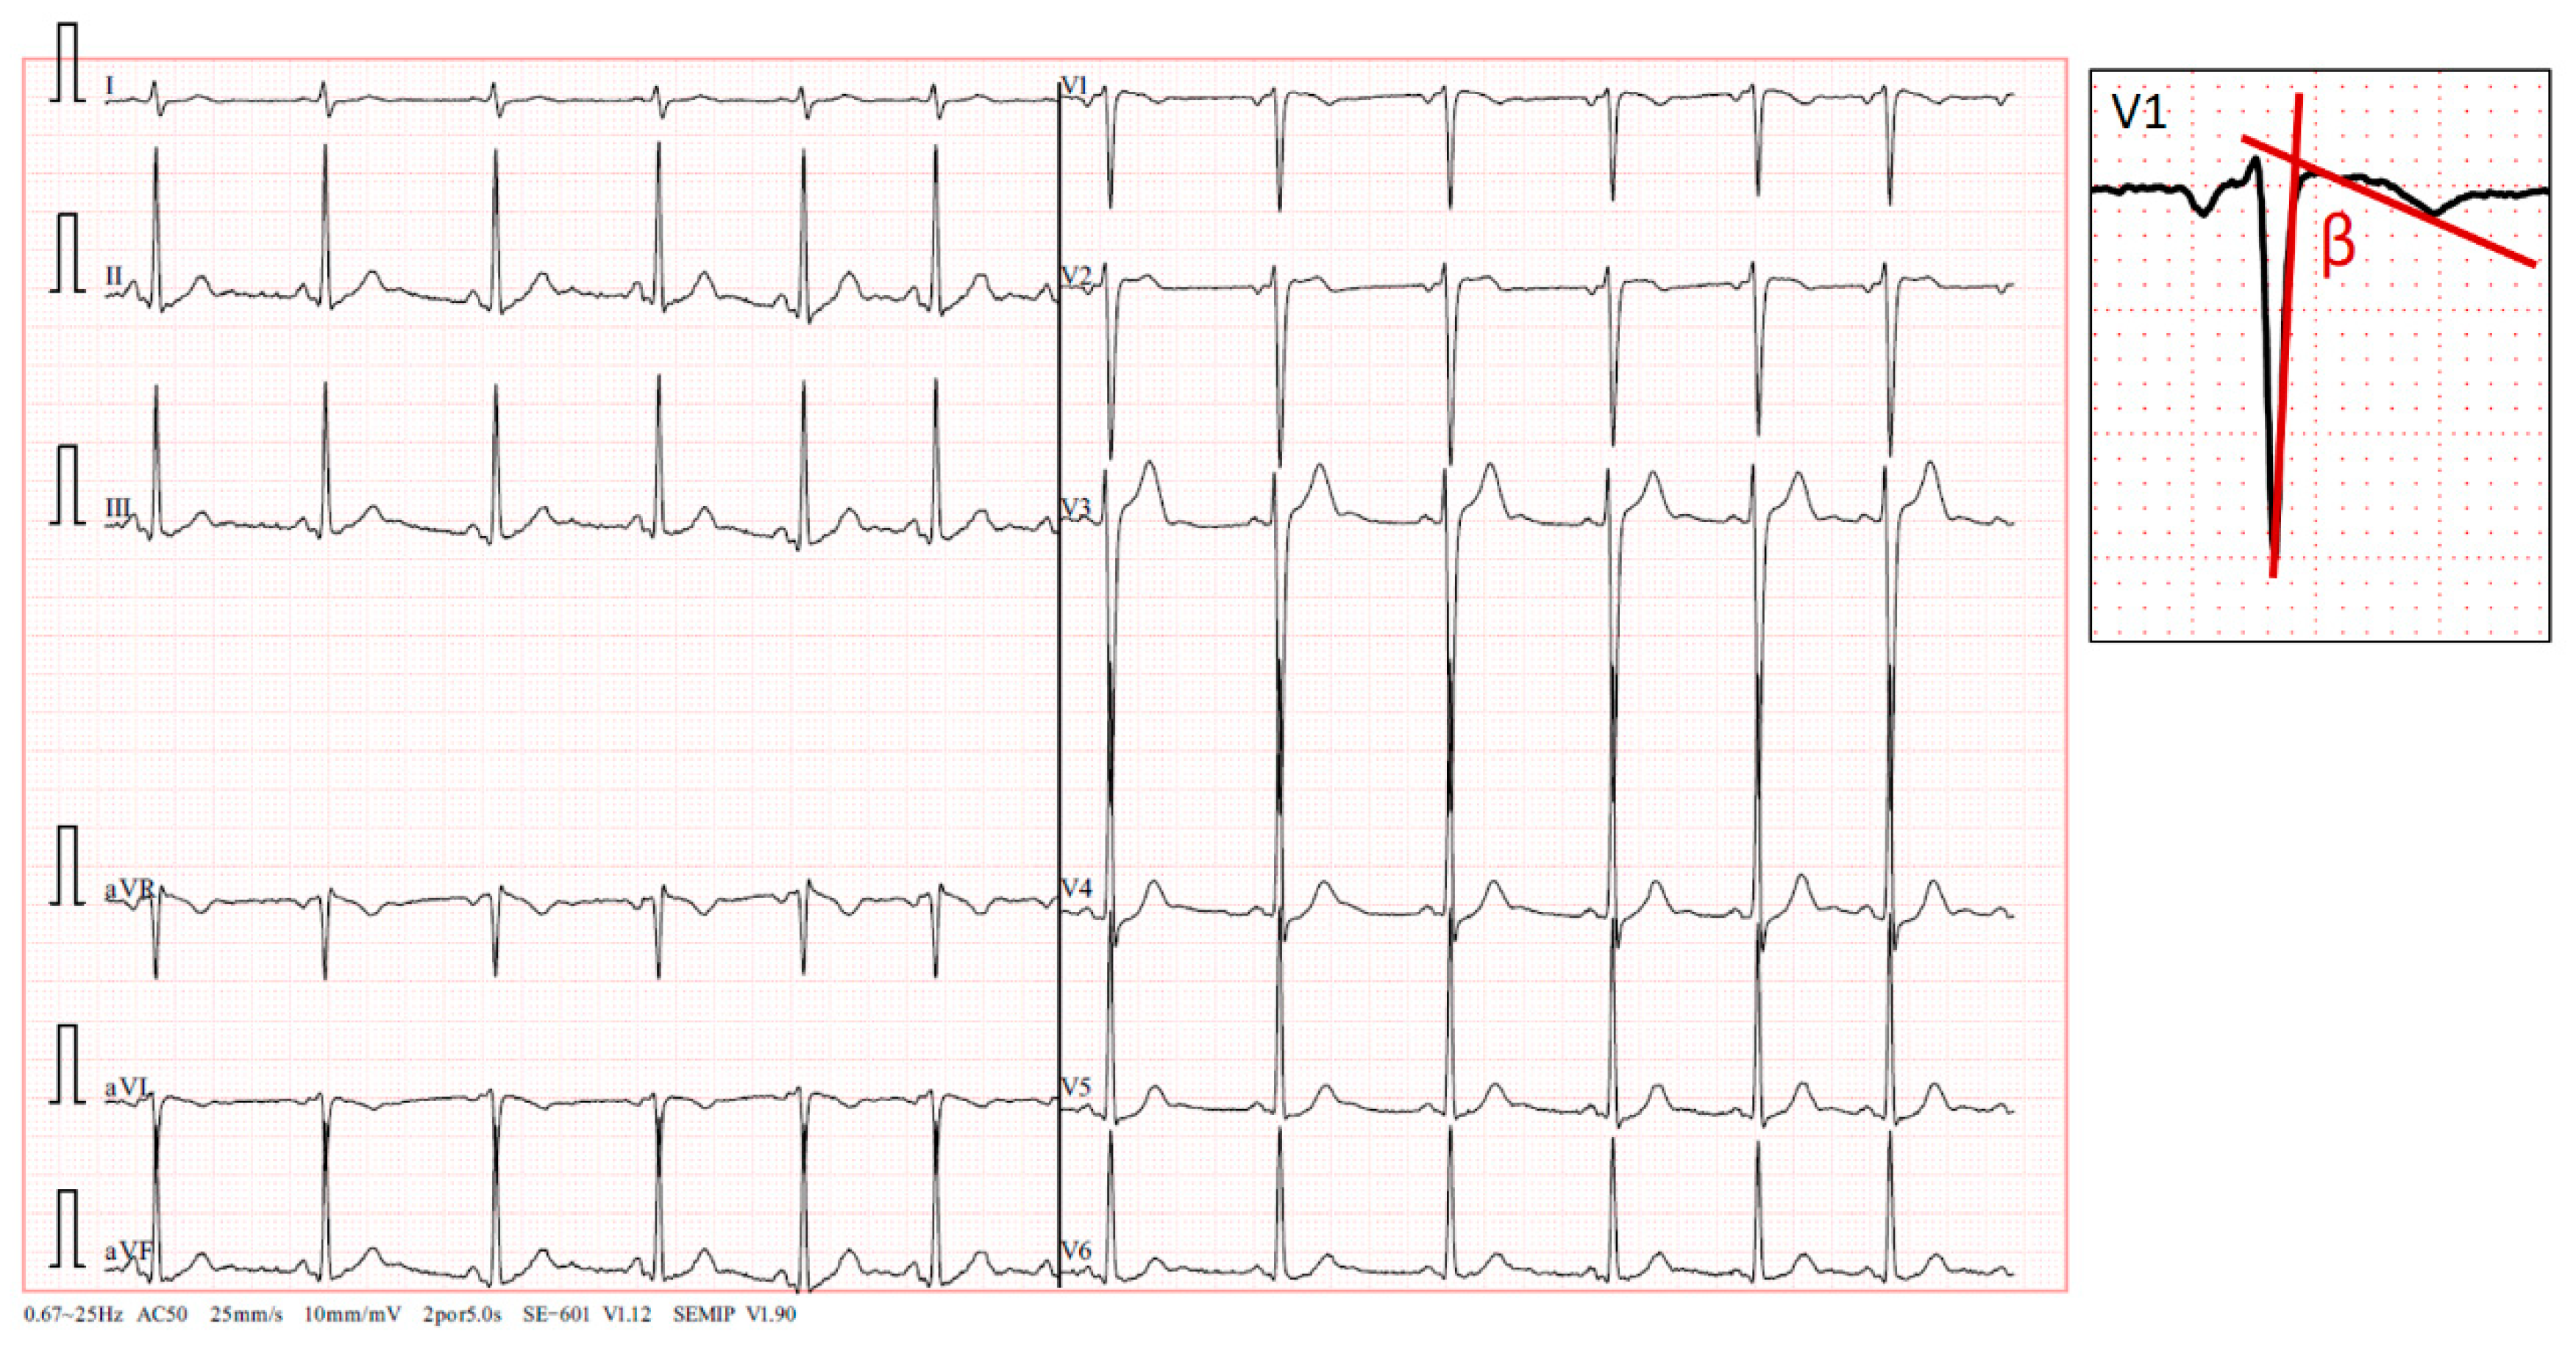
Figure 3.
Disappearance of Brugada patterns upon moving the precordial leads two intercostal spaces downward.
Figure 3.
Disappearance of Brugada patterns upon moving the precordial leads two intercostal spaces downward.
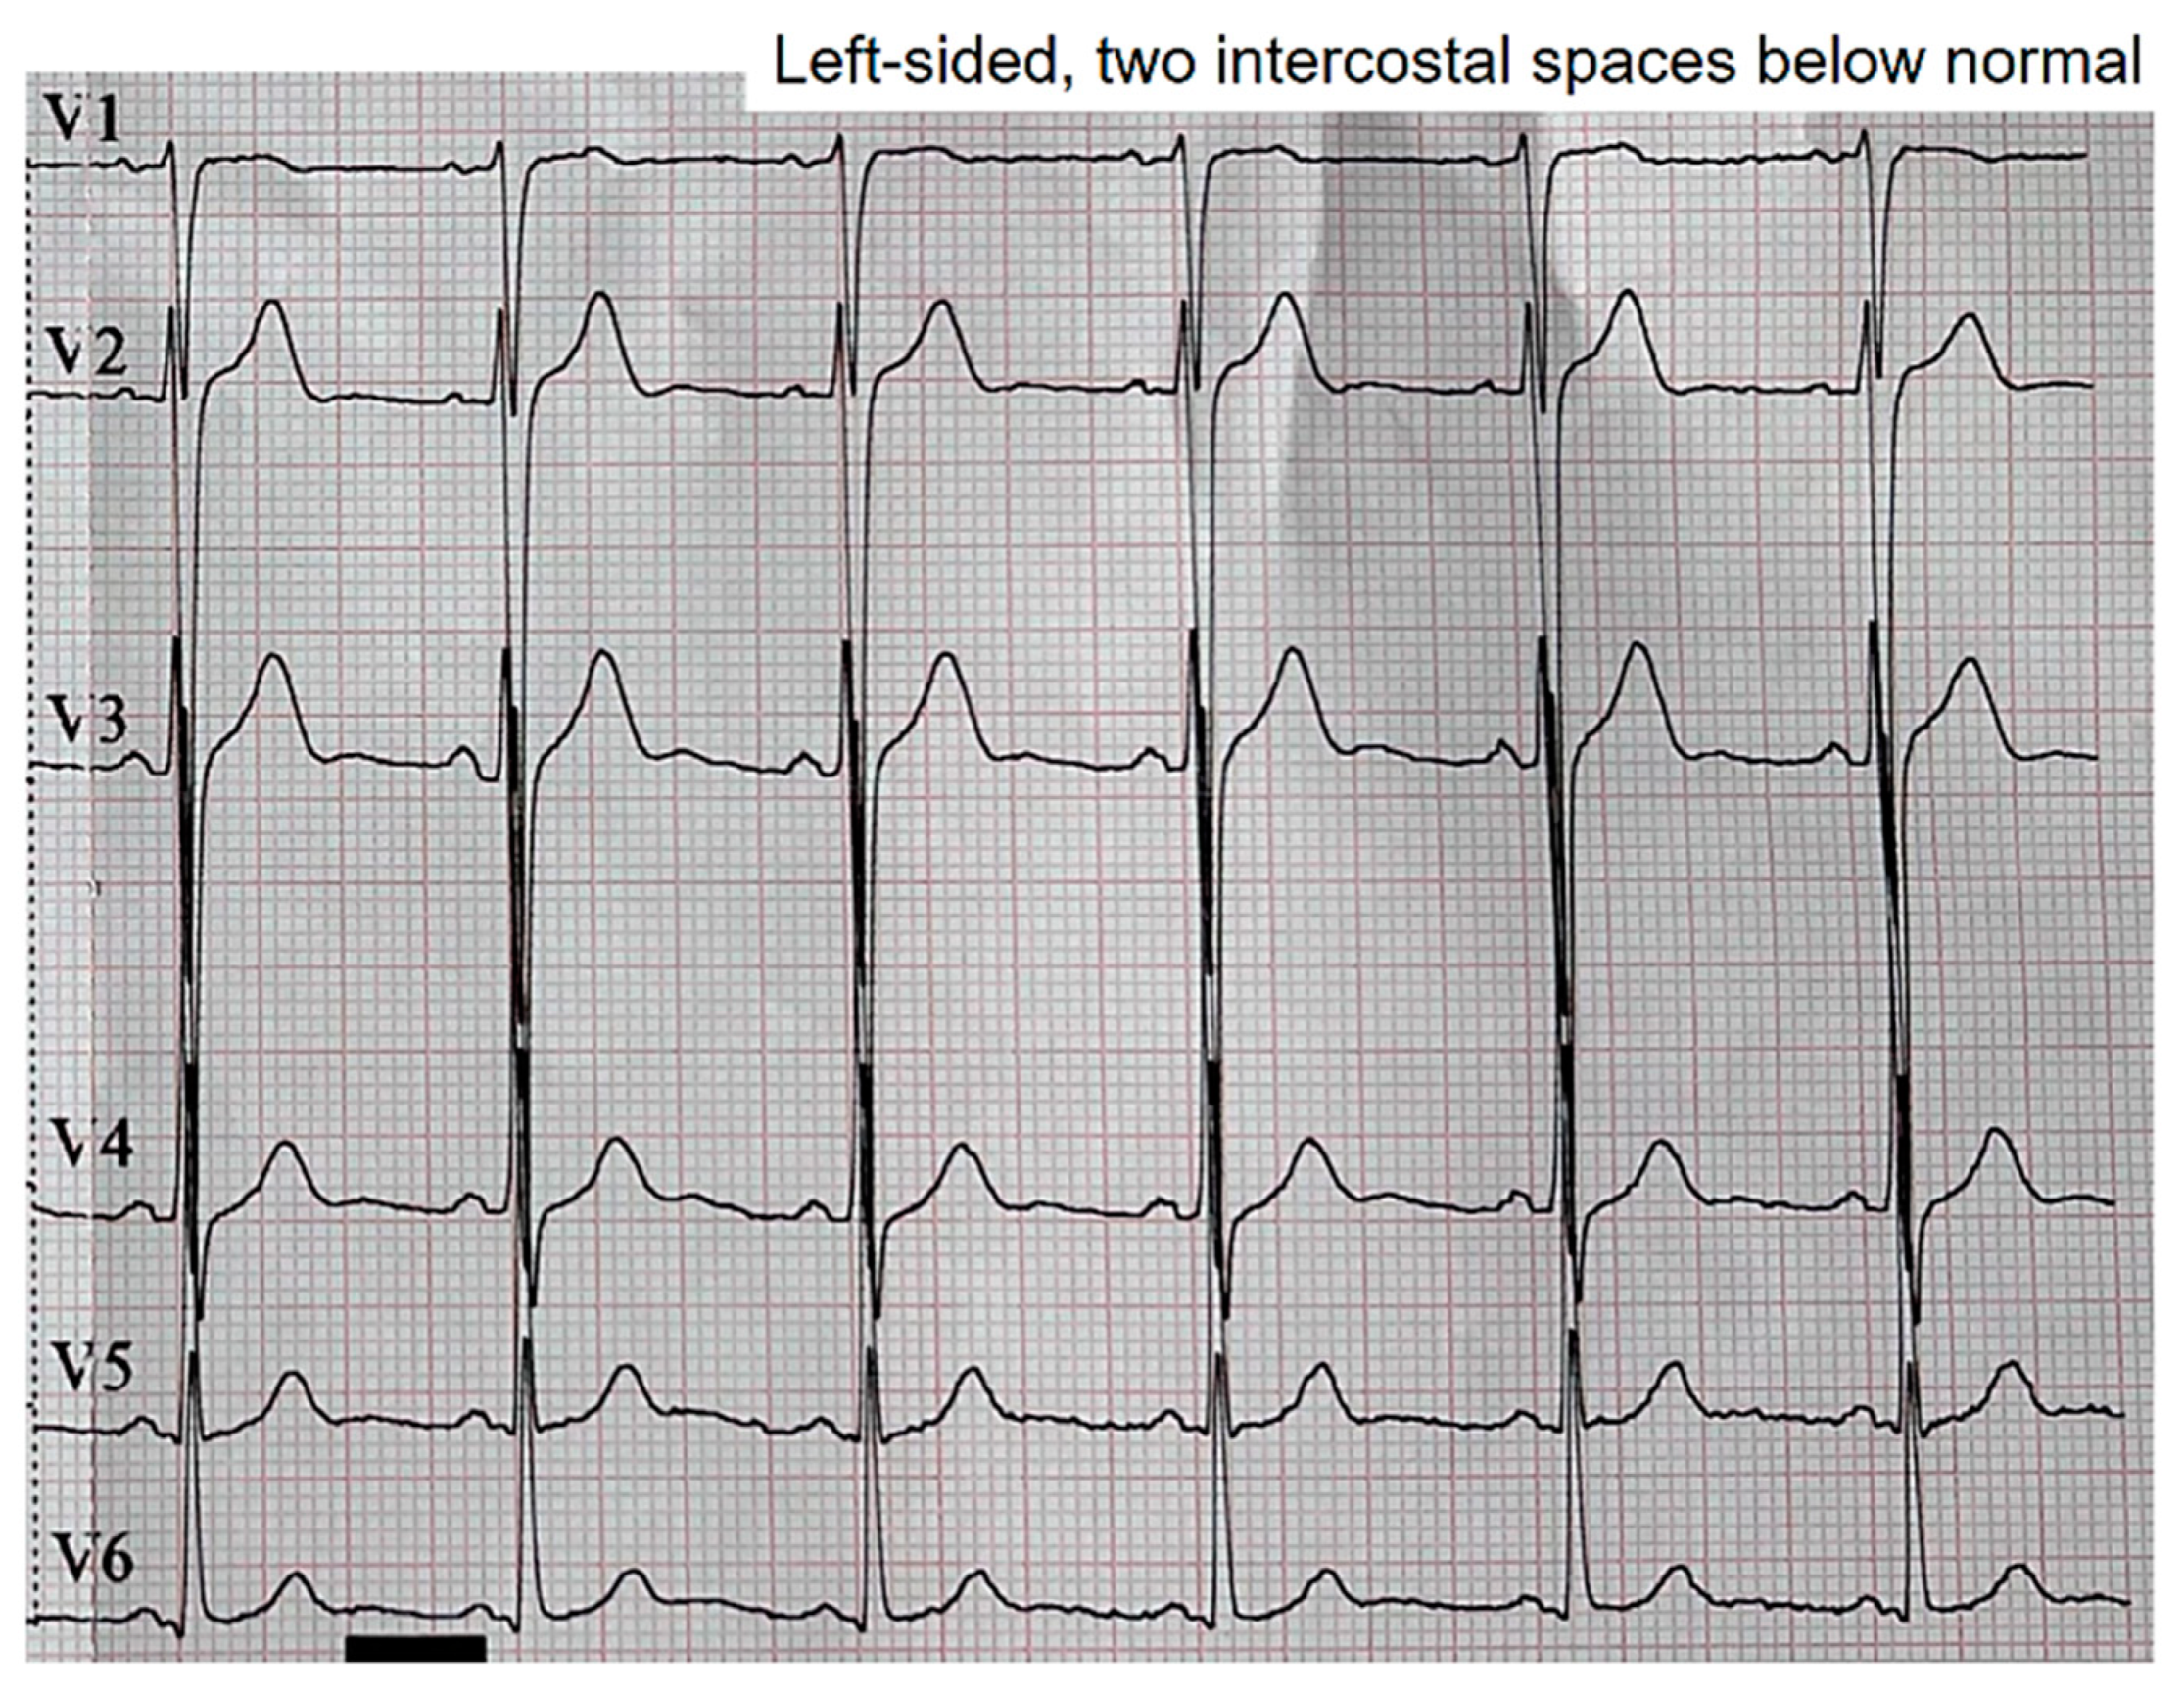
Figure 4.
Right precordial leads using V1 and V2 at the level of the second intercostal space. Change from a type 2 pattern to a type 3 pattern in lead V2, corresponding to a descent of the ST segment towards the isoelectric line. The red lines highlight the formation of a new β angle following the pattern change.
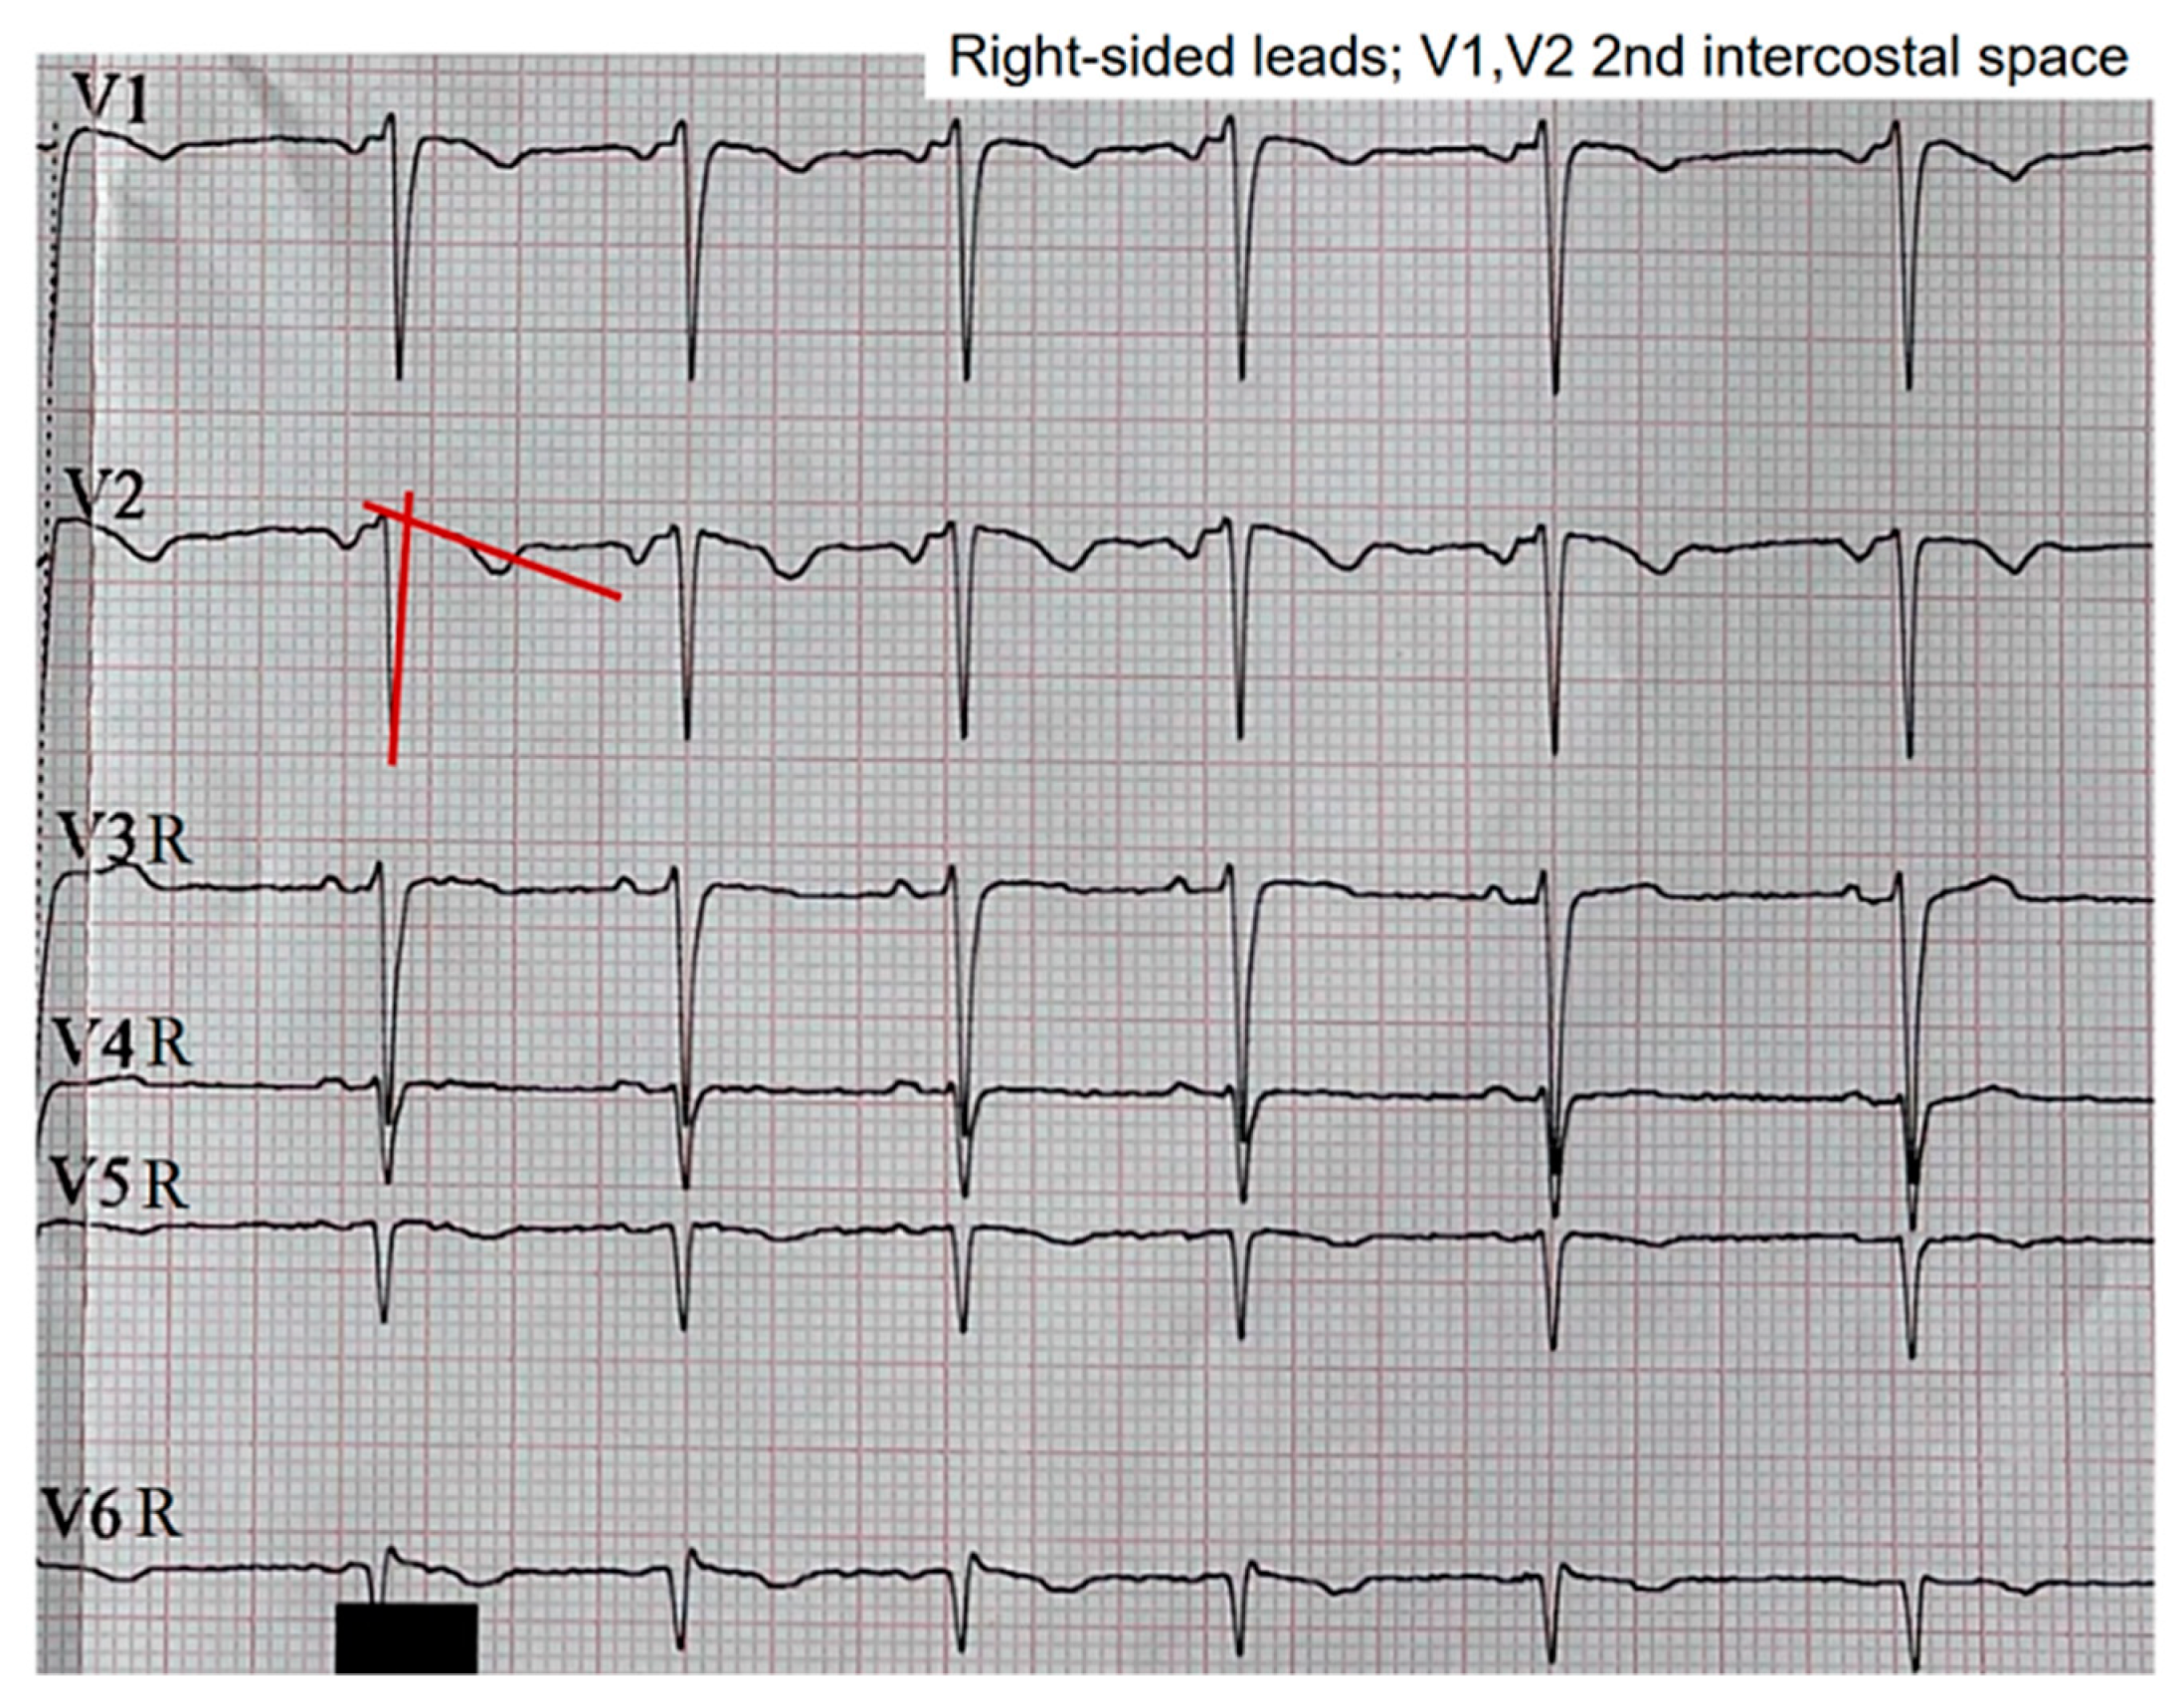
Figure 5.
Intermediate morphology between the patterns observed in the second intercostal space and the normal position in the fourth intercostal space.
Figure 5.
Intermediate morphology between the patterns observed in the second intercostal space and the normal position in the fourth intercostal space.
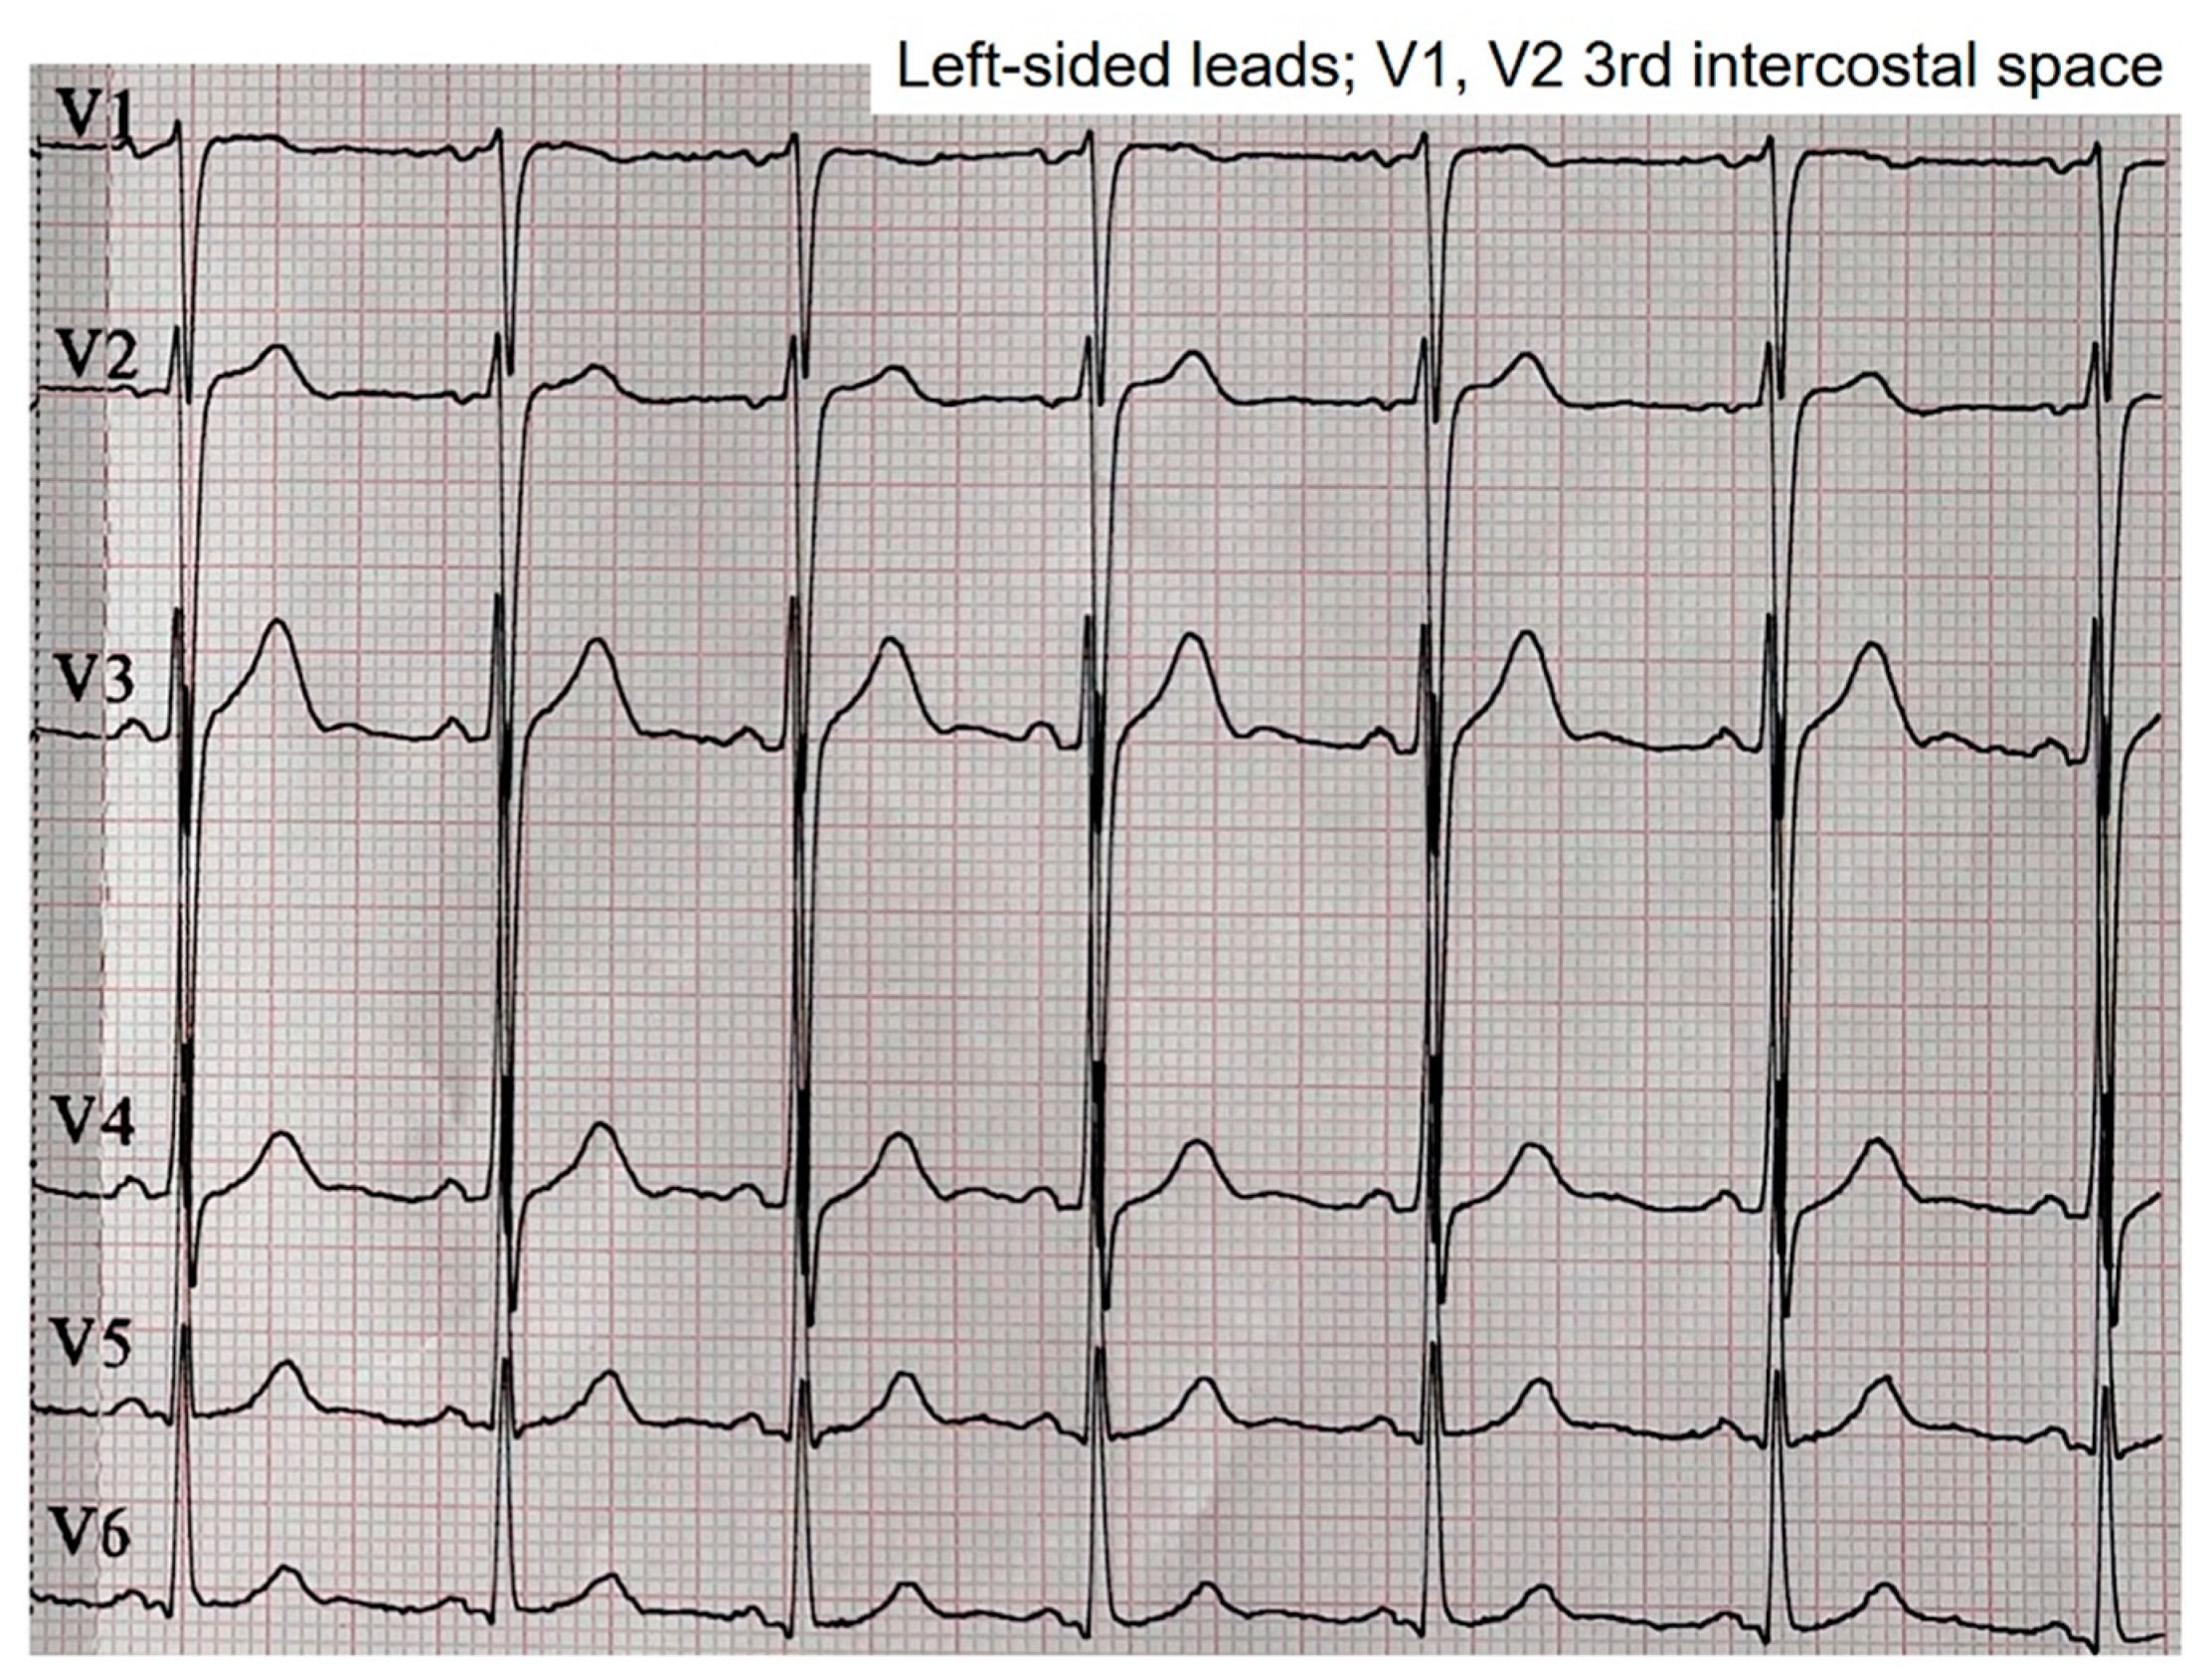
Figure 7.
We take Figure 2 again and highlight the probable location of the RVOT and the third and fourth intercostal spaces. Note that the RVOT is positioned behind the third intercostal space in our patient.
Figure 7.
We take Figure 2 again and highlight the probable location of the RVOT and the third and fourth intercostal spaces. Note that the RVOT is positioned behind the third intercostal space in our patient.
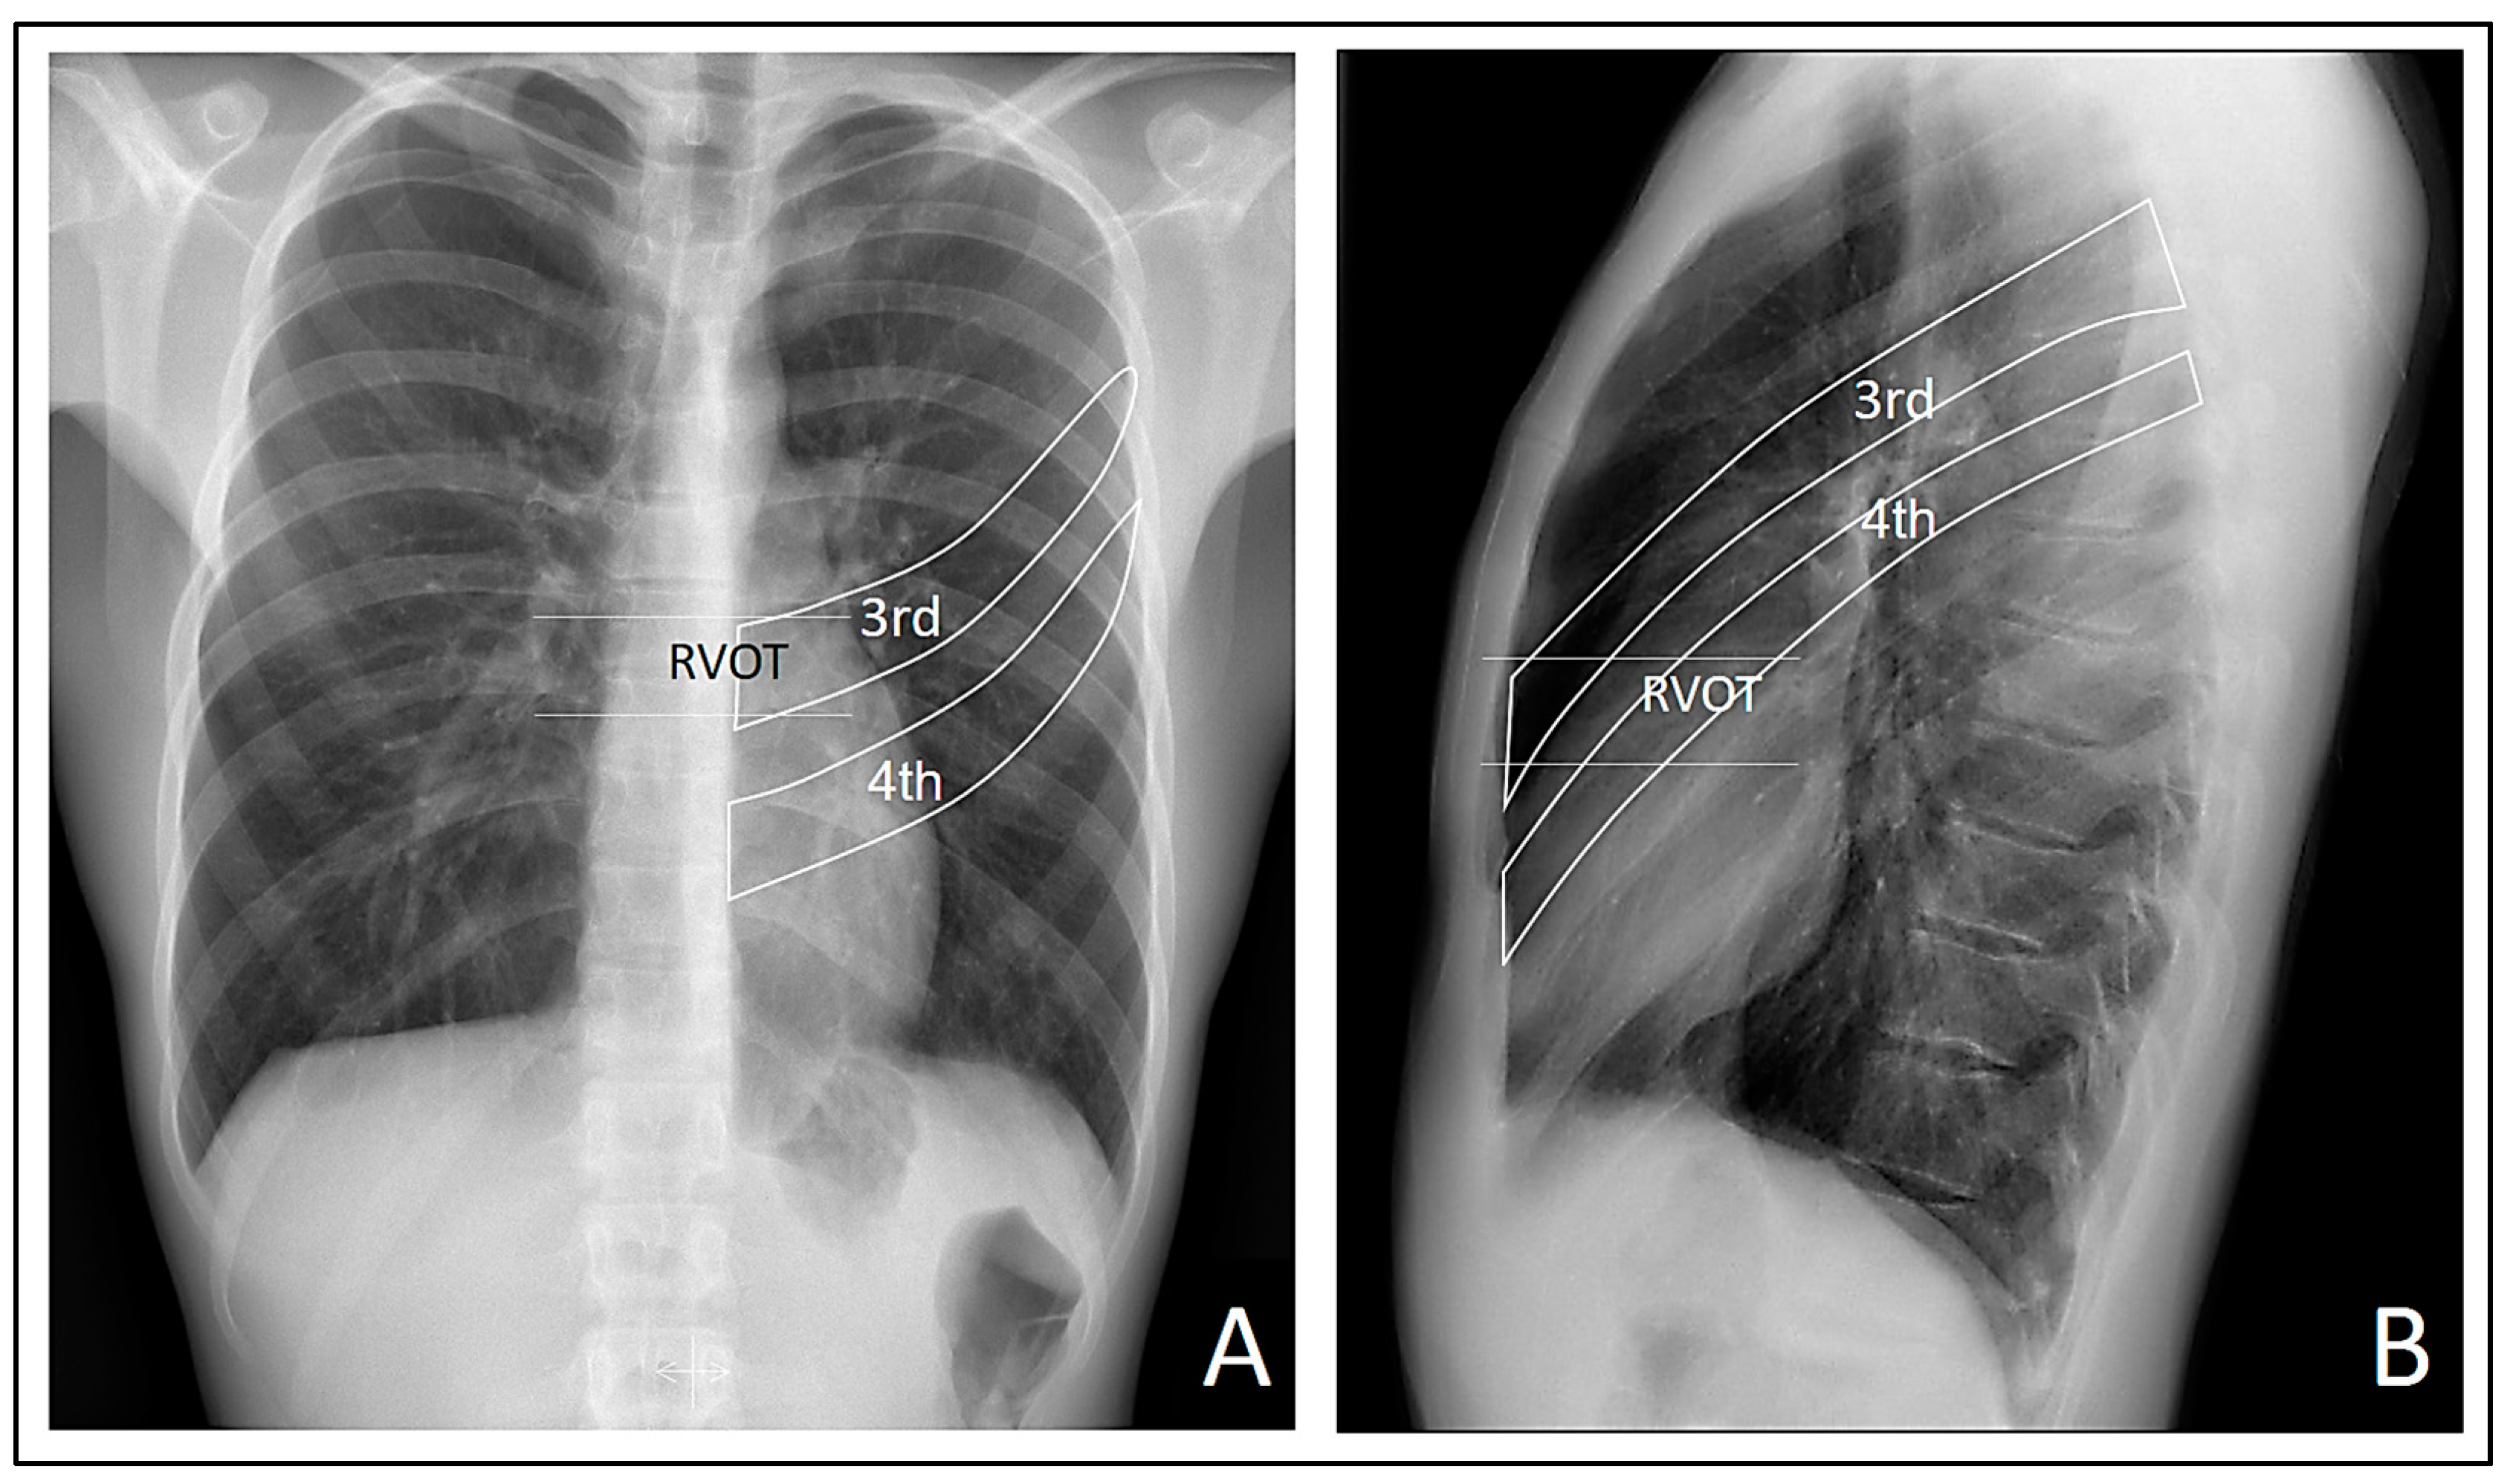
Figure 8.
We observe the approximate anatomical relationship of the RVOT concerning the V2 leads positioned at the third and fourth intercostal spaces. The superior and inferior sternopericardial ligaments are highlighted in red for emphasis. It is noteworthy that when V2 is placed at the fourth intercostal space, there is direct physical contact between V2 and the RVOT through denser tissues, contrasting with the more dielectric electrical conduction when V2 is positioned at the third intercostal space due to air interposition between V2 and the RVOT.
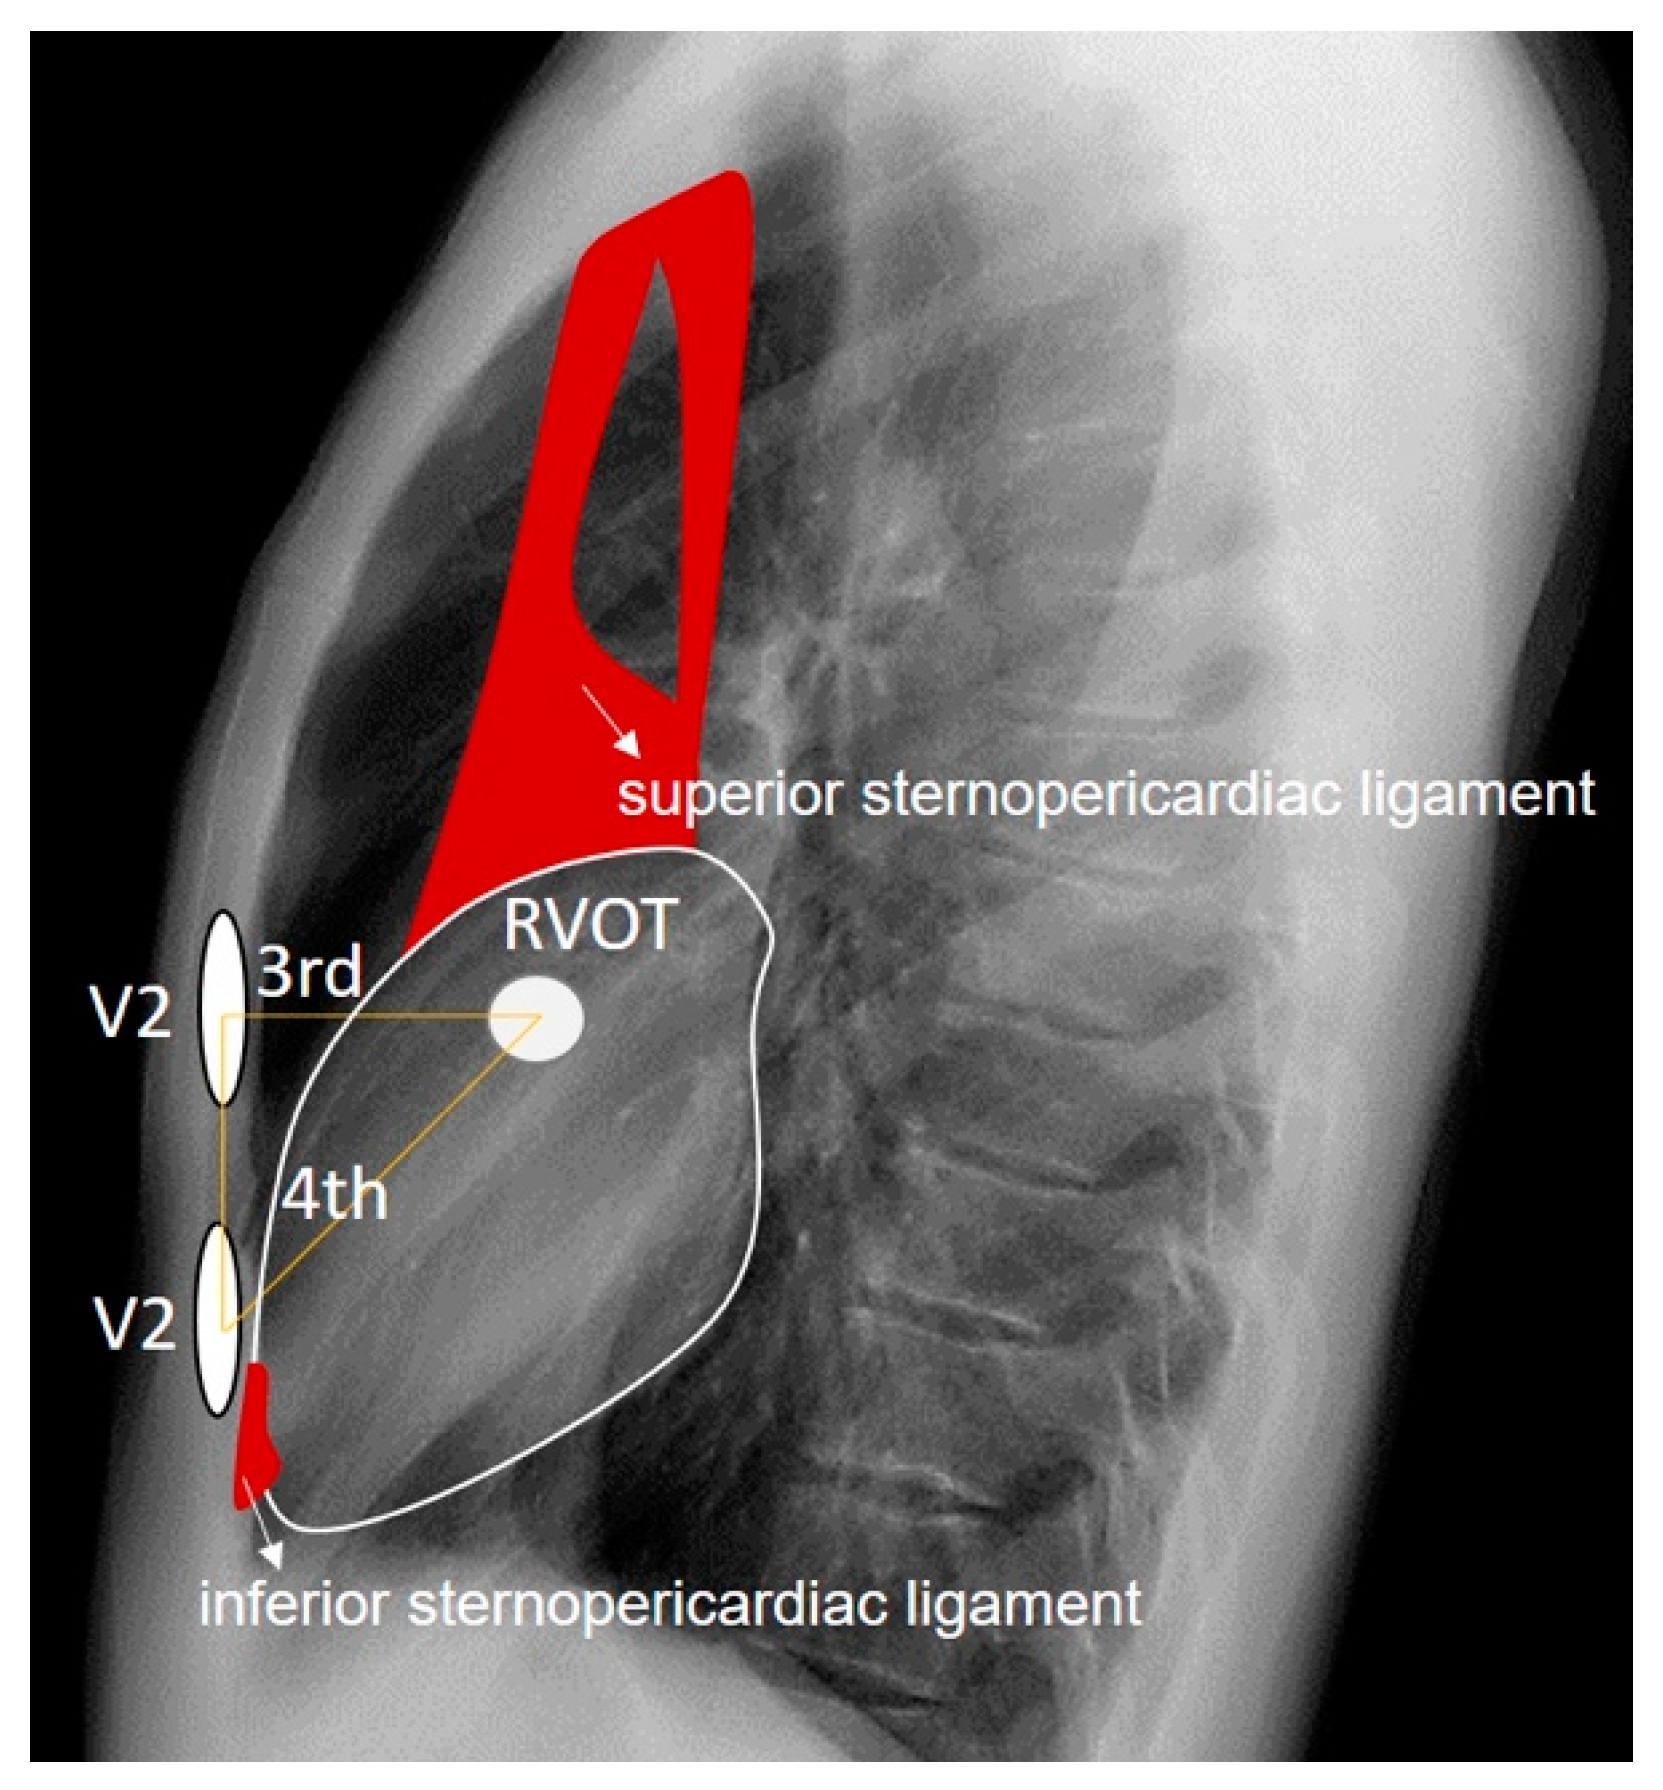
Figure 9.
We observe a diminishing trend in the type 2 pattern with increasing heart rate during inspiration. We use the notation “a” to represent the S-S segment between the first two complexes, allowing for visual assessment of its shortening as the complexes progress.
Figure 9.
We observe a diminishing trend in the type 2 pattern with increasing heart rate during inspiration. We use the notation “a” to represent the S-S segment between the first two complexes, allowing for visual assessment of its shortening as the complexes progress.

Figure 10.
Schematic depicting the V2 electrode placement on the thoracic surface. The gray rectangle denotes the sternum, the heart is depicted on the right, and the position of the RVOT is delineated. The yellow area outlines the subepicardial potential alongside the potential from extracardiac tissues, while the orange area represents the subendocardial potential including the RVOT. This illustrates how the surface electrode could measure both subendocardial and subepicardial potentials, along with the influence of the modification of these potentials by extracardiac and even intracardiac tissues.
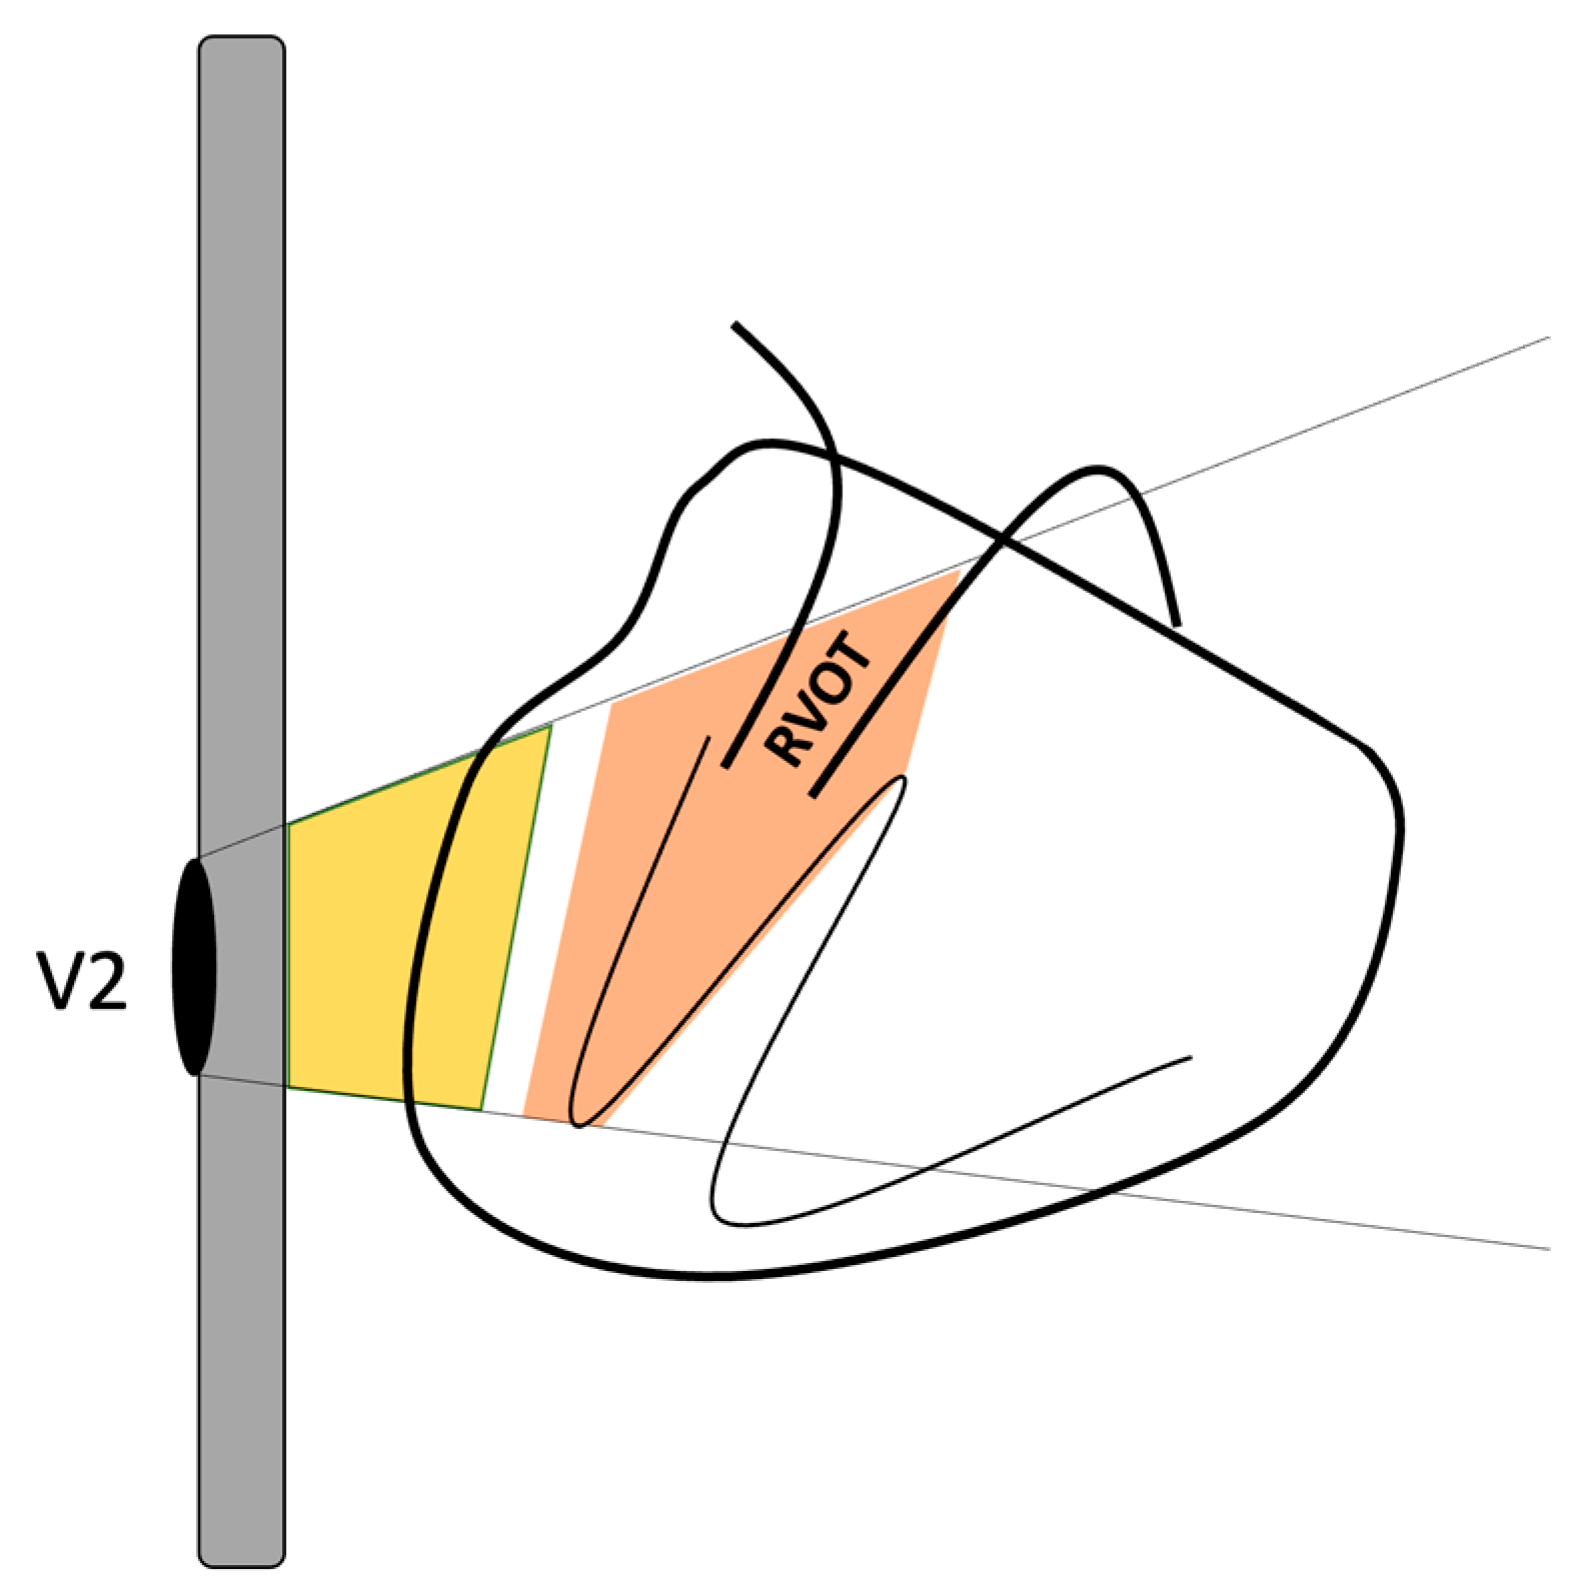
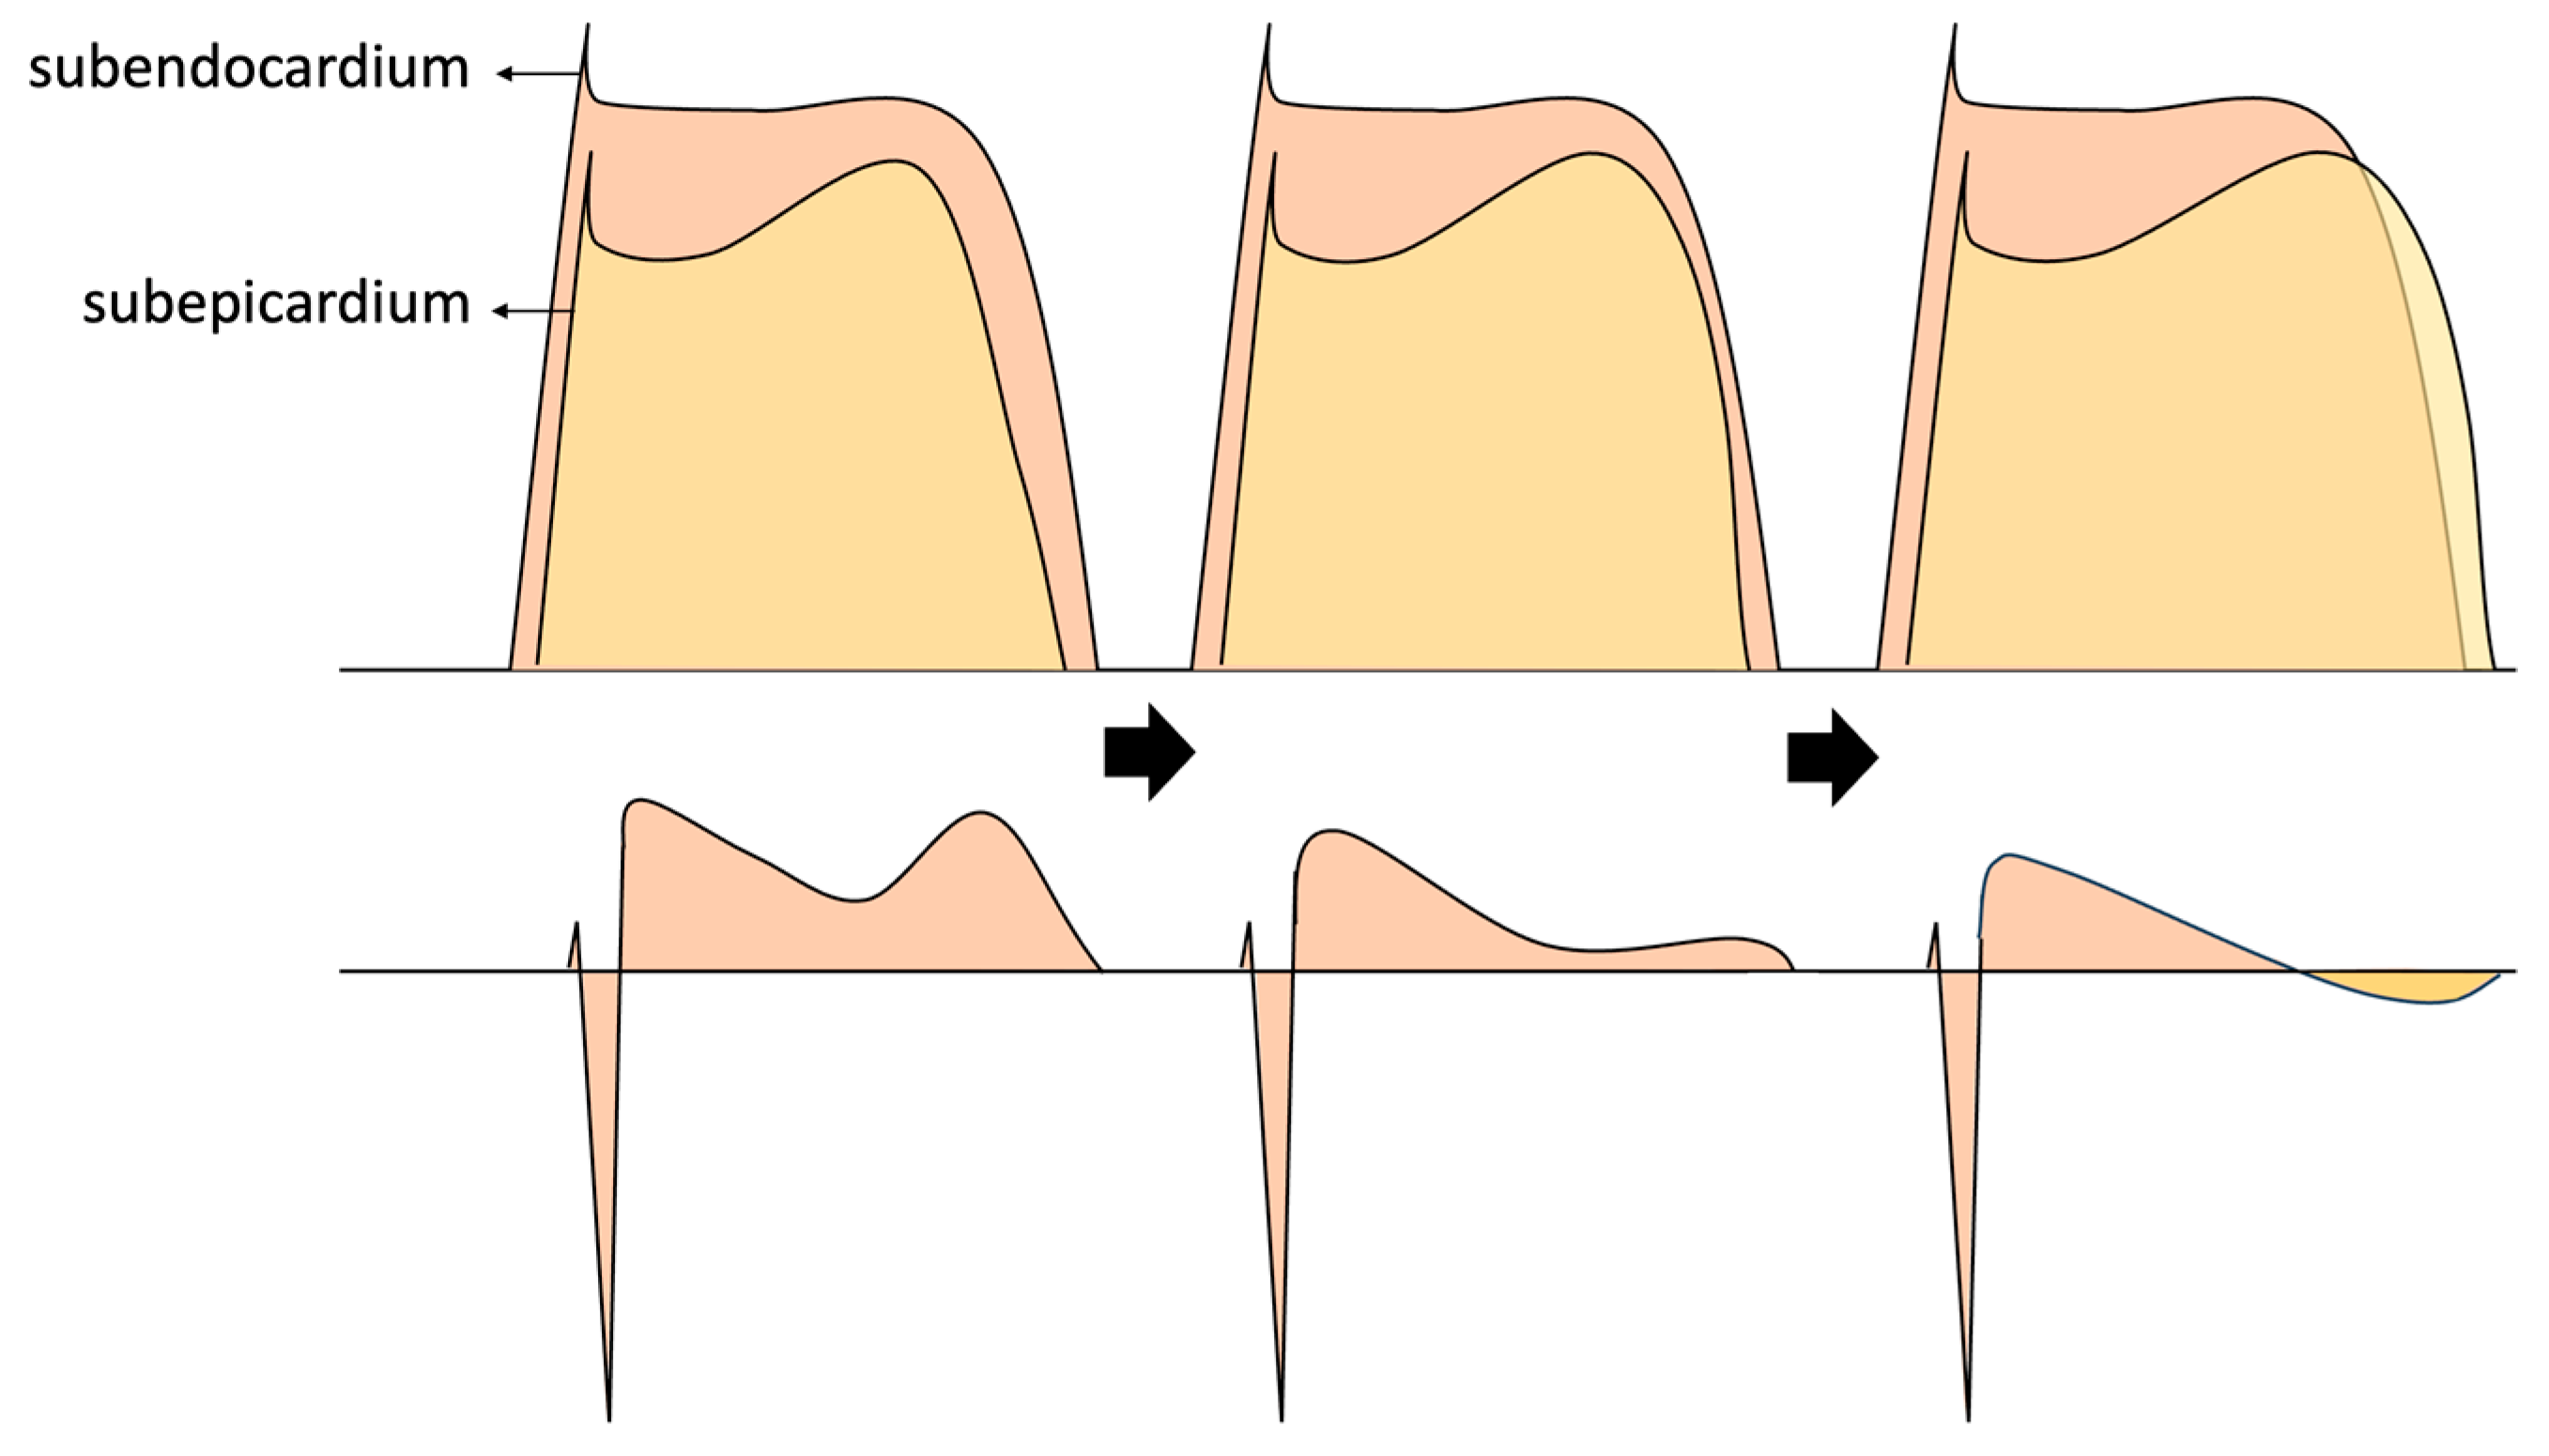
Figure 11.
Illustrates the influence of subepicardial potentials on the alterations observed in our patient’s electrocardiogram. It is worth noting that not only changes in voltage, but also the prolongation of action potential during repolarization, could elucidate the eventual emergence of the negative T wave.
Disclaimer/Publisher’s Note: The statements, opinions and data contained in all publications are solely those of the individual author(s) and contributor(s) and not of MDPI and/or the editor(s). MDPI and/or the editor(s) disclaim responsibility for any injury to people or property resulting from any ideas, methods, instructions or products referred to in the content. |
© 2024 by the authors. Licensee MDPI, Basel, Switzerland. This article is an open access article distributed under the terms and conditions of the Creative Commons Attribution (CC BY) license (http://creativecommons.org/licenses/by/4.0/).
Copyright: This open access article is published under a Creative Commons CC BY 4.0 license, which permit the free download, distribution, and reuse, provided that the author and preprint are cited in any reuse.


