Preprint
Article

Circulating RKIP and pRKIP Might Be Novel Potential Biomarkers of Early-Stage Lung Cancer: Results from a Pilot Study

Altmetrics

Downloads

152

Views

159

Comments

0

Submitted:

10 April 2024

Posted:

11 April 2024

You are already at the latest version

Alerts
Abstract
Lung cancer remains the main cause of global cancer-related deaths. Currently low-dose computed tomography (LD-CT) shows a 20% reduction of mortality. However, its clinical suitability is hindered by cost, radiation, and some false positives. Thus, the discovery non-invasive and less-expensive biomarker is urgent needed. In this scenario, proteins released in biological fluids could be considered interesting biomarkers for their role in cancer development. We conducted a pioneering case-control pilot study aimed at assessing the usefulness of Raf Kinase Inhibitory Protein (RKIP) and its phosphorylated form (pRKIP) as potential early-stage lung cancer biomarkers. Urine and Blood samples of two consecutive and independent cohorts of lung cancer patients and healthy controls were screened by means of a novel experimental ELISA assay designed to evaluate both forms of the biomarker. Although urinary levels of RKIP were not statistically different between the lung cancer group and high-risk healthy group, serum ones instead increased significantly in early stage LC patients and permitted to discriminate LC patients from both low-risk (HS) and high-risk healthy subjects (HR-HS) with an overall 93% accuracy (AUC 0.93) when LC was compared to HS and 74% (AUC 0.73) when it was compared to high-risk group. Of note, the analysis of RKIP/pRKIP ratio also showed a high accuracy (90% - AUC 0.95) in discriminating LC patients from HS and more importantly, it allowed to identify LC patients compared to HR-HS, with a higher accuracy (79% - AUC 0.79) than RKIP alone. We hypothesize that serum RKIP levels may be correlated to the activation of the immune systems against the tumor during the first phases of its development. Our study identified a preliminary, non-invasive, RKIP and pRKIP profile able to discriminate with high specificity and sensitivity the early-stage lung cancer patients from high-risk Healthy Subjects. These results, although preliminary, suggest the utility of measuring RKIP/pRKIP as potential new screening test for lung cancer and provide the basis for future validation studies.
Keywords: 
Subject: Medicine and Pharmacology  -   Oncology and Oncogenics

1. Introduction

Lung cancer remains the leading cause of cancer deaths, with over 1,8 million of deaths in worldwide [1]. It is a latent and asymptomatic disease, only 15% of patients with lung cancer are still alive 5 years after diagnosis, because approximately 70% of patients have advanced disease at the time of diagnosis [2]. Tobacco use is still the most important risk factor [1].
Studies reported that lung cancer resulted in more deaths than breast and colorectal cancers [3]. This could depend, at least in part, to the evidence that no screening test is currently available for the detection of Lung Cancer at early stage. Looking at the literature, the National Lung Screening Trial (NLST) demonstrated a 20% reduction in lung cancer mortality by screening patients at high risk with low-dose chest CT (LDCT); however, the rate of false positive and over diagnosis have emphasized the need to set-up new and more confident screening tests in order to improve the early detection and increase the overall survival of the patients [3,4].
In this scenario, research has undertaken numerous efforts for the identification of biomolecules that could be useful for screening the high-risk population. In accordance with the National Institute of Health (NIH), a biomarker is defined as "a feature used to objectively measure and assess normal biological processes, pathogenic processes, or pharmacological responses to a therapeutic intervention”. Therefore, many studies are focusing on the search for biomarkers for acute, chronic diseases, as well as cancers in non-invasive and cost-effective biological samples. [5,6,7,8,9,10,11]
Among tumor-related biomarkers, proteins are particularly interesting, because they are relatively stable and are the biological end-points responsible for most cellular functions that are often regulated by proteins’ post translational modifications (PTMs). [12] Therefore, evaluation of the native and modified form of a selected protein biomarker could be a useful way to increase the sensitivity and specificity of a diagnostic test. In this context, there is a growing interest for Raf Kinase Inhibitor Protein (RKIP), an endogenous inhibitor of Raf Kinase, widely expressed in human tissues. RKIP function is finely regulated at translational [13] and post- translational levels by microRNAs [14,15] and post translational modifications such phosphorylation [16,17] that inhibit its function and, in turn, activate the Raf kinase pathway, a key regulator of many cellular functions, such as proliferation, differentiation, survival, and angiogenesis often involved in the progression of many neoplasms [18]. A number of independent studies have shown that RKIP is frequently downregulated in many types of neoplasms, including non-small cell lung cancer (NSCLC) [19], and its downregulation is often associated with an increase in invasiveness and the ability to form metastases [20] which, overall, contributes to a greater severity [21] and worse overall survival, especially in advanced-stage NSCLC [22]. However, although this protein has been reported in plasma [23], little is known about its role in physiological and pathological processes and no data are currently available about the usefulness of this protein as potential biomarker of NSCLC. In this article we present first case-control prospective and monocentric pilot study aimed at evaluating RKIP and phospho-RKIP (pRKIP) in urine and blood of lung cancer patients to test their potentiality as biomarkers for the detection of early-stage lung cancer.

2. Materials and Methods

2.1. Study Design and Patient Selection

The present study is a prospective, single-centre case-control study, conducted on urinary and serum samples of two consecutive and different cohorts of lung cancer patients and healthy controls. Samples were collected by the Thoracic Surgery Division of the European Institute of Oncology, Milan, Italy. The protocol was approved by the Ethics Committee, n. R846/18-IEO890. The first cohort consisted of a total 42 individuals, 21 lung cancer patients (LC) and 21 high-risk healthy subjects (HR-HS) aged between 60 – 80 years. (Table 1) All subject enrolled underwent LDCT scan to confirm the presence of malignant nodules in lung cancer group and negativity of the healthy controls. The diagnosis and staging of lung cancer were confirmed by histological examination according to TNM^8 Ed (Table 2). None of the patients had a history of cancer within the previous five years and none had received radio/chemotherapy. The second cohort included 18 lung cancer patients and 21 high-risk controls (HR-HS group) aged between 50 – 70 years. The inclusion criteria adopted were the same as described for the first cohort. An independent control group of 11chest CT/x-Ray negative healthy subjects without any risk factor for lung cancer neither familiarity or symptoms was also recruited (HS group). At the time of registration, all the subjects were duly informed, signed the study-specific informed consent form and completed the clinical questionnaire. The analysis of RKIP and pRKIP was performed on urine and serum samples, in the first and second cohort, respectively. Clinical characteristics of the patients enrolled in this study are shown in table 1.

2.2. Sample Collection and Analysis

Fifty mL urine sample were collected from each patient at morning, centrifuged at 1.000 x g for 10 minutes at 4°C, aliquoted and immediately frozen at -80°C until use. Blood samples were collected by standard phlebotomy. Serum was prepared by leaving blood in the tubes for at least 30 minutes at room temperature (RT) to allow blood clotting followed by centrifugation at 1000 x g for 10 minutes at RT. Serum was removed immediately after centrifugation, leaving a 0.5 cm leftover to avoid disturbing the serum-clot interface then aliquoted and stored at – 80 °C until use. Urinary and blood levels of RKIP and Ser153 Phosphorylated-RKIP were measured either by indirect or sandwich experimental ELISA assays developed by Fluidia s.r.l. (Foggia, Italy). Briefly, this assay allows parallel and quantitative assessment of both native and phosphorylated RKIP, potentially, in any sample type. To test RKIP and pRKIP in urine samples, 100 μL of diluted samples and 100 μL reconstituted standard were loaded, in duplicate, in a two series of wells coated with a specific capture antibody. After incubation, the wells were properly washed in washing solution and subsequently incubated with the Detection Reagent A or Detection Reagent B which were able to recognize immunocomplex RKIP-RKIPAb or pRKIP-pRKIPAb, respectively. After a series of washing steps, the plates were incubated with the Detection Reagent C and the amount of the antigen-antibody complex was revealed by adding a chromogenic substrate and reading at 450 nm optical density. RKIP and pRKIP in urine samples were normalized to urine creatinine (uCr), and RKIP/pRKIP concentration were expressed as ng/mg uCr. Serum RKIP and pRKIP was assessed either by indirect or sandwich ELISA. For indirect assay, serum samples were directly loaded on the wells of an ELISA plate then, after overnight incubation and a number of washing steps, Detection Reagent A or Detection Reagent B were added to detect RKIP and pRKIP, respectively. Finally, the plates were incubated with the Detection Reagent C and the amount of the antigen-antibody complex was revealed by adding a chromogenic substrate and reading at 450 nm optical density. For sandwich ELISA, serum samples were loaded to the wells previously coated with RKIP antibody in order to capture total RKIP/pRKIP then processed as described for indirect ELISA. Urinary and serum excretion of RKIP and pRKIP as well as the RKIP/pRKIP ratio (R/pR score) were calculated for each patient and used, alone or in combination, for statistical analysis.

2.3. Statistical Analysis

The analysis of RKIP and pRKIP was performed where appropriate on urine and serum samples, in the first and second cohort, respectively. All experiments were repeated three times. Statistical analysis was performed using Microsoft Excel (Microsoft Inc., Redmond, USA). Data are presented as M ± SD or median as appropriate. Comparisons between groups were conducted using Student’s t-test. P<0.05 was considered to be statistically significant. A receiver operating characteristic (ROC) curve analysis was used to validate the association between RKIP, pRKIP or RKIP/pRKIP (RpR) ratio and the LC. The cut-off value was set by the percentile method to determine the diagnostic power of each assay according to the area under the ROC curve.

3. Results

3.1. Evaluation of RKIP and pRKIP Levels in Urine Sample

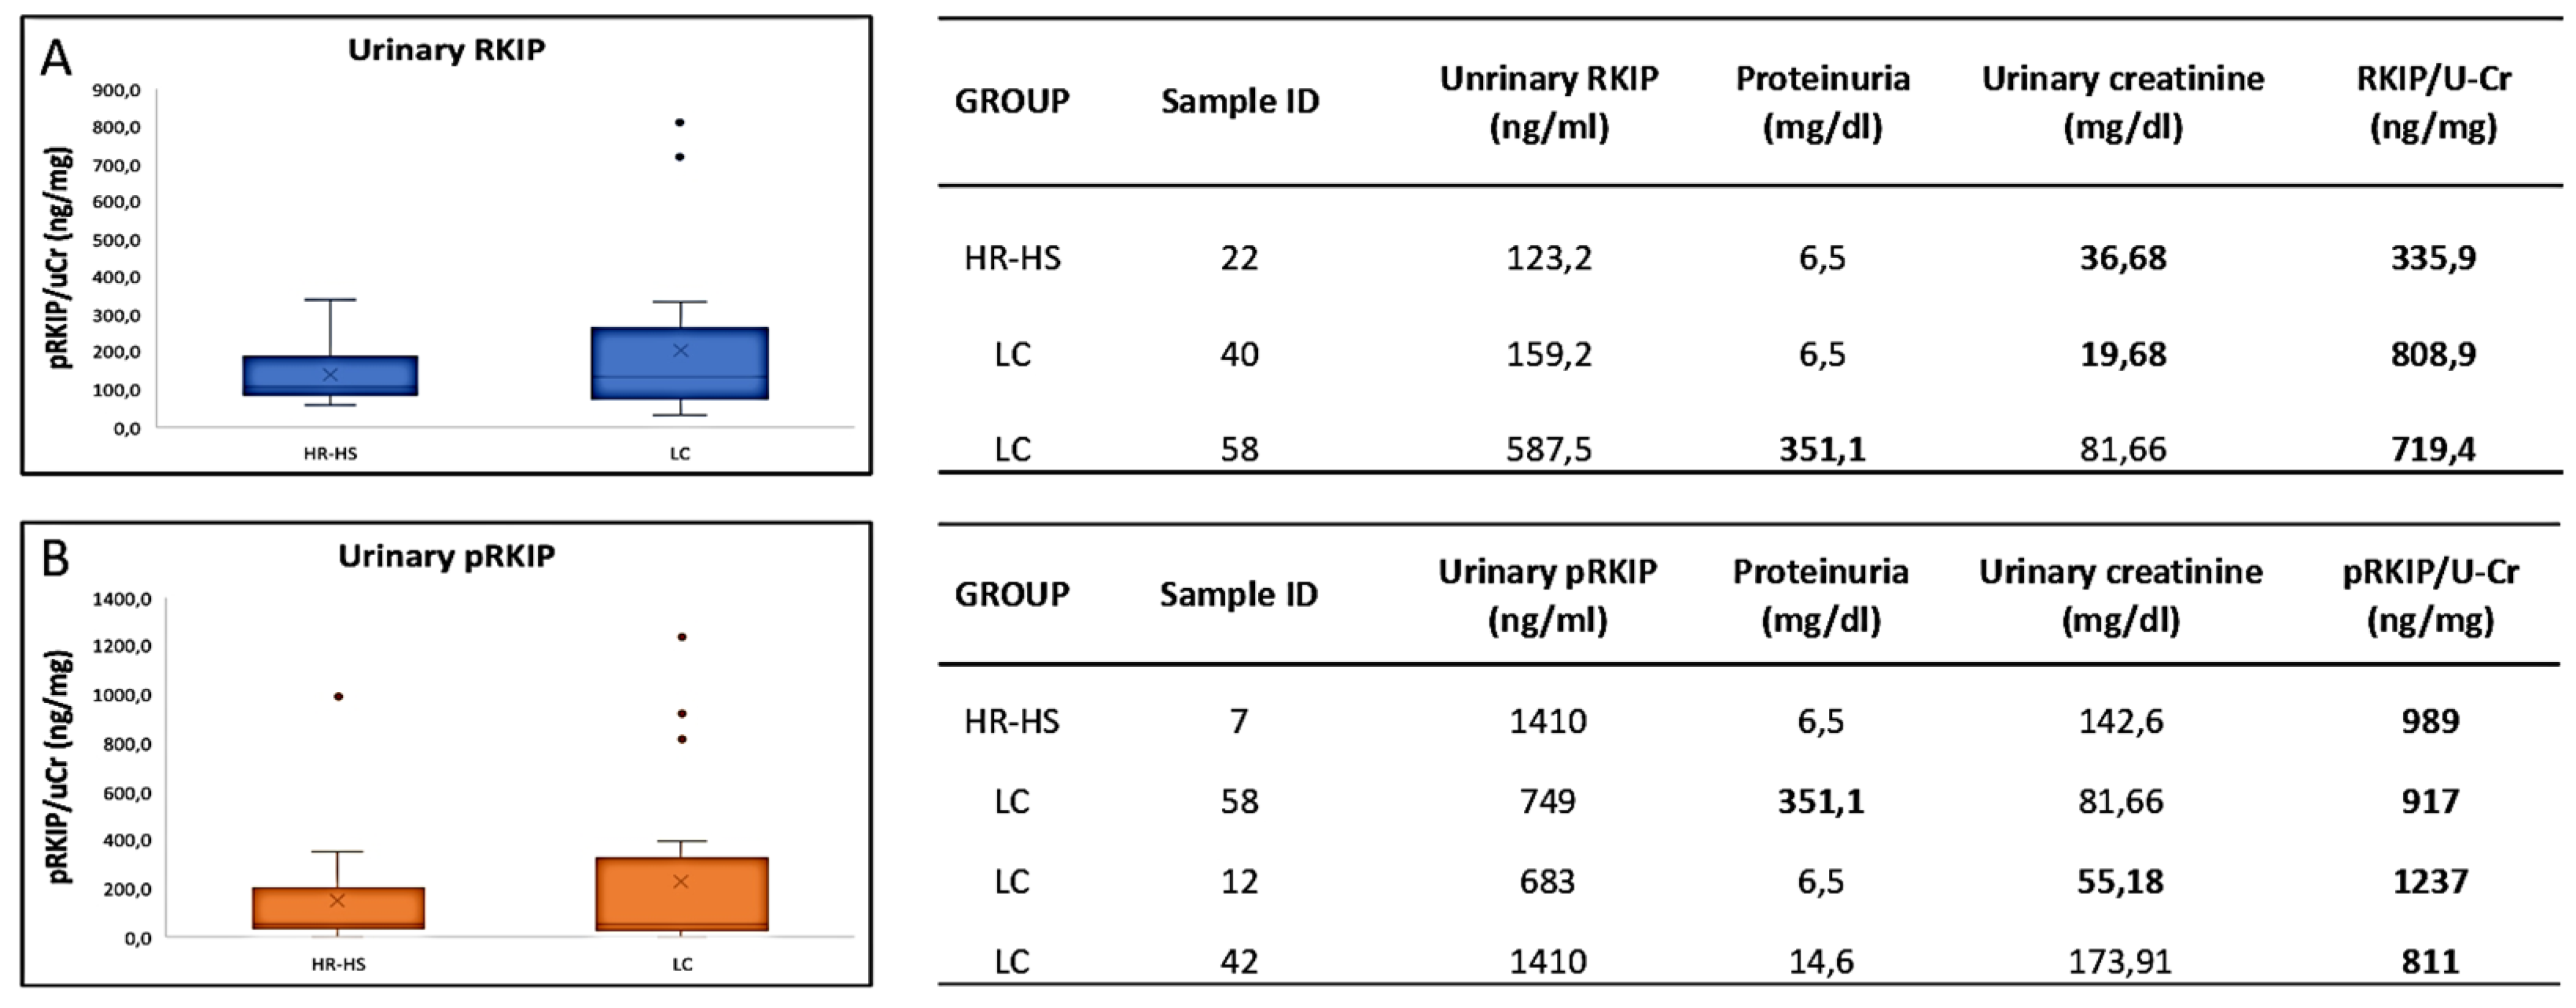
In order to establish if urinary RKIP could allow successful identification of LC patients, we firstly analyzed the levels of this protein in urine samples of early stage lung cancer patients matched with a high-risk control (HR-HS group). HR-HS and LC patients showed 138 ± 78 ng/mg/uCr and 203 ± 205 ng/mg/uCr urinary RKIP, respectively. We measured a large variability of RKIP levels in both the groups in fact it ranged from 57 to 336 ng/mg/uCr (median 104 ng/mg/uCr) in the HR-HS group and from 31 to 809 ng/mg uCr (median 133 ng/mg/uCr) in the LC group (Figure 1A). Although the LC group showed a trend of increased urinary RKIP, the differences between the groups were not statistically significant (p-value 0.09). Furthermore, we assessed urinary concentration of phosphorylated RKIP (pRKIP) in the same cohort. Again we reported a large intra-group variability (142 ± 219 ng/mg/uCr for HR-HS and 226 ± 345 ng/mg/uCr for LC) with values ranging between 0 to 989 ng/mg/uCr in the HR-HS group and from 0 and 1237 ng/mg/uCr in the LC group (figure 1B) and any statistically significant difference between the groups. Of note, analysis of patients’ clinical data showed some of those with higher urinary RKIP titer also had proteinuria or reduced urine creatinine excretion (Table 2A and 2B in Figure 1).

3.2. Evaluation of RKIP and pRKIP Levels in Serum Samples

  • - INDIRECT ELISA
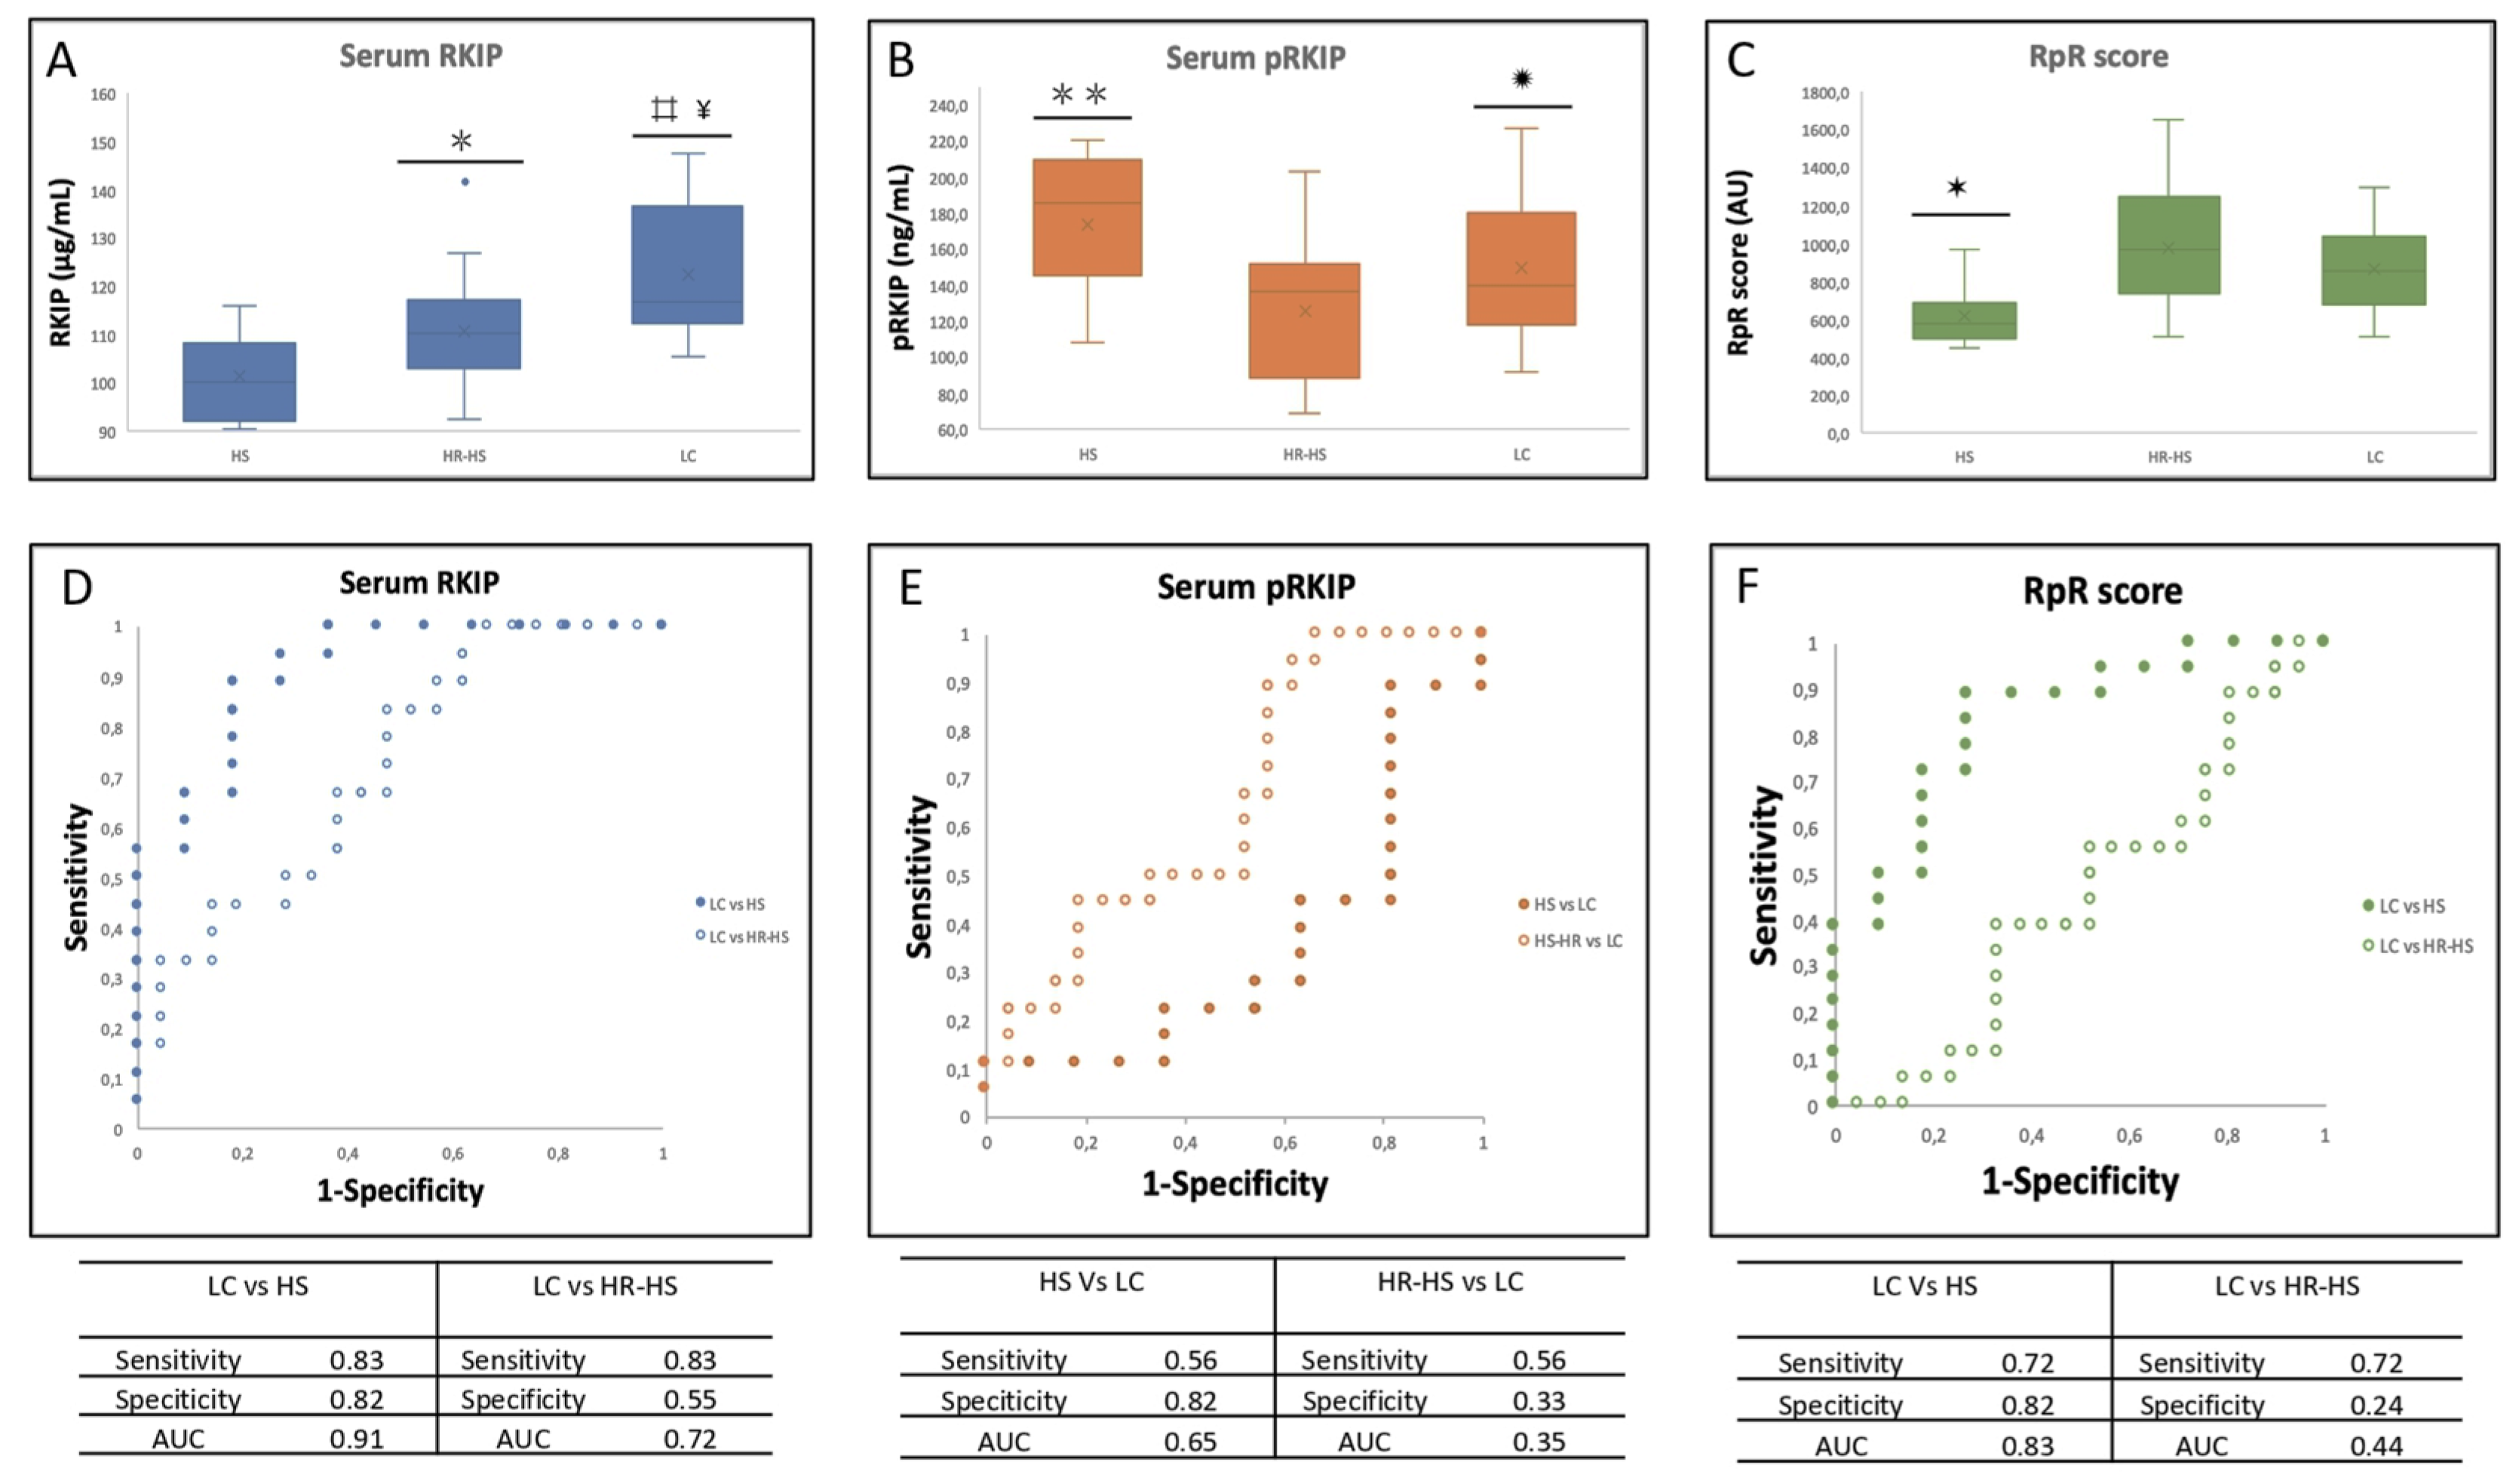
Considering the results obtained from urine, we extended the analysis of RKIP and pRKIP to the blood samples by recruiting a new cohort of LC, HR-HS and, in addiction, a group of low-risk HS subjects. In the first instance, we carried out an exploratory analysis of RKIP and pRKIP through an indirect ELISA. Briefly, LC group showed higher levels of blood RKIP when compared to both HS and HR-HS (Figure 2A). Specifically, we measured 122.5 ± 14.1 μg/mL in LC group compared to 110.7 ± 11.8 μg/mL and 101.4 ± 9.0 μg/mL in HR-HS and HS groups, respectively. The differences were statistically significant with both the control groups (P-value of LC vs. HS and HR-HS was 1.93704E-07 and < 0.005, respectively). Of note, we observed statistically significant differences also between HS and HR-HS (p-value < 0.005). Furthermore, we measured pRKIP levels in the same cohort. HS group showed the highest levels (173 ± 41 ng/mL) while HR-HS and LC had lower levels (125 ± 39 ng/mL and 149 ± 41 ng/mL, respectively). We found a statistically significant differences between LC and HR-HS (p-value <0.05) and between HS vs. HR-HS (p-value < 0.0005) (figure 2B). Of note there was no statistically significant difference between LC and HS. We also calculated the RKIP/pRKIP ratio in each sample and observed lower ratio in HS group (616 ± 160) with respect to both HS-HR and LC group which had almost comparable levels (974 ± 324 and 870 ± 220, respectively). Furthermore, the differences were statistically significant between LC vs. HS (p-value < 0.005) and between HS vs HS-HR (p-value < 0.005) but not between LC and HR-HS. In order to establish diagnostic power of the assay, we calculated the Area Under the Curve (AUC) for RKIP, pRKIP and RpR score by applying ROC analysis (figure 2 D-F). The assessment of serum RKIP correctly classified LC patients over Healthy Subjects with 83 % sensitivity and 82% specificity (AUC 0.92 – Accuracy 82%) by putting a cut-off value of 112.2 μg/mL (Figure 2D - Solid circles). This model, though, was unable to correctly classified LC patients over HR-HS, in fact we calculated 83% sensitivity but only 55% specificity (AUC =0.72 - Accuracy 67%) with the same cut-off value (Figure 2D- empty circles). We then calculated the ROC curves for pRKIP when LC was compared to other groups. The analysis showed lower diagnostic performances than for RKIP, thus we obtained only 56 % sensitivity and 82% specificity (AUC 0.66 - Accuracy 65%) when HS was compared to LC (Figure 2E - Solid circles) and 56% sensitivity and 33% specificity (AUC 0.35 – Accuracy 43%) when HR-HS was compared to LC (Figure 2E- empty circles). Finally, we calculated the diagnostic power of RKIP/pRKIP ratio. It discriminated LC from HS with 72% sensitivity and 82 % specificity (AUC 0.83 - Accuracy 76%) but it failed to correctly classify LC over HR-HS patients due to the low specificity (AUC 0.44 - Accuracy 46% -Figure 2F).
  • -SANDWICH ELISA
With the aim of improve the accuracy of classification we re-analyzed serum samples by sandwich ELISA that assess both RKIP and pRKIP. We measured 23.6 ± 11.8 μg/mL total RKIP in LC, 15.7 ± 16.3 μg/mL in HR-HS and 2.4 ± 0.96 μg/mL in HS (Figure 3A). RKIP levels ranged from 1 to 37.1 μg/mL (median value 28.13 μg/mL) in LC group, from 1.8 to 70.8 in the HR-HS group (median 10.4 μg/mL) and from 1.3 and 4.7 μg/mL in the HS group (median 2.2 μg/mL) (Table S2A). The differences between LC and the other groups were statistically significant (p-values LC vs HS and HR-HS were 3.3883E-07 and <0.05, respectively). The differences between HS and HR-HS were also significant (P-value <0.001). In contrast, we assessed higher levels of pRKIP (1.1± 0.5 μg/mL) in HS group (0.2-2.2 μg/mL; median 1.1 μg/mL), intermediate values (1 ± 0.4 μg/mL) in HR-HS group (0.2-1.9 μg/mL; median 0.9 μg/mL) and lower levels (0.6 ± 0.4 μg/mL) in LC group (0.1-1.1μg/mL; median 0.7 μg/mL) (Figure 3B and Table S2B). The differences between LC vs. HS and HR-HS were statistically significant (p-value < 0.005). The opposite trend in the concentration of RKIP and pRKIP in LC group vs HS and HR-HS increased the RKIP/pRKIP ratio (RpR score) in affected patients (Figure 3C). In fact, the median values of RpR score were 1.8 (1.3-14.9) in the HS group, 11.1 (1.9-108.6) in the HR-HS group and 36.1 (1.7-370) in the LC group. The differences based on RpR score were statistically significant even between LC and both control groups (p-value LC vs HS < 0.01; LC vs HR-HS < 0.05) and between HS and HR-HS (p-value < 0.01). We further calculated the Area Under the Curve (AUC) for RKIP, pRKIP and RpR score by applying ROC analysis. Serum RKIP correctly classified LC patients over Healthy Subjects with 94% sensitivity and 91% specificity (AUC 0.94 – accuracy 93%) by putting a cut-off value of 3.86 μg/mL (Figure 3D) while It reaches a 72% sensitivity and 76 %specificity (AUC: 0.72 – Accuracy 74%) when the classification model was applied to LC patients Vs. HR-HS (cut-off: 27 μg/mL). The diagnostic model based on the assessment of serum pRKIP (cut-off value for LC patients < 0.8 μg/mL) showed 72% sensitivity and 82% specificity (AUC: 0.81 – Accuracy 76%) when it was used to classify LC over HS patients and 72 % sensitivity vs 62% specificity (AUC 0.72 – Accuracy 67%) when it was used to classify LC over HR-HS patients (Figure 3E). Finally, the calculation of the AUC based on the combined analysis of RKIP and pRKIP showed the best diagnostic performance: the model reached 83% sensitivity and 100 % specificity (AUC 0.95 -Accuracy 90%) when used to classify LC vs HS and 83% sensitivity and 76 % specificity (AUC: 0.79 – Accuracy 79%) when it was used to classify LC vs HR-HS patients (Figure 3F). Overall, the ROC curve based on the RpR score provided more accurate diagnostic performance than those based on RKIP alone (AUC 0.79 vs 0.72 - Figure 3G).
Table 1. Characteristics of participants.
PHASE 1 PHASE 2
All Lung
cancer
Healthy Controls p-value All Lung
cancer
healthy Controls p-value
Subjects (n) 42 (100) 21 (100) 21 (100) 41 (100) 18 (100) 21 (100)
Mean Age 65.5 ± 6.3 67.1 ± 6.6 63.9 ± 5.5 0.089 68.0 ± 6.8 69.8 ± 6.7 66.1 ± 6.4 0.083
Sex
Female 18 (42.9) 10 (47.6) 8 (38.1) 16 (39.0) 11 (61.1) 5 (23.8)
Male 24 (57.1) 11 (52.4) 13 (61.9) 0.76 24 (58.5) 9 (50.0) 15 (71.4) 0.11
Smoking status
Current smokers 15 (35.7) 7 (33.3) 8 (38.1) 8 (19.5) 2 (11.1) 6 (28.6)
Ex-smokers 20 (47.6) 9 (42.9) 11 (52.4) 25 (61.0) 12 (66.7) 13 (61.9)
Never-smokers 7 (16.7) 5 (23.8) 2 ( 9.5) 0.60 7 (17.1) 6 (33.3) 1 ( 4.8) 0.081
Mean Pack-years 51.1 ± 35.3 58.9 ± 35.0 44.6 ± 35.1 0.24 30.5 ± 29.5 30.0 ± 29.1 30.9 ± 30.6 0.93
Commorbidities
AH1 17 (40.5) 11 (52.4) 6 (28.6) 0.21 19 (46.3) 12 (66.7) 7 (33.3) 0.20
Cardiac disease 4 ( 9.5) 4 (19.0) 0 ( 0.0) 0.11 3 ( 7.3) 0 ( 0.0) 3 (14.3) 0.23
Metabolic disease2 17 (40.5) 8 (38.1) 9 (42.9) 1.00 12 (29.3) 5 (27.8) 7 (33.3) 0.73
COPD3 4 ( 9.5) 0 ( 0.0) 4 (19.0) 0.11 3 ( 7.3) 0 ( 0.0) 3 (14.3) 0.23
AH1= arterial hypertension; Metabolic disease2= diabetes and dyslipidemia; COPD3= chronic obstructive pulmonary disease
Table 2. Lung cancer histology.
PHASE 1 PAHSE 2
Histology Adenocarcinoma 17 13
squamous-cell carcinoma 1 2
Neuroendocrine 3 3
Stage IA 5 3
IA2 6 2
IA3 4 4
IB 6 2
IIB - 3
IIIA - 4
Figure 1. RKIP and pRKIP urinary excretion in urine of HR-HS and LC patients.
Preprints 103614 g001
Urinary RKIP (A) and pRKIP (B) showed large variability in HR-HS (138 ± 78 ng/mg/uCr for RKIP and 142 ± 219 ng/mg/uCr for pRKIP) and LC (203 ± 205 ng/mg/uCr for RKIP and 226 ± 345 ng/mg/uCr for pRKIP). Further, the differences between LC and HR-HS were not statistically significant (p-value 0.09). Table A and B show proteinuria and urine creatinine of the patients with higher titer of RKIP and pRKIP, respectively.
Figure 2. Serum levels of RKIP and pRKIP assessed by indirect ELISA.
Preprints 103614 g002
Total (A) and ser-153 phosphorylated (B) serum RKIP assayed by indirect ELISA. Ratio between Total RKIP and pRKIP is shown in panel C; ⌗ = p-value = 1.93704E-07 LC vs HS; ¥ p-value < 0.005 LC vs HR-HS; Preprints 103614 i001 = p-value < 0.005 HS vs HR-HS; ✹ = p-value < 0.05 HR-HS vs LC; Preprints 103614 i001 Preprints 103614 i001 = p-value < 0.0005 HS-HR vs HS; ✶ = p-value < 0.005 HS vs HR-HS and LC . D. AUC obtained by measuring total serum RKIP in LC vs HS (solid circles) or HR-HS (empty circles); E AUC obtained by measuring serum pRKIP in Hs vs LC (solid circles) or HR-HS vs LC (empty circles); F. AUC obtained by measuring serum RKIP/pRKIP ratio in Hs vs LC (solid circles) or HR-HS vs LC (empty circles);
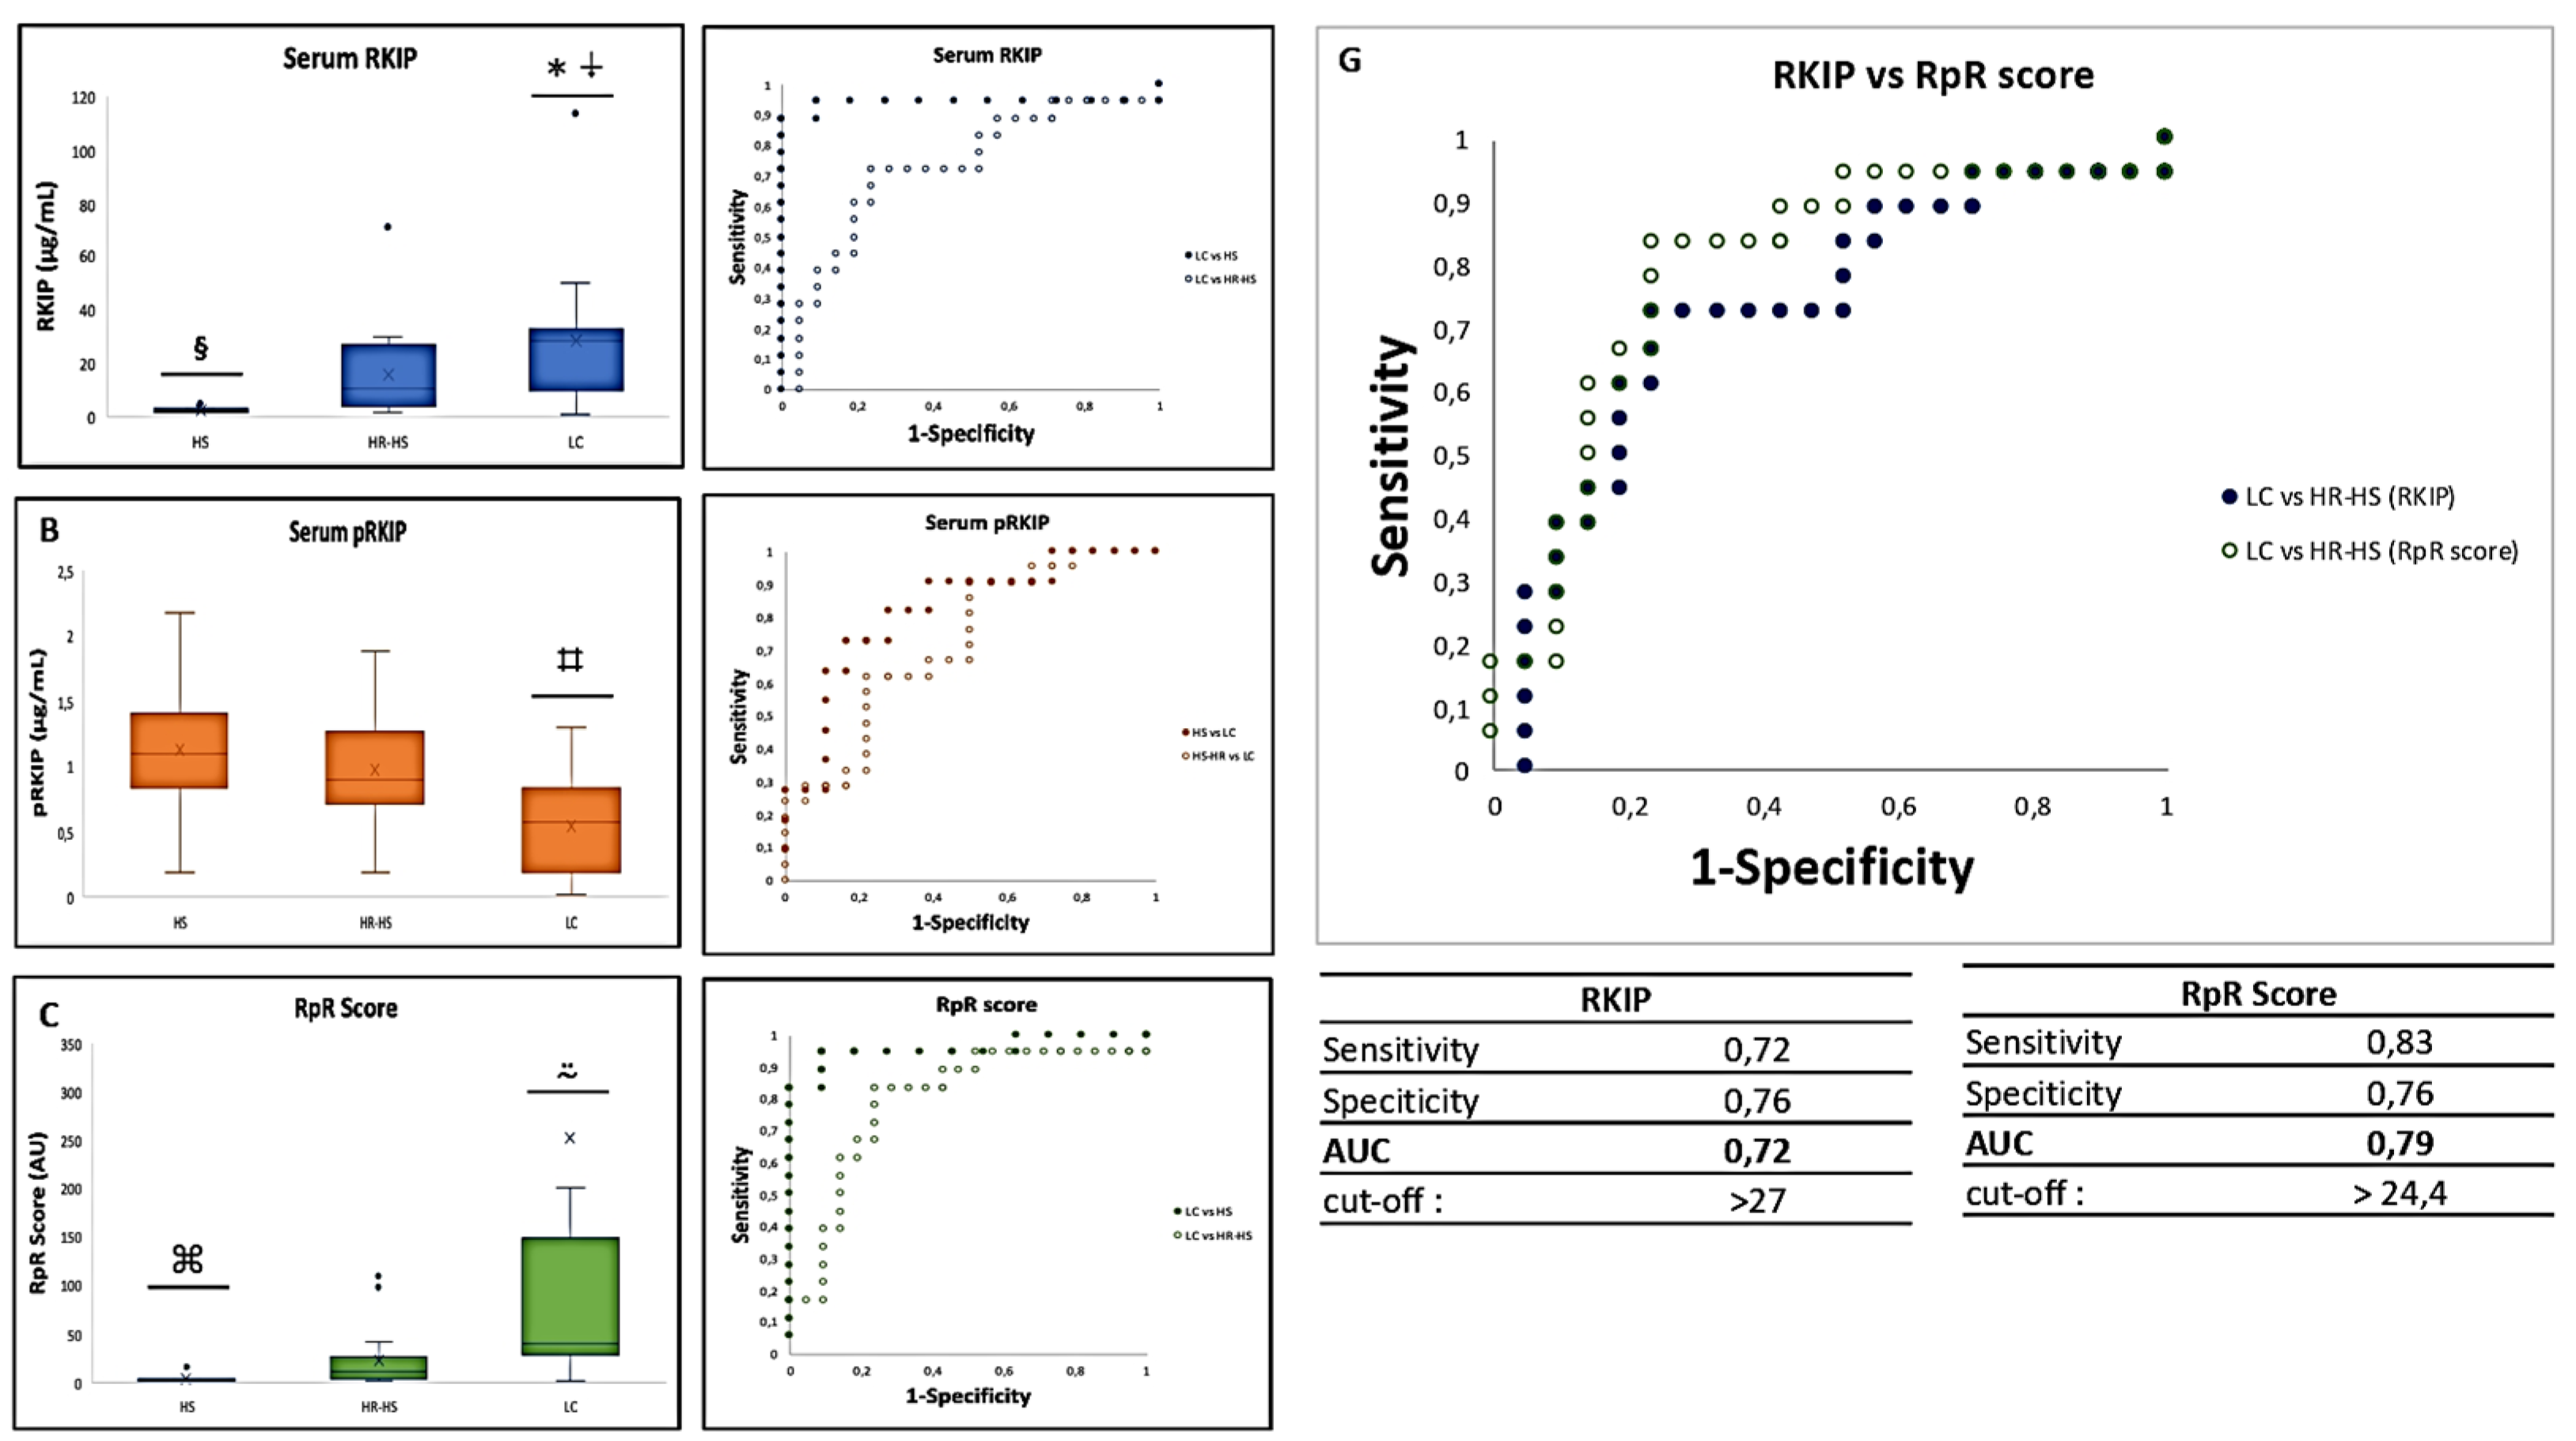
Figure 3. Serum levels of RKIP and pRKIP assayed by sandwich ELISA.
Preprints 103614 g003
Total (A) and ser-153 phosphorylated (B) serum RKIP assayed by sandwich ELISA. Ratio between Total RKIP and pRKIP is shown in panel C; Preprints 103614 i001 = p-value 3.3883E-07 LC vs HS; ⍖= p-value < 0.05 LC vs HR-HS; § = p-value < 0.001 HS vs HR-HS; ⌗ = p-value < 0.005 LC vs HS and HR-HS; ⍨ = p-value < 0.01 LC vs HS and HR-HS; ⌘= p-value < 0.01 HS vs HR-HS .D. AUC obtained by measuring total serum RKIP in LC vs HS (solid circles) or HR-HS (empty circles); E AUC obtained by measuring serum pRKIP in Hs vs LC (solid circles) or HR-HS vs LC (empty circles); F. AUC obtained by measuring serum RKIP/pRKIP ratio in LC vs HS ( solid circles) or LC vs HR-HS (empty circles); G. Comparison of AUC obtained by classifying LC over HR-HS patients by RKIP vs. RpR score

4. Discussion

Lung cancer is the leading causes of cancer death. The NSCLC accounts for 80–90% of lung cancer cases and is among the most malignant type of cancer since up to 70% of affected patients are diagnosed at the advanced stage of disease [24]. Therefore, the identification of novel biomarkers for early diagnosis of lung cancer represents a key challenge for the development of a non-invasive and less expensive screening test, useful to improve the clinical practice and the prognosis of patients. To the best of our knowledge, the present study describes for the first time the potential utility of blood assessment of RKIP and pRKIP as novel biomarkers for the early identification of NSCLC. The research was conducted in urinary and serum samples from two independent cohorts of subjects: patient with diagnosis of lung cancer vs. high-risk healthy people with negative LDCT for lung cancer. In order to understand how the expression levels of RKIP and pRKIP change in both of group, we carried out a first analysis exclusively on the urine samples of the first cohort enrolled (table 1). We have chosen the urine as first sample since our previous results from Gasparri et.al [25] showed the diagnostic power of urinary volatile organic compounds (VOCs) to detect the early stage of lung cancer and Papale et.al [26] described the potential of assessing urinary RKIP and pRKIP as novel biomarkers for clear cell Renal cell Carcinoma (ccRCC). Thus, we investigated the possibility of translating the results already obtained in kidney cancer into a lung cancer cohort with the aim of further strengthening the diagnostic power of the model based on VOCs profile. The analysis of urinary RKIP/pRKIP in this cohort showed overall overlapping levels of the biomarker in the urine of LC patients and matched controls, with a slight increase in RKIP in patients in the LC group. However, some patients had unusually higher levels of the biomarker in their urine. A careful analysis of the characteristics of these patients showed that some of those with higher urinary RKIP values also had increased proteinuria or reduced urine creatinine (figure 1), two conditions which can indicate kidney impairment and protein loss. Interestingly, this could suggest that the blood concentration of the marker might be greater than that measured in urine and that the slight differences in urinary excretion may depend, at least in part, on the kidney’s ability to reabsorb most of the filtered RKIP that underestimate the differences between the groups. For these reasons, we decided to complete the research by recruiting a second cohort of LC and matched Healthy Subjects and focusing our attention on blood samples. We carried out a first set of exploratory experiments by indirect ELISA that demonstrated a statistically significant increase of total RKIP in blood of LC patients. A comparison between the groups showed that there was a progressive increase in blood levels of RKIP as they moved from healthy subjects to patients at risk, with a marked increase in patients with LC in the early stages. Of note, we observed statistically significant differences also between low risk (HS) and high risk (HR-HS) healthy subjects which could highlight the increased blood RKIP as risk factor for the subsequent development of the tumor. Furthermore, we found that HS group showed the higher levels of pRKIP compared to HR-HS and LC and, as a consequence, we observed a significant increase of RKIP/pRKIP ratio (RpR score) in both at-risk and lung cancer patients. Unfortunately, the score calculated by using this assay was unable to distinguish HR-HS from LC precisely. We hypothesized that indirect ELISA could be an inaccurate test for the detection of proteins such as pRKIP that are expressed at lower concentrations in blood so we decided to re-screened the samples by means of a sandwich ELISA that allows at preliminary capturing blood RKIP and then at measuring its total and phosphorylated form. This analysis confirmed the increase in blood RKIP and most importantly, highlighted a trend of reduction of phosphorylated RKIP in LC group that leads to a statistically significant increase of RpR score in this group. The ROC curves obtained by the analysis of RKIP and pRKIP through the sandwich test allowed to establish that the evaluation of blood RKIP alone was able to correctly classify LC patients when compared to the low and High Risk-HS with 93% and 74% accuracy, respectively. The pRKIP-based classification model identified LC patients with an accuracy of 76 % when compared to the HS group and 72 % when compared to the HR-HS group. Finally, the model based on the evaluation of the RKIP/pRKIP ratio showed a 90% diagnostic accuracy for LC when this group was compared with the HS and, most importantly, up to 79% accuracy when it was compares to the high-risk group. Interestingly, the patient of HR-HS group with the highest RKIP value (70.8 µg/mL) developed LC the year following the analysis, which seems to reinforce the predictive value of this test for the early detection of lung cancer. The results of this study may appear to contradict the current literature, but this could be only apparently true. In fact, in most of the studies published so far, significant reduction in RKIP levels has been described, correlated proportionally with the aggressiveness and ability of tumors to form metastases. Thus, there is a close association between reduced RKIP expression and the progression of various cancers including NSCLC [18]. However, most of the cited studies mainly focused on the expression RKIP in tumour tissues, while there is little evidence on blood expression of RKIP and pRKIP. In blood, RKIP is prominently expressed in CD34+ hematopoietic stem and progenitor cells (HSPCs) and in lymphocytes while it is greatly less expressed in differentiated myeloid leukocytes, including granulocytes and monocytes [27]. In addition, Bedri et al. [23] recently described a significant reduction of plasma RKIP in multiple sclerosis patients treated with a highly anti-inflammatory monoclonal antibody, therefore we hypothesize that the increase of blood RKIP observed in early stage LC patients could be linked, at least in part, to activation of the immune system against the tumor. Indeed, the inflammation is a hallmark of cancer and is mediated by immune cells attracted to or residing at sites of neoplastic transformation [28,29] thus, tumor-immune system communications form the basis for disease pathophysiology. We speculate that increased RKIP expression could be associated to the modulation of tumour microenvironment. Our hypothesis is corroborated by the evidence that RKIP controls TAMs’ infiltration [30]. In addition, it has been reported that RKIP regulates CCL5 expression to inhibit cancer invasion and metastasis by controlling macrophage infiltration [31] and may be considered as an important novel negative regulator of tumour microenvironment, at least by blocking the recruitment of pro-metastatic macrophages, through regulation of chemokines expression [32]. In this context, the increase in blood RKIP that we reported in patients with early-stage NSCLC could be an indication of the immune system’s attempt to block tumor progression by inhibiting the recall of TAMs in the tumor microenvironment. This concept is supported in our model by the fact that we observed, experimentally, a significant increase in the active form of RKIP and a concomitant significant reduction in the inactive (phosphorylated) one that, in turn, lead to significant increase of RpR ratio, a novel cancer score postulated by Papale et al. [18,26] as preliminary screening test to detect lung cancer in high-risk subjects.

4.1. Study Limitation

The present study underlined the potentiality of RKIP and pRKIP to differentiate lung cancer patients from healthy subjects. However, the research was conducted on a limited number of subjects in a monocentric study. Moreover, at the moment it has not been possible to establish whether and how quickly the removal of the tumor leads to a normalization of blood levels of the biomarker. Finally, we were unable to correlate serum levels RKIP with tumour macrophage infiltration. These aspects will have to be investigated by further studies by recruiting an independent cohort of patients and establish with greater precision the optimal cut-off value of each biomarker to obtain a standardized risk score for LC.

5. Conclusions

In conclusion the set of analyses conducted in the present work suggest that blood RKIP is increased in early-stage lung cancer, while its phosphorylated form is reduced. Moreover RKIP/pRKIP ratio allows to provide a more accurate risk score than the evaluation of each individual biomarker. On the whole the results obtained in this research suggest to take up major knowledge about the role of blood RKIP and pRKIP as novel biomarkers for the early diagnosis of lung cancer.

Supplementary Materials

The following supporting information can be downloaded at the website of this paper posted on Preprints.org, Table S1A: mean vale of urinary RKIP as well as proteinuria and urinary creatinine recorded for each patient enrolled in phase 1. Table S1B: mean vale of urinary pRKIP as well as proteinuria and urinary creatinine recorded for each patient enrolled in phase 1. Table S2A: mean values of serum RKIP, pRKIP and RpR score recorded by indirect ELISA for each patient enrolled in phase 2. Table S2B: mean values of serum RKIP, pRKIP and RpR score recorded by sandwich ELISA for each patient enrolled in phase 2.

Author Contributions

L.S. and R.G. are respectively PI and co-PI of the study, they designed the study, followed approval of the ethics committee, the enrolment and sample collection; R.G. revised the manuscript. M.P. co-designed the study, coordinated the experimental plan, performed statistical analyses and wrote the MS; A.S. has counted on the revision of the databases, wrote and revised the manuscript and tables. A.D. took part to the assay development and carried out the analyses on urine samples; V.C. and F. D. executed serum analyses by indirect and sandwich assay and elaborated part of the results; E.R. critically revised the MS.

Funding

This research was funded by institutional founding FONDAZIONE IEO-MONZINO, grant number FIEO-2018.

Institutional Review Board Statement

The study was conducted in accordance with the Declaration of Helsinki, and approved by the Institutional Review Board (or Ethics Committee) of European Institute of Oncology (IEO) (protocol code R846/18-IEO, approved on 26/07/2018); amendment for phase 2 approved in date 16/12/20.

Informed Consent Statement

Informed consent was obtained from all subjects involved in the study.”

Data Availability Statement

We encourage all authors of articles published in MDPI journals to share their research data. In this section, please provide details regarding where data supporting reported results can be found, including links to publicly archived datasets analyzed or generated during the study. Where no new data were created, or where data is unavailable due to privacy or ethical restrictions, a statement is still required. Suggested Data Availability Statements are available in section “MDPI Research Data Policies” at https://www.mdpi.com/ethics.

Acknowledgments

We want to acknowledge Dr. Federica Spadaccino, PhD from (University of Foggia) for her technical support in carrying out part of the experiments and her contribution to the analysis’ standardization.

Conflicts of Interest

M.P. and E.R are currently shareholders of FLUIDIA s.r.l. a Biotech SME that developed and patented the assay for RKIP/pRKIP detection.

References

  1. Sung H, Ferlay J, Siegel RL, et al. Global Cancer Statistics 2020: GLOBOCAN Estimates of Incidence and Mortality Worldwide for 36 Cancers in 185 Countries. CA Cancer J Clin. 2021;71(3):209-249. [CrossRef]
  2. Siegel RL, Miller KD, Jemal A. Cancer statistics, 2019. CA Cancer J Clin. 2019;69(1):7-34. [CrossRef]
  3. Alexander M, Kim SY, Cheng H. Update 2020: Management of Non-Small Cell Lung Cancer. Lung. 2020;198(6):897-907. [CrossRef]
  4. Chu GCW, Lazare K, Sullivan F. Serum and blood based biomarkers for lung cancer screening: a systematic review. BMC Cancer. 2018;18(1):181. Published 2018 Feb 13. [CrossRef]
  5. Van Kimmenade RR, Januzzi JL Jr. Emerging biomarkers in heart failure. Clin Chem. 2012;58(1):127-138. [CrossRef]
  6. Conserva, F., Barozzino, M., Pesce, F. et al. Urinary miRNA-27b-3p and miRNA-1228-3p correlate with the progression of Kidney Fibrosis in Diabetic Nephropathy. Sci Rep 9, 11357 (2019). [CrossRef]
  7. Harris AC, Ferrara JL, Braun TM, et al. Plasma biomarkers of lower gastrointestinal and liver acute GVHD. Blood. 2012;119(12):2960-2963. [CrossRef]
  8. Papale M, Di Paolo S, Magistroni R, et al. Urine proteome analysis may allow noninvasive differential diagnosis of diabetic nephropathy. Diabetes Care. 2010;33(11):2409-2415. [CrossRef]
  9. Gasparri R, Guaglio A, Spaggiari L. Early Diagnosis of Lung Cancer: The Urgent Need of a Clinical Test. J Clin Med. 2022;11(15):4398. Published 2022 Jul 28. [CrossRef]
  10. Pepe MS, Etzioni R, Feng Z, et al. Phases of biomarker development for early detection of cancer. J Natl Cancer Inst. 2001;93(14):1054-1061. [CrossRef]
  11. Gasparri R, Sabalic A, Spaggiari L. The Early Diagnosis of Lung Cancer: Critical Gaps in the Discovery of Biomarkers. J Clin Med. 2023;12(23):7244. Published 2023 Nov 23. [CrossRef]
  12. Deleonardis A, Papale M. Methods to Study Posttranslational Modification Patterns in Cytotoxic T-Cells and Cancer. Methods Mol Biol. 2021;2325:137-153. PMID: 34053056. [CrossRef]
  13. Kim, G. E., Kim, N. I., Lee, J. S., Park, M. H., & Yoon, J. H. (2017). Reduced RKIP Expression is Associated With Breast Neoplastic Progression and is Correlated With Poor Outcomes and Aberrant Methylation in Breast Carcinoma. Applied immunohistochemistry & molecular morphology : AIMM, 25(7), 467–474; [CrossRef]
  14. Luo D., Zhang Z., Zhang Z., et al. Aberrant expression of miR-362 promotes lung cancer metastasis through downregulation of sema3A. J Immunol Res. 2018, 2018:1687097.
  15. Gong Z., Chen X., Zhang Y.C., Liu C., Wang Z., Xu X., Zhu J., Xue T. LncRNA GATA6-AS1 Inhibits the Progression of Non-Small Cell Lung Cancer via Repressing microRNA-543 to Up-Regulating RKIP. Cancer Manag Res. 2020, 12, 9327–9338.
  16. Huerta-Yepez S., Yoon N.K., Hernandez-Cueto A., Mah V., Rivera-Pazos C.M., Chatterjee D., Vega M.I., Maresh E.L., Horvath S., Chia D., et al. Expression of phosphorylated raf kinase inhibitor protein (pRKIP) is a predictor of lung cancer survival. BMC Cancer. 2011, 11:259. [CrossRef]
  17. Al-Mulla, F.; Bitar, M.S.; Thiery, J.P.; Zea, T.T.; Chatterjee, D.; Bennett, L.; Park, S.; Edwards, J.; Yeung, K.C. Clinical implications for loss or diminution of expression of Raf-1 kinase inhibitory protein and its phosphorylated form in ductal breast cancer. Am. J. Cancer Res. 2013, 3, 446–464.
  18. Papale M, Netti GS, Stallone G, Ranieri E. Understanding Mechanisms of RKIP Regulation to Improve the Development of New Diagnostic Tools. Cancers (Basel). 2022;14(20):5070. Published 2022 Oct 17. [CrossRef]
  19. Klysik J. et al. Signaling crossroads: The function of Raf kinase inhibitory protein in cancer, the central nervous system and reproduction. Cell. Signal. 2008, 20, 1-9., Yesilkanal AE Rosner MR. Targeting Raf Kinase Inhibitory Protein Regulation and Function Cancers (Basel), 2018, 9 (10), 306.
  20. Wang A. Duan G., Zhao C., Gao Y., Liu X., Wang Z., Li W., Wang K., Wang W. Reduced RKIP expression levels are associated with frequent non-small cell lung cancer metastasis and STAT3 phosphorylation and activation, Oncol Lett. 2017, 5 (13), 3039-3045.
  21. Wang Q., Wu X., Wu T., Li G., Shi Y. Clinical Significance of RKIP MRNA Expression in Non-Small Cell Lung Cancer. Tumor Biol. 2014;35:4377–4380. [CrossRef]
  22. Xiong Y, Zhang X, Lin Z, et al. SFTA1P, LINC00968, GATA6-AS1, TBX5-AS1, and FEZF1-AS1 are crucial long non-coding RNAs associated with the prognosis of lung squamous cell carcinoma. Oncol Lett. 2019;18(4):3985-3993. [CrossRef]
  23. Bedri SK, Nilsson OB, Fink K, et al. Plasma protein profiling reveals candidate biomarkers for multiple sclerosis treatment. PLoS One. 2019;14(5):e0217208. Published 2019 May 29. [CrossRef]
  24. Black RC, Khurshid H. NSCLC: An Update of Driver Mutations, Their Role in Pathogenesis and Clinical Significance. R I Med J (2013). 2015;98(10):25-28. Published 2015 Oct 1.
  25. Gasparri R, Capuano R, Guaglio A, et al. Volatolomic urinary profile analysis for diagnosis of the early stage of lung cancer. J Breath Res. 2022;16(4):10.1088/1752-7163/ac88ec. Published 2022 Sep 2. [CrossRef]
  26. Papale M, Vocino G, Lucarelli G, et al. Urinary RKIP/p-RKIP is a potential diagnostic and prognostic marker of clear cell renal cell carcinoma. Oncotarget. 2017;8(25):40412-40424. [CrossRef]
  27. Zebisch A, Caraffini V, Sill H. RAF Kinase Inhibitor Protein in Myeloid Leukemogenesis. Int J Mol Sci. 2019;20(22):5756. Published 2019 Nov 16. [CrossRef]
  28. Elinav E, Nowarski R, Thaiss CA, Hu B, Jin C, Flavell RA. Inflammation-induced cancer: crosstalk between tumours, immune cells and microorganisms. Nat Rev Cancer. 2013;13(11):759-771. [CrossRef]
  29. Balkwill F, Charles KA, Mantovani A. Smoldering and polarized inflammation in the initiation and promotion of malignant disease. Cancer Cell. 2005;7(3):211-217. [CrossRef]
  30. Frankenberger C, Rabe D, Bainer R, et al. Metastasis Suppressors Regulate the Tumor Microenvironment by Blocking Recruitment of Prometastatic Tumor-Associated Macrophages. Cancer Res. 2015;75(19):4063-4073. [CrossRef]
  31. Datar I, Qiu X, Ma HZ, et al. RKIP regulates CCL5 expression to inhibit breast cancer invasion and metastasis by controlling macrophage infiltration [published correction appears in Oncotarget. 2016 May 3;7(18):26925]. Oncotarget. 2015;6(36):39050-39061. [CrossRef]
  32. Gabriela-Freitas M, Pinheiro J, Raquel-Cunha A, Cardoso-Carneiro D, Martinho O. RKIP as an Inflammatory and Immune System Modulator: Implications in Cancer. Biomolecules. 2019;9(12):769. Published 2019 Nov 22. [CrossRef]
Disclaimer/Publisher’s Note: The statements, opinions and data contained in all publications are solely those of the individual author(s) and contributor(s) and not of MDPI and/or the editor(s). MDPI and/or the editor(s) disclaim responsibility for any injury to people or property resulting from any ideas, methods, instructions or products referred to in the content.
Copyright: This open access article is published under a Creative Commons CC BY 4.0 license, which permit the free download, distribution, and reuse, provided that the author and preprint are cited in any reuse.
Prerpints.org logo

Preprints.org is a free preprint server supported by MDPI in Basel, Switzerland.

Subscribe

© 2024 MDPI (Basel, Switzerland) unless otherwise stated