1. Introduction
Gas solid two-phase flows are widely present in various fields of process engineering, such as petroleum, chemical industry, metallurgy, thermal energy, and mining processing [
1,
2]. Gas-solid fluidized bed reactors have the advantages of high combustion efficiency, high mixing rate and wide fuel adaptability [
3,
4,
5,
6]. The design, scaling up, control, and optimization of fluidized beds in these fields require a deep understanding of multiphase fluid dynamics, transfer, and reaction behavior within the reactor, as well as their interactions with various complex flow structures and the coordination laws of various control mechanisms. Moreover, gas-solid two-phase flow is also the most fundamental and cutting-edge branch of multiphase flow, and the study of gas-solid two-phase flow contributes to the deepening of multiphase flow research.
The computational fluid dynamics (CFD) coupled with discrete element method (DEM) for simulating gas-solid systems belongs to the Euler Lagrangian framework which can effectively process and analyze structures of particle unit scale, system scale and even meso scale. In this method of CFD-DEM [
7,
8,
9,
10], the continuous fluid described by the Navier-Stokes equation is solved by a CFD solver, while the solid particles considered as discrete phases are solved by a DEM solver. Due to the fact that particles have certain geometric information, such as size and shape, it is necessary to calculate collisions between particles. However, in the gas phase control equation, the solid phase is represented as Lagrangian point particles, which means that particles do not impose any physical boundary conditions at the interface between the gas phase and the solid phase. Therefore, the simulation of this method is considered non analytical simulation. Moreover, although the flow situation of a single particle in an unbounded uniform flow field is already very clear, there is no reliable correlation result for the force problem of a single particle in a non-uniform flow field. And the resistance exerted by particle groups on the fluid in microelements is also the same. Furthermore, the linear elastic model used in the soft sphere model is insufficient to describe the complex contact forces between particles. The collision between particles and the suspension of particles by the fluid are processed using motion decomposition methods, resulting in distorted results.
Fortunately, although we can only estimate the interactions between particles and fluids through approximate models and correlation formulas, we can still simulate the dynamic mechanisms. In fact, accurately tracking the motion trajectory of each particle is currently not only unattainable, but it is not even our focus of interest. Due to the imprecision of the forces acting on a single particle under non-uniform flow conditions and the forces exerted by particle groups on microelements, it is necessary to re-examine the two coupling relationships between fluid and particles in traditional CFD-DEM simulations. For the first coupling relationship, the drag forces acting on particles and fluids are usually coupled at the grid scale through Newton’s third law, which means that the sum of the drag forces acting on all particles in the grid reacts on the fluid in the grid. For the second coupling relationship, the drag forces acting on all particles in the grid are calculated and then averaged by interpolation to react on each particle in the grid. Among these two coupling methods, Yu’s research group tended to insist that the first coupling relationship be able to more reasonably reflect the true bidirectional strong coupling relationship between particles and fluid [
9,
11,
12]. In recent two years, most CFD-DEM simulations [
13,
14,
15,
16,
17,
18,
19] published in the renowned journal, Chem. Eng. Sci.
, have adopted the first coupling relationship. At present, simulations generally uses a fine grid size of about 3 times the particle diameter, which has high spatial resolution and avoids the complexity of grid parameter calculation. The effective computational scale of the interaction between particles and fluids, i.e. the effective neighborhood of the target particle, exceeds the scale of the fine grid. Thus the uneven distribution of particles and fluids leads to serious errors in calculating drag forces through strong coupling at the fine grid scale. Since the strong coupling relationship between fluid and particles within the commonly used fine grid is difficult to be accurately described, a decoupling method should be used to independently calculate the drag force on particles and fluid. This means that the drag force on fluid is calculated in the fine grid while the drag force on particles is calculated in the effective neighborhood.
There is another important reason for using decoupling phase interaction relationship. Note that particles in fluidized bed are often in non-uniform distribution states. New models should be established as much as possible based on the different environments in the flow field to improve the accuracy of the calculation. The so-called “decoupling” mainly refers to the decoupling of the two-phase interaction at the fine grid scale. This way of decoupling calculation is also reflected in the calculation methods of local porosity and grid porosity [
20,
21]. In traditional methods, the main parameters for calculating drag force are local gas velocity and local porosity, which means that the grid parameters are calculated using the so-called area weighted average method to calculate the local parameters at the particle center of mass. Based on the core logic of decoupling, it is believed that there is no necessary correlation between grid porosity and local porosity. The former is the real and determined volume fraction of gas in the grid, while the latter is the gas content at the particle center of mass, which is a virtual, complex, and scale dependent point variable that can reflect the uneven distribution characteristics of particles. Since the local porosity does not depend on the grid porosity but solely on the environment with uneven particle distribution, after determining the effective domain in fine grid simulation, a method that decouples from the grid porosity and completely depends on the surrounding uneven distribution environment should be used to calculate the local porosity.
This article models the gas-solid two-phase flow using two decoupling models which are the particle drag model and the gas source term model. The simulated solid volume fraction, relative pressure and bed layer height are compared with the experimental data. It seems that the decoupling models are no less impressive than the commonly used strong coupling method.
2. Decoupling Models
2.1. Particle Drag Model
The problem that the local porosity model aims to solve is how to calculate the contribute to the local solid volume fraction in a way of circumstance-dependence. In order to describe the decoupling gas-solid interaction, one should first define the neighbor radius
which is the smooth length of the neighboring area. According to the nuclear approximation idea of smooth particle dynamics, for the target particle
, the solid volume fraction contribute [
22] of the surrounding particle
can be calculated as
where
is the particle diameter and
is the quantic normalized kernel function which can be expressed as
Then the local porosity can be calculated as
where
is the introduced multiplier parameter that was not included in Xu et al.’s formula. When the reciprocal of this parameter was introduced earlier [
20], it was precisely debugged to 0.89. Thus the value of
here is 1.12.
Most of the researchers calculate drag on a single particle according to the particle’s drag correlation in the unbounded uniform flow field by use of the correction form of particle drag coefficient. That is to say, instead use of the single particle coefficient, the apparent drag coefficient
of the particle group around particle
is used in the drag formula as
where
be the gas density,
be the local gas velocity and
be the particle velocity.
According to Wen and Yu’ s well-known drag correlation [
23] and the single-particle drag coefficient proposed by Schiller and Naumann’s drag formula of a single particle [
24],
By combining the above formulas (1)–(5), we then construct the so-called particle circumstance-dependent drag model.
2.1. Gas Source Term Model
The momentum exchange source term for gas phase is calculated as
where
is the grid mean gas velocity,
is the mean particle velocity within the grid and
is the interphase momentum transfer coefficient which can be calculated by two equations. When the grid porosity
is lower than 0.8, it is calculated as
When
is not lower than 0.8, it is calculated as
By combining the above formulas (6)–(8), we then construct the present gas source term model.
3. Simulation Method
The Navier-Stokes equations are expressed using the following two equations. The continuity equation is described as
where
is the grid mean porosity. The momentum equation is described as
where
is the pressure and
is the stress tensor. The momentum exchange source term
is calculated according to equation (6).
Due to the fact that the correlation fomula for drag force is mainly based on three-dimensional real experiments, one should transform two dimensions to three dimensions. The widely-used equation [
8] is adopted as
As the Navier-Stokes equations are complex differential ones, there is currently no analytical solution available. Therefore, the CFD method should be used to solve them. After setting the boundary conditions of the consistent velocity inlet, the pressure outlet, and the impenetrable wall, the Navier-Stokes equations can be discretized using the well-known finite volume method. Further, the obtained algebraic equations can be solved by the SIMPLER method [
25].
The particle motion must first consider transitional motion, which can be described as
where
is the contact force,
is particle volume and
is the local pressure.
The particle rotation motion should also be considered which is descried as
where
is the particle angular velocity,
is the inertia of the particle and
is the torque of the collision.
The simulated bed geometry corresponds to the experimental set-up [
26], 500 mm high and 90 mm wide. The fixed parameters used in the simulations are given in
Table 1.
4. Results and Discussion
4.1. Bubble Morphology and Complex Motion
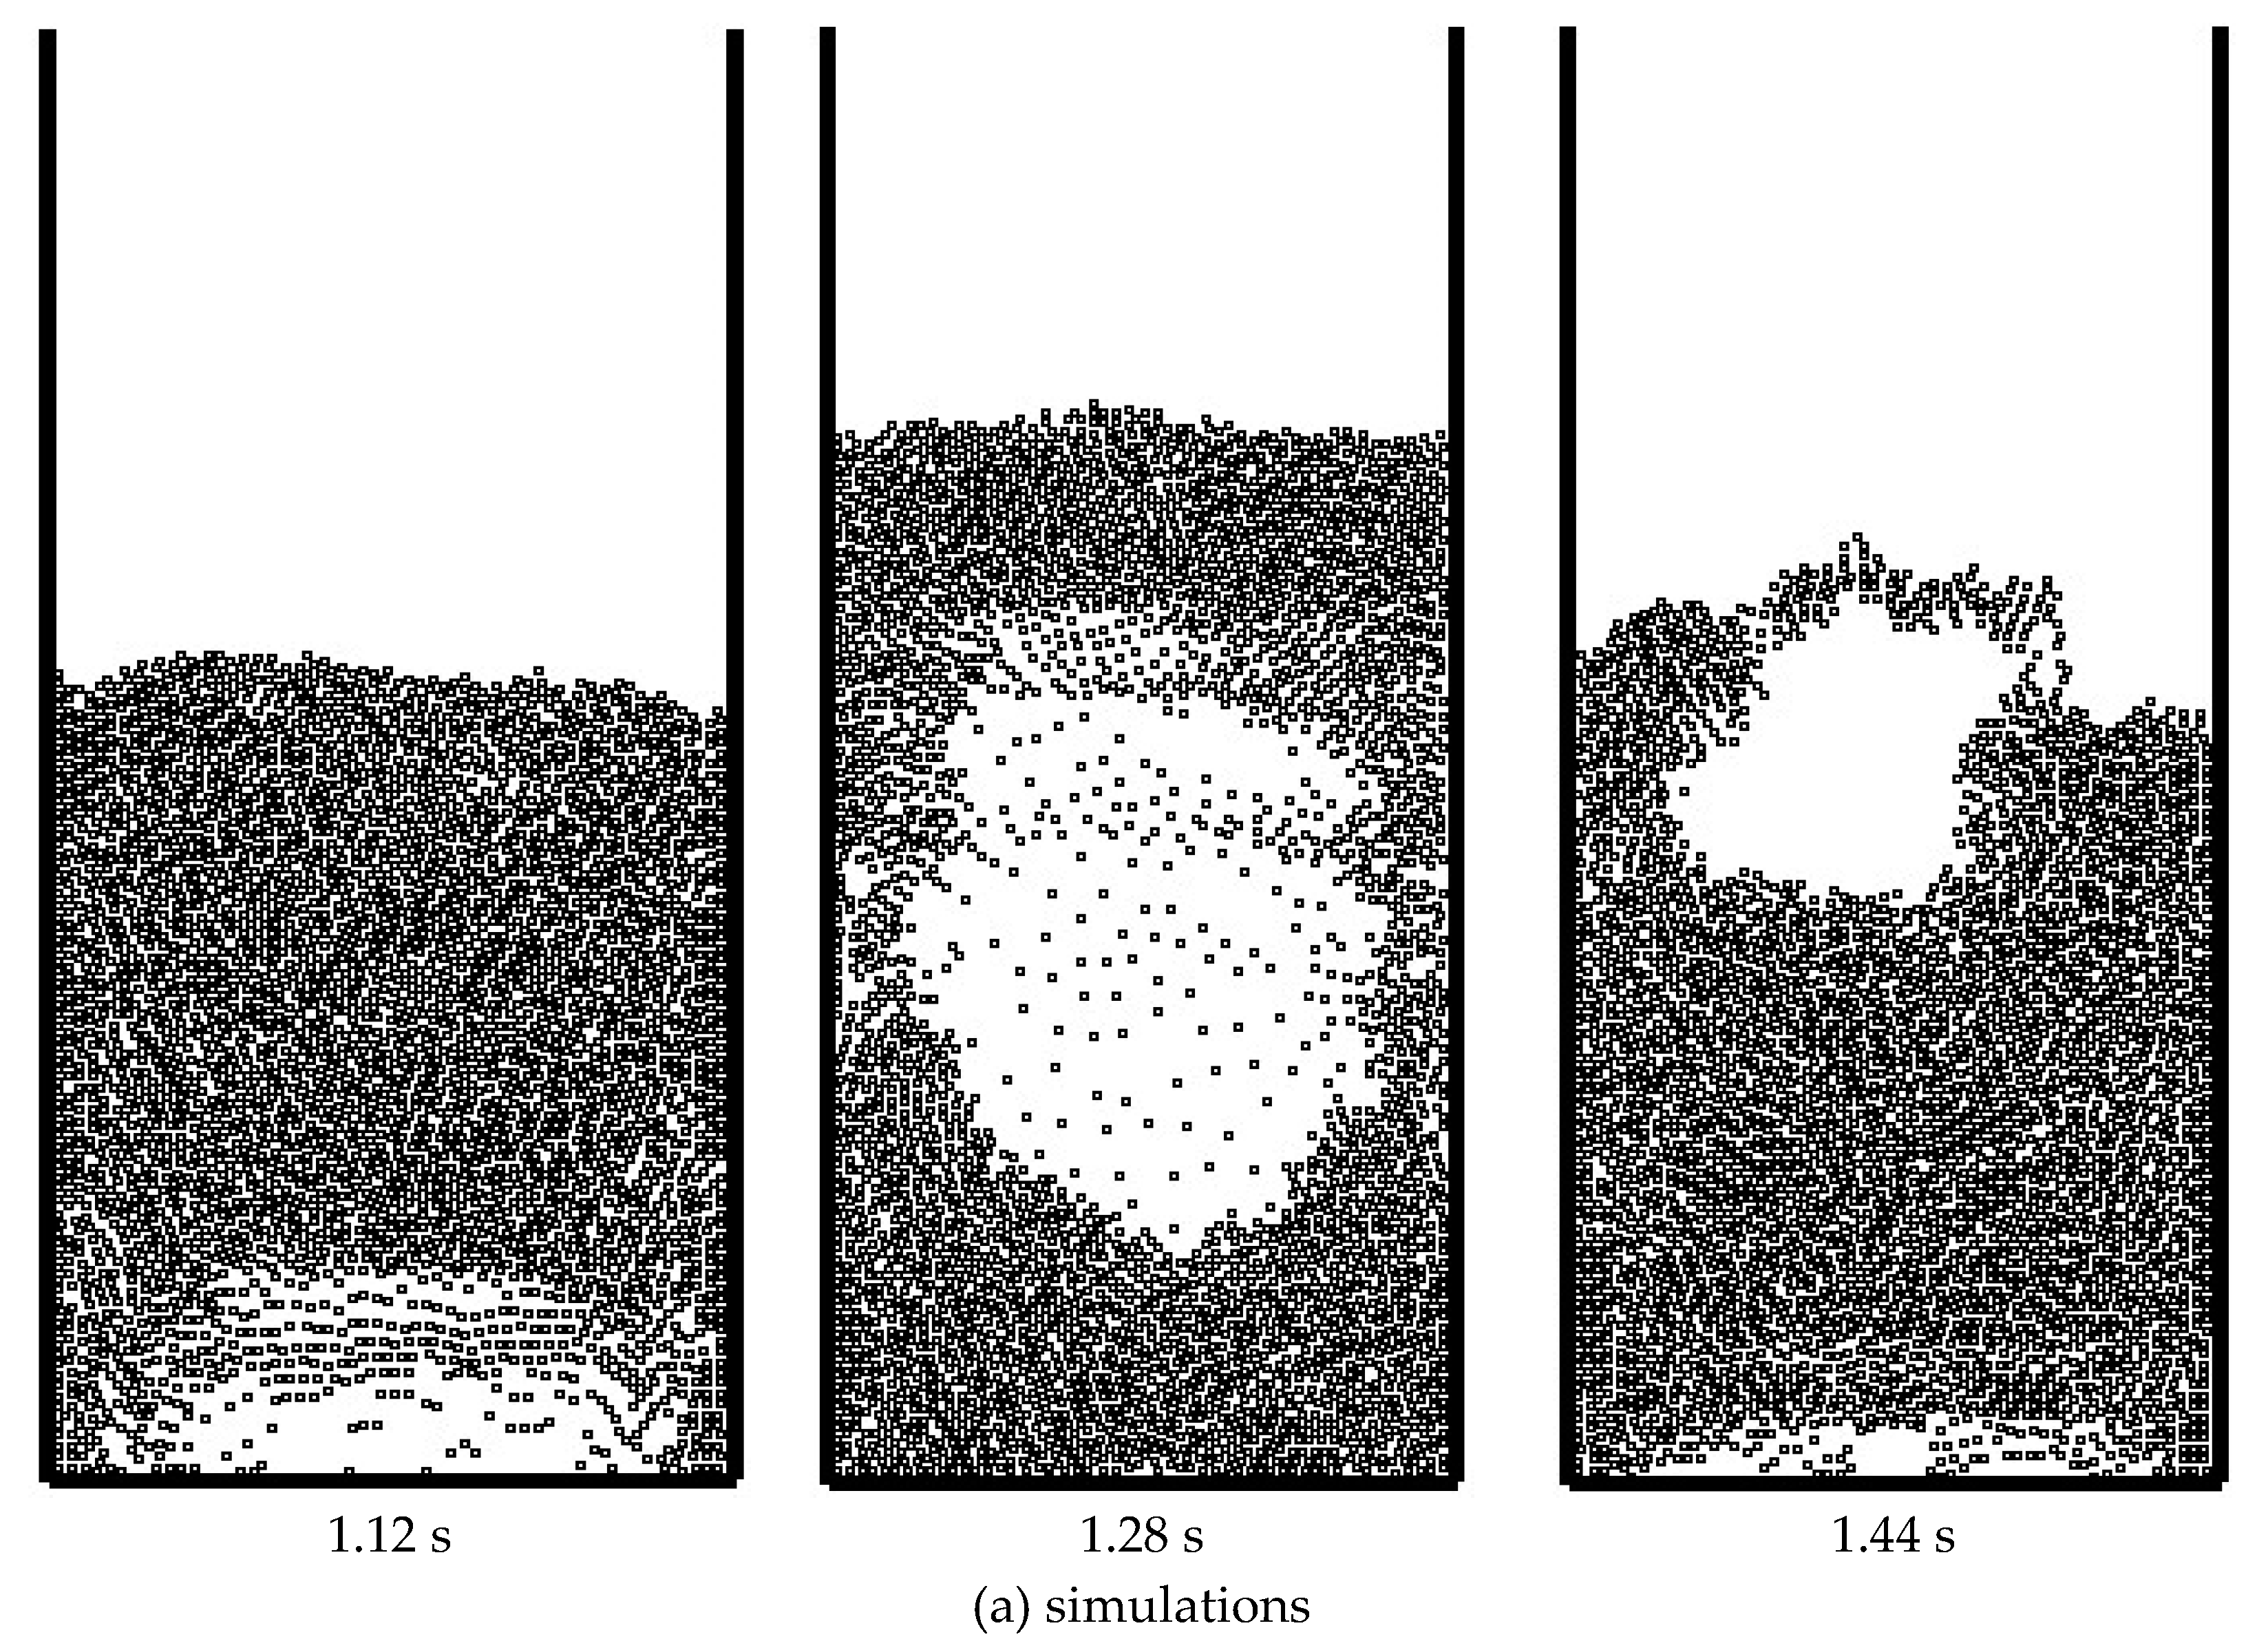
Figure 1 shows the snapshots of particle distribution and bubble motion obtained from numerical simulation and experimental observations [
26]. As can be seen from the figure, both in the simulations and experiments, Bubbles first form at the bottom of the bed and gradually grow as they rise. As the bubbles emerge from the bed, they eventually rupture and disappear. The process of bubbles emerging from the bed is considered difficult to simulate, and the current simulation of this complex process is very close to experimental observations. Moreover, the shape, size, and motion period of the large bubbles are also in good agreement with experimental observations. Therefore, the decoupling interaction model used in the present simulations has the ability to capture the complex motion process of bubbles.
4.2. Solid Volume Fraction
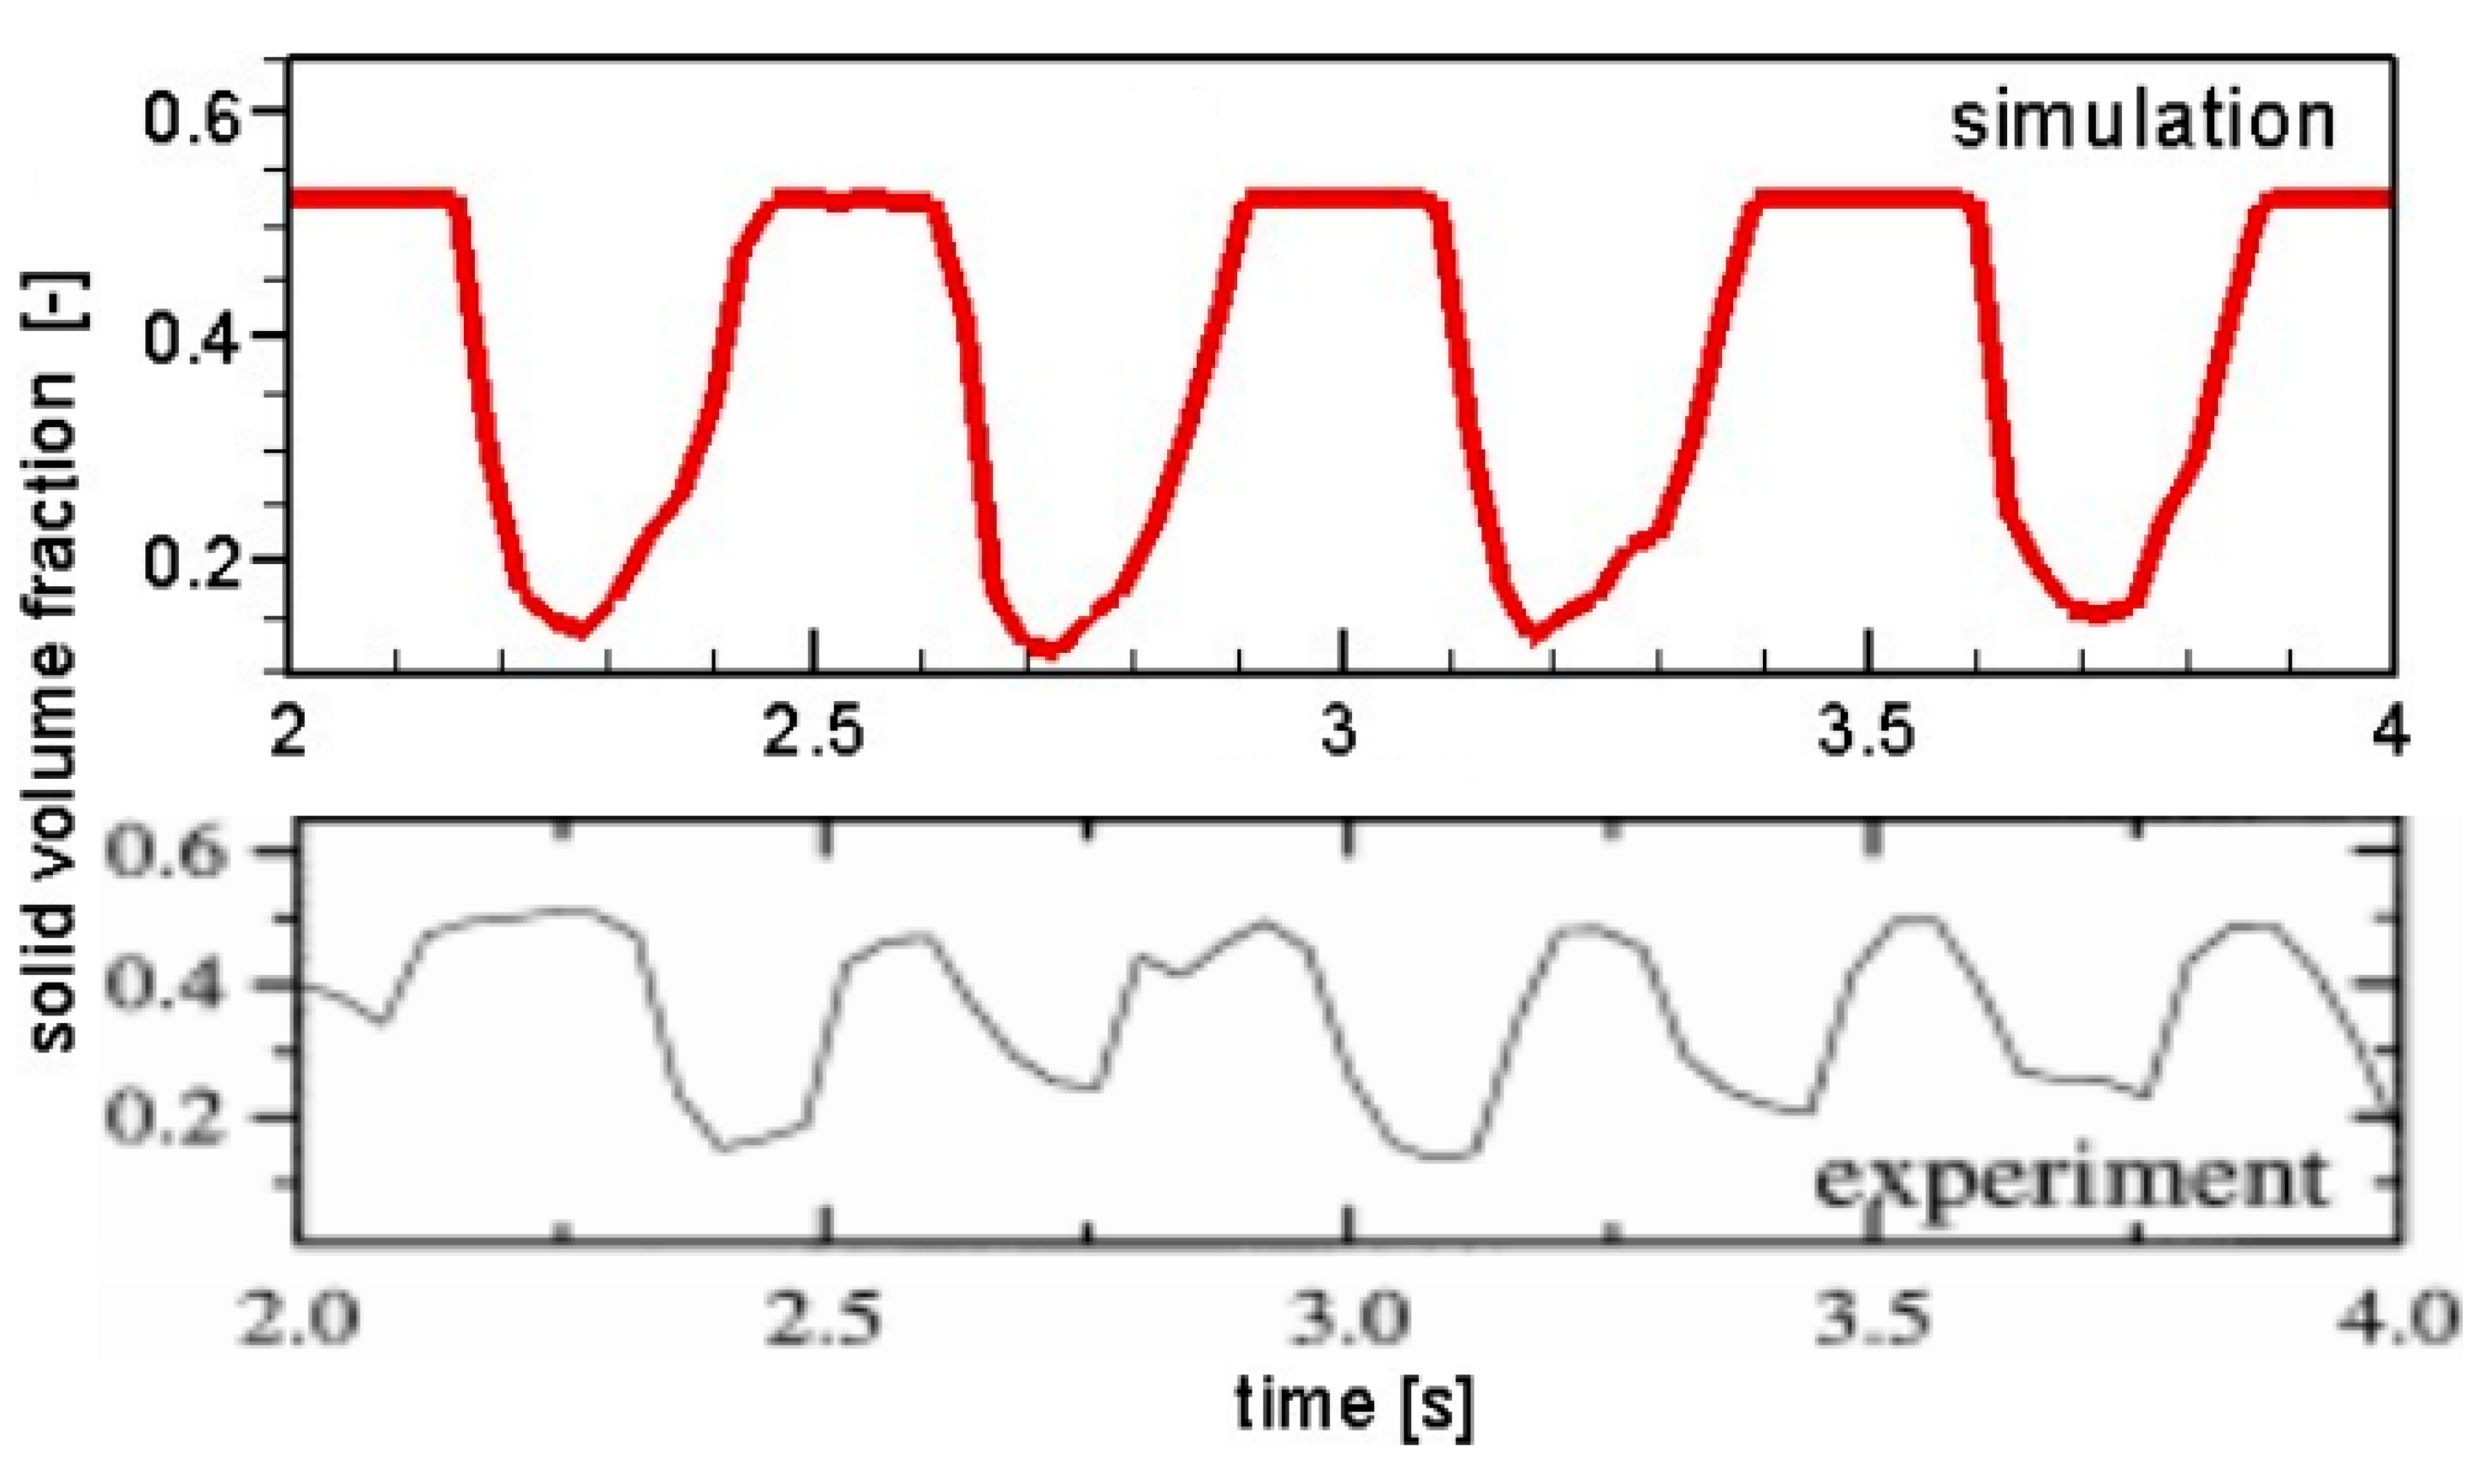
Figure 2 shows the snapshots of the average solid volume fraction at a horizontal section 45 mm above the fluidized bed distributor. The current simulated highest point of solid volume fraction can reach a maximum value of 0.525, corresponding to a minimum porosity of 0.475. The experimentally measured highest point of solid volume fraction can reach a maximum value of just over 0.5. The current simulated lowest point of solid phase volume fraction can reach a maximum value slightly less than 0.125, while the experimentally measured lowest point of solid phase volume fraction can reach a maximum value of about 0.15. The simulated solid volume fraction fluctuated for more than 4 cycles within 2 seconds, while the experimentally measured solid volume fraction completed slightly over 5.5 cycles within 2 seconds. The reason for the above inconsistency may be related to the calculation method of grid porosity. In simulation, the local area often reaches the minimum porosity, and it can last for a period of time after reaching the minimum porosity. However, in experiments, it is difficult for the local area to reach the minimum porosity, and even if it approaches the minimum porosity, it will quickly rebound. Overall, the deviation between the numerical simulation results and the experimental measurement results is generally acceptable.
4.3. Relative Pressure
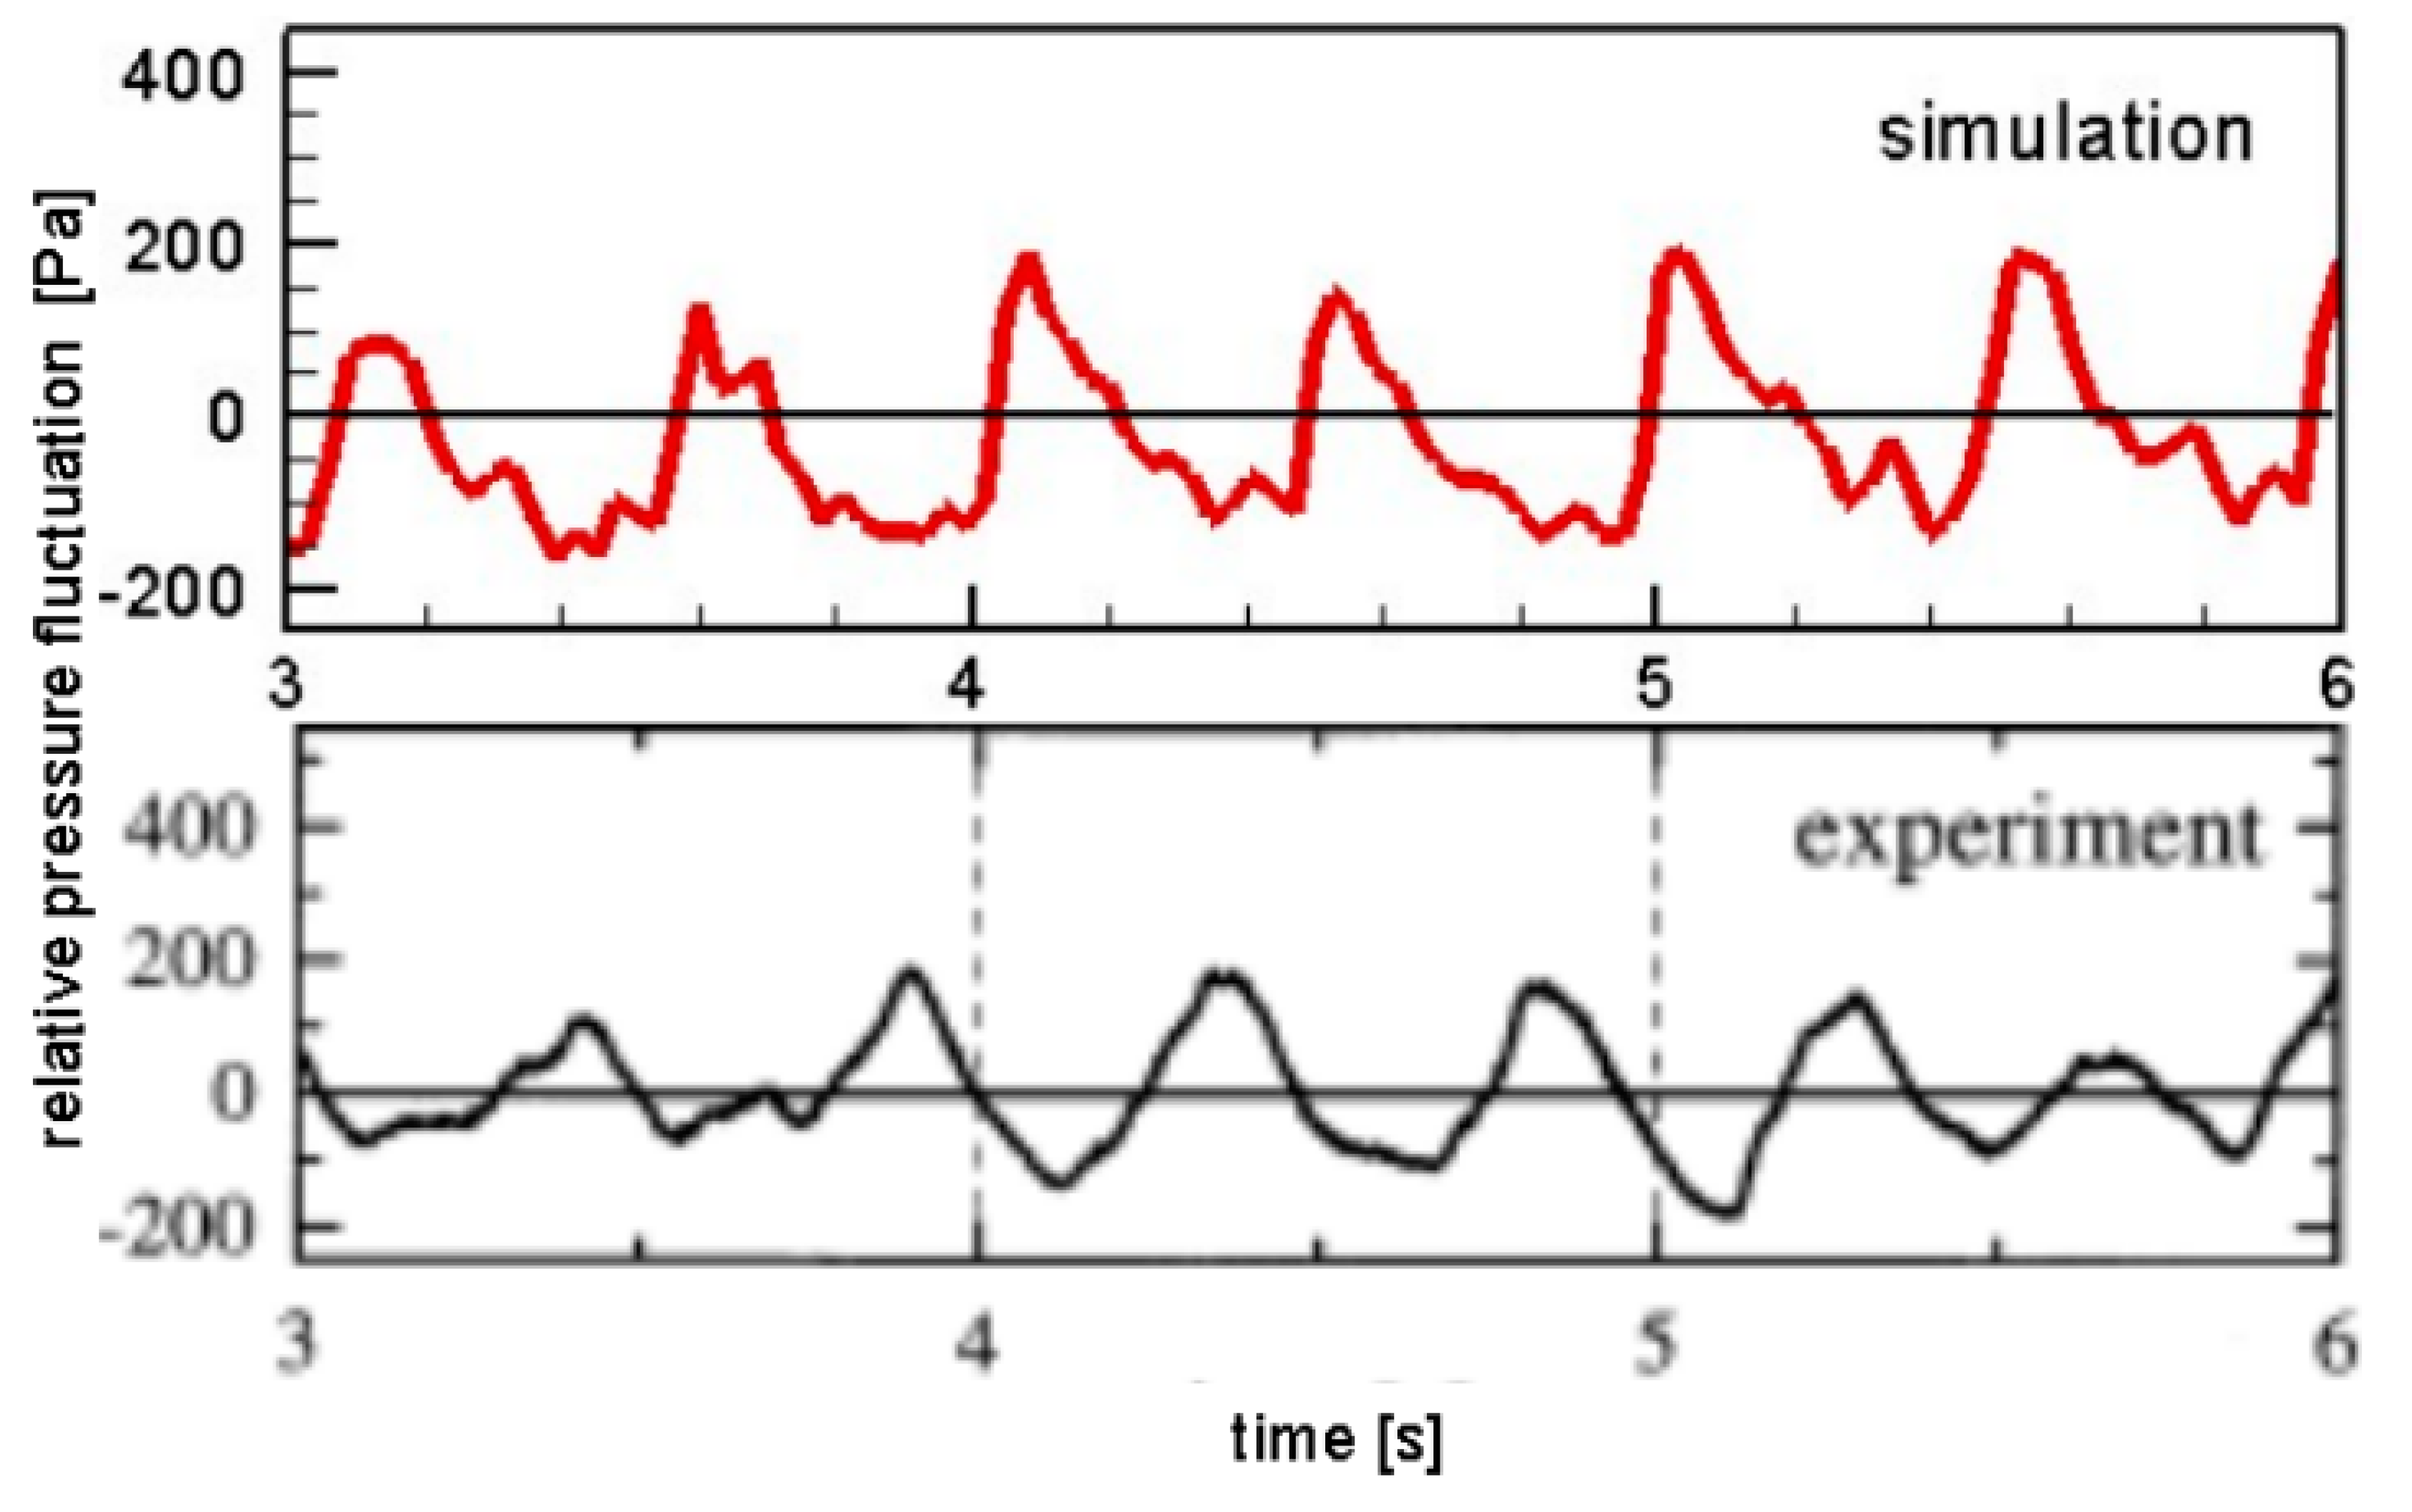
Figure 3 shows the snapshots of the relative pressure fluctuations at a horizontal section 45 mm above the fluidized bed distributor. The amplitude of the simulated relative pressure fluctuation is very close to the experimental data, and the pressure waveform is also very similar. At the trough, there are low-frequency small amplitude fluctuations observed in both simulation and experiment, with only more small amplitude fluctuations observed in the simulation. In numerical simulation, the pressure fluctuation completed approximately 6.5 cycles within a three second time interval, while in experimental observations, the pressure fluctuation completed approximately 7 cycles. This indicates that the current simulated pressure fluctuation period is very close to the experimental data. It also indicates that the CFD-DEM model based on decoupling phase interactions has the ability to capture pressure fluctuation signals.
4.4. Bed Height
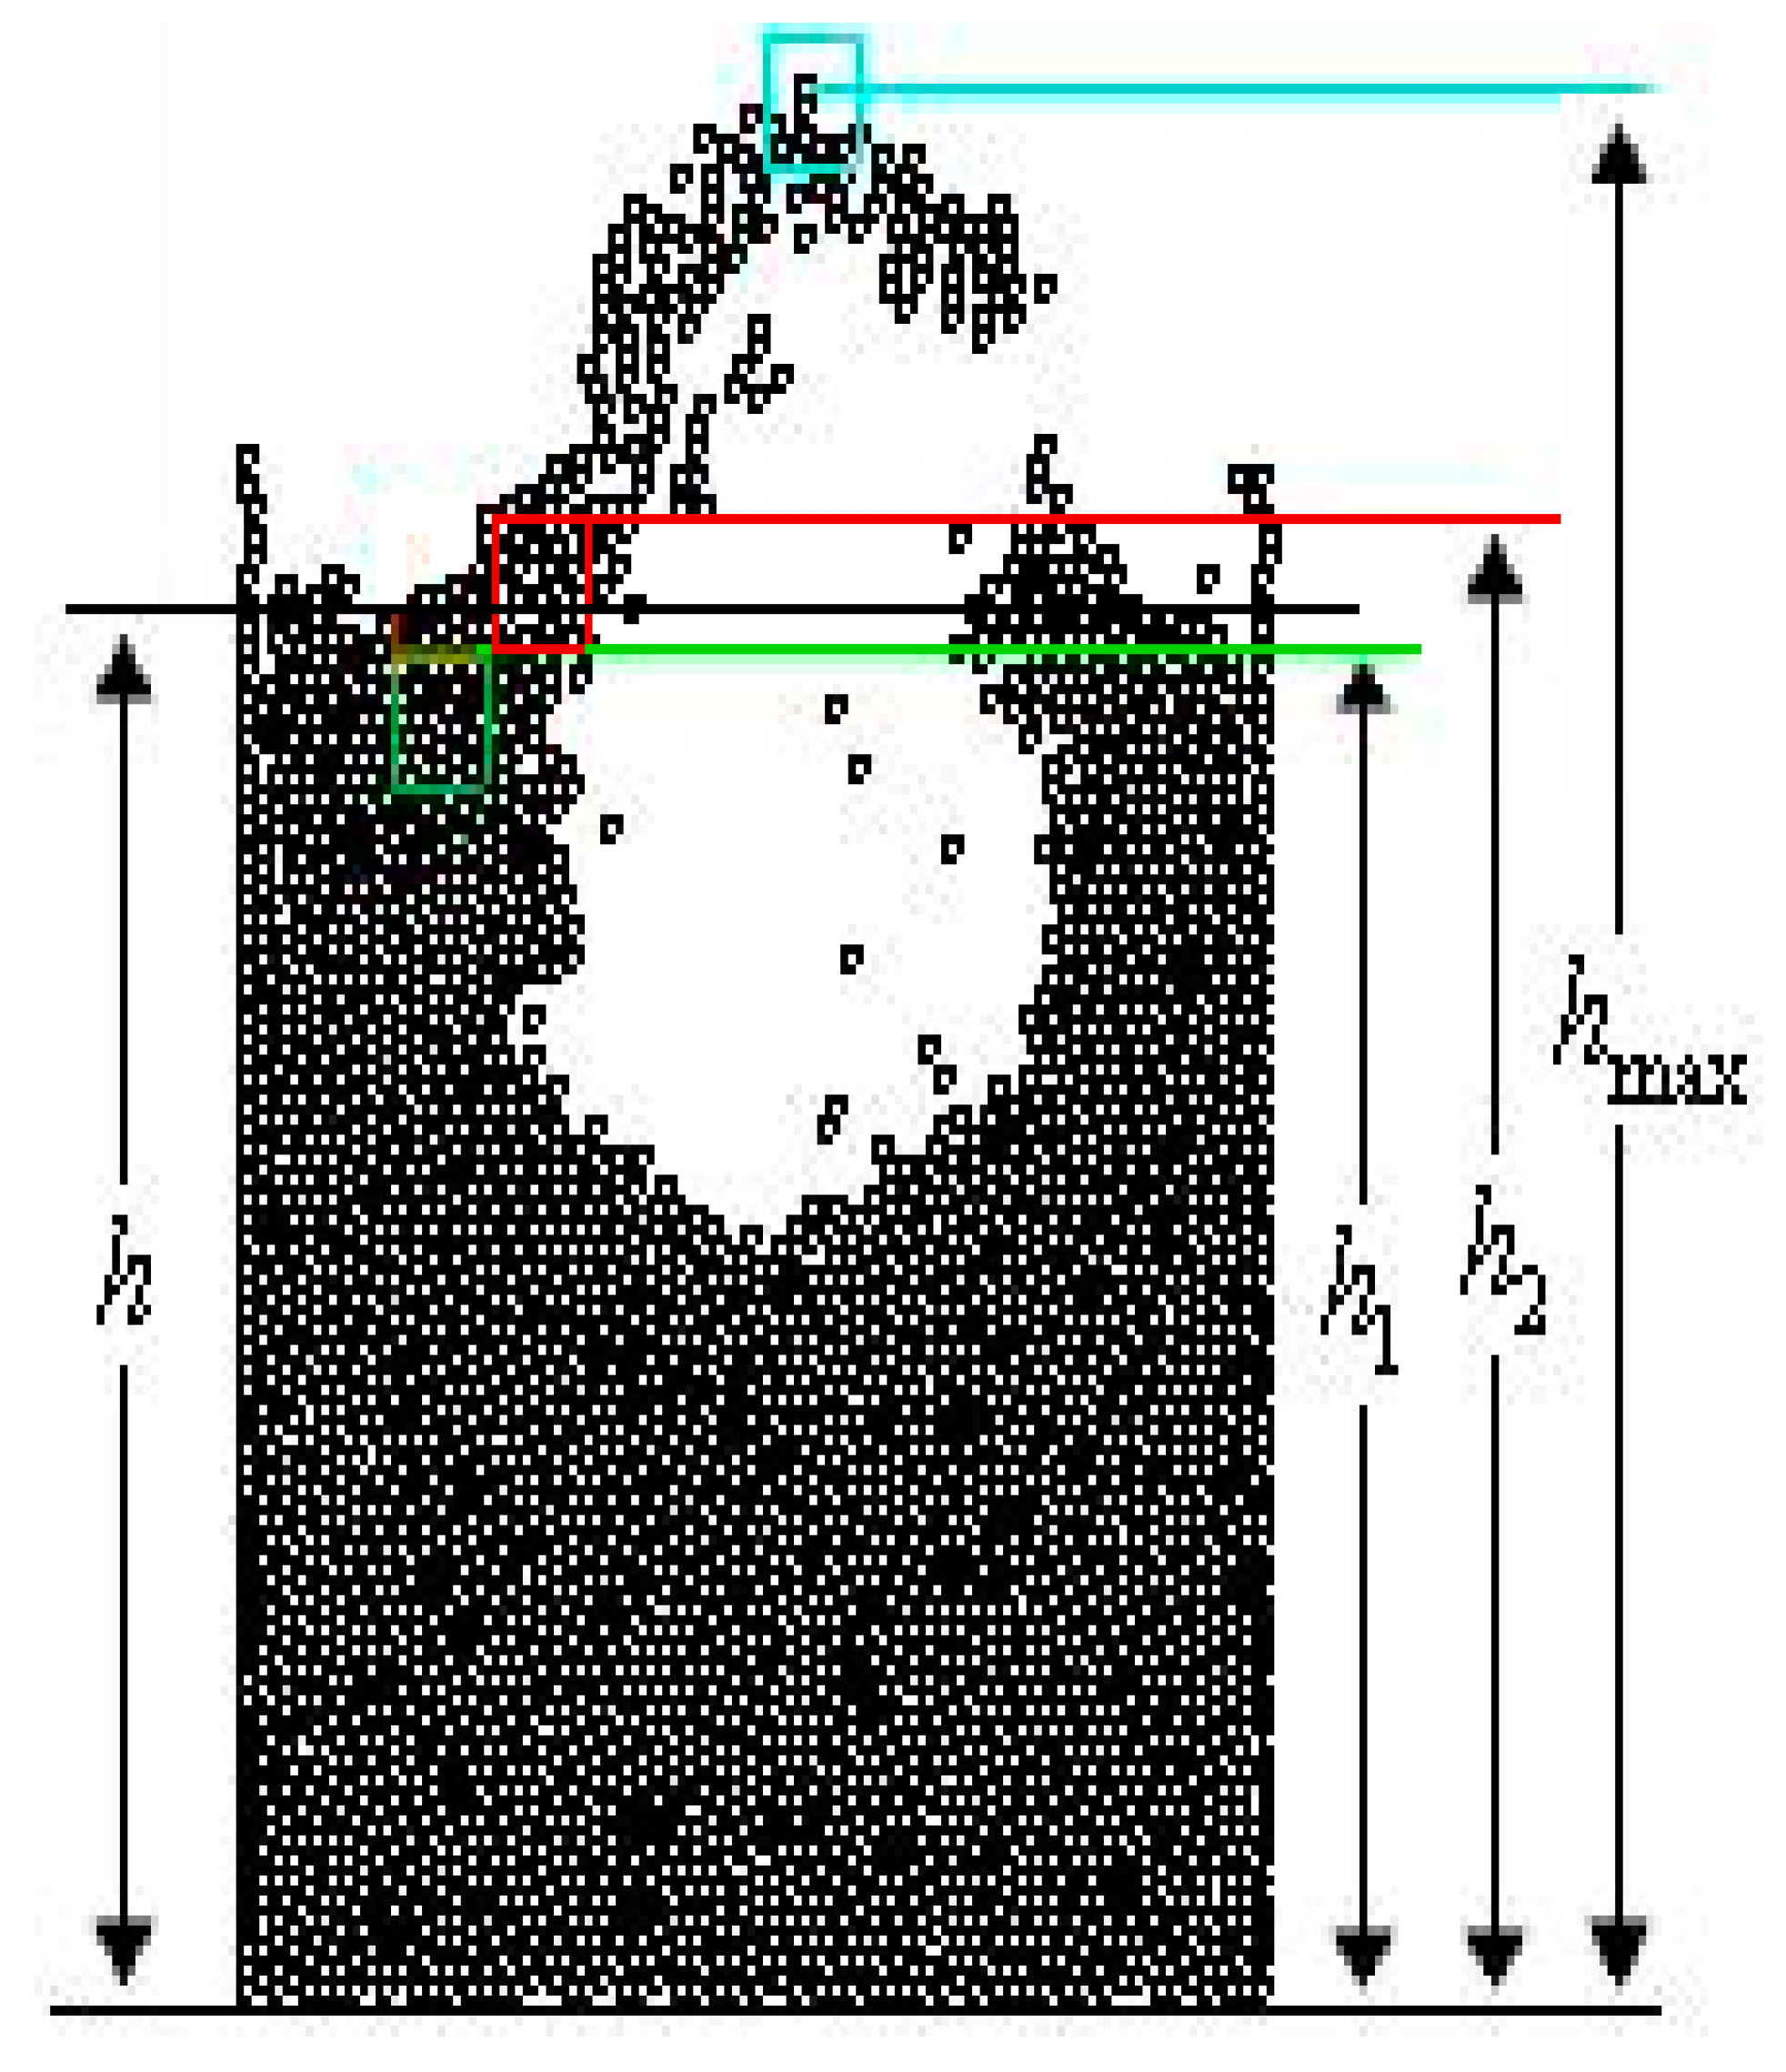
Figure 4 shows a schematic diagram for determining the bed height. The bed height expression was not explicitly given in the study by Wachem et al. [100]. It is not possible to obtain a universal, effective, and reliable expression. As shown in
Figure 4, if the bed height is defined as the maximum particle height h
max, it will cause large deviation. If the bed height is defined according to the grid side, for example h
1,and h
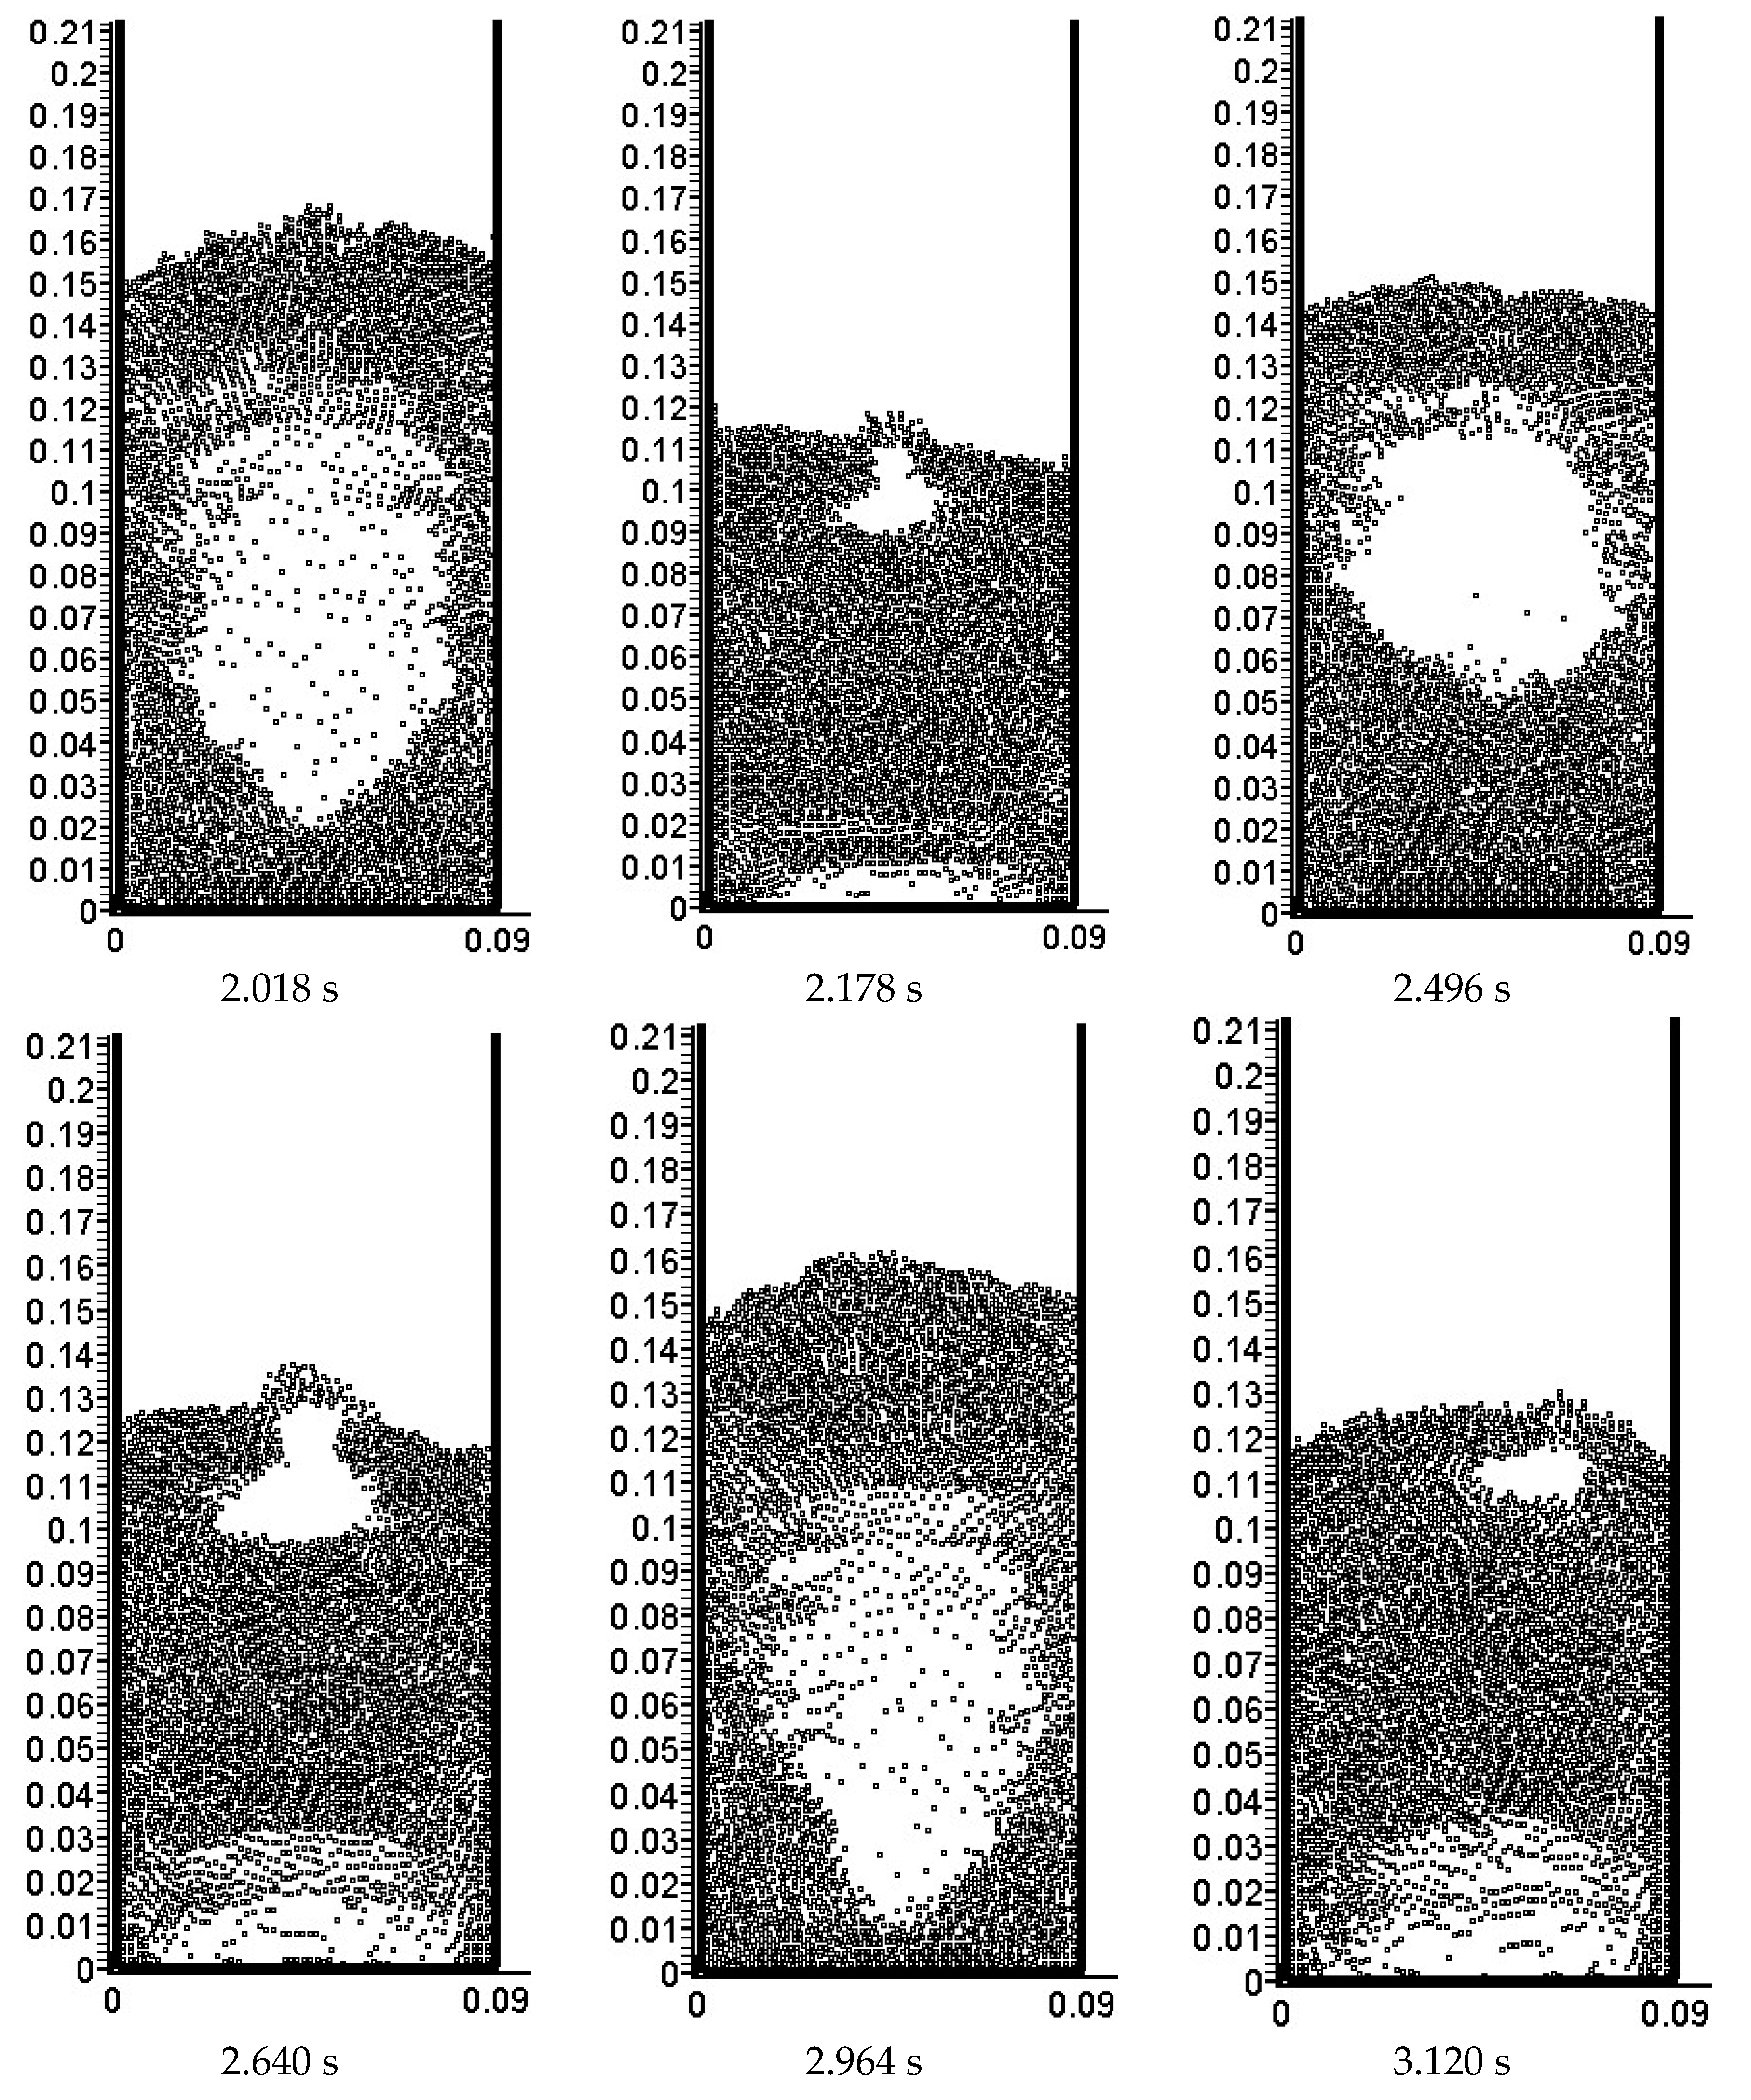
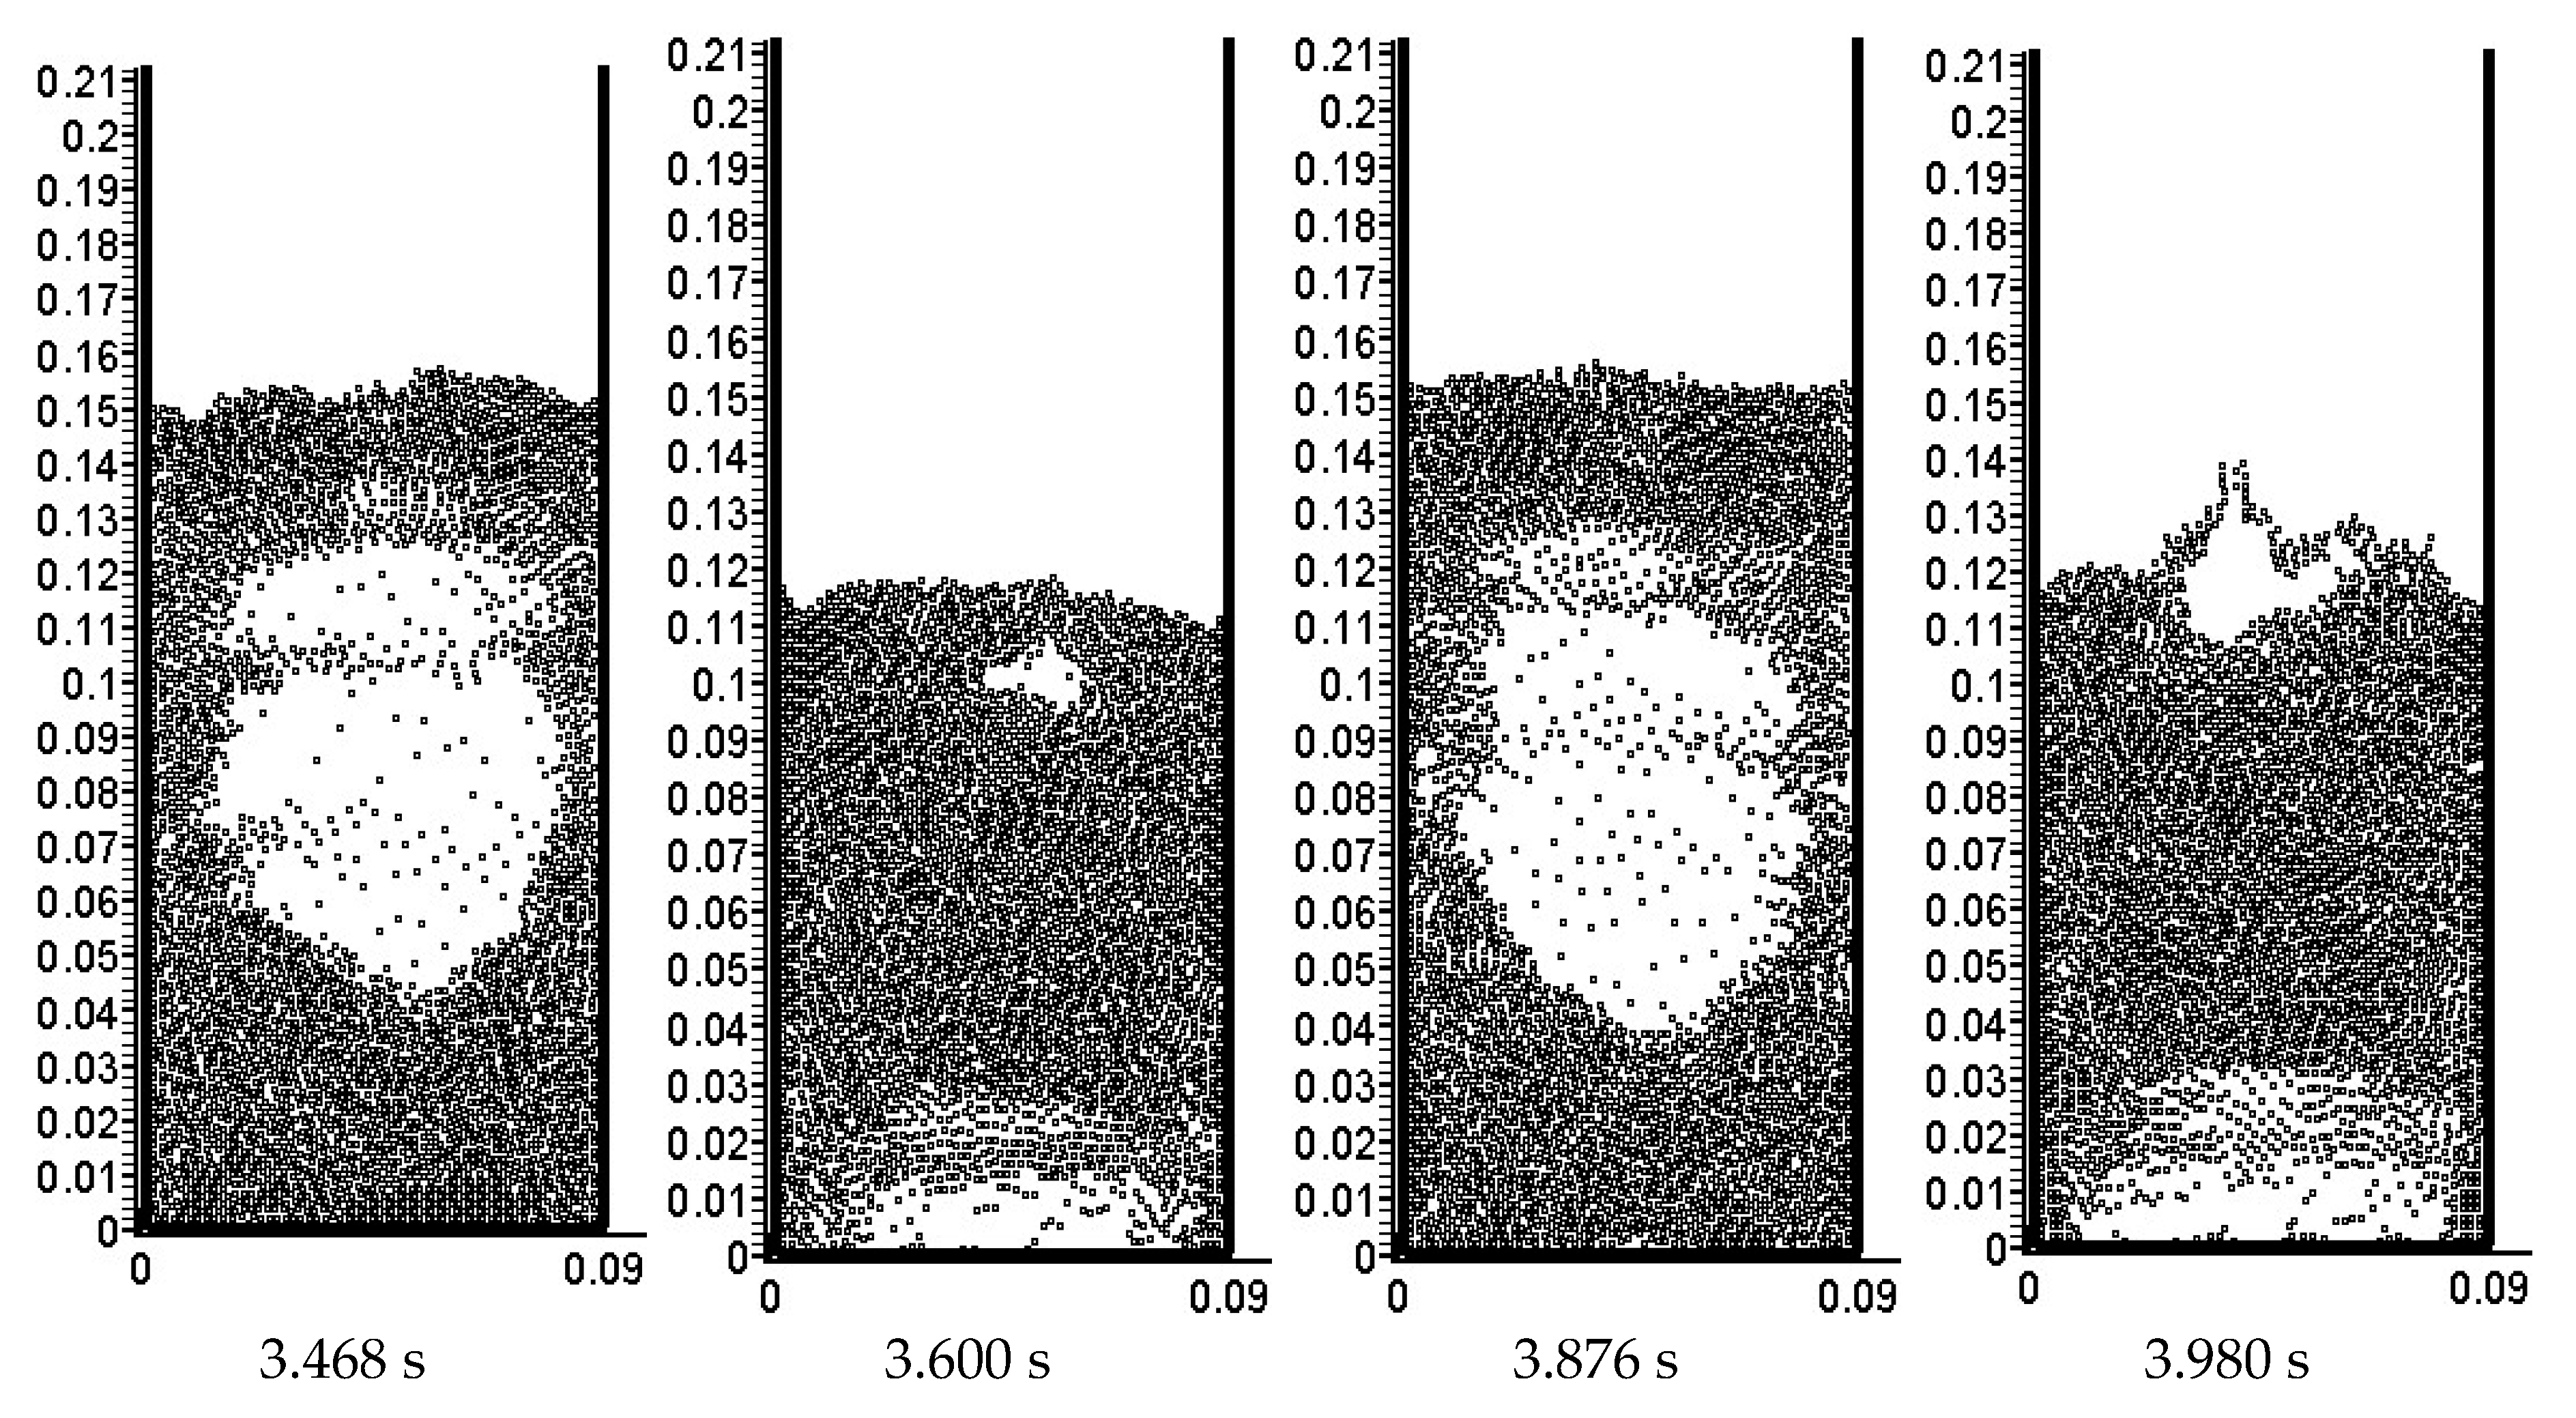
2, the former is a little lower while the latter is a little higher. Here we use a relative reliable method of visual inspection. When the bed height is determined to be h, it is more in line with the physical meaning of bed height. From the simulation animation, the instantaneous bed height determined by the visual inspection method has a gradual process, unlike the parameter correlation method, which may cause non-physical jumping problems. The cost of using visual inspection is that continuous fluctuation results cannot be obtained. This problem can obviously be solved by tirelessly and frequently visually measuring the bed height during short periods of time. If we only focus on the amplitude and period of bed fluctuations, we only need to visually observe the bed height at the peaks and valleys of the waves.
Figure 5 shows the simulated snapshots of the particle distributions at the peak and valley times of the bed height. The minimum scale on the vertical axis can be adjusted to be smaller, and then zooming in on the graph can provide more accurate readings. According to the visual method illustrated in
Figure 4, determine the discrete values corresponding to the bed height at each peak and valley moment. Then, using the method of piecewise linear interpolation, the approximate waveform of the bed expansion can be obtained.
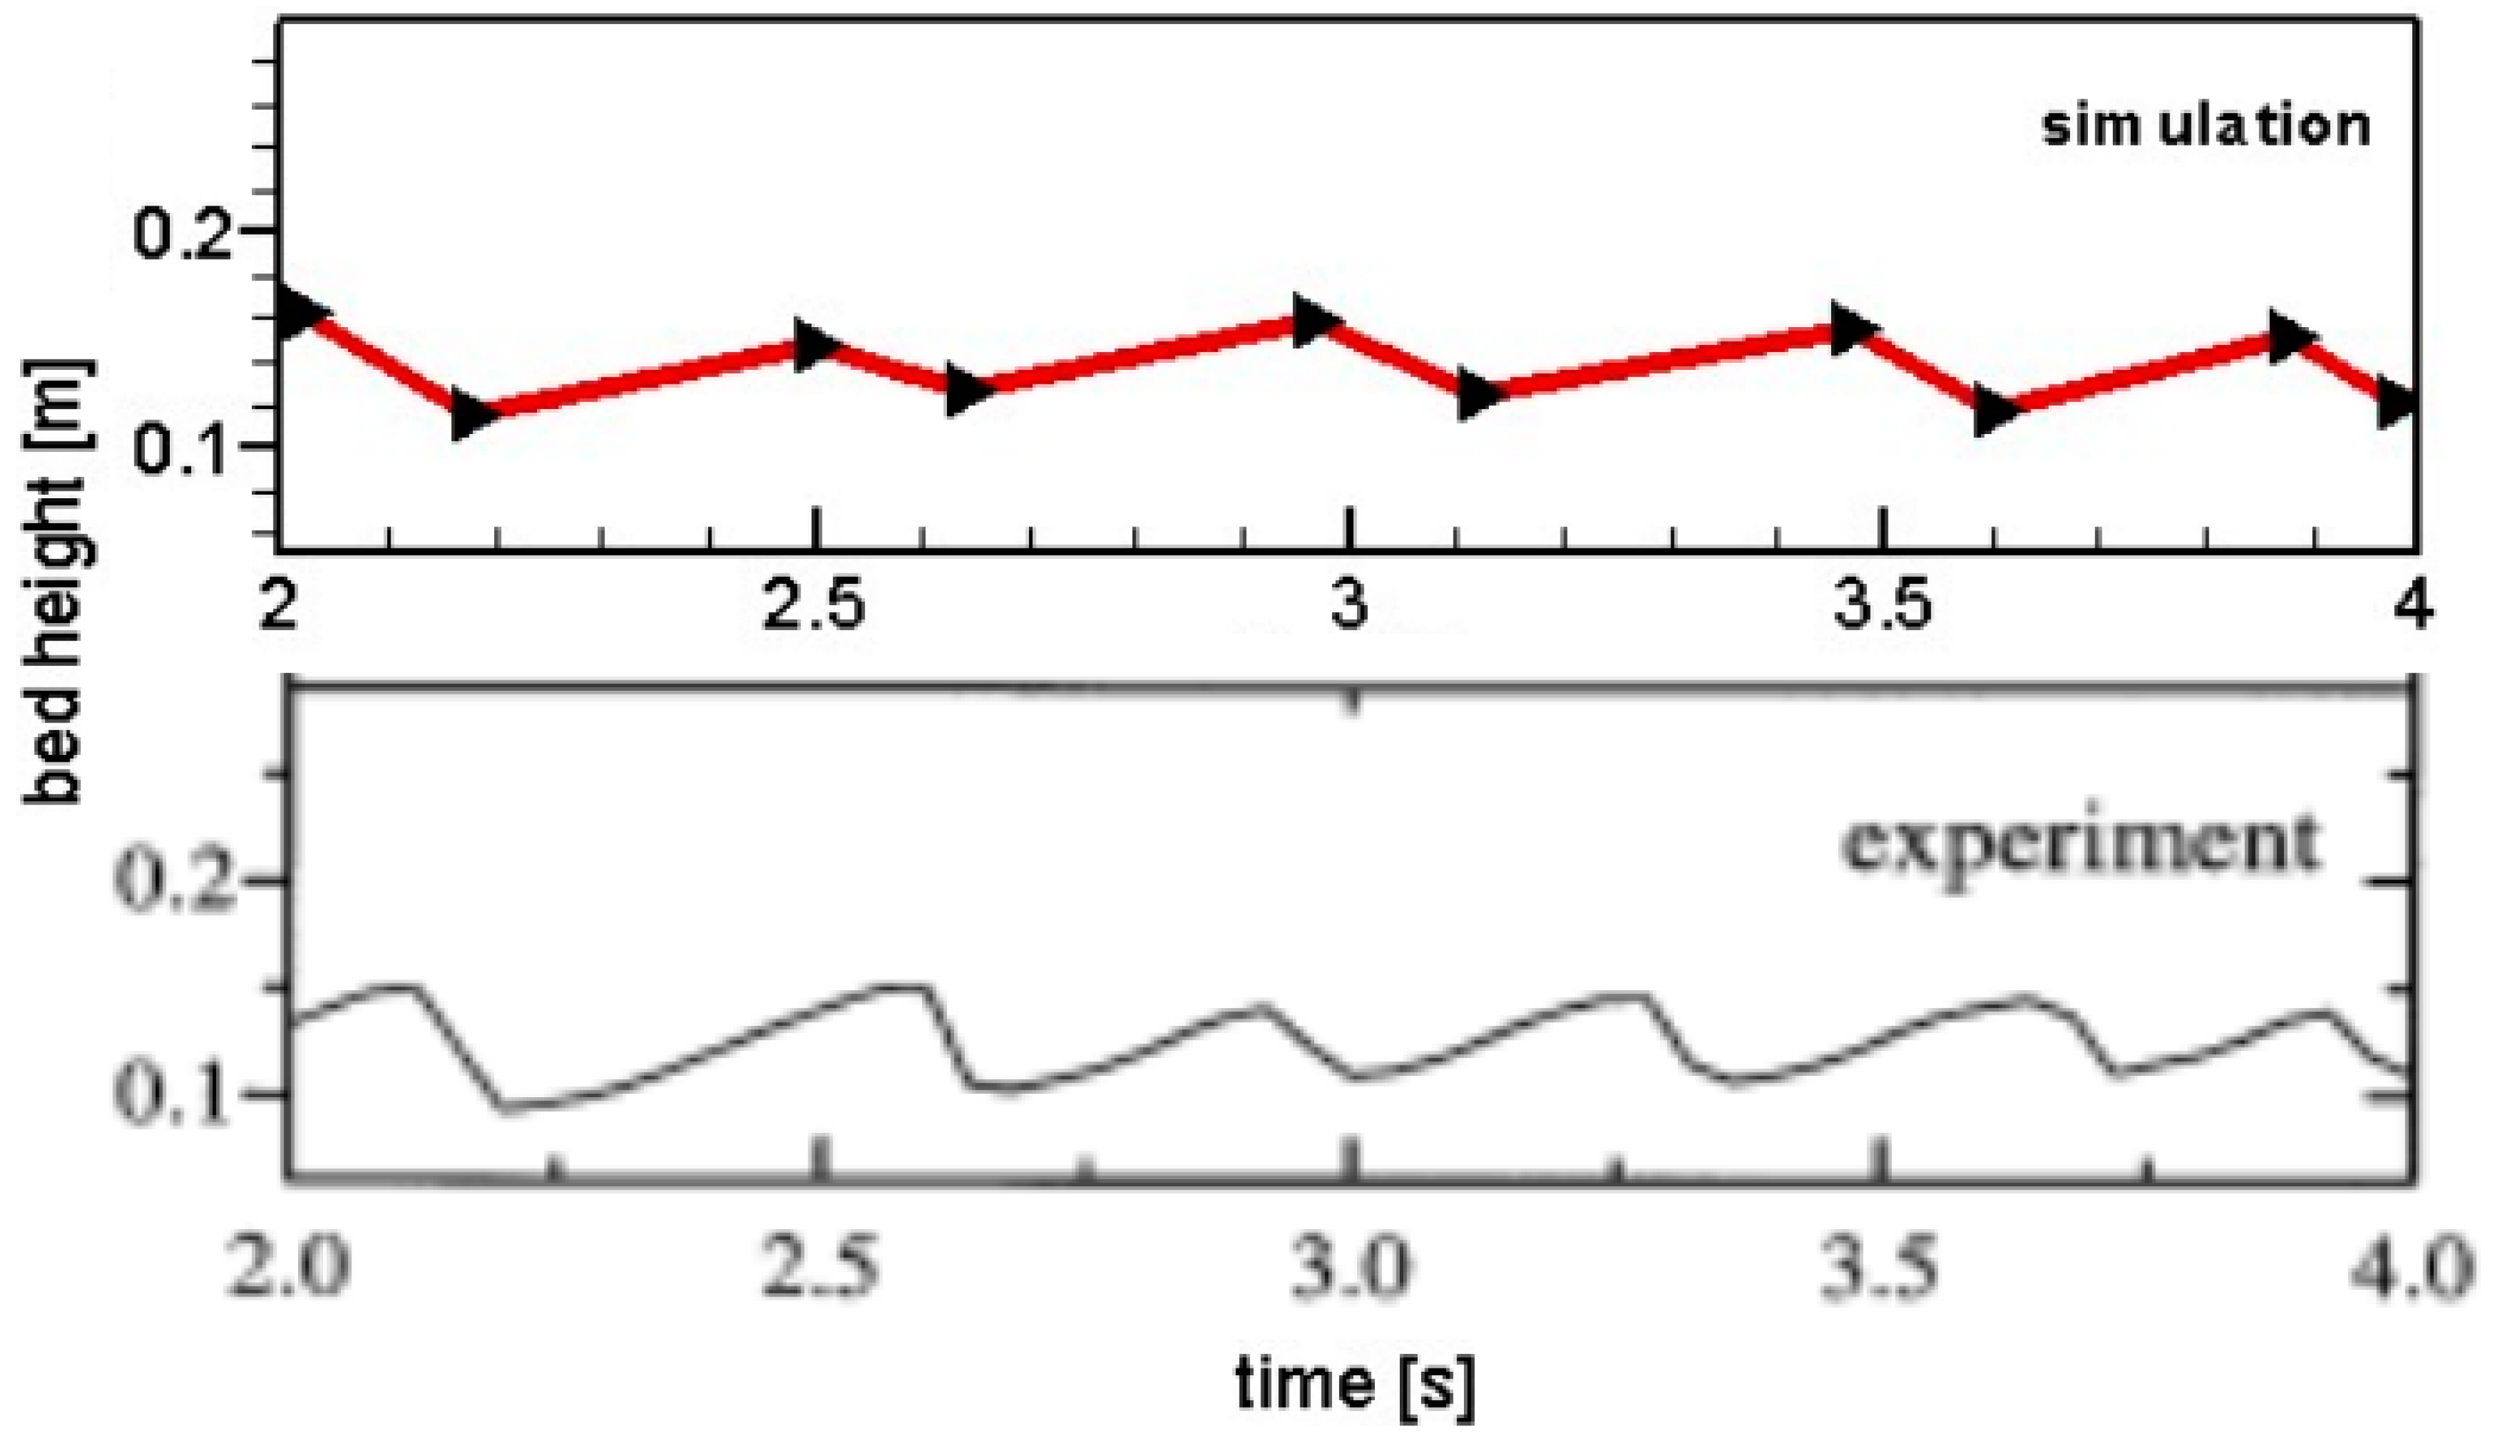
Figure 6 shows the fluctuation of bed height measured by simulation and experiment. The figure shows that the simulated maximum bed height is slightly higher than 0.16 meters, while the experimentally observed maximum bed height is slightly lower than 0.16 meters. The simulated minimum bed height is slightly higher than 0.1 meters, while the observed minimum bed height in the experiment is slightly lower than 0.1 meters. The amplitude of simulated bed expansion is quite satisfactory. The figure also shows that the simulation results showed that the bed layer fluctuated approximately 4.5 cycles within a period of 2 to 4 seconds, while the experimental observations showed that the bed layer fluctuated approximately 5.5 cycles within the same period. This deviation is also acceptable. Overall, the CFD-DEM based on the decoupled phase interaction model currently used in the simulation can effectively simulate the bed expansion process. As for the small deviations in amplitude and period that occur, it is related to the number of particles used in the simulation. The number of particles used in this article is determined based on the solid phase volume fraction when the particles are in a stacked state in the experiment, but this standard is not unique. For example, it can be determined based on the bed height when the particles are in a stacked state in the experiment, which will result in the use of relatively fewer particles.
5. Conclusions
This paper presents gas-solid fluidized simulations by use of CFD-DEM. The two-phase interaction is calculated in a way of decoupling. The simulated form, size and motion process of the big bubble are all consistent with experimental observations. The simulated solid volume fraction and relative pressure averaged in a horizontal plane at 45 mm above the bottom are in reasonable agreement with the experimental data. The fluctuation of the simulated bed height over time is similar to the experimental measurement results. The reproduction of these qualitative and quantitative results indicates that the proposed method effectively improves simulation performance and accuracy.
From the calculation method of phase interaction, the coupling calculation method is obviously superior to the decoupling calculation method. However, under the premise of imprecise correlation formulas, deliberately pursuing coupling calculation methods can lead to significant simulation distortion. On the other hand, decoupling calculation methods do not violate Newton's third law of phase interaction principle. Although the interaction between gas and solid phases may not be strictly coupled at the grid scale, this interaction principle should be followed in a larger neighborhood range, which must be gradually verified in subsequent research.
Author Contributions
Conceptualization, Y.L.; methodology, Y.L.; software, G.W.; validation, Y.L. and H.W.; formal analysis, Y.L. and H.W; investigation, G.W. and Y.L.; resources, G.W.; data curation, Y.L.; writing—original draft preparation, G.W.; writing—review and editing, G.W.; visualization, G.W.; supervision, Y.L. and H.W; and project administration, Y.L. All authors have read and agreed to the published version of the manuscript.
Funding
This research received fundings supported by the Science and Technology Plan Project of Qinghai Province-Applied Basic Research Plan (2023-ZJ-736), the National Natural Science Foundation of China (12161058), the Natural Science Foundation of Chongqing (CSTB2022NSCQ-MSX0974), the Key Projects of Guangdong University of Science and Technology (GKY-2023KYZDK-7) and the Doctoral research Foundation of Guangdong University of Science and Technology (GKY-2023BSQD-17).
Data Availability Statement
The date underlying this article will be shared on reasonable request to the first author.
Conflicts of Interest
The authors declare no conflicts of interest.
Nomenclature
| C |
drag coefficient |
| d |
particle diameter, m |
| F |
force on particle, N |
| f |
solid volume fraction |
| g |
gravity acceleration, m·s−2
|
| h |
bed height, m |
| I |
inertia moment of particle as spherical, kg·m2
|
| i, j, k |
particle or grid index |
| l |
smooth length, m |
| N |
number of particles |
| p |
pressure, Pa |
| r |
characteristic radius, m |
|
Sp
|
momentum exchange source term |
| T |
torque, N·m |
| t |
time, s |
|
u0
|
inlet gas velocity, m·s−1
|
| u |
gas velocity, m·s−1
|
| ut |
particle terminal speed |
| V |
volume, m3
|
| v |
particle velocity, m·s−1
|
|
interphase momentum transfer coefficient |
|
porosity |
|
Multiplier parameter |
|
viscosity, N·s·m−2
|
|
density, kg·m−3
|
|
viscocous stress tensor, Pa |
|
particle angular velocity, s−1
|
| subscript |
|
| 2D |
two dimension |
| 3D |
three dimension |
| c |
contact |
| d |
drag |
| g |
gas |
| i, j, k |
particle or grid index |
| mf |
minimal fluidized state |
| p |
particle |
References
- Li, J.; Ouyang, J.; Gao, S.; Ge, W.; Yang, N.; Song, W. Multi-Scale Simulation of Particle-Fluid Complex Systems; Sience Press: Beijing, China, 2005. [Google Scholar]
- Jin, Y.; Zhu, J.X.; Wang, Z.W.; Yu, Z.Q. Fluidization Engineering Principles; Tsinghua University Press: Beijing, China, 2001. [Google Scholar]
- Hanchate, N.; Ramani, S.; Mathpati, C.; Dalvi, V.H. Biomass gasification using dual fluidized bed gasification systems: A review. J. Clean. Prod. 2020, 280, 123148. [Google Scholar] [CrossRef]
- Zhou, L.; Zhang, L.; Shi, W.; Agarwal, R.; Li, W. Transient Computational Fluid Dynamics/Discrete Element Method Simulation of Gas–Solid Flow in a Spouted Bed and Its Validation by High-Speed Imaging Experiment. J. Energy Resour. Technol. 2017, 140, 012206. [Google Scholar] [CrossRef]
- He, J.; Chen, H.; Zhu, L.; Tan, M.; Liu, B.; Chen, L.; Zhang, M. Decarbonization and upgrading of fine-sized coal-series kaolinite via the enhancement of density stability and uniformity of dense-phase gas-solid fluidized bed. Powder Technol. 2021, 394, 62–72. [Google Scholar] [CrossRef]
- Fu, Z.; Zhu, J.; Barghi, S.; Zhao, Y.; Luo, Z.; Duan, C. Mixing and segregation behavior in an air dense medium fluidized bed with binary mixtures for dry coal beneficiation. Powder Technol. 2020, 371, 161–169. [Google Scholar] [CrossRef]
- Tsuji, Y.; Kawaguchi, T.; Tanaka, T. Discrete particle simulation of two-dimensional fluidized bed. Powder Technol. 1993, 77, 79–87. [Google Scholar] [CrossRef]
- Hoomans, B.; Kuipers, J.; Briels, W.; van Swaaij, W. Discrete particle simulation of bubble and slug formation in a two-dimensional gas-fluidised bed: A hard-sphere approach. Chem. Eng. Sci. 1996, 51, 99–118. [Google Scholar] [CrossRef]
- Xu, B.H.; Yu, A.B. Numerical simulation of the gas-solid flow in a fluidized bed by combing discrete particle method with computational fluid dynamics. Chem. Eng. Sci. 1997, 52, 2785–2809. [Google Scholar] [CrossRef]
- Ouyang, J.; Li, J. Particle-motion-resolved discrete model for simulating gas–solid fluidization. Chem. Eng. Sci. 1999, 54, 2077–2083. [Google Scholar] [CrossRef]
- Yu, A.B.; Xu, B.H. Particle-scale modelling of gas–solid flow in fluidisation. J. Chem. Technol. Biotechnol. 2003, 78, 111–121. [Google Scholar] [CrossRef]
- Wu, Y.; Zheng, Q.; Zhu, H.; Yu, A. A micro-macro constitutive relationship for the pressure of solid phase in dense fluid-particle flows in hopper. Powder Technol. 2024, 434. [Google Scholar] [CrossRef]
- de Munck, M.; van Gelder, J.; Peters, E.; Kuipers, J. A detailed gas-solid fluidized bed comparison study on CFD-DEM coarse-graining techniques. Chem. Eng. Sci. 2023, 269. [Google Scholar] [CrossRef]
- de Munck, M.; Peters, E.; Kuipers, J. Fluidized bed gas-solid heat transfer using a CFD-DEM coarse-graining technique. Chem. Eng. Sci. 2023, 280. [Google Scholar] [CrossRef]
- Hadian, M.; de Munck, M.; Buist, K.; Bos, A.; Kuipers, J. Modeling of a catalytic fluidized bed reactor via coupled CFD-DEM with MGM: from intra-particle scale to reactor scale. Chem. Eng. Sci. 2023, 284. [Google Scholar] [CrossRef]
- Nijssen, T.M.; Padding, J.T.; Ottens, M. Hydrodynamics of expanded bed adsorption studied through CFD-DEM. Chem. Eng. Sci. 2023, 280. [Google Scholar] [CrossRef]
- Esgandari, B.; Rauchenzauner, S.; Goniva, C.; Kieckhefen, P. A comprehensive comparison of Two-Fluid Model, Discrete Element Method and experiments for the simulation of single- and multiplespout fluidized beds. Chem. Eng. Sci. 2023, 267, 118357. [Google Scholar] [CrossRef]
- Nikku, M.; Myöhänen, K.; Ritvanen, J.; Hyppänen, T. Evaluation of mixing of a secondary solid phase in a circulating fluidized bed riser. Chem. Eng. Sci. 2023, 269. [Google Scholar] [CrossRef]
- Runstedler, A.; Duchesne, M.A. A method to predict particle collision speeds in fluidized beds. Chem. Eng. Sci. 2022, 264, 118157. [Google Scholar] [CrossRef]
- Wu, G.; Ouyang, J.; Li, Q. Revised drag calculation method for coarse grid Lagrangian–Eulerian simulation of gas–solid bubbling fluidized bed. Powder Technol. 2012, 235, 959–967. [Google Scholar] [CrossRef]
- Wu, G.; Li, Y. CFD-DEM Simulation of Slugging and Non-Slugging Fast Fluidization of Fine Particles in a Micro Riser. Processes 2023, 11, 2977. [Google Scholar] [CrossRef]
- Xu, M.; Ge, W.; Li, J. A discrete particle model for particle–fluid flow with considerations of sub-grid structures. Chem. Eng. Sci. 2007, 62, 2302–2308. [Google Scholar] [CrossRef]
- Wen, C.Y.; Yu, Y.H. Mechanics of fluidization. Chem. Eng. Progr. Symp. Ser. 1966, 62, 100–111. [Google Scholar]
- Schiller, V.L.; Naumann, A. Uber die grundlegenden berechnungen bei der schwerkraftaufbereitung. Z. Ver. Dtsch. Ing. 1993, 77, 318–320. [Google Scholar]
- Patankar, T.V. Numerical Heat Transfer and Fluid Flow; Hemisphere Publishing Corporation: New York, NY, USA, 1980. [Google Scholar]
- van Wachem, B.; van der Schaaf, J.; Schouten, J.; Krishna, R.; Bleek, C.v.D. Experimental validation of Lagrangian–Eulerian simulations of fluidized beds. Powder Technol. 2001, 116, 155–165. [Google Scholar] [CrossRef]
|
Disclaimer/Publisher’s Note: The statements, opinions and data contained in all publications are solely those of the individual author(s) and contributor(s) and not of MDPI and/or the editor(s). MDPI and/or the editor(s) disclaim responsibility for any injury to people or property resulting from any ideas, methods, instructions or products referred to in the content. |
© 2024 by the authors. Licensee MDPI, Basel, Switzerland. This article is an open access article distributed under the terms and conditions of the Creative Commons Attribution (CC BY) license (http://creativecommons.org/licenses/by/4.0/).
