1. Introduction
At present, mankind is facing an iteration of new and old energy replacement, and the oil and gas industry worldwide has gradually extended to unconventional fields
Error! Reference source not found.-
Error! Reference source not found. With the support of new theory and technology, it is difficult to directly measure the amount of oil and gas adsorption and evaluate the adsorption process by means of laboratory experiments[
5,
7], numerical simulation and molecular simulation. Isothermal adsorption experiment can effectively make up for this deficiency, which provides important technical support for the study of oil and gas adsorption and migration, and is of great significance to oil and gas exploration and development[
5,
7].
By combining the isothermal adsorption of shale-water vapor with the theoretical model, Dong et al. described the capillary phenomenon and multi-molecular layer adsorption behavior of shale in the process of water vapor adsorption, and found that the adsorption was a spontaneous, exothermic and entropy-reducing process[
10]. Huang et al. quantitatively analyzed the effect of water molecules on methane adsorption in shale, clarified the mechanism of water molecules on methane adsorption rate under different pressure gradients, and deepened the understanding of underground supercritical adsorption[
11]. Based on this, Wang carried out research on the adsorption mechanism of methane in shale under supercritical conditions, analyzed the main controlling factors of methane adsorption in shale by thermodynamic model, and clarified the thermodynamic characteristics of methane adsorption under supercritical conditions[
12]. In order to improve oil and gas recovery, Abdulkareem et al. carried out experiments on shale adsorption and desorption of CO
2 based on the gravimetric method, and used the numerical equilibrium isotherm model to clarify the influence of physical properties of shale reservoirs on the adsorption rate[
13]. Tian carried out experimental and theoretical research on the adsorption of methane, ethane pure component gas and its binary mixture in shale. The multi-temperature Langmuir-Freundlich adsorption equation was selected to characterize the adsorption difference of oil and gas components in shale. Based on the isothermal adsorption method, a comprehensive evaluation model of shale gas content was established[
14]. By studying the adsorption law of shale in Fuxian area of Ordos Basin, Chen et al. established a four-parameter Langmuir expansion model for accurately predicting the amount of methane adsorption, which provided a new method for quantitative calculation of oil and gas adsorption. Since then, many scholars have carried out a lot of research on the process and characteristics of oil and gas adsorption by combining isothermal adsorption experiments with mathematical evaluation models[
16,
20].
Based on the existing theoretical and experimental techniques, the research objects of isothermal adsorption physics experiments are mostly limited to solid-gas two-phase state, and few experts carry out solid-liquid isothermal adsorption experiments for shale oil (oil phase)[
21,
25]. Yu et al. firstly carried out solid-liquid (oil phase) isothermal adsorption experiments on shale for the first time. The adsorption model was used to analyze the adsorption characteristics of shale to diesel oil. It was clear that the adsorption of shale to diesel oil under natural conditions conforms to the Langmuir model and tends to monolayer adsorption[
26].
As an important area for oil and gas exploration and development in China, the adsorption characteristics of shale oil and gas in the Beibu Gulf Basin, which is conducive to promoting domestic oil and gas reserves and production[
27]
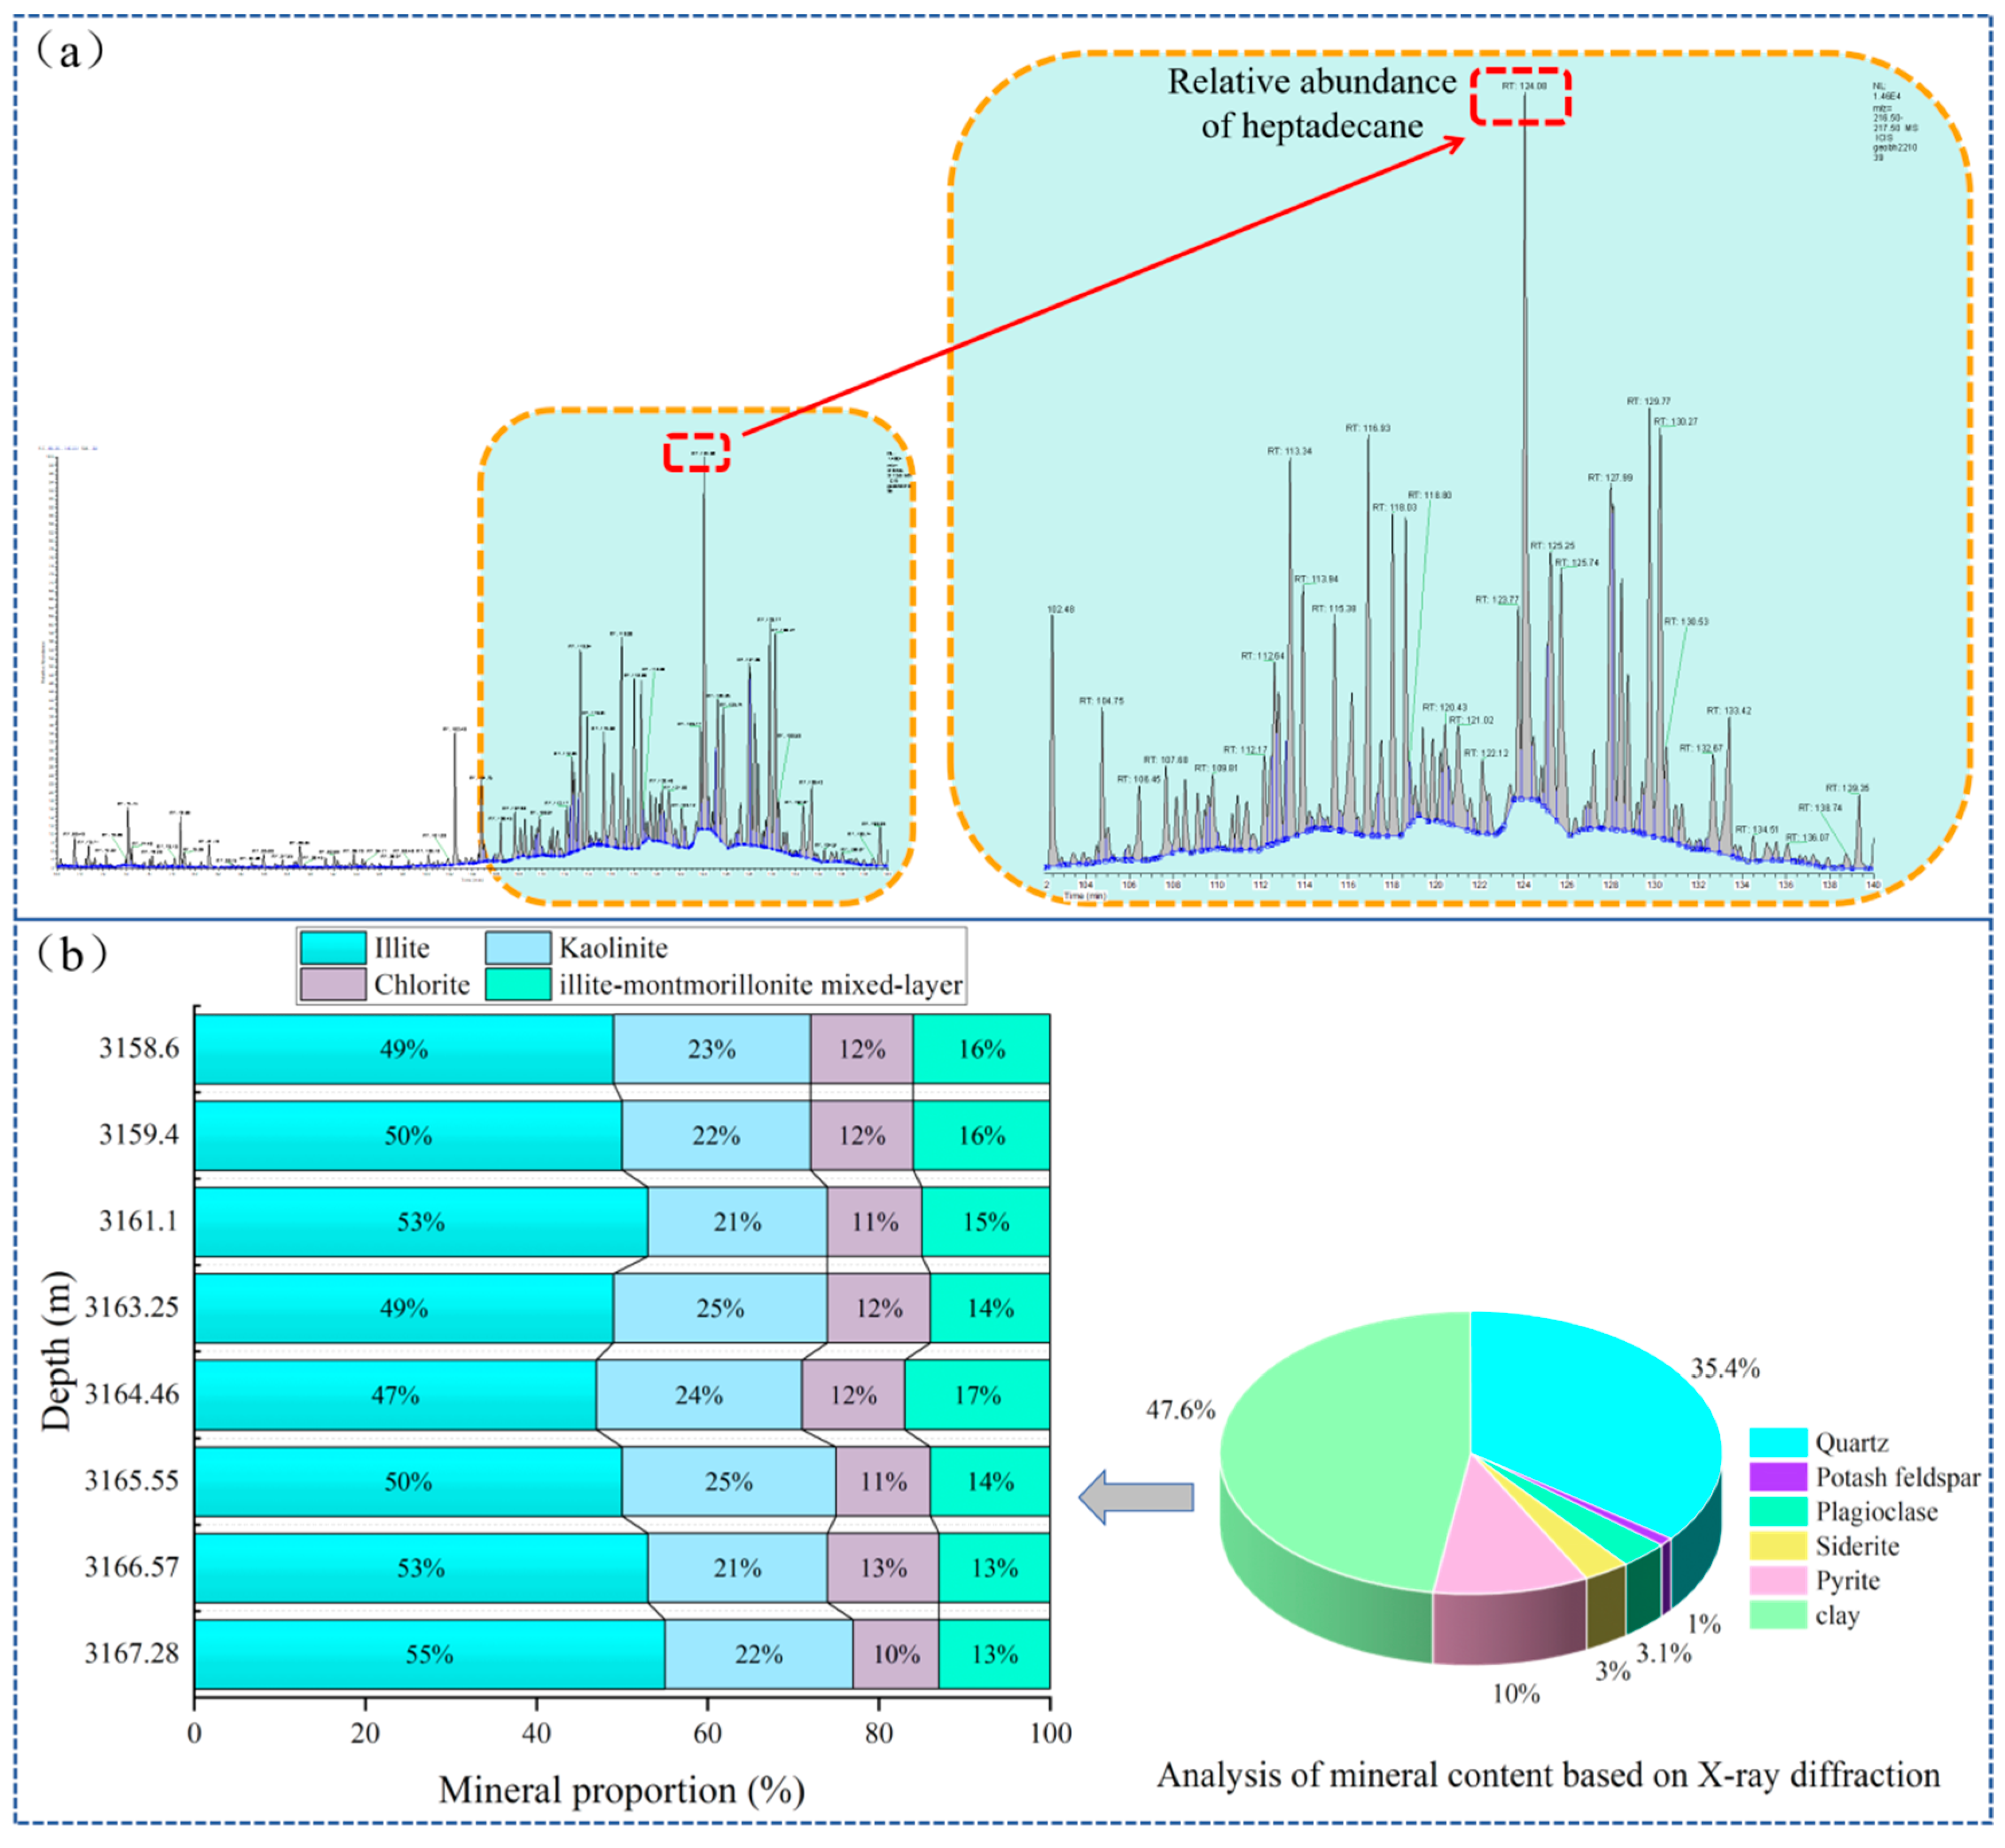
Error! Reference source not found. Based on the phase mass spectrometry of shale oil saturated hydrocarbons in the study area and the XRD experiment of the reservoir, it is learned that the heavy component of saturated hydrocarbons is mainly heptadecane (
Figure 1a), illite is the main component of soil minerals in shale (
Figure 1b), and kerogen is also an important part of shale. Therefore, Therefore, the solid-liquid isothermal adsorption experiments of illite and kerogen oil phase (heptadecane) were carried out, Which is helpful to investigate the adsorption law and characteristics of shale oil, clarify the reaction mechanism of alkane concentration on the adsorption process, fill the research gap of solid-liquid (oil phase) isothermal adsorption experiment in oil and gas exploration, and provide theoretical support for the occurrence mechanism of shale oil.
2. Illite and Kerogen Oil Phase Adsorption Experiment
Based on infrared spectrophotometry and gas chromatography-mass spectrometry, Heptadecane was used as oil phase and tetrachloroethylene was used as solvent, to investigate adsorption properties of heptadecane in illite and kerogen powders. The concentration changes of oil phase solution before and after adsorption were determined by infrared oil analyzer and GC-MS, and the relationship between adsorption amount and oil phase solution concentration and adsorption temperature was determined. In order to determine the relationship between the adsorption amount and the concentration of the oil phase solution and the adsorption temperature, the concentration of the oil phase solution before and after adsorption was determined by infrared oil meter and GC-MS[
31,
32], and the adsorption characteristics of oil phase components on the surface and pores of illite and kerogen were discussed by adsorption thermodynamics[
33,
34].
2.1. Samples
The experimental samples are divided into two aspects: adsorbent and adsorbate. The adsorbent is an oil phase solution of heptadecane and tetrachloroethane, and the adsorbate is a solid powder of illite and kerogen (
Table 1). Heptadecane, tetrachloroethylene and illite have stable physical and chemical properties. However, kerogen, as a macromolecular organic matter, does not have a fixed molecular structure. Therefore, heptadecane, tetrachloroethylene and illite were purchased for adsorption experiments, and the illite powder with a particle size of 75-100um was screened and separated. It was burned in a muffle furnace at 600℃ for 8h to remove organic pollutants on the surface. Compared with the original purchased illite sample, the color of the illite sample after high temperature heating was deepened and slightly reddish brown (
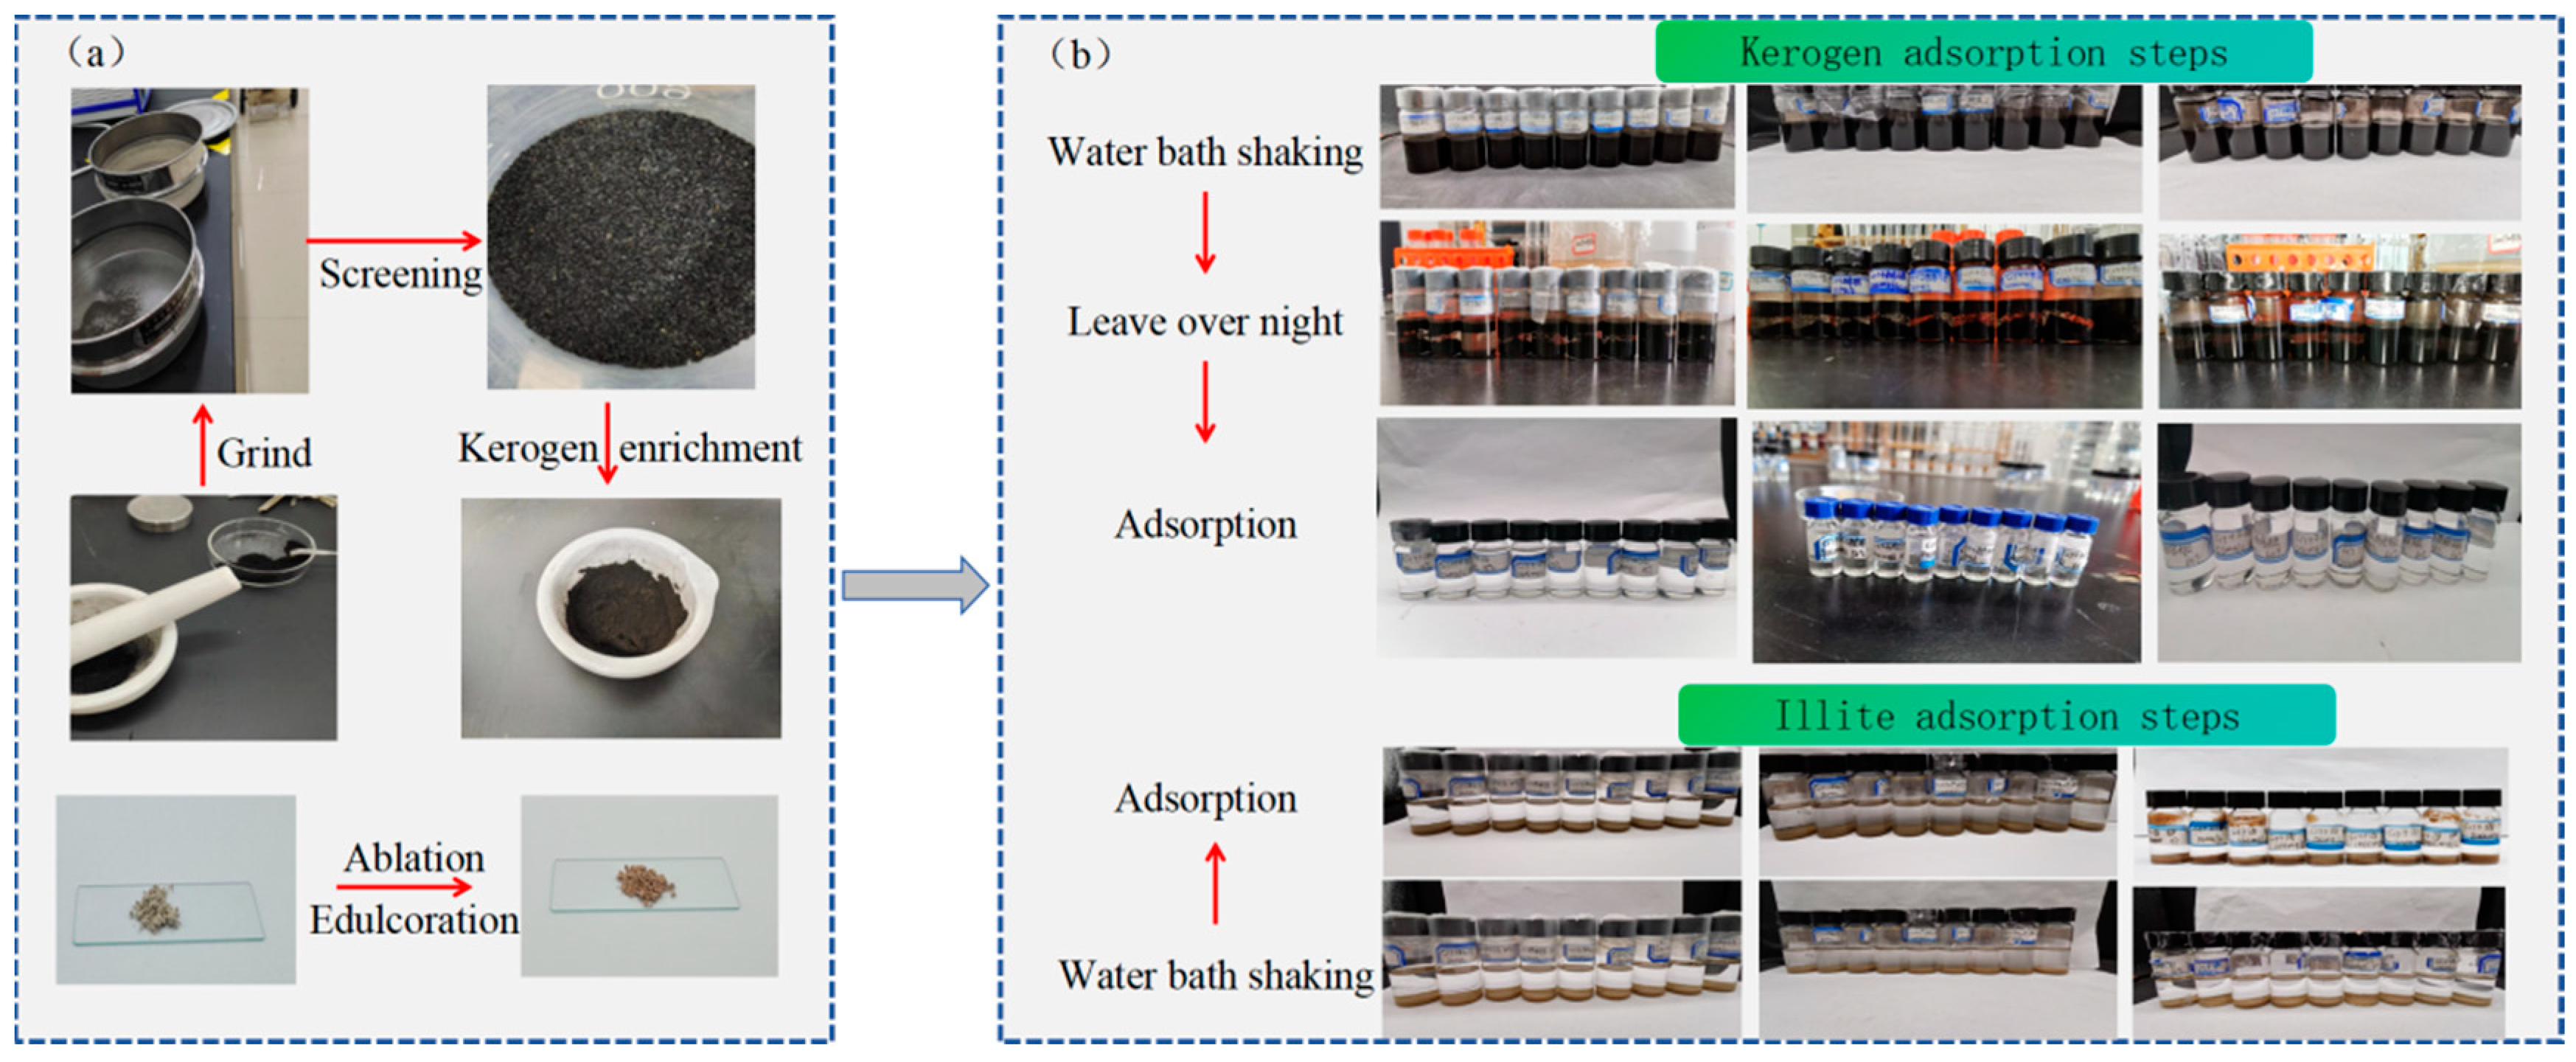
Figure 2a). Based on the《GB/ T 19144 -2010 method for separation of kerogen in sedimentary rocks》, the organic-rich oil shale clastic powder in Weixinan Sag of Beibu Gulf Basin was treated with acid and alkali, and the kerogen samples with an average burning vector of 90.51 % were prepared (
Figure 2a).
According to the different functions of the adsorbent, it is divided into alkane solution for plotting the standard curve and for measuring the adsorption capacity. Using analytical balance, 2.500g heptadecane was accurately weighed in 250mL volumetric flask and dissolved in tetrachloroethylene to obtain 250mL solution of 10000mg/L alkane tetrachloroethylene. Based on the infrared spectrophotometry and GC-MS method, the stepwise dilution method was used to configure the solution for marking and determination of adsorption experiments (
Table 2,
Table 3,
Table 4 and
Table 5).
2.2. Experimental Methods and Steps
In order to investigate the occurrence characteristics of shale oil, the solid-liquid isothermal adsorption experiments of alkane solution (oil phase) in illite and kerogen were carried out to study the effect of solution concentration on the whole adsorption process. The combination of isothermal adsorption results with adsorption isotherm model and adsorption thermodynamic model can describe the adsorption process of alkanes in depth, which is helpful to investigate the reaction mechanism of adsorption behavior to solution concentration and adsorption temperature, and to clarify the adsorption process and characteristics of heptadecane in illite and kerogen[
33,
34].
10mL of alkane solution with different concentrations were taken into 20mL glass bottles, and 0.2g of illite powder and kerogen powder were added respectively. After sealing, they were placed on a constant temperature water bath shaker and oscillated for 24h. Because kerogen is very difficult to separate from the solution, it is necessary to first leave the mixture of kerogen and alkane solution overnight, and then use 2.5mL syringe and 0.45μm filter head to separate the supernatant from illite and kerogen powder to obtain the filtrate, which is used to investigate the effect of adsorption concentration solution on adsorption performance (
Figure 2b).
The effects of different temperatures (25℃, 50℃, 60℃) on the equilibrium of alkane solution adsorbed by illite and kerogen were investigated under atmospheric pressure. 10mL of alkane solution with different concentrations were taken into 20mL glass bottles, and 0.2g of illite and kerogen powder were added respectively. After sealing, they were shaken on a constant temperature water bath shaker for 24h. The supernatant was separated from the illite powder using a 2.5mL syringe and a 0.45μm filter to obtain the illite filtrate. However, kerogen is extremely difficult to be separated from the solution. The mixture of kerogen and alkane solution needs to be placed overnight, and then the filtrate is obtained by separating the supernatant and kerogen powder to investigate the effect of adsorption temperature on adsorption equilibrium (
Figure 2b).
In the experiment, the concentration of oil phase solution before and after adsorption was measured by infrared oil analyzer and GC-MS, and the relationship between adsorption amount and oil phase concentration and adsorption temperature was determined[
37]. Based on the calculation of isothermal adsorption capacity, the isothermal adsorption curve was drawn, and the adsorption isotherm model and adsorption thermodynamic model were used to explore the adsorption characteristics of heptadecane on the surface and pores of illite and kerogen.
In the formula, is the shale mass; is the concentration of the solution before adsorption; is the solution concentration after adsorption ; is the volume of solution; is the adsorption capacity.
3. Experimental Results
The adsorption isotherm refers to the relationship curve between the concentration of the solute in the two phases when the solute molecules reach the adsorption equilibrium on the two-phase interface at a certain temperature, which can provide deeper information on the interaction between the adsorbate and the adsorbent. The adsorption capacity of a given adsorbate can be determined by adsorption isotherms, and adsorption equilibrium is one of the most important factors in the study of adsorbent-adsorbate system. By plotting the isothermal adsorption curves of illite and kerogen to alkane solution, and fitting the adsorption data with the isothermal adsorption mathematical model, the adsorption site information on the surface of the adsorbent and the adsorption characteristics of the adsorption system were obtained. The commonly used mathematical models include Langmuir, Freundlich and Temkin adsorption isotherm models[
38].
3.1. Illite Adsorption of Alkane Solution Isotherm Characteristics
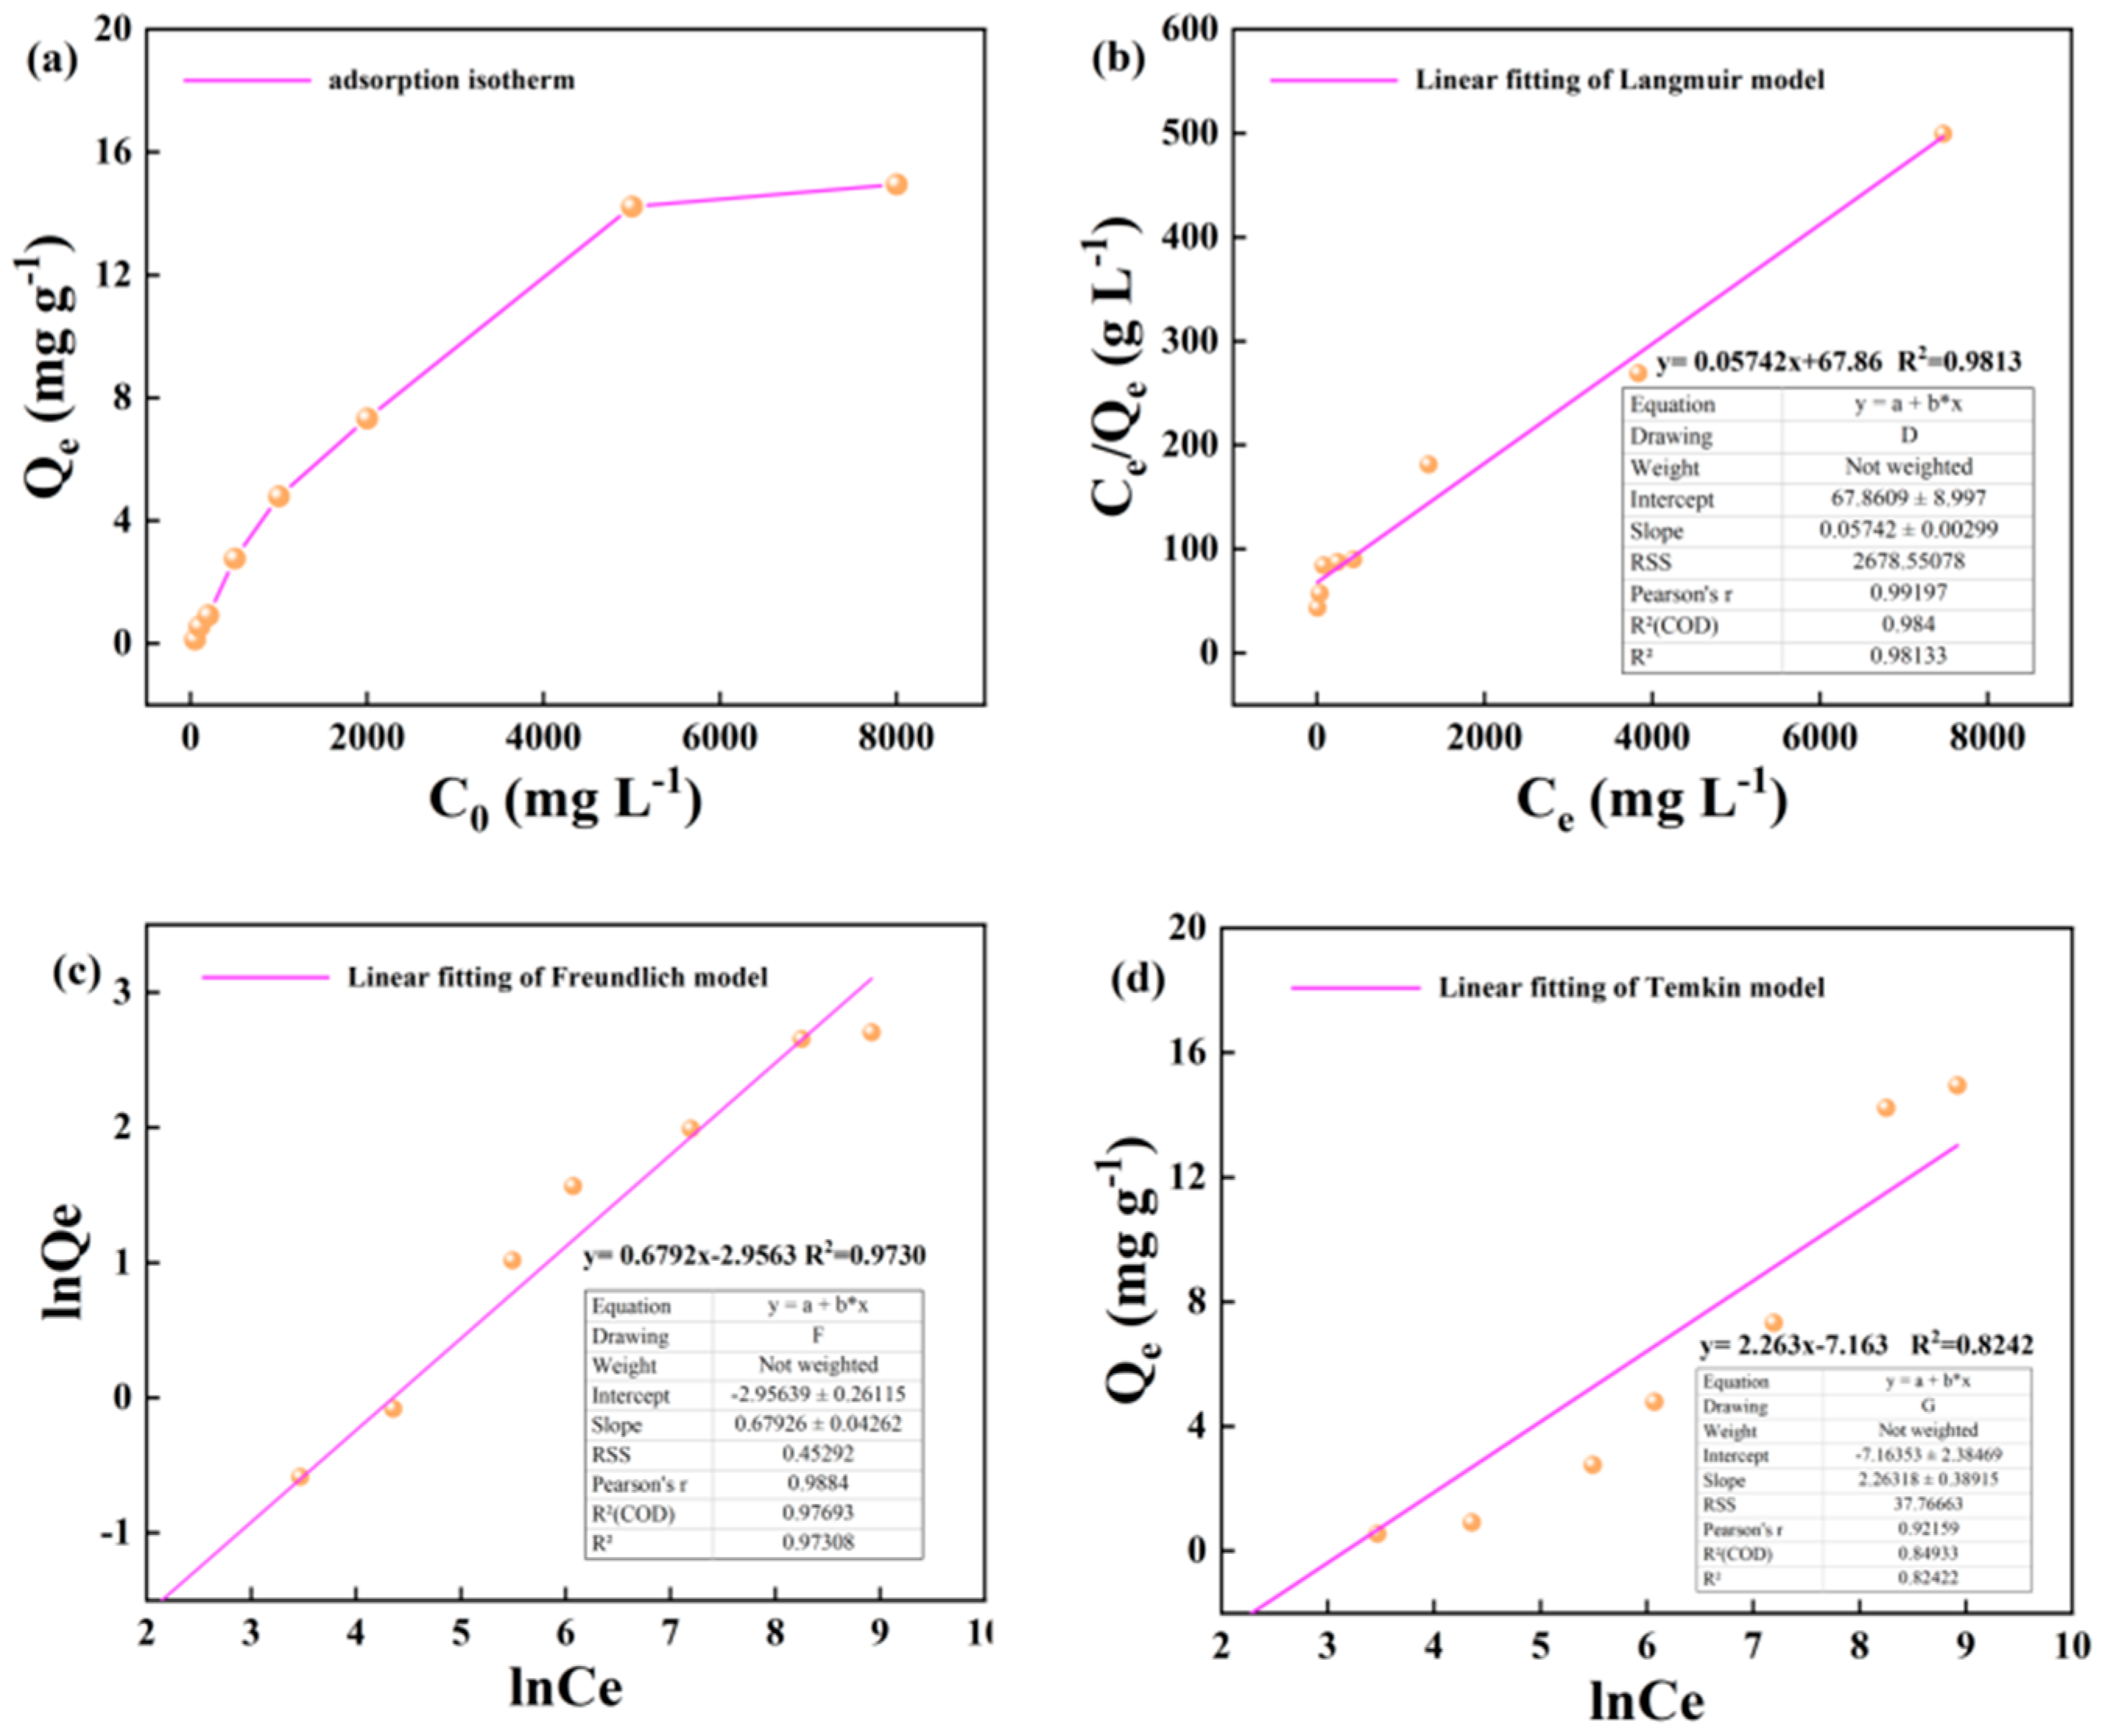
The change of adsorption capacity of illite to alkane solution with initial concentration at 25 °C is shown in the diagram. In the lower concentration range of 50-1000 mg · L-1, the adsorption capacity of illite to heptadecane increases linearly with the increase of alkane concentration. In the higher concentration range of 1000-5000 m · L-1, the adsorption capacity of illite to heptadecane increased slowly, but the adsorption capacity still increased linearly with the increase of the concentration of the alkane solution. In the higher concentration range of 5000-8000 m · L-1, the growth rate of adsorption capacity of illite to heptadecane was further slowed down (
Figure 3a). The Langmuir, Freundlich and Temkin adsorption isotherms of illite on alkane solution at 25 °C are shown as follows (
Figure 3b–d).
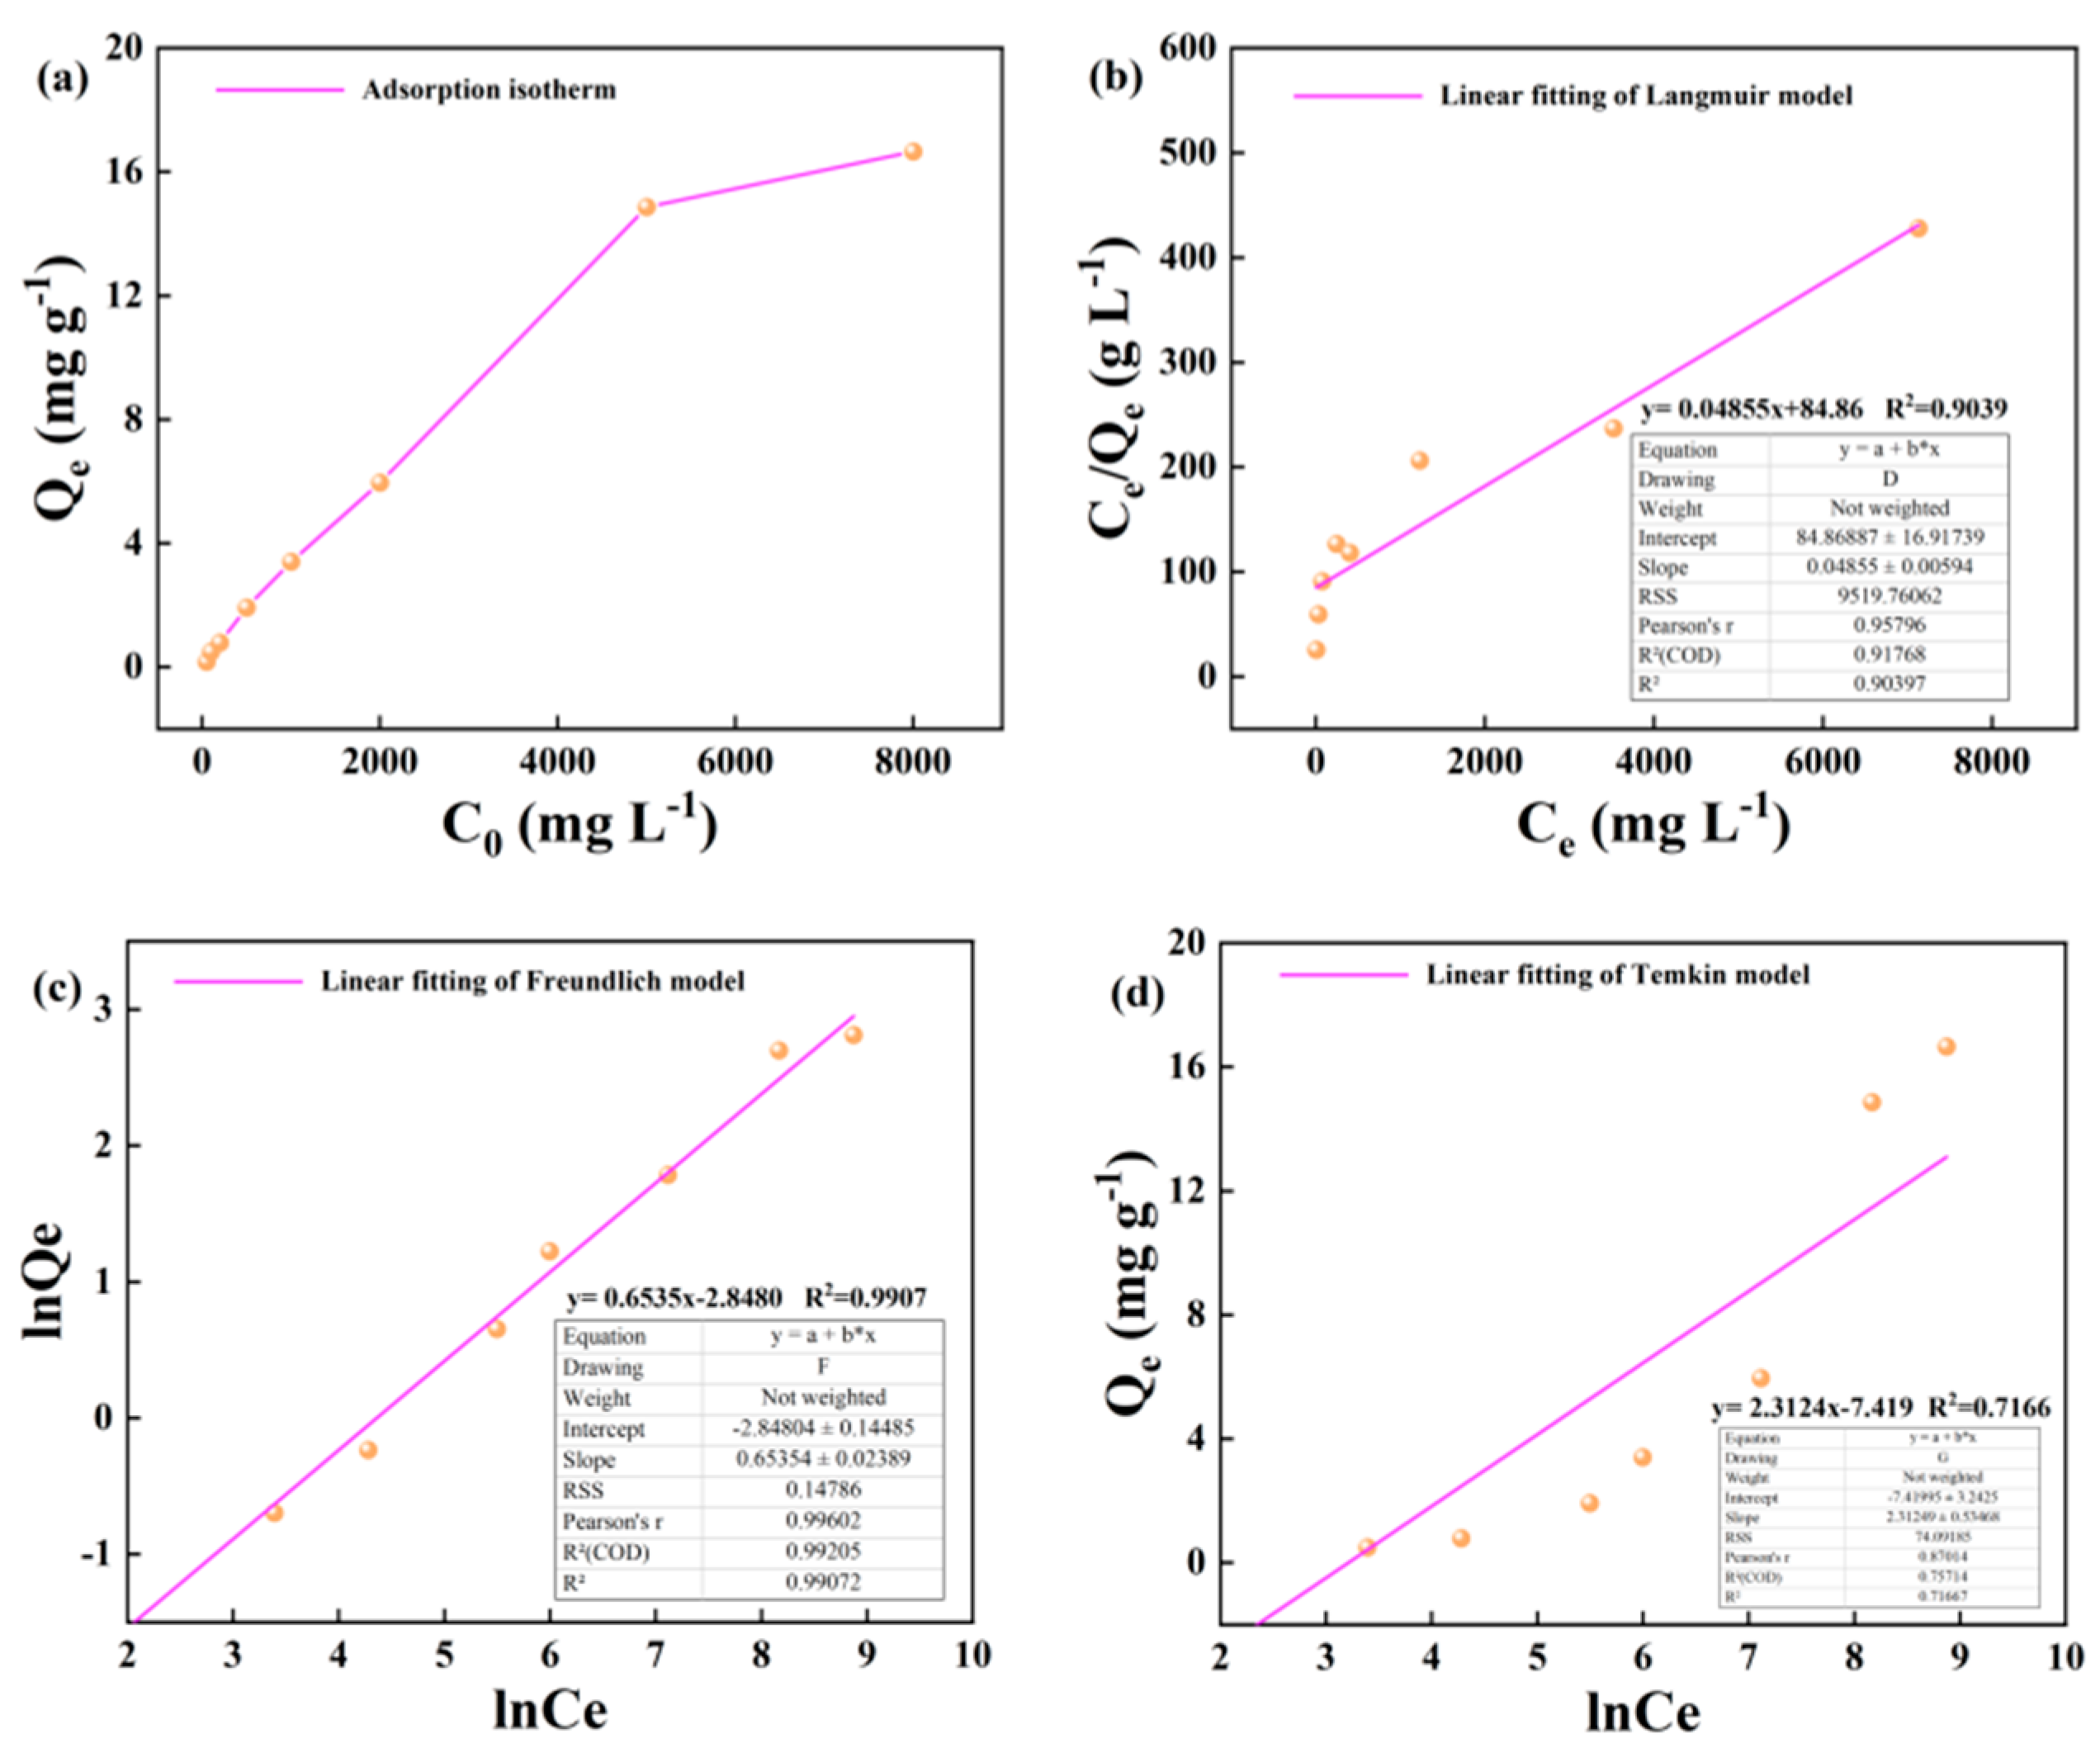
The change of the adsorption capacity of illite to alkane solution at 50 °C with the initial concentration is shown in the figure. In the wide concentration range of 50-5000m · L-1, the adsorption capacity of illite to heptadecane increases linearly with the increase of alkane concentration. In the high concentration range of 5000-8000 m · L-1, the growth rate of adsorption capacity of illite to heptadecane slowed down (
Figure 4a). The Langmuir, Freundlich and Temkin adsorption isotherms of illite for alkane solution at 50 °C are shown as follows (
Figure 4b–d).
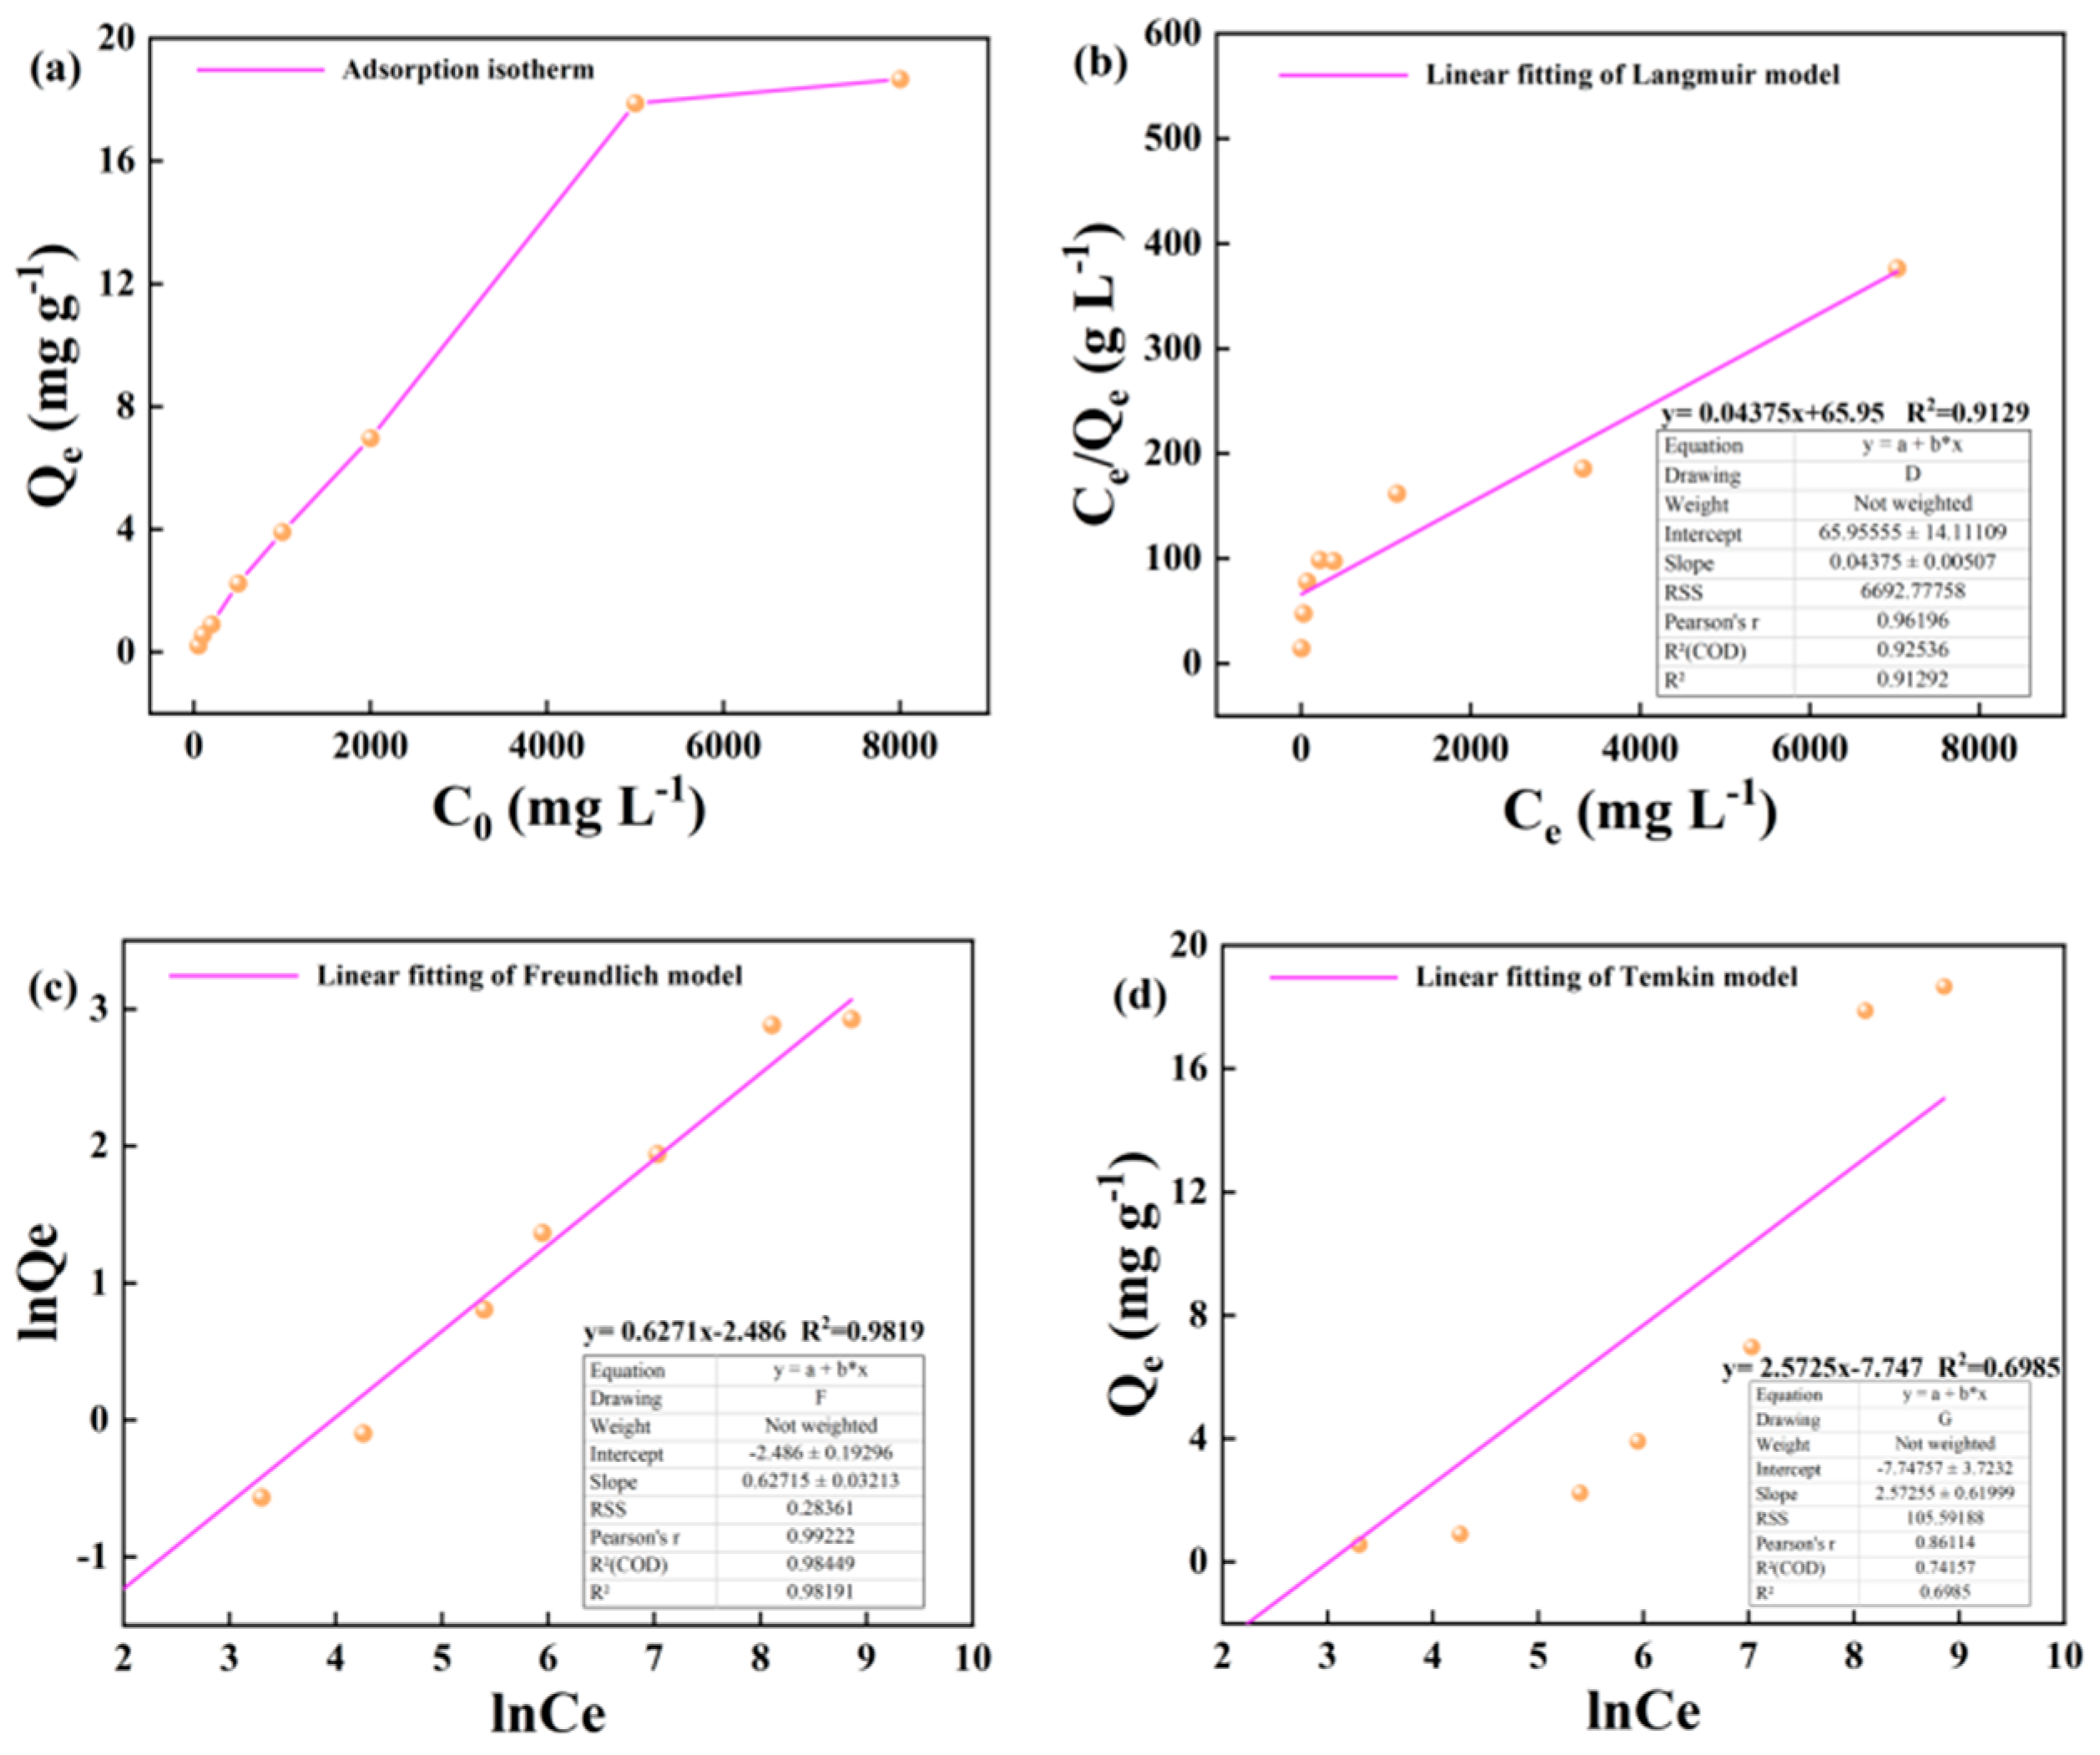
The change of adsorption capacity of illite to alkane solution with the initial concentration at 60 °C is as shown in the graph. In the lower concentration range of 50-5000m · L-1, the adsorption capacity of illite to heptadecane increases linearly with the increase of alkane concentration. In the high concentration range of 5000-10000 m · L-1, the adsorption capacity of illite to heptadecane increased slowly (
Figure 5a). The Langmuir, Freundlich and Temkin adsorption isotherms of illite for alkane solution at 60 °C are shown as follows (Figure 5b–d).
3.2. Kerogen Adsorption of Alkane Solution Isotherm Characteristics
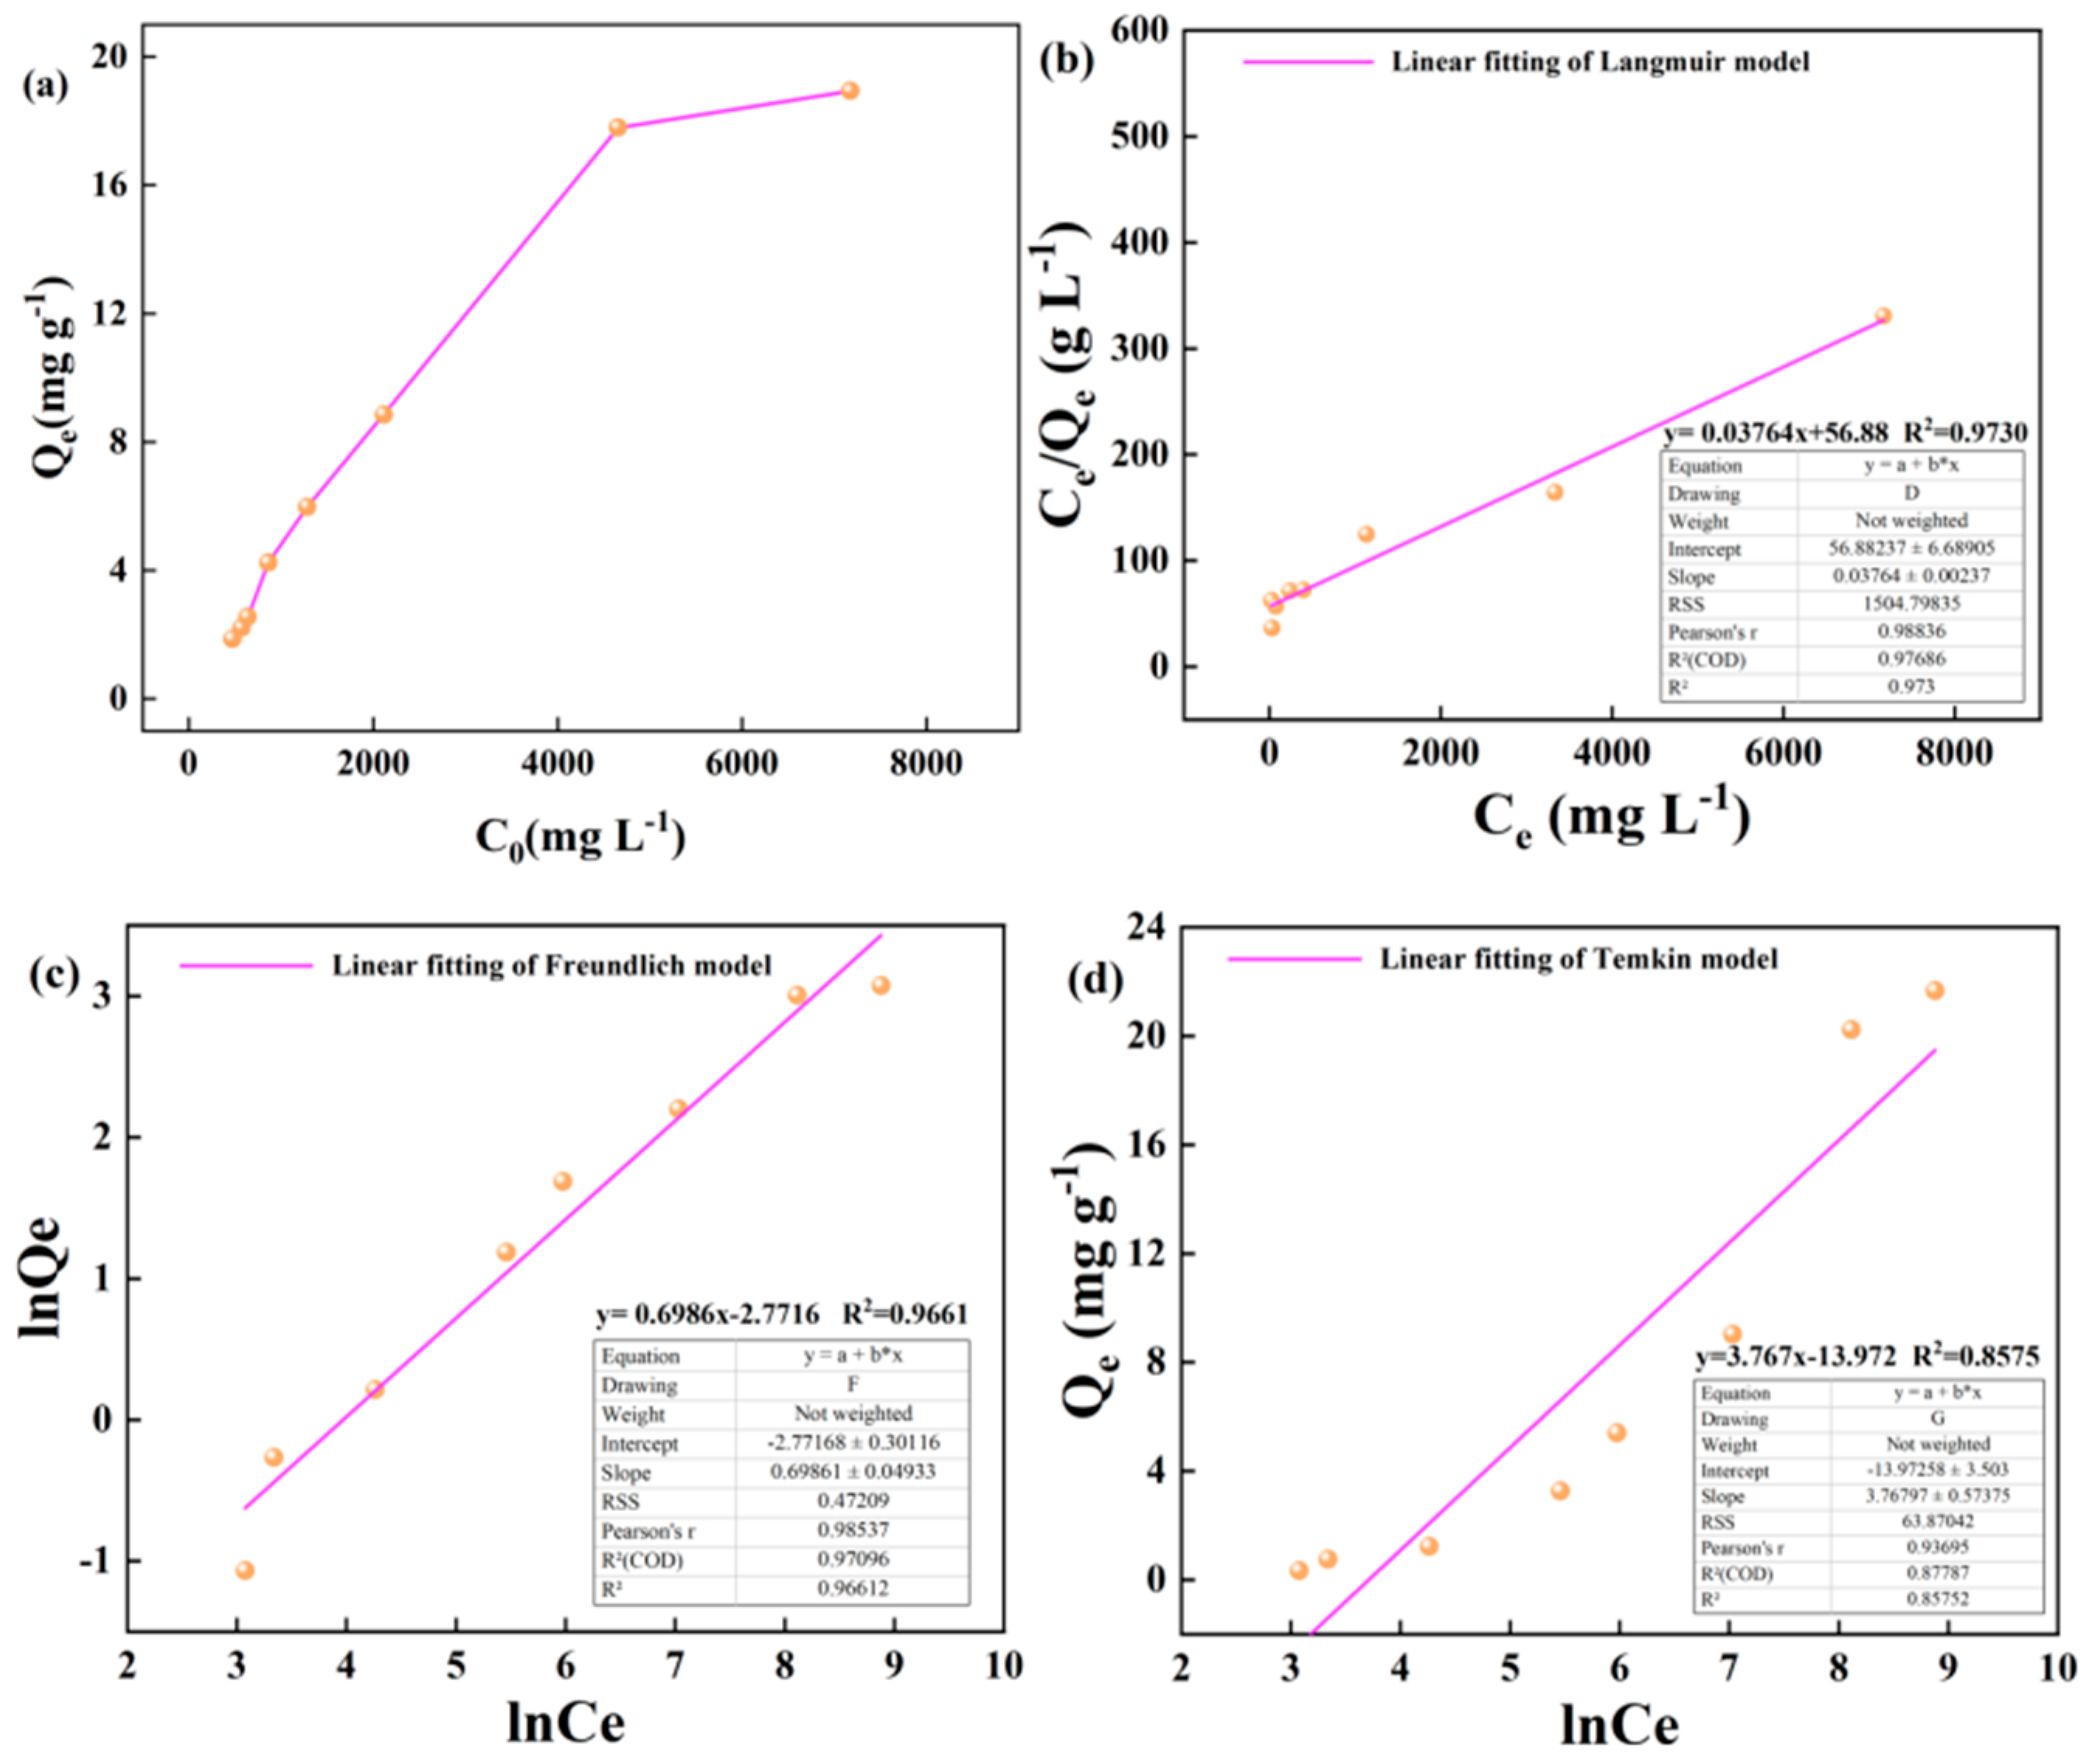
The adsorption amount of kerogen to alkane solution at 25 °C with the change of initial concentration as shown in the graph, in a wide concentration range of 50-5000m · L-1, the adsorption amount of illite to heptadecane increases linearly with the increase of alkane concentration. In the high concentration range of 5000-8000 m · L-1, the growth rate of adsorption capacity of illite to heptadecane slowed down (
Figure 6a). The Langmuir, Freundlich and Temkin adsorption isotherms of kerogen on alkane solution at 25 °C are shown as follows (
Figure 6b–d).
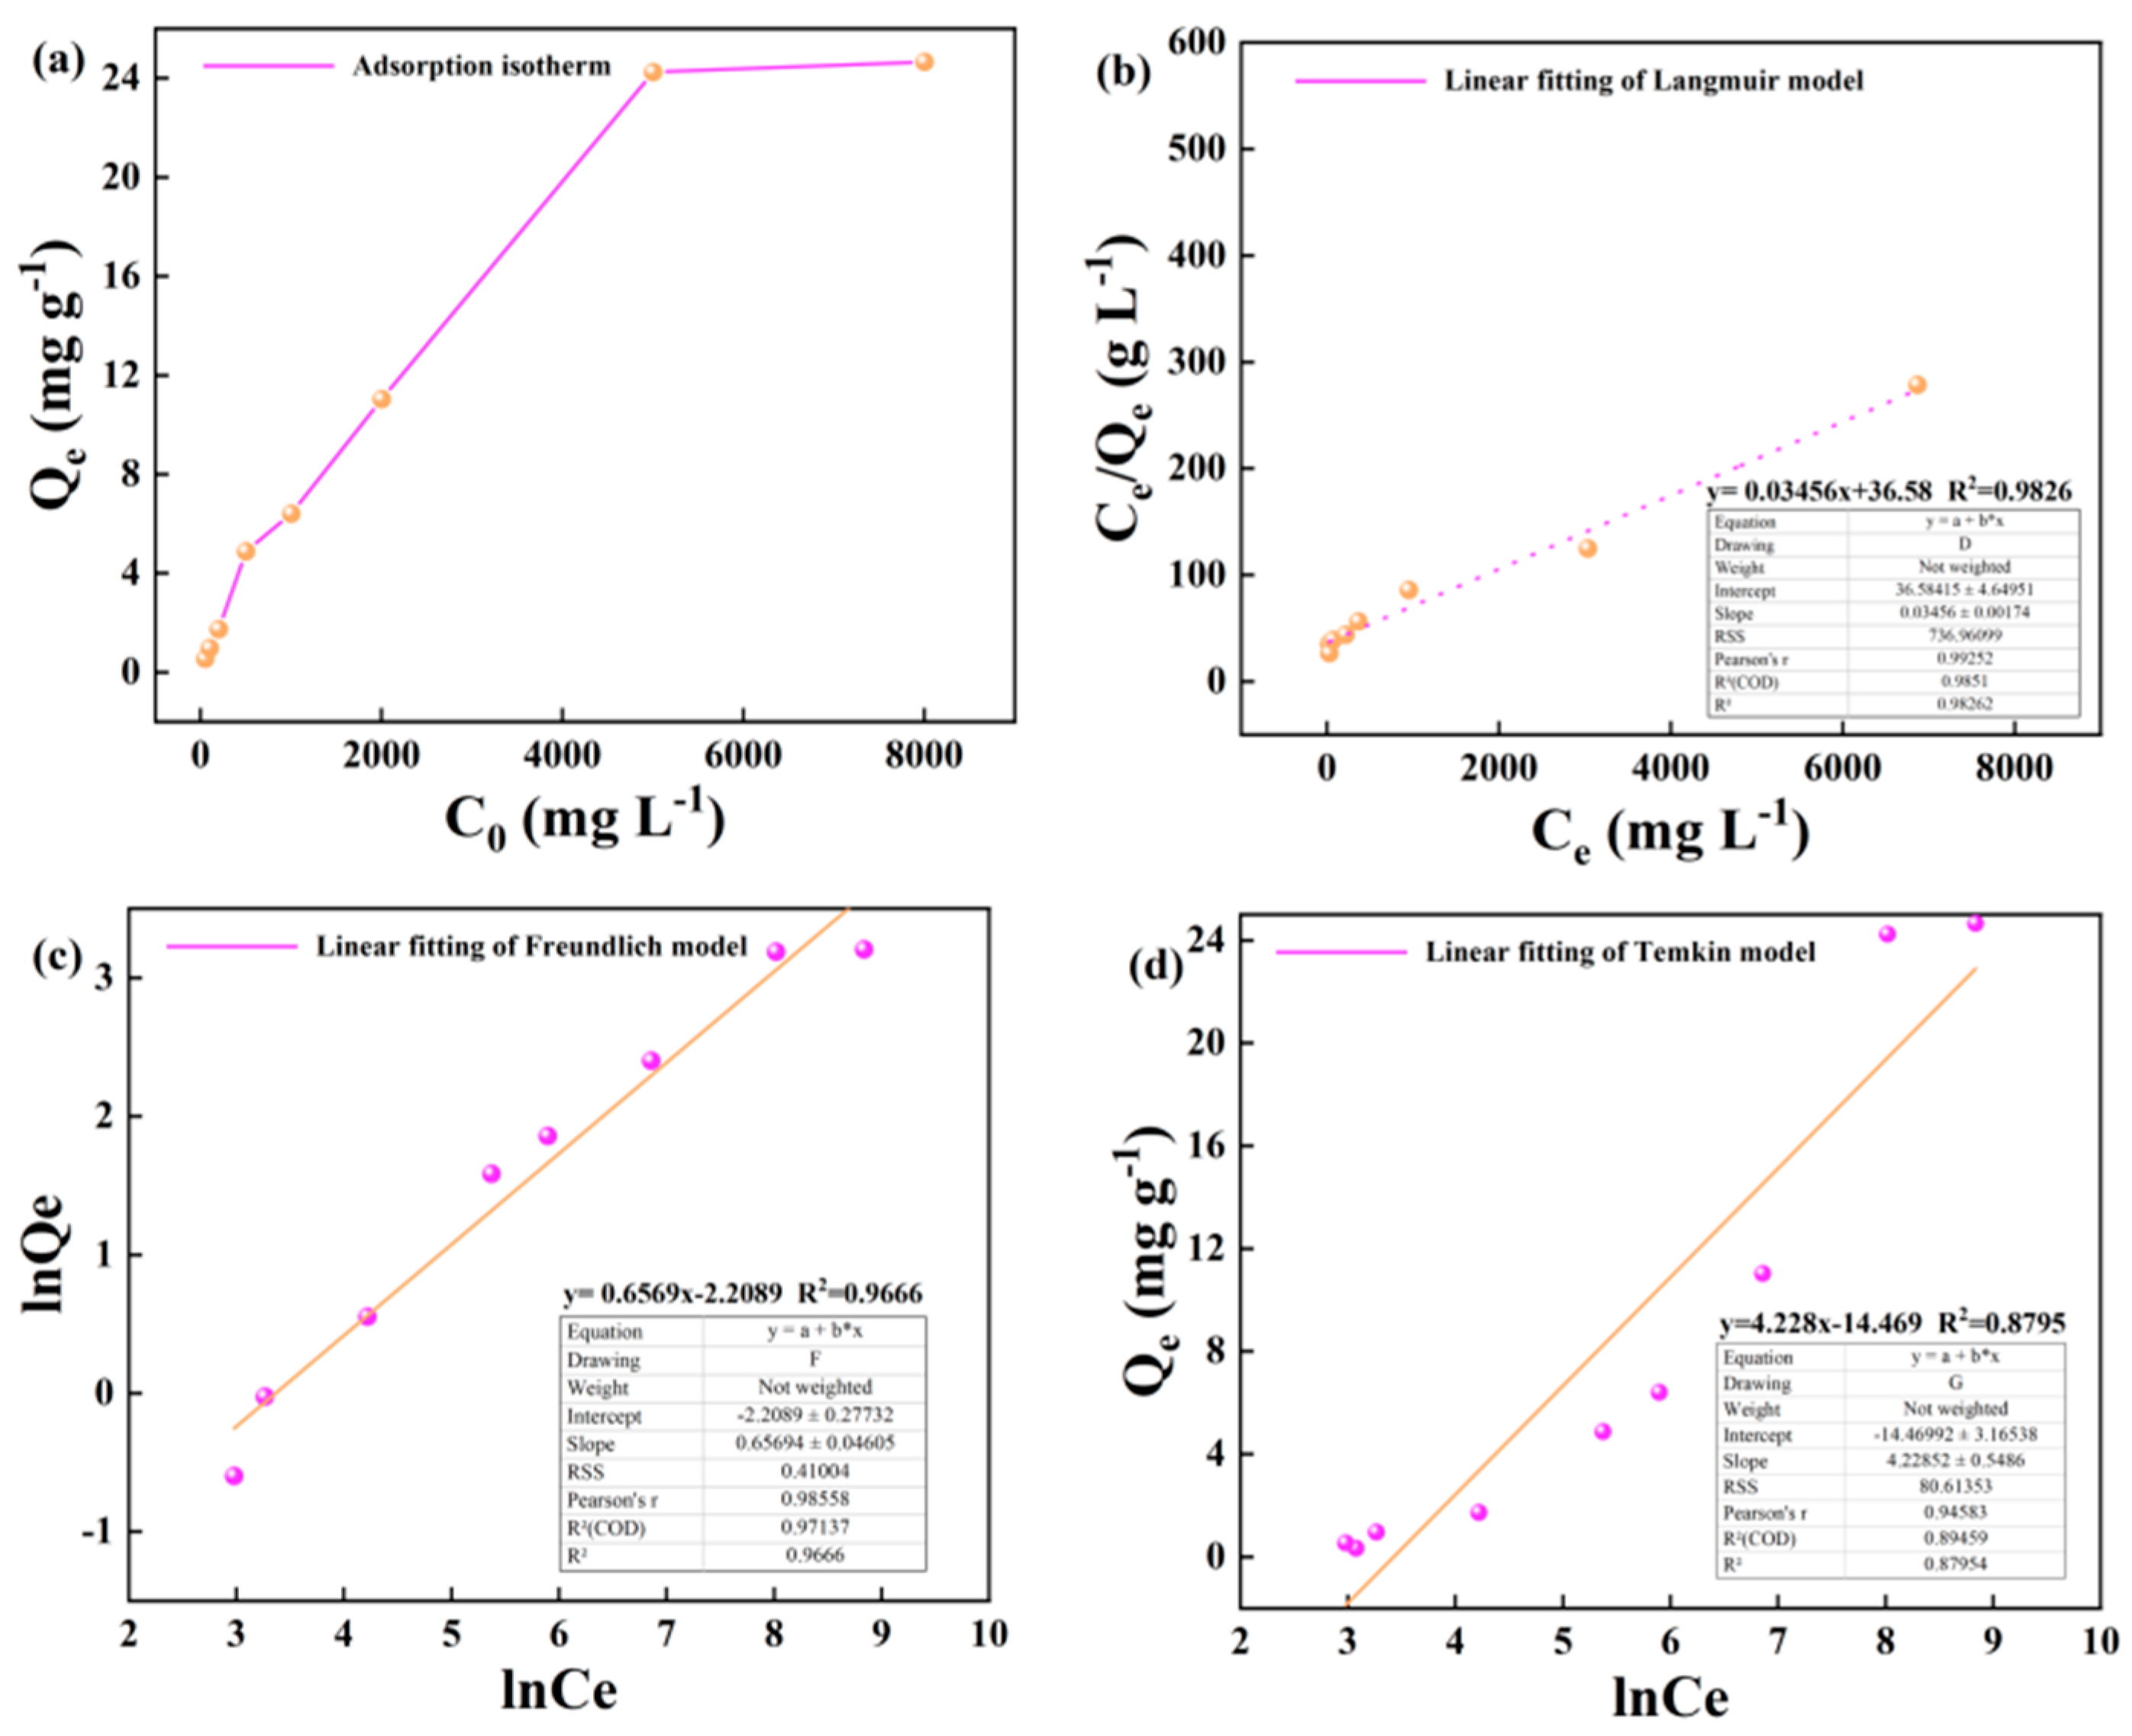
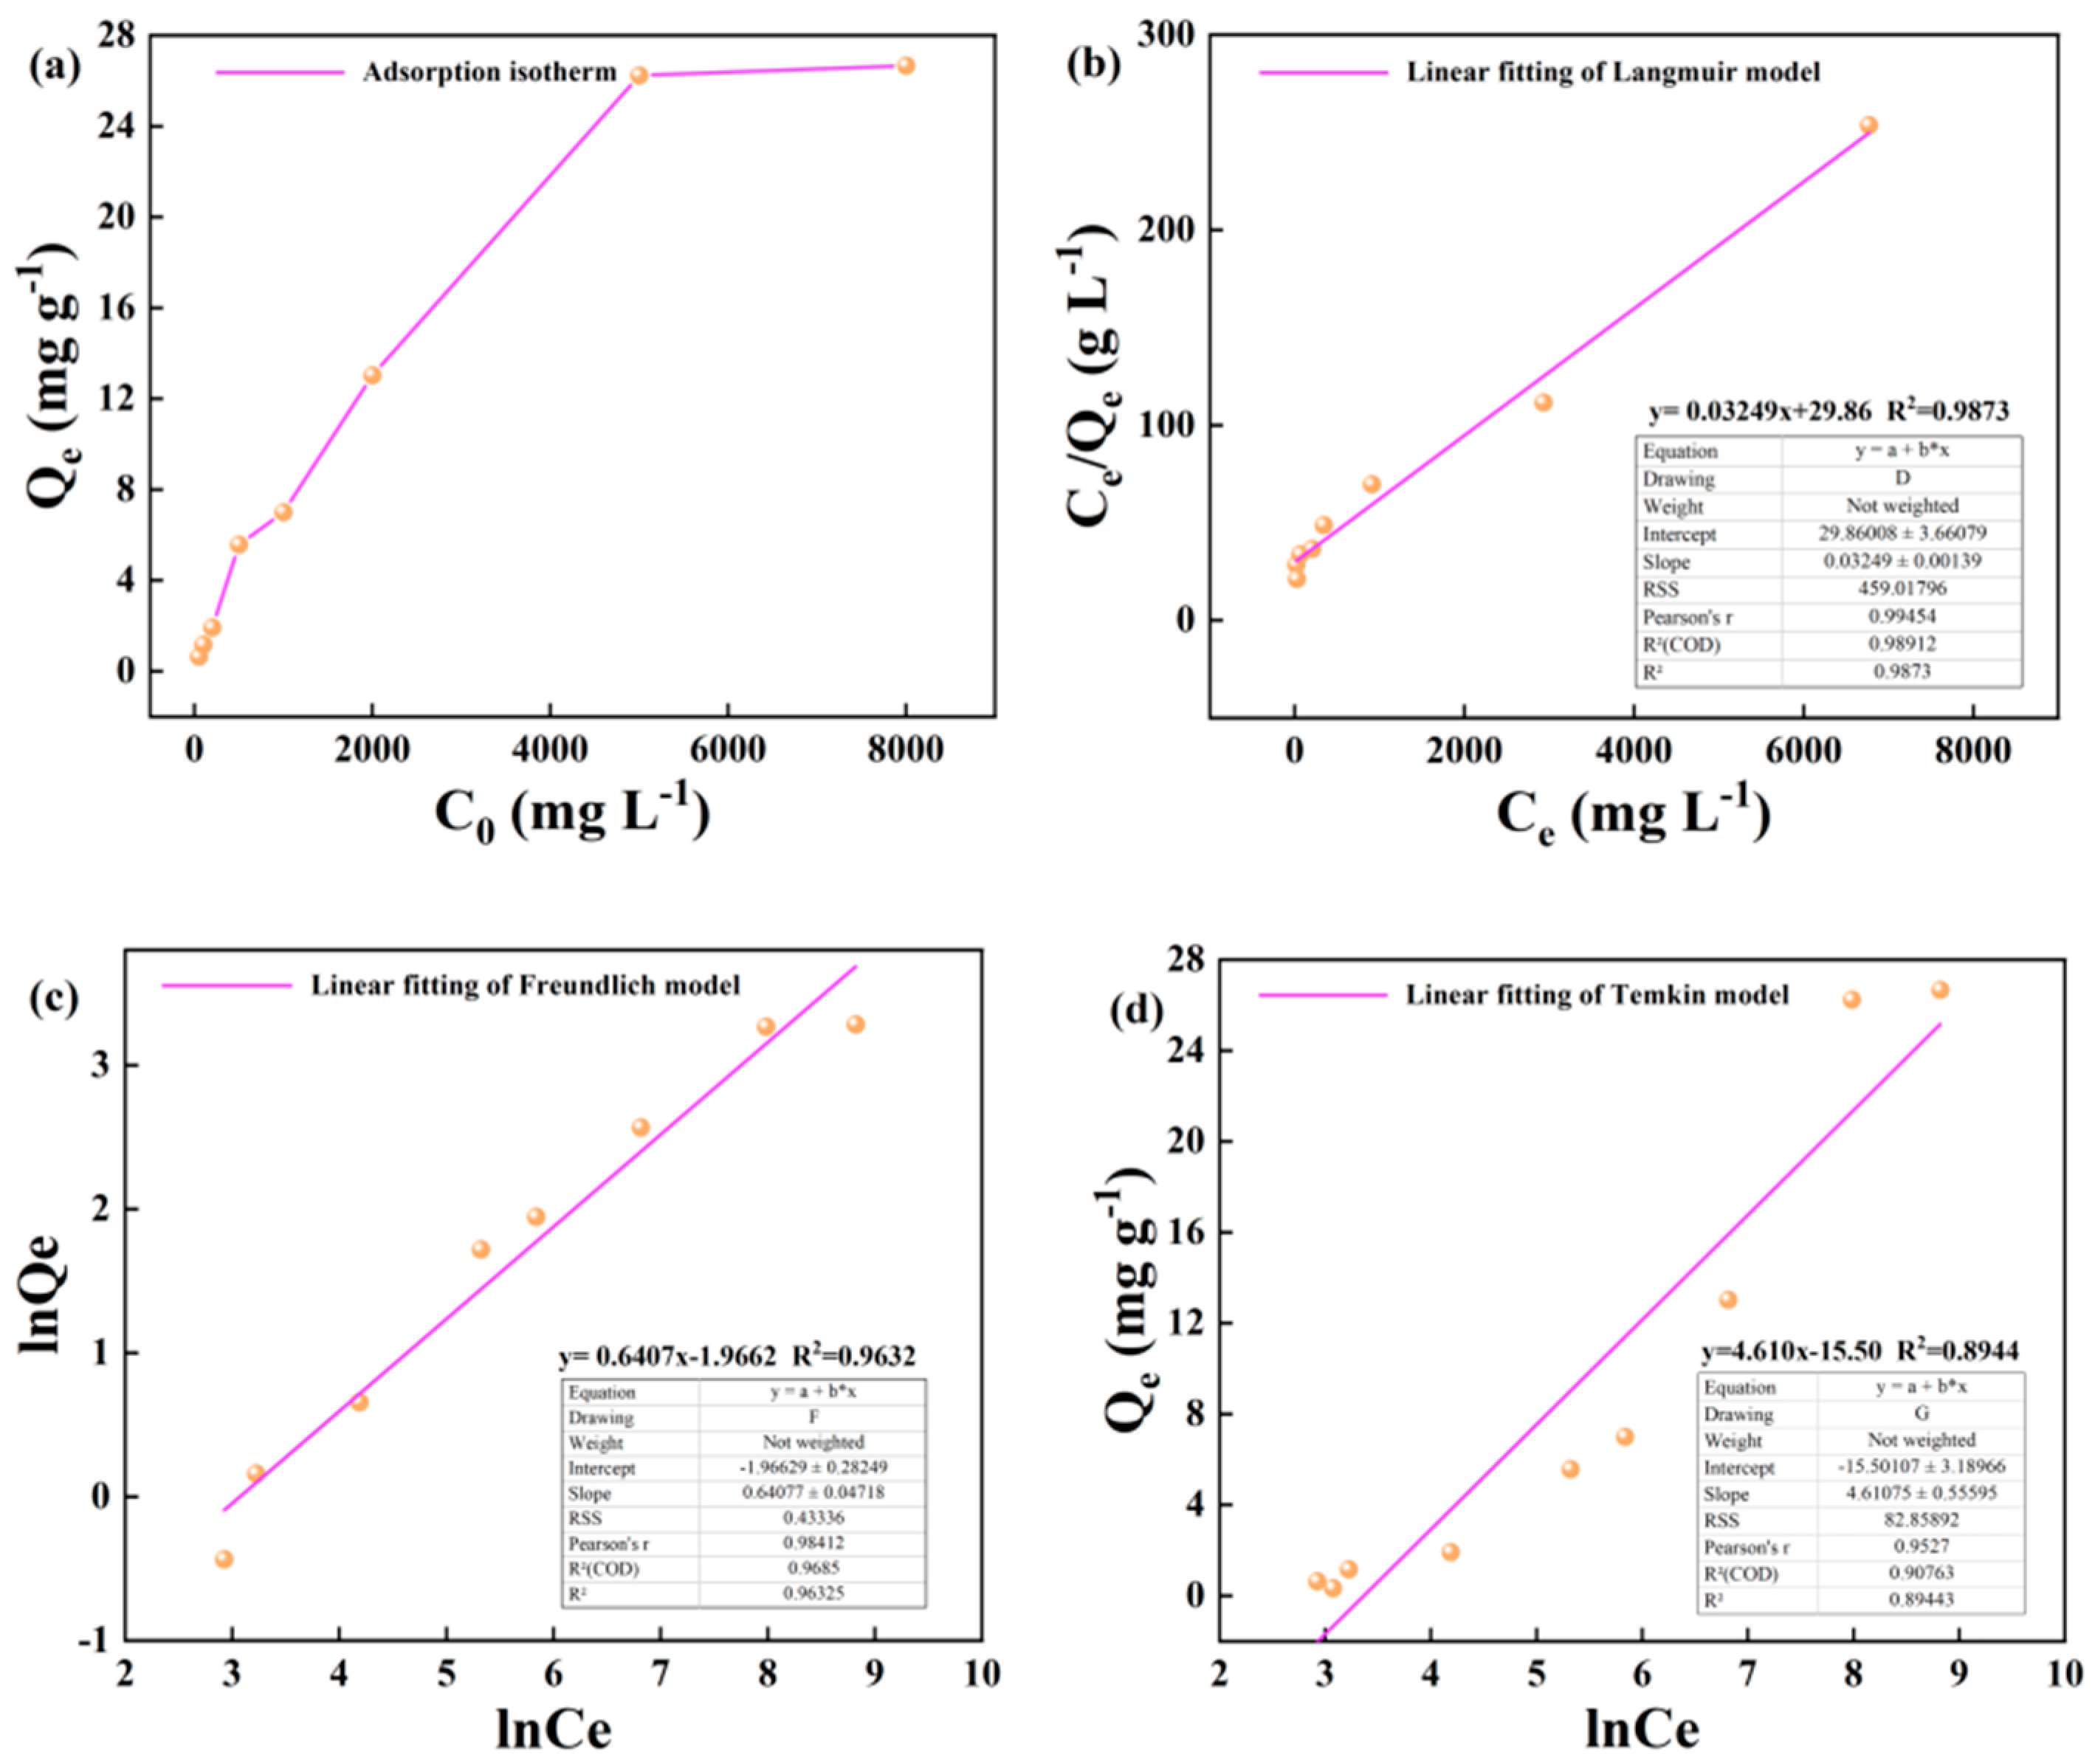
The variation of the adsorption capacity of kerogen to alkane solution at 50 °C and 60 °C with the initial concentration is shown in the figure. In the wide concentration range of 50-5000 m · L-1, the adsorption capacity of illite to heptadecane increases linearly with the increase of alkane concentration. In the high concentration range of 5000-8000 m · L-1, the growth rate of adsorption capacity of kerogen to heptadecane slowed down, but the adsorption capacity still increased linearly with the increase of the concentration of the alkane solution (
Figure 7a and
Figure 8a). The Langmuir, Freundlich and Temkin adsorption isotherms of kerogen to alkane solution at 50 °C and 60 °C are shown below (
Figure 7b–d and
Figure 8b-d).
4. Analysis and Discussion
The isothermal adsorption simulation and physical isothermal adsorption experiments based on molecular dynamics usually need to be described by mathematical models. The fitting degree is used to judge the scientificity and rigor of the adsorption process. According to the fitting correlation of different models and the applicable scope of adsorption models, the adsorption behavior and adsorption characteristics of adsorbates in adsorbents are clarified[
39].
4.1. Evaluation of Adsorption Isotherm Model
The isothermal adsorption results of illite and kerogen heptadecane solution show that with the increase of alkane concentration, the equilibrium adsorption capacity of illite and kerogen to heptadecane also increases and finally tends to be stable. At three temperature gradients of 25 °C, 50 °C and 60 °C, the Langmuir, Freundlich and Temkin model equation fitting adsorption results and related fitting parameters of illite and kerogen adsorbing heptadecane solution were calculated (
Table 6).
The mathematical model was used to evaluate the adsorption of alkane solution by illite and kerogen, respectively. The results show that the effect of temperature on the adsorption process is reflected in the molecular adsorption layer, which in turn affects the change of adsorption capacity. The calculation results of different adsorption models are different. At 25 °C, 50 °C and 60 °C, the highest fitting degrees of the three evaluation models for illite adsorption alkane solution are 0.981, 0.990, 0.981, and 25 °C. It is considered that the Langmuir isothermal adsorption model is more suitable for describing the adsorption process at 25 °C, while the Freundlich isothermal adsorption model is more suitable for describing the adsorption process at 50 °C and 60 °C. Based on the isothermal adsorption mathematical evaluation model, the application scope and description characteristics of the model are evaluated. The adsorption process at 25 °C is mainly single molecule adsorption, forming a single molecule adsorption layer. The adsorption process at 50 °C and 60 °C is mainly multi-layer adsorption, and the adsorption heat and affinity do not need to be evenly distributed on the heterogeneous surface [
39,
41].
Differently, the highest fitting degree of isothermal adsorption model to evaluate the adsorption of alkane solution by kerogen was calculated by Langmuir theory. The fitting degree of isothermal adsorption evaluation at 25 °C, 50 °C and 60 °C was 0.973, 0.982 and 0.987, respectively. The fitting analysis showed that the adsorption process of alkane solution by kerogen was mainly single molecule adsorption, forming a single molecule adsorption layer.
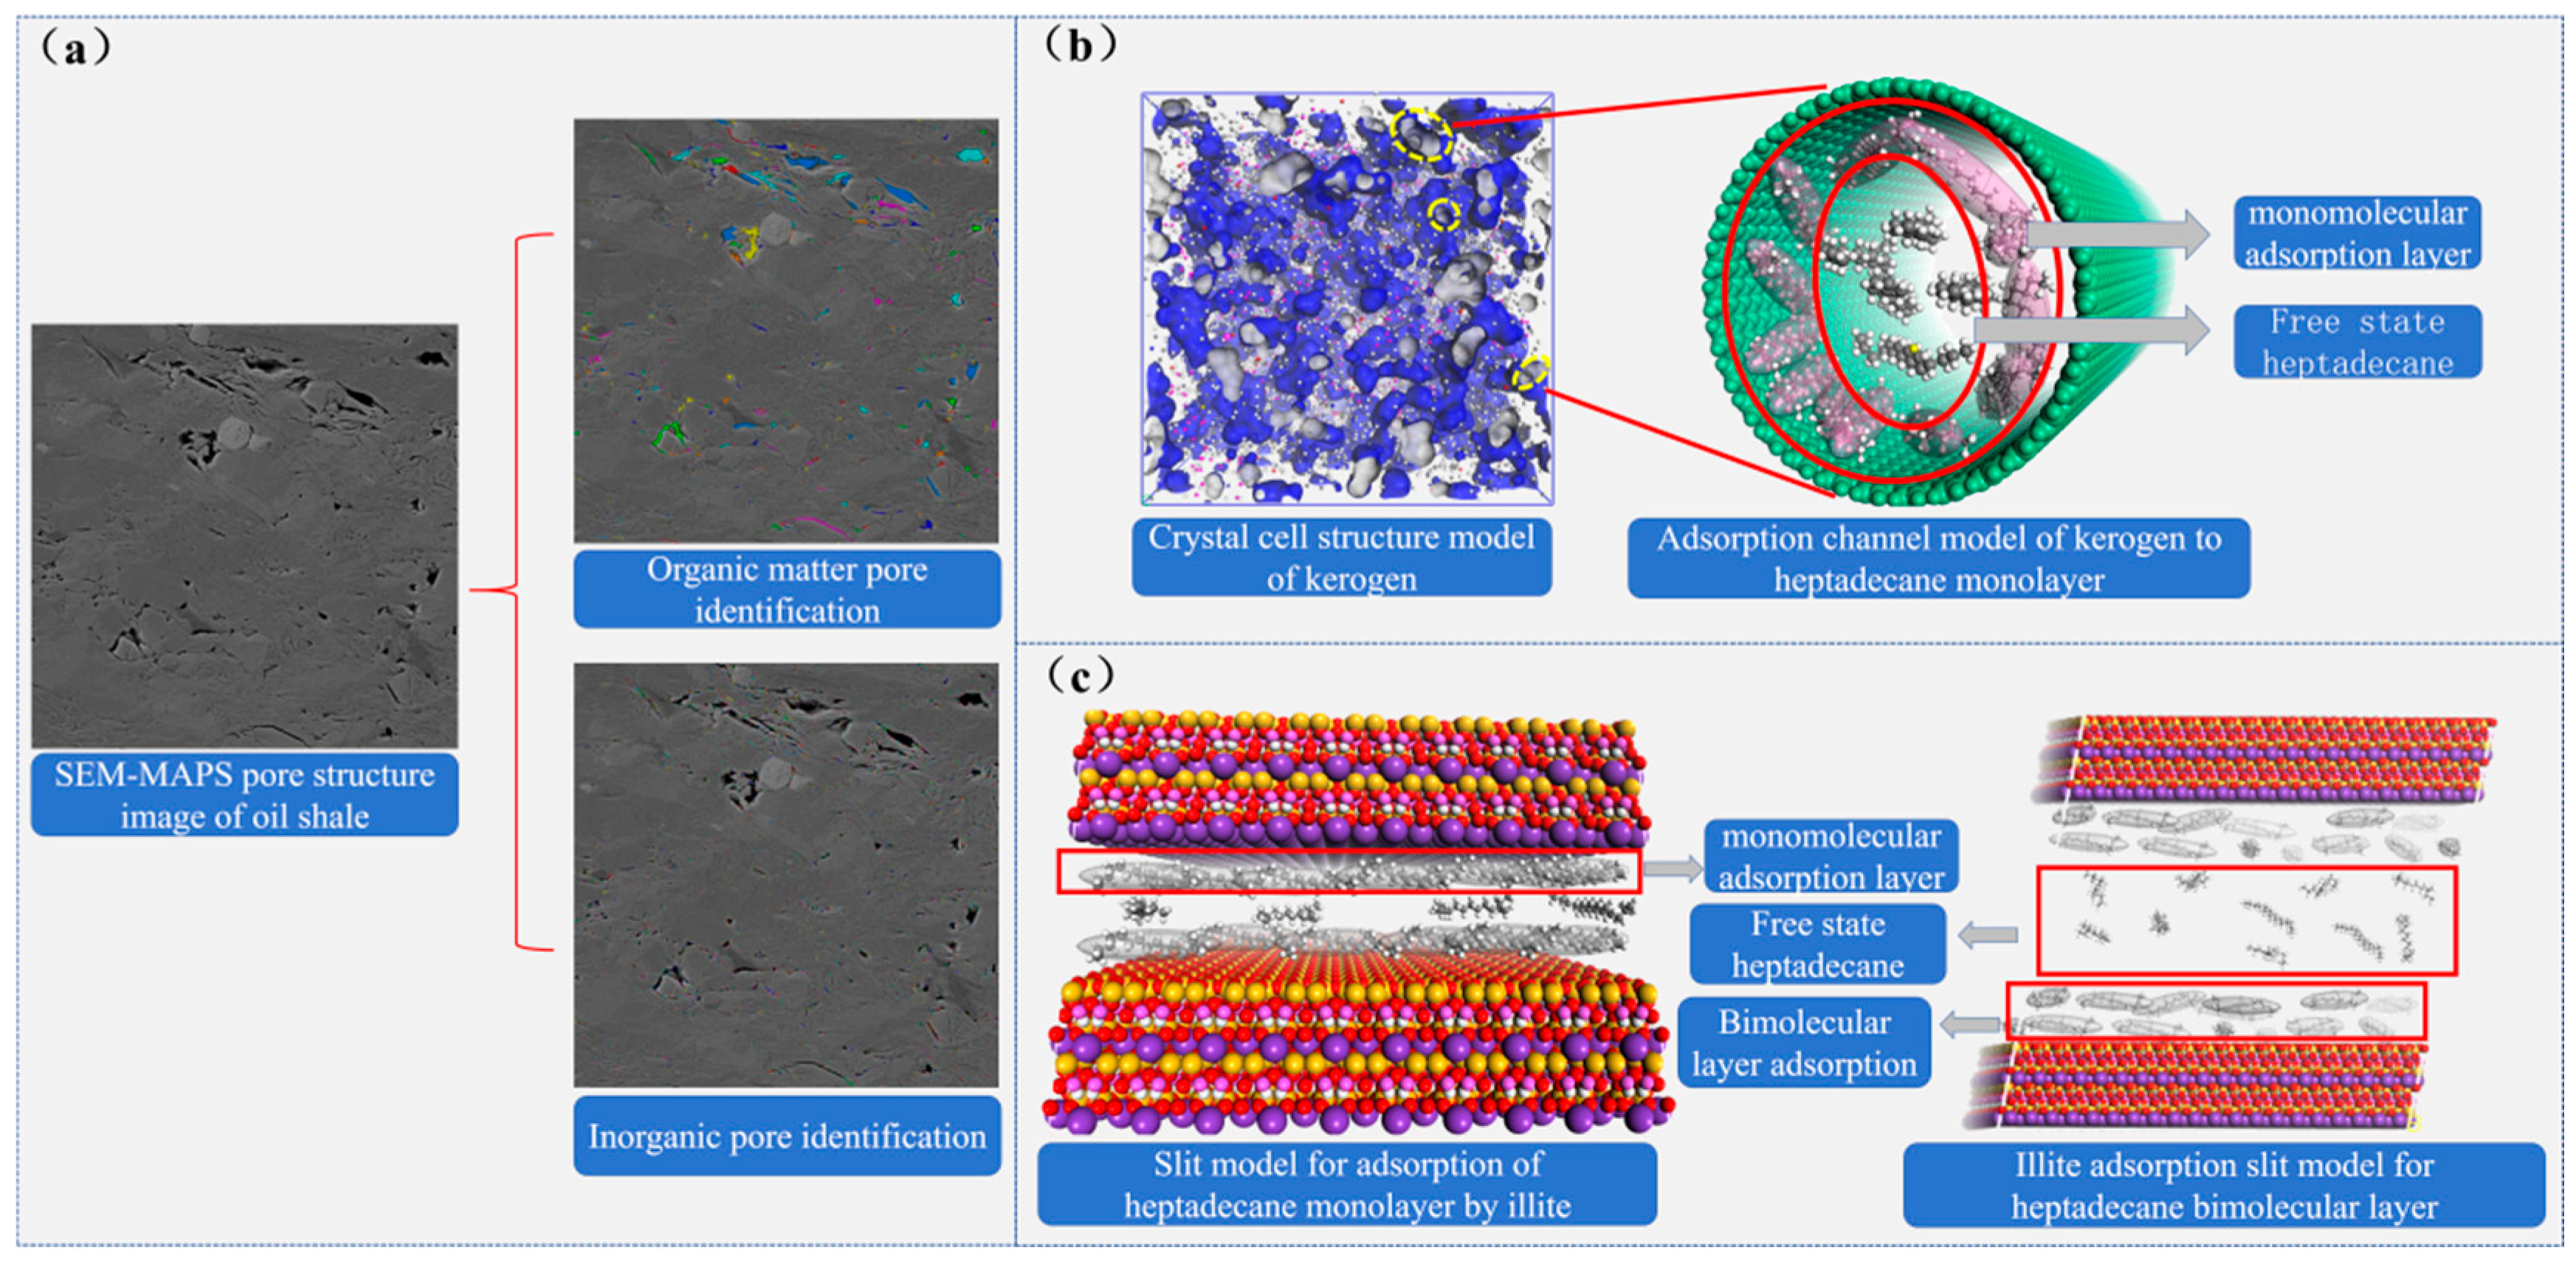
Figure 9.
Pore structure characteristics of shale and isothermal adsorption characteristics of main minerals on heptadecane (a) Classification and characterization of pore structure of oil shale based on Avizo and PerGeos image processing technology, (b) The pore structure characteristics of kerogen and the adsorption characteristics of heptadecane in circular pores. (c) The adsorption characteristics of heptadecane in illite slit pores.
4.2. Thermodynamic Evaluation of Adsorption
Based on the adsorption isotherm model and related parameters of illite and kerogen on heptadecane solution (
Table 6), the best adsorption model of illite and kerogen on heptadecane at different temperatures was selected. The equilibrium constant was calculated by the following thermodynamic relationship to obtain the standard Gibbs free energy change
)[
42,
43].
The standard enthalpy change
) and standard entropy change
) of relevant thermodynamic parameters were calculated by van 't Hoff equation and Gibbs-Helmholtz equation.
In the formula, R is the molar gas constant, 8.314 J / (mol · K); t is the thermodynamic temperature, K.
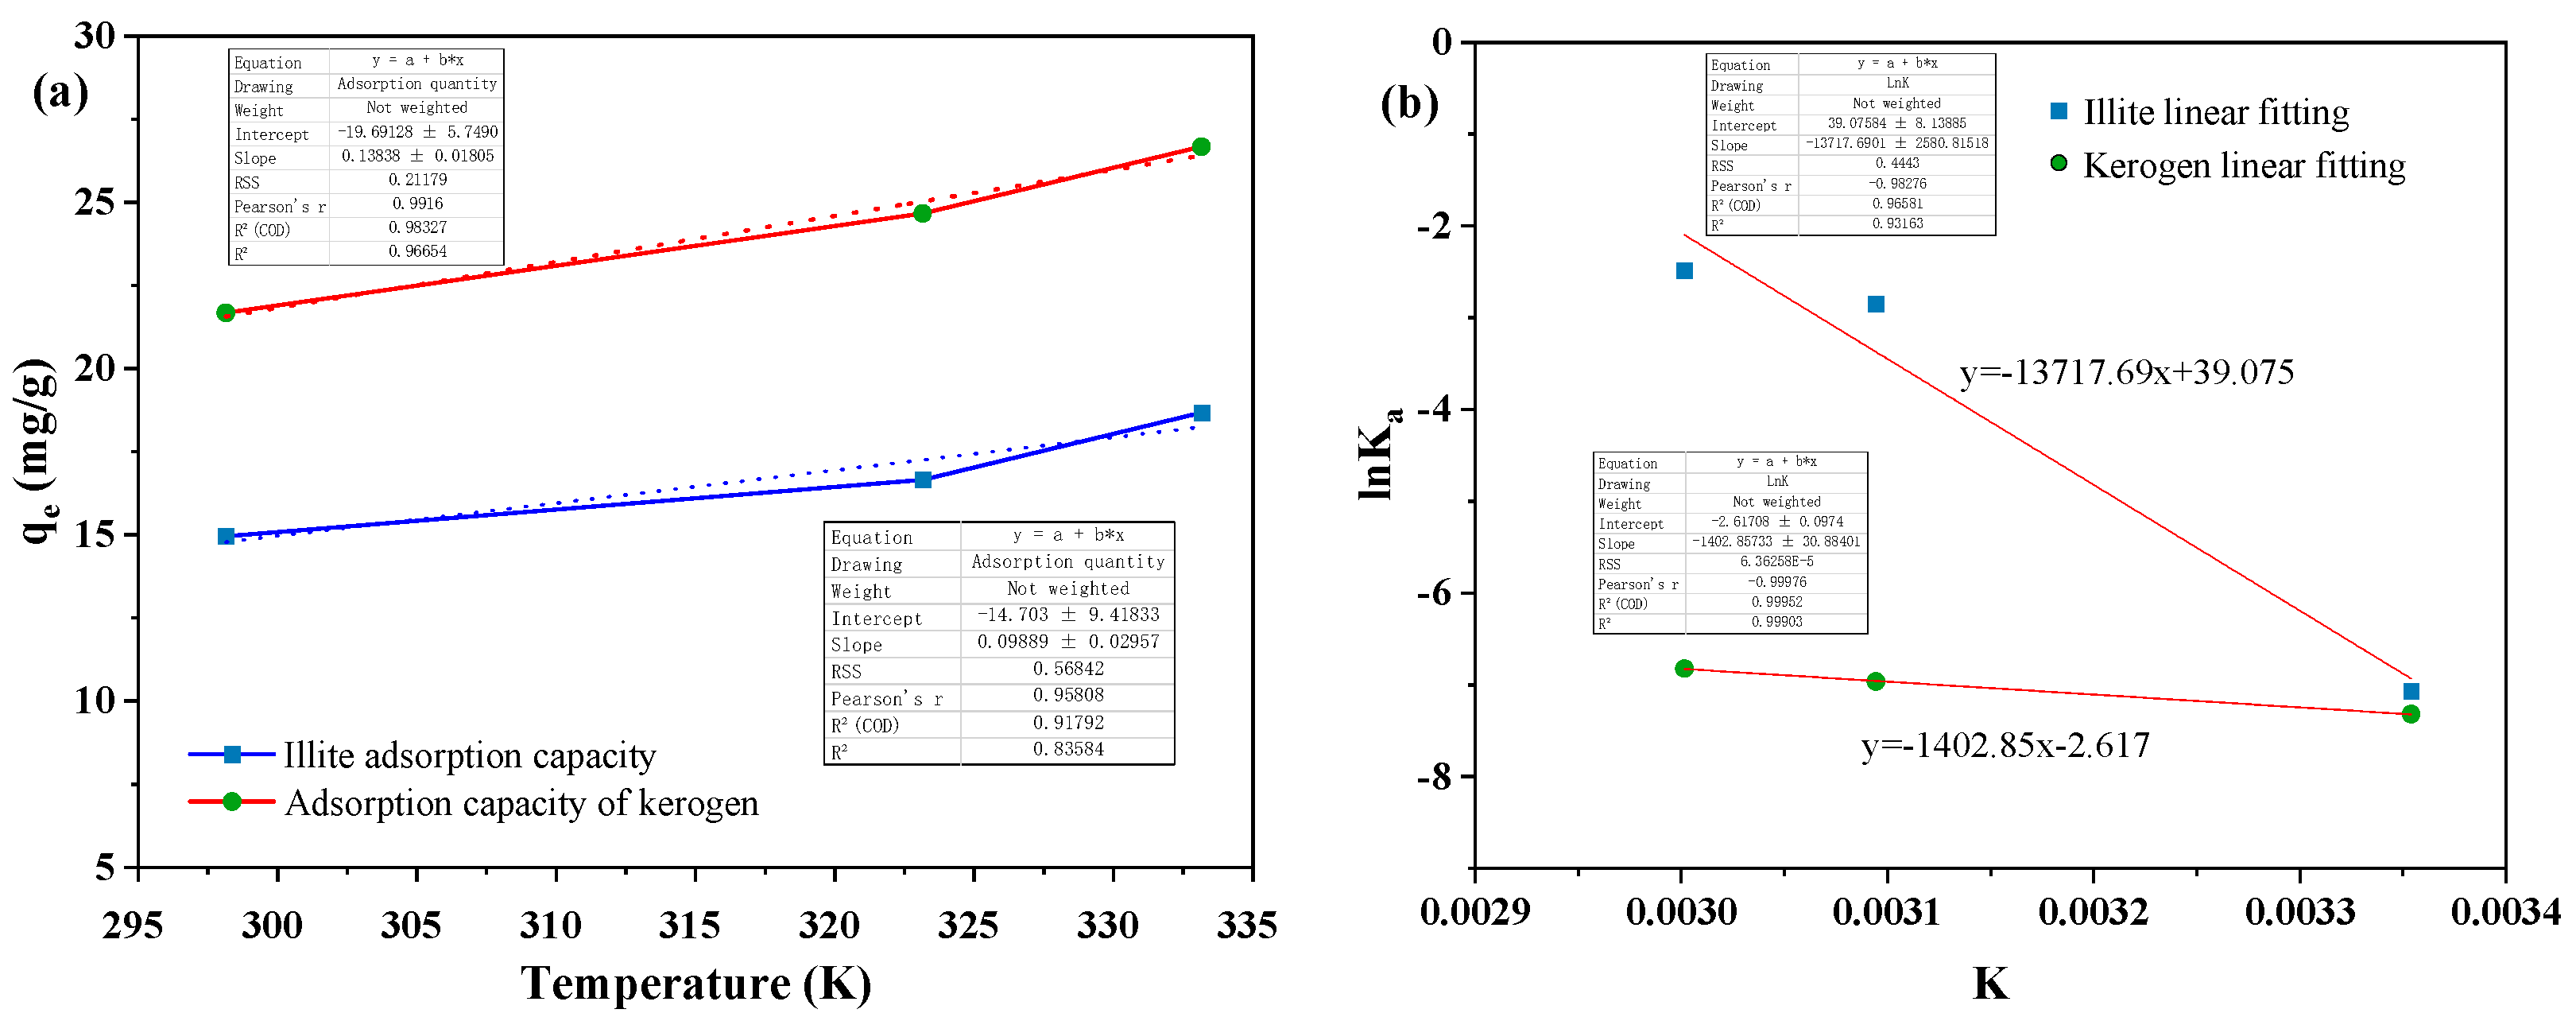
The calculation shows that the equilibrium adsorption capacity of illite and kerogen to heptadecane increases with the increase of temperature (
Figure 10a). This may be that the increase of temperature increases the collision efficiency between the adsorbate molecule and the adsorbent, and accelerates the diffusion transmission rate of the heptadecane molecule into the micropore channel inside the matrix rock, indicating that the adsorption process of illite and kerogen to heptadecane is an endothermic reaction. The increase of temperature is beneficial to the adsorption reaction and enhances the adsorption capacity of the matrix rock[
43].
The adsorption experimental data of illite and kerogen on heptadecane were analyzed, and the thermodynamic curves (
Figure 10b) were drawn with 1/T as the abscissa and the ordinate as the ordinate. Combined with the adsorption thermodynamic parameters of illite and kerogen on heptadecane at different temperatures, it was found that the standard enthalpy change in the adsorption process was always positive, indicating that the adsorption of illite and kerogen on heptadecane was an exothermic process. The increase of temperature was beneficial to the adsorption reaction, which was consistent with the results of previous adsorption isotherm experiments. At the same time, the standard entropy change of illite to heptadecane is positive, indicating that the degree of confusion is increasing during the whole adsorption reaction. However, the standard entropy change of kerogen to heptadecane is negative, indicating that the degree of confusion during the entire adsorption reaction is continuously reduced. The opposite phenomenon of the entropy change of heptadecane on the two substrates may be due to the different hydrophilic and lipophilic properties of the adsorption sites of illite and kerogen[
39,
41].
Table 12.
Thermodynamic parameters of adsorption of heptadecane by illite and kerogen.
Table 12.
Thermodynamic parameters of adsorption of heptadecane by illite and kerogen.
| Sample |
Temperature (K) |
ΔHθ (kJ/mol) |
ΔSθ (J/ (mol·K)) |
ΔGθ (kJ/mol) |
| Illite |
298.15 |
114.049 |
324.869 |
18.145 |
| 323.15 |
7.654 |
| 333.15 |
6.887 |
| Kerogen |
298.15 |
11.663 |
-21.757 |
18.146 |
| 323.15 |
18.711 |
| 333.15 |
18.899 |
5. Conclusion
In this paper, the adsorption characteristics of oil phase heptadecane solution on the surface and pore of illite and kerogen solid powder were systematically studied. The adsorption capacity of heptadecane was calculated by the concentration of alkane solution before and after adsorption. The fitting curves and adsorption equilibrium parameters of the three adsorption isotherm mathematical models of Langmuir, Freundlich and Temkin were determined by fitting. Based on the fitting equation, the fitting degree was calculated, and the influence of adsorption concentration on the adsorption process was obtained. At the same time, starting from the entropy change and enthalpy change, the reaction mechanism of temperature in the adsorption process was studied, and the difference characteristics of the adsorption of heptadecane by illite and kerogen were obtained, and the reasons for the difference characteristics were analyzed from the perspective of the physical properties of the adsorbent.
- (1)
The adsorption amount of illite and kerogen pores and surfaces increased with the increase of alkane solution concentration. At the initial adsorption stage of low concentration, the adsorption amount increased linearly with the increase of alkane concentration, and the adsorption rate slowed down with the continuous increase of alkane solution concentration. The reaction mechanism of temperature on the adsorption of heptadecane by illite and kerogen is basically the same, which almost does not affect the adsorption rate.
- (2)
Based on the mathematical model of adsorption isotherm and the evaluation of fitting parameters, it was found that the adsorption of alkane solution by illite at 25 °C conformed to the Langmuir model, which was dominated by monolayer adsorption. At 50 °C and 60 °C, the adsorption heat and affinity do not need to be evenly distributed on the heterogeneous surface, and the adsorption process is more consistent with the Freundlich model, which is dominated by multi-layer adsorption. The Langmuir model is suitable for describing the adsorption process of kerogen to alkane solution. The adsorption process is mainly based on single molecule adsorption, forming a single molecule adsorption layer.
- (3)
The adsorption process of heptadecane by illite and kerogen is an endothermic reaction. Temperature can improve the collision efficiency between adsorbate molecules and adsorbents, and accelerate the diffusion rate of heptadecane molecules into the micropores of matrix rocks, which is conducive to the adsorption reaction and enhances the adsorption capacity of matrix rocks.
- (4)
The degree of chaos in the whole process of adsorption reaction of illite to heptadecane is increasing, while the degree of chaos in the whole process of adsorption reaction of kerogen to heptadecane is decreasing. Heptadecane shows the opposite phenomenon on the two substrates, which may be due to the different hydrophilic and lipophilic properties of the adsorption sites of illite and kerogen.
Acknowledgments
The article was supported by the Chongqing Natural Science Foundation project “Study onthe microscopic influence mechanism of magmatic thermal anomaly on shale reservoirphysical properties” [No. CSTB2022NSCQ-MSX0333].
References
- MA Y, XIANG Q Y, DING K L. Development of oil shale at home and abroad[J]. World Petroleum Industry, 2024, 31 (1): 16 - 25.
- Zhijun J, Qian Z, Rukai Z, et al. Classification of lacustrine shale oil reservoirs in China and its significance[J]. Oil & Gas Geology, 2023,44 (4): 801-819. https: //doi.org/10.20944/preprints202404.0799.v1.
- Wenzhi Z, Congsheng B, Yongxin L, et al. Enrichment factors of movable hydrocarbons in lacustrine shale oil and exploration potential of shale oil in Gulong Sag, Songliao Basin, NE China[J]. Petroleum Exploration and Development, 2023, 50 (3): 455 - 467. https: //doi.org/10.1016/S1876-3804(23)60407-0.
- Ming L, Min L, Jinyou Z, et al. Evaluation of the compositions of lacustrine shale oil in China’s typical basins and its implications[J]. Oil & Gas Geology,2023,44 (6): 1479 - 1498.
- Caineng Z, Rukai Z, Dazhong D, Songtao W, et al. Scientific and technological progress,development strategy and policy suggestion regarding shale oil and gas[J]. Acta Petrolei Sinica, 2022, 43 (12): 1675 - 1686. https: //doi.org/10.7623/syxb202212001.
- Xiwu L, Xinyu W, Yuwei L, Jinqiang Z. Jiong L, Qian L. Current status and development direction of seismic prospecting technology for continental shale oil in China[J]. Acta Petrolei Sinica , 2023, 44 (12): 2270 - 2285. https: //doi.org/10.7623/syxb202312016.
- Caineng Z, Zhi Y, Rukai Z, et al. Progress in Chinas Unconventional Oil & Gas Exploration and Development and Theoretical Technologies[J]. ACTA GEOLOGICA SINICA, 2015, 89 (6): 979 - 1007. https: //doi.org/10.1111/1755-6724.12491.
- Qi C, Junqing C, Guiwu L, et al. Review on influencing factors and microscopic mechanism of shale adsorption capacity by molecular dynamics simulation[J]. Journal of Central South University (Science and Technology), 2022, 53 (09): 3474 - 3489.
- Laixing C, Tian Y, Jingchun T, et al. Advances in Studies of Development and Growth Mechanisms of Clay Minerals in Tight Sandstone Reservoirs[J]. ACTA SEDIMEN TOLOGICA SINICA, 2023, 41 (06): 1859 - 1889.
- Wei D, Jinchuan J, Fengqin W, et al. Thermodynamics and kinetics of water vapor adsorption onto shale: A case study of the Permian Shanxi Formation,Ordos Basin[J]. OIL & GAS GEOLOGY, 2021, 42 (01): 173 - 185.
- Hexin H , Rongxi L , Zhou L, et al. Comparative study of methane adsorption of Middle-Upper Ordovician marine shales in the western Ordos Basin, NW China: Insights into impacts of moisture on thermodynamics and kinetics of adsorption[J]. Chemical Engineering Journal, 2022, 446 (P4). https: //doi.org/10.1016/j.cej.2022.137411.
- TAO W. Mechanism of supercritical methane adsorption in Wufeng and Longmaxi shales from the Dongxi area, Sichuan Basin[D]. China University of Geosciences, 2023.
- FA A., Gauthier F , Amatalrhman R, et al. Marcellus shale characteristics and CO2 adsorption: equilibrium and kinetic modeling study[J]. IOP Conference Series: Earth and Environmental Science, 2022, 1003 (1). https: //doi.org/10.1088/1755-1315/1003/1/012027.
- Wei T. Study on the Adsorption Law of CH4, C2H6 and Their Binary Mixtures in Shale[D]. China University of Petroleum (Beijing), 2022.
- Zhan C, Younan L. Study on shale adsorption in Fuxian area of Ordos Basin[J]. 石油化工应用, 2023, 42 (10): 83 - 90.
- Lian P. Study on adsorption kinetics of nonionic surfactants in Bohai Oilfield. Unconventional Oil & Gas, 2023, 10 (06): 61 - 67.
- Shuling X , Manfei C , Hui Y , et al. Experimental investigation of thermodynamic and kinetic behaviors from water vapor adsorption on four typical clay minerals[J]. Gas Science and Engineering, 2023, 111. https: //doi.org/10.1016/j.jgsce.2023.204933.
- Xusong C. Study on the kinetics of adsorption of CH4 and CO2 on porous materials[D]. Chongqing University , 2022.
- Muath A , Qadeer A M S , Hamid R. A sorption-kinetics coupled dual-porosity poromechanical model for organic-rich shales[J]. Computers and Geotechnics, 2022, 147. https: //doi.org/10.1016/j.compgeo.2022.104755.
- Mingjie Z, Mingxin Y,Tianrang J, et al. Adsorption kinetic characteristics of anthracite in Longshan Mine[J]. Natural Gas Geoscience, 2022, 33 (02): 267 - 276.
- Pei X, Lixia Z, Quansheng L, et al. Isothermal adsorption properties of supercritical methane on shale[J]. Natural Gas Geoscience, 2020, 31 (09): 1261 - 1270.
- Zeyuan S. Productivity Difference of CO2 Rich Coalbed Methane Wells andAdsorption Thermodynamic Mechanism in the East of Haishiwan Coalfield[D]. HENAN POLYTECHNIC UNIVERSITY, 2022.
- Longjie M. Experimental Investigation into Simultaneous Adsorption Process of Water vapor and Methane onto Shales[D]. China University of Petroleum (Beijing), 2021.
- Wang M , Lun Z , Zhao C , et al. Influences of primary moisture on methane adsorption within Lower Silurian Longmaxi shales in the Sichuan Basin, China[J]. Energy Fuels, 2020, 34 (9): 10810 - 10824. https: //doi.org/10.1021/acs.energyfuels.0c01932.
- Shan H. The Characteristic and Influencing Factors of High-pressure Methane Adsorption on Dry Coals[D]. China University of Petroleum (Beijing), 2020.
- Zhenzhen Y , Kangle D , Chao H, et al. Adsorption of diesel oil onto natural mud shale: from experimental investigation to thermodynamic and kinetic modelling[J]. International Journal of Environmental Analytical Chemistry, 2023, 103 (15): 3468 - 3482. https: //doi.org/10.1080/03067319.2021.1910247.
- Yong D, Desheng H, Jitian Z, et al. Hydrocarbon accumulation regularities ,new fields and new types of exploration, and resource potentials in Beibuwan Basin[J]. ACTA PETROLEI SINICA, 2024, 45 (01): 202 - 225. https: //doi.org/10.7623/syxb202401012.
- Caihong Y, Donghui J, Xinghai Z, et al. Key Factors and Mode of Hydrocarbon Accumulation of Haizhong Sag in Beibu Gulf Basin[J]. OFFSHORE OIL, 2023, 43 (04): 41 - 45.
- Caineng Z, Rukai Z, Dazhong D, et al. Scientific and technological progress,development strategy and policy suggestion regarding shale oil and gas[J]. ACTA PETROLEI SINICA, 2022, 43 (12): 1675 - 1686. https: //doi.org/10.7623/syxb202212001.
- Jieqiong Z, Xiaohan L, Heng Y, et al. Shale characteristics and shale oil and gas resource potential of Liushagang Formation in Fushan sag,Beibu Gulf basin[J]. China Offshore Oil and Gas, 2022, 34 (6): 65 - 79.
- Rontani F J ,Smik L ,Divine D , et al. Gas chromatography-mass spectrometry selected ion monitoring and gas chromatography-tandem mass spectrometry selected reaction monitoring analyses of mono-, di- and tri-unsaturated Csub25/sub highly branched isoprenoid alkene biomarkers in sea ice and sediment samples: A comparative study.[J]. Rapid communications in mass spectrometry : RCM, 2024, 38 (6): e9704 - e9704. https: //doi.org/10.1002/rcm.9704.
- Naixin W, Zelong L, Jing Y, et, at. Research and Application on the Determination of Hydrocarbon Molecular Composition in Middle Distillate Oil by GC-MS[J/OL]. Acta Petrolei Sinica (Petroleum Processing Section), 1 - 13[ 2024 - 03 - 28].
- Shuling X ,Manfei C ,Hui Y , et al. Experimental investigation of thermodynamic and kinetic behaviors from water vapor adsorption on four typical clay minerals[J]. Gas Science and Engineering, 2023, 111. https: //doi.org/10.1016/j.jgsce.2023.204933.
- Yufeng C. Study on adsorption mechanism and thermodynamic model of shale gas in Micro-Nano pore [D]. CENTRAL SOUTH UNIVERSITY, 2022.
- Shangping L, Xijian L, Xing Y, et al. Optimal model of isothermal adsorption for shale gas under high temperature and high pressure[J]. CHINA MINING MAGAZINE, 2018, 27 (06): 160 - 166. https: //doi.org/10.12075/j.issn.1004-4051.2018.06.007.
- Qayyimah A A M , Farhah D M ,Belladonna M , et al. Supercritical methane adsorption measurement on shale using the isotherm modelling aspect.[J]. RSC advances, 2022, 12 (32): 20530 - 20543. https: //doi.org/10.1039/D2RA03367D.
- Wei T, Huiqin L, Qin W, et al. A New Method for Calculating the Isosteric Heat of Adsorption of CH4 on Shale Under High Pressure[J]. Contemporary Chemical Industry, 2022, 51 (08): 1916 - 1922 + 1926.
- Majd M M , Kordzadeh-Kermani V , Ghalandari V , et al. Adsorption isotherm models: A comprehensive and systematic review (2010 − 2020)[J]. Science of The Total Environment, 2022, 812: 151334. https: //doi.org/10.1016/j.scitotenv.2021.151334.
- Al-Ghouti M A , Da'ana D A . Guidelines for the use and interpretation of adsorption isotherm models: A review[J]. Journal of hazardous materials, 2020, 393: 122383. https: //doi.org/10.1016/j.jhazmat.2020.122383.
- Xiaohu D , Wenjing X ,Renjing L , et al. Insights into adsorption and diffusion behavior of shale oil in slit nanopores: A molecular dynamics simulation study[J]. Journal of Molecular Liquids, 2022, 359. https: //doi.org/10.1016/j.molliq.2022.119322.
- Yu L, Huiqin L, Yabin F, et al. Adsorption Behavior of Heavy Oil on Montmorillonite Surface by Typical Surfactant: Molecular Dynamics Simulation[J]. CHINESE JOURNAL OF COMPUTATIONAL PHYSICS, 2023, 40 (05): 583 - 596.
- Weitao W, Xiangli C, Baiqin Y. Calculation of Adsorption Thermodynamics Parameters for Adsorption on the Solid-Liquid Interface[J]. Univ. Chem, 2021, 36 (02): 233 - 240.
- Jiheng L, Liangqiong P, Lijun G, et al. Solid-liquid Adsorption Isotherm Model and Thermodynamic Parameter Calculation[J]. LEATHERSCIENCE ANDENGINEERING, 2023, 33 (06): 36 - 43.
- Jiaojiao H. Effect of temperature on adsorption efficiency of activated carbon[J]. Engineering Technology Magazine, 2021 (6): 1.
Figure 1.
Chromatogram mass spectrometry of saturated hydrocarbon of shale oil in Weixinan Sag, Beibuwan Basin. (a) Shale oil saturated hydrocarbon chromatography mass spectrometry, (b) Distribution characteristics of mineral components in organic-rich oil shale.
Figure 1.
Chromatogram mass spectrometry of saturated hydrocarbon of shale oil in Weixinan Sag, Beibuwan Basin. (a) Shale oil saturated hydrocarbon chromatography mass spectrometry, (b) Distribution characteristics of mineral components in organic-rich oil shale.
Figure 2.
Illite and kerogen oil phase adsorption experiment. (a) Illite purification and kerogen enrichment steps, (b) Illite and kerogen isothermal adsorption of heptadecane solution process.
Figure 2.
Illite and kerogen oil phase adsorption experiment. (a) Illite purification and kerogen enrichment steps, (b) Illite and kerogen isothermal adsorption of heptadecane solution process.
Figure 3.
Isothermal adsorption results of illite on heptadecane at 25℃: (a) The change of adsorption capacity with initial concentration; (b) Langmuir model fitting; (c) Freundlich model fitting; (d) Temkin model fitting.
Figure 3.
Isothermal adsorption results of illite on heptadecane at 25℃: (a) The change of adsorption capacity with initial concentration; (b) Langmuir model fitting; (c) Freundlich model fitting; (d) Temkin model fitting.
Figure 4.
Isothermal adsorption results of illite on heptadecane at 50℃: (a) The change of adsorption capacity with initial concentration; (b) Langmuir model fitting; (c) Freundlich model fitting; (d) Temkin model fitting.
Figure 4.
Isothermal adsorption results of illite on heptadecane at 50℃: (a) The change of adsorption capacity with initial concentration; (b) Langmuir model fitting; (c) Freundlich model fitting; (d) Temkin model fitting.
Figure 5.
Isothermal adsorption results of illite on heptadecane at 60℃: (a) The change of adsorption capacity with initial concentration; (b) Langmuir model fitting; (c) Freundlich model fitting; (d) Temkin model fitting.
Figure 5.
Isothermal adsorption results of illite on heptadecane at 60℃: (a) The change of adsorption capacity with initial concentration; (b) Langmuir model fitting; (c) Freundlich model fitting; (d) Temkin model fitting.
Figure 6.
Isothermal adsorption results of kerogen on heptadecane at 25 ℃: (a) The change of adsorption capacity with initial concentration; (b) Langmuir model fitting; (c) Freundlich model fitting; (d) Temkin model fitting.
Figure 6.
Isothermal adsorption results of kerogen on heptadecane at 25 ℃: (a) The change of adsorption capacity with initial concentration; (b) Langmuir model fitting; (c) Freundlich model fitting; (d) Temkin model fitting.
Figure 7.
Isothermal adsorption results of kerogen on heptadecane at 50 ℃: (a) The change of adsorption capacity with initial concentration; (b) Langmuir model fitting; (c) Freundlich model fitting; (d) Temkin model fitting.
Figure 7.
Isothermal adsorption results of kerogen on heptadecane at 50 ℃: (a) The change of adsorption capacity with initial concentration; (b) Langmuir model fitting; (c) Freundlich model fitting; (d) Temkin model fitting.
Figure 8.
Isothermal adsorption results of kerogen on heptadecane at 60 ℃: (a) The change of adsorption capacity with initial concentration; (b) Langmuir model fitting; (c) Freundlich model fitting; (d) Temkin model fitting.
Figure 8.
Isothermal adsorption results of kerogen on heptadecane at 60 ℃: (a) The change of adsorption capacity with initial concentration; (b) Langmuir model fitting; (c) Freundlich model fitting; (d) Temkin model fitting.
Figure 10.
Thermodynamic adsorption characteristics of illite and kerogen on heptadecane at different temperatures (a) Equilibrium adsorption capacity of illite and kerogen on heptadecane at three temperatures, (b) Thermodynamic adsorption curves of illite and kerogen on heptadecane at three temperatures.
Table 1.
Solid-liquid (oil phase) isothermal adsorption experimental samples.
Table 1.
Solid-liquid (oil phase) isothermal adsorption experimental samples.
| Sample Kind |
Purity/Specification |
Sample Source |
| Adsorbent |
Illite |
75-100μm |
Dehang Mineral Products Co., Ltd. |
| Kerogen |
90.51% |
Shale core debris in Weixinan Sag, Beibuwan Basin |
| Adsorbate |
Heptadecane |
AR |
Chengdu Cologne Chemicals Co., Ltd. |
| Tetrachloroethylene |
AR |
Chengdu Cologne Chemicals Co., Ltd. |
Table 2.
Alkane solution for drawing standard curve of infrared spectrophotometry.
Table 2.
Alkane solution for drawing standard curve of infrared spectrophotometry.
| Concentration (mg/L) |
20 |
40 |
60 |
80 |
100 |
| Volume (mL) |
10 |
10 |
10 |
10 |
10 |
Table 3.
Alkane solution for determination of adsorption capacity based on infrared spectrophotometry.
Table 3.
Alkane solution for determination of adsorption capacity based on infrared spectrophotometry.
| Concentration (mg/L) |
50 |
100 |
200 |
500 |
1000 |
2000 |
5000 |
8000 |
| Volume (mL) |
10 |
10 |
10 |
10 |
10 |
10 |
10 |
10 |
Table 4.
Alkane solution for drawing GC-MS standard curve.
Table 4.
Alkane solution for drawing GC-MS standard curve.
| Concentration (mg/L) |
5 |
10 |
20 |
50 |
100 |
| Volume (mL) |
10 |
10 |
10 |
10 |
10 |
Table 5.
Alkane solution for determination of adsorption capacity based on GC-MS method.
Table 5.
Alkane solution for determination of adsorption capacity based on GC-MS method.
| Concentration (mg/L) |
50 |
100 |
200 |
500 |
1000 |
2000 |
5000 |
10000 |
| Volume (mL) |
10 |
10 |
10 |
10 |
10 |
10 |
10 |
10 |
Table 6.
Related parameters of adsorption isotherm model of illite and kerogen to heptadecane solution.
Table 6.
Related parameters of adsorption isotherm model of illite and kerogen to heptadecane solution.
| Adsorbent |
Temperature/℃ |
Langmuir Model
|
Freundlich Model
|
Temkin model
|
|
KL
|
|
KF
|
n |
|
A |
|
|
| Illite |
25 |
y= 0.05742x+67.86 |
y= 0.6792x-2.9563 |
y= 2.263x-7.163 |
| 17.415 |
0.000849 |
0.981 |
0.0520 |
1.472 |
0.973 |
2.263 |
-7.163 |
0.824 |
| 50 |
y= 0.04855x+84.86 |
y= 0.6535x-2.8480 |
y= 2.3124x-7.419 |
| 20.597 |
0.00572 |
0.903 |
0.0579 |
1.530 |
0.990 |
2.312 |
-7.419 |
0.716 |
| 60 |
y= 0.04375x+65.95 |
y= 0.6271x-2.486 |
y= 2.5725x-7.747 |
| 22.857 |
0.000663 |
0.912 |
0.0832 |
1.594 |
0.981 |
2.572 |
-7.747 |
0.698 |
| Kerogen |
25 |
y= 0.03764x+56.88 |
y= 0.6986x-2.7716 |
y=3.767x-13.972 |
| 26.567 |
0.00066 |
0.973 |
0.062 |
1.431 |
0.966 |
3.767 |
-13.972 |
0.857 |
| 50 |
y= 0.03456x+36.58 |
y=0.6569x-2.2089 |
y=4.228x-14.469 |
| 28.935 |
0.00945 |
0.982 |
0.109 |
1.522 |
0.966 |
4.228 |
-14.469 |
0.879 |
| 60 |
y= 0.03249x+29.86 |
y= 0.6407x-1.9662 |
y=4.610x-15.50 |
| 30.778 |
0.00108 |
0.987 |
0.139 |
1.560 |
0.963 |
4.610 |
-15.50 |
0.894 |
|
Disclaimer/Publisher’s Note: The statements, opinions and data contained in all publications are solely those of the individual author(s) and contributor(s) and not of MDPI and/or the editor(s). MDPI and/or the editor(s) disclaim responsibility for any injury to people or property resulting from any ideas, methods, instructions or products referred to in the content. |
© 2024 by the authors. Licensee MDPI, Basel, Switzerland. This article is an open access article distributed under the terms and conditions of the Creative Commons Attribution (CC BY) license (http://creativecommons.org/licenses/by/4.0/).
