Preprint
Article

Exploring the Immunomodulatory Potential of Pancreatic Cancer-Derived Extracellular Vesicles through Proteomic and Functional Analyses

Altmetrics

Downloads

144

Views

63

Comments

0

A peer-reviewed article of this preprint also exists.

Submitted:

11 April 2024

Posted:

15 April 2024

You are already at the latest version

Alerts
Abstract
Pancreatic cancer (PC) has a poor prognosis and displays resistance to immunotherapy. A better understanding of tumor-derived extracellular vesicles (EVs) effects on immune responses might contribute to improved immunotherapy. EVs derived from Capan-2 and BxPC-3 PC cells isolated by ultracentrifugation were characterized by atomic force microscopy, western blot (WB), nanoparticle tracking analysis and label-free proteomics. Fresh PBMCs from healthy donors were treated with PC- or control-derived heterologous EVs followed by flow cytometry analysis of CD8+ and CD4+ lymphocytes. Proteomics of lymphocytes sorted from EV-treated, or -untreated PBMCs was performed and IFN-γ concentration was measured by ELISA. Notably, most of the proteins identified in Capan-2 and BxPC-3 EVs by proteomic analysis were connected in a single functional network (p=1x10-16) and were involved in “Immune System” (FDR: 1.10x10⁻²⁴ and 3.69x10⁻¹⁹, respectively). Interestingly, treatment of healthy donor-derived PBMCs with Capan-2 EVs, but not with BxPC-3 EVs or heterologous control EVs induced early activation of CD8+ and CD4+ lymphocytes. Proteomics of lymphocytes sorted from EV-treated PBMCs was consistent with their activation by Capan-2 EVs, indicating IFN-γ among major upstream regulators, as confirmed by ELISA. Proteomic and functional analyses indicate that PC-EVs have pleiotropic effects, and some may activate early immune response, which might be relevant for the development of highly needed immunotherapeutic strategies in this immune-cold tumor.
Keywords: 
Subject: Biology and Life Sciences  -   Immunology and Microbiology

1. Introduction

Pancreatic cancer (PC) is one of the most aggressive and lethal cancers, with a dismal prognosis. Survival rates for PC patients are among the lowest for solid tumors, with a 5-year survival rate of about 10% [1]. PC exhibits limited or no response to chemotherapy and radiotherapy and is resistant to immunotherapy, although this therapeutic approach has shown promising results for various malignant tumors [2]. PC is a poorly immunogenic tumor characterized by an immunosuppressive microenvironment with an imbalance in the number of immune cells, such as immunosuppressive T regulatory cells (Treg), M2 polarized tumor-associated macrophages and myeloid-derived suppressor cells (MDSCs) that prevail over cytotoxic CD8 T cells and dendritic cells [1]. Extracellular vesicles (EVs) are released by almost all cell types in various biological fluids and in cell culture supernatants [3,4]. They deliver specific biological signals to recipient cells and act as crucial regulators of organized cell communities in several physiological and pathological processes, including cancer [3,4,5]. In particular, EVs are involved in initiation, progression, and metastasis of different types of tumors and in mechanisms related to tumor microenvironment (TME) remodeling [4,6]. EVs have also emerged as significant regulators of the immune system, with the potential to inhibit or activate immune response [7]. Several studies analyzed the role of tumor-derived small EVs and found that they may directly suppress the proliferation and activation of CD8+ T cells [8,9]. Moreover, EVs favor immunosuppressive TME by inducing the differentiation of monocytes into MDSCs and by stimulating the expansion of Tregs, thus causing suppression of effector T cells [9]. In addition, tumor-derived EVs promote polarization of macrophages into an M2-like phenotype contributing to an environment that supports tumor growth, angiogenesis, and tissue remodelling [10]. Also, PC-derived EVs were found to suppress immune response by regulating various immune cells and processes [2,11]. In particular, it was reported that the uptake of PC-derived exosomes by isolated T lymphocytes may induce ER stress-mediated apoptosis of pre-stimulated T lymphocytes [12]. Moreover, PC-EVs compromise DC antigen presentation, thereby impairing their ability to activate CD4+ T cells, promote the expansion of suppressor MDSCs in the TME, and polarize macrophages into the M2-phenotype [2,13,14]. Intriguingly, opposite to their immunosuppressive activity, EVs derived from several malignancies, such as T-cell lymphoma, melanoma, and colon carcinoma were shown to induce immune activation of NK antitumor-cytotoxic activity and to activate dendritic cells, thereby priming the immune system to kill cancer cells [15,16,17]. Notably, cancer EVs can present tumor antigens to dendritic cells, thereby triggering the activation of T cells that inhibit tumor progression [18,19]. In fact, exosomes derived from colon carcinoma, mammary carcinoma, mesothelioma, mastocytoma, and chronic myeloid leukemia were used to load dendritic cells triggering T-cell–mediated antitumor immune responses, which led to rejections of autologous tumors and strong inter-tumor cross-protection in mice [19]. Notably, not all tumor-derived exosomes were effective in triggering antitumor immune responses [19]. At present, most studies on EVs derived from pancreatic cancer cells focused on their immunosuppressive potential, whereas it is unknown whether PC-derived EVs, in their native state, possess also an intrinsic immune-stimulatory potential. In this regard, a previous study showed that EVs derived from PANC-1 cell line, after depletion of miRNA cargo, had immunostimulatory effects. After this manipulation, PANC-1-derived EVs gained a dendritic cell-mediated immune stimulatory effect on cytokine-induced killer cells (CIKs), greater than unmanipulated EVs and comparable to that obtained by stimulating dendritic cells with LPS [20]. However, the intrinsic stimulatory activity of unmanipulated PC-derived EVs was not evaluated in that study. The immunomodulatory role of PC-derived EVs on T lymphocytes within the context of peripheral blood mononuclear cells (PBMCs) was not explored before. Considering that this experimental condition may reflect physiological conditions where T lymphocytes can interact with costimulatory cells [21], we analyzed the effect of PC-derived EVs in this context. Using multiple approaches, including proteomic profiling of PC-derived EVs, treatment of PBMCs with these EVs followed by functional and proteomic analysis of CD3 lymphocytes, we observed that PC-derived EVs expressed immunomodulatory proteins and had immunostimulatory or no effect on CD4+ and CD8+ lymphocytes, depending on the cell line from which they were derived.

2. Materials and Methods

2.1. Cell line and Cultures

Human pancreatic cancer (PC) cell lines Capan-2 and BxPC-3 were purchased from Cell Lines Service ATCC (American Type Culture Collection). PC cell lines were cultured in RPMI 1640 supplemented with 10% fetal bovine serum, 1% Pen/Strep, and 1% L-glutamine (Sigma-Aldrich, Saint Louis, MO, USA). To obtain PC extracellular vesicles (EVs) from Capan-2 or BxPC-3, cells (8x10⁶) were seeded in T175 cell culture flasks and the following day, media was replaced with RPMI 1640 supplemented with FBS exosome-depleted by ultracentrifugation, according to Beckman Coulter protocol. Culture media for EV isolation were collected after 72 hours.

2.2. EV Isolation

Extracellular vesicles from conditioned media (EVs) were isolated by sequential centrifugations and ultracentrifugations, essentially according to the protocol previously described by Théry, with some modifications [22]. Briefly, the first steps were performed to eliminate large dead cells and large cell debris by successive centrifugations at increasing speeds. At each of these steps, pellet was thrown away and supernatant was used for the following step. Final supernatant was ultracentrifuged at 100.000xg to pellet EVs [22]. EVs pellet was resuspended in 100-200 µl of RPMI 1640 with exosome depleted FBS.

2.3. EV Characterization

2.3.1. Nanoparticle Tracking Analysis (NTA)

The size of EVs was determined by ZetaView instrument (Particle Metrix GmbH, Germany), which is equipped with fast video capture and nanoparticle tracking software.

2.3.2. Atomic Force Microscopy Analysis (AFM)

In order to investigate the size distribution and the morphology of the isolated EVs, Atomic Force Microscopy (AFM) analysis was performed by using MultiMode 8 AFM microscope with Nanoscope V controller (Bruker, Billerica, Massachusetts, US). Samples were prepared by depositing a drop of diluted suspensions of isolated vesicles on SiO2 wafer followed by drying in the oven at 37°C for 2h and then at room temperature overnight. These preparations were scanned by the silicon RTESPA-150 probe (rectangular geometry, cantilever resonance frequency 150 kHz and nominal spring constant 5 N/m) in TappingMode™ in air. Images of 512 x 512 pixels were collected with different scan sizes of 1.5 µm2 and were elaborated using NanoScope Analysis 1.8 software (Bruker).

2.3.3. Western Blot Analysis

Cells and EVs were collected and lysed in RIPA buffer (Sigma, St. Louis, MO, USA) supplemented with protease and phosphatase inhibitor cocktail, and phenylmethanesulfonyl fluoride (PMSF, Sigma, St. Louis, MO, USA). Protein concentrations were determined by the BCA Protein Assay (Thermo Scientific, Rockford, IL, USA) and 40 μg were subjected to electrophoresis followed by immunoblotting as previously described [23]. Mouse monoclonal CD81 and Cytochrome C antibodies were obtained from Santa Cruz Biotechnology, Inc. (Dallas, TX, USA). Mouse monoclonal CD63 and rabbit monoclonal Flotillin-1 antibodies were purchased from Invitrogen (Thermo Fisher Scientific, Waltham, MA, USA) and from Cell Signaling Technology, Inc. (Beverly, MA, USA), respectively. Blots were revealed by chemiluminescence using Westar ηC Ultra 2.0 chemiluminescence substrate (Cyanagen, Bologna, Italy).

2.4. Peripheral Blood Mononuclear Cells (PBMCs) Purification and Counts

Peripheral blood mononuclear cells (PBMCs) were isolated from fresh whole blood of healthy donors by density gradient centrifugation using Ficoll-Paque PLUS (GE Healthcare, Chicago, IL, USA) as previously reported [24]. PBMCs were stained using 10 µl of 7-Amino Actinomycin D (7-AAD, Via-Probe, BD Biosciences, Cat. 555815) and concentrations of viable PBMCs (7-AAD- events) were obtained by flow cytometry, using a FACSVerse analyzer equipped with a volumetric count module (BD, Becton-Dickinson Biosciences, San Jose, CA). All procedures involving human participants were carried out in accordance with the ethical standards of the 1964 Helsinki Declaration and its later amendments or with comparable ethical standards. This study was approved by the local ethics committee (V 1.0, 25 February 2016; V. 2.0, 21 January 2020). All human participants gave written informed consent.

2.5. Flow Cytometry Analysis

As described above, we treated fresh PBMCs of healthy donors with EVs derived from PC cells (Capan-2 or BxPC-3) or with EVs derived from CD3+ of healthy donor. After treatment, PBMCs were collected in PBS and stained at room temperature in the dark for 30 min with the mix summarized in supplementary table 1. After labeling, the samples were washed in PBS by centrifugation at 1500 rpm for 10 min, to remove excess antibodies. The gating strategy and the evaluation of non-specific fluorescence were determined by fluorescence minus one (FMO) controls [25]. Data were acquired with FACSVerse analyzer equipped with a volumetric count module (BD Biosciences, San Jose, CA, USA) and Cytoflex (Beckman Coulter, California, USA).

2.6. Treatment of PBMCs with Capan-2 or Control Heterologous EVs and Fluorescence Activated Cell Sorting of CD3+ Lymphocytes

Fresh PBMCs of healthy donors were seeded in 6-well plates (5x10⁶ cells/well) in RPMI 1640 supplemented with 10% exosome-depleted FBS (according to Beckman Coulter protocol). Heterologous control EVs from healthy donors were freshly isolated after 24 hours of colture by ultracentrifugation from conditioned media of PBMCs, as described above for PC EVs. PBMCs from healthy donors were treated for 48 hours with 150 μg of EVs derived both from Capan-2 or heterologous control EVs. After EV treatment, PBMCs were stained using an allophycocyanin conjugated anti-CD3 (3 μL), followed by washing and fixing with Cytofix/Cytoperm (BD Bioscience, San Jose, CA, USA Cat. 554714) 1x for 15 min. CD3+ lymphocytes were then isolated (100 μm nozzle) by fluorescence-activated cell sorter (FACS, FACSAria III, BD Biosciences) [26] and were subjected to proteomic analysis. A purity of at least 90% was achieved for each isolated population.

2.7. Label-Free Proteomic Analysis

To evaluate the protein cargo of Capan-2 or BxPC-3 derived EVs, 30 μg proteins from extracellular vesicle lysate were employed for proteomics investigation. Proteomic analysis was conducted also on CD3+ 1x10⁶ lymphocytes sorted from Capan-2 EV-treated PBMCs. Samples were prepared for Filter Aided Sample Preparation (FASP) protocol. Lymphocytes were lysed by sonication on ice (Sonicator U200S control, IKA Labortechnik, Staufen, Germany) at 70% amplitude in a lysis buffer (urea 6 M in 100 mM Tris/HCl, pH = 7.5) to carry out an overnight tryptic digestion at 37°C. Tryptic peptides were analyzed in triplicate by LC-MS/MS using the UltiMateTM 3000 UPLC (Thermo Fisher Scientific, Milan, Italy) chromatographic system coupled to the Orbitrap FusionTM TribridTM (Thermo Fisher Scientific, Milan, Italy) mass spectrometer. Peptides were loaded on the Trap Cartridge C18 (0.3 mm ID, 5 mm L, 5 μm PS, Thermo Fisher Scientific) and then separated on an EASY-spray AcclaimTM PepMapTM C18 (75 μm ID, 25 cm L, 2 μm PS, Thermo Fisher Scientific) nanoscale chromatographic column. Mobile phase A was 0.1% formic acid in H2O and mobile phase B was 0.1% formic acid in acetonitrile. The flow rate was set at 300 nL/min, with a total run time of 65 min using a chromatographic gradient from 2% to 90% of phase B. Proteomic data were acquired in positive-ion polarity with Data Dependent Acquisition (DDA) mode to trigger precursor isolation and MS2 sequence using N2 as collision gas for HCD fragmentation. The analytical method specifications were related to MS1 scans which were performed in the Orbitrap analyzer covering a m/z range of 375-1500 with 240,000 of resolution and the signal intensity threshold was set to 1x10⁴. Precursor ions with charges of +2 to +5 were used for MS2 sequencing and scanned in the ion trap with the following parameters: MS2 isolation window of 1.6 Da, normalized AGC target of 150%, dynamic exclusion time of 60s and mass tolerance of ±10 ppm. In this case, a HCD fragmentation with a fixed collision energy of 30 and an activation time of 10ms was performed by covering a m/z range of 300-1200.

2.8. Bioinformatics and Proteomics Data Processing

Proteomics MS/MS raw data were processed using a free computational platform, MaxQuant version 1.6.10.50 (Max-Planck Institute for Biochemistry, Martinsried, Germany). Peak lists were searched using Andromeda peptide search engine against the UniProt database (released 2020_06, taxonomy Homo Sapiens, 20,588 entries) supplemented with frequently observed contaminants and containing forward and reverse sequences. As already reported in our previous works [27,28,29] , carbamidomethylation of cysteines (C) was defined as fixed and quantification modification, while oxidation of methionines (M) and deamidation of asparagines (N) and glutamines (Q) were set as variable modifications. False discovery rate (FDR) was set to 1% both for protein and for peptide levels. Match-between-runs (MBR) algorithm was used to transfer the peptide identifications from one LC-MS/MS run to all others using its default settings (match window of 0.7 min and alignment time of 20 min). LFQ Intensities were used to quantify protein abundance in each sample. Bioinformatics analysis was performed with Perseus version 1.6.10.50 (Max-Planck Institute for Biochemistry, Martinsried, Germany). Protein abundance parameters were log2 transformed to facilitate the calculation of the protein expression. Site only, reverse and contaminant peptides were removed from the dataset. For each comparison, the minimum number of valid values accepted was set at 2 in at least one group. In this way we have evaluated not only the different protein expression, but also the presence and absence of proteins between the different treatment conditions. Protein ratios were used for the Gene Ontology and functional enrichment analysis through Ingenuity Pathway Analysis tool (IPA, Qiagen, Hilden, Germany) and STRING. Briefly, IPA is able to predict the activation (z-scores ≥ 2.0) or inhibition (z-scores ≤ -2.0) of transcriptional regulators or downstream for the loaded dataset basing on prior knowledge of expected effects from published literature citations stored in the IPA system [30]. Comparison Analysis was used to identify similarities or different trends between the various comparative proteomics results. Using IPA, we compared the upstream and downstream effects induced by Capan-2-derived EVs in CD3 (Capan-2 EV treated/untreated CD3), versus those induced by heterologous control EVs (Control EV treated/untreated CD3). Pathway enrichment in EV proteomic analysis was evaluated both by IPA and STRING (v. 12; https://string-db.org/).

2.9. Elisa Assay

INF-γ concentrations were measured in supernatants of EV-treated or untreated PBMCs by Human INF-γ ELISA Kit, according to manufacturer instructions (Invitrogen by Thermo Fisher Scientific, MA, USA). PBMCs were isolated from three different healthy donors. Photometric measurements were performed at specific wavelength of 450nm and 550nm by Infinite F50 absorbance plate reader (Tecan, Switzerland). INF-γ concentration values were obtained by interpolation with a standard curve created using standards at known and increasing concentrations of INF-γ.

2.10. Statistical Analysis

Statistical analyses were performed using GraphPad Prism version 5.01 software (San Diego, CA). Comparisons of mean values were performed by an unpaired Student’s t-test. A p-value ≤ 0.05 was considered statistically significant (*p < 0.05; **p < 0.01; ***p < 0.001; ****p < 0.0001).

3. Results

3.1. Characterization of EVs Derived from Pancreatic Cancer Cell Lines

Human pancreatic cancer cell lines Capan-2 and BxPC-3 were cultured, and extracellular vesicles (EVs) were isolated by sequential centrifugations and ultracentrifugations. EVs derived from Capan-2 and BxPC-3 were characterized by Atomic Force Microscopy (AFM) for the evaluation of their size and integrity. Most of the EVs derived from the two PC cell lines showed globular shape and were in isolated form (Figure 1, Panel A and B). Diameter and size distribution of EVs were measured by Nanoparticle Tracking Analysis (NTA). According to NTA, EVs derived from Capan-2 or BxPC-3 showed an average diameter of 241 nm and 137 nm respectively, falling within the size range detected by AFM (Figure 1, Panel A and B). EVs were further characterized by Western blot analysis for three positive protein markers of EVs and for one EV negative protein marker, according to MISEV2018 and MISEV2023 guidelines [31,32]. EVs derived from Capan-2 or BXPC-3 expressed CD63 and CD81 tetraspanins and the cytosolic Flotillin-1 protein (Figure 1, Panel C), while Cytochrome C was exclusively detectable in cell lysate of the PC cell lines and absent from EV fractions (Figure 1, Panel C). These results indicated that the EV preparation was not contaminated with elements of cellular organelles or by apoptotic blebs.

3.2. Proteomic Analysis of Capan-2 and BxPC-3 Derived EVs

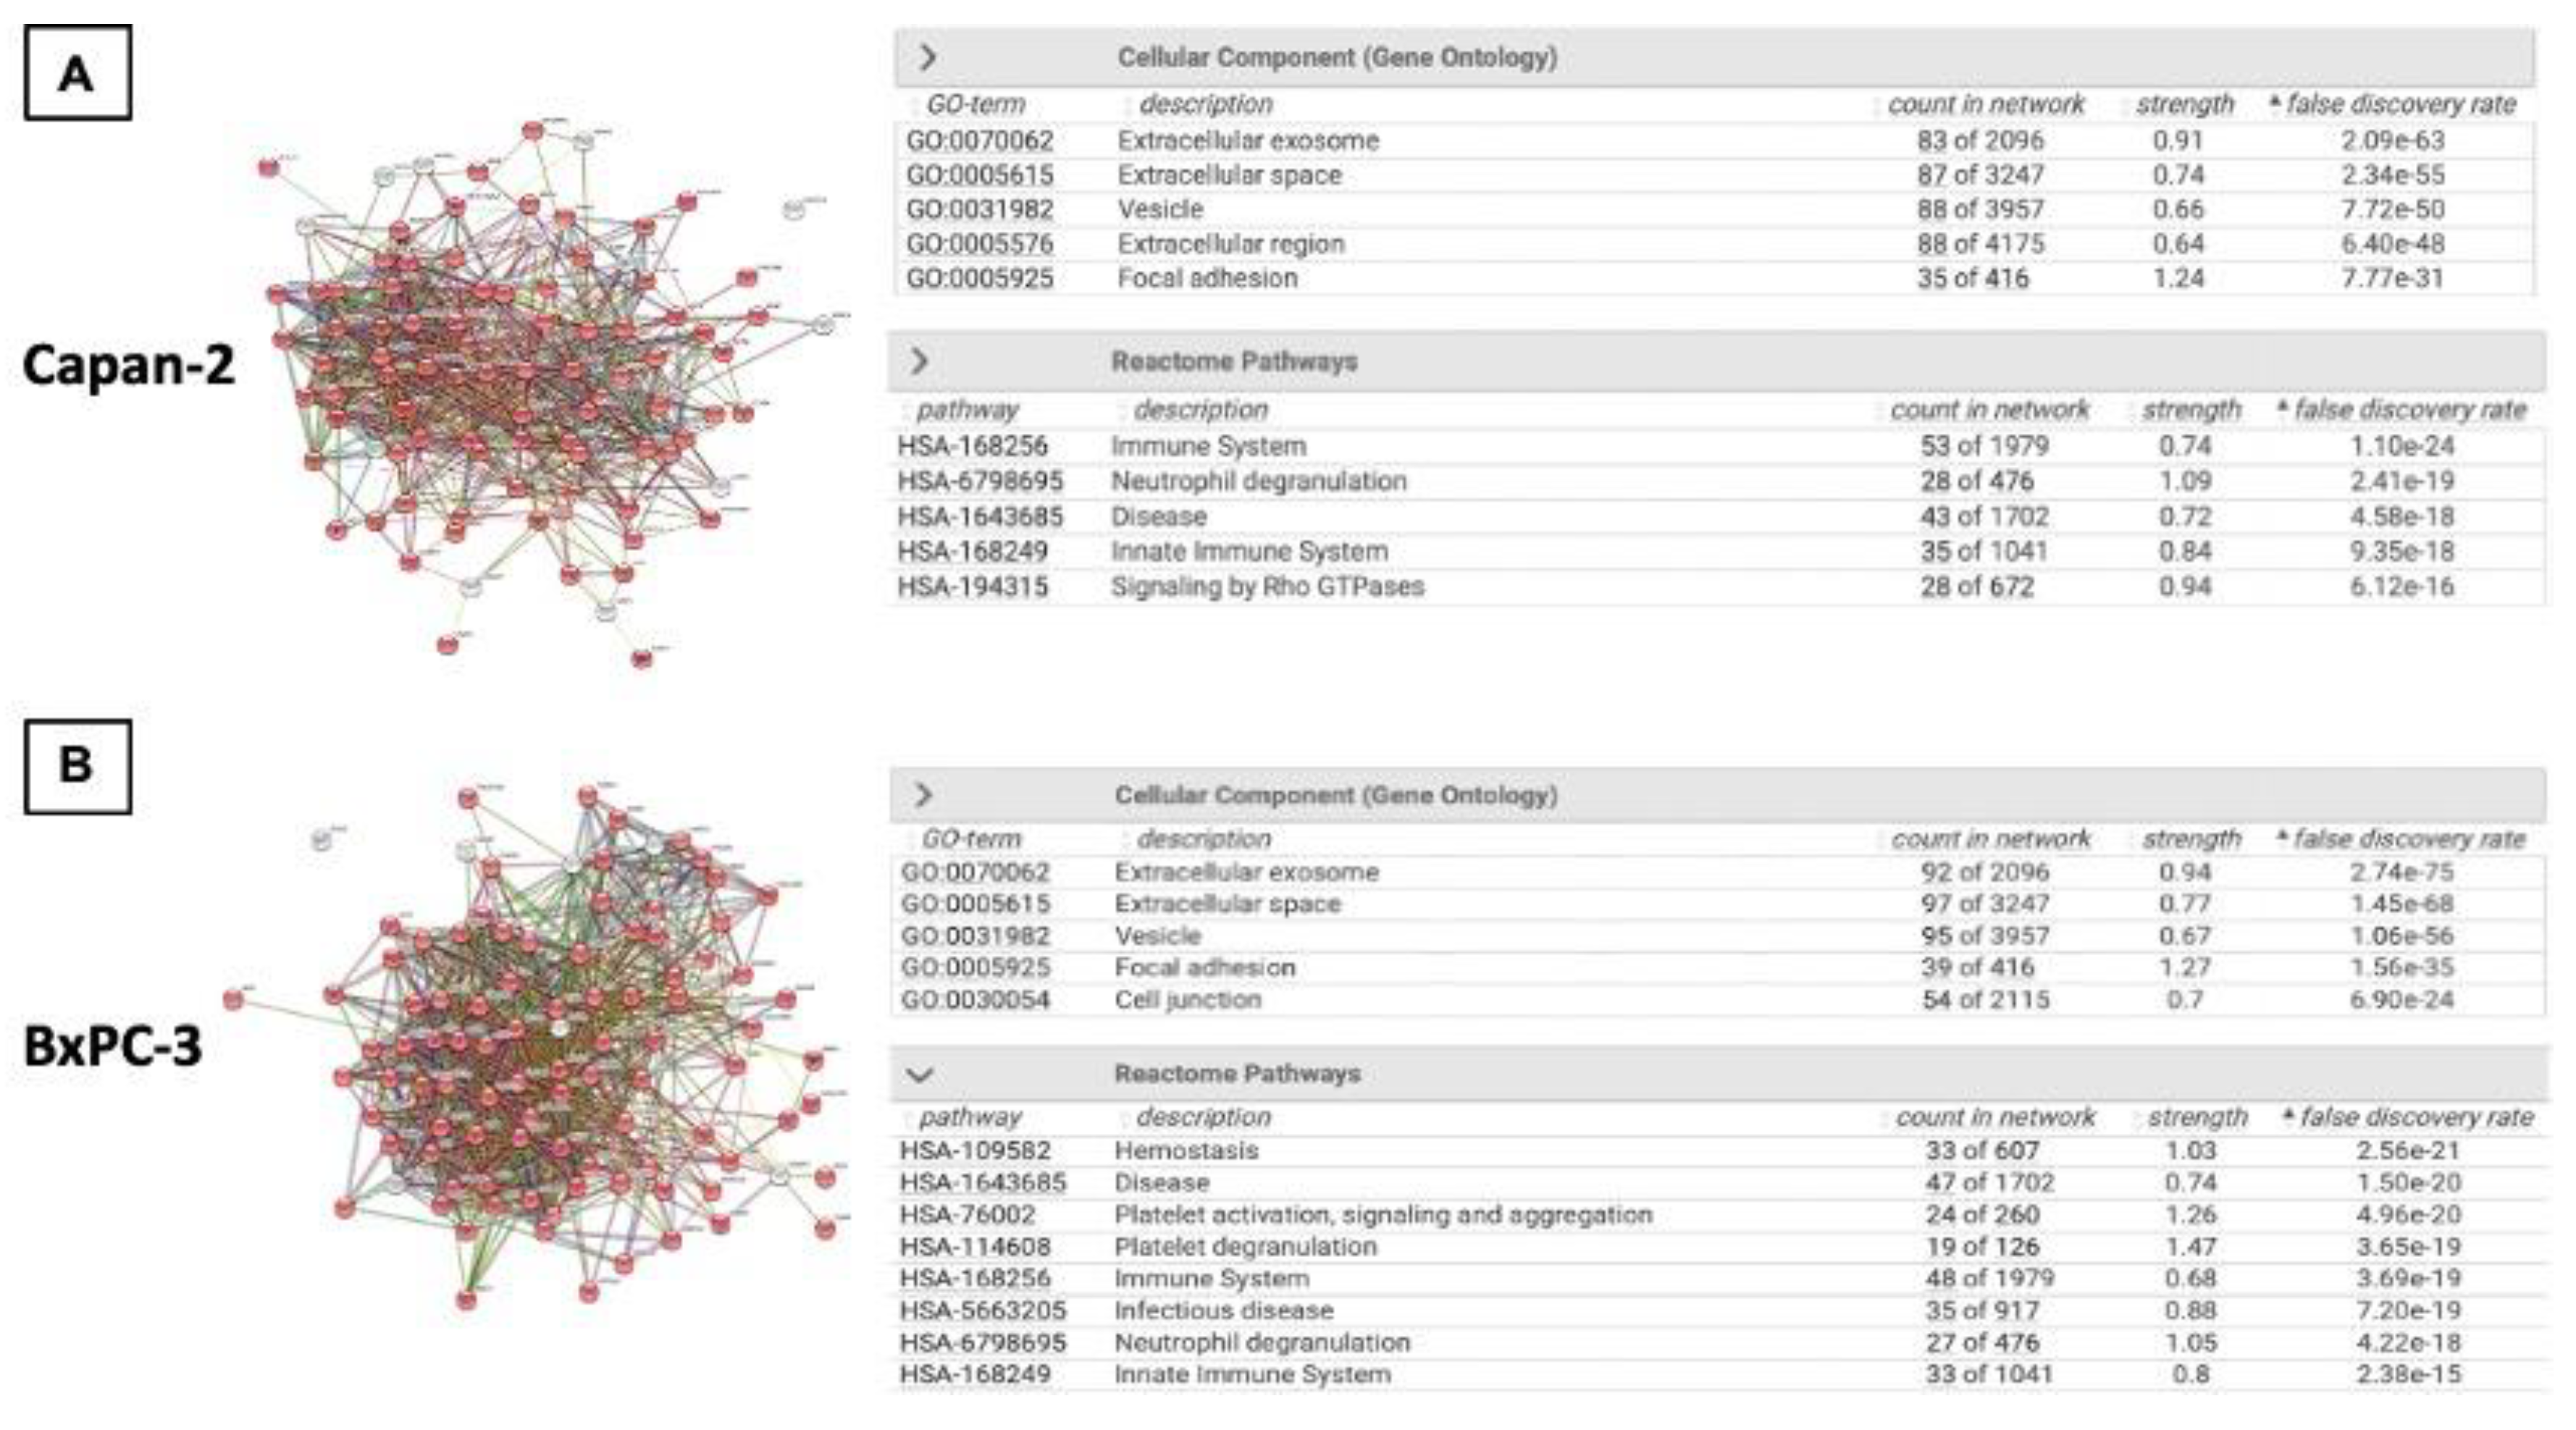
After morphological and dimensional characterization of EVs derived from pancreatic cancer cell lines, we analyzed their protein cargo. Proteomic analysis of Capan-2 and BxPC-3 EVs identified 95 and 97 proteins, respectively (Supplementary Table S2). In both cases these proteins were connected in a single functional network (p=1x10-16) by STRING analysis (Figure 2, Panel A and B). According to STRING, 83 of the 95 proteins identified in Capan-2 were involved in “Extracellular exosome” (GO Cellular component, FDR: 2.09x10-63), confirming the EV origin of the protein dataset (Figure 2, Panel A). Intriguingly, the majority of these proteins (n=53/95) were involved in “Immune System” pathway (Reactome Pathways, FDR: 1.10x10⁻²⁴). Similarly, 92 of the 97 proteins identified in BxPC-3 were involved in “Extracellular exosome” (GO Cellular component, FDR 2.74x10-75) (Figure 2, Panel B) and the majority of these proteins (n=48/92) were involved in “Immune System” pathway (Reactome Pathways, FDR: 3.69x10⁻¹⁹).
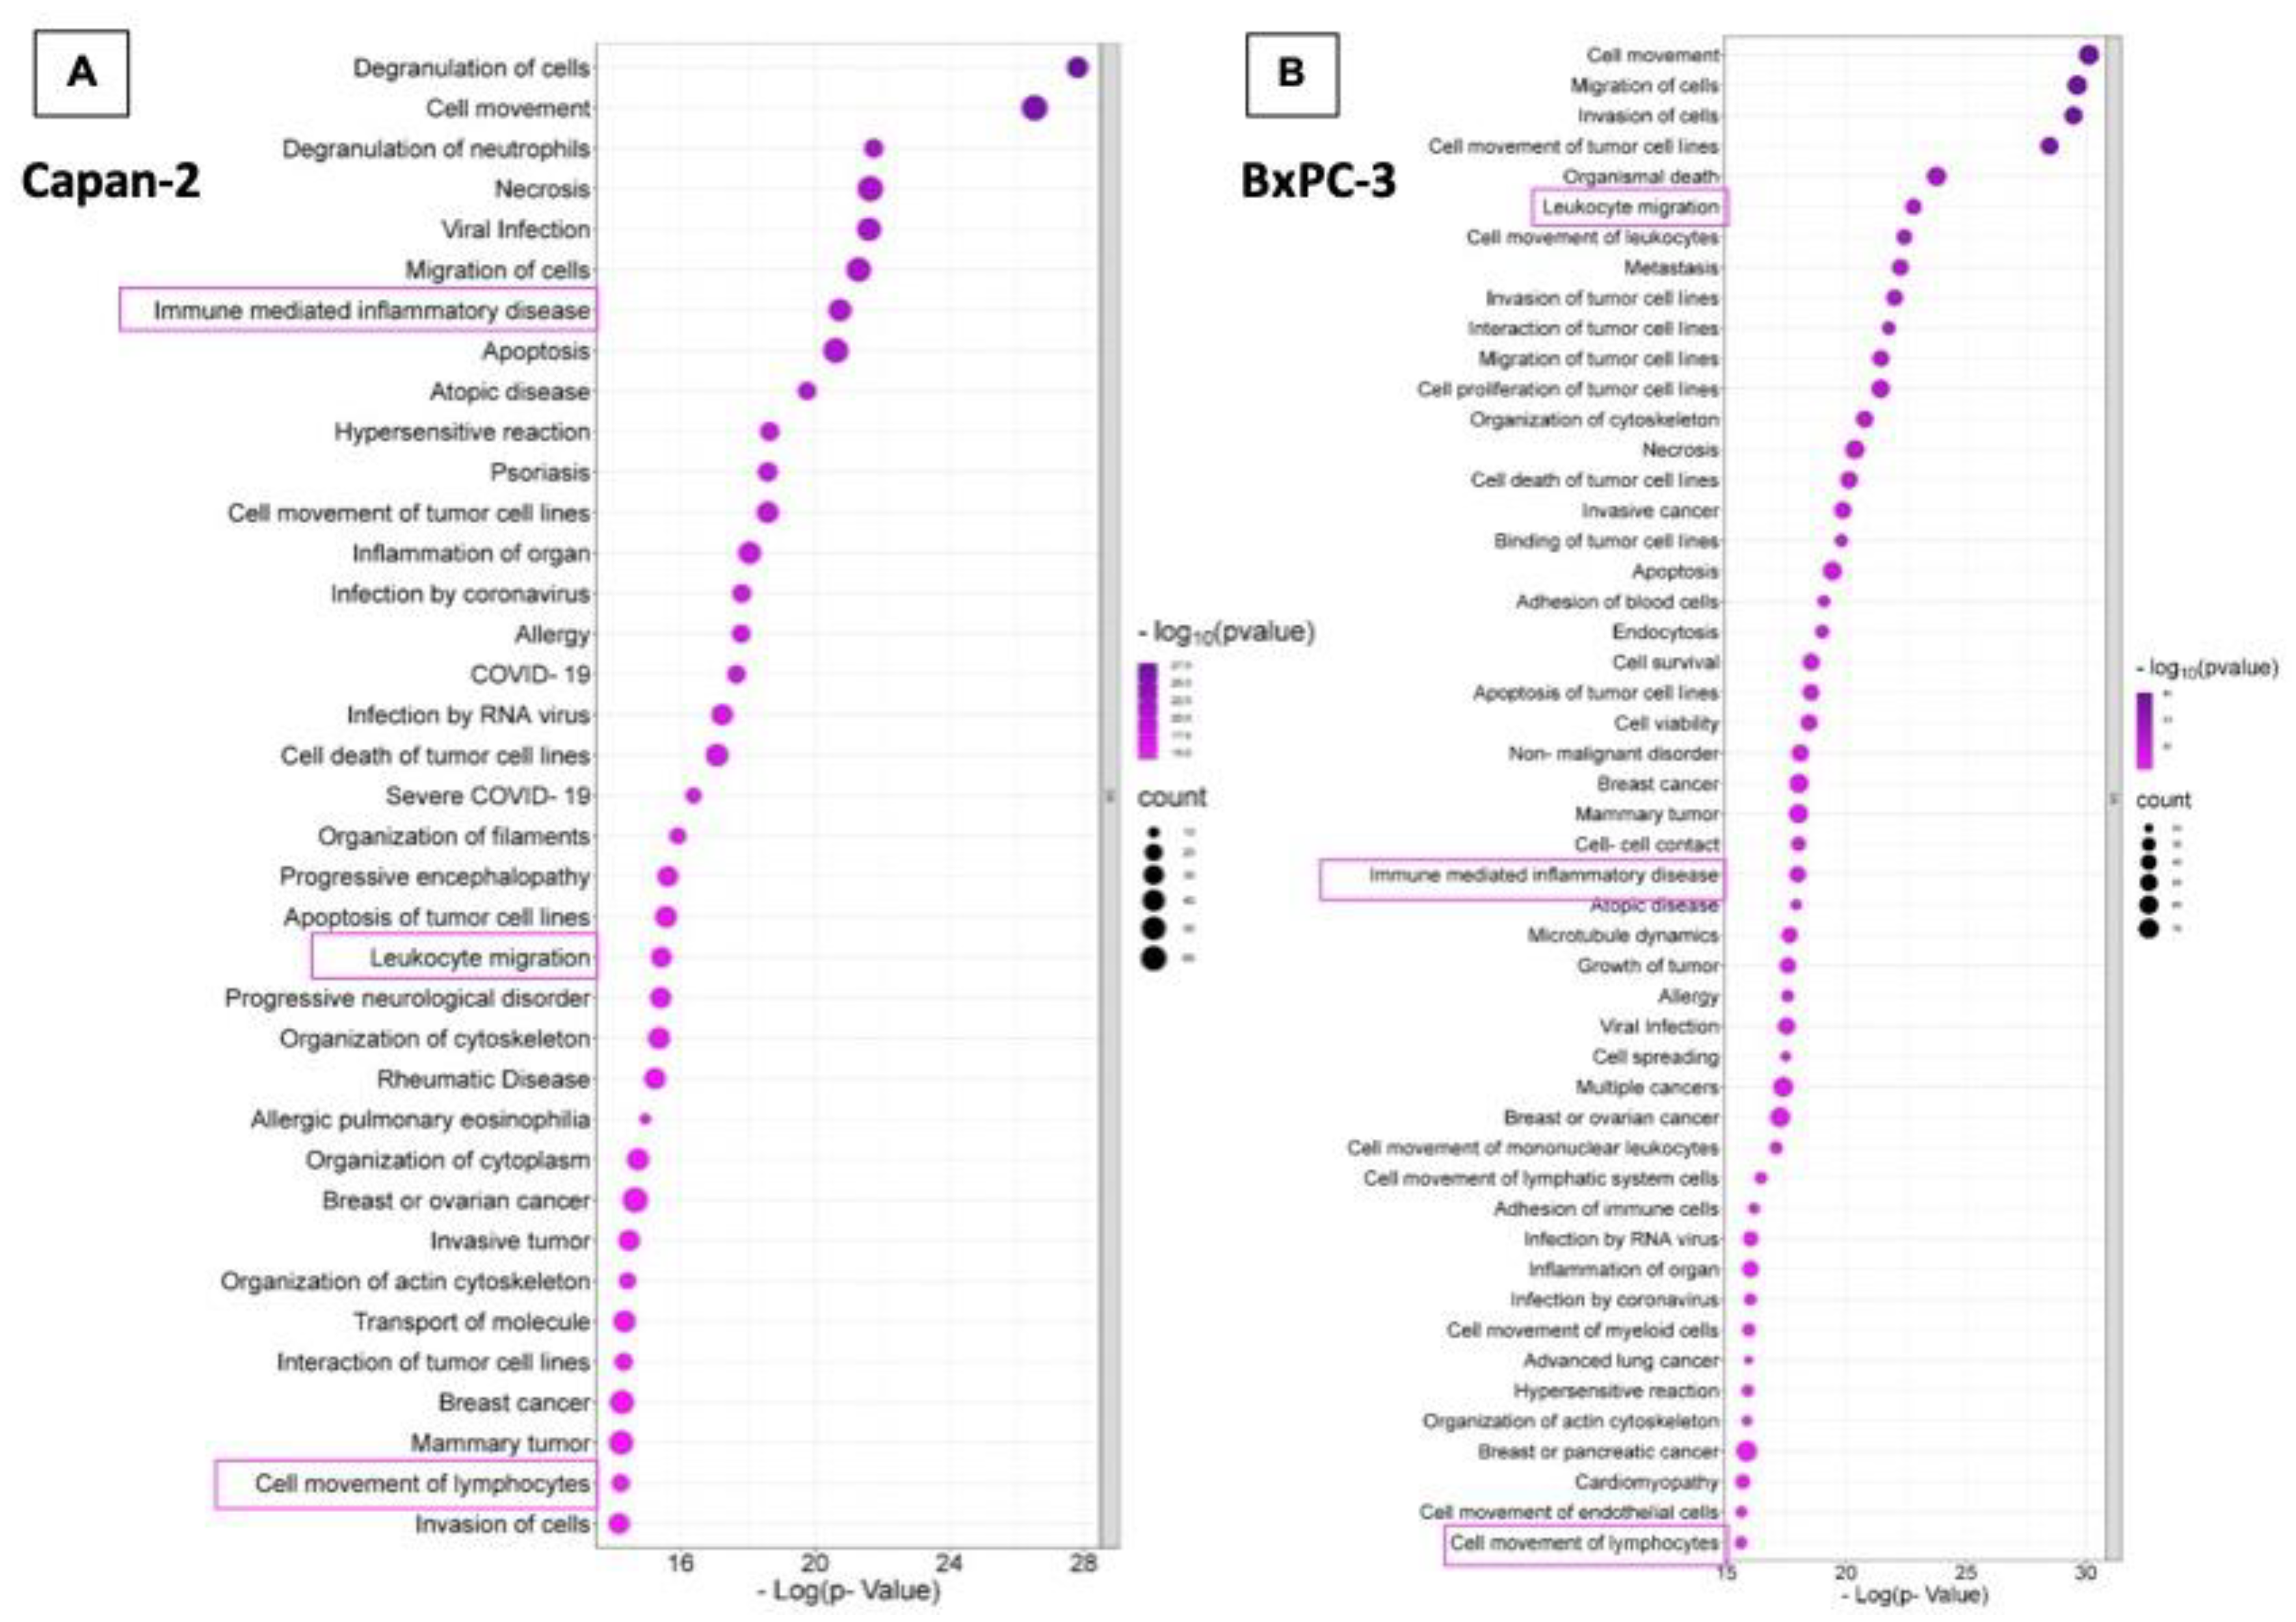
In line with STRING analysis of proteins expressed in EVs isolated from Capan-2, “Immune mediated inflammatory disease” (p=1,84x10⁻²¹), “Leukocyte migration” (p=3,74x10⁻¹⁶) and “Cell movement of lymphocytes” (p=6,10x10⁻¹⁵) were among the highest ranked IPA downstream pathways (Figure 3, Panel A and Supplementary Table S3). Similarly, analysis of proteins expressed protein in BxPC-3 derived EVs showed that “Leukocyte migration” (p=1,53x10⁻²³) “Immune mediated inflammatory disease” (p=1,05x10⁻¹⁸), and “Cell movement of lymphocytes” (p=2,39x10⁻¹⁶) were among the highest ranked IPA downstream pathways (Figure 3, Panel B and Supplementary Table S3). Overall, STRING and IPA analyses showed that cargo proteins of both Capan-2 and BxPC-3 derived EVs were highly enriched in proteins involved in the immune system response.
Notably, there were several differences in the EV protein cargo of the two cell lines with regard to proteins of the “immune pathway” identified in STRING Analysis (Supplementary Table S4 and Supplementary Table S5). In particular, 35 proteins were in common and 32 were not shared between EVs derived from the two PC cell lines, with 19 proteins unique to Capan-2 and 13 proteins unique to BxPC-3 (Supplementary Table S5). In addition to these immunomodulatory proteins resulting from STRING analysis, some of the proteins identified by proteomic analysis in EVs derived from Capan-2 (Supplementary Table S2) are known to be antigens involved in immune activation such as mesothelin, HSP90 and HSP70 [7]. HSP90 and HSP70, but not mesothelin were detected by proteomic analysis also in EVs derived from BxPC-3. Notably, this difference in mesothelin expression between EVs from these two lines is consistent with the drastic difference in mesothelin transcript expression between the two cell lines reported in The Human Protein Atlas (Capan-2: 497,5 nTPM, vs. BxPC-3: 87,1 nTPM; www.proteinatlas.org).

3.3. Capan-2 Derived EVs Increase the Expression of Early Activation Markers in CD4+ and CD8+ Lymphocytes

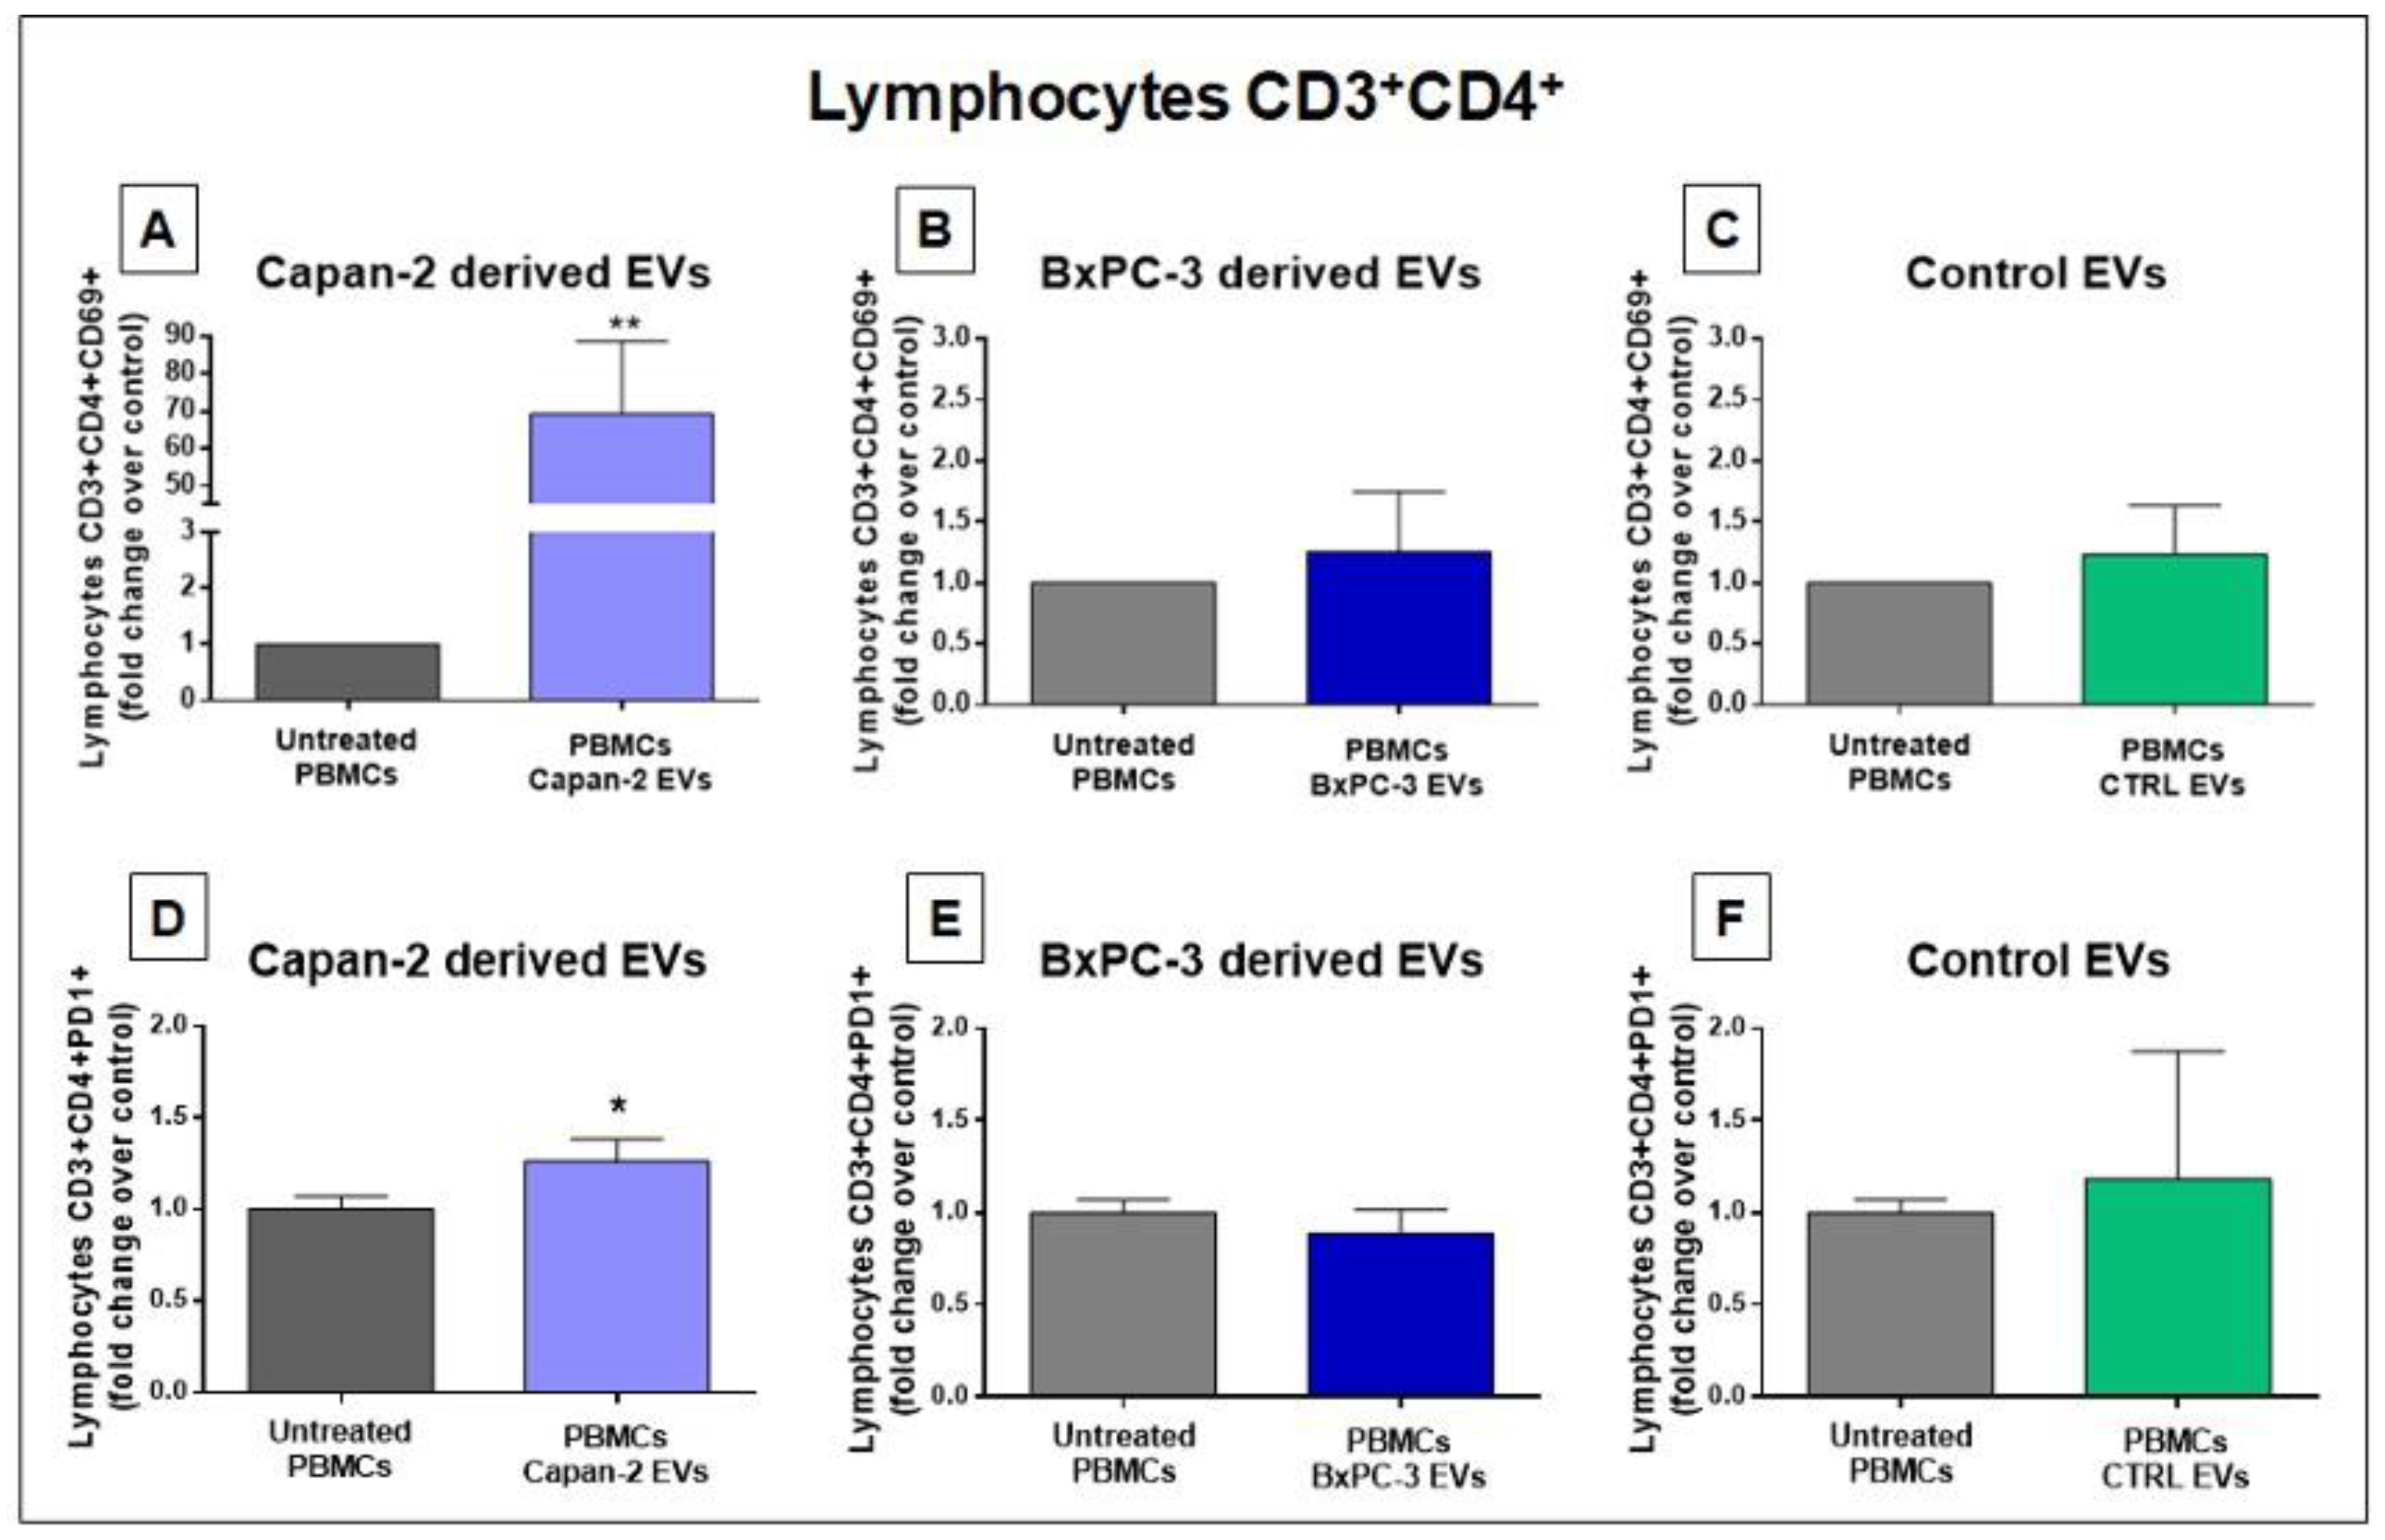
Considering that several pathways related to immune system and immune modulation were among the highest ranked IPA downstream pathways according to STRING and IPA (Figure 2 and Figure 3), we analyzed the effect of PC cancer EVs on the expression of CD69 a classical early marker of lymphocyte activation [33], and Programmed Death-1 (PD-1/CD279), another marker of early lymphocyte activation. In particular, we analyzed by flow cytometry CD69 and PD-1 expression in CD3+CD4+ and CD3+CD8+ cells derived from PBMCs untreated or treated for 48 hours with EVs derived from PC cell lines (Capan-2 and BxPC-3). As a further control, we analyzed CD69 and PD-1 expression in CD3+CD4+ and CD3+CD8+ cells derived from PBMCs treated or untreated with heterologous EVs derived from unmatched healthy donors. We studied these effects after EV stimulation of PBMCs because this experimental condition may reflect physiological conditions where T lymphocytes can interact with costimulatory cells. The analysis of CD4+, in PBMCs from two healthy donors treated with EVs derived from Capan-2 cells revealed that the proportion of CD3+CD4+CD69+ lymphocytes were markedly increased as compared to untreated PBMCs (p=0.0036) (Figure 4, Panel A). Conversely, in PBMCs from the same healthy donors, we did not observe significant changes in the proportion of CD3+CD4+CD69+ lymphocytes after PBMCs treatment with BXPC-3 derived EVs or with heterologous control EVs (Figure 4, Panel B and C). The results of flow cytometry analysis using Programmed Death-1 (PD-1/CD279) were consistent with those obtained with CD69. Namely, in healthy donors PBMCs, we observed a slight increase in the proportion of CD3+CD4+PD1+ lymphocytes only after treatment with EVs derived from Capan-2 cells (p=0.0326) (Figure 4, Panel D), but not with BXPC-3 derived EVs and with heterologous control EVs (Figure 4, Panel E and F). These results with CD69 and PD-1 are in line with an activation of CD4+ T-cells after a 48-hour treatment with Capan-2 derived EVs, but not after treatment with EVs from BXPC-3 or heterologous control EVs.
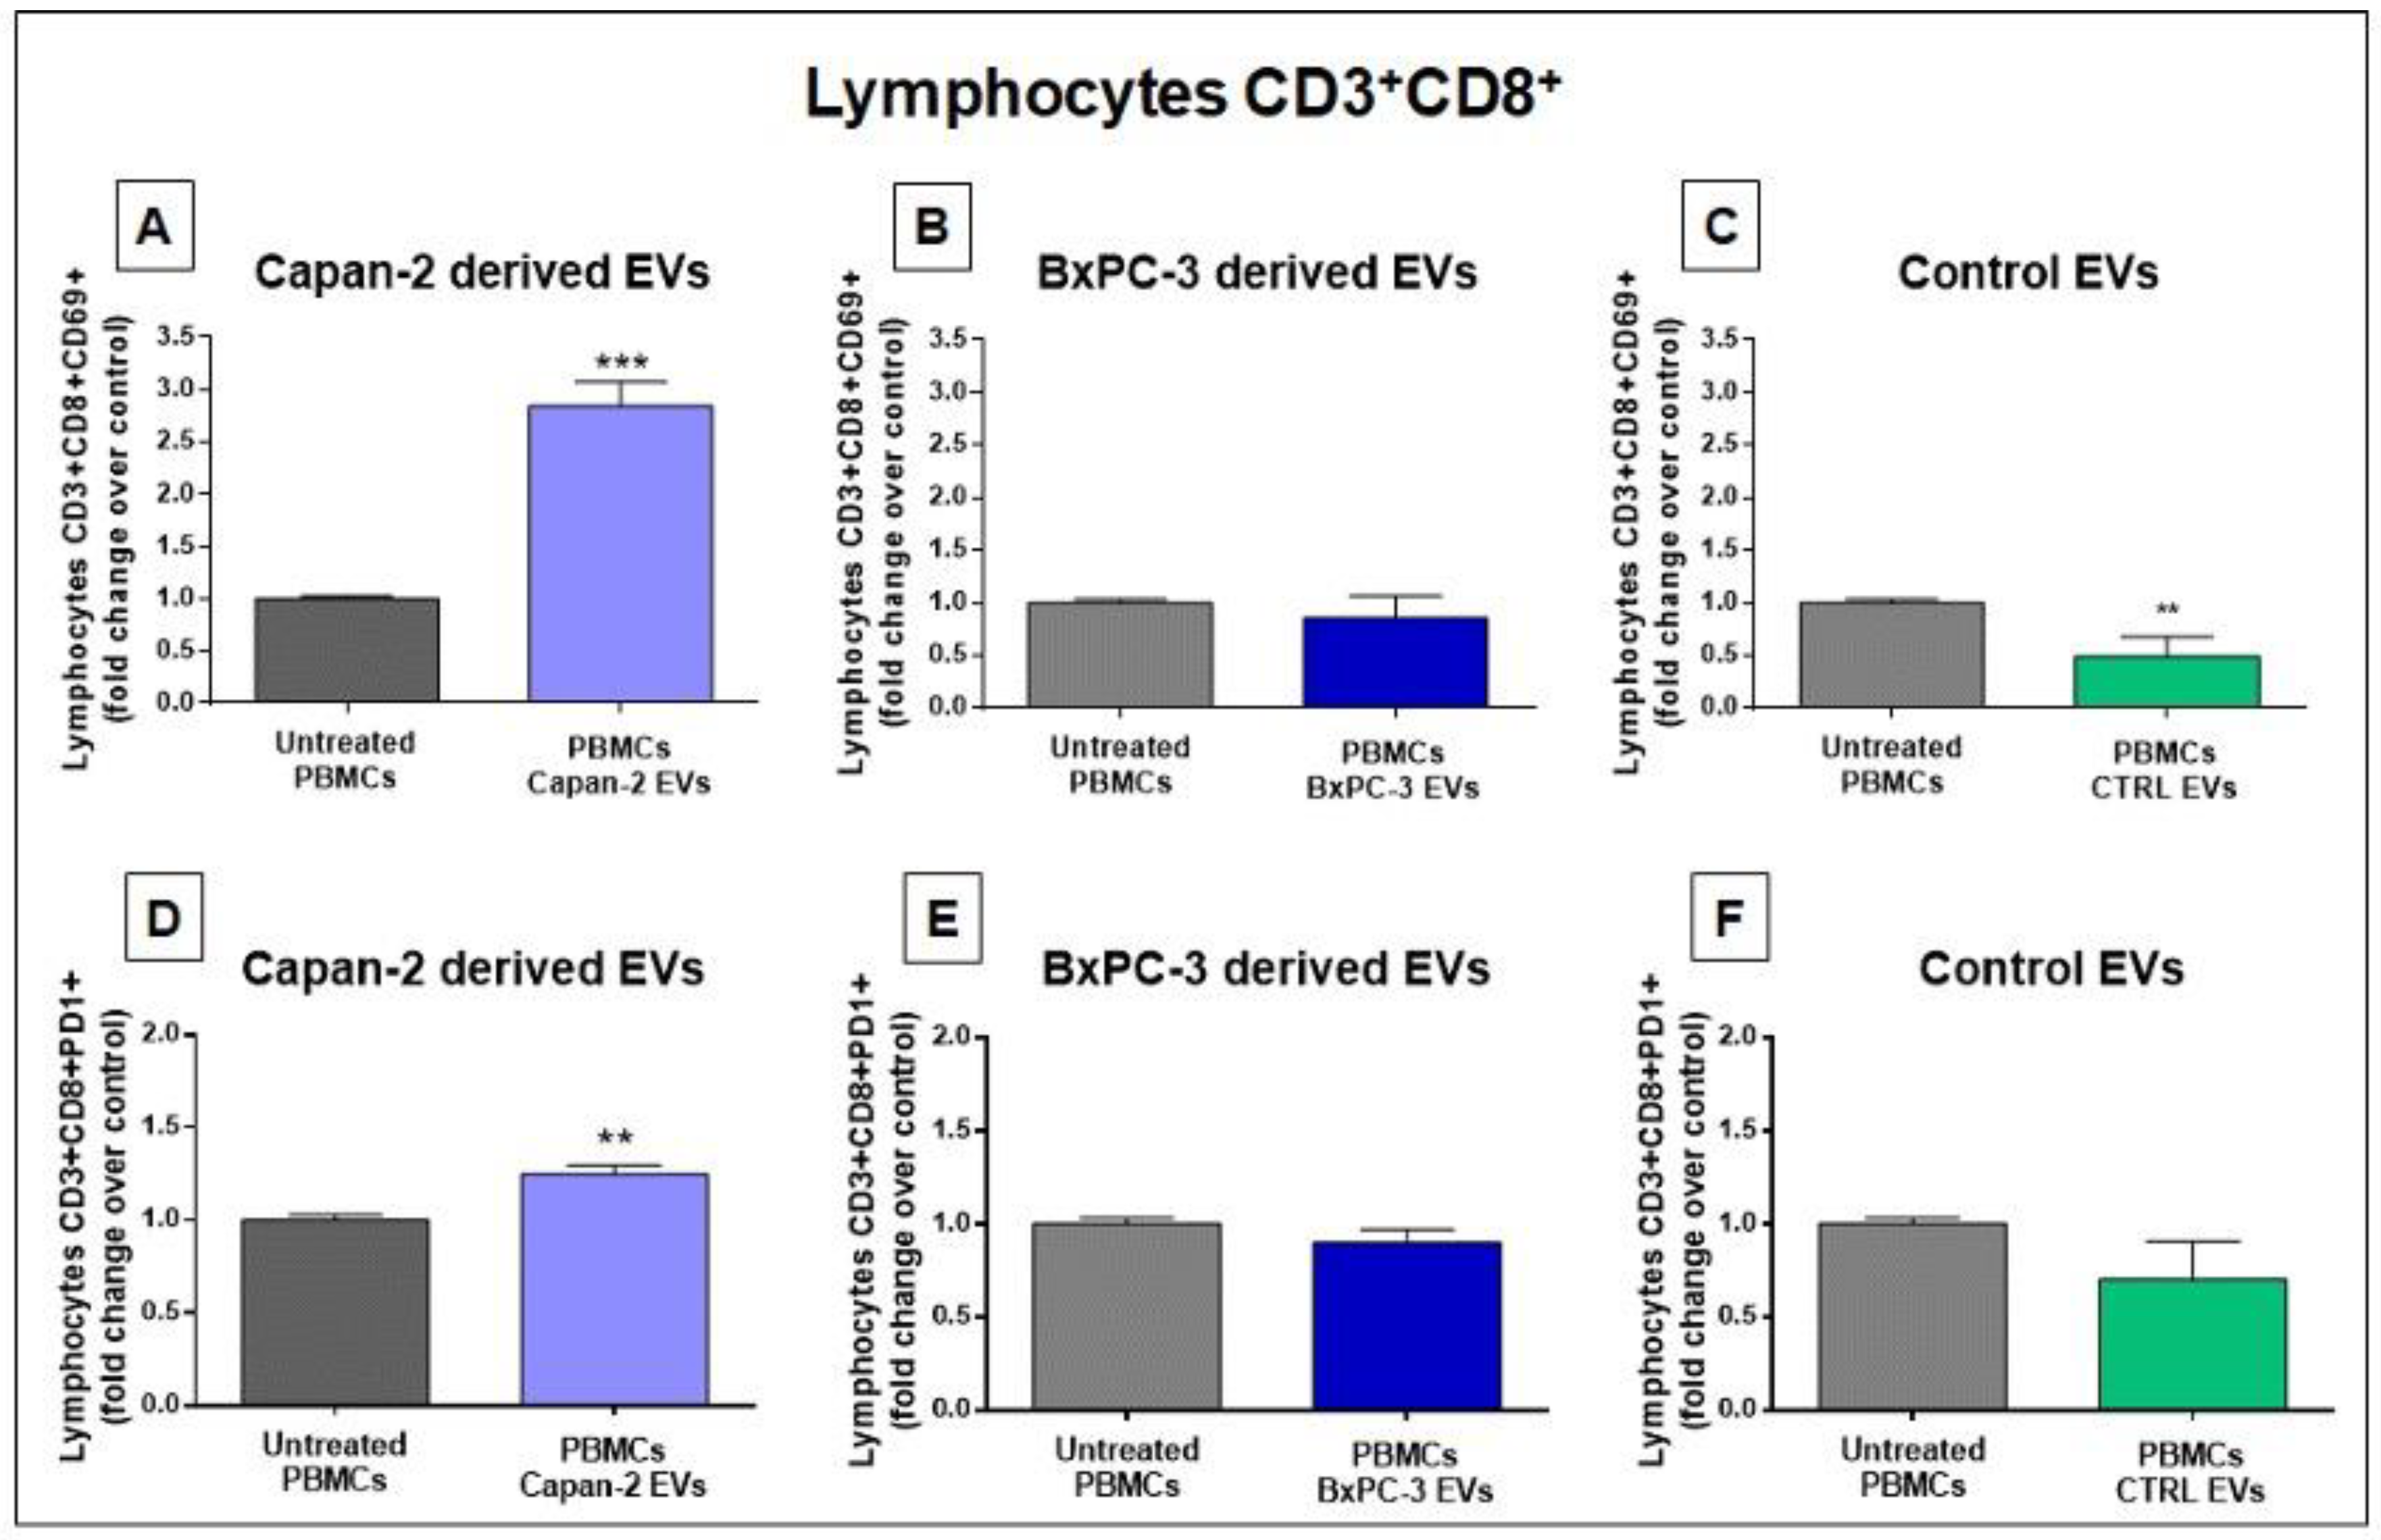
The analysis of CD8+, in PBMCs from two healthy donors treated with EVs derived from Capan-2 cells showed that the proportion of CD3+CD8+CD69+ lymphocytes was markedly increased as compared to untreated PBMCs (p=0.0002) (Figure 5, Panel A). Conversely, in PBMCs from the same healthy donors treated with BXPC-3 derived EVs, we did not observe an increase in the proportion of CD3+CD8+CD69+ lymphocytes (Figure 5, Panel B). Interestingly, after treatment of PBMCs from the same healthy donors with heterologous control EVs we observed, if anything, a slight decrease in the proportion of CD3+CD8+CD69+ lymphocytes (p=0.0058) (Figure 5, Panel C). The results of flow cytometry analysis using Programmed Death-1 (PD-1/CD279) in CD8+ lymphocytes were consistent with those obtained with CD69. Namely, the proportion of CD3+CD8+PD1+ lymphocytes was increased only after PBMCs treatment with EVs derived from Capan-2 cells (p=0.0016) (Figure 5, Panel D), but not after treatment with EVs derived frorm BxPC-3 cells (Figure 5, Panel E). Moreover, treatment of healthy donors PBMCs with heterologous EVs derived from unmatched healthy donors did not significantly modify the proportion of CD8+PD1+ lymphocytes, in comparison to untreated PBMCs (Figure 5, Panel F). Overall, the results obtained with CD69 and PD-1 markers in CD4+ and CD8+ lymphocytes are concordant and are in line with an early activation of these cells after a 48-hour treatment only with Capan-2 derived EVs, but not with EVs from BxPC-3 or with heterologous control EVs.

3.4. CD3+ Lymphocytes Proteomics in Response to Treatment with Capan-2 and Control EVs

Since EVs from Capan-2 promoted the expression of lymphocyte activation markers on CD3+CD4+ and CD3+CD8+, we analyzed the proteomics of CD3+ lymphocytes sorted from PBMCs with or without treatment with Capan-2 EVs or heterologous control EVs. For this purpose, PBMCs were isolated from fresh whole blood of two healthy donors and treated or untreated with Capan-2 EVs heterologous control EVs After treatment for 48 hours, PBMCs were fixed and stained using an anti-CD3 antibody. Finally, CD3+ lymphocytes were isolated by fluorescence-activated cell sorting. Then, sorted CD3+ lymphocytes were employed for proteomic analysis. Proteins identified in CD3+ lymphocytes sorted from PBMCs treated with Capan-2 derived EVs are reported in Supplementary Table S6.
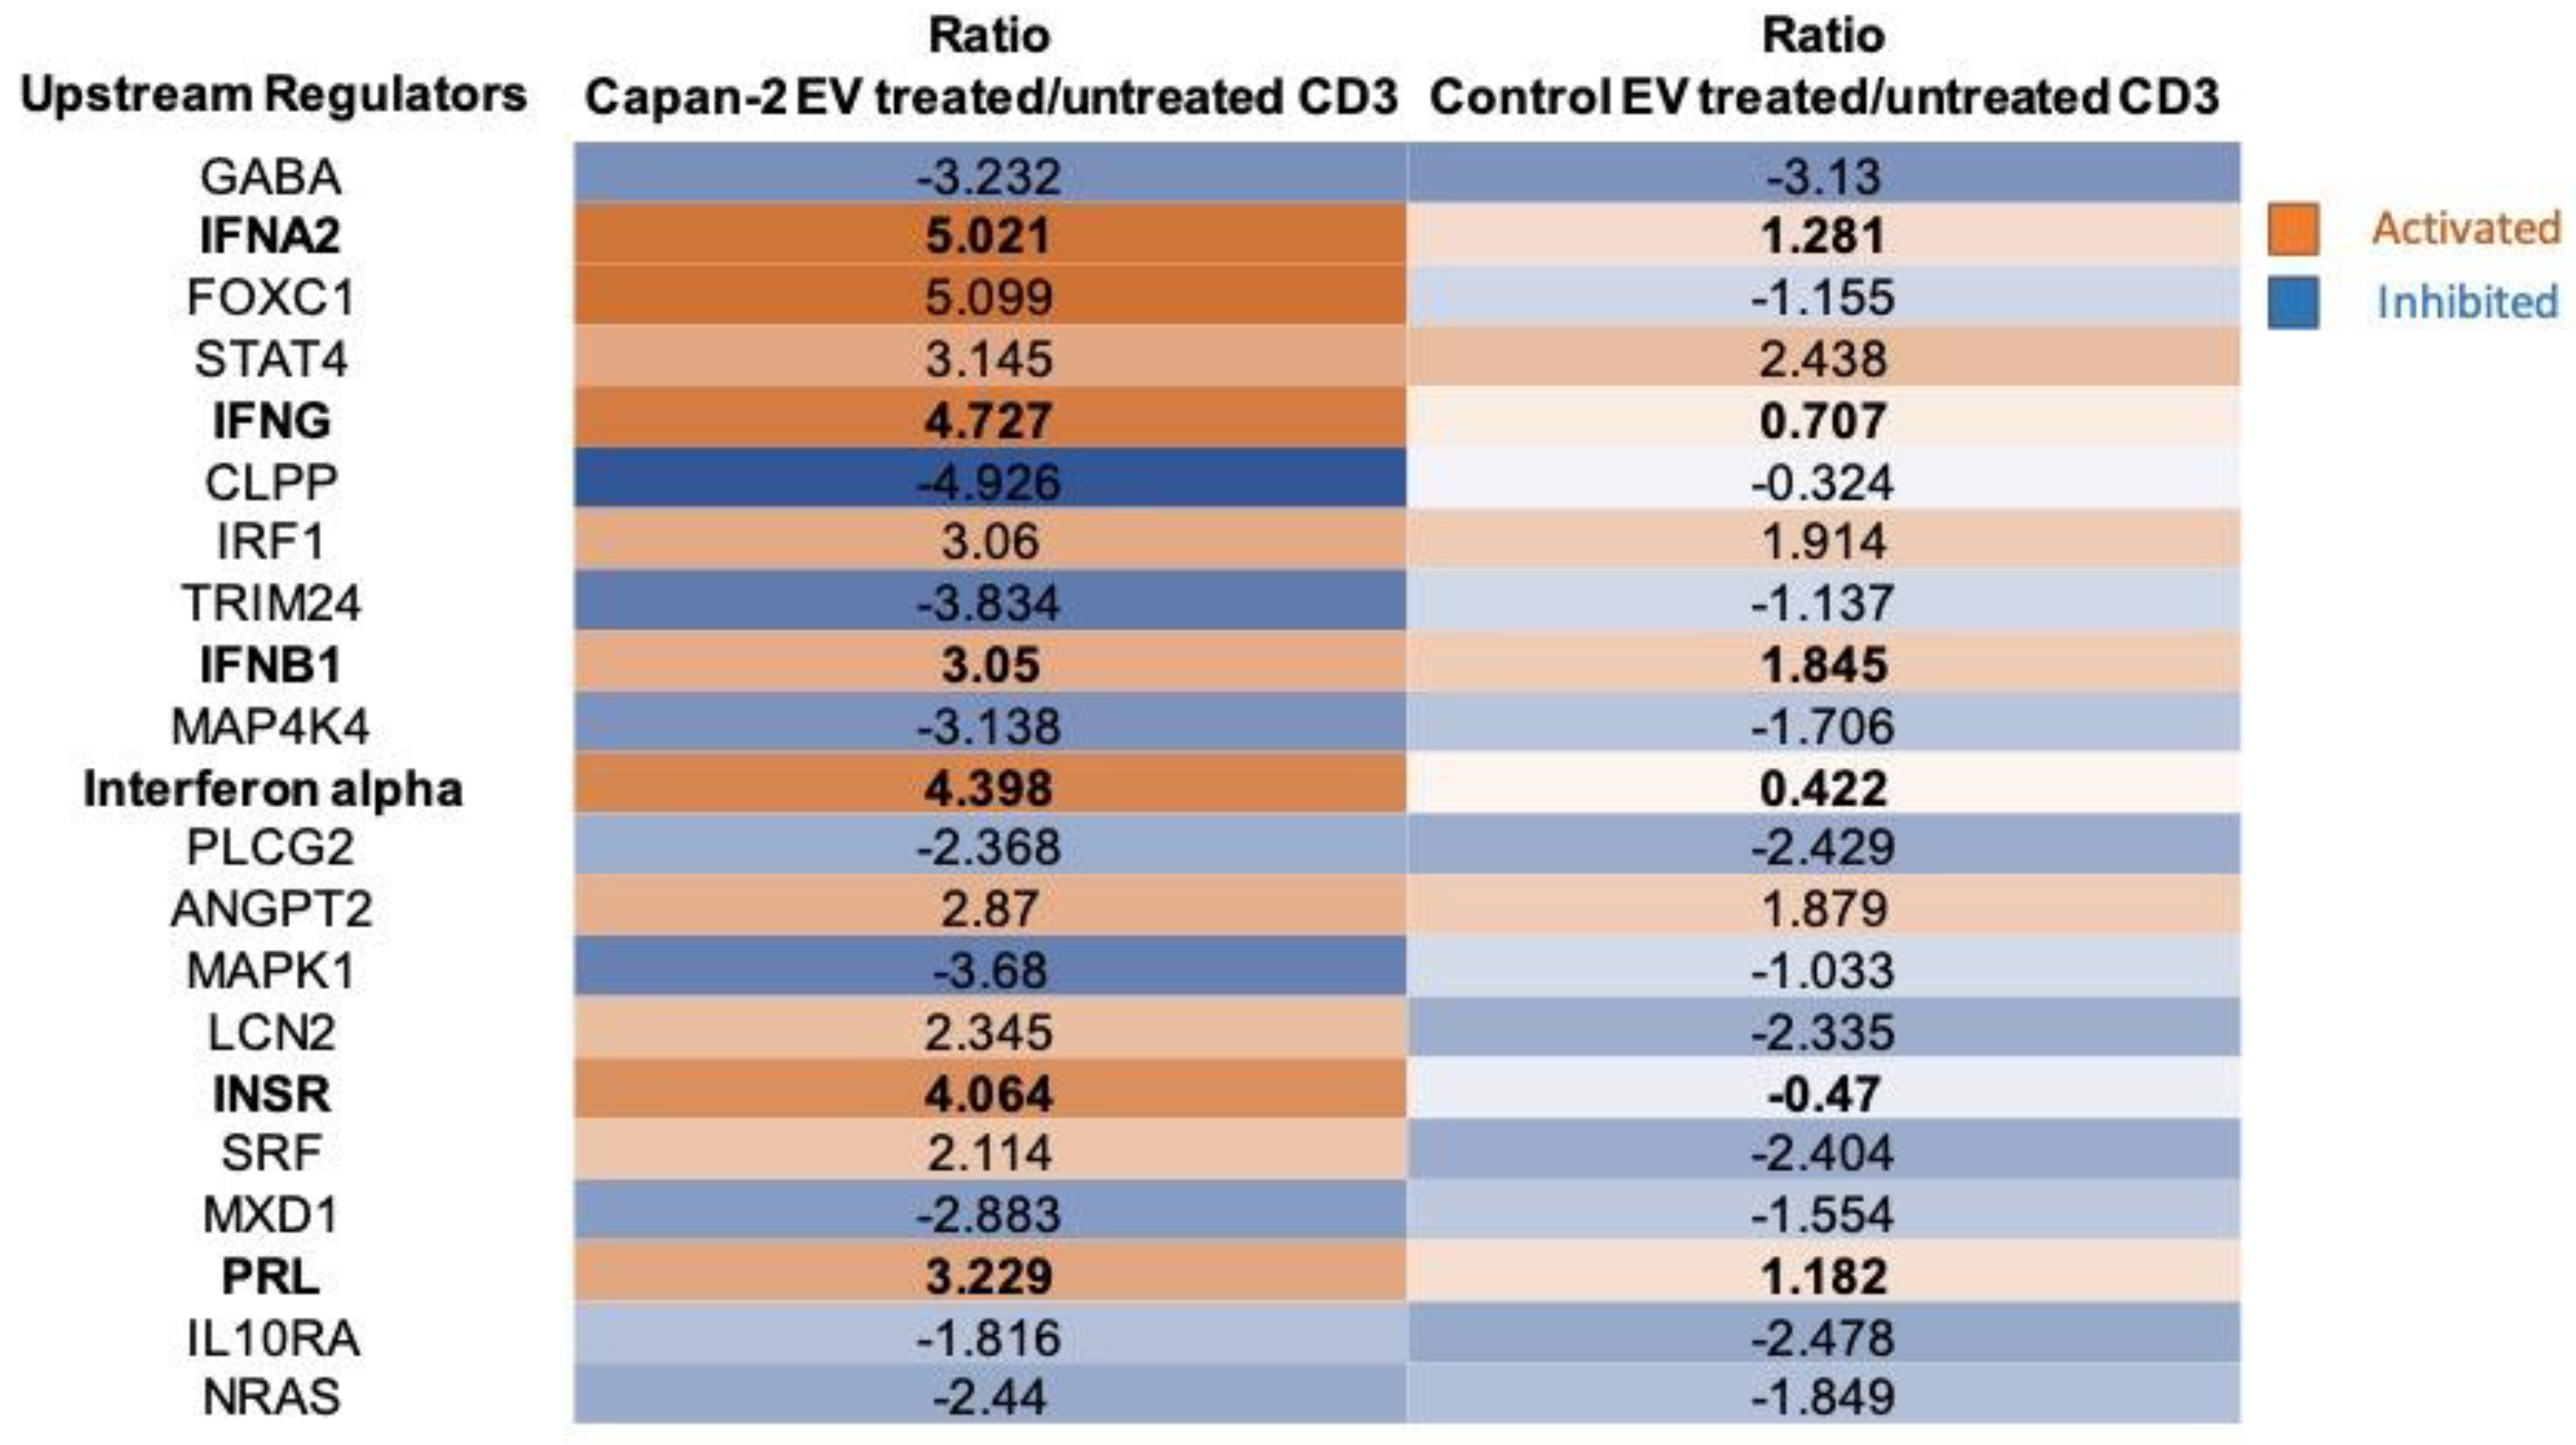
Upstream regulators – Upstream regulators were identified by IPA functional proteomic analysis in CD3+ sorted from PBMCs treated or untreated with Capan-2-derived EVs, versus those treated or untreated with control EVs from heterologous healthy donors (Figure 4). Interestingly, most upstream regulators were immunomodulatory and were significantly activated only by Capan-2 EVs. Among these, “Interferon α” (z-score 4.398), “Interferon α2” (z-score 5.021), “Interferon β1” (z-score 3.05), “Interferon γ” (z-score 4.727), “Prolactin” (z-score 3.229) and “Insulin Receptor” (z-score 4.064) that are involved in the activation of immune response. Specifically, IPA indicated as upstream regulators some molecules belonging to type I interferon family, such as the IFNα, IFNα2 and IFNβ1 and type II interferon, such as interferon-γ (IFNG). IFNα and α2 have the potential to directly enhance the responsiveness of CD8+ T lymphocytes to specific antigens, increase their cytotoxic activity, and prolong their survival [34,35]. In particular, for interferon α and α2 the ratio of activation induced by Capan-2 EVs was, respectively, 10.4 and 3.9-fold higher than that induced by control EVs. Also interferon-γ (IFNG) plays a key role in the activation of cellular immunity and, subsequently, in stimulation of antitumor immune response [36]. This molecule was one of the most activated upstream regulators in CD3+ lymphocytes after treatment of PBMCs with Capan-2 EVs with a ratio of activation more than 6-fold higher than that observed with control EVs (Figure 4). Among other molecules known to be involved in the activation of immune response, the insulin receptor (INSR) is considered a marker of activation, as its expression increases upon T cell receptor (TCR) stimulation [37]. Its ratio of activation with Capan-2 EVs was more than 8-fold higher as compared than that observed with control EVs (Figure 4). In addition, prolactin (PRL) had a ratio of activation almost 3-fold higher with Capan-2 EVs as compared to what observed with control EVs (Figure 4) and this molecule was shown to increase the cytotoxic activity of T lymphocytes, as well as the secretion of proinflammatory cytokines, particularly those belonging to type I interferon family [38].
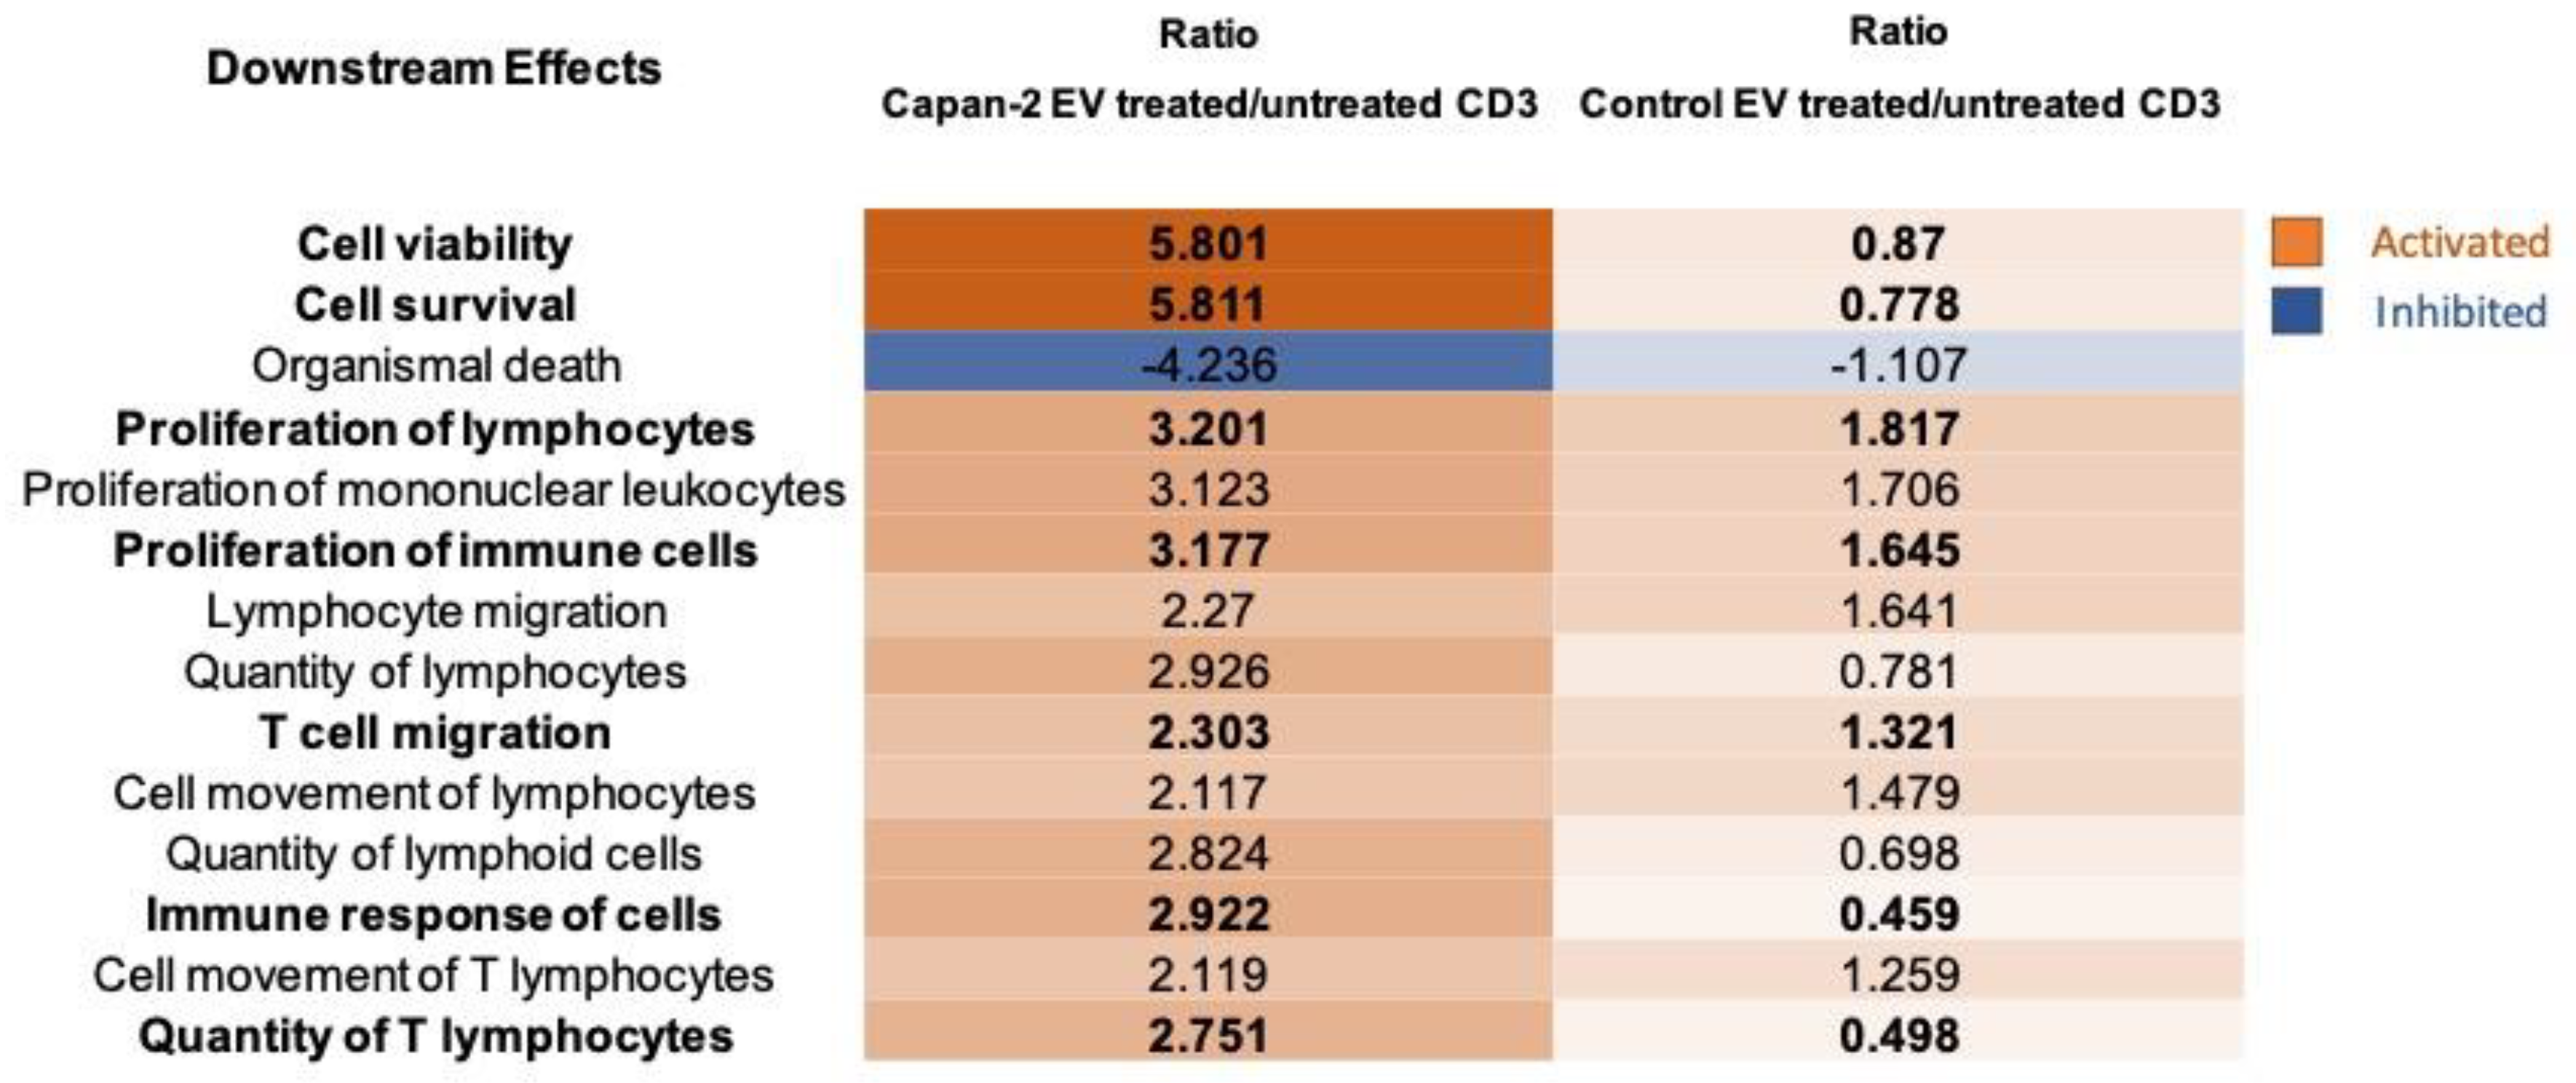
Downstream effects – Downstream effects were identified by IPA functional proteomic analysis of CD3+ sorted from PBMCs treated or untreated with Capan-2-derived EVs, versus those treated or untreated with control EVs from heterologous healthy donors (Figure 5). Most downstream effects were activated in CD3+ lymphocytes only with Capan-2 EVs, including “Cell viability” (z-score 5.801) and “Cell survival” (z-score 5.811). In particular, for “Cell viability” and “Cell survival” the ratios of activation induced in CD3+ lymphocytes by Capan-2 EVs were, respectively, 6.7 and 7.5-fold higher than that induced by control EVs. Most downstream effects were immunomodulatory and were activated only with Capan-2 EVs, including “Proliferation of lymphocytes” (z-score 3.20), “Proliferation of immune cells” (z-score 3.18), “T cell migration” (z-score 2.30), “Immune response of cells” (z-score 2.92) and “Quantity of T lymphocytes” (z-score 2.75). In particular, the ratios of activation induced by Capan-2 EVs for “Immune response of cells” and “Quantity of T lymphocytes” were, respectively, 6.3 and 5.5-fold higher as compared to that observed with control EVs. Overall, the results of IPA analysis, including upstream regulators and downstream effects are in line with the increased expression of early activation markers observed by flow cytometry in CD4+ and CD8+ lymphocytes.

3.5. PC-Derived EVs Stimulate IFNG Secretion in PBMCs

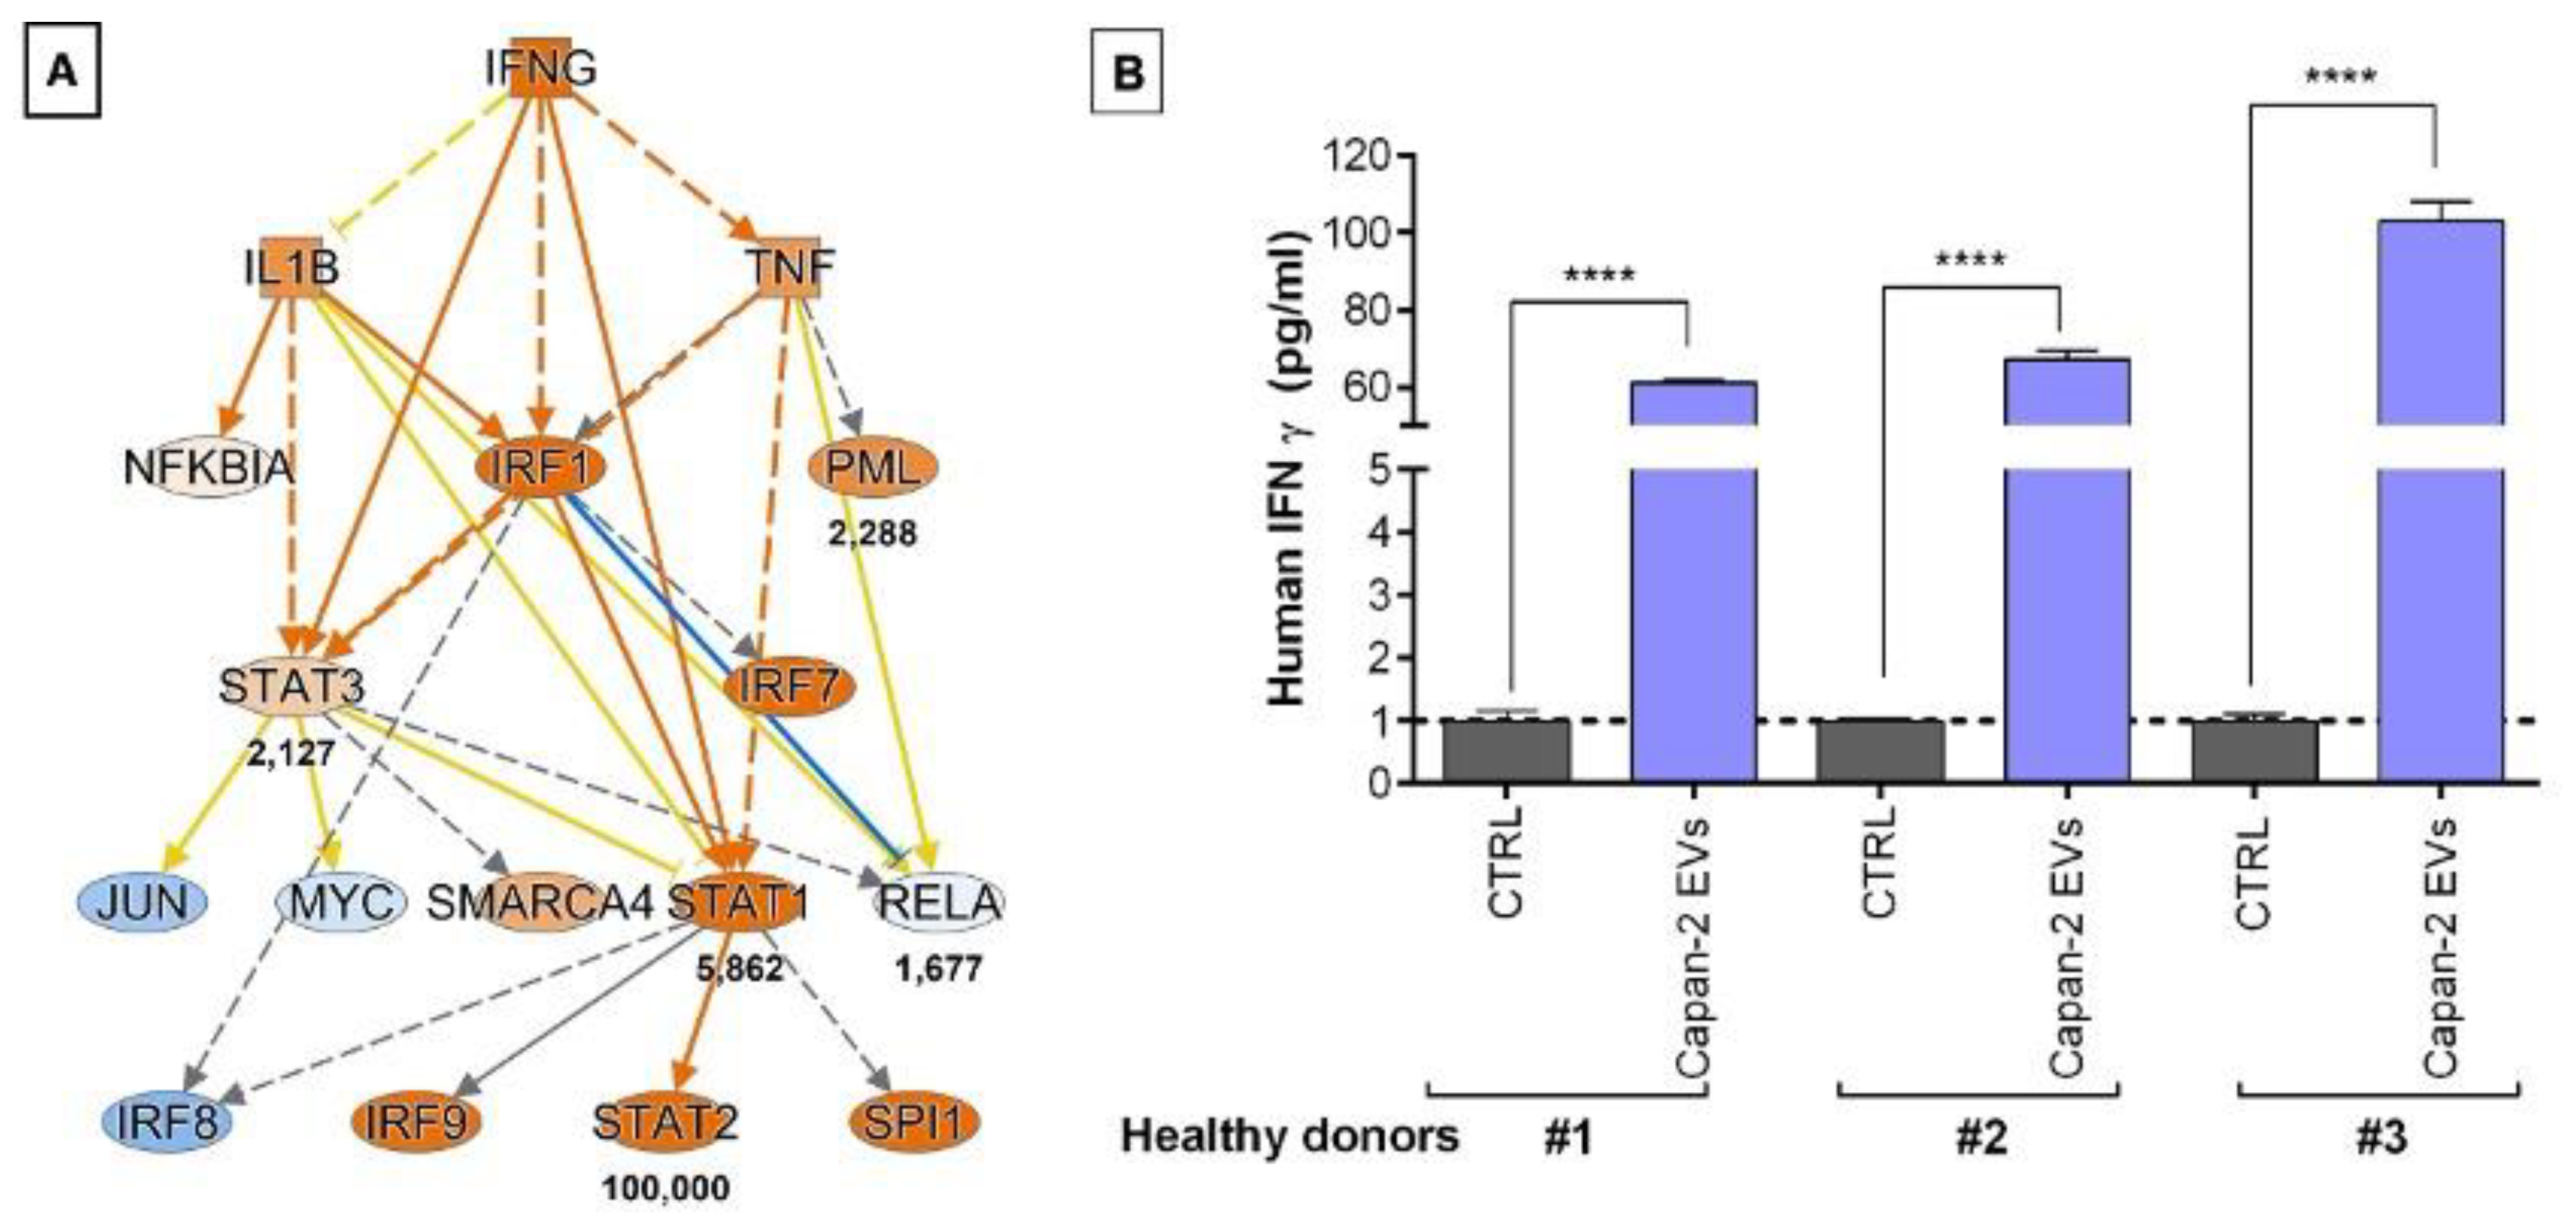
Considering that IPA predicted IFNG (Figure 6) as one of the most activated upstream regulators of CD3+ lymphocytes after treatment of PBMCs with Capan-2 EVs, acting through stimulation of a mechanistic network (Figure 8, Panel A), we analyzed by ELISA assay the secretion of IFNG in supernatants of EV-treated or untreated PBMCs from three different healthy donors (Figure 8, Panel B). IFNG concentrations were markedly increased in supernatants of PBMCs from all three healthy donors treated with Capan-2, in comparison to untreated PBMCs (CTRL). These results are in line with IPA prediction suggesting that Capan-2 derived EVs have the potential to modulate immune response through an increased IFNG secretion by PBMC.

4. Discussion

Patients with pancreatic cancer (PC) receive limited or no benefits from radio- or chemo-therapy in terms of survival and PC remains a malignancy with one of the highest mortality rate of malignant tumors [2]. Despite great progress in immunotherapy for various cancers, PC is not sensitive to this treatment option [2]. In this regard, the presence of a highly immunosuppressive tumor microenvironment is likely to contribute to the lack of response to immunotherapy [1]. Cancer-derived EVs appear to have an immunomodulatory potential, but only a few studies analyzed potential role of pancreatic cancer-derived EVs in the modulation of the immune response. Most studies focused on the immunosuppressive potential of PC-derived EVs, which may contribute to the marked immunotherapy resistance observed in PC [2]. On the other hand, EVs from colon carcinoma, mammary carcinoma, mesothelioma, mastocytoma, and chronic myeloid leukemia were shown to have an immunostimulatory potential [19]. This cancer EV property was exploited to generate antitumor immune responses, inducing T cell-dependent eradication or growth suppression in established murine tumors [19]. With regard to pancreatic cancer EVs, their manipulation was shown to elicit immunostimulatory activity [20], but it is unknown whether PC-derived EVs in their native state may possess an intrinsic immune-stimulatory potential. Investigations in this field might contribute to improve our knowledge on immunomodulatory properties of PC-EVs, with potential implications for PC therapy. In this study, we investigated the proteomic profile of PC-derived EVs and their functional effects, analyzing their potential immunomodulatory role in the context of PBMCs. Intriguingly, most proteins identified in our proteomic analysis of PC-EVs were included in immune-related pathways according to STRING analysis, albeit there was a substantial difference between the immune-related proteins identified in the two PC cell lines analyzed, with only 35 of the 67 proteins in this pathway shared by Capan-2 and BxPC-3. Proteomic analysis revealed that, among other differences between protein cargo of the two PC cell lines, the antigenic immunostimulatory protein mesothelin was expressed only in Capan-2 EVs. Considering that, in addition to the differences in protein cargo observed in our proteomic analysis, there may be other heterogeneities in protein and nucleic acid cargo not analyzed in this study, it is conceivable that these differences might have functional implications. In agreement with this possibility, the effect of Capan-2 EVs on early activation markers in CD4+ and CD8+ lymphocytes was distinct from what observed with BxPC-3 EVs. Namely, an increased expression of CD69 and PD-1 early activation markers was observed only after treatment of PBMCs with Capan-2 EVs, but not after treatment with BxPC-3 EVs. In line with a specific activating effect of Capan-2 EVs on CD4+ and CD8+, an increased expression of CD69 and PD-1 early activation markers was not observed even after treatment of PBMCs with heterologous control EVs from different unmatched donors. The lack of CD4+ and CD8+ activation with BxPC-3 EVs and with heterologous control EVs indicated that the activation observed with Capan-2 EVs was not per se an effect of the heterologous source of EVs employed. In addition, these results indicated that not all PC-EVs are able to induce early CD4+ and CD8+ activation, which may be relevant in experimental strategies aimed at inducing antitumor immune responses using cancer-EV treatment. The early lymphocyte activation observed by flow cytometry after treatment of PBMCs with Capan-2 EVs was in agreement with the results of proteomic analysis of CD3+ in the same experimental setting. In particular, IPA functional proteomic analysis of CD3+ lymphocytes identified several upstream regulators associated with activation of immune response, such as type I and type II interferon family and other known activators of immune response, such as prolactin and insulin receptor. IPA prediction that gamma interferon was one of the top upstream regulators of CD3+ lymphocytes playing a role in response to treatment of PBMCs with Capan-2 EVs was concordant with ELISA results. Moreover, in support for the activation of CD4+ and CD8+ observed by flow cytometry following treatment of PBMCs with Capan-2 EVs, proteomic analysis indicated that, in the same experimental conditions, several downstream effects predicted by IPA in CD3+ lymphocytes were related to a marked early activation of the immune response. The observation that EVs from one of the PC cell lines analyzed may induce activation of the immune response was somewhat surprising and at odds with the notion that PC is an immune-cold tumor. However, in a previous study, PC-EVs manipulated to deplete their miRNA cargo were shown to induce dendritic cell-mediated activation of CIKs, which shows that under certain conditions PC EVs may have an immunostimulatory potential [20]. Moreover, it is known that cancer EV cargo is heterogeneous and may include immunostimulatory, as well as immunosuppressive molecules [7]. In this study we observed that, even without manipulation, EVs from Capan-2, one of the PC cell lines analyzed, can induce early activation of immune response in CD4+ and CD8+ lymphocytes and that this effect is PC-cell line dependent, since it was not observed with BxPC-3 EVs. Nevertheless, considering that one of the markers induced by Capan-2 EVs is PD1, a marker of early activation/exhaustion, it is conceivable that the expression of this marker could prelude in the long term to in vivo exhaustion of the anti-tumor response in the long term even with EVs from this PC cell line. Considering that pancreatic cancer is one of the most immuno-cold tumors, this possibility will need to be explored in future studies. Nevertheless, it is interesting that EVs from a PC cell line can activate immune response in the short term and in the context of PBMCs that includes costimulatory cells can activate immune response. A better understanding of heterogeneous responses induced by different PC-EVs could be relevant in the design of rational EV-based antitumor vaccination protocols.

5. Conclusions

Previous studies highlighted that pancreatic cancer EVs may exert a direct immunosuppressive role on pre-stimulated T cells [12], but also a dendritic cell-mediated immunostimulatory effect on CIKs after depletion of miRNA cargo, suggesting a pleiotropic potential of PC-EVs on immune system [20]. In this study, we observed that immune related proteins are highly enriched in pancreatic cancer EVs and that “immune system” represents one of the top pathways revealed by proteomic analysis of PC EVs, supporting their key role in immunoregulation. In addition, we observed that PBMC stimulation with unmanipulated Capan-2, but not BxPC-3 PC EVs may produce immunostimulatory effects on CD4+ and CD8+ lymphocytes. We also observed that EVs from healthy donors had no immunostimulatory effect on CD4+ and CD8+ in the context of PBMC derived from heterologous donors, further supporting the observation that the immune activation induced by Capan-2 EVs is not simply due to the heterologous source of EVs and PBMCs. These results are in line with the pleiotropic cargo of cancer EVs [7] that might facilitate either immunostimulatory, or immunosuppressive interactions, at least in the short term. A better understanding of the heterogeneous effects on immunoregulation observed with EVs derived from different pancreatic cancer cell lines might be relevant for the development of highly needed immunotherapeutic strategies in this immune-cold tumor.

Supplementary Materials

The following supporting information can be downloaded at the website of this paper posted on Preprints.org. Supplementary table 1. list of reagent mix used by Flow Cytometry. Supplementary table 2. List of the 95 and 97 proteins identified by proteomic analysis in EVs derived from Capan-2 and BxPC-3, respectively. Supplementary table 3. List of Ingenuity Pathways Analysis (IPA) downstream pathways of functional assignments for Capan-2 EV proteins. Supplementary table 4. Reactome Pathways identified by STRING for Capan-2 and BxPC-3 EV proteins. Supplementary table 5. List of EV Proteins in Capan-2 (orange) vs. BxPC-3 (green) EVs identified by STRING as involved in REACTOME immune system pathway. Supplementary table 6. List of the 60 unique proteins identified by proteomic analysis in CD3+ lymphocytes treated with Capan-2 EVs and not present in untreated CD3

Author Contributions

Conceptualization, A.P, D.B, A.C, S.V; Data curation, M.C.C, P.L, S.Pi, P.S; D.P, A.F; Investigation, A.P, M.C.C, L.D.L, R.F, S.Pa; Methodology, P.L, DB, S.D.F, S.Vesp, G.C, F.V ; Resources, A.C; Supervision, A.C, S.V; Writing—original draft, P.D.B, A.G, A.C, S.V; Writing—review and editing, A.P, P.L, D.B, A.C, S.V; All authors have read and agreed to the published version of the manuscript.

Funding

This study was supported by the Italian Ministry of University and Research, grant PRIN 2017 EKMFTN_005 to Alessandro Cama. The junior researcher position of Serena Pilato is funded by European Union – NextGenerationEU under the National Recovery and Resilience Plan (NRRP) Mission 4 Component 2 – M4C2 Investiment 1.5 – Call for tender No. 3277 of 30.12.2021 Italian Ministry of University – Award Number: ECS00000041; Project Title: “Innovation, digitalization and sustainability for the diffused economy in Central Italy”; Concession Degree No. 1057 of 23.06.2022 adopted by the Italian Ministry of University (CUP D73C22000840006).

Institutional Review Board Statement

The study was conducted according to the guidelines of the Declaration of Helsinki and approved by the Institutional Review Board (or Ethics Committee) of Chieti-Pescara and University “G. d’Annunzio”, Chieti-Pescara (V 1.0, 25 February 2016; V. 2.0, 21 January 2020).

Informed Consent Statement

Informed consent was obtained from all individuals involved in the study.

Conflicts of Interest

The authors declare no conflicts of interest

References

  1. Purushothaman, A.; Oliva-Ramírez, J.; Treekitkarnmongkol, W.; Sankaran, D.; Hurd, M.W.; Putluri, N.; Maitra, A.; Haymaker, C.; Sen, S. Differential Effects of Pancreatic Cancer-Derived Extracellular Vesicles Driving a Suppressive Environment. Int. J. Mol. Sci. 2023, 24. [Google Scholar] [CrossRef] [PubMed]
  2. Liu, C.; He, D.; Li, L.; Zhang, S.; Wang, L.; Fan, Z.; Wang, Y. Extracellular Vesicles in Pancreatic Cancer Immune Escape: Emerging Roles and Mechanisms. Pharmacol. Res. 2022, 183, 106364. [Google Scholar] [CrossRef] [PubMed]
  3. Yáñez-Mó, M.; Siljander, P.R.-M.; Andreu, Z.; Zavec, A.B.; Borràs, F.E.; Buzas, E.I.; Buzas, K.; Casal, E.; Cappello, F.; Carvalho, J.; et al. Biological Properties of Extracellular Vesicles and Their Physiological Functions. J. Extracell. vesicles 2015, 4, 27066. [Google Scholar] [CrossRef] [PubMed]
  4. Simeone, P.; Bologna, G.; Lanuti, P.; Pierdomenico, L.; Guagnano, M.T.; Pieragostino, D.; Del Boccio, P.; Vergara, D.; Marchisio, M.; Miscia, S.; et al. Extracellular Vesicles as Signaling Mediators and Disease Biomarkers across Biological Barriers. Int. J. Mol. Sci. 2020, 21. [Google Scholar] [CrossRef] [PubMed]
  5. De Lellis, L.; Florio, R.; Di Bella, M.C.; Brocco, D.; Guidotti, F.; Tinari, N.; Grassadonia, A.; Lattanzio, R.; Cama, A.; Veschi, S. Exosomes as Pleiotropic Players in Pancreatic Cancer. Biomedicines 2021, 9. [Google Scholar] [CrossRef] [PubMed]
  6. Han, L.; Lam, E.W.-F.; Sun, Y. Extracellular Vesicles in the Tumor Microenvironment: Old Stories, but New Tales. Mol. Cancer 2019, 18, 59. [Google Scholar] [CrossRef]
  7. Marar, C.; Starich, B.; Wirtz, D. Extracellular Vesicles in Immunomodulation and Tumor Progression. Nat. Immunol. 2021, 22, 560–570. [Google Scholar] [CrossRef] [PubMed]
  8. Poggio, M.; Hu, T.; Pai, C.-C.; Chu, B.; Belair, C.D.; Chang, A.; Montabana, E.; Lang, U.E.; Fu, Q.; Fong, L.; et al. Suppression of Exosomal PD-L1 Induces Systemic Anti-Tumor Immunity and Memory. Cell 2019, 177, 414–427.e13. [Google Scholar] [CrossRef] [PubMed]
  9. Ma, F.; Vayalil, J.; Lee, G.; Wang, Y.; Peng, G. Emerging Role of Tumor-Derived Extracellular Vesicles in T Cell Suppression and Dysfunction in the Tumor Microenvironment. J. Immunother. cancer 2021, 9. [Google Scholar] [CrossRef]
  10. Baig, M.S.; Roy, A.; Rajpoot, S.; Liu, D.; Savai, R.; Banerjee, S.; Kawada, M.; Faisal, S.M.; Saluja, R.; Saqib, U.; et al. Tumor-Derived Exosomes in the Regulation of Macrophage Polarization. Inflamm. Res. 2020, 69, 435–451. [Google Scholar] [CrossRef]
  11. Nannan, L.; Oudart, J.-B.; Monboisse, J.C.; Ramont, L.; Brassart-Pasco, S.; Brassart, B. Extracellular Vesicle-Dependent Cross-Talk in Cancer-Focus on Pancreatic Cancer. Front. Oncol. 2020, 10, 1456. [Google Scholar] [CrossRef] [PubMed]
  12. Shen, T.; Huang, Z.; Shi, C.; Pu, X.; Xu, X.; Wu, Z.; Ding, G.; Cao, L. Pancreatic Cancer-Derived Exosomes Induce Apoptosis of T Lymphocytes through the P38 MAPK-Mediated Endoplasmic Reticulum Stress. FASEB J. 2020, 34, 8442–8458. [Google Scholar] [CrossRef] [PubMed]
  13. Ding, G.; Zhou, L.; Qian, Y.; Fu, M.; Chen, J.; Chen, J.; Xiang, J.; Wu, Z.; Jiang, G.; Cao, L. Pancreatic Cancer-Derived Exosomes Transfer MiRNAs to Dendritic Cells and Inhibit RFXAP Expression via MiR-212-3p. Oncotarget 2015, 6, 29877–29888. [Google Scholar] [CrossRef] [PubMed]
  14. Basso, D.; Gnatta, E.; Padoan, A.; Fogar, P.; Furlanello, S.; Aita, A.; Bozzato, D.; Zambon, C.-F.; Arrigoni, G.; Frasson, C.; et al. PDAC-Derived Exosomes Enrich the Microenvironment in MDSCs in a SMAD4-Dependent Manner through a New Calcium Related Axis. Oncotarget 2017, 8, 84928–84944. [Google Scholar] [CrossRef] [PubMed]
  15. Menay, F.; Herschlik, L.; De Toro, J.; Cocozza, F.; Tsacalian, R.; Gravisaco, M.J.; Di Sciullo, M.P.; Vendrell, A.; Waldner, C.I.; Mongini, C. Exosomes Isolated from Ascites of T-Cell Lymphoma-Bearing Mice Expressing Surface CD24 and HSP-90 Induce a Tumor-Specific Immune Response. Front. Immunol. 2017, 8, 286. [Google Scholar] [CrossRef] [PubMed]
  16. Daßler-Plenker, J.; Reiners, K.S.; van den Boorn, J.G.; Hansen, H.P.; Putschli, B.; Barnert, S.; Schuberth-Wagner, C.; Schubert, R.; Tüting, T.; Hallek, M.; et al. RIG-I Activation Induces the Release of Extracellular Vesicles with Antitumor Activity. Oncoimmunology 2016, 5, e1219827. [Google Scholar] [CrossRef] [PubMed]
  17. Gastpar, R.; Gehrmann, M.; Bausero, M.A.; Asea, A.; Gross, C.; Schroeder, J.A.; Multhoff, G. Heat Shock Protein 70 Surface-Positive Tumor Exosomes Stimulate Migratory and Cytolytic Activity of Natural Killer Cells. Cancer Res. 2005, 65, 5238–5247. [Google Scholar] [CrossRef]
  18. Kahlert, C.; Kalluri, R. Exosomes in Tumor Microenvironment Influence Cancer Progression and Metastasis. J. Mol. Med. (Berl). 2013, 91, 431–437. [Google Scholar] [CrossRef]
  19. Wolfers, J.; Lozier, A.; Raposo, G.; Regnault, A.; Théry, C.; Masurier, C.; Flament, C.; Pouzieux, S.; Faure, F.; Tursz, T.; et al. Tumor-Derived Exosomes Are a Source of Shared Tumor Rejection Antigens for CTL Cross-Priming. Nat. Med. 2001, 7, 297–303. [Google Scholar] [CrossRef]
  20. Que, R.-S.; Lin, C.; Ding, G.-P.; Wu, Z.-R.; Cao, L.-P. Increasing the Immune Activity of Exosomes: The Effect of MiRNA-Depleted Exosome Proteins on Activating Dendritic Cell/Cytokine-Induced Killer Cells against Pancreatic Cancer. J. Zhejiang Univ. Sci. B 2016, 17, 352–360. [Google Scholar] [CrossRef]
  21. Ricklefs, F.L.; Alayo, Q.; Krenzlin, H.; Mahmoud, A.B.; Speranza, M.C.; Nakashima, H.; Hayes, J.L.; Lee, K.; Balaj, L.; Passaro, C.; et al. Immune Evasion Mediated by PD-L1 on Glioblastoma-Derived Extracellular Vesicles. Sci. Adv. 2018, 4, eaar2766. [Google Scholar] [CrossRef] [PubMed]
  22. Théry, C.; Amigorena, S.; Raposo, G.; Clayton, A. Isolation and Characterization of Exosomes from Cell Culture Supernatants and Biological Fluids. Curr. Protoc. Cell Biol. 2006, 30. [Google Scholar] [CrossRef] [PubMed]
  23. Veschi, S.; De Lellis, L.; Florio, R.; Lanuti, P.; Massucci, A.; Tinari, N.; De Tursi, M.; di Sebastiano, P.; Marchisio, M.; Natoli, C.; et al. Effects of Repurposed Drug Candidates Nitroxoline and Nelfinavir as Single Agents or in Combination with Erlotinib in Pancreatic Cancer Cells. J. Exp. Clin. Cancer Res. 2018, 37, 236. [Google Scholar] [CrossRef] [PubMed]
  24. Di Marco, M.; Veschi, S.; Lanuti, P.; Ramassone, A.; Pacillo, S.; Pagotto, S.; Pepe, F.; George-William, J.N.; Curcio, C.; Marchisio, M.; et al. Enhanced Expression of MiR-181b in B Cells of CLL Improves the Anti-Tumor Cytotoxic T Cell Response. Cancers (Basel). 2021, 13. [Google Scholar] [CrossRef] [PubMed]
  25. Cossarizza, A.; Chang, H.-D.; Radbruch, A.; Acs, A.; Adam, D.; Adam-Klages, S.; Agace, W.W.; Aghaeepour, N.; Akdis, M.; Allez, M.; et al. Guidelines for the Use of Flow Cytometry and Cell Sorting in Immunological Studies (Second Edition). Eur. J. Immunol. 2019, 49, 1457–1973. [Google Scholar] [CrossRef] [PubMed]
  26. Marchisio, M.; Simeone, P.; Bologna, G.; Ercolino, E.; Pierdomenico, L.; Pieragostino, D.; Ventrella, A.; Antonini, F.; Del Zotto, G.; Vergara, D.; et al. Flow Cytometry Analysis of Circulating Extracellular Vesicle Subtypes from Fresh Peripheral Blood Samples. Int. J. Mol. Sci. 2020, 22. [Google Scholar] [CrossRef] [PubMed]
  27. Brocco, D.; Lanuti, P.; Pieragostino, D.; Cufaro, M.C.; Simeone, P.; Bologna, G.; Di Marino, P.; De Tursi, M.; Grassadonia, A.; Irtelli, L.; et al. Phenotypic and Proteomic Analysis Identifies Hallmarks of Blood Circulating Extracellular Vesicles in NSCLC Responders to Immune Checkpoint Inhibitors. Cancers (Basel). 2021, 13. [Google Scholar] [CrossRef] [PubMed]
  28. Falasca, K.; Lanuti, P.; Ucciferri, C.; Pieragostino, D.; Cufaro, M.C.; Bologna, G.; Federici, L.; Miscia, S.; Pontolillo, M.; Auricchio, A.; et al. Circulating Extracellular Vesicles as New Inflammation Marker in HIV Infection. AIDS 2021, 35, 595–604. [Google Scholar] [CrossRef] [PubMed]
  29. Madonna, R.; Pieragostino, D.; Cufaro, M.C.; Doria, V.; Del Boccio, P.; Deidda, M.; Pierdomenico, S.D.; Dessalvi, C.C.; De Caterina, R.; Mercuro, G. Ponatinib Induces Vascular Toxicity through the Notch-1 Signaling Pathway. J. Clin. Med. 2020, 9. [Google Scholar] [CrossRef]
  30. Krämer, A.; Green, J.; Pollard, J.; Tugendreich, S. Causal Analysis Approaches in Ingenuity Pathway Analysis. Bioinformatics 2014, 30, 523–530. [Google Scholar] [CrossRef]
  31. Théry, C.; Witwer, K.W.; Aikawa, E.; Alcaraz, M.J.; Anderson, J.D.; Andriantsitohaina, R.; Antoniou, A.; Arab, T.; Archer, F.; Atkin-Smith, G.K.; et al. Minimal Information for Studies of Extracellular Vesicles 2018 (MISEV2018): A Position Statement of the International Society for Extracellular Vesicles and Update of the MISEV2014 Guidelines. J. Extracell. vesicles 2018, 7, 1535750. [Google Scholar] [CrossRef]
  32. Welsh, J.A.; Goberdhan, D.C.I.; O’Driscoll, L.; Buzas, E.I.; Blenkiron, C.; Bussolati, B.; Cai, H.; Di Vizio, D.; Driedonks, T.A.P.; Erdbrügger, U.; et al. Minimal Information for Studies of Extracellular Vesicles (MISEV2023): From Basic to Advanced Approaches. J. Extracell. vesicles 2024, 13, e12404. [Google Scholar] [CrossRef] [PubMed]
  33. Cibrián, D.; Sánchez-Madrid, F. CD69: From Activation Marker to Metabolic Gatekeeper. Eur. J. Immunol. 2017, 47, 946–953. [Google Scholar] [CrossRef]
  34. Buzzai, A.C.; Wagner, T.; Audsley, K.M.; Newnes, H. V.; Barrett, L.W.; Barnes, S.; Wylie, B.C.; Stone, S.; McDonnell, A.; Fear, V.S.; et al. Diverse Anti-Tumor Immune Potential Driven by Individual IFNα Subtypes. Front. Immunol. 2020, 11, 542. [Google Scholar] [CrossRef] [PubMed]
  35. Boukhaled, G.M.; Harding, S.; Brooks, D.G. Opposing Roles of Type I Interferons in Cancer Immunity. Annu. Rev. Pathol. 2021, 16, 167–198. [Google Scholar] [CrossRef]
  36. Jorgovanovic, D.; Song, M.; Wang, L.; Zhang, Y. Roles of IFN-γ in Tumor Progression and Regression: A Review. Biomark. Res. 2020, 8, 49. [Google Scholar] [CrossRef] [PubMed]
  37. Tsai, S.; Clemente-Casares, X.; Zhou, A.C.; Lei, H.; Ahn, J.J.; Chan, Y.T.; Choi, O.; Luck, H.; Woo, M.; Dunn, S.E.; et al. Insulin Receptor-Mediated Stimulation Boosts T Cell Immunity during Inflammation and Infection. Cell Metab. 2018, 28, 922–934.e4. [Google Scholar] [CrossRef]
  38. Legorreta-Haquet, M.V.; Santana-Sánchez, P.; Chávez-Sánchez, L.; Chávez-Rueda, A.K. The Effect of Prolactin on Immune Cell Subsets Involved in SLE Pathogenesis. Front. Immunol. 2022, 13, 1016427. [Google Scholar] [CrossRef]
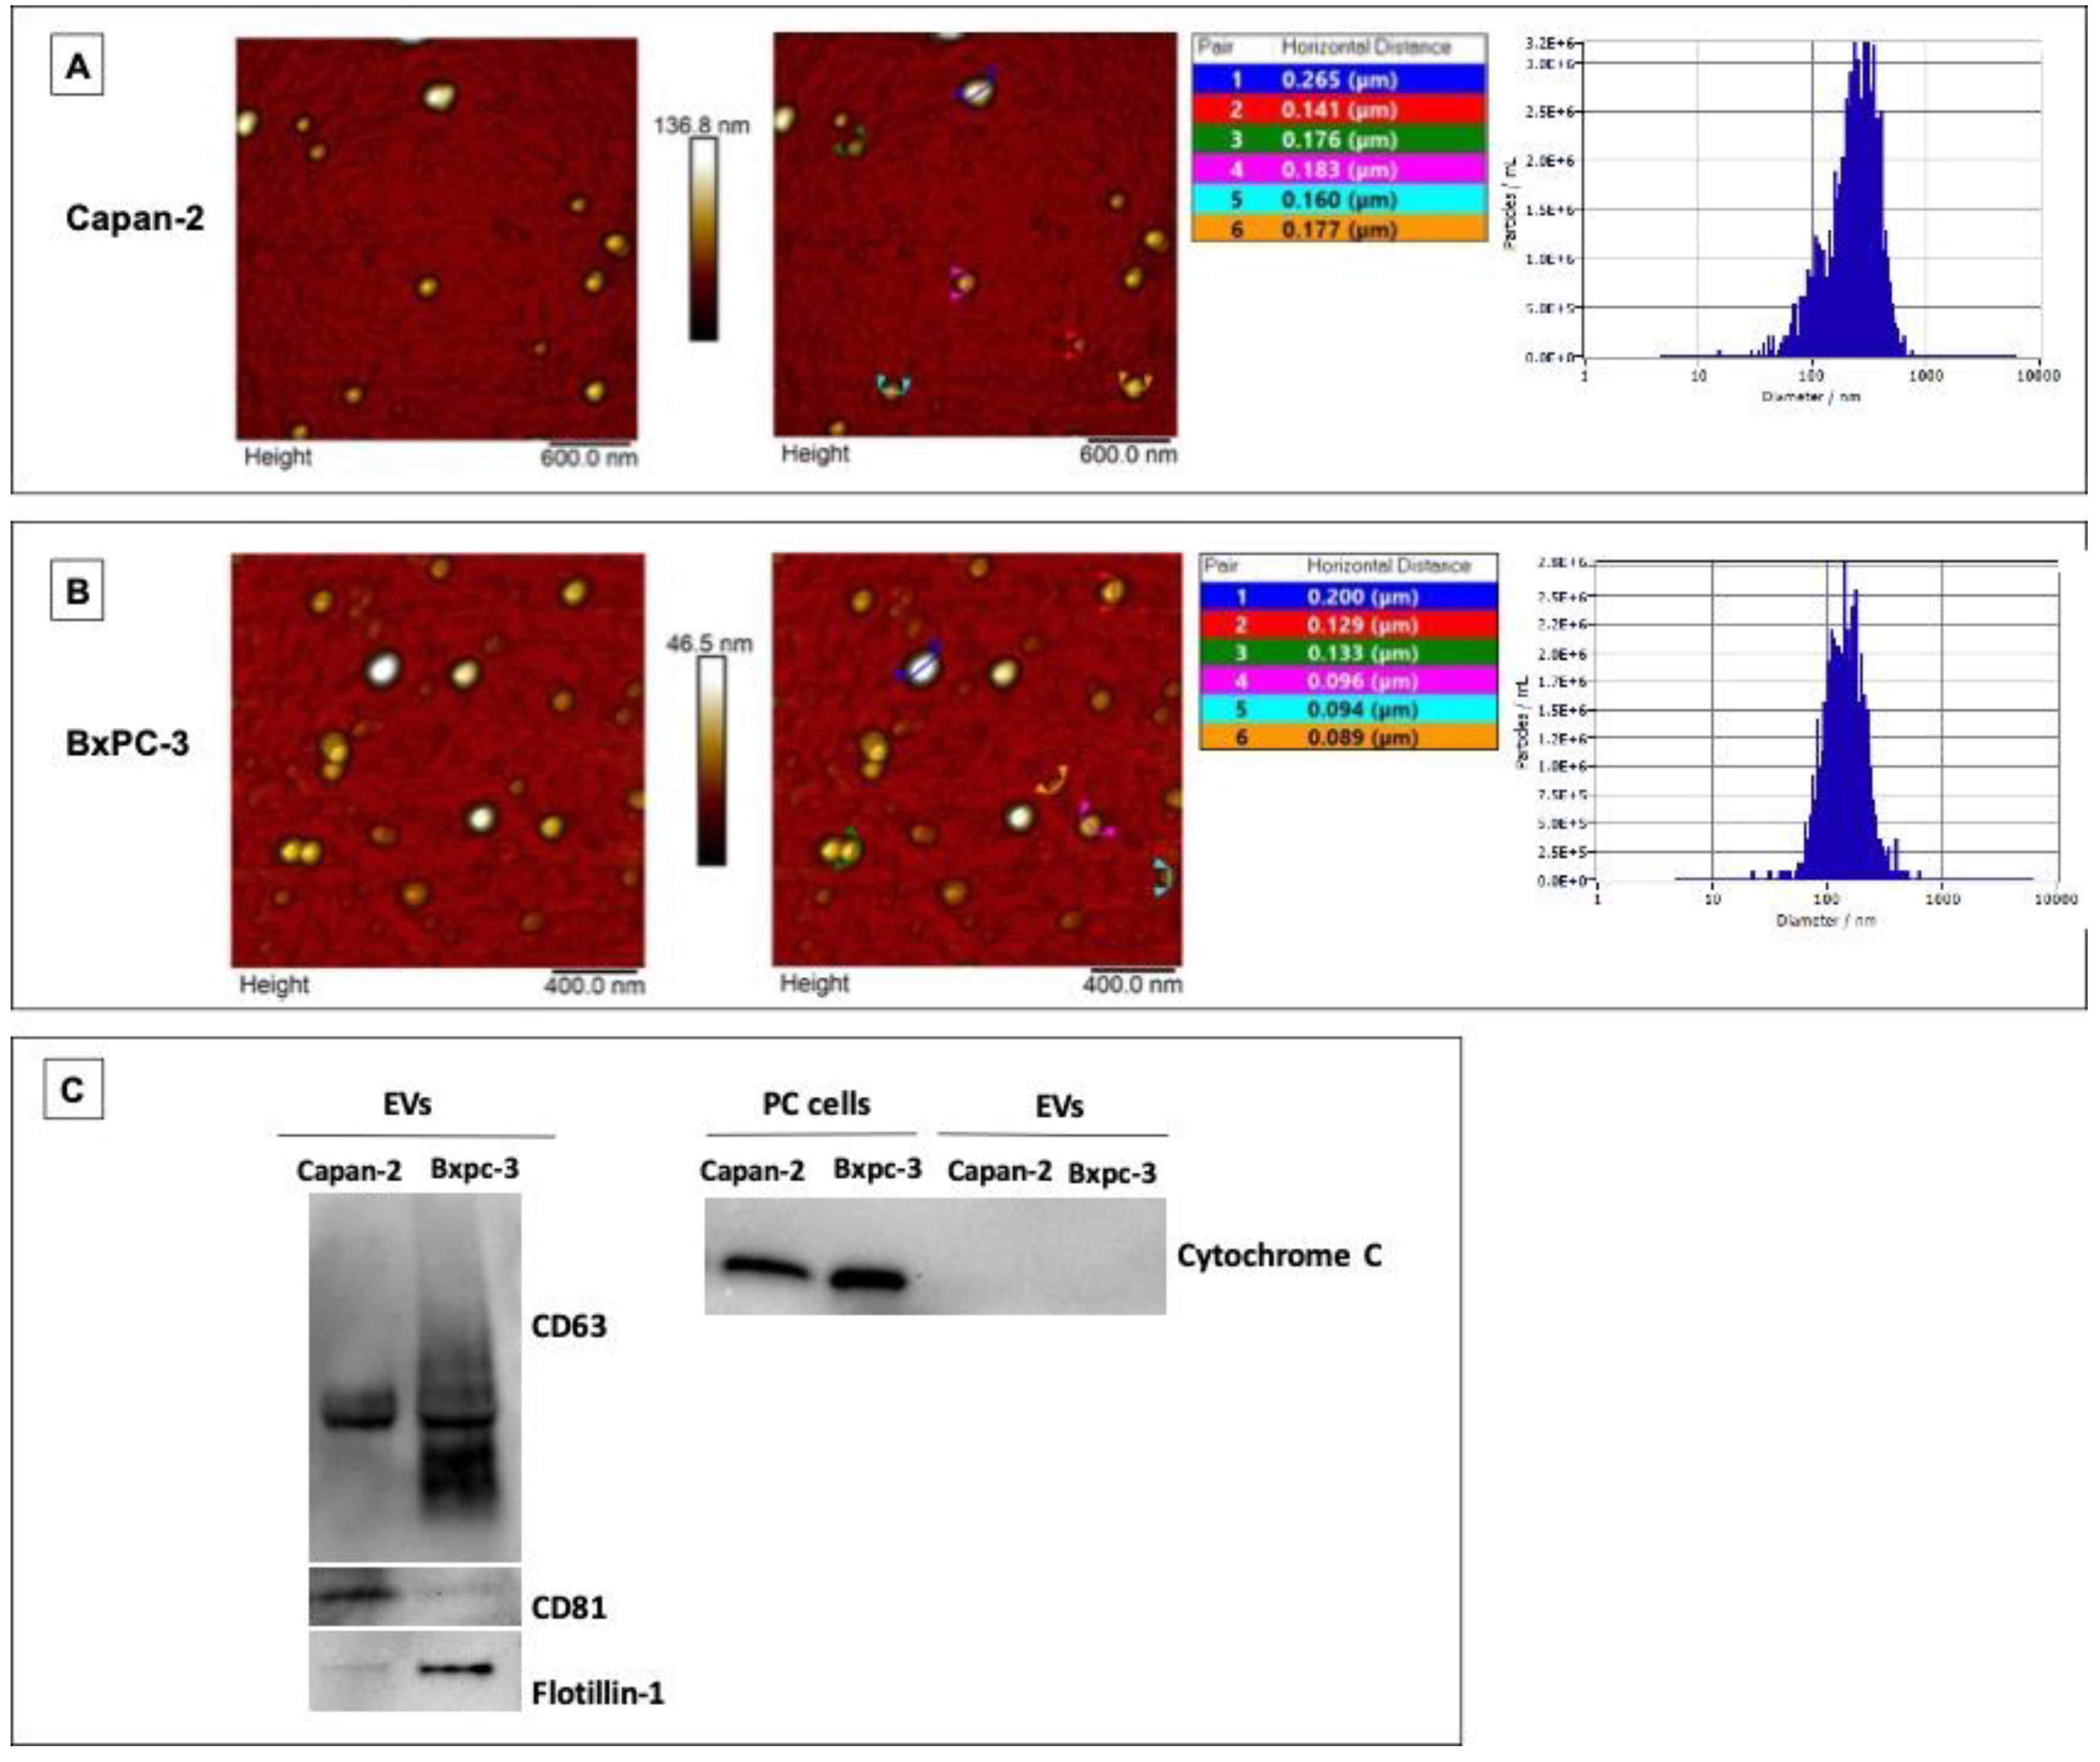
Figure 1. Characterization of Capan-2 and BXPC-3 derived EVs. Morphological features by AFM and sizing by NTA of EVs derived from Capan-2 (A) or BxPC-3 (B). 2D Atomic Force Microscopy topography images of EVs isolated from Capan-2 or BXPC-3 cells with corresponding height cross-sectional profiles are shown. In the tables, the horizontal distances related to each couple of colored markers were reported. On the right of panels A and B, Nanoparticle tracking of size (diameter/nm) and concentration (particles/ml) of secreted vesicles produced by Capan-2 or BxPC-3 cells. According to NTA, EVs derived from Capan-2 or BxPC-3 showed an average diameter of 241 nm and 137 nm respectively, falling within the size range detected by AFM. Western blot analysis of EV markers (C). To the left, representative western blot of CD63, CD81 and Flotillin-1 in EVs derived from Capan-2 or BxPC-3. EVs expressed the three positive protein markers. To the right, representative western blot of Cytochrome C, a negative protein marker of EVs, in whole cell lysates of Capan-2 or BxPC-3 and their EVs. As expected, Cytochrome C was not present in vesicle fractions.
Preprints 103691 g001
Figure 2. Protein expression analysis of EVs isolated from Capan-2 and BxPC-3 culture media. A) The panel reports the STRING network of 95 proteins identified in Capan-2 derived EVs. The proteins are connected in a single functional network (PPI enrichment p-value<1.0x10⁻¹⁶). Notably, 83 of the 95 identified proteins are involved in “Extracellular Exosome” (FDR 2.09x10-63), in line with the EV origin of the protein dataset and 53 of the 95 identified proteins are involved in “Immune System” (FDR 1.10x10⁻²⁴). B) The panel reports the STRING network of 97 proteins identified in BXPC-3 derived EVs. The proteins are connected in a single functional network (PPI enrichment p-value<1.0x10⁻¹⁶). Notably, 92 of the 97 identified proteins are involved in “Extracellular Exosome” (FDR 2.74x10-75), in line with the EV origin of the protein dataset and 48 of the 97 identified proteins are involved in “Immune System” (FDR 3.69x10⁻¹⁹).
Preprints 103691 g002
Figure 3. Functional assignments of Capan-2 and BxPC-3 EV proteins. The panel shows the functional assignments of Capan-2 (Panel A) and BxPC-3 (Panel B) EV proteins as bubble plot, where the counts and statistical significance of biological processes obtained with Ingenuity Pathway Analysis (IPA tool) are reported in the legend beside.
Preprints 103691 g003
Figure 4. Capan-2, but not BxPC-3 or control EVs increase the proportion of CD4+CD69+ and CD4+PD1+ lymphocytes. The proportion of CD4+CD69+ lymphocytes was markedly increased after 48-hour treatment of PBMCs with EVs derived from Capan-2 cell line (A), in comparison to untreated PBMCs, whereas treatment with BxPC-3 derived EVs (B) or with heterologous control EVs (C) did not increase the proportion of CD4+CD69+ lymphocytes. The proportion of CD4+PD1+ lymphocytes show a slight increase only after treatment of PBMCs with EVs derived from Capan-2 cells (D), but not with BXPC-3 derived EVs (E) or with heterologous control EVs (F). The graphed results are the mean + SD of at least three determinations, using PBMCs and heterologous EVs isolated from two different healthy donors. *Statistically significant differences between untreated PBMCs and EV-treated PBMCs (*p < 0.05, **p < 0.01).
Preprints 103691 g004
Figure 5. Capan-2, but not BxPC-3 or control EVs increase the proportion of CD8+CD69+ and CD8+PD1+ lymphocytes. The proportion of CD8+CD69+ lymphocytes is increased after 48-hour treatment of PBMCs with EVs derived from Capan-2 cell line (A), in comparison to untreated PBMCs, whereas treatment with BxPC-3 derived EVs (B) did not increase the proportion of CD8+CD69+ lymphocytes. A slight decrease in the proportion of CD8+CD69+ lymphocytes was observed after treatment with heterologous control EVs (C). The proportion of CD8+PD1+ lymphocytes show an increase only after treatment with EVs derived from Capan-2 cells (D), but not with BXPC-3 derived EVs (E) or with heterologous control EVs (F). The graphed results are the mean + SD of at least three determinations, using PBMCs and heterologous EVs isolated from two different healthy donors. *Statistically significant differences between untreated PBMCs and EV-treated PBMCs (**p < 0.01, ***p < 0.001).
Preprints 103691 g005
Figure 6. Upstream regulators analysis by IPA. A) The figure reports the main upstream effects highlighted by functional proteomics analysis induced in CD3 by treatment of PBMCs with Capan-2-derived EVs (Capan-2 EV treated/untreated CD3), versus those induced by heterologous control EVs derived from CD3+ isolated from healthy donors (Control EV treated/untreated CD3). The box color is directly proportional to z-score values (orange for the activation and blue for the inhibition). Z-score values ˃ 2 or < -2 were considered statistically significant for activation or inhibition, respectively.
Preprints 103691 g006
Figure 7. Downstream effects analysis by IPA. The Table reports the main downstream effects highlighted by functional proteomics analysis induced in CD3 by Capan-2-derived EVs (Capan-2 EV treated/untreated CD3), versus those induced by heterologous control EVs (Control EV treated/untreated CD3). The box color is directly proportional to z-score values (orange for the activation and blue for the inhibition). Z-score values ˃ 2 or < -2 were considered statistically significant for activation or inhibition, respectively.
Preprints 103691 g007
Figure 8. Capan-2 derived EVs increase IFNG secretion in PBMCs as predicted by proteomic analysis. A) According to upstream regulators analysis by IPA, IFNG is one of the most activated upstream regulators of CD3+ lymphocytes after treatment of PBMCs with Capan-2 EVs and the panel shows the mechanistic network generated by IPA software, where orange nodes and edges indicate activation, while blue nodes and edges indicate inhibition. Yellow and grey reveal an inconsistent and a no predicted relationship between upstream regulators. Color intensity is directly proportional to the statistical significance of the predicted activation or inhibition. Numbers under the transcriptional regulators indicates the protein fold changes observed by LC-MS/MS analysis. B) Measurement of IFNG concentration (pg/ml) by ELISA assay in supernatants of PBMCs treated or untreated (CTRL) with Capan-2 EVs. PBMCs were isolated from 3 different healthy donors (#1, #2 and #3). IFNG concentrations were increased in supernatants of PBMCs from all three healthy donors treated with Capan-2 EVs, in comparison to untreated PBMCs.
Preprints 103691 g008
Disclaimer/Publisher’s Note: The statements, opinions and data contained in all publications are solely those of the individual author(s) and contributor(s) and not of MDPI and/or the editor(s). MDPI and/or the editor(s) disclaim responsibility for any injury to people or property resulting from any ideas, methods, instructions or products referred to in the content.
Copyright: This open access article is published under a Creative Commons CC BY 4.0 license, which permit the free download, distribution, and reuse, provided that the author and preprint are cited in any reuse.
Prerpints.org logo

Preprints.org is a free preprint server supported by MDPI in Basel, Switzerland.

Subscribe

© 2024 MDPI (Basel, Switzerland) unless otherwise stated