
Submitted:
12 April 2024
Posted:
15 April 2024
You are already at the latest version
Abstract
Uterine pathologies pose a challenge to women’s health on a global scale. Despite extensive research, the causes and origin of some of these common disorders are not well defined yet. This study presents a comprehensive analysis of transcriptome data from diverse datasets encompassing relevant uterine pathologies such as endometriosis, endometrial cancer and uterine leiomyomas. Leveraging the Comparative Analysis of Shapley values (CASh) technique, we demonstrate its efficacy in improving the outcomes of classical differential expression analysis on transcriptomic data derived from microarray experiments. CASh integrates the Microarray game algorithm with Bootstrap resampling, offering a robust statistical framework to mitigate the impact of potential outliers in the expression data. Our findings unveil novel insights into the molecular signatures underlying these gynecological disorders, highlighting CASh as a valuable tool for enhancing the precision of transcriptomics analyses in complex biological contexts. This research contributes to a deeper understanding of gene expression patterns and potential biomarkers associated with these pathologies, offering implications for future diagnostic and therapeutic strategies.
Keywords:
endometrial cancer
; endometriosis
; microarrays
; systems biology
; transcriptomics
; uterine leiomyomas
1. Introduction
Disorders affecting the uterus represent significant burdens on women’s health worldwide. These conditions, characterized by aberrant cellular proliferation and tissue growth within the uterine environment, manifest with diverse clinical presentations and pose substantial challenges in diagnosis and management [1]. Endometriosis is defined as a debilitating gynecological disorder characterized by the presence of endometrial-like tissue outside the uterine cavity. This chronic widespread condition affecting up to 10% of women of reproductive age commonly causes pelvic pain, infertility and menstrual irregularities, among other symptoms [2]. Uterine leiomyomas, often known as fibroids, are benign smooth muscle tumors that arise within the uterine wall and are prevalent in up to 70% of women by the age of 50, often causing symptoms such as abnormal uterine bleeding, pelvic pressure, and reproductive dysfunction [3]. Endometrial cancer, originating from the malignant transformation of the endometrial lining, ranks as the most common gynecologic malignancy in developed countries, with an increasing incidence observed globally [4]. Despite the high prevalence of these common gynecological conditions and the ongoing debate about the existence of a genetic overlap and comorbidity among them, the molecular basis of these pathologies has yet to be determined [1,5]. Thus, understanding the molecular mechanisms underlying uterine pathologies is crucial for the development of targeted therapeutic interventions and improved patient outcomes [6].
Advances in omics technologies, particularly in microarray analyses, have paved the way to the comprehensive exploration of gene expression patterns associated with uterine conditions [7,8,9,10,11,12,13]. Microarray technologies provide the measurement of the expression levels for thousands of genes at a glance, which allows to obtain a deeper insight into the dysregulated molecular pathways implicated in the pathogenesis of several diseases [14,15,16,17,18]. The identification of differentially expressed genes (DEGs) represents a keystone in microarray data analysis. Classical approaches for microarray data analyses usually apply Welch’s t-test as a statistical method for the identification of DEGs by comparing expression levels between two experimental groups or conditions [19,20]. However, traditional methods may overlook significant changes at gene expression level, especially in complex diseases such as those affecting the uterus, which possess heterogeneous molecular profiles [21,22]. To overcome this limitation, alternative methods can be applied to help untangle the complexity underlying transcriptomics datasets [23,24,25].
In the present study, we aim to investigate the gene expression profiles associated with three of the most common uterine pathologies through the application of two different methods for microarray data analysis: i) a conventional method using Welch’s t-test and ii) a complementary analysis based on the Comparative Analysis of Shapley value (CASh) method derived from Game Theory, a method we have previously demonstrated that significantly increases the power to identify DEGs [25].
2. Materials and Methods
2.1. Microarray Expression Data Acquisition and Processing
Microarray data were obtained from Gene Expression Omnibus (GEO) database (https://www.ncbi.nlm.nih.gov/geo/). For the selection of datasets of interest, raw data from Affymetrix commercial microarrays Affymetrix Human Genome U133A Array (HG-U133A), Affymetrix Human Genome U133A 2.0 Array (HG-U133A_2), Affymetrix Human Genome U133 Plus 2.0 Array (HG-U133_Plus_2), and Affymetrix Human Gene 1.0 ST Array [transcript (gene) version] (HuGene-1_0-st), were accessed preferentially, when possible.
CEL files from two datasets of endometriosis (GSE7846, GSE17504), two datasets of uterine leiomyomas (GSE12814, GSE23112), and two datasets of endometrial cancer (GSE36389, GSE63678) were retrieved from GEO repository. Raw data were downloaded for each dataset and preprocessing, quality control and normalization based on relative log expression (RLE), normalized unscaled standard error (NUSE), and Robust Multi-Array Average expression measure (RMA) methods were computed using ‘affy’ and ‘affyPLM’ packages in RStudio (version 2021.09.0) [26,27,28]. Finally, expression matrices were generated and samples were classified into experimental and control groups for further analyses (Supplementary Table S1).
Each dataset was processed independently in order to identify DEGs. To conduct differential expression analyses between patients and controls, two approaches were performed: i) a conventional approach based on the utilization of Welch’s t-test, and ii) an alternative method rooted on CASh technique.
2.1.1. Classical Approach
Conventional analyses for the detection of DEGs were performed using the Welch’s t-test implemented in the ‘multtest’ package in RStudio (version 2021.09.0) [29].
The significant DEGs were detected after multiple testing correction using the Benjamini & Hochberg method to control for False Discovery Rates (FDR) [30]. A significance threshold of an adjusted p-value (FDR) < 0.05 was applied.
2.1.2. Alternative Approach
We applied the Comparative Analysis of Shapley value (CASh) method to identify DEGs based on their cooperative contribution to overall gene expression changes [31]. The Shapley value, a concept derived from Game Theory, quantifies the marginal contribution of each gene to the collective expression change observed in the dataset [32]. CASh is a statistical technique that combines the Microarray Game algorithm (applied to transcriptomic values obtained from microarray experiments) with the Bootstrap technique, that applies random resampling of certain values, aiming to compensate for potential outliers in the data matrix [31,33,34,35]. Therefore, CASh considers gene expression as a cooperative game, where each gene contributes to the observed expression changes in a collaborative manner.
In our study, CASh method was applied to the detection of DEGs using two levels of restriction by stablishing 0.01 (more restrictive) and 0.05 (less restrictive) as cutoff p-values. Bootstrap resampling with 1000 iterations was computed in each analysis. In addition, Fold Changes (FC) were evaluated. Genes with p-values below 0.01 and 0.05 and |FC|>1.5 were considered as statistically significant.
2.1.3. Gene Set Enrichment Analysis and Functional Annotation
g:Profiler functional profiling tool g:GOSt (https://biit.cs.ut.ee/gprofiler/gost) was used to determine the enriched biological processes and pathways modulated by the DEGs based on Gene Ontology (GO) terms [36,37].
When needed, transcripts IDs were annotated and converted into official gene symbols using g:Convert tool (https://biit.cs.ut.ee/gprofiler/convert) from g:Profiler webserver [36,37]. For ambiguous transcripts names, IDs with the most GO annotations were utilized.
Three main GO categories were evaluated: biological processes (BP), cellular components (CC), and molecular functions (MF). GO terms with a Benjamini-Hochberg FDR <0.05 were considered to be significantly enriched. Top-ten significantly enriched GO terms in each category were plotted for CASh 0.05 comparisons using ‘ggplot2’ RStudio package [38].
3. Results
3.1. Datasets and Samples Analyzed
Gene expression data from six datasets covering a total of 68 samples was accessed. Table 1 describes the main characteristics of the datasets included in our study.
Datasets were analyzed for the detection of DEGs using two different strategies. First, the use of conventional methods based on Welch’s t-test was applied. Then, an alternative analysis based on CASh method was performed. The use of Welch’s t-test did not allow us to identify any DEGs, while several transcripts were revealed when using CASh method with both 0.01 and 0.05 cutoff p-values (Table 2). Total lists of DEGs for each dataset detected after each comparison are shown in Supplementary Table 2. Our analyses revealed that the application of CASh method allows a better detection of differentially expressed genes in the six datasets analyzed.
3.2. Functional Enrichment Analysis of the Differentially Expressed Genes
Given the restrictive criteria applied when running CASh 0.01 method, the number of DEGs detected did not allow to obtain a number of significantly enriched pathways associated to some genesets (data not shown). However, functional enrichment analysis of the differentially expressed genes obtained after the application of CASh 0.05 method revealed relevant significantly enriched processes in the analyzed datasets. In endometrial cancer datasets (GSE36389 and GSE63678), DEGs were mainly related to biological processes (BP) such as development and morphogenesis, whereas cellular components (CC) and molecular functions (MF) were mainly associated with extracellular locations and binding, respectively (Figure 1).
Regarding datasets of endometriosis (GSE7846 and GSE17504), the top significantly enriched BP were related to development, regulation of several cellular processes and morphogenesis. CC results revealed extracellular regions, cell surface and vesicles to be significantly relevant, and MF analysis detected functions mainly associated to protein activity (Figure 2).
Gene set enrichment analysis of the differentially expressed genes obtained after the application of CASh 0.05 method in uterine leiomyomas datasets (GSE12814 and GSE23112) revealed the regulation of several biological processes as significantly enriched BP, while membrane and binding processes were detected as significantly enriched CC and MF, respectively (Figure 3).
4. Discussion
Uterine pathologies impact women’s health and quality of life considerably. In recent years, the advent of omics technologies has facilitated a comprehensive exploration of molecular patterns associated with some of the most common gynecological conditions [39,40,41,42]. Microarray technology emerged about three decades ago with the aim of studying whole gene expression profiles, and the analysis of the amount of data derived from the application of this powerful tool has provided unprecedented insights into the discovery of dysregulated molecular pathways implicated in disease pathogenesis [43,44]. In the present study, we analyzed data from six datasets generated from the application of Affymetrix microarray devices: two datasets from endometrial cancer, two datasets from endometriosis and two datasets from uterine leiomyomas.
Raw data were downloaded from GEO public repository, and gene expression files were pre-processed, quality controlled and normalized. For the detection of DEGs, two strategies were adopted: i) a traditional approach based on the use of classical statistical t-tests and ii) an alternative approach using CASh method [31]. We were not able to detect any DEGs using traditional approaches, while the use of CASh method revealed a number of statistically significant genes in the six datasets analyzed. The t-test selects genes according to their differential expression between the two study conditions at an individual level. Thus, genes are considered significant when its p-value is below a stablished threshold (0.05 adj. p-value in our study). On the other hand, CASh method considers not only the expression of each gene under two conditions but the contribution of those genes that consistently interact with other genes, using the Shapley value to measure this contribution. Therefore, CASh highlights the most relevant genes as those that not only explain the differences between two conditions, but also play an important role over all possible permutations of genes [31,33,34,35]. In brief, CASh offers a more nuanced understanding of gene interactions and their collective impact on disease pathophysiology.
Interestingly, functional enrichment analysis of the DEGs detected using CASh method confirmed previous findings on the molecular bases of the uterine pathologies analyzed in our study. Some processes related to cell cycle and proliferation events have been shown to be significantly dysregulated in our sets of DEGs. Given the nature of endometrial cancer and endometriosis, it is plausible to believe that alterations at gene expression levels in some genes involved in these proliferative pathways may contribute to the phenotype of these diseases, as it has been previously proposed [45,46]. Further, a possible role of the degradation and remodeling of the extracellular matrix in endometriosis datasets has been revealed in our study. Endometriotic tissues have been shown to be significantly associated to extracellular matrix reorganization in some studies, which may explain some of the molecular mechanisms underlying the progression of the disease [47,48,49,50]. Regarding uterine leiomyomas, we were able to detect some significantly enriched biological processes that have been previously reported in association with the disease such as hormone secretion and cell signaling [51].
Our preliminary results underscore the potential of CASh as a valuable tool for analyzing microarray data. Further extensive research, including validation studies on larger cohorts and functional assays, is warranted to confirm the robustness and clinical relevance of the identified molecular signatures.
5. Conclusions
The Comparative Analysis of Shapley value seems to improve the detection of differentially expressed genes from microarray datasets compared to classical statistical techniques based on the use of t-tests in the context of complex diseases such as those affecting the uterus. By identifying key DEGs and elucidating their functional roles and interactions, we seek to advance our understanding of the underlying mechanisms driving disease origin and progression, thus paving the way for the development of targeted therapeutic strategies tailored to the management of women with uterine pathologies.
Supplementary Materials
The following supporting information can be downloaded at the website of this paper posted on Preprints.org, Table S1: Technical description of the datasets analyzed in the present study; Table S2: Differentially expressed genes obtained from each dataset after statistical analyses.
Author Contributions
Conceptualization, F.J.E. and J.A.C.-M.; methodology, F.J.E., E.V. and J.A.C.-M.; software, F.J.E. and J.A.C.-M.; validation, L.D.-B. and F.J.E.; formal analysis, J.A.C.-M.; investigation, J.A.C.-M., E.V., L.D.-B. and F.J.E.; resources, F.J.E.; data curation, E.V., L.D.-B. and F.J.E.; writing—original draft preparation, J.A.C.-M. and E.V.; writing—review and editing, J.A.C.-M., E.V., L.D.-B. and F.J.E.; visualization, J.A.C.-M.; supervision, E.V., L.D.-B. and F.J.E.; project administration, F.J.E.; funding acquisition, F.J.E. All authors have read and agreed to the published version of the manuscript.
Funding
The research group receives funding for research from the University of Jaén (PAIUJA-EI_CTS02_2023) and from the Junta de Andalucía (BIO-302). F.J.E. is partially financed by the Ministry of Science and Innovation, the State Research Agency (AEI), and the European Regional Development Fund (ERDF - Ref: PID2021-122991NB-C21).
Data Availability Statement
Microarray data were obtained from Gene Expression Omnibus (GEO) database (https://www.ncbi.nlm.nih.gov/geo) as stated above. The custom scripts used for data analysis can be shared with anyone who requests them from the corresponding author.
Conflicts of Interest
The authors declare no conflicts of interest.
References
- Devesa-Peiro, A.; Sebastian-Leon, P.; Garcia-Garcia, F.; Arnau, V.; Aleman, A.; Pellicer, A.; Diaz-Gimeno, P. Uterine disorders affecting female fertility: what are the molecular functions altered in endometrium? Fertil. Steril. 2020, 113, 1261–1274. [Google Scholar] [CrossRef] [PubMed]
- Giudice, L.C.; Horne, A.W.; Missmer, S.A. Time for global health policy and research leaders to prioritize endometriosis. Nat. Commun. 2023, 14, 8028. [Google Scholar] [CrossRef] [PubMed]
- Giuliani, E.; As-Sanie, S.; Marsh, E.E. Epidemiology and management of uterine fibroids. Int. J. Gynaecol. Obstet. 2020, 149, 3–9. [Google Scholar] [CrossRef] [PubMed]
- Crosbie, E.J.; Kitson, S.J.; McAlpine, J.N.; Mukhopadhyay, A.; Powell, M.E.; Singh, N. Endometrial cancer. Lancet 2022, 399, 1412–1428. [Google Scholar] [CrossRef] [PubMed]
- Geng, R.; Huang, X.; Li, L.; Guo, X.; Wang, Q.; Zheng, Y.; Guo, X. Gene expression analysis in endometriosis: Immunopathology insights, transcription factors and therapeutic targets. Front. Immunol. 2022, 13, 1037504. [Google Scholar] [CrossRef] [PubMed]
- Giudice, L.C.; Oskotsky, T.T.; Falako, S.; Opoku-Anane, J.; Sirota, M. Endometriosis in the era of precision medicine and impact on sexual and reproductive health across the lifespan and in diverse populations. FASEB J. 2023, 37, e23130. [Google Scholar] [CrossRef] [PubMed]
- Buyukcelebi, K.; Duval, A.J.; Abdula, F.; Elkafas, H.; Seker-Polat, F.; Adli, M. Integrating leiomyoma genetics, epigenomics, and single-cell transcriptomics reveals causal genetic variants, genes, and cell types. Nat. Commun. 2024, 15, 1169. [Google Scholar] [CrossRef]
- Hever, A.; Roth, R.B.; Hevezi, P.A.; Lee, J.; Willhite, D.; White, E.C.; Marin, E.M.; Herrera, R.; Acosta, H.M.; Acosta, A.J.; Zlotnik, A. Molecular characterization of human adenomyosis. Mol. Hum. Reprod. 2006, 12, 737–748. [Google Scholar] [CrossRef]
- Maxwell, G.L.; Chandramouli, G.V.; Dainty, L.; Litzi, T.J.; Berchuck, A.; Barrett, J.C.; Risinger, J.I. Microarray analysis of endometrial carcinomas and mixed mullerian tumors reveals distinct gene expression profiles associated with different histologic types of uterine cancer. Clin. Cancer Res. 2005, 11, 4056–4066. [Google Scholar] [CrossRef]
- Risinger, J.I.; Maxwell, G.L.; Chandramouli, G.V.; Jazaeri, A.; Aprelikova, O.; Patterson, T.; Berchuck, A.; Barrett, J.C. Microarray analysis reveals distinct gene expression profiles among different histologic types of endometrial cancer. Cancer Res. 2003, 63, 6–11. [Google Scholar]
- Wang, H.; Mahadevappa, M.; Yamamoto, K.; Wen, Y.; Chen, B.; Warrington, J.A.; Polan, M.L. Distinctive proliferative phase differences in gene expression in human myometrium and leiomyomata. Fertil. Steril. 2003, 80, 266–276. [Google Scholar] [CrossRef] [PubMed]
- Wang, Y.; Chen, Y.; Xiao, Y.; Ruan, J.; Tian, Q.; Cheng, Q.; Chang, K.; Yi, X. Distinct subtypes of endometriosis identified based on stromal-immune microenvironment and gene expression: implications for hormone therapy. Front. Immunol. 2023, 14, 1133672. [Google Scholar] [CrossRef] [PubMed]
- Zhao, H.; Wang, Q.; Bai, C.; He, K.; Pan, Y. A cross-study gene set enrichment analysis identifies critical pathways in endometriosis. Reprod. Biol. Endocrinol. 2009, 7, 94. [Google Scholar] [CrossRef] [PubMed]
- Bryant, P.A.; Venter, D.; Robins-Browne, R.; Curtis, N. Chips with everything: DNA microarrays in infectious diseases. Lancet Infect. Dis. 2004, 4, 100–111. [Google Scholar] [CrossRef] [PubMed]
- Copland, J.A.; Davies, P.J.; Shipley, G.L.; Wood, C.G.; Luxon, B.A.; Urban, R.J. The use of DNA microarrays to assess clinical samples: the transition from bedside to bench to bedside. Recent Prog. Horm. Res. 2003, 58, 25–53. [Google Scholar] [CrossRef] [PubMed]
- Krokidis, M.G.; Vlamos, P. Transcriptomics in amyotrophic lateral sclerosis. Front. Biosci. (Elite Ed.) 2018, 10, 103–121. [Google Scholar] [CrossRef]
- Rai, G.; Rai, R.; Saeidian, A.H.; Rai, M. Microarray to deep sequencing: transcriptome and miRNA profiling to elucidate molecular pathways in systemic lupus erythematosus. Immunol. Res. 2016, 64, 14–24. [Google Scholar] [CrossRef] [PubMed]
- Ward, K. Microarray technology in obstetrics and gynecology: a guide for clinicians. Am. J. Obstet. Gynecol. 2006, 195, 364–372. [Google Scholar] [CrossRef] [PubMed]
- Jeffery, I.B.; Higgins, D.G.; Culhane, A.C. Comparison and evaluation of methods for generating differentially expressed gene lists from microarray data. BMC Bioinformatics 2006, 7, 359. [Google Scholar] [CrossRef]
- Selvaraj, S.; Natarajan, J. Microarray data analysis and mining tools. Bioinformation 2011, 6, 95–99. [Google Scholar] [CrossRef]
- Suhorutshenko, M.; Kukushkina, V.; Velthut-Meikas, A.; Altmäe, S.; Peters, M.; Mägi, R.; Krjutškov, K.; Koel, M.; Codoñer, F.M.; Martinez-Blanch, J.F.; Vilella, F.; Simón, C.; Salumets, A.; Laisk, T. Endometrial receptivity revisited: endometrial transcriptome adjusted for tissue cellular heterogeneity. Hum. Reprod. 2018, 33, 2074–2086. [Google Scholar] [CrossRef] [PubMed]
- Wang, W.; Vilella, F.; Alama, P.; Moreno, I.; Mignardi, M.; Isakova, A.; Pan, W.; Simon, C.; Quake, S.R. Single-cell transcriptomic atlas of the human endometrium during the menstrual cycle. Nat. Med. 2020, 26, 1644–1653. [Google Scholar] [CrossRef] [PubMed]
- Breitling, R.; Herzyk, P. Rank-based methods as a non-parametric alternative of the T-statistic for the analysis of biological microarray data. J. Bioinform. Comput. Biol. 2005, 3, 1171–1189. [Google Scholar] [CrossRef] [PubMed]
- Cordero, F.; Botta, M.; Calogero, R.A. Microarray data analysis and mining approaches. Brief. Funct. Genomics 2007, 6, 265–281. [Google Scholar] [CrossRef] [PubMed]
- Esteban, F.J.; Wall, D.P. Using game theory to detect genes involved in Autism Spectrum Disorder. TOP 2011, 19, 121–129. [Google Scholar] [CrossRef]
- Bolstad, B.M.; Irizarry, R. A.; Astrand, M.; Speed, T.P. A Comparison of Normalization Methods for High Density Oligonucleotide Array Data Based on Bias and Variance. Bioinformatics 2003, 19, 185–193. [Google Scholar] [CrossRef] [PubMed]
- Bolstad, B.M.; Collin, F.; Brettschneider, J.; Simpson, K.; Cope, L.; Irizarry, R.A.; Speed, T.P. Quality Assessment of Affymetrix GeneChip Data. In Bioinformatics and Computational Biology Solutions Using R and Bioconductor; Gentleman, R., Carey, V., Huber, W., Irizarry, R., Dudoit, S., Eds.; Springer: New York, 2005; pp. 33–47. [Google Scholar]
- Irizarry, R.A.; Bolstad, B.M.; Collin, F.; Cope, L.M.; Hobbs, B.; Speed, T.P. Summaries of Affymetrix GeneChip probe level data. Nucleic Acids Res. 2003, 31, e15. [Google Scholar] [CrossRef] [PubMed]
- Pollard, K.S.; Dudoit, S.; van der Laan, M.J. Multiple Testing Procedures: R multtest Package and Applications to Genomics. In Bioinformatics and Computational Biology Solutions Using R and Bioconductor; Gentleman, R., Carey, V.J., Huber, W., Irizarry, R.A., Dudoit, S., Eds.; Springer: New York, 2005; pp. 249–271. [Google Scholar]
- Benjamini, Y.; Hochberg, Y. Controlling the false discovery rate: a practical and powerful approach to multiple testing. J. R. Statist. Soc. B. 1995, 57, 289–300. [Google Scholar] [CrossRef]
- Moretti, S.; van Leeuwen, D.; Gmuender, H.; Bonassi, S.; van Delft, J.; Kleinjans, J.; Patrone, F.; Merlo, D.F. Combining Shapley value and statistics to the analysis of gene expression data in children exposed to air pollution. BMC Bioinformatics 2008, 9, 361. [Google Scholar] [CrossRef]
- Moretti, S. Statistical analysis of the Shapley value for microarray games. Comput. Oper. Res. 2010, 37, 1413–1418. [Google Scholar] [CrossRef]
- Cesari, G.; Algaba, E.; Moretti, S.; Nepomuceno, J.A. An application of the Shapley value to the analysis of co-expression networks. Appl. Netw. Sci. 2018, 3, 35. [Google Scholar] [CrossRef] [PubMed]
- Moretti, S.; Fragnelli, V.; Patrone, F.; Bonassi, S. Using coalitional games on biological networks to measure centrality and power of genes. Bioinformatics 2010, 26, 2721–2730. [Google Scholar] [CrossRef] [PubMed]
- Sun, M.W.; Moretti, S.; Paskov, K.M.; Stockham, N.T.; Varma, M.; Chrisman, B.S.; Washington, P.Y.; Jung, J.Y.; Wall, D.P. Game theoretic centrality: a novel approach to prioritize disease candidate genes by combining biological networks with the Shapley value. BMC Bioinformatics 2020, 21, 356. [Google Scholar] [CrossRef]
- Kolberg, L.; Raudvere, U.; Kuzmin, I.; Adler, P.; Vilo, J.; Peterson, H. g:Profiler—interoperable web service for functional enrichment analysis and gene identifier mapping (2023 update). Nucleic Acids Res. 2023, 51, W207–W212. [Google Scholar] [CrossRef]
- Raudvere, U.; Kolberg, L.; Kuzmin, I.; Arak, T.; Adler, P.; Peterson, H.; Vilo, J. g:Profiler: a web server for functional enrichment analysis and conversions of gene lists (2019 update). Nucleic Acids Res. 2019, 47, W191–W198. [Google Scholar] [CrossRef] [PubMed]
- Wickham, H. ggplot2: Elegant Graphics for Data Analysis; Springer Verlag: New York, 2016. [Google Scholar]
- Babu, A.; Ramanathan, G. Multi-omics insights and therapeutic implications in polycystic ovary syndrome: a review. Funct. Integr. Genomics 2023, 23, 130. [Google Scholar] [CrossRef] [PubMed]
- Bonetti, G.; Madeo, G.; Michelini, S.; Ricci, M.; Cestari, M.; Michelini, S.; Gadler, M.; Benedetti, S.; Guerri, G.; Cristofoli, F.; Generali, D.; Donofrio, C.A.; Cominetti, M.; Fioravanti, A.; Riccio, L.; Bernini, A.; Fulcheri, E.; Stuppia, L.; Gatta, V.; Cecchin, S.; Marceddu, G.; Bertelli, M. Omics sciences and precision medicine in breast and ovarian cancer. Clin. Ter. 2023, 174, 104–118. [Google Scholar] [CrossRef] [PubMed]
- Boroń, D.; Zmarzły, N.; Wierzbik-Strońska, M.; Rosińczuk, J.; Mieszczański, P.; Grabarek, B.O. Recent Multiomics Approaches in Endometrial Cancer. Int. J. Mol. Sci. 2022, 23, 1237. [Google Scholar] [CrossRef]
- Goulielmos, G.N.; Matalliotakis, M.; Matalliotaki, C.; Eliopoulos, E.; Matalliotakis, I.; Zervou, M.I. Endometriosis research in the -omics era. Gene 2020, 741, 144545. [Google Scholar] [CrossRef]
- Matsuzaki, S. DNA microarray analysis in endometriosis for development of more effective targeted therapies. Front. Biosci. (Elite Ed.) 2011, 3, 1139–1153. [Google Scholar] [CrossRef]
- Shai, R.M. Microarray tools for deciphering complex diseases. Front. Biosci. 2006, 11, 1414–1424. [Google Scholar] [CrossRef]
- Zhao, H.; Jiang, A.; Yu, M.; Bao, H. Identification of biomarkers correlated with diagnosis and prognosis of endometrial cancer using bioinformatics analysis. J. Cell Biochem. 2020, 121, 4908–4921. [Google Scholar] [CrossRef]
- Ajabnoor, G.; Alsubhi, F.; Shinawi, T.; Habhab, W.; Albaqami, W.F.; Alqahtani, H.S.; Nasief, H.; Bondagji, N.; Elango, R.; Shaik, N.A.; Banaganapalli, B. Computational approaches for discovering significant microRNAs, microRNA-mRNA regulatory pathways, and therapeutic protein targets in endometrial cancer. Front. Genet. 2023, 13, 1105173. [Google Scholar] [CrossRef]
- Bae, S.J.; Jo, Y.; Cho, M.K. , Jin, J.S.; Kim, J.Y., Shim, J.; Kim, Y.H.; Park, J.K.; Ryu, D.; Lee, H.J., Joo, J.; Ha, K.T. Identification and analysis of novel endometriosis biomarkers via integrative bioinformatics. Front. Endocrinol. (Laussane) 2022, 13, 942368. [Google Scholar] [CrossRef] [PubMed]
- Iwasaki, S.; Kaneda, K. Genes relating to biological process of endometriosis: expression changes common to a mouse model and patients. Drug. Res. (Stuttg.) 2022, 72, 523–533. [Google Scholar] [CrossRef] [PubMed]
- Yu, L.; Shen, H.; Ren, X.; Wang, A.; Zhu, S.; Cheng, Y.; Wang, X. Multi-omics analysis reveals the interaction between the complement system and the coagulation cascade in the development of endometriosis. Sci. Rep. 2021, 11, 11926. [Google Scholar] [CrossRef] [PubMed]
- Wang, T.; Jiang, R.; Yao, Y.; Qian, L.; Zhao, Y.; Huang, X. Identification of endometriosis-associated genes and pathways based on bioinformatics analysis. Medicine (Baltimore) 2021, 100, e26530. [Google Scholar] [CrossRef]
- Zhang, X.; Wu, L.; Xu, R.; Zhu, C.; Ma, G.; Zhang, C.; Liu, X.; Zhao, H.; Miao, Q. Identification of the molecular relationship between intravenous leiomyomatosis and uterine myoma using RNA sequencing. Sci. Rep. 2019, 9, 1442. [Google Scholar] [CrossRef]
Figure 1.
Gene Set Enrichment Analysis results showing the significantly enriched Gene Ontology (GO) terms of the differentially expressed genes in endometrial cancer datasets: (a) GSE36389 dataset; (b) GSE63678 dataset. For each dataset, significantly enriched molecular functions (GO:MF), biological processes (GO:BP) and cellular components (GO:CC) are shown.
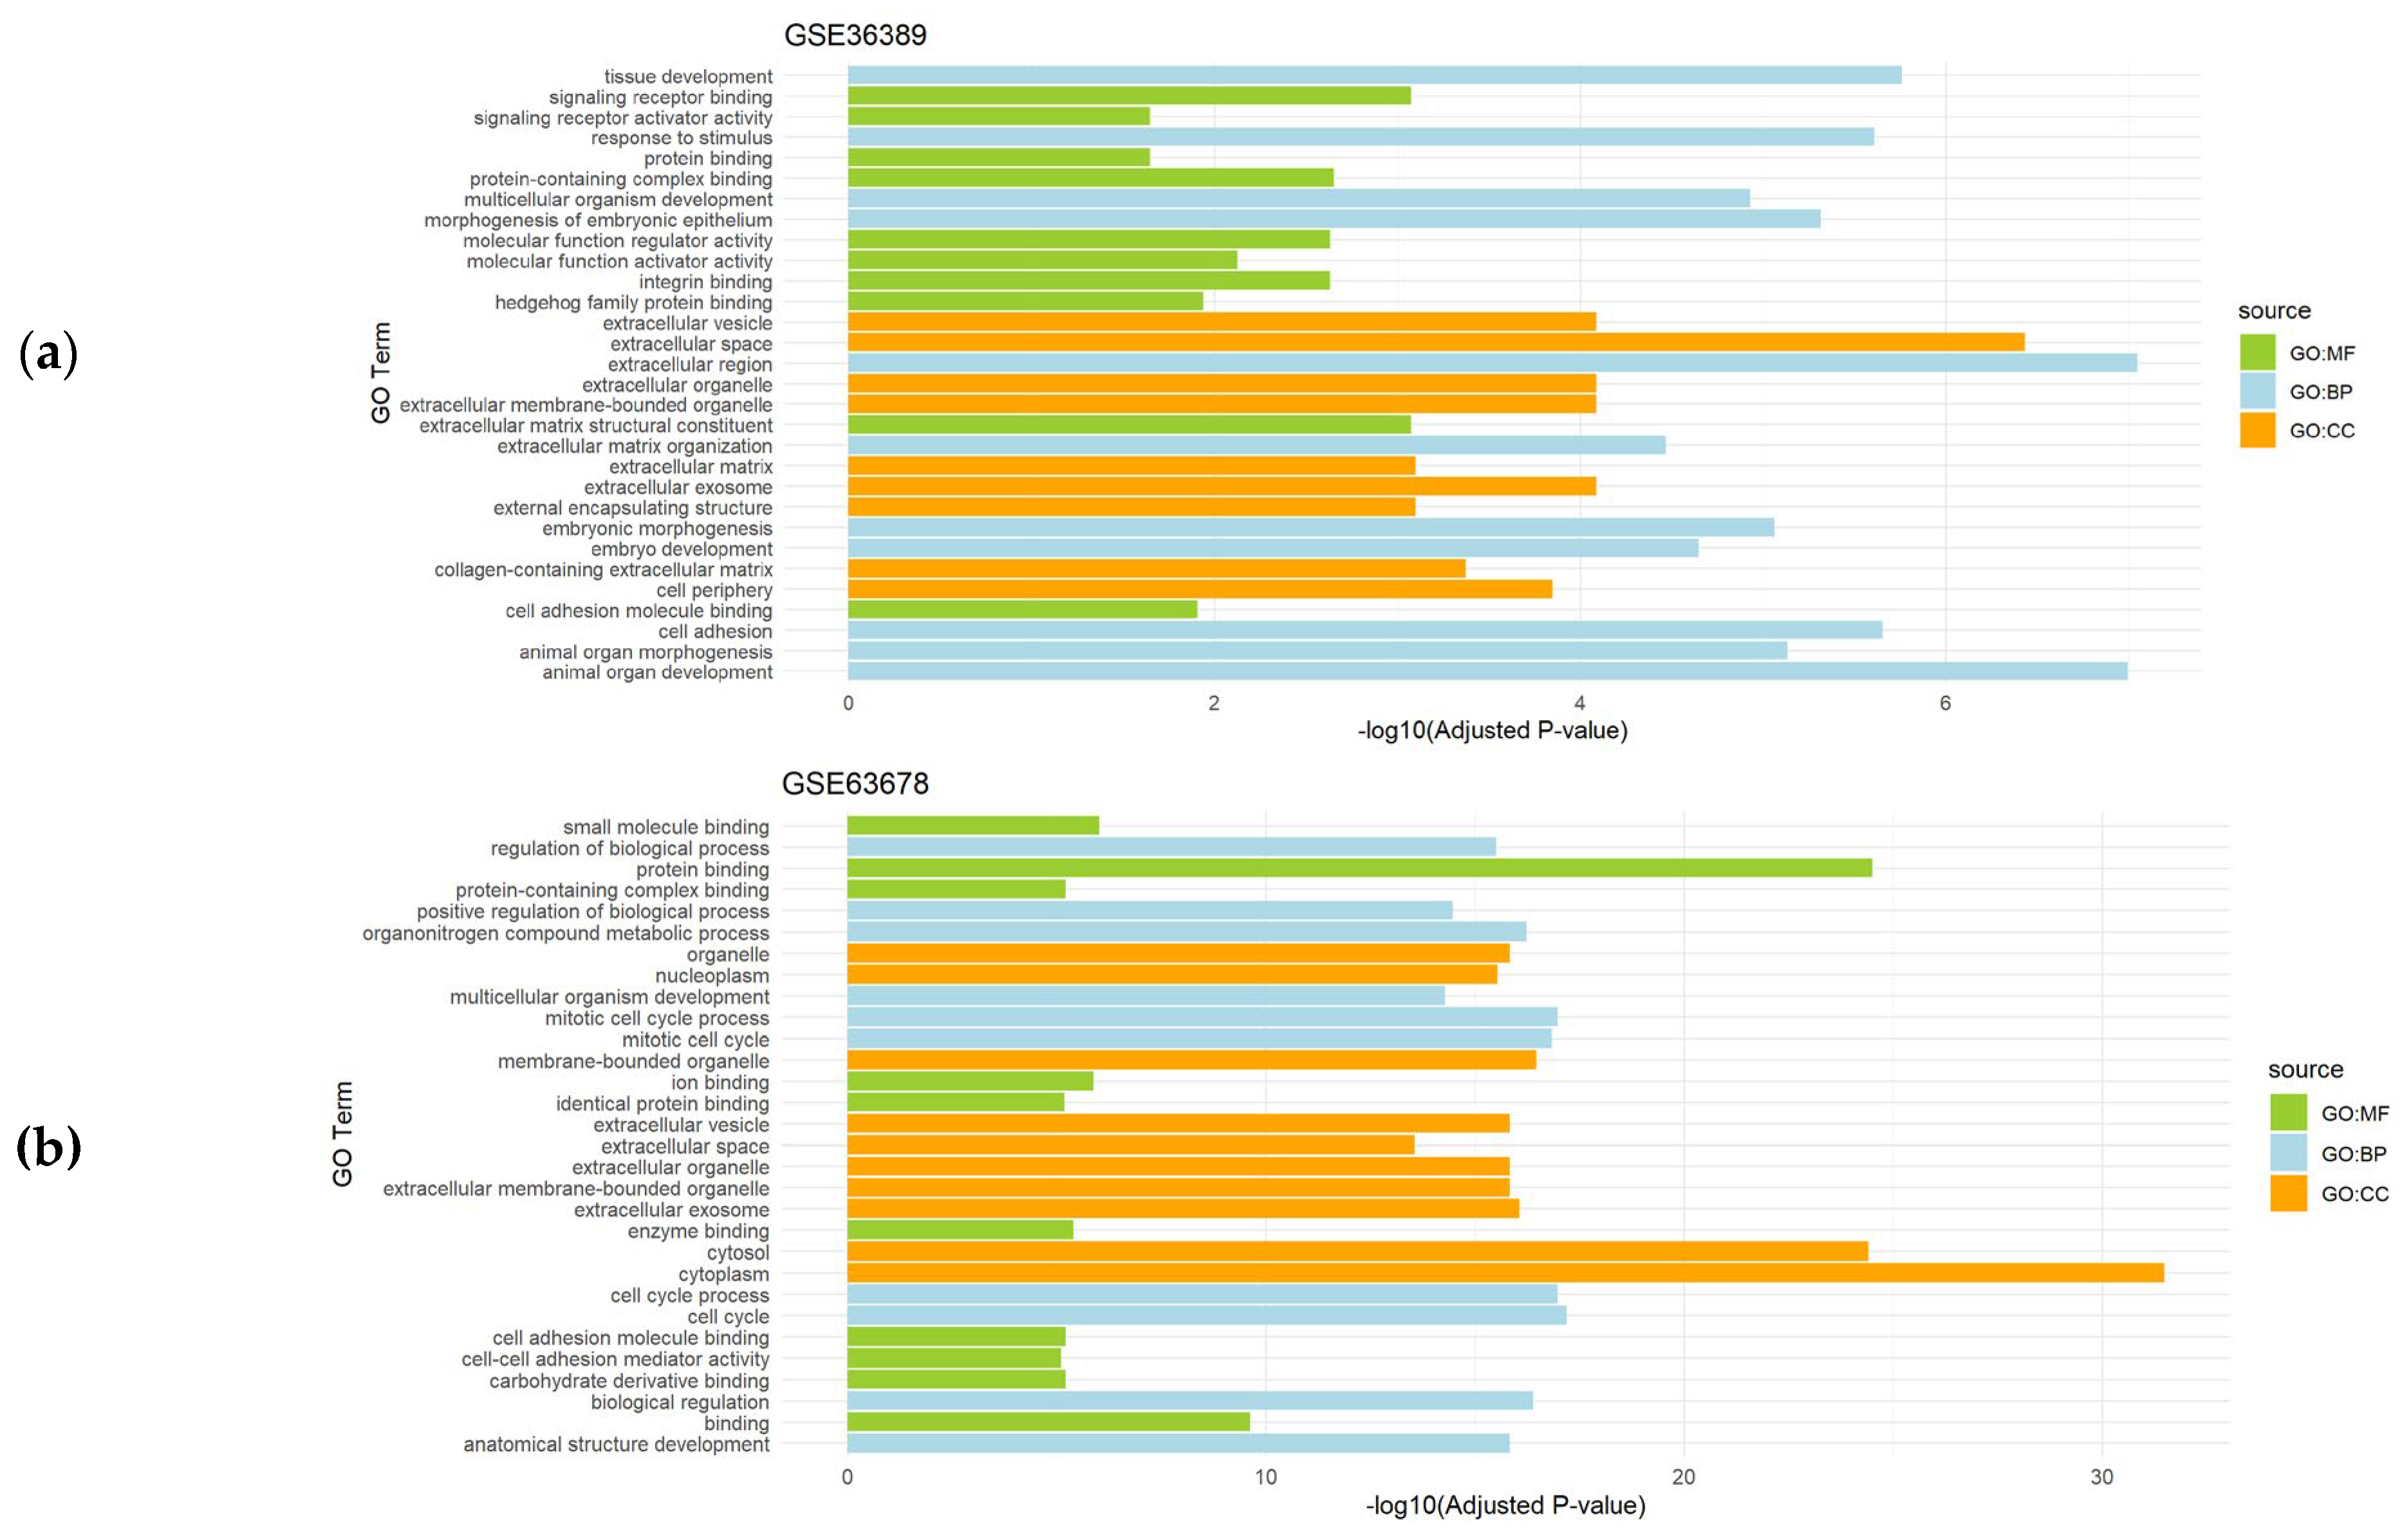
Figure 2.
Gene Set Enrichment Analysis results showing the significantly enriched Gene Ontology (GO) terms of the differentially expressed genes in endometriosis datasets: (a) GSE7846 dataset; (b) GSE17504 dataset. For each dataset, significantly enriched molecular functions (GO:MF), biological processes (GO:BP) and cellular components (GO:CC) are shown.
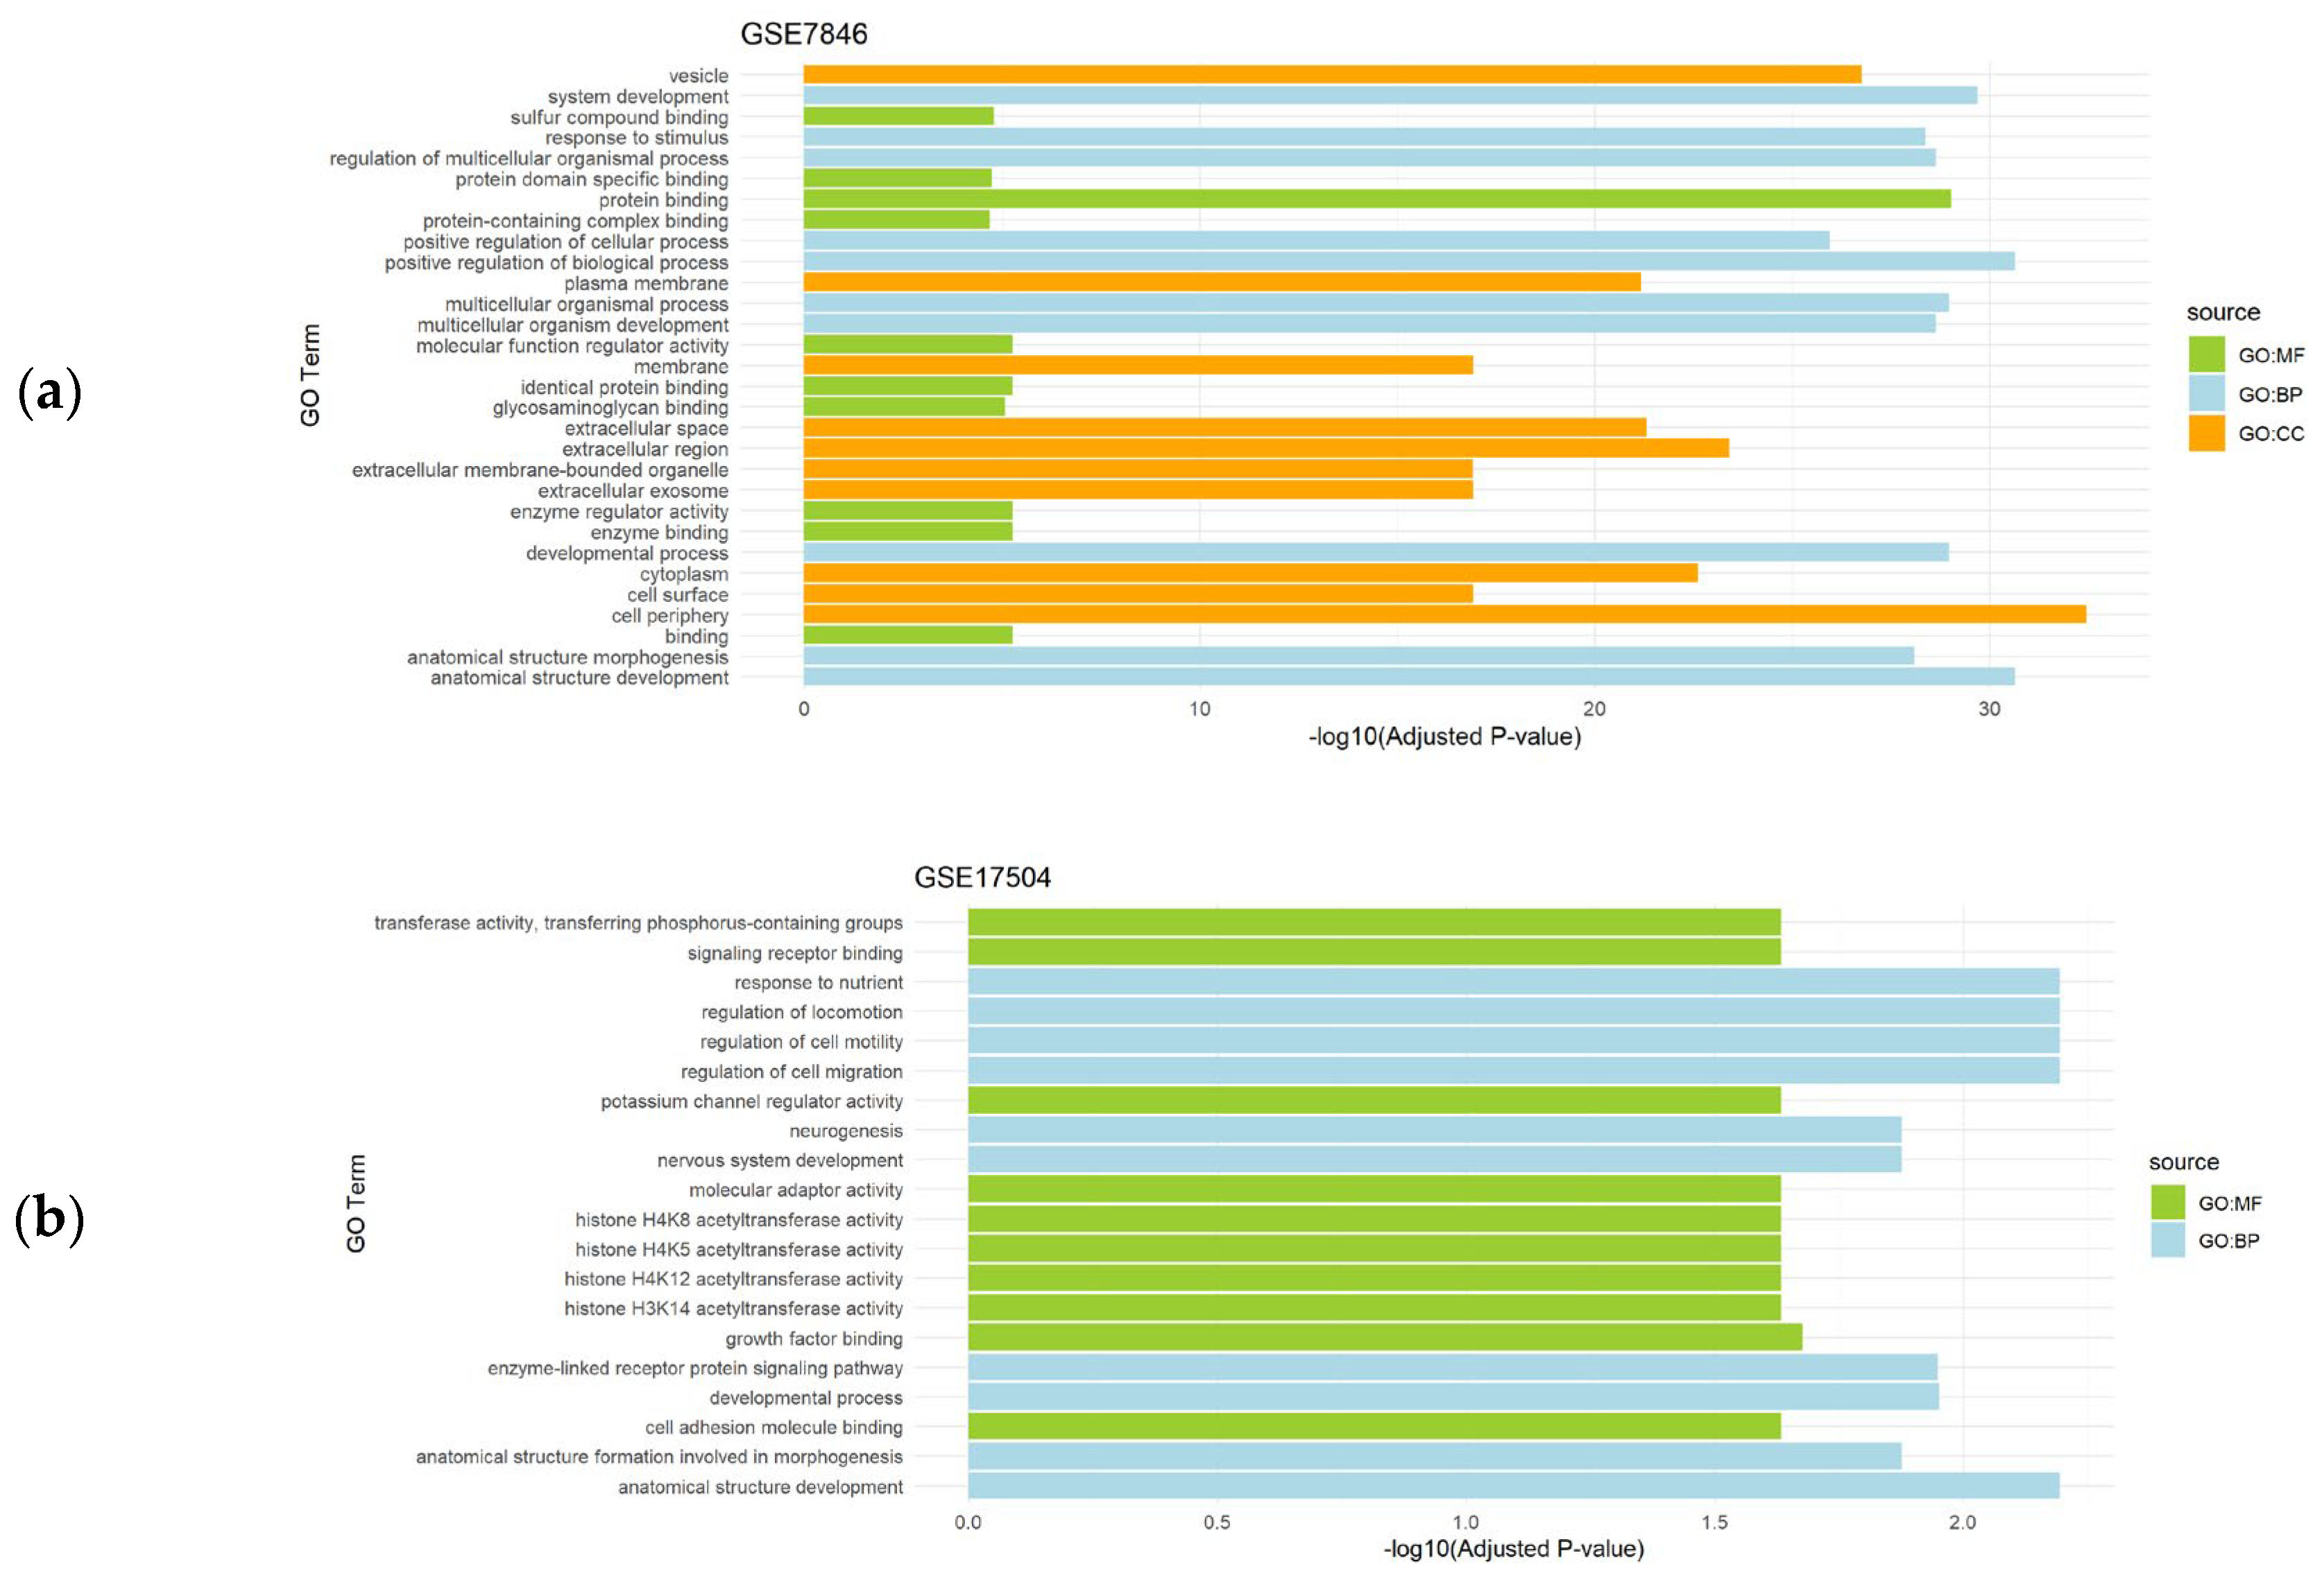
Figure 3.
Gene Set Enrichment Analysis results showing the significantly enriched Gene Ontology (GO) terms of the differentially expressed genes in uterine leiomyoma datasets: (a) GSE12814 dataset; (b) GSE23112 dataset. For each dataset, significantly enriched molecular functions (GO:MF), biological processes (GO:BP) and cellular components (GO:CC) are shown.
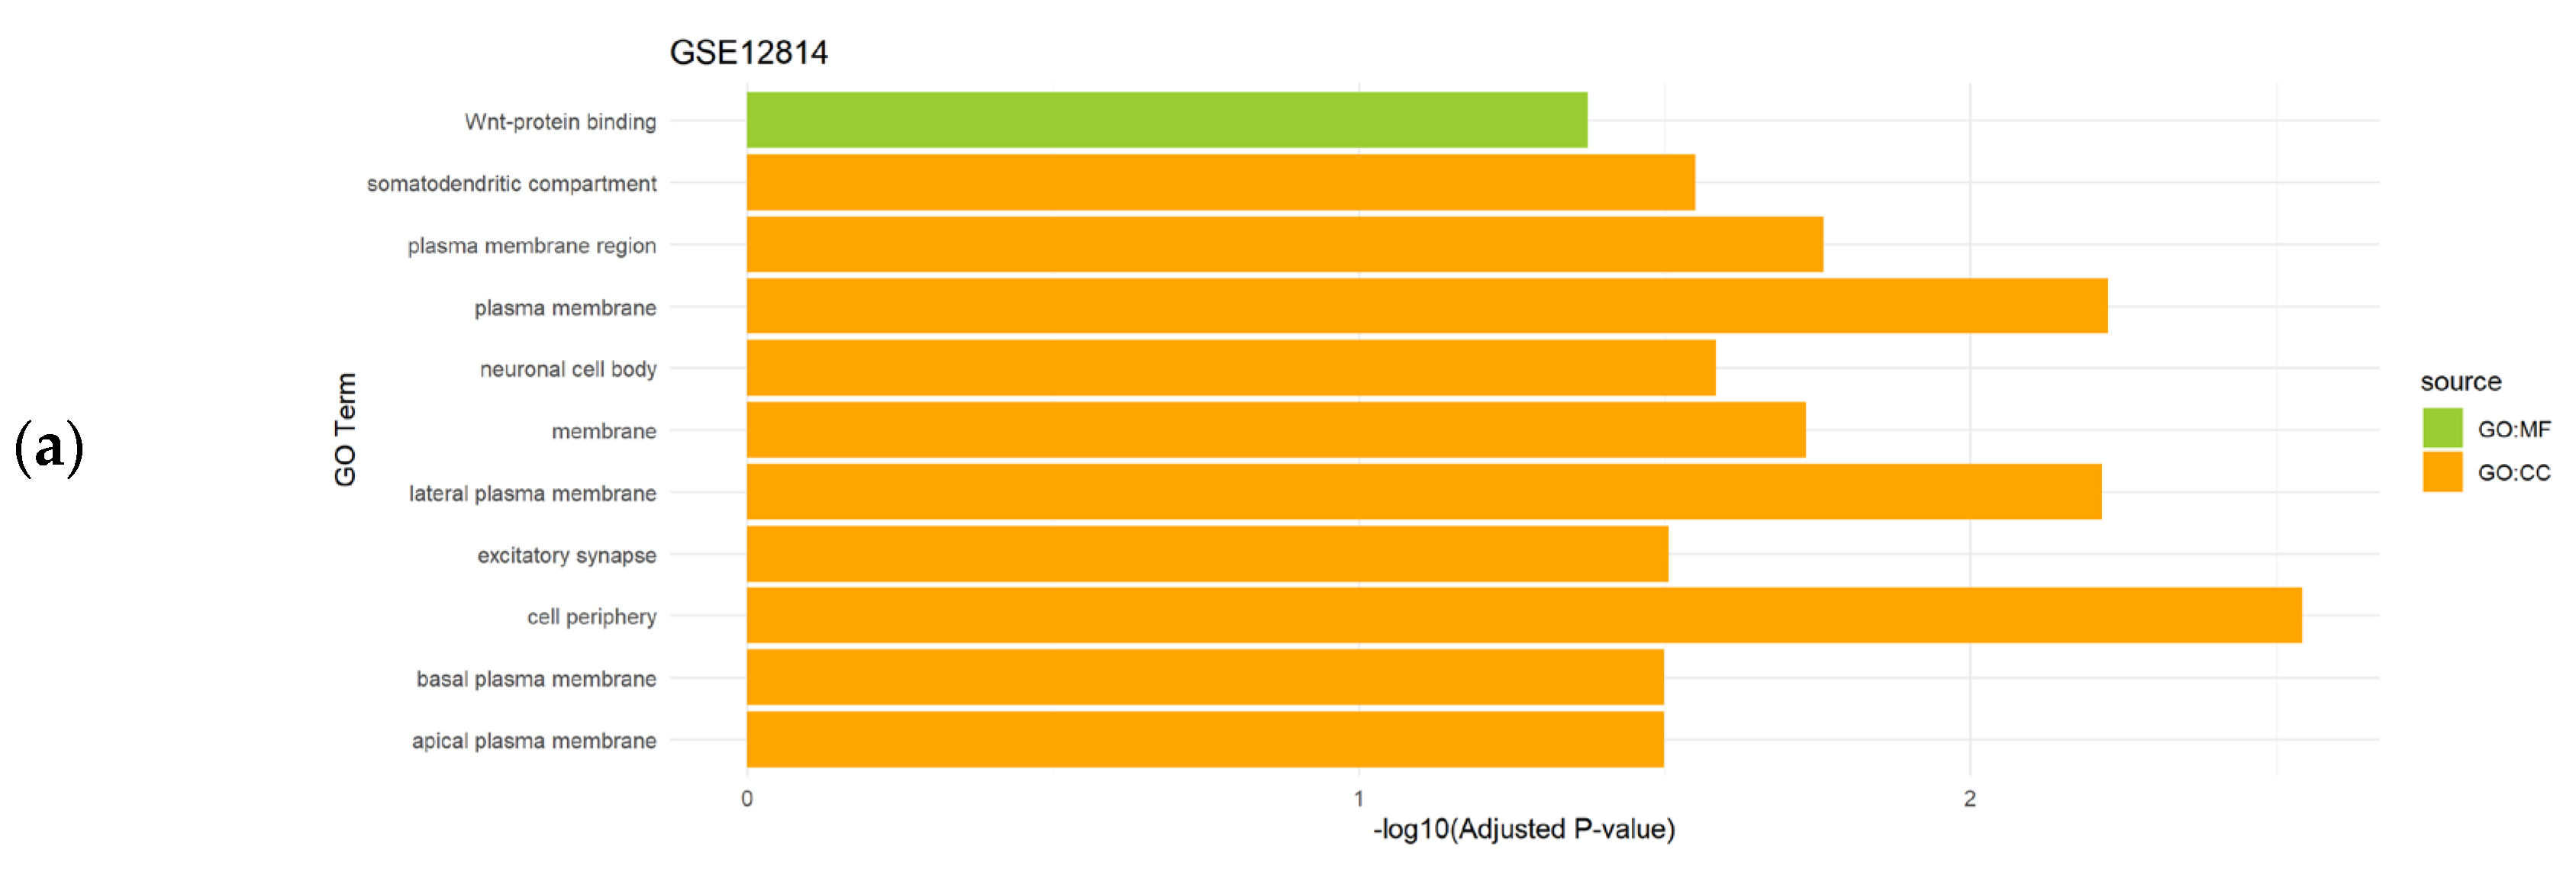
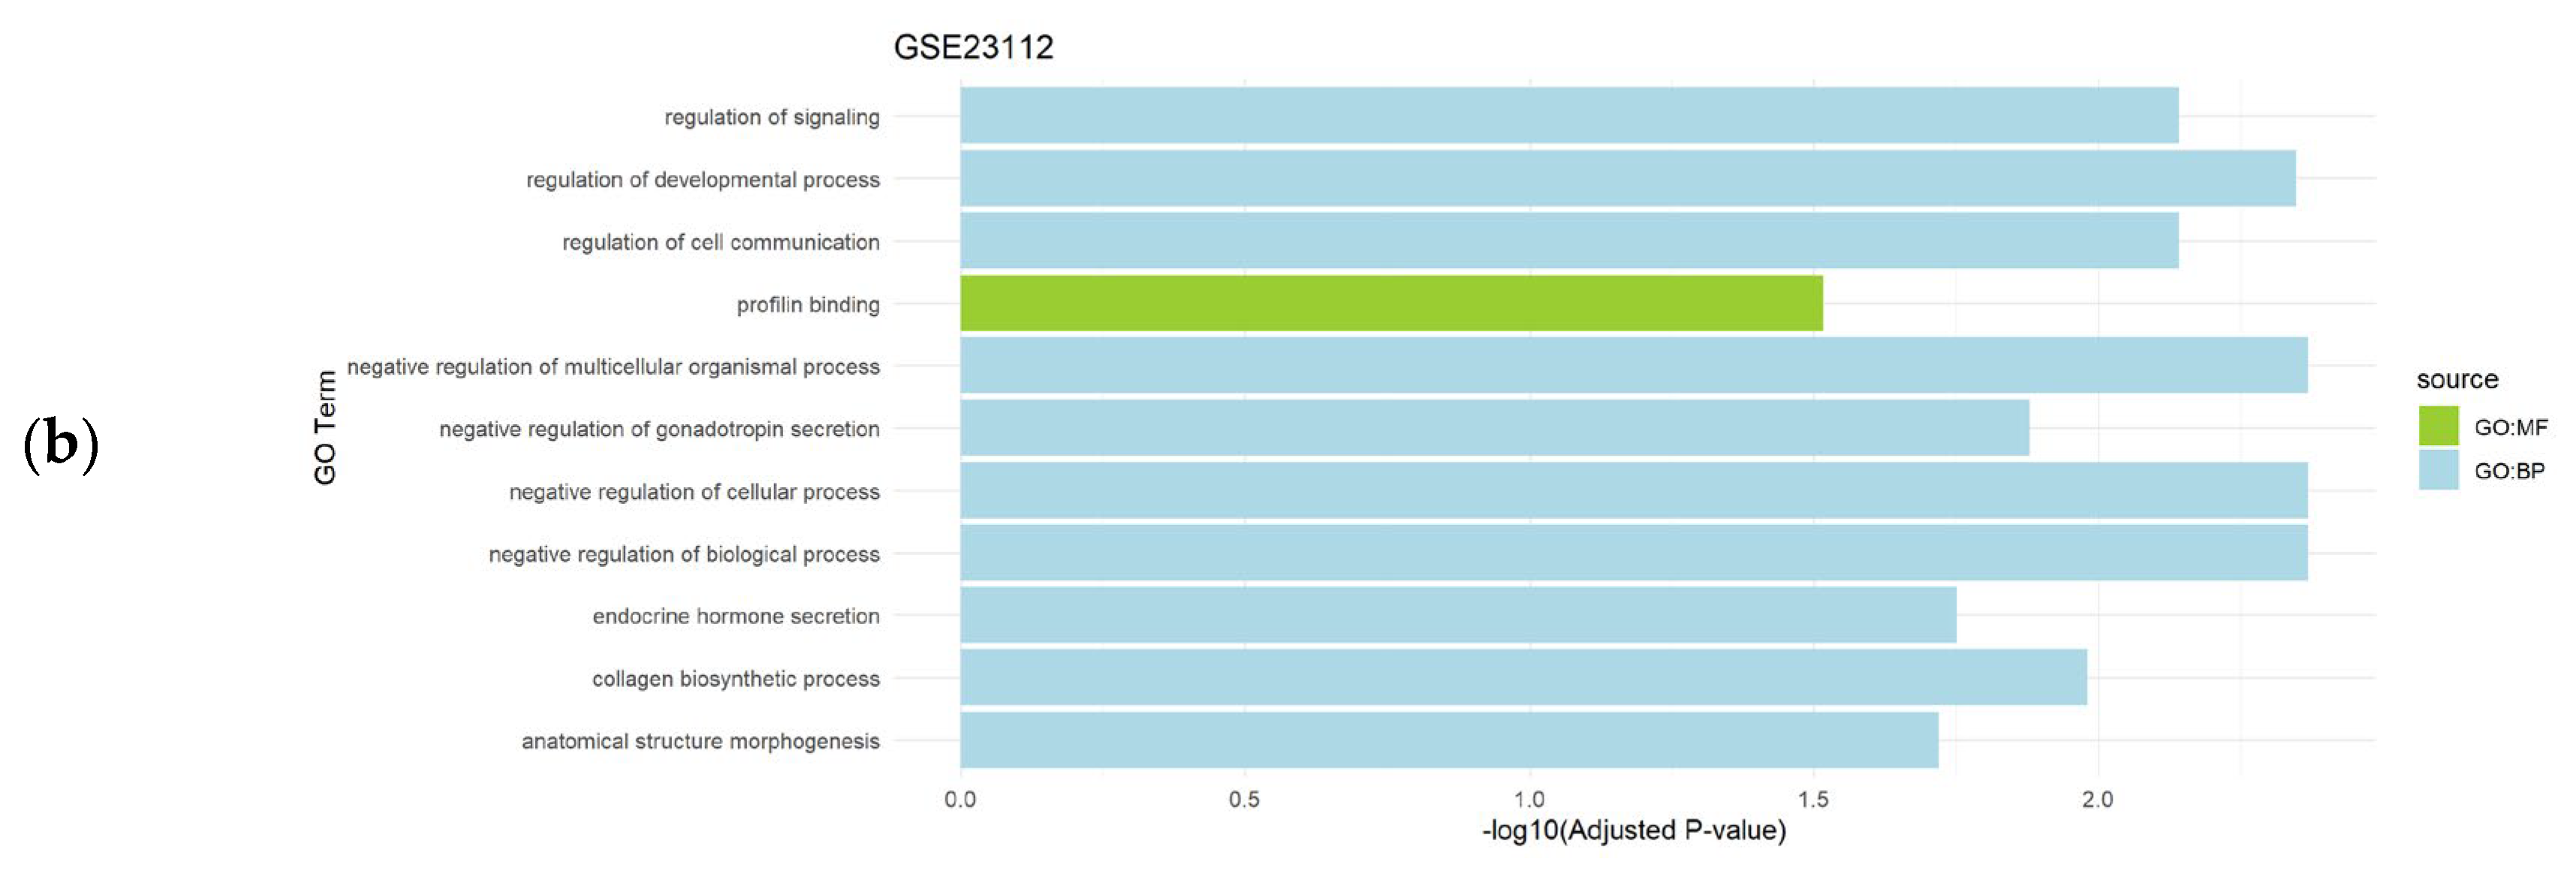

Table 1.
Summary of Gene Expression Omnibus (GEO) datasets analyzed in our study. For each study, number and description of samples are shown.
Table 1.
Summary of Gene Expression Omnibus (GEO) datasets analyzed in our study. For each study, number and description of samples are shown.
| Phenotype Group | Dataset ID | No. of samples | Description of Samples |
|---|---|---|---|
| Endometrial cancer | GSE36389 | 16 | Endometrial cancer (n=10) vs. controls (n=6) |
| GSE63678 | 11 | Endometrial carcinoma (n=6) vs. controls (n=5) | |
| Endometriosis | GSE7846 | 9 | Endometriosis (n=4) vs. controls (n=5) |
| GSE17504 | 11 | Endometriosis (n=5) vs. controls (n=6) | |
| Uterine leiomyomas | GSE12814 | 14 | Uterine leiomyoma (n=5) vs. controls (n=9) |
| GSE23112 | 7 | Uterine leiomyoma (n=3) vs. controls (n=4) |
Table 2.
Number of differentially expressed genes (DEGs) detected after the analysis using conventional techniques based on Welch's t-test and alternative approaches rooted on Comparative Analysis of Shapley value (CASh) method with cutoff p-values of 0.01 and 0.05, respectively.
Table 2.
Number of differentially expressed genes (DEGs) detected after the analysis using conventional techniques based on Welch's t-test and alternative approaches rooted on Comparative Analysis of Shapley value (CASh) method with cutoff p-values of 0.01 and 0.05, respectively.
| Dataset ID | Welch’s t-Test | CASh 0.01 | CASh 0.05 |
|---|---|---|---|
| GSE36389 GSE63678 |
0 | 38 (21 ↑, 17 ↓) | 125 (70 ↑, 55 ↓) |
| 0 | 496 (213 ↑, 283 ↓) | 934 (454 ↑, 480 ↓) | |
| GSE7846 GSE17504 |
0 | 74 (39 ↑, 35 ↓) | 1069 (674 ↑, 395 ↓) |
| 0 | 17 (9 ↑, 8 ↓) | 84 (51 ↑, 33 ↓) | |
| GSE12814 | 0 | 21 (13 ↑, 8 ↓) | 84 (39 ↑, 45 ↓) |
| GSE23112 | 0 | 7 (6 ↑, 1 ↓) | 38 (31 ↑, 7 ↓) |
* ↑ and ↓ symbols indicate up- (FC >1.5) and down-regulated (FC <-1.5) genes, respectively.
Disclaimer/Publisher’s Note: The statements, opinions and data contained in all publications are solely those of the individual author(s) and contributor(s) and not of MDPI and/or the editor(s). MDPI and/or the editor(s) disclaim responsibility for any injury to people or property resulting from any ideas, methods, instructions or products referred to in the content. |
© 2024 by the authors. Licensee MDPI, Basel, Switzerland. This article is an open access article distributed under the terms and conditions of the Creative Commons Attribution (CC BY) license (http://creativecommons.org/licenses/by/4.0/).
Copyright: This open access article is published under a Creative Commons CC BY 4.0 license, which permit the free download, distribution, and reuse, provided that the author and preprint are cited in any reuse.


