Preprint
Article

Two-week Computerized Cognitive Training Affects Resting-State Electroencephalographic Rhythms in Parkinson’s Disease Patients with Cognitive Deficits

Altmetrics

Downloads

153

Views

82

Comments

0

Submitted:

12 April 2024

Posted:

15 April 2024

You are already at the latest version

Alerts
Abstract
The present exploratory study tested the hypothesis that computerized cognitive training (CCT) in home telemonitoring may beneficially affect eyes-closed resting-state electroencephalographic (rsEEG) rhythms in Parkinson's disease patients with cognitive deficits (PDCD). A Eurasian database provided clinical-demographic-rsEEG datasets in 40 PDCD patients, 29 PD patients without cognitive deficits (PDNCD), 40 Alzheimer’s disease patients with cognitive deficits (ADCD), and 40 cognitively normal older adults (Healthy). Sixteen of the 40 PDCD patients completed a cross-over unsupervised CCT program of simple, serious video games (versus a sham program) consisting of 14 daily sessions of approximately 20 minutes each in the patients' homes. Compared to the Healthy, PDNCD, and ADCD groups, the PDCD group was characterized by greater diffuse rsEEG delta (about 2-4 Hz) and theta (about 4-7 Hz) source activity. The PDCD patients who underwent the CCT program showed an improvement in video game performance and a reduction in these delta-theta source activities after this program compared to the control condition. In conclusion, these results suggest that the 2-week CCT program in home telemonitoring may mitigate the abnormal “slowing” of rsEEG rhythms in PDCD patients, possibly enhancing the regulation of brain arousal and quiet vigilance.
Keywords: 
Subject: Biology and Life Sciences  -   Neuroscience and Neurology

1. Introduction

Parkinson’s disease (PD) is the second most common progressive neurodegenerative disorder after Alzheimer's disease (AD); its estimated prevalence is over 8,5 million cases on a global scale [1]. According to current clinical guidelines, PD patients are mainly characterized by motor symptoms, such as akinesia, tremors, postural instability, and rigidity [2,3]. However, cognitive deficits are frequently observed in PD patients, including dysfunctions in planning, working memory, executive abilities, attention, semantic verbal fluency, and visual-spatial abilities [4,5,6,7]. Specifically, about 50% of PD patients develop cognitive deficits (PDCD) and dementia within 10 years after the PD diagnosis, while the vast majority of PD patients have dementia within 20 years after such a diagnosis [2]. Furthermore, about 50% of PD patients have mild cognitive impairment (MCI) at the time of diagnosis, which increases to 40–50% after 5 years of follow-up [2,8,9,10].
In recent years, there has been increasing interest in nonpharmacological interventions for mitigating cognitive impairments in PDCD patients. Previous studies include cognitive training (CT), physical rehabilitation, and brain stimulation techniques [7]. The CT induced beneficial effects, such as significant and stable improvements in verbal fluency, memory, executive functioning, visuo-spatial skills, and attention in PD patients [11,12,13,14]. In those studies, the most frequently used CT interventions were pen-and-paper and oral cognitive exercises. Trained professionals held these traditional CT programs during meetings requiring face-to-face contact and then complications such as identifying a convenient meeting location, coordination of schedules, and travel time [15].
Traditional CT programs have some limitations. Analyzing PDCD patients’ performances can be complex and often requires manual annotation of answers and response times, with possible imprecisions and omissions. Furthermore, face-to-face training programs can be expensive. Notably, these drawbacks can be overcome by modern computerized CT (CCT) procedures. In principle, they are cost-effective, customizable, and easy to follow in point-of-care telemonitoring (e.g., home, assisted living, or nursing home, etc.) with the collection of patient’s responses to a central cloud-based server. Overall, CCT procedures in-home telemonitoring have the advantage of allowing long-term and large-scale interventions. Concerning feasibility and effectivity, it has been shown that PDCD patients were able to complete CCT programs with a high percentage of protocol completion and beneficial effects on cognitive functions in both hospital and home telemonitoring settings [16,17,18,19,20,21].
Although the assessment of PDCD patients is typically focused on motor and cognitive deficits, they often suffer from dysregulations of quiet vigilance (e.g., mental fatigue, cognitive fluctuations, etc.) and diurnal sleepiness, possibly due to impairments in subcortical ascending arousing systems [22,23,24,25,26]. The abnormal neurophysiological mechanisms underpinning those dysregulations can be investigated by the analysis of eyes-closed resting-state electroencephalographic (rsEEG) rhythms recorded from the scalp in quiet wakefulness (for a recent review, see [27]). In healthy adults, the rsEEG activity typically shows dominant rhythms at 8-12 Hz (alpha) frequencies, located in posterior scalp regions, and rhythms with low amplitude (power) and frequencies at 1-4 Hz (delta) and 4-7 Hz (delta), distributed over the whole scalp [28,29]. Previous studies showed that these rsEEG rhythms markedly changed in PDCD patients. In those patients, the rsEEG activity was characterized by dominant delta and theta rhythms over the whole scalp and by posterior alpha rhythms with low amplitude [30,31,32,33,34,35]. These changes in the rsEEG rhythms were related to global cognitive deficits, motor deficits, and visual hallucinations in PDCD patients [36]. Finally, an acute dose of levodopa reduced rsEEG delta and alpha rhythms in PD and PDCD patients undergoing a standard chronic dopaminergic regimen [37].
Previous findings demonstrated the beneficial effects of CCT programs on rsEEG rhythms. They showed decreased activity of rsEEG delta, theta, and beta rhythms in older MCI patients and improved cognitive functions after a combined eight-week program with CCT and physical activity [38]. Along the same line, a recent study in PDCD patients showed that a combined eight-week program with CCT and physical activity in hospital settings induced beneficial effects of cognitive functions in negative correlation with rsEEG theta rhythms and positive correlation with rsEEG beta rhythms [39].
In the present study, we tested the hypothesis that CCT in home telemonitoring may affect cortical sources of (eyes-closed) rsEEG rhythms in PD patients with cognitive deficits (PDCD) spanning from MCI to mild-moderate dementia. A Eurasian database provided clinical-demographic-rsEEG datasets in PDCD patients and matched persons of the following control groups: PDCD patients, PD patients without cognitive deficits (PDNCD), Alzheimer’s disease patients with cognitive deficits (ADCD), and cognitively unimpaired older adults (Healthy). A subgroup of the 40 PDCD patients performed the mentioned CCT program. It consisted of 14 daily sessions lasting about 20 minutes each at patients’ homes. In each session, patients played homemade serious video games operated on common standard tablets. The data analysis design included a preliminary analysis aimed at identifying rsEEG sources and frequency bands showing differences in the PDCD group over the control groups. The main analysis in the subgroup of PDCD patients tested the hypothesis that such a CCT program may have beneficial effects on rsEEG activity estimated in those sources and frequency bands.

2. Materials and Methods

2.1. Participants

The clinical and rsEEG datasets for the present investigation were taken from the Eurasian archive of the PDWAVES Consortium (www.pdwaves.eu). Specifically, those data were acquired from 40 PDCD patients, 29 PDNCD, 40 ADCD, and 40 Healthy persons. The groups were matched for age, gender, and sex. Table 1 summarizes the relevant demographic and clinical (i.e., Mini-Mental State Examination, MMSE, score) information about the Healthy, PDNCD, ADCD, and PDCD groups, together with the results of the statistical analyses computed to evaluate the presence or absence of statistically significant differences between these groups regarding age (ANOVA), sex (Freeman-Halton test), education (ANOVA), and MMSE score (Kruskal-Wallis test). As expected, statistically significant differences were found for the MMSE score (H = 102.9, p < 0.00001), showing a higher score in the Healthy and PDNCD than the ADCD and PDCD groups (post-hoc test = p < 0.00001). On the contrary, no statistically significant differences in age, sex, and education were found between the groups (p > 0.05). The 16 PDCD patients (6 males) who entered the CCT program (over a sham condition) had a mean age of 70.3 years ± 1.7 standard error of the mean (SE), mean education of 7.4 years ± 1.0 SE, and mean MMSE score of 23.7 ± 0.3 SE.
The present investigation was performed in agreement with the Code of Ethics of the World Medical Association (Declaration of Helsinki) and received formal approval from the local Ethics Review Board. All participants or their caregivers expressed their written informed consent.

2.2. Diagnostic Criteria

The diagnosis of PD (i.e., PDCD and PDNCD, N = 69) was based on a standard clinical assessment of tremor, rigidity, and bradykinesia [40]. As measures of severity of a motor disability, the Hoehn and Yahr stage [41] and the Unified Parkinson Disease Rating Scale-III (UPDRS III; [42]) for extrapyramidal symptoms were used (Unfortunately, the data from the Movement Disorder Society-Sponsored Revision of the Unified Parkinson's Disease Rating Scale were not available). All PD patients were under standard long-term chronic dopaminergic treatment, and all exams were performed under the ON state. Furthermore, the diagnosis of PDCD was given to patients with a history of MCI or dementia, preceded by a typical levodopa-responsive Parkinsonian motor syndrome for at least 12 months and unrelated to other pathologic conditions than PD. The selected PDCD patients did not suffer from severe tremors or dyskinesias. The following inclusion criteria were fulfilled: (i) diagnosis of PD as specified previously; (ii) a gradual neurocognitive decline in the context of established PD reported by either the patient or a reliable informant or observed by clinicians; and (iii) an abnormally low score in at least one of the neuropsychological tests mentioned in the following section, as defined by performances beyond 1.5 times the standard deviation (SD) from the mean value for age- and education-matched controls or equivalent scores for abnormality according to the manuals of the tests used. The exclusion criteria for the PD patients (i.e., PDCD and PDNCD) included the following forms of parkinsonism: (i) dementia of any kind, including DLB [43,44,45], (ii) drug-induced or cerebrovascular parkinsonism, (iii) atypical parkinsonism with absent or minimal responses to antiparkinsonian drugs, and (iv) mixed neurodegenerative diseases.
The diagnosis of ADCD was given to patients with a history of MCI or dementia. The ADCD status was based on the “positivity” to one or more of the following biomarkers: Aβ1-42/phospho-tau ratio in the cerebrospinal fluid (CSF), 18F-fluorodeoxyglucose positron emission tomography (FDG-PET), and structural magnetic resonance imaging (MRI) of the hippocampus, parietal, temporal, and posterior cingulate regions [46]. The “positivity” was judged by the physicians in charge of releasing the clinical diagnosis to the patients, according to the local diagnostic routine of the participating clinical Units. Exclusion criteria for the ADCD patients were other significant neurological, systemic, or psychiatric illness, mixed dementing diseases, enrolment in a clinical trial with experimental drugs, the use of antidepressant drugs with anticholinergic side effects, high dose of neuroleptics or chronic sedatives or hypnotics, antiparkinsonian medication and the use of narcotic analgesics.
The Healthy persons were selected from the clinical units of the coworkers of the study. Exclusion criteria for healthy seniors were (i) neurological or psychiatric diseases (previous or present), (ii) a depressive episode (detected with a GDS - 15 items version - score higher than 5), (iii) the use of chronic psychoactive drugs, and (iv) significant chronic systemic illnesses (e.g., diabetes mellitus).
In all participants, the global cognitive functions were assessed using Mini-Mental State Evaluation (MMSE) and/or Montreal Cognitive Assessment (MOCA) tests [47,48]. Furthermore, performance in various cognitive domains, including language, visuospatial function, executive function/attention, and memory, was assessed using a battery of the following neuropsychological tests: (i) language was tested by the Verbal fluency test for letters and Verbal fluency test category (fruits, animals, or car trades; [49]); (ii) visuo-spatial functions were assessed by the Rey Figures Copy, Rey Figures Immediate Recall, Line Orientation test and Face Recognition test [50,51,52], (iii) executive functions and attention were evaluated by the Frontal Assessment Battery, Clock Drawing, Trail Making Test Part A and B, Stroop test and Confusion Assessment Method [53,54,55,56,57]; and (iv) memory was tested by the Digit Span Forward and Backward, Oktem Verbal Memory test, and Confusion Assessment Method [55,58,59]. Notably, the clinical units administered one or more of the above-mentioned neuropsychological tests for each cognitive domain.

2.3. Clinical and Neuropsychological Data In the PDCD Patients Involved in the Intervention Study

Table 2 summarizes the mean values (± SE) of the clinical features (i.e., Hoehn and Yahr, UPDRS III, Clinical Dementia Rating, Geriatric Depression Scale, Activities of Daily Living, and Instrumental Activities of Daily Living) and neuropsychological tests (i.e., MMSE, MOCA, Digit Span, Frontal Assessment Battery, Clock Drawing, Verbal Fluency for Letters, Verbal Fluency Category, Prose Memory, Rey Words Immediate Recall, Rey Words Delayed Recall, Rey Figures Copy, and Rey Figures Immediate Recall) in the group of 16 PDCD patients recruited in the intervention study. The cut-off scores of the above-mentioned clinical features and neuropsychological tests and the percentage of the 16 PDCD patients with the pathological score are also reported.

2.4. Experimental Paradigm

Figure 1 illustrates the design of the cross-over, sham-controlled intervention study with the CCT program in the 16 PDCD patients mentioned. These patients were involved in the CCT program for 2 weeks and in the Sham program for the same period (balanced pseudorandom order). For the CCT program, they performed the CCT in a daily session of 20 minutes. For the sham program, the PDCD patients watched neutral videos on the tablet in a daily session of 20 minutes. A washout period lasting 1 week was used between the CCT and Sham programs.
The clinical assessment for diagnostic purposes was only performed at the baseline (T0). In contrast, the neuropsychological evaluation and rsEEG recordings were performed at the baseline (T0) and after the Sham and CCT programs (CCT program as T1 or T2).

2.5. Computerized Cognitive Training (CCT) and Sham Programs

The 16 PDCD patients involved in the cross-over clinical intervention study participated in an individual session in the local hospital setting to receive full instructions and demonstrations on the CCT and Sham programs. This session was scheduled after the neuropsychological assessment. For each PD patient, one family or caregiver person living with him/her participated in the session to ensure technical support during the development of the CCT and Sham programs at patients’ homes. The session included a final demonstration showing that the PD patients (with the eventual support of the family or caregiver persons) were able to perform the procedures to run the CCT and Sham programs successfully. The final phase of the session aimed at selecting the list of videos lasting 20 minutes for the PD patient to be used for the Sham program. The PD patient was asked to select them based on his/her preferences. At the end of the session, the patient and his/her family or caregiver person received the tablet with the CCT and Sham materials ready for use. The experimenters periodically monitored the development of the CCT and Sham programs at the patient’s home and provided technical input in telemonitoring when required.
The CCT program was based on a homemade app that included step-by-step instructions with simple text and graphics helping the patient (and family or caregiver person) to develop the procedure. Each session was for about 20 minutes. This program was based on 7 simple, serious video games to be repeated every day. The logical structure of visual stimuli into a grid field and the required hand motor responses with the index finger of the dominant hand were the same for all video games. The degree of difficulty was set to allow all PD patients to complete all serious video games. Of course, performances and accuracy varied across the PD patients in relation to their cognitive-motor status. The first (serious) video game was a simple visual non-spatial reaction-time task for the evaluation of basic visual hand sensorimotor functions. The second video game was a visuospatial attention task for the evaluation of frontal visuospatial executive functions. The third video game was a visual non-spatial attention task for the evaluation of the frontal non-spatial executive functions. The fourth video game was a short-term visuospatial episodic memory task. The fifth video game was a short-term visual non-spatial episodic memory task. The sixth video game tested was a modified Posner’s task testing visuo-spatial expectancy. The seventh video game tested the ability to refrain from impulsive motor responses.
The patient’s performance was automatically stored on the tablet and transmitted via Internet connectivity to a central server managed by the researchers of the Department of Physiology and Pharmacology “V. Erspamer” at the Sapienza University of Rome (Italy). For each CCT video game, performances were indexed by accuracy (%), reaction, or response time (ms).

2.6. rsEEG Recordings

Electrophysiological data were recorded by professional digital EEG systems licensed for clinical applications (equipment and clinical recording Units were considered covariates in the statistical models). All rsEEG recordings were performed in the late morning. The rsEEG recordings were performed in all participants using 19 scalp exploring electrodes placed according to the 10-20 system. The ground electrode was attached to the right clavicle or on the forehead, while linked earlobes (A1 and A2) or a midline cephalic electrode served as the active reference. The electrode’s impedance was kept below 5 kΩ. Continuous EEG data were recorded at a sampling frequency of 256-512 Hz and filtered between 0.01 Hz and 60-100 Hz (antialiasing bandpass). Bipolar electrooculographic (EOG) potentials (0.3-70 Hz bandpass) were also recorded with the same data sampling settings to control eye movements and blinking.
The participants were seated in a comfortable armchair during the rsEEG recording and instructed to remain awake, psychophysically relaxed (no movement), and with the mind freely wandering (no mental planning or cognitive operations). Based on the instructions given by an experiment, each rsEEG recording lasted 3-5 minutes in the condition of eyes closed. Two experimenters supervised participants during the rsEEG recording to monitor adherence to the protocol. One experimenter may kindly invite participants to adhere to the protocol if needed. All deviations by the protocol and verbal interventions were annotated and used during the phase of preliminary rsEEG data analysis.

2.7. Preliminary rsEEG Data Analysis

The rsEEG data were centrally analyzed by experts blinded to the participants’ diagnosis by the Sapienza University of Rome unit. The recorded rsEEG data were exported as a European data format (.edf) or EEGLAB set (.set) files and then processed offline using the EEGLAB toolbox ([60]; version eeglab14_1_2b) running in the MATLAB software (Mathworks, Natick, MA, USA; version: R2014b). The rsEEG data were divided into epochs lasting 2 s (i.e., 5 minutes = 150 rsEEG epochs of 2 s) and analyzed offline.
Afterward, they received a stepwise procedure aimed at detecting and removing (i) recording channels (electrodes) showing prolonged artifactual rsEEG activity due to bad electric contacts or other reasons; (ii) rsEEG epochs with artifacts at recording channels characterized by general good signals; and (iii) intrinsic components of the rsEEG epochs with artifacts.
The first step was based on a visual analysis of the recorded rsEEG activity by two independent experimenters among three experts (i.e., C.D.P, R.L., and G.N.) for a first identification of the eventual EEG electrodes affected by irremediable artifacts. In a few cases, one or two electrodes were removed. In those cases, the rsEEG data were interpolated to compute the potential values at those removed electrodes (EEGLAB toolbox, [60]; version eeglab14_1_2b), thus ensuring that all participants had artifact-free EEG data at the locations of the 19 electrodes.
The second step was based on a visual analysis of the recorded rsEEG activity by two of the mentioned independent experimenters for a first selection of artifactual rsEEG epochs. The rsEEG epochs contaminated by muscular, ocular, head movements, or non-physiological artifacts were removed.
The third step was implemented by an independent component analysis (ICA) from the EEGLAB toolbox, applied to remove the ICA components representing the residual artifacts due to (i) blinking and eye movements, (ii) involuntary head movements, (iii) neck and shoulder muscle tensions, and (iv) electrocardiographic activity [61,62]. For each rsEEG dataset, less than 4 ICA components were removed from the original ICA solutions based on 19 ICA components. In the third step, the rsEEG datasets were reconstructed with the remaining (artifact-free) ICA components. The putative artifact-free rsEEG epochs were visually double-checked again by two of the mentioned independent experimenters to confirm or make the final decision about the inclusion or the exclusion of each of those rsEEG epochs.
The fourth step harmonized the rsEEG data recorded by the clinical units using different reference electrodes and sampling frequency rates. Specifically, the rsEEG data were frequency-band passed at 0.5-45 Hz and down-sampled, when appropriate, to make the sampling rate of the artifact-free rsEEG datasets in all participants equal to 256 Hz. Furthermore, all rsEEG epochs were re-referenced to the common average reference.
As an outcome of the above procedure, the artifact-free rsEEG epochs showed a similar proportion (> 75%) of the total amount of rsEEG activity recorded in all groups of participants (i.e., Healthy, PDNCD, PDCD, and ADCD). This was also true for the artifact-free rsEEG epochs in the 3 rsEEG recordings performed in the 16 PDCD patients involved in the CCT and Sham programs (Baseline vs. Sham vs. CCT).

2.8. Spectral Analysis of the rsEEG Epochs

A standard digital FFT-based analysis (Welch technique, Hanning windowing function, no phase shift) computed the power density of the artifact-free rsEEG epochs at all 19 scalp electrodes (0.5 Hz of frequency resolution). From those spectral solutions, the rsEEG frequency bands of interest were individually identified based on the following frequency landmarks in all participants: transition frequency (TF) and individual alpha frequency (IAF) peak [63,64,65]. In the (eyes-closed) rsEEG power density spectrum, the TF marks the transition between the theta and alpha bands, corresponding to the minimum of the rsEEG power density at 3 - 8 Hz. IAF corresponds to the maximum power density peak at 6 - 14 Hz. Based on the TF and the IAF peak, we estimated the individual delta, theta, and alpha bands as follows: delta from TF-4 Hz to TF-2 Hz, theta from TF-2 Hz to TF, and alpha around the IAF peak, namely, from IAF-2 to IAF+2 Hz. The beta and gamma bands were defined based on standard fixed frequency ranges: beta from 14 to 30 Hz and gamma from 30 to 40 Hz.

2.9. Estimation of the rsEEG Source Solutions

The rsEEG source activity was estimated using an improved version of LORETA freeware [66] called exact LORETA (eLORETA; [67]). eLORETA uses a mathematical head volume conductor model composed of the scalp, skull, and gray matter of the cerebral cortex. Exploring EEG electrodes are virtually positioned in the scalp compartment of that model to give EEG data as an input to the source estimation [67]. The model of the cerebral cortex is based on a realistic shape of that structure from a template typically used in neuroimaging studies, namely that of the Montreal Neurological Institute (MNI152 template).
In the eLORETA freeware, the cortical gray matter compartment used as a cortical source model is formed by 6,239 voxels (5 mm resolution). The eLORETA package provides the Talairach coordinates, lobe, and Brodmann area (BA) for each voxel. For the estimation of the rsEEG source activity, one equivalent current dipole is located at the center of each voxel. This dipole is fixed and cannot change direction or verse during the source estimation. The input for the rsEEG source estimation is the spectral power density computed from the artifact-free rsEEG data at the virtual EEG electrodes located on the modeled scalp. The output is the estimate of the neural current density in each of the equivalent current dipoles that form the cortical source space. To this aim, the eLORETA freeware linearly solves the EEG inverse problem with regularized weighted minimum-norm solutions (i.e., the eLORETA solutions) that estimate such a neural current density. The solutions are computed rsEEG frequency bin-by-frequency bin.
The following procedure was used to normalize the absolute eLORETA solutions computed from the rsEEG data for each participant and rsEEG recording. The absolute eLORETA solutions were averaged across all frequency bins from 0.5 to 45 Hz and for all 6,239 voxels of the cortical compartment of the head model to obtain the eLORETA “mean” solution. Afterward, we computed the ratio between the absolute eLORETA solutions at a given frequency bin and voxel and the eLORETA “mean” solution.
In line with the general low spatial resolution of the current EEG methodological approach (i.e., 19 scalp electrodes), we performed a regional analysis of the eLORETA solutions. For this purpose, we separately collapsed the eLORETA solutions within frontal (Brodmann area, BA, 8, 9, 10, 11, 44, 45, 46, 47), central (BA 1, 2, 3, 4, 6), parietal (BA 5, 7, 30, 39, 40, 43), occipital (BA 17, 18, 19), and temporal (BA 20, 21, 22, 37, 38, 41, 42) macro-regions (ROIs). Notably, the main advantage of the regional analysis of eLORETA solutions was that we could disentangle the rsEEG source activity in contiguous cortical regions of interest (ROIs). For example, the rsEEG source activity in the occipital ROI was disentangled from that estimated in the parietal and temporal ROIs, etc. This was made possible because eLORETA solves the linear inverse problem by considering (at least in part) the effects of the head as a volume conductor. In contrast, the solutions of rsEEG power density computed at a parietal scalp electrode reflect the contribution of source activities not only of the underlying parietal cortex but also of surrounding occipital and temporal cortices.

2.10. Statistical Analysis of rsEEG eLORETA Source Activities

Two main statistical sessions were performed by the commercial tool STATISTICA 10 (StatSoft Inc., www.statsoft.com). In all statistical sessions, an ANOVA was computed using the rsEEG source activities (i.e., regional normalized eLORETA current densities) as the dependent variables. It is well known that the use of ANOVA models implies that dependent variables approximate Gaussian distributions, so we tested this feature in the regional normalized eLORETA current densities of interest by the Kolmogorov–Smirnov test. The hypothesis of Gaussian distributions was tested at p > 0.05 (i.e., p > 0.05 = Gaussian; p ≤ 0.05 = non-Gaussian). As the distributions of the regional normalized eLORETA current densities were not Gaussian in most cases, those variables underwent the log-10 transformation and were re-tested. Mauchly’s test evaluated the sphericity assumption, and degrees of freedom were corrected by the Greenhouse–Geisser procedure when appropriate (p < 0.05). Duncan test was used for post-hoc comparisons (p < 0.05 Bonferroni corrected). Finally, the results of the statistical analyses were controlled by the Grubbs test for the presence of outliers (p < 0.001).
The first ANOVA tested the control hypothesis that the rsEEG source activities (i.e., regional normalized eLORETA current densities) may differ between the PDCD group and the other three enrolled groups (i.e., Healthy, PDNCD, and ADCD). The ANOVA factors were Group (Healthy, PDNCD, ADCD, and PDCD), Band (delta, theta, alpha, beta, and gamma), and ROI (frontal, central, parietal, occipital, and temporal). The confirmation of this control hypothesis may require (i) a statistically significant ANOVA interaction including the factor Group (p < 0.05) and (ii) a post-hoc Duncan test indicating statistically significant (p < 0.05 Bonferroni corrected) differences in the rsEEG source activities between the PDCD group and the Healthy, PDNCD, and ADCD groups (i.e., PDCD > Healthy PDNCD, ADCD or PDCD < Healthy, PDNCD, ADCD).
The rsEEG source activities (i.e., regional normalized eLORETA current densities) showing differences (p < 0.05 Bonferroni corrected) between the PDCD group and the other three enrolled groups (i.e., Healthy, PDNCD, and ADCD) were used as dependent variables for the second ANOVA. This ANOVA tested the working hypothesis that those rsEEG source activities (i.e., regional normalized eLORETA current densities) may differ between the CCT condition when compared to the Baseline and Sham conditions in the 16 PDCD involved in the intervention study. The differences were expected in terms of a trend of normalization to support the hypothesis of a neurophysiological beneficial effect of the CCT program. The ANOVA factors were Condition (Baseline, Sham, CCT), Band (delta, theta, alpha, beta, and gamma), and ROI (frontal, central, parietal, occipital, and temporal). The confirmation of this control hypothesis may require (i) a statistically significant ANOVA interaction including the factor Condition (p < 0.05) and (ii) a post-hoc Duncan test indicating statistically significant (p < 0.05 Bonferroni corrected) differences in the rsEEG source activities between the CCT condition and the Baseline and Sham conditions (i.e., CCT > Sham, Baseline or CCT < Sham, Baseline).

3. Results

3.1. rsEEG Source Activities in the Healthy, PDNCD, ADCD, and PDCD Participants

The mean TF was 5.6 Hz (±0.2 SE) in the Healthy (N = 40) group, 5.7 Hz (±0.2 SE) in the PDNCD (N = 29) group, 5.2 Hz (± 0.2 SE) in the ADCD (N = 40) group, and 4.5 Hz (± 0.1 SE) in the PDCD (N = 40) group. Furthermore, the mean IAF was 9.0 Hz (±0.2 SE) in the Healthy group, 9.2 Hz (±0.2 SE) in the PDNCD group, 8.2 Hz (± 0.2 SE) in the ADCD group, and 6.8 Hz (± 0.2 SE) in the PDCD group. The ANOVAs of these variables showed the following statistically significant effects. The mean TF was greater (F = 14.3, p < 0.0001) in the Healthy and PDNCD groups than in the ADCD and PDCD groups (post-hoc test = p < 0.0001). It was also higher in the ADCD group than in the PDCD group (post-hoc test = p < 0.001). Furthermore, the mean IAF peak was greater (F = 31.4, p < 0.0001) in the Healthy and PDNCD groups than in the ADCD and PDCD groups (post-hoc test = p < 0.00001). It was also higher in the ADCD group than in the PDCD group (post-hoc test = p < 0.0001). These findings emphasized the importance of the use of the TF and IAF peak in the determination of the delta to alpha frequency bands in the studies involving ADCD and PDCD patients.
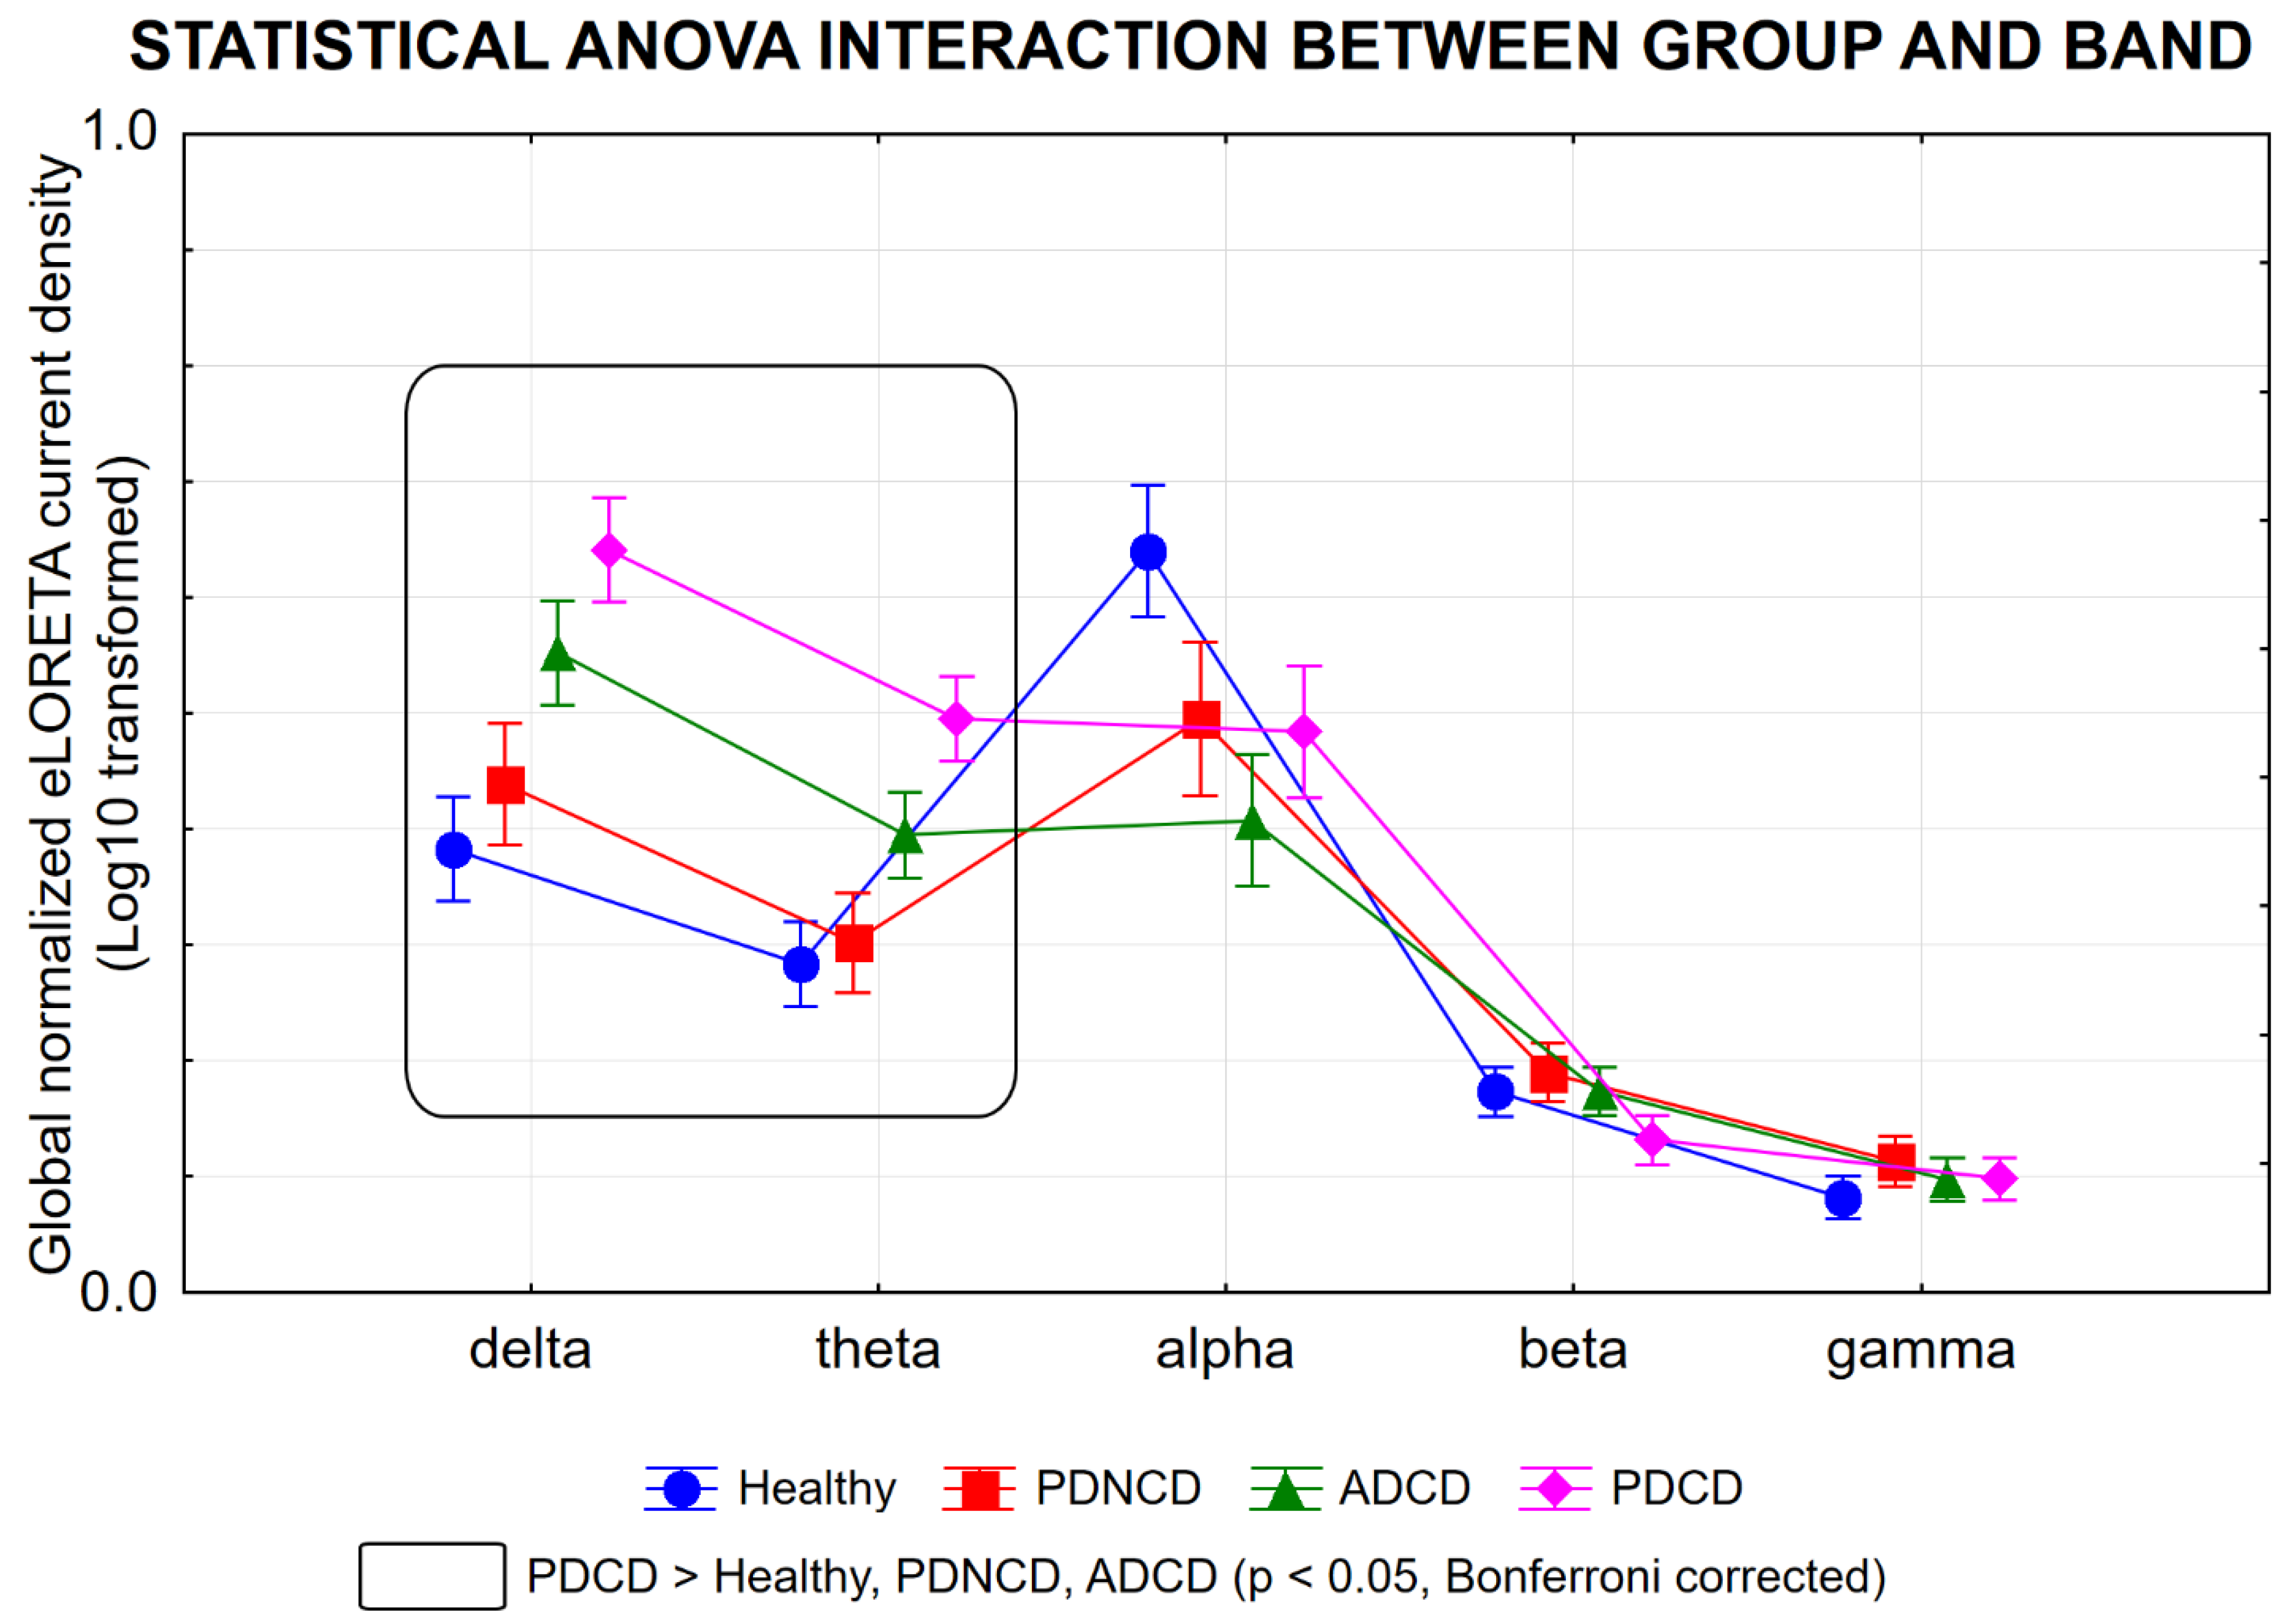
In the four groups of participants considered, the ANOVA of the regional rsEEG source activities showed a statistical 2-way interaction effect (F = 25.3; p < 0.0001; Figure 2) between the factors Group (Healthy, PDNCD, ADCD, and PDCD) and Band (delta, theta, alpha, beta, and gamma). The Duncan planned post-hoc (p < 0.05 Bonferroni correction for 5 frequency bands, P < 0.05/5 = 0.01) test showed that the discriminant pattern PDCD > Healthy, PDNCD, and ADCD groups was fitted by the global delta (p < 0.001-0.000001) and theta (p < 0.0005-0.000005) source activities.
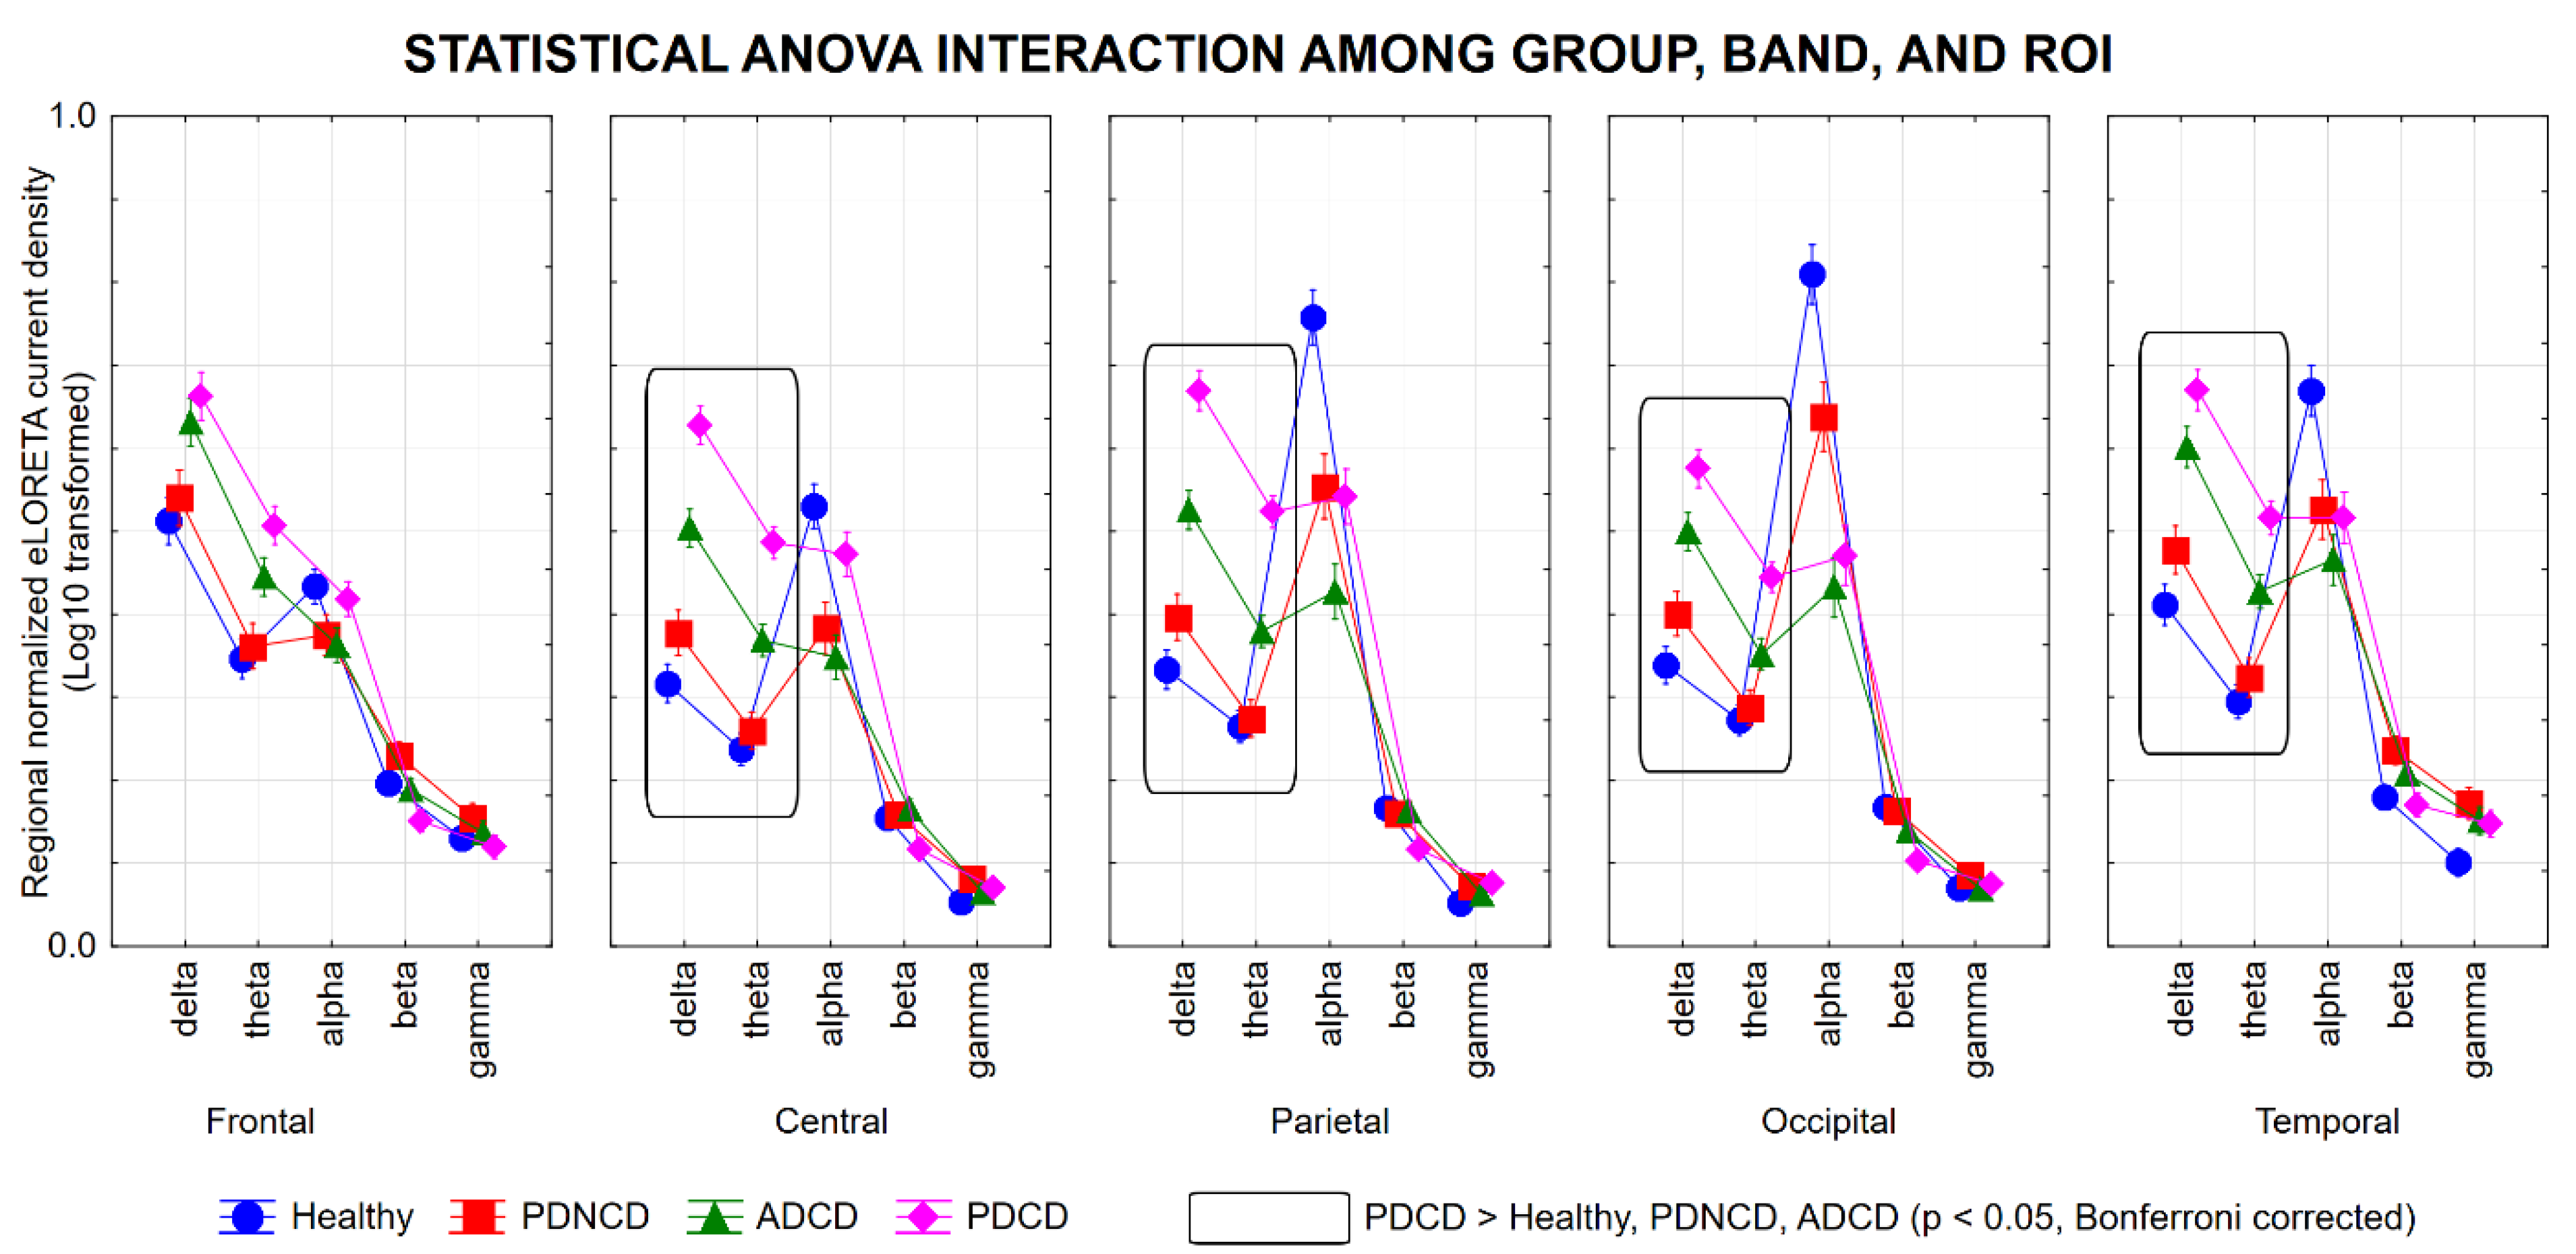
Furthermore, there was also a statistical 3-way interaction effect (F = 10.6; p < 0.0001; Figure 3) among the factors Group (Healthy, PDNCD, ADCD, and PDCD), Band (delta, theta, alpha, beta, and gamma), and ROI (frontal, central, parietal, occipital, and temporal). The Duncan planned post-hoc (p < 0.05 Bonferroni correction for 5 frequency bands X 5 ROIs = 25, P < 0.05/25 = 0.002) test showed that the discriminant pattern PDCD > Healthy, PDNCD, and ADCD groups was fitted by the central, parietal, occipital, and temporal rsEEG delta source activities (p < 0.002-0.000001) as well as central, parietal, occipital, and temporal rsEEG theta source activities (p < 0.0001-0.000001).
Notably, these findings were not due to outliers from individual eLORETA solutions, as shown by the Grubbs’ test with an arbitrary threshold of p > 0.001.
The present results indicate that the PDCD group is characterized by specific abnormalities of rsEEG source activities in the delta and theta frequency bands compared to the healthy, PDNCD and ADCD groups.

3.2. Effects of the CCT Program on Task Performances in PDCD Patients

All the 16 PDCD patients recruited for the intervention study completed the CCT and Sham programs. Table 3 shows the mean values (± SE) of the performance accuracy (%) and reaction time (s) before the intervention (Baseline) and after two weeks of the CCT for the following computerized neuropsychological tests (7 video games or tasks): (i) visual non-spatial reaction time task, (ii) visuospatial attention task, (iii) visual non-spatial attention task, (iv) short-term visuospatial task, (v) short-term visual non-spatial task, (iv) a modified Posner’s task, and (vii) a task testing the ability to refrain from impulsive motor responses. Table 3 also shows the results of the presence or absence of statistically significant differences (Wilcoxon test) in performance on the above tasks between the Baseline and CCT conditions. To account for the inflating effects of repeated univariate testing, the statistical threshold was set at p < 0.0036 (i.e., 7 tests X 2 scores, p  <  0.05/14  =  0.0036) to obtain the Bonferroni correction at p  <  0.05. A statistically significant increase (p < 0.0036) in the accuracy after the CCT program was found for the visuospatial attention task (p = 0.003) and visual non-spatial attention task (p =0.002). Furthermore, there was a statistically significant decrease (p < 0.0036) in the reaction time (i.e., better performance) after the CCT program for the task testing the ability to refrain from impulsive motor responses task (p = 0.003). These findings showed that the CCT program improved cognitive functions underlying some training tasks in PDNCD patients.

3.3. Effects of the CCT Program on rsEEG Source Activities in PDCD Patients

In the PDCD patients of the intervention study, the mean TF was 4.8 Hz (± 0.2 SE) at the Baseline, 4.8 Hz (± 0.2 SE) after the Sham program, and 5.2 Hz (± 0.2 SE) after the CCT program. The mean IAF peak was 7.1 Hz (± 0.4 SE) at the Baseline, 7.1 Hz (± 0.3 SE) after the Sham program, and 7.2 Hz (± 0.3 SE) after the CCT program. The ANOVAs of these variables showed no statistically significant effects of the CCT program (p > 0.05).
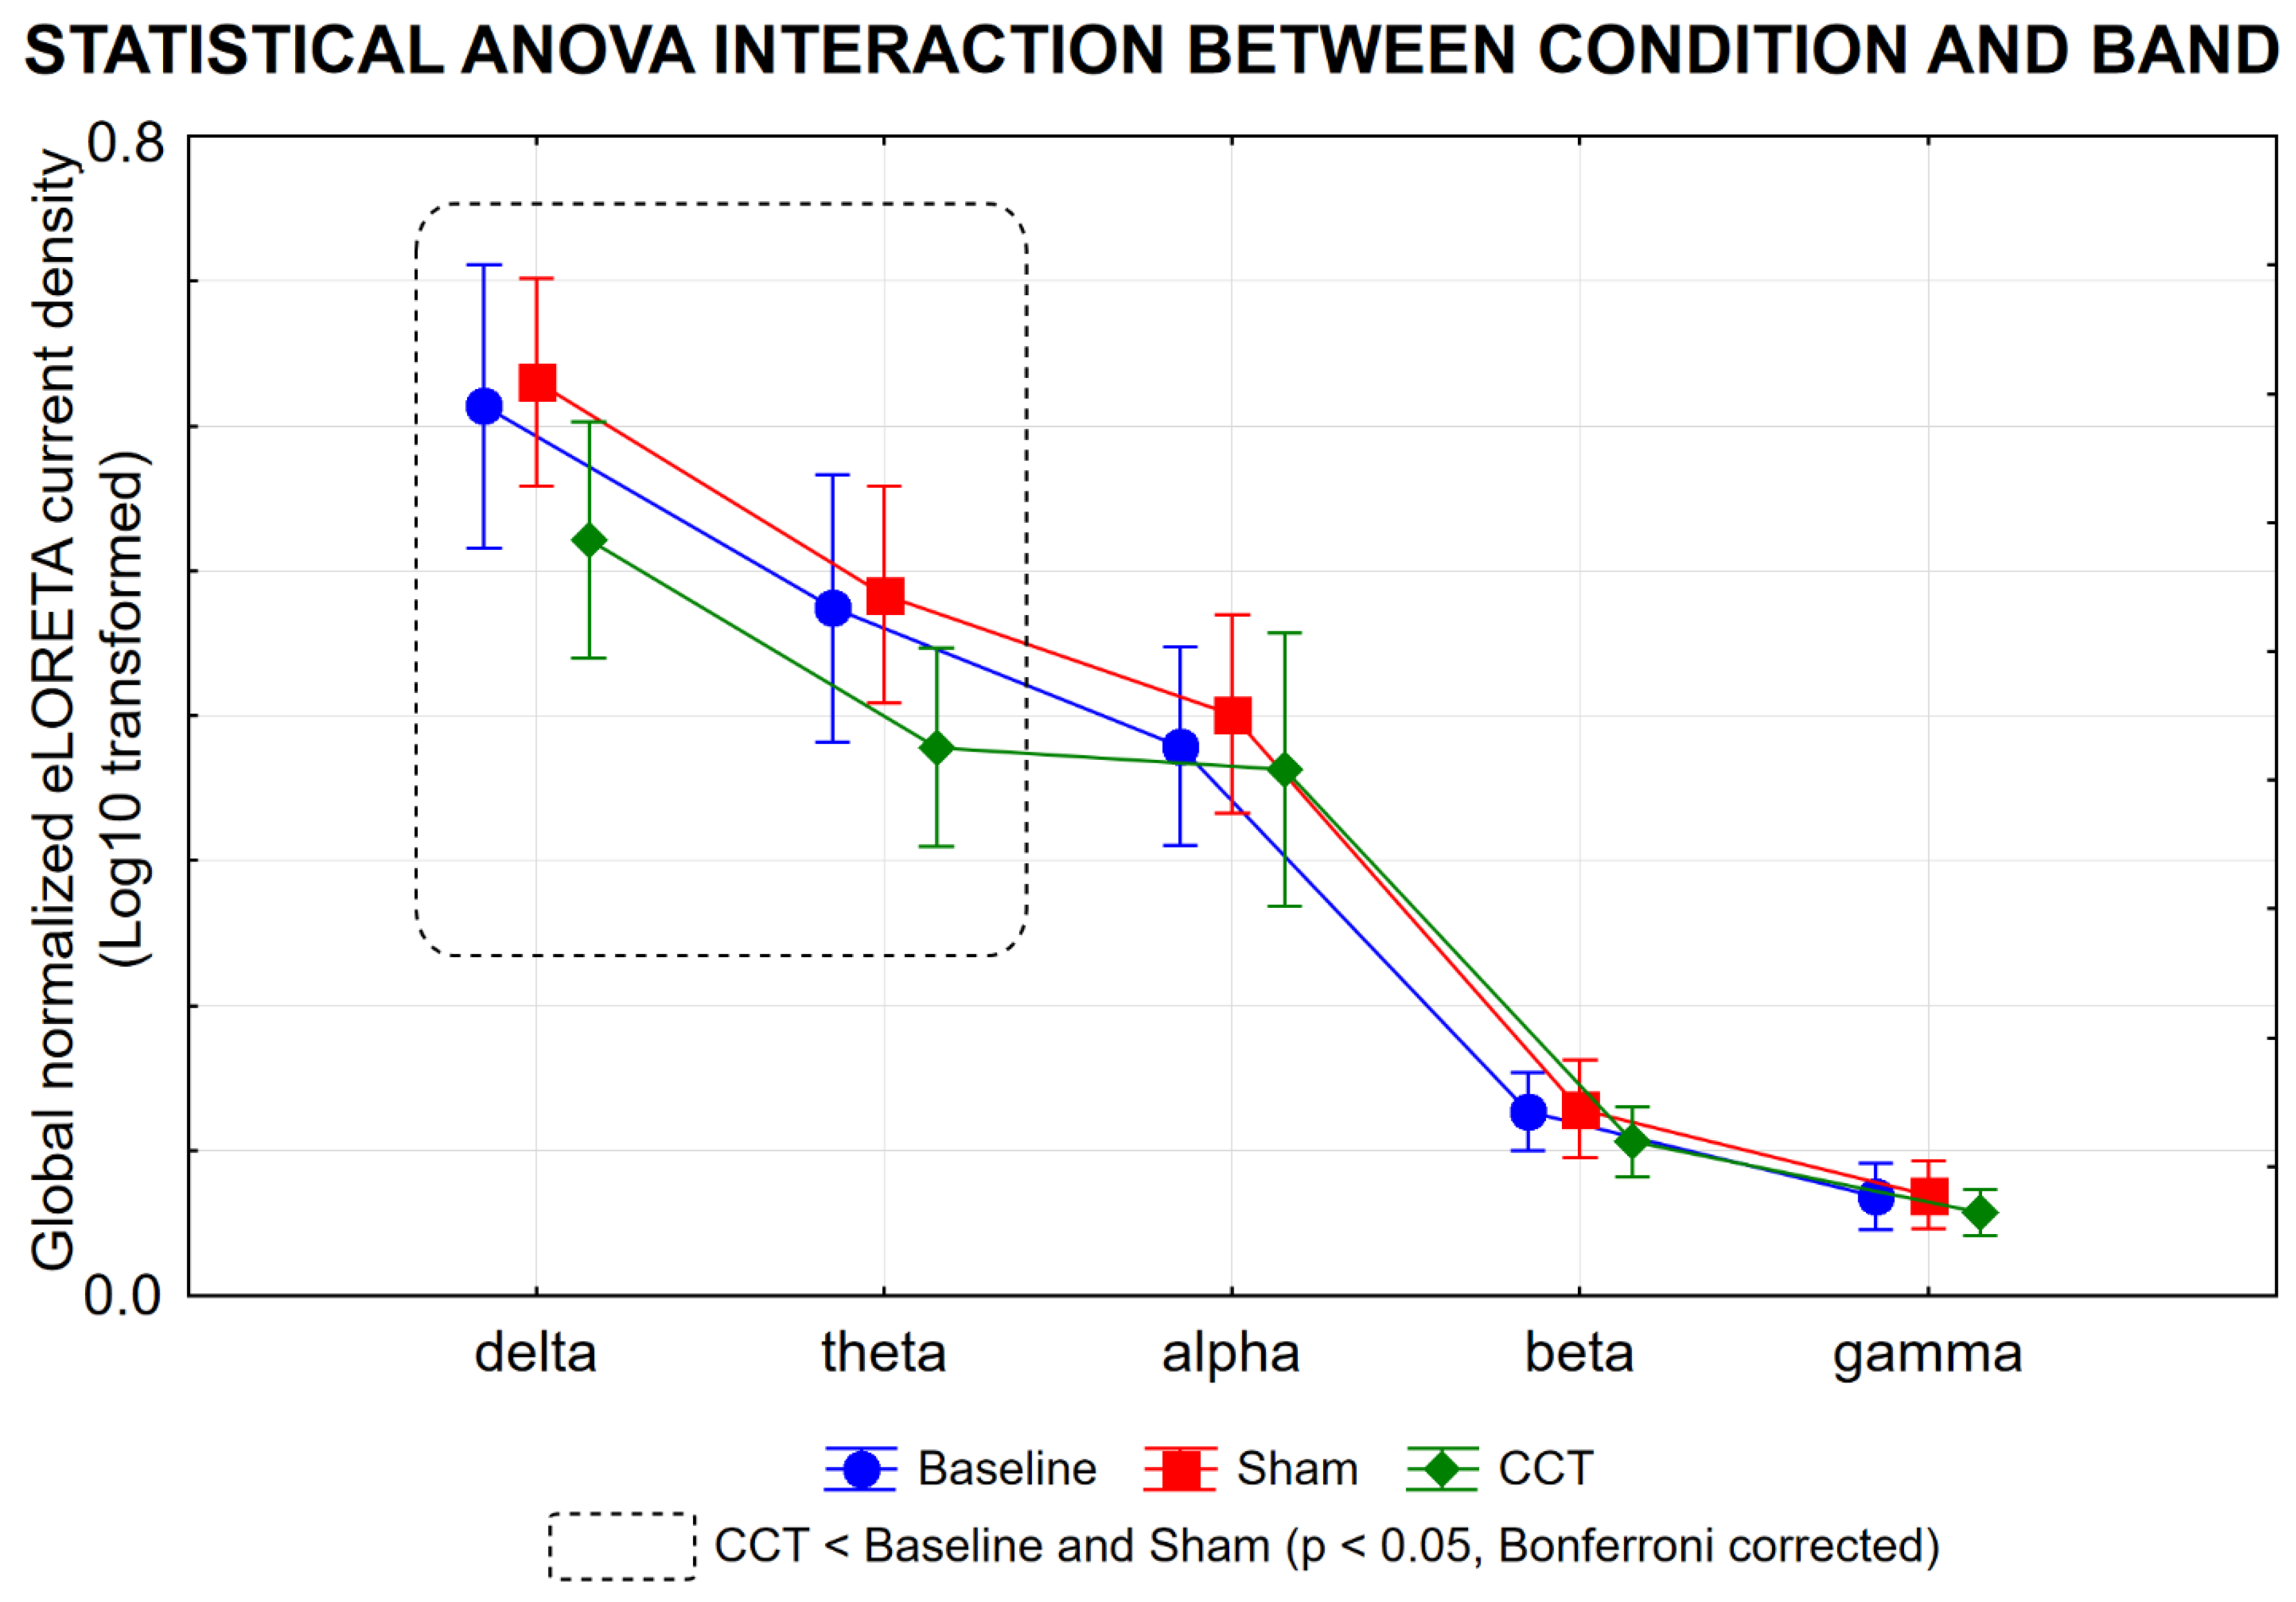
In these PDCD participants, the ANOVA of the rsEEG source activities showed a statistical 2-way interaction effect (F = 2.2; p < 0.05; Figure 4) between the factors Condition (Baseline, Sham, CCT) and Band (delta, theta, alpha, beta, and gamma). The Duncan planned post-hoc test (p < 0.05 Bonferroni correction for 5 frequency bands, P < 0.05/5 = 0.01) showed that the discriminant pattern CCT < Sham and Baseline conditions was fitted by the global delta (p < 0.0005-0.0001) and theta (p < 0.0005-0.0001) source activities.
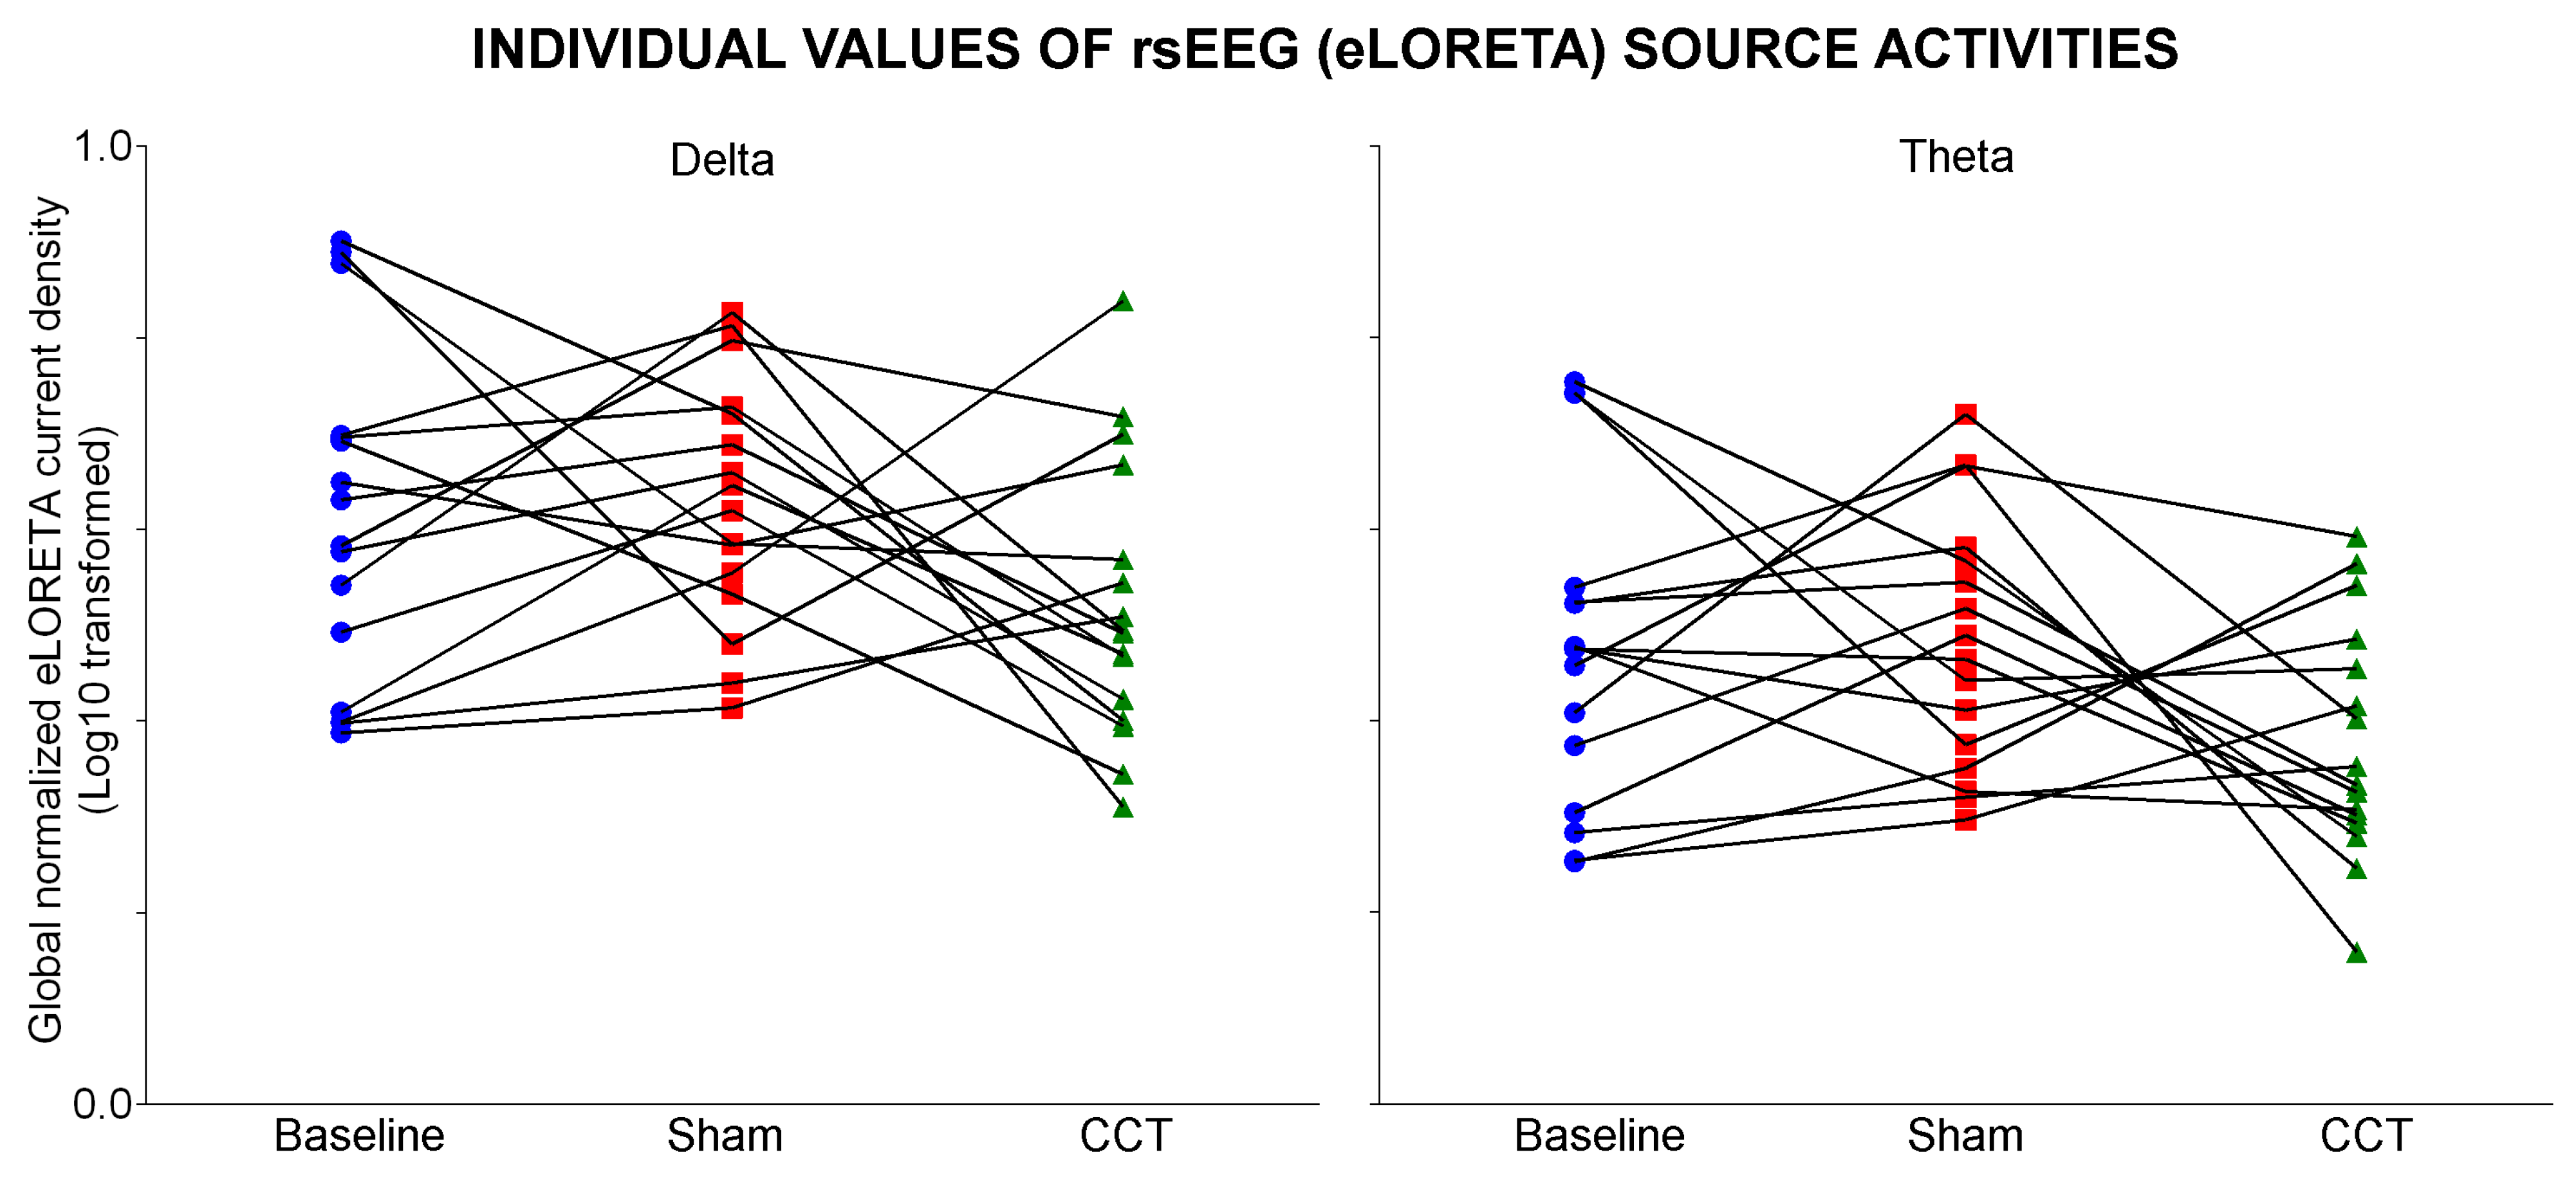
Notably, these findings were not due to outliers from individual eLORETA solutions, as shown by Grubbs’ test with an arbitrary threshold of p > 0.001 (Figure 5).
The present results indicate that the CCT program in PDCD patients partially restores their abnormalities of rsEEG source activities at delta and theta frequency bands.

3.4. Control Analysis

Spearman test was used to evaluate the correlation between the rsEEG (eLORETA) source activities (i.e., global delta and theta) and the MMSE score as an index of global cognition. Such a correlation was computed across all PDNCD (N = 29), ADCD (N =40), and PDCD (N = 40) patients as a whole group (p < 0.05). A statistically significant negative correlation was found between the activity of the global delta (R = -0.39, p = 0.00003) and theta (R = -0.43, p = 0.000003) sources vs. the MMSE score. The higher the global delta and theta source activities, the lower the MMSE score. This finding suggests the clinical relevance of the rsEEG delta and theta source activities in those patients.

4. Discussion

Previous studies in PD patients showed the beneficial effects of cognitive training on brain connectivity and cognitive performance, supporting this non-pharmacological intervention to mitigate the risk of progressive cognitive decline [68,69,70]. Along this line, this study in PDCD patients tested the effect of a two-week unsupervised CCT intervention in home telemonitoring on rsEEG rhythms typically abnormal in these patients [71,72,73,74]. As a first step in the study, we used an international database (www.pdwaves.eu) to determine the abnormal rsEEG rhythms in PDCD patients when compared to matched control groups of healthy individuals and patients with PDNCD and ADDC. Compared to these control groups, the PDCD group was characterized by a greater amplitude of rsEEG rhythms in the delta and theta frequency bands, in line with a bulk of previous findings reporting a significant “slowing” of rsEEG rhythms in PDCD patients [29,34,35,36,37,71,72,73,74]. Notably, these rsEEG rhythms were associated with PD-related cortical neuropathology (autoptic biofluid and histological markers) and cognitive deficits in previous rsEEG studies [73,75,76].
In a second step, the effects of the two-week CCT program on rsEEG delta and theta rhythms were tested in a subgroup of PDCD patients. As a novel finding, the PDCD patients showed a substantial improvement in the performance of the serious video games (i.e., accuracy and reaction/response time) during the CCT program and changes in the rsEEG rhythms. Specifically, the rsEEG delta and theta rhythms were reduced in magnitude after the CCT program compared to the control Sham program. These findings extend recent evidence showing that a combined eight-week program with CCT and physical activity in a hospital setting induced beneficial effects on cognitive functions that (negatively) correlated with rsEEG theta rhythms [39].
At this early stage of the research, we can only speculate on the neurophysiological mechanisms underlying the present results. We posit that the present CCT program could mitigate the abnormal slow-frequency (< 7 Hz) oscillatory synchronization of the cortical neural activity responsible for the prominent rsEEG delta-theta rhythms observed in these PDCD patients. This speculation is based on the theory of thalamocortical dysrhythmia discussed in the following paragraphs [77,78,79].

4.1. The CCT Program Might Mitigate Thalamocortical Dysrhythmia in PDCD Patients

According to the theory of thalamocortical dysrhythmia, the abnormal cortical rsEEG delta and theta rhythms in PDCD patients may reflect the physiopathological mechanisms underlying, at least in part, their vigilance and cognitive-motor deficits [77,78,79]. These rsEEG rhythms may be generated by an abnormal oscillatory synchronization at slow frequencies of cortical neuronal activities, which would be induced by low-frequency bursting of action potentials (< 7 Hz) in the neurons belonging to reciprocal cortical and thalamic circuits. This bursting mode would inhibit the information processing in those neurons due to the relatively long interval of the membrane hyperpolarization (inhibition) between two bursts of action potentials [77,78,79]. Reduced excitatory signals in the cortical and thalamic circuits may explain the evidence of poor intracortical (glutamatergic) excitatory facilitation reported in PDCD patients in studies using transcranial magnetic stimulation of the motor cortex with an appropriate time interval between the conditioning and test stimuli [80,81,82].
It can also be speculated that in PDCD patients, the thalamocortical dysrhythmia may be due to reduced excitatory inputs to unspecific and specific thalamocortical neurons, which, in turn, would reduce their excitatory inputs to GABAergic neurons of the thalamic nucleus reticularis. Consequently, those (inhibitory) GABAergic neurons would start their bursting firing at < 7 Hz. This bursting firing would propagate to the aforementioned thalamocortical and corticothalamic circuits [78,83]. In this speculative line, the original physiopathological processes responsible for reduced excitatory inputs to thalamocortical neurons in PDCD patients may mainly include the PD-related loss of nigrostriatal dopaminergic projections and cortical neuropathology, such as Lewy-type synucleinopathy and amyloidosis [73,75,76].

4.2. Cognitive Training and Modulation of Subcortical Ascending Arousing Systems

It can be speculated that the neurophysiological mechanisms underlying the present CCT effects may induce structural and functional changes within the corticothalamic, thalamocortical, and nigrostriatal circuits. Along this speculative line, previous structural MRI evidence showed that an eight-week CCT program in home telemonitoring induced an enhancement of the intra-striatal and thalamostriatal fibers of the anterior thalamic radiation in PDCD patients, which was associated with improved performance on a task probing frontal executive functions [84]. Notably, the anterior thalamic radiation and other white-matter bundles (i.e., the inferior longitudinal fascicles, corpus callosum, etc.) are impared in PDCD patients [85,86]. Furthermore, resting-state functional MRI data showed that such a CCT program induced enhanced connectivity of the dorsal anterior cingulate cortex and dorsolateral prefrontal cortex in PD patients, especially with the striatum [87].
Considering the present and cited data, it can be speculated that the CCT program may strengthen dopamine-dependent cortico-striato-thalamo-cortical circuits involved in executive functions [88] and cognitive control [89] in PDCD patients. Those circuits involving specific and non-specific high-order thalamic nuclei may regulate the brain arousal and vigilance/consciousness levels, enabling synchronization of neural activity and large-scale integration of information across multiple cortical circuits [90]. In this sense, previous resting-state functional MRI data in PD patients showed that inter-areal synchronization and stability within functional cortical connectivity were reduced from ON to OFF dopamine state in association with cognitive performance [91], with the dynamic time course of this connectivity being related to these performances [92,93,94] and thalamic and thalamocortical fiber connectivity volumes [91].
Finally, it should be remarked that other subcortical neuromodulatory systems may play a substantial role in explaining the present findings. Molecular neuroimaging studies unveiled that PD induces the degeneration of both subcortical cholinergic and dopaminergic systems, and that the loss of cholinergic projections from the basal forebrain and brainstem to the basal ganglia and cerebral cortex may affect executive, posterior visuospatial, and episodic memory functions in PD patients [95,96,97]. A synergistic model of the dopaminergic and cholinergic neurotransmission in PD predicts that anticholinergic drugs impair cognitive functions in PD patients and acetylcholinesterase inhibitors improve them [98]. Furthermore, the concomitant degeneration of other monoaminergic systems (e.g., noradrenergic, serotoninergic) could influence the interaction of synaptic dopamine and acetylcholine release. For example, neuropharmacological studies showed that selective noradrenergic agonists mitigated attention deficits in PDCD patients [99,100].

4.3. Methodological Remarks

In the interpretation of the present findings, the following methodological limitations of the study should be considered.
First, the sample of PDCD patients for the CCT program was relatively small. It did not allow stratification of the participants based on the time from diagnosis, pharmacological treatment, the severity of cognitive decline to dementia, and motor symptoms. The results motivate a future multicentric study in healthy controls and a larger population of PDCD patients using the harmonized experimental protocol for the participants’ enrollment, MRI scans, EEG recordings, clinical measures, and neuropsychological tests.
Second, the use of 19 scalp electrodes (i.e., 10-20 International System) did not allow a high spatial sampling of rsEEG rhythms for a finer spatial analysis of the source activities [101,102]. The present exploratory approach allowed us to investigate broad cortical sources by averaging eLORETA solutions within lobar regions. A future study may use more than 32 electrodes for a finer analysis of rsEEG source activity and connectivity [103].
Third, the experimental design was of only two-weeks of CCT program and did not include an assessment of the patient after the wash-out week. This choice reduced the impact of the protocol on PDCD patients due to its preliminary nature. In a future study, an assessment of the patient after the wash-out week needs to be included in the experimental protocol.

5. Conclusions

This retrospective and exploratory study tested the hypothesis that a 2-week CCT program in video telemonitoring may mitigate the abnormal rsEEG rhythms recorded in PDCD patients. Compared to the Healthy, PDNCD, and ADCD groups, the PDCD group was characterized by greater rsEEG delta (about 2-4 Hz) and theta (about 4-7 Hz) rhythms diffusely. The PDCD subgroup who underwent the CCT program showed an improvement in their performances on serious video games during that program. Furthermore, they showed reduced rsEEG delta-theta rhythms after the CCT program as compared with the Sham program.
These results suggest that an unsupervised 2-week CCT program in home telemonitoring may mitigate the abnormal “slowing” of rsEEG rhythms recorded in PDCD patients, possibly enhancing the regulation of brain arousal and quiet vigilance. Overall, they encourage a future cross-validation study in a larger PDCD population to strengthen and cross-validate the present findings. This CCT program may represent a useful, practical, free, “green,” and non-invasive digital intervention to slow progressive cognitive decline and subsequent loss of autonomy in PDCD patients.

Authors’ contribution

RL and CDP: Conceptualization, Methodology, Formal analysis, Validation, Writing - Original Draft, Supervision, and Project administration. CB: Conceptualization, Methodology, Writing - Original Draft, Supervision, and Project administration. GN: Methodology, Formal analysis, Validation. VC, RR, DA, FF, MM, LH, NHY: Recruitment of the participants and Data acquisition. VS, GR: Contribution on the home telemonitoring platform. MFDP, RF, AS, MS, FS, LV, BG, GY, GBF, FI: Contribution to manuscript editing and critically discussed the results. All authors have read and agreed to the published version of the manuscript.

Funding and Acknowledgments

The present study was developed based on the data of the PDWAVES Consortium (www.pdwaves.eu). The electroencephalographic data recording and analysis were partially supported by the funds of “Ricerca Corrente” attributed by the Italian Ministry of Health to the IRCCS Synlab SDN (Naples), Oasi Research Institute-IRCCS (Troina), IRCCS Ospedale San Martino of Genoa, Istituto Centro San Giovanni di Dio Fatebenefratelli (Brescia), and IRCCS San Raffaele of Rome. The Sapienza University of Rome Unit's research activities were partially supported by the grant with the following reference: Progetto ECS 0000024 Rome Technopole, - CUP B83C22002820006, PNRR Missione 4 Componente 2 Investimento 1.5, founded by the European Union – NextGenerationEU. Ing. Giacomo Russo was supported by the grant with the following reference: Progetto “TELEMAIA,” Regione Lazio Det. n. G18823 of December 28, 2022, "Call: Riposizionamento Competitivo RSI”.

Informed Consent Statement

Informed consent was obtained from all participants.

Conflicts of interest

None of the Authors have potential conflicts of interest to be disclosed.

References

  1. World Health Organization Risk Reduction of Cognitive Decline and Dementia: WHO Guidelines; World Health Organization: Geneva, 2019; ISBN 978-92-4-155054-3.
  2. Aarsland, D.; Batzu, L.; Halliday, G.M.; Geurtsen, G.J.; Ballard, C.; Ray Chaudhuri, K.; Weintraub, D. Parkinson Disease-Associated Cognitive Impairment. Nat Rev Dis Primers 2021, 7, 47. [Google Scholar] [CrossRef] [PubMed]
  3. Prince, M.; Wimo, A.; Guerchet, M.; Ali, G.-C.; Wu, Y.-T.; Prina, M. World Alzheimer Report 2015.The Global Impact of Dementia: An Analysis of Prevalence, Incidence, Cost and Trends.; Alzheimer’s Disease International, 2015.
  4. Levy, G.; Tang, M.-X.; Cote, L.J.; Louis, E.D.; Alfaro, B.; Mejia, H.; Stern, Y.; Marder, K. Motor Impairment in PD: Relationship to Incident Dementia and Age. Neurology 2000, 55, 539–544. [Google Scholar] [CrossRef] [PubMed]
  5. Aarsland, D. Performance on the Dementia Rating Scale in Parkinson’s Disease with Dementia and Dementia with Lewy Bodies: Comparison with Progressive Supranuclear Palsy and Alzheimer’s Disease. Journal of Neurology, Neurosurgery & Psychiatry 2003, 74, 1215–1220. [Google Scholar] [CrossRef]
  6. Buter, T.C.; van den Hout, A.; Matthews, F.E.; Larsen, J.P.; Brayne, C.; Aarsland, D. Dementia and Survival in Parkinson Disease: A 12-Year Population Study. Neurology 2008, 70, 1017–1022. [Google Scholar] [CrossRef] [PubMed]
  7. Fang, C.; Lv, L.; Mao, S.; Dong, H.; Liu, B. Cognition Deficits in Parkinson’s Disease: Mechanisms and Treatment. Parkinsons Dis 2020, 2020, 2076942. [Google Scholar] [CrossRef] [PubMed]
  8. Aarsland, D.; Kurz, M.W. The Epidemiology of Dementia Associated with Parkinson’s Disease. Brain Pathology 2010, 20, 633–639. [Google Scholar] [CrossRef] [PubMed]
  9. Pedersen, K.F.; Larsen, J.P.; Tysnes, O.-B.; Alves, G. Natural Course of Mild Cognitive Impairment in Parkinson Disease: A 5-Year Population-Based Study. Neurology 2017, 88, 767–774. [Google Scholar] [CrossRef] [PubMed]
  10. Lawson, R.A.; Yarnall, A.J.; Duncan, G.W.; Breen, D.P.; Khoo, T.K.; Williams-Gray, C.H.; Barker, R.A.; Burn, D.J. Stability of Mild Cognitive Impairment in Newly Diagnosed Parkinson’s Disease. J Neurol Neurosurg Psychiatry 2017, 88, 648–652. [Google Scholar] [CrossRef]
  11. Zimmermann, R.; Gschwandtner, U.; Benz, N.; Hatz, F.; Schindler, C.; Taub, E.; Fuhr, P. Cognitive Training in Parkinson Disease: Cognition-Specific vs Nonspecific Computer Training. Neurology 2014, 82, 1219–1226. [Google Scholar] [CrossRef]
  12. Hershey, L.A. Comment: Performance Improvement with Computer Training in Parkinson Disease. Neurology 2014, 82, 1224–1224. [Google Scholar] [CrossRef]
  13. Edwards, J.D.; Hauser, R.A.; O’Connor, M.L.; Valdés, E.G.; Zesiewicz, T.A.; Uc, E.Y. Randomized Trial of Cognitive Speed of Processing Training in Parkinson Disease. Neurology 2013, 81, 1284–1290. [Google Scholar] [CrossRef]
  14. Naismith, S.L.; Mowszowski, L.; Diamond, K.; Lewis, S.J.G. Improving Memory in Parkinson’s Disease: A Healthy Brain Ageing Cognitive Training Program. Mov Disord 2013, 28, 1097–1103. [Google Scholar] [CrossRef] [PubMed]
  15. Dunlosky, J.; Kubat-Silman, A.K.; Hertzog, C. Training Monitoring Skills Improves Older Adults’ Self-Paced Associative Learning. Psychol Aging 2003, 18, 340–345. [Google Scholar] [CrossRef] [PubMed]
  16. Alloni, A.; Quaglini, S.; Panzarasa, S.; Sinforiani, E.; Bernini, S. Evaluation of an Ontology-Based System for Computerized Cognitive Rehabilitation. International Journal of Medical Informatics 2018, 115, 64–72. [Google Scholar] [CrossRef]
  17. Vallejo, V.; Wyss, P.; Rampa, L.; Mitache, A.V.; Müri, R.M.; Mosimann, U.P.; Nef, T. Evaluation of a Novel Serious Game Based Assessment Tool for Patients with Alzheimer’s Disease. PLoS ONE 2017, 12, e0175999. [Google Scholar] [CrossRef]
  18. Ben-Sadoun, G.; Manera, V.; Alvarez, J.; Sacco, G.; Robert, P. Recommendations for the Design of Serious Games in Neurodegenerative Diseases. Front. Aging Neurosci. 2018, 10, 13. [Google Scholar] [CrossRef]
  19. Bernini, S.; Panzarasa, S.; Barbieri, M.; Sinforiani, E.; Quaglini, S.; Tassorelli, C.; Bottiroli, S. A Double-Blind Randomized Controlled Trial of the Efficacy of Cognitive Training Delivered Using Two Different Methods in Mild Cognitive Impairment in Parkinson’s Disease: Preliminary Report of Benefits Associated with the Use of a Computerized Tool. Aging Clin Exp Res 2021, 33, 1567–1575. [Google Scholar] [CrossRef]
  20. Kalbe, E.; Folkerts, A.-K.; Ophey, A.; Eggers, C.; Elben, S.; Dimenshteyn, K.; Sulzer, P.; Schulte, C.; Schmidt, N.; Schlenstedt, C.; et al. Enhancement of Executive Functions but Not Memory by Multidomain Group Cognitive Training in Patients with Parkinson’s Disease and Mild Cognitive Impairment: A Multicenter Randomized Controlled Trial. Parkinsons Dis 2020, 2020, 4068706. [Google Scholar] [CrossRef]
  21. Gavelin, H.M.; Domellöf, M.E.; Leung, I.; Neely, A.S.; Launder, N.H.; Nategh, L.; Finke, C.; Lampit, A. Computerized Cognitive Training in Parkinson’s Disease: A Systematic Review and Meta-Analysis. Ageing Res Rev 2022, 80, 101671. [Google Scholar] [CrossRef]
  22. Suzuki, K.; Miyamoto, T.; Miyamoto, M.; Okuma, Y.; Hattori, N.; Kamei, S.; Yoshii, F.; Utsumi, H.; Iwasaki, Y.; Iijima, M.; et al. Excessive Daytime Sleepiness and Sleep Episodes in Japanese Patients with Parkinson’s Disease. J Neurol Sci 2008, 271, 47–52. [Google Scholar] [CrossRef]
  23. Höglund, A.; Broman, J.-E.; Pålhagen, S.; Fredrikson, S.; Hagell, P. Is Excessive Daytime Sleepiness a Separate Manifestation in Parkinson’s Disease? Acta Neurol Scand 2015, 132, 97–104. [Google Scholar] [CrossRef] [PubMed]
  24. Höglund, A.; Hagell, P.; Broman, J.; Pålhagen, S.; Sorjonen, K.; Fredrikson, S.; Svenningsson, P. Associations Between Fluctuations in Daytime Sleepiness and Motor and Non-Motor Symptoms in Parkinson’s Disease. Movement Disord Clin Pract 2021, 8, 44–50. [Google Scholar] [CrossRef] [PubMed]
  25. Jost, S.T.; Konitsioti, A.; Loehrer, P.A.; Ashkan, K.; Rizos, A.; Sauerbier, A.; Dos Santos Ghilardi, M.G.; Rosenkranz, F.; Strobel, L.; Gronostay, A.; et al. Non-Motor Effects of Deep Brain Stimulation in Parkinson’s Disease Motor Subtypes. Parkinsonism & Related Disorders 2023, 109, 105318. [Google Scholar] [CrossRef]
  26. Iijima, M.; Osawa, M.; Yasuda, S.; Kitagawa, K. Association between Excessive Daytime Sleepiness and the Cholinergic Ascending Reticular System in Parkinson’s Disease. Neurodegener Dis 2021, 21, 48–54. [Google Scholar] [CrossRef] [PubMed]
  27. Shirahige, L.; Berenguer-Rocha, M.; Mendonça, S.; Rocha, S.; Rodrigues, M.C.; Monte-Silva, K. Quantitative Electroencephalography Characteristics for Parkinson’s Disease: A Systematic Review. J Parkinsons Dis 2020, 10, 455–470. [Google Scholar] [CrossRef] [PubMed]
  28. Pfurtscheller, G.; Lopes da Silva, F.H. Event-Related EEG/MEG Synchronization and Desynchronization: Basic Principles. Clin Neurophysiol 1999, 110, 1842–1857. [Google Scholar] [CrossRef] [PubMed]
  29. Babiloni, C.; Barry, R.J.; Başar, E.; Blinowska, K.J.; Cichocki, A.; Drinkenburg, W.H.I.M.; Klimesch, W.; Knight, R.T.; Lopes Da Silva, F.; Nunez, P.; et al. International Federation of Clinical Neurophysiology (IFCN) – EEG Research Workgroup: Recommendations on Frequency and Topographic Analysis of Resting State EEG Rhythms. Part 1: Applications in Clinical Research Studies. Clinical Neurophysiology 2020, 131, 285–307. [Google Scholar] [CrossRef] [PubMed]
  30. Serizawa, K.; Kamei, S.; Morita, A.; Hara, M.; Mizutani, T.; Yoshihashi, H.; Yamaguchi, M.; Takeshita, J.; Hirayanagi, K. Comparison of Quantitative EEGs between Parkinson Disease and Age-Adjusted Normal Controls. J Clin Neurophysiol 2008, 25, 361–366. [Google Scholar] [CrossRef]
  31. Bonanni, L.; Thomas, A.; Tiraboschi, P.; Perfetti, B.; Varanese, S.; Onofrj, M. EEG Comparisons in Early Alzheimer’s Disease, Dementia with Lewy Bodies and Parkinson’s Disease with Dementia Patients with a 2-Year Follow-Up. Brain 2008, 131, 690–705. [Google Scholar] [CrossRef]
  32. Kamei, S.; Morita, A.; Serizawa, K.; Mizutani, T.; Hirayanagi, K. Quantitative EEG Analysis of Executive Dysfunction in Parkinson Disease. J Clin Neurophysiol 2010, 27, 193–197. [Google Scholar] [CrossRef]
  33. Pugnetti, L.; Baglio, F.; Farina, E.; Alberoni, M.; Calabrese, E.; Gambini, A.; Di Bella, E.; Garegnani, M.; Deleonardis, L.; Nemni, R. EEG Evidence of Posterior Cortical Disconnection in PD and Related Dementias. Int J Neurosci 2010, 120, 88–98. [Google Scholar] [CrossRef] [PubMed]
  34. Babiloni, C.; Del Percio, C.; Lizio, R.; Noce, G.; Cordone, S.; Lopez, S.; Soricelli, A.; Ferri, R.; Pascarelli, M.T.; Nobili, F.; et al. Abnormalities of Cortical Neural Synchronization Mechanisms in Subjects with Mild Cognitive Impairment Due to Alzheimer’s and Parkinson’s Diseases: An EEG Study. JAD 2017, 59, 339–358. [Google Scholar] [CrossRef] [PubMed]
  35. Babiloni, C.; Del Percio, C.; Lizio, R.; Noce, G.; Cordone, S.; Lopez, S.; Soricelli, A.; Ferri, R.; Pascarelli, M.T.; Nobili, F.; et al. Abnormalities of Cortical Neural Synchronization Mechanisms in Patients with Dementia Due to Alzheimer’s and Lewy Body Diseases: An EEG Study. Neurobiology of Aging 2017, 55, 143–158. [Google Scholar] [CrossRef] [PubMed]
  36. Babiloni, C.; Blinowska, K.; Bonanni, L.; Cichocki, A.; De Haan, W.; Del Percio, C.; Dubois, B.; Escudero, J.; Fernández, A.; Frisoni, G.; et al. What Electrophysiology Tells Us about Alzheimer’s Disease: A Window into the Synchronization and Connectivity of Brain Neurons. Neurobiology of Aging 2020, 85, 58–73. [Google Scholar] [CrossRef] [PubMed]
  37. Babiloni, C.; Del Percio, C.; Lizio, R.; Noce, G.; Lopez, S.; Soricelli, A.; Ferri, R.; Pascarelli, M.T.; Catania, V.; Nobili, F.; et al. Levodopa May Affect Cortical Excitability in Parkinson’s Disease Patients with Cognitive Deficits as Revealed by Reduced Activity of Cortical Sources of Resting State Electroencephalographic Rhythms. Neurobiology of Aging 2019, 73, 9–20. [Google Scholar] [CrossRef] [PubMed]
  38. Styliadis, C.; Kartsidis, P.; Paraskevopoulos, E.; Ioannides, A.A.; Bamidis, P.D. Neuroplastic Effects of Combined Computerized Physical and Cognitive Training in Elderly Individuals at Risk for Dementia: An eLORETA Controlled Study on Resting States. Neural Plast 2015, 2015, 172192. [Google Scholar] [CrossRef] [PubMed]
  39. Trenado, C.; Trauberg, P.; Elben, S.; Dimenshteyn, K.; Folkerts, A.-K.; Witt, K.; Weiss, D.; Liepelt-Scarfone, I.; Kalbe, E.; Wojtecki, L. Resting State EEG as Biomarker of Cognitive Training and Physical Activity’s Joint Effect in Parkinson’s Patients with Mild Cognitive Impairment. Neurol Res Pract 2023, 5, 46. [Google Scholar] [CrossRef] [PubMed]
  40. Gelb, D.J.; Oliver, E.; Gilman, S. Diagnostic Criteria for Parkinson Disease. Arch Neurol 1999, 56, 33–39. [Google Scholar] [CrossRef] [PubMed]
  41. Hoehn, M.M.; Yahr, M.D. Parkinsonism: Onset, Progression, and Mortality. Neurology 1967, 17, 427–427. [Google Scholar] [CrossRef]
  42. Fahn; Elton The Unified Parkinson’s Disease Rating Scale (UPDRS): Status and Recommendations. Movement Disorders 2003, 18, 738–750. [CrossRef]
  43. Geser, F.; Wenning, G.K.; Poewe, W.; McKeith, I. How to Diagnose Dementia with Lewy Bodies: State of the Art. Mov Disord. 2005, 20, S11–S20. [Google Scholar] [CrossRef] [PubMed]
  44. McKeith, I.G.; Galasko, D.; Kosaka, K.; Perry, E.K.; Dickson, D.W.; Hansen, L.A.; Salmon, D.P.; Lowe, J.; Mirra, S.S.; Byrne, E.J.; et al. Consensus Guidelines for the Clinical and Pathologic Diagnosis of Dementia with Lewy Bodies (DLB): Report of the Consortium on DLB International Workshop. Neurology 1996, 47, 1113–1124. [Google Scholar] [CrossRef]
  45. McKeith, I.G.; Boeve, B.F.; Dickson, D.W.; Halliday, G.; Taylor, J.-P.; Weintraub, D.; Aarsland, D.; Galvin, J.; Attems, J.; Ballard, C.G.; et al. Diagnosis and Management of Dementia with Lewy Bodies: Fourth Consensus Report of the DLB Consortium. Neurology 2017, 89, 88–100. [Google Scholar] [CrossRef]
  46. Albert, M.S. Changes in Cognition. Neurobiology of Aging 2011, 32, S58–S63. [Google Scholar] [CrossRef]
  47. Folstein, M.F.; Folstein, S.E.; McHugh, P.R. “Mini-Mental State”. A Practical Method for Grading the Cognitive State of Patients for the Clinician. J Psychiatr Res 1975, 12, 189–198. [Google Scholar] [CrossRef] [PubMed]
  48. Nasreddine, Z.S.; Phillips, N.A.; Bédirian, V.; Charbonneau, S.; Whitehead, V.; Collin, I.; Cummings, J.L.; Chertkow, H. The Montreal Cognitive Assessment, MoCA: A Brief Screening Tool for Mild Cognitive Impairment. J Am Geriatr Soc 2005, 53, 695–699. [Google Scholar] [CrossRef]
  49. Novelli, G.; Papagno, C.; Capitani, E.; Laiacona, M. Tre Test Clinici Di Ricerca e Produzione Lessicale. Taratura Su Sogetti Normali. Archivio di psicologia, neurologia e psichiatria, 1986.
  50. Osterrieth, P.A. Le Test de Copie d’une Figure Complexe; Contribution à l’étude de La Perception et de La Mémoire. [Test of Copying a Complex Figure; Contribution to the Study of Perception and Memory.]. Archives de Psychologie 1944, 30, 206–356. [Google Scholar]
  51. Benton, A.L. Visuospatial Judgment: A Clinical Test. Arch Neurol 1978, 35, 364. [Google Scholar] [CrossRef]
  52. Benton, A.; Hamsher, K.; Varney, N.; Spreen, O. Contribution to Neuropsychological Assessment, A Clinical Manual.; Oxford University Press, New York, 1983;
  53. Stroop, J.R. Studies of Interference in Serial Verbal Reactions. Journal of Experimental Psychology 1935, 18, 643–662. [Google Scholar] [CrossRef]
  54. Reitan, R.M. VALIDITY OF THE TRAIL MAKING TEST AS AN INDICATOR OF ORGANIC BRAIN DAMAGE. PMS 1958, 8, 271. [Google Scholar] [CrossRef]
  55. Inouye, S.K. Clarifying Confusion: The Confusion Assessment Method: A New Method for Detection of Delirium. Ann Intern Med 1990, 113, 941. [Google Scholar] [CrossRef]
  56. Dubois, B.; Slachevsky, A.; Litvan, I.; Pillon, B. The FAB: A Frontal Assessment Battery at Bedside. Neurology 2000, 55, 1621–1626. [Google Scholar] [CrossRef] [PubMed]
  57. Caffarra, P.; Gardini, S.; Zonato, F.; Concari, L.; Dieci, F.; Copelli, S.; Freedman, M.; Stracciari, A.; Venneri, A. Italian Norms for the Freedman Version of the Clock Drawing Test. Journal of Clinical and Experimental Neuropsychology 2011, 33, 982–988. [Google Scholar] [CrossRef] [PubMed]
  58. Wechsler, D. WMS-R: Wechsler Memory Scale-Revised: Manual.; Psychological Corporation, 1987;
  59. Oktem, O. A Verbal Test of Memory Processes: A Preliminary Study. Archives of Neuropsychiatry 1992, 29, 196–206. [Google Scholar]
  60. Delorme, A.; Makeig, S. EEGLAB: An Open Source Toolbox for Analysis of Single-Trial EEG Dynamics Including Independent Component Analysis. J Neurosci Methods 2004, 134, 9–21. [Google Scholar] [CrossRef]
  61. Crespo-Garcia, M.; Atienza, M.; Cantero, J.L. Muscle Artifact Removal from Human Sleep EEG by Using Independent Component Analysis. Ann Biomed Eng 2008, 36, 467–475. [Google Scholar] [CrossRef]
  62. Jung, T.P.; Makeig, S.; Humphries, C.; Lee, T.W.; McKeown, M.J.; Iragui, V.; Sejnowski, T.J. Removing Electroencephalographic Artifacts by Blind Source Separation. Psychophysiology 2000, 37, 163–178. [Google Scholar] [CrossRef] [PubMed]
  63. Klimesch, W.; Doppelmayr, M.; Schimke, H.; Pachinger, T. Alpha Frequency, Reaction Time, and the Speed of Processing Information. J Clin Neurophysiol 1996, 13, 511–518. [Google Scholar] [CrossRef] [PubMed]
  64. Klimesch, W.; Doppelmayr, M.; Russegger, H.; Pachinger, T.; Schwaiger, J. Induced Alpha Band Power Changes in the Human EEG and Attention. Neurosci Lett 1998, 244, 73–76. [Google Scholar] [CrossRef]
  65. Klimesch, W. EEG Alpha and Theta Oscillations Reflect Cognitive and Memory Performance: A Review and Analysis. Brain Research Reviews 1999, 29, 169–195. [Google Scholar] [CrossRef]
  66. Pascual-Marqui, R.D.; Esslen, M.; Kochi, K.; Lehmann, D. Functional Imaging with Low-Resolution Brain Electromagnetic Tomography (LORETA): A Review. Methods Find Exp Clin Pharmacol 2002, 24 Suppl C, 91–95. [Google Scholar]
  67. Pascual-Marqui, R.D. Discrete, 3D Distributed, Linear Imaging Methods of Electric Neuronal Activity. Part 1: Exact, Zero Error Localization 2007.
  68. Leung, I.H.K.; Walton, C.C.; Hallock, H.; Lewis, S.J.G.; Valenzuela, M.; Lampit, A. Cognitive Training in Parkinson Disease: A Systematic Review and Meta-Analysis. Neurology 2015, 85, 1843–1851. [Google Scholar] [CrossRef] [PubMed]
  69. Aarsland, D.; Creese, B.; Politis, M.; Chaudhuri, K.R.; Ffytche, D.H.; Weintraub, D.; Ballard, C. Cognitive Decline in Parkinson Disease. Nat Rev Neurol 2017, 13, 217–231. [Google Scholar] [CrossRef] [PubMed]
  70. Van Balkom, T.D.; Van Den Heuvel, O.A.; Berendse, H.W.; Van Der Werf, Y.D.; Vriend, C. The Effects of Cognitive Training on Brain Network Activity and Connectivity in Aging and Neurodegenerative Diseases: A Systematic Review. Neuropsychol Rev 2020, 30, 267–286. [Google Scholar] [CrossRef] [PubMed]
  71. Kai, T.; Asai, Y.; Sakuma, K.; Koeda, T.; Nakashima, K. Quantitative Electroencephalogram Analysis in Dementia with Lewy Bodies and Alzheimer’s Disease. J Neurol Sci 2005, 237, 89–95. [Google Scholar] [CrossRef]
  72. Andersson, M.; Hansson, O.; Minthon, L.; Rosén, I.; Londos, E. Electroencephalogram Variability in Dementia with Lewy Bodies, Alzheimer’s Disease and Controls. Dement Geriatr Cogn Disord 2008, 26, 284–290. [Google Scholar] [CrossRef]
  73. Caviness, J.N.; Hentz, J.G.; Belden, C.M.; Shill, H.A.; Driver-Dunckley, E.D.; Sabbagh, M.N.; Powell, J.J.; Adler, C.H. Longitudinal EEG Changes Correlate with Cognitive Measure Deterioration in Parkinson’s Disease. J Parkinsons Dis 2015, 5, 117–124. [Google Scholar] [CrossRef]
  74. Schumacher, J.; Thomas, A.J.; Peraza, L.R.; Firbank, M.; Cromarty, R.; Hamilton, C.A.; Donaghy, P.C.; O’Brien, J.T.; Taylor, J.-P. EEG Alpha Reactivity and Cholinergic System Integrity in Lewy Body Dementia and Alzheimer’s Disease. Alzheimers Res Ther 2020, 12, 46. [Google Scholar] [CrossRef] [PubMed]
  75. Caviness, J.N.; Lue, L.-F.; Hentz, J.G.; Schmitz, C.T.; Adler, C.H.; Shill, H.A.; Sabbagh, M.N.; Beach, T.G.; Walker, D.G. Cortical Phosphorylated α-Synuclein Levels Correlate with Brain Wave Spectra in Parkinson’s Disease. Mov Disord 2016, 31, 1012–1019. [Google Scholar] [CrossRef]
  76. Caviness, J.N.; Beach, T.G.; Hentz, J.G.; Shill, H.A.; Driver-Dunckley, E.D.; Adler, C.H. Association Between Pathology and Electroencephalographic Activity in Parkinson’s Disease. Clin EEG Neurosci 2018, 49, 321–327. [Google Scholar] [CrossRef]
  77. Jeanmonod, D.; Magnin, M.; Morel, A. Low-Threshold Calcium Spike Bursts in the Human Thalamus. Common Physiopathology for Sensory, Motor and Limbic Positive Symptoms. Brain, 1996, 119 ( Pt 2), 363–375. [CrossRef]
  78. Llinás, R.R.; Steriade, M. Bursting of Thalamic Neurons and States of Vigilance. Journal of Neurophysiology 2006, 95, 3297–3308. [Google Scholar] [CrossRef] [PubMed]
  79. Sarnthein, J.; Jeanmonod, D. High Thalamocortical Theta Coherence in Patients with Parkinson’s Disease. J Neurosci 2007, 27, 124–131. [Google Scholar] [CrossRef] [PubMed]
  80. Bareš, M.; Kaňovský, P.; Klajblová, H.; Rektor, I. Intracortical Inhibition and Facilitation Are Impaired in Patients with Early Parkinson’s Disease: A Paired TMS Study. Euro J of Neurology 2003, 10, 385–389. [Google Scholar] [CrossRef] [PubMed]
  81. MacKinnon, C.D.; Gilley, E.A.; Weis-McNulty, A.; Simuni, T. Pathways Mediating Abnormal Intracortical Inhibition in Parkinson’s Disease. Ann Neurol 2005, 58, 516–524. [Google Scholar] [CrossRef] [PubMed]
  82. Kamble, N.; Bhattacharya, A.; Hegde, S.; Vidya, N.; Gothwal, M.; Yadav, R.; Pal, P.K. Cortical Excitability Changes as a Marker of Cognitive Impairment in Parkinson’s Disease. Behav Brain Res 2022, 422, 113733. [Google Scholar] [CrossRef] [PubMed]
  83. Zhang, Y.; Llinas, R.R.; Lisman, J.E. Inhibition of NMDARs in the Nucleus Reticularis of the Thalamus Produces Delta Frequency Bursting. Front Neural Circuits 2009, 3, 20. [Google Scholar] [CrossRef] [PubMed]
  84. Vriend, C.; Van Balkom, T.D.; Berendse, H.W.; Van Der Werf, Y.D.; Van Den Heuvel, O.A. Cognitive Training in Parkinson’s Disease Induces Local, Not Global, Changes in White Matter Microstructure. Neurotherapeutics 2021, 18, 2518–2528. [Google Scholar] [CrossRef]
  85. Haghshomar, M.; Dolatshahi, M.; Ghazi Sherbaf, F.; Sanjari Moghaddam, H.; Shirin Shandiz, M.; Aarabi, M.H. Disruption of Inferior Longitudinal Fasciculus Microstructure in Parkinson’s Disease: A Systematic Review of Diffusion Tensor Imaging Studies. Front. Neurol. 2018, 9, 598. [Google Scholar] [CrossRef] [PubMed]
  86. Gorges, M.; Müller, H.-P.; Liepelt-Scarfone, I.; Storch, A.; Dodel, R.; LANDSCAPE Consortium; Hilker-Roggendorf, R. ; Berg, D.; Kunz, M.S.; Kalbe, E.; et al. Structural Brain Signature of Cognitive Decline in Parkinson’s Disease: DTI-Based Evidence from the LANDSCAPE Study. Ther Adv Neurol Disord 2019, 12, 1756286419843447. [Google Scholar] [CrossRef]
  87. Van Balkom, T.D.; Van Den Heuvel, O.A.; Berendse, H.W.; Van Der Werf, Y.D.; Vriend, C. Eight-Week Multi-Domain Cognitive Training Does Not Impact Large-Scale Resting-State Brain Networks in Parkinson’s Disease. NeuroImage: Clinical 2022, 33, 102952. [Google Scholar] [CrossRef]
  88. Owen, A.M. Cognitive Dysfunction in Parkinson’s Disease: The Role of Frontostriatal Circuitry. Neuroscientist 2004, 10, 525–537. [Google Scholar] [CrossRef] [PubMed]
  89. Peters, S.K.; Dunlop, K.; Downar, J. Cortico-Striatal-Thalamic Loop Circuits of the Salience Network: A Central Pathway in Psychiatric Disease and Treatment. Front Syst Neurosci 2016, 10, 104. [Google Scholar] [CrossRef] [PubMed]
  90. Saalmann, Y.B. Intralaminar and Medial Thalamic Influence on Cortical Synchrony, Information Transmission and Cognition. Front. Syst. Neurosci. 2014, 8. [Google Scholar] [CrossRef]
  91. Wang, L.; Zhou, C.; Cheng, W.; Rolls, E.T.; Huang, P.; Ma, N.; Liu, Y.; Zhang, Y.; Guan, X.; Guo, T.; et al. Dopamine Depletion and Subcortical Dysfunction Disrupt Cortical Synchronization and Metastability Affecting Cognitive Function in Parkinson’s Disease. Hum Brain Mapp 2022, 43, 1598–1610. [Google Scholar] [CrossRef] [PubMed]
  92. Shine, J.M.; Bissett, P.G.; Bell, P.T.; Koyejo, O.; Balsters, J.H.; Gorgolewski, K.J.; Moodie, C.A.; Poldrack, R.A. The Dynamics of Functional Brain Networks: Integrated Network States during Cognitive Task Performance. Neuron 2016, 92, 544–554. [Google Scholar] [CrossRef] [PubMed]
  93. Kim, J.; Criaud, M.; Cho, S.S.; Díez-Cirarda, M.; Mihaescu, A.; Coakeley, S.; Ghadery, C.; Valli, M.; Jacobs, M.F.; Houle, S.; et al. Abnormal Intrinsic Brain Functional Network Dynamics in Parkinson’s Disease. Brain 2017, 140, 2955–2967. [Google Scholar] [CrossRef] [PubMed]
  94. Fiorenzato, E.; Strafella, A.P.; Kim, J.; Schifano, R.; Weis, L.; Antonini, A.; Biundo, R. Dynamic Functional Connectivity Changes Associated with Dementia in Parkinson’s Disease. Brain 2019, 142, 2860–2872. [Google Scholar] [CrossRef] [PubMed]
  95. Hirano, S.; Shinotoh, H.; Eidelberg, D. Functional Brain Imaging of Cognitive Dysfunction in Parkinson’s Disease. J Neurol Neurosurg Psychiatry 2012, 83, 963–969. [Google Scholar] [CrossRef]
  96. Bohnen, N.I.; Albin, R.L.; Müller, M.L.T.M.; Petrou, M.; Kotagal, V.; Koeppe, R.A.; Scott, P.J.H.; Frey, K.A. Frequency of Cholinergic and Caudate Nucleus Dopaminergic Deficits Across the Predemented Cognitive Spectrum of Parkinson Disease and Evidence of Interaction Effects. JAMA Neurol 2015, 72, 194. [Google Scholar] [CrossRef]
  97. Hirano, S. Clinical Implications for Dopaminergic and Functional Neuroimage Research in Cognitive Symptoms of Parkinson’s Disease. Mol Med 2021, 27, 40. [Google Scholar] [CrossRef]
  98. Calabresi, P.; Picconi, B.; Parnetti, L.; Di Filippo, M. A Convergent Model for Cognitive Dysfunctions in Parkinson’s Disease: The Critical Dopamine–Acetylcholine Synaptic Balance. The Lancet Neurology 2006, 5, 974–983. [Google Scholar] [CrossRef] [PubMed]
  99. Bédard, M.A.; el Massioui, F.; Malapani, C.; Dubois, B.; Pillon, B.; Renault, B.; Agid, Y. Attentional Deficits in Parkinson’s Disease: Partial Reversibility with Naphtoxazine (SDZ NVI-085), a Selective Noradrenergic Alpha 1 Agonist. Clin Neuropharmacol 1998, 21, 108–117. [Google Scholar] [PubMed]
  100. Riekkinen, M.; Kejonen, K.; Jäkälä, P.; Soininen, H.; Riekkinen, P. Reduction of Noradrenaline Impairs Attention and Dopamine Depletion Slows Responses in Parkinson’s Disease. Eur J Neurosci 1998, 10, 1429–1435. [Google Scholar] [CrossRef] [PubMed]
  101. Liu, Q.; Ganzetti, M.; Wenderoth, N.; Mantini, D. Detecting Large-Scale Brain Networks Using EEG: Impact of Electrode Density, Head Modeling and Source Localization. Front. Neuroinform. 2018, 12, 4. [Google Scholar] [CrossRef] [PubMed]
  102. Marino, M.; Liu, Q.; Brem, S.; Wenderoth, N.; Mantini, D. Automated Detection and Labeling of High-Density EEG Electrodes from Structural MR Images. J Neural Eng 2016, 13, 056003. [Google Scholar] [CrossRef]
  103. Michel, C.M.; Brunet, D. EEG Source Imaging: A Practical Review of the Analysis Steps. Front Neurol 2019, 10, 325. [Google Scholar] [CrossRef]
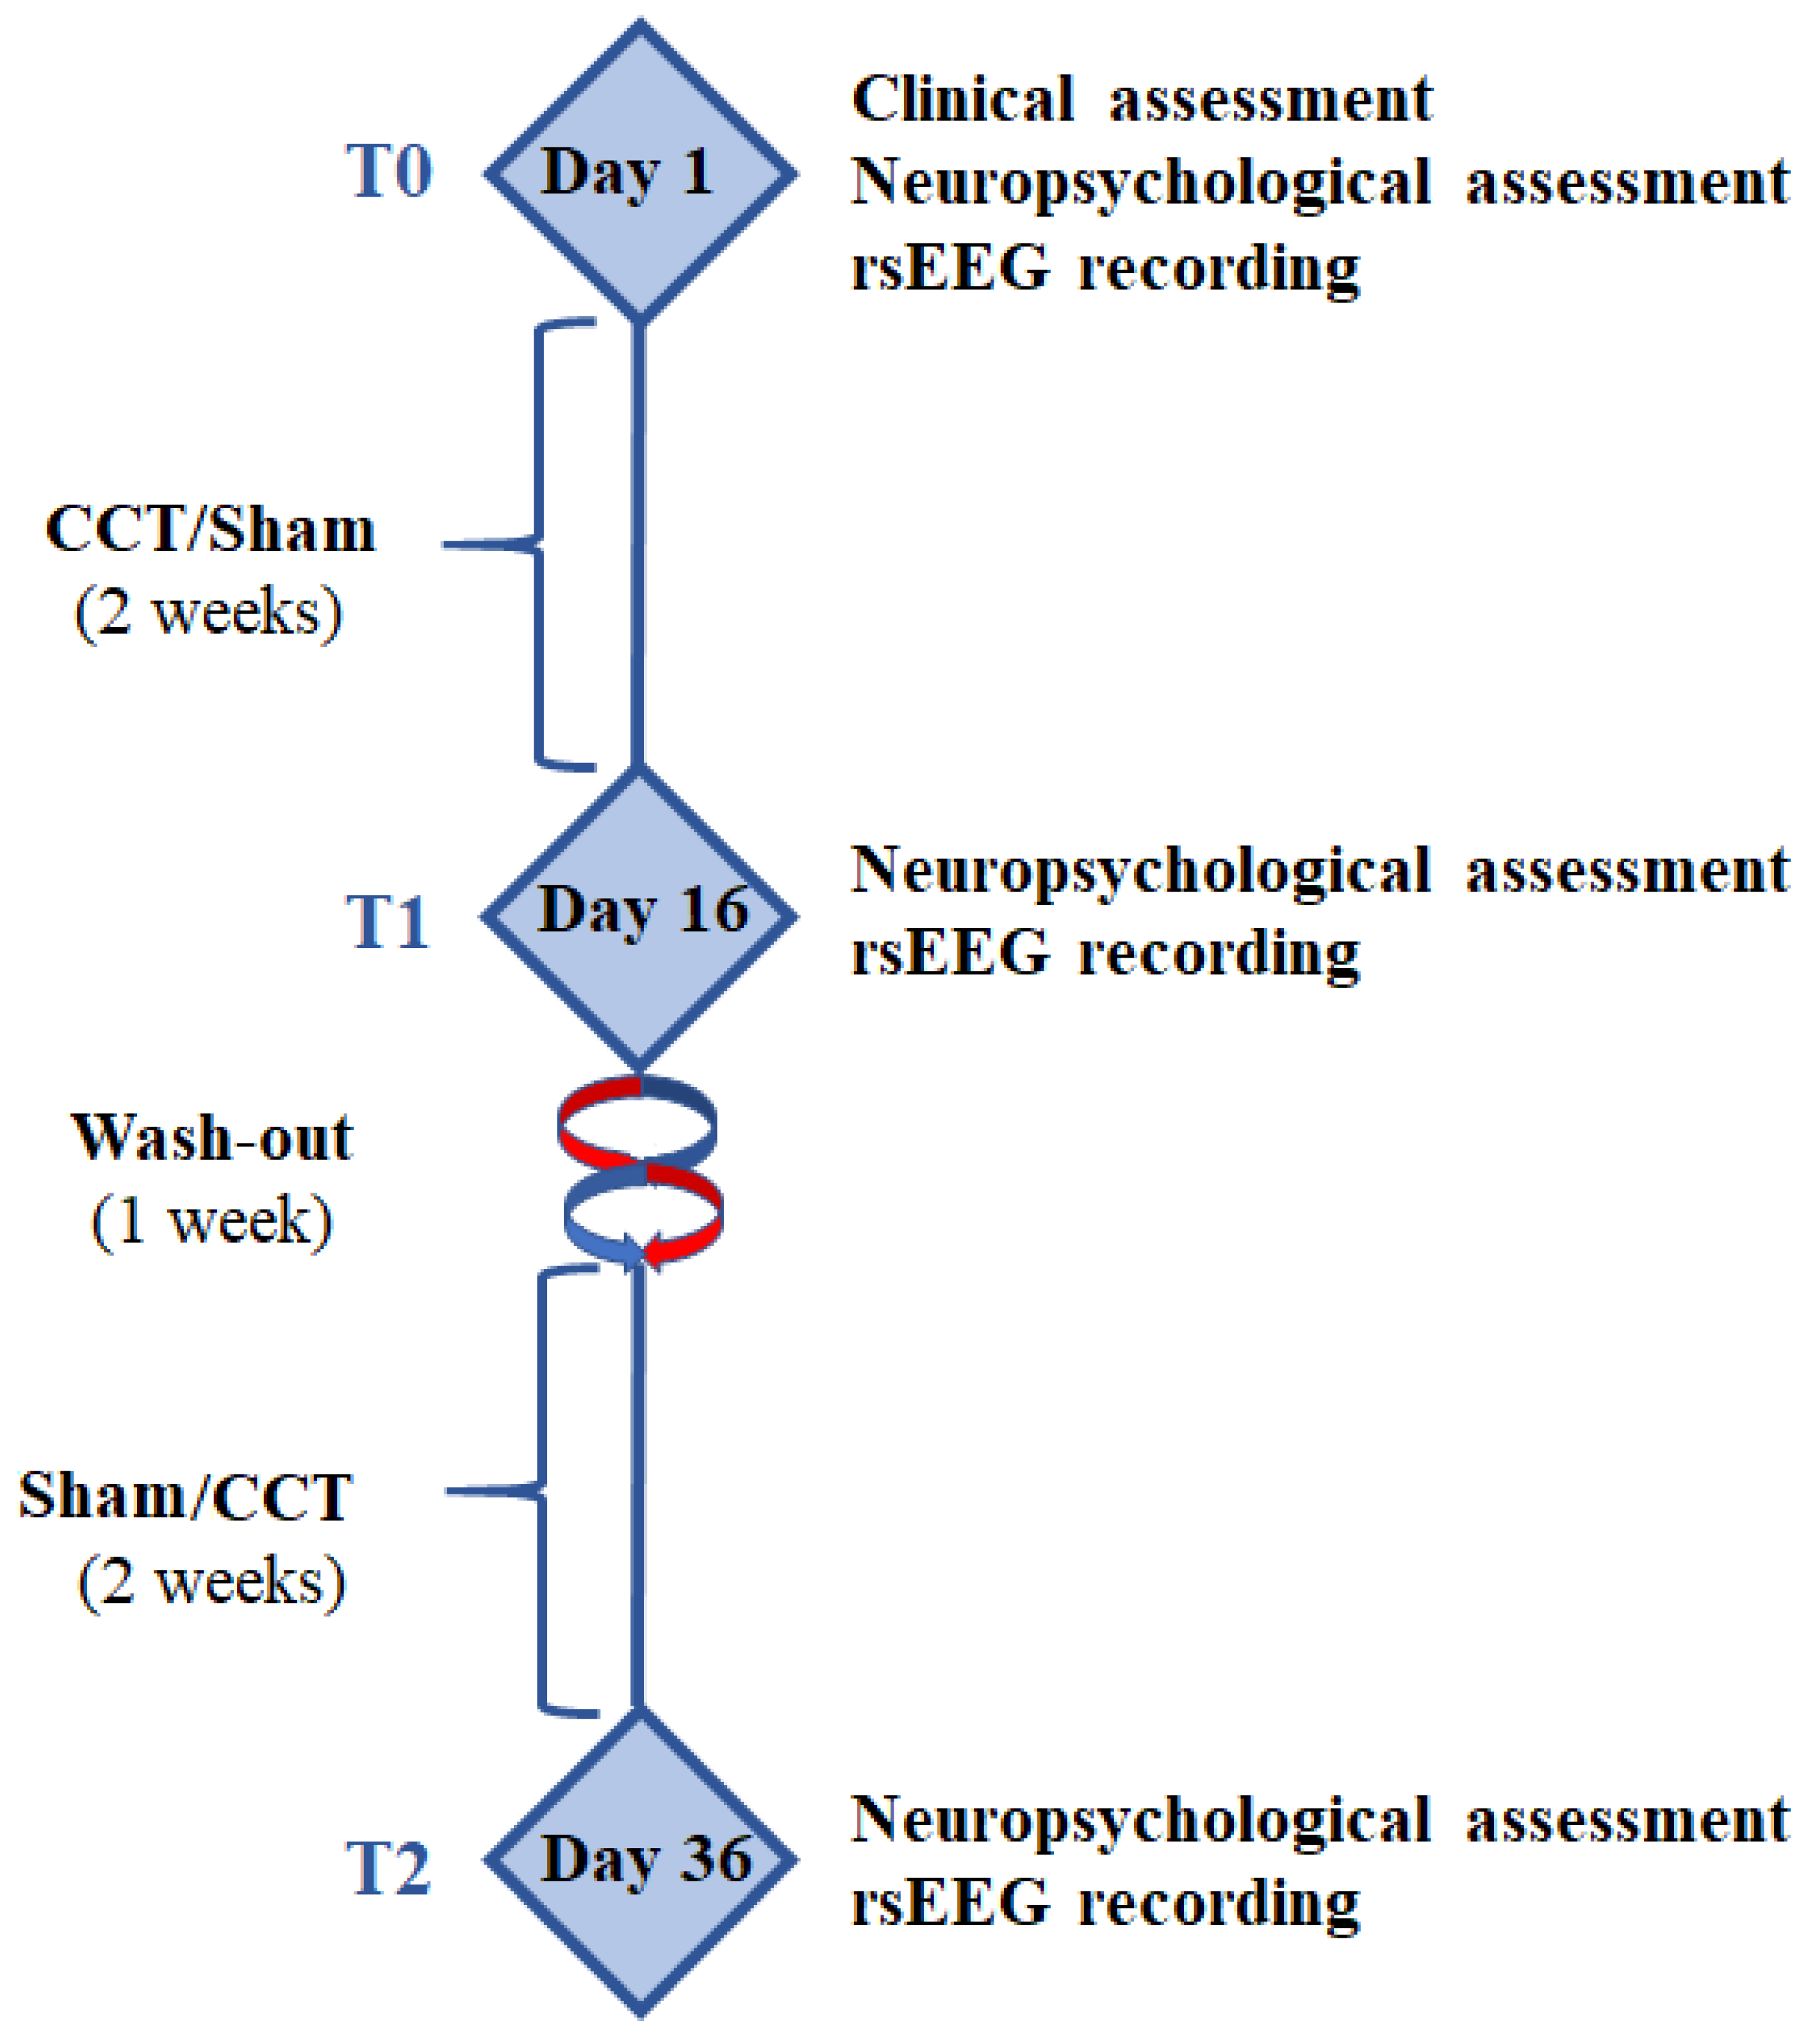
Figure 1. Experimental paradigm of the present study. In Parkinson's disease patients with cognitive deficits (PDCD, N = 16), the clinical assessment was done at the baseline (T0); the neuropsychological assessment and resting state electroencephalographic (rsEEG) recordings were performed at the baseline (T0), after 2 weeks of the Sham program (Sham; T1 or T2), and after 2 weeks of the computerized cognitive training (CCT) program (T1 or T2). The order of the Sham and CCT programs was pseudorandom. A washout period (1 week) was used between the two programs (i.e., CCT and Sham).
Preprints 103768 g001
Figure 2. Mean values (± standard error of the mean, SE; log 10 transformed) of the exact Low-Resolution Brain Electromagnetic Source Tomography (eLORETA) source activities from resting-state eyes-closed electroencephalographic (rsEEG) rhythms in the groups of cognitively normal older adults (Healthy, N = 40), Parkinson's disease patients without cognitive deficits (PDNCD, N =29), Alzheimer's disease patients with cognitive deficits (ADCD, N = 40), and Parkinson's disease patients with cognitive deficits (PDCD, N =40). These values refer to a statistical ANOVA interaction effect (F = 25.3; p < 0.0001) between the factors Group (Health, PDNC, ADCD, and PDCD) and Band (delta, theta, alpha, beta, and gamma). The rectangles indicate the frequency bands in which the rsEEG (eLORETA) source activities statistically presented a significant pattern PDCD > Healthy, PDNCD, and ADCD (i.e., p < 0.05 Bonferroni corrected).
Preprints 103768 g002
Figure 3. Mean values (± SE; log 10 transformed) of the rsEEG (eLORETA) source activities relative to a statistical ANOVA interaction effect (F = 10.6; p < 0.0001) among the factors Group (Healthy, PDNCD, ADCD, and PDCD), Band (delta, theta, alpha, beta, and gamma), and Region of Interest (ROI; frontal, central, parietal, occipital, and temporal). The rectangles indicate the frequency bands and cortical regions in which the rsEEG (eLORETA) source activities statistically presented a significant pattern PDCD > Healthy, PDNCD, and ADCD (i.e., p < 0.05 Bonferroni corrected). Abbreviations: rsEEG = resting state electroencephalographic; eLORETA = exact Low-Resolution Brain Electromagnetic Source Tomography; Healthy = cognitively normal older adults; PDNCD = Parkinson's disease patients without cognitive deficits; ADCD = Alzheimer’s disease patients with cognitive deficits; PDCD = Parkinson's disease patients with cognitive deficits.
Preprints 103768 g003
Figure 4. Mean values (± SE; log 10 transformed) of the rsEEG (eLORETA) source activities relative to a statistical ANOVA interaction effect (F = 2.2; p < 0.05) between the factors Group (Baseline, Sham, and CCT) and Band (delta, theta, alpha, beta, and gamma) in the Parkinson's disease patients with cognitive deficits (PDCD, N = 16) enrolled in the cross-over study on the effects of a 2-week computerized cognitive training (CCT) program in home video monitoring as compared to 2 weeks of a Sham program.
Preprints 103768 g004
Figure 5. Individual values (log 10 transformed) of the rsEEG (eLORETA) source activities showing statistically significant (p < 0.05 corrected) differences among Baseline, Sham, and CCT conditions in the Parkinson's disease patients with cognitive deficits (PDCD, N = 16). Abbreviations: Sham: after two weeks of the Sham program; CCT = after two weeks of the computerized cognitive training program; eLORETA = exact Low-Resolution Brain Electromagnetic Source Tomography; rsEEG = resting-state electroencephalographic.
Preprints 103768 g005
Table 1. Mean values (± standard error of the mean, SE) of the demographic and clinical data as well as the results of their statistical comparisons (p < 0.05) in the groups of cognitively normal older adults (Healthy, N = 40), Parkinson's disease patients without cognitive deficits (PDNCD, N =29), Alzheimer's disease patients with cognitive deficits (ADCD, N = 40), and Parkinson's disease patients with cognitive deficits (PDCD, N =40). Legend: M/F = males/females; n.s. = not significant (p > 0.05); MMSE = Mini-Mental State Evaluation.
Mean values (± SE) of demographic and global cognitive status (MMSE) data
Healthy PDNCD ADCD PDCD Statistical analysis
N 40 29 40 40 -
Age (years) 70.0 (± 1.1 SE) 70.4 (± 1.3 SE) 71.7 (± 1.0 SE) 71.6 (± 0.9 SE) ANOVA: n.s.
Sex (M/F) 20/20 15/14 21/19 20/20 Freeman-Halton test: n.s.
Education (years) 10.6(± 0.7 SE) 9.1 (± 0.3 SE) 9.0(± 0.6 SE) 9.5 (± 0.6 SE) ANOVA: n.s.
MMSE score 28.1 ±(0.2 SE) 28.0 ±(0.3 SE) 21.0 (±0.7 SE) 21.2 (± 0.7 SE) Kruskal- Wallis test: p < 0.0001 (Healthy, PDNCD > ADCD, PDCD)
Table 2. Mean values (± SE) of the clinical and neuropsychological data at baseline in the Parkinson's disease patients with cognitive deficits (PDCD, N = 16) enrolled for the clinical study on the 2-week computerized cognitive training (CCT) program in video telemonitoring. For each clinical and neuropsychological data, the cut-off for the pathologic scores and the percentage of the PDCD patients with a pathological score are reported.
Clinical data at Baseline in PDCD patients
Mean (± SE) Pathologic cut-off % Patients with pathologic score
Hoehn and Yahr stage (H & Y) 2.8 (± 0.1 SE) ≥ 4 (range 0-5; 1-3 moderate; 4-5 severe) 100%
Unified Parkinson Disease Rating Scale (UPDRS-III Motor Part) 47.7 (± 4.7 SE) ≥ 59 (range 0-80; 1-32 mild; 33-58 moderate; 59-80 severe) 100%
Activities of daily living (ADL) 1.6 (± 0.3 SE) > 0 (range 0-6; 0 completely autonomous; 6 completely dependent); 87.5%
Instrumental activities of daily living (IADL) 4.1 (± 0.3 SE) > 5 (range 0-8; 0 completely autonomous; 8 completely dependent) 100%
Clinical dementia rating scale(CDR) 0.9 (± 0.1 SE) > 0 (0.5- 1 mild cognitive impairment; 2-3 moderate to severe impairment) 93.8%
Geriatric depression scale(GDS) 17.3 (± 1.0 SE) ≥ 17 (range 0-30; 0-10 depression absent; 11-16 moderate; 17-30 severe) 93.8%
Mini-Mental State Examination (MMSE) 23.7 (± 0.3 SE) < 24 (range 0-30) 56.3%
Montreal Cognitive Assessment (MOCA) 19.4 (± 1.1 SE) < 26 (range 0-30) 93.8%
Digit span 4.8 (± 0.2 SE) < 3.75 (range 0-8) 6.3%
Frontal assessment battery (FAB) 14.3 (± 0.36 SE) < 13.5 (range 0-18) 37.5%
Clock drawing 7.7 (± 0.8 SE) < 6.55 (range 0-33) 37.5%
Verbal fluency for letters 29.0 (± 2.0 SE) < 17 0%
Verbal fluency for categories 36.1 (± 2.3 SE) < 25 18.8%
Rey wordsImmediate recall 32.4 (± 1.7 SE) < 28.53 (range 0-75) 31.3%
Rey wordsdelayed recall 7.2 (± 0.7 SE) < 4.69 (range 0-15) 12.5%
Prose memory 9.1 (± 1.1 SE) < 14.5 (range 0-28) 93.8%
Rey figures Copy 21.7 (±3.0 SE) < 28 (range 0-36) 50%
Rey figuresdelayed recall 11.5 (± 1.4 SE) < 6.2 (range 0-36) 25.0%
Table 3. Mean values (± SE) of the accuracy of the performance (%) and the response time (s) for the seven serious video games of the computerized cognitive training (CCT) program before intervention (Baseline) and after two weeks of it in the Parkinson's disease patients with cognitive deficits (PDCD, N = 16). The results of the statistical comparisons (p < 0.05, Bonferroni corrected) between Baseline and CCT program (Baseline vs CCT) are also reported.
Mean values (± SE) of the performance of serious video games of CCT program in PDCD patients
Task domain Accuracy (%)/Reaction time (ms) Baseline CCT Wilcoxon test
Visual non-spatial reaction time task Accuracy (%) 89.0 (± 4.7 SE) 98.0 (± 1.2 SE) p = 0.05
Reaction time (ms) 1.3 (± 0.1 SE) 1.1 (± 0.1 SE) n.s.
Visuospatial attention task Accuracy (%) 58.0 (± 5.1 SE) 82.7 (± 3.8 SE) p = 0.003
Reaction time (ms) 44.9 (± 1.6 SE) 43.6 (± 2.3 SE) n.s.
Visual non-spatial attention task, (iv) short-term visuospatial task Accuracy (%) 66.0 (± 5.5 SE) 86.3 (± 4.8 SE) p = 0.002
Reaction time (ms) 43.2 (± 1.6 SE) 40.5 (± 2.4 SE) n.s.
Short-term visuospatial task Accuracy (%) 75.0 (± 3.0 SE) 84.0 (± 2.9 SE) p = 0.01
Reaction time (ms) 66.3 (± 3.5 SE) 55.0 (± 4.0 SE) n.s.
short-term visual non-spatial task Accuracy (%) 52.0 (± 4.9 SE) 66.0 (± 6.1 SE) p = 0.05
Reaction time (ms) 50.1 (± 4.9 SE) 41.6 (± 3.8 SE) n.s.
A modified Posner’s task Accuracy (%) 87.6 (± 3.2 SE) 97.9 (± 1.3 SE) p = 0.02
Reaction time (ms) 1.2 (± 0.1 SE) 1.0 (± 0.0 SE) n.s.
A task testing the ability to refrain from impulsive motor responses Accuracy (%) 74.5 (± 8.2 SE) 85.6 (± 7.1 SE) p = 0.01
Reaction time (ms) 197.8 (± 13.9 SE) 152.3 (± 13.9 SE) p = 0.003
Disclaimer/Publisher’s Note: The statements, opinions and data contained in all publications are solely those of the individual author(s) and contributor(s) and not of MDPI and/or the editor(s). MDPI and/or the editor(s) disclaim responsibility for any injury to people or property resulting from any ideas, methods, instructions or products referred to in the content.
Copyright: This open access article is published under a Creative Commons CC BY 4.0 license, which permit the free download, distribution, and reuse, provided that the author and preprint are cited in any reuse.
Prerpints.org logo

Preprints.org is a free preprint server supported by MDPI in Basel, Switzerland.

Subscribe

© 2024 MDPI (Basel, Switzerland) unless otherwise stated