Submitted:
15 April 2024
Posted:
15 April 2024
You are already at the latest version
Abstract
Keywords:
1. Introduction
2. Materials and Methods
2.1. Data and Study Area
2.2. Case Selection
2.2.1. Weather Stations
2.2.2. Heavy Rain
2.3. Cases Validation
2.4. Vertical Structure and Microphysical Processes
2.4.1. Traking
2.4.2. VIL and VII
2.4.3. CFADs
2.5. Case Studies
3. Results and Discussion
3.1. Events
3.2. Regional Categorization
3.3. VIL and VII
3.4. CFADs
3.5. Case Studies
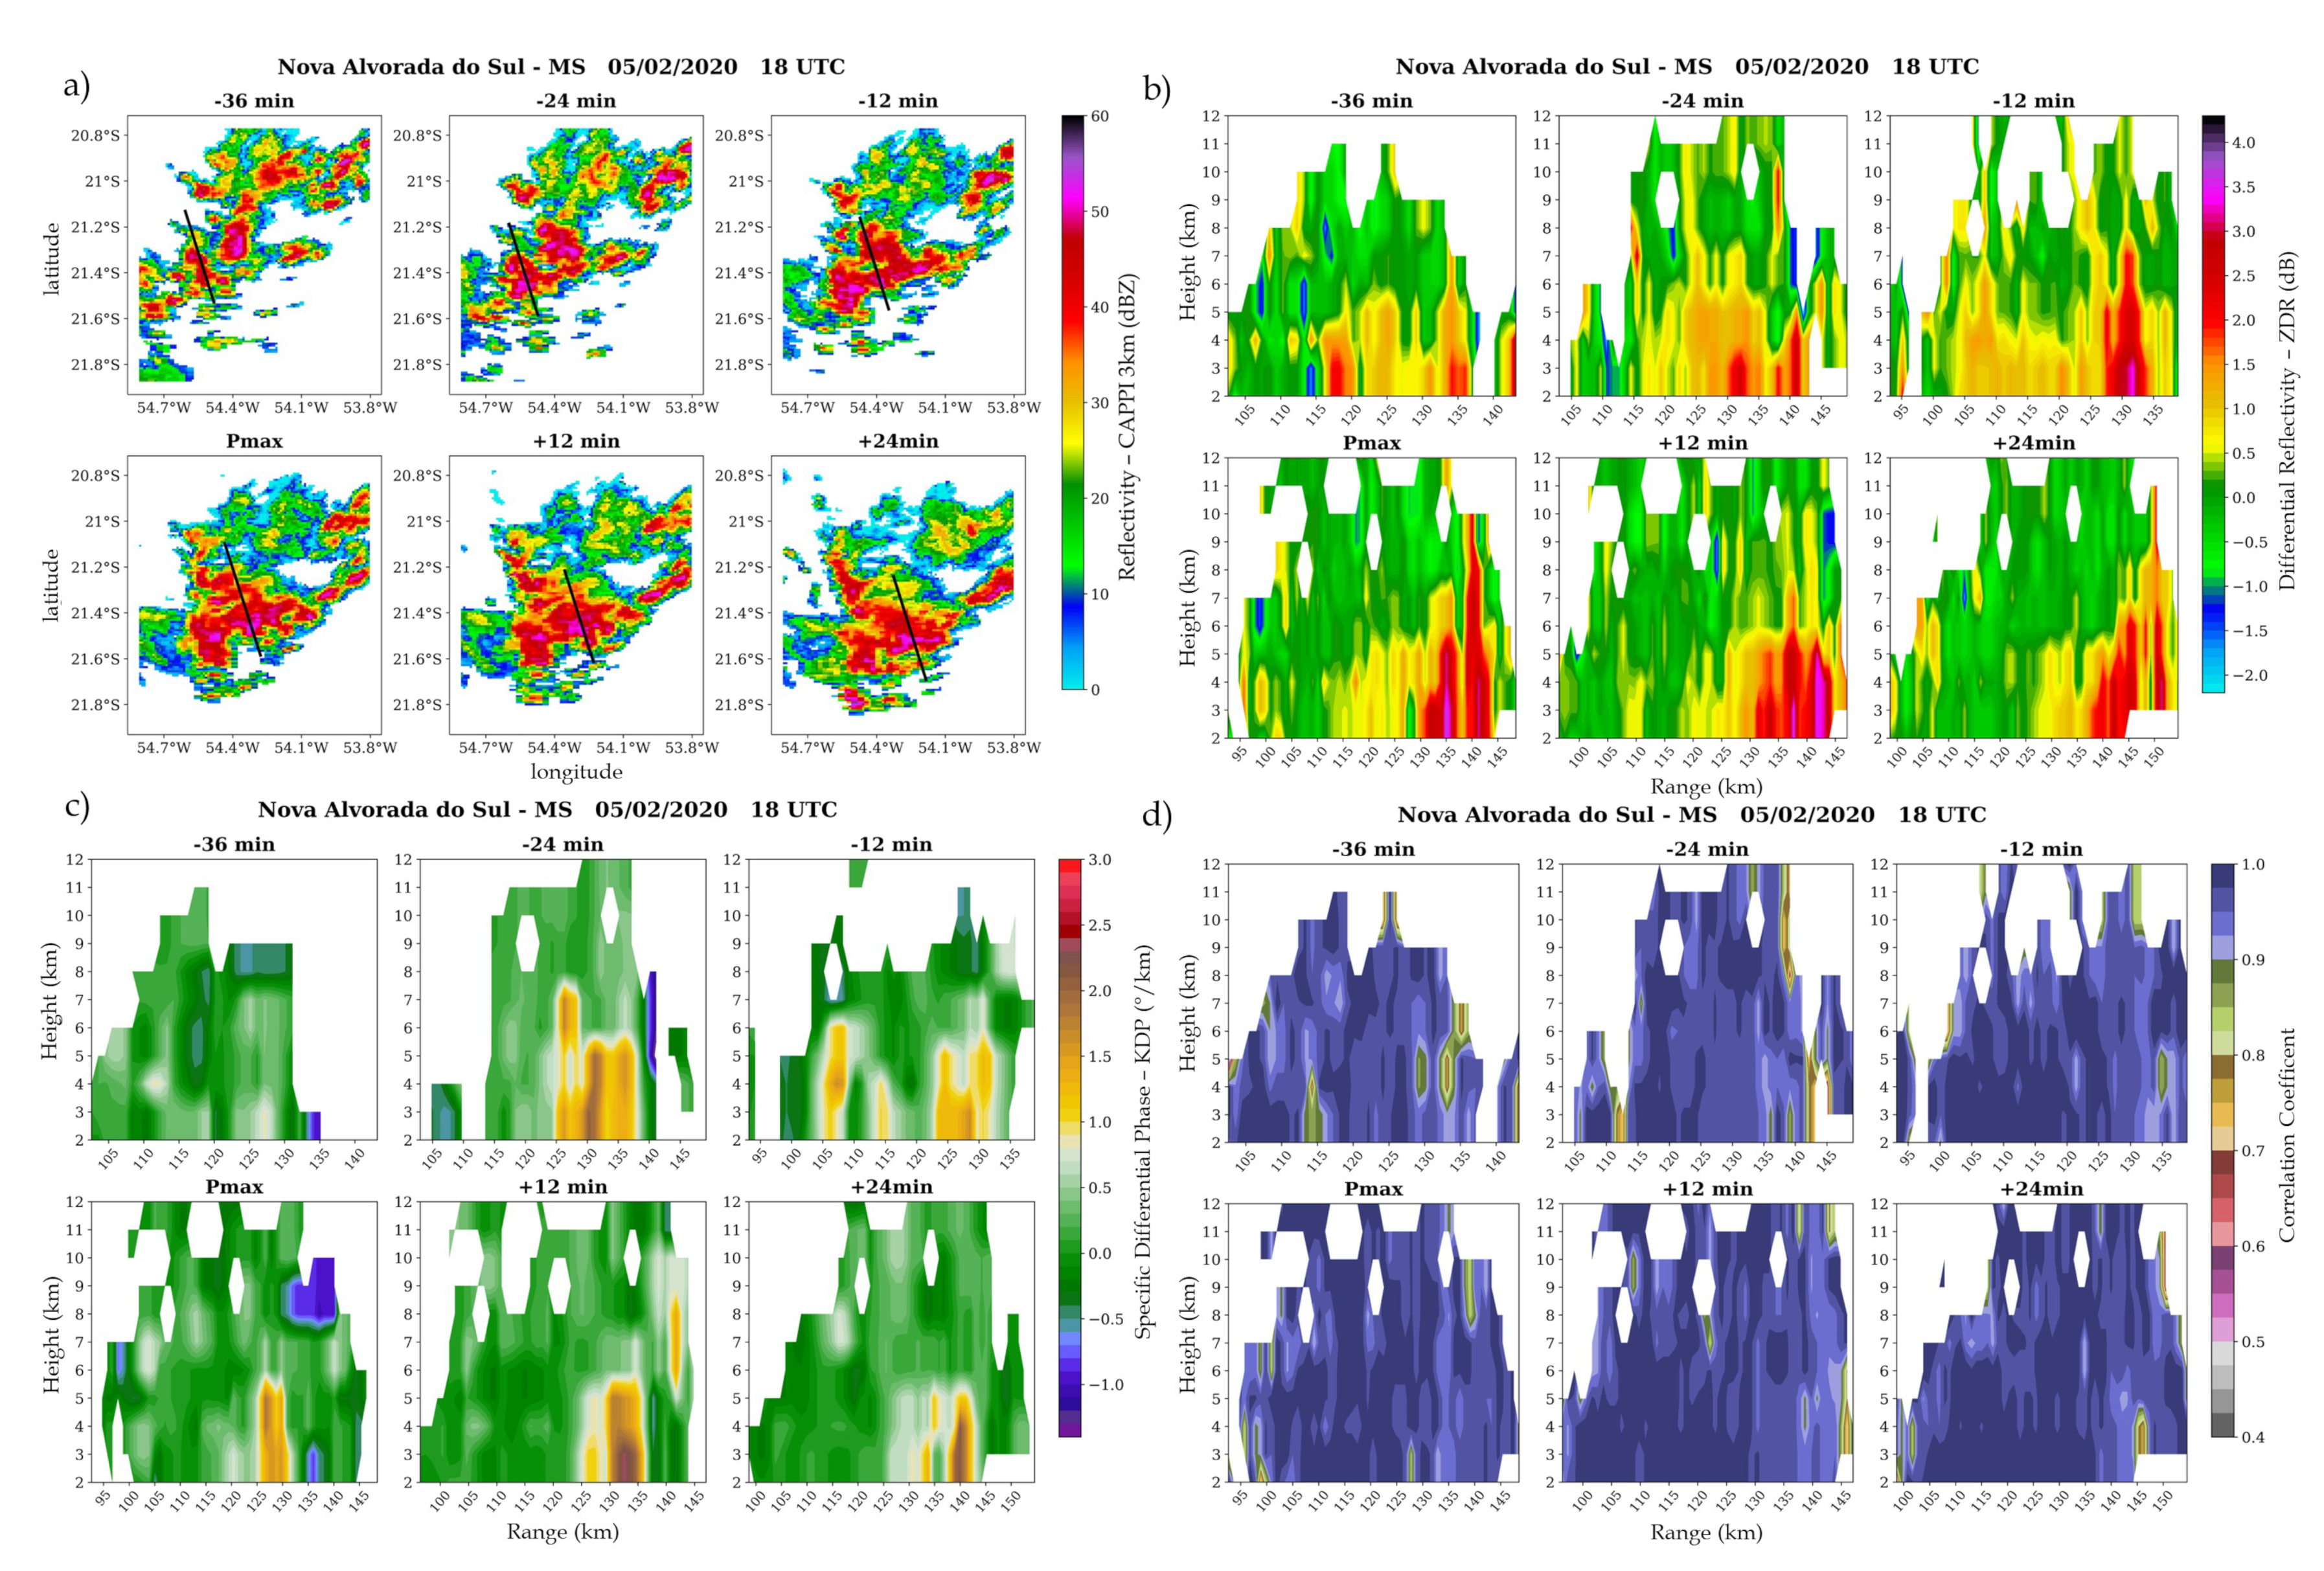
3.5.1. Nova Alvorada do Sul (Jaraguari Radar)
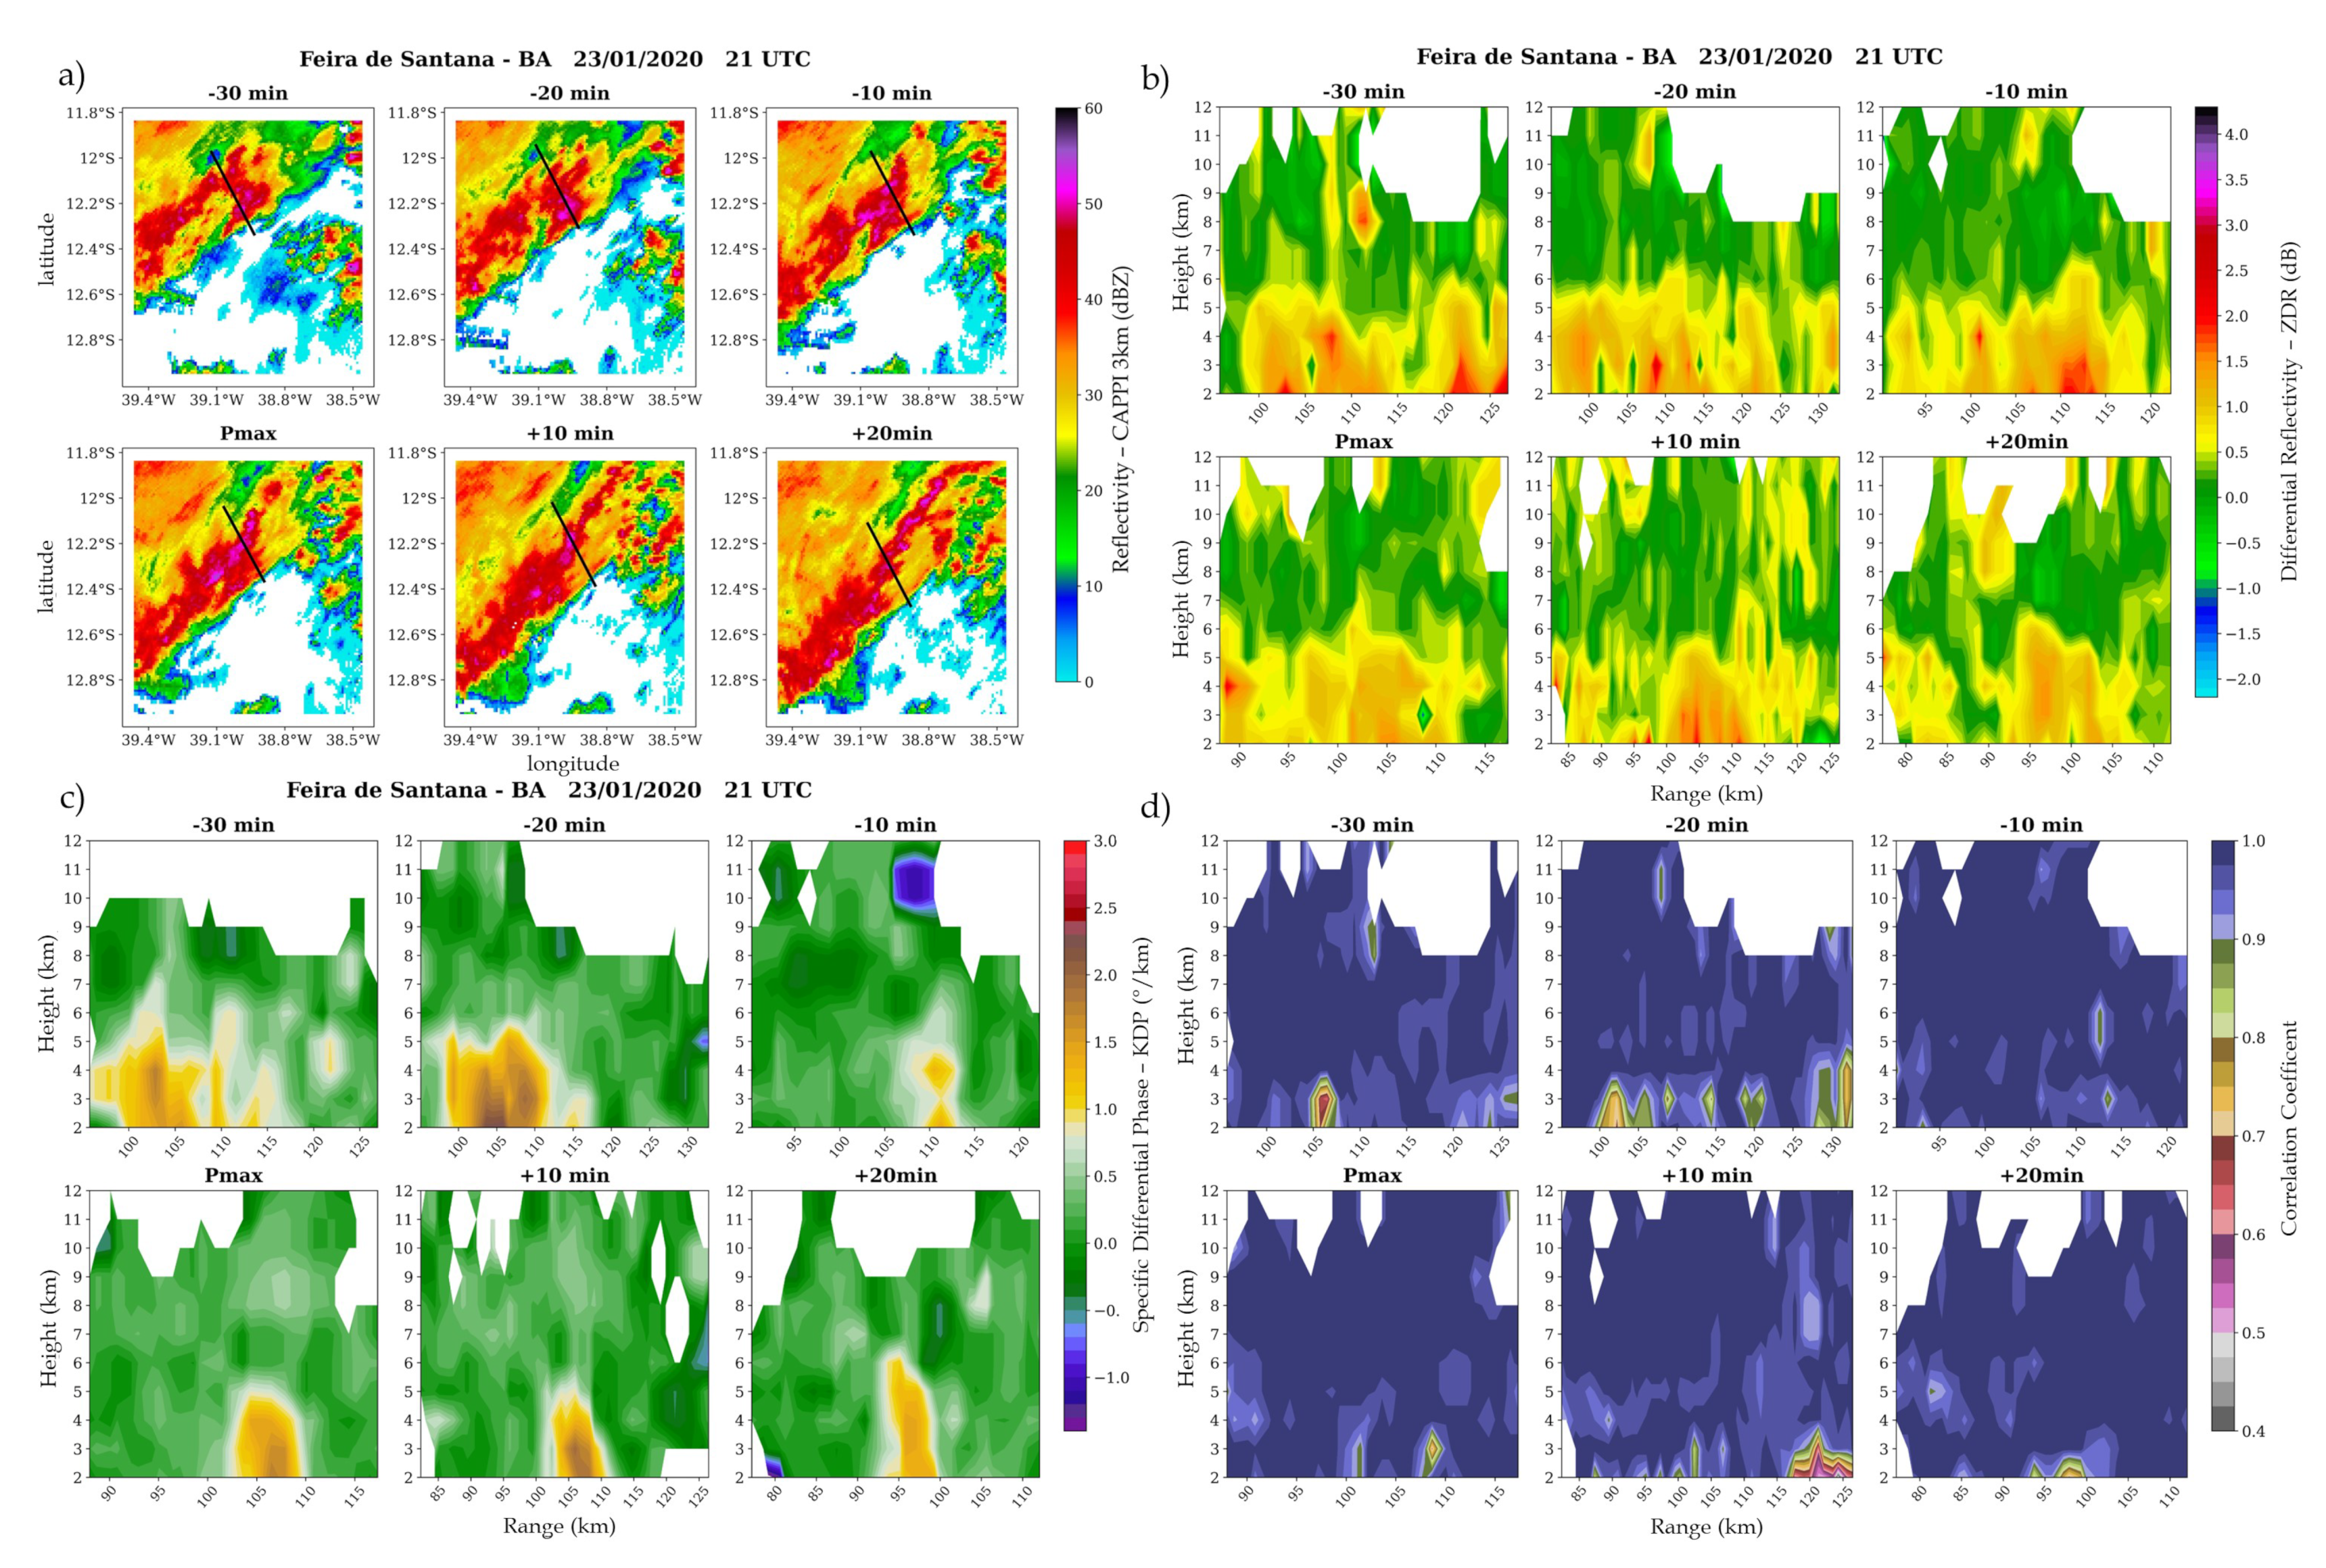
3.5.2. Feira de Santana (Salvador Radar)
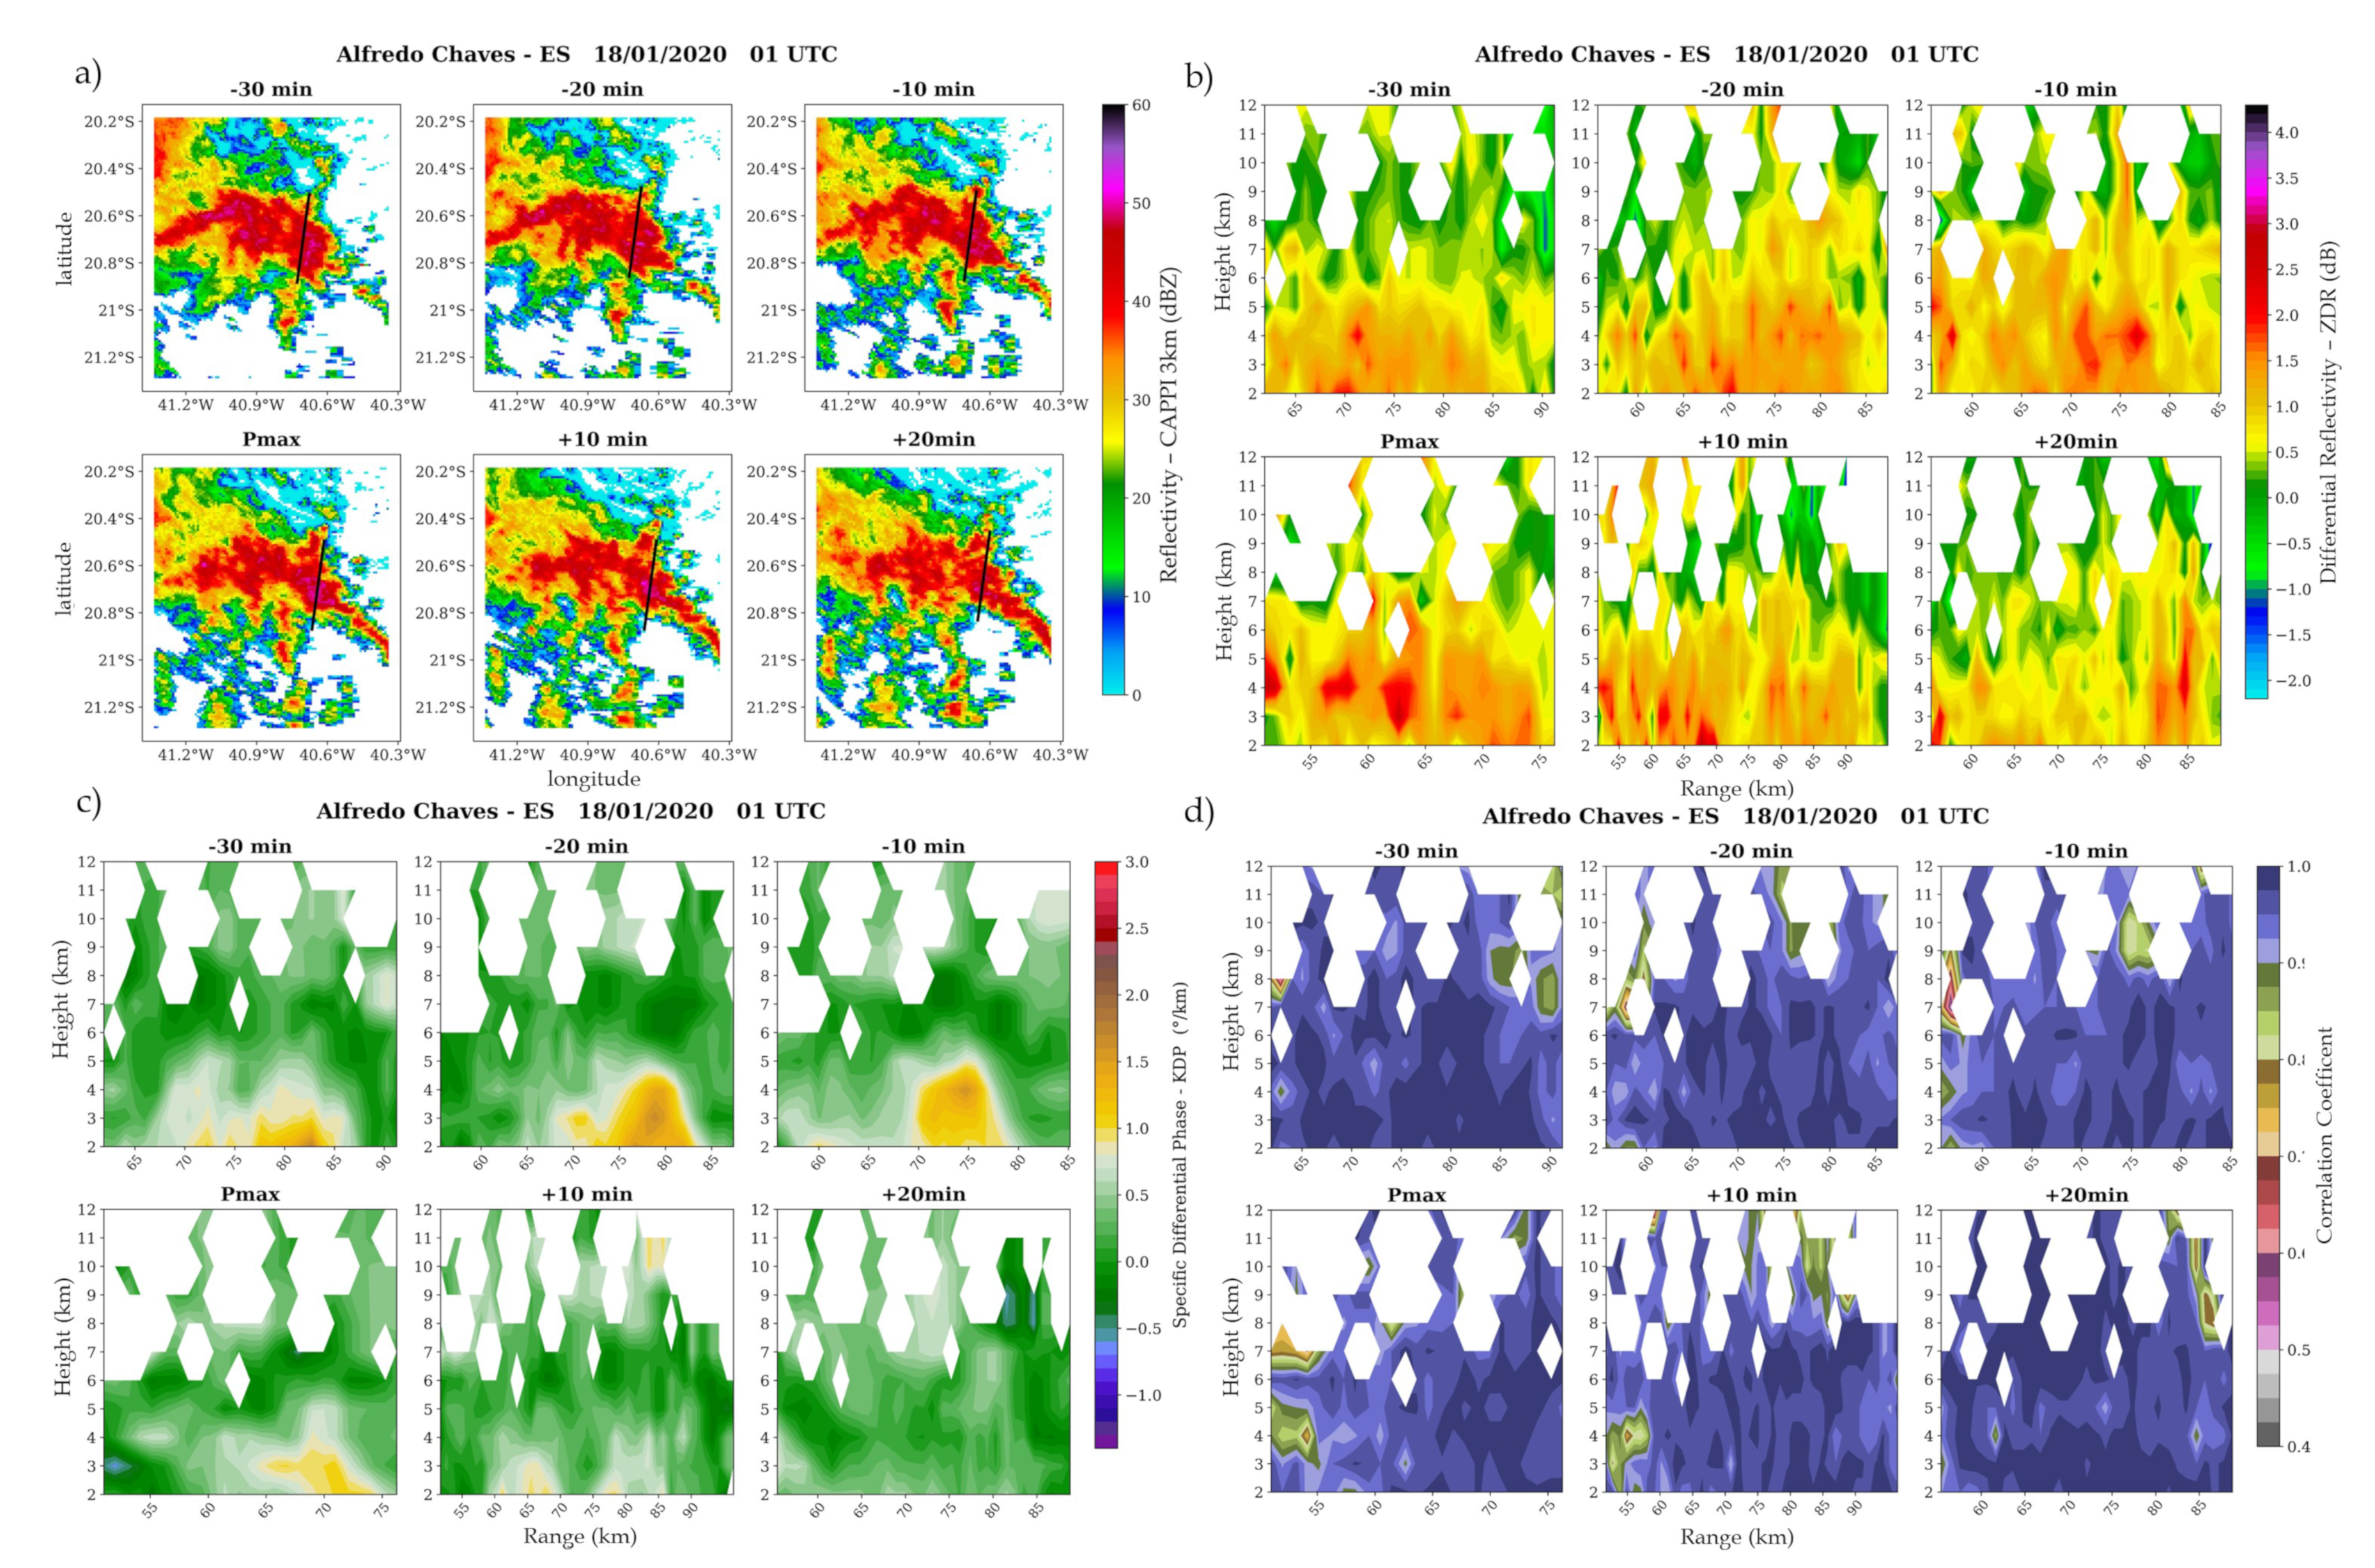
3.5.3. Alfredo Chaves (Santa Tereza Radar)
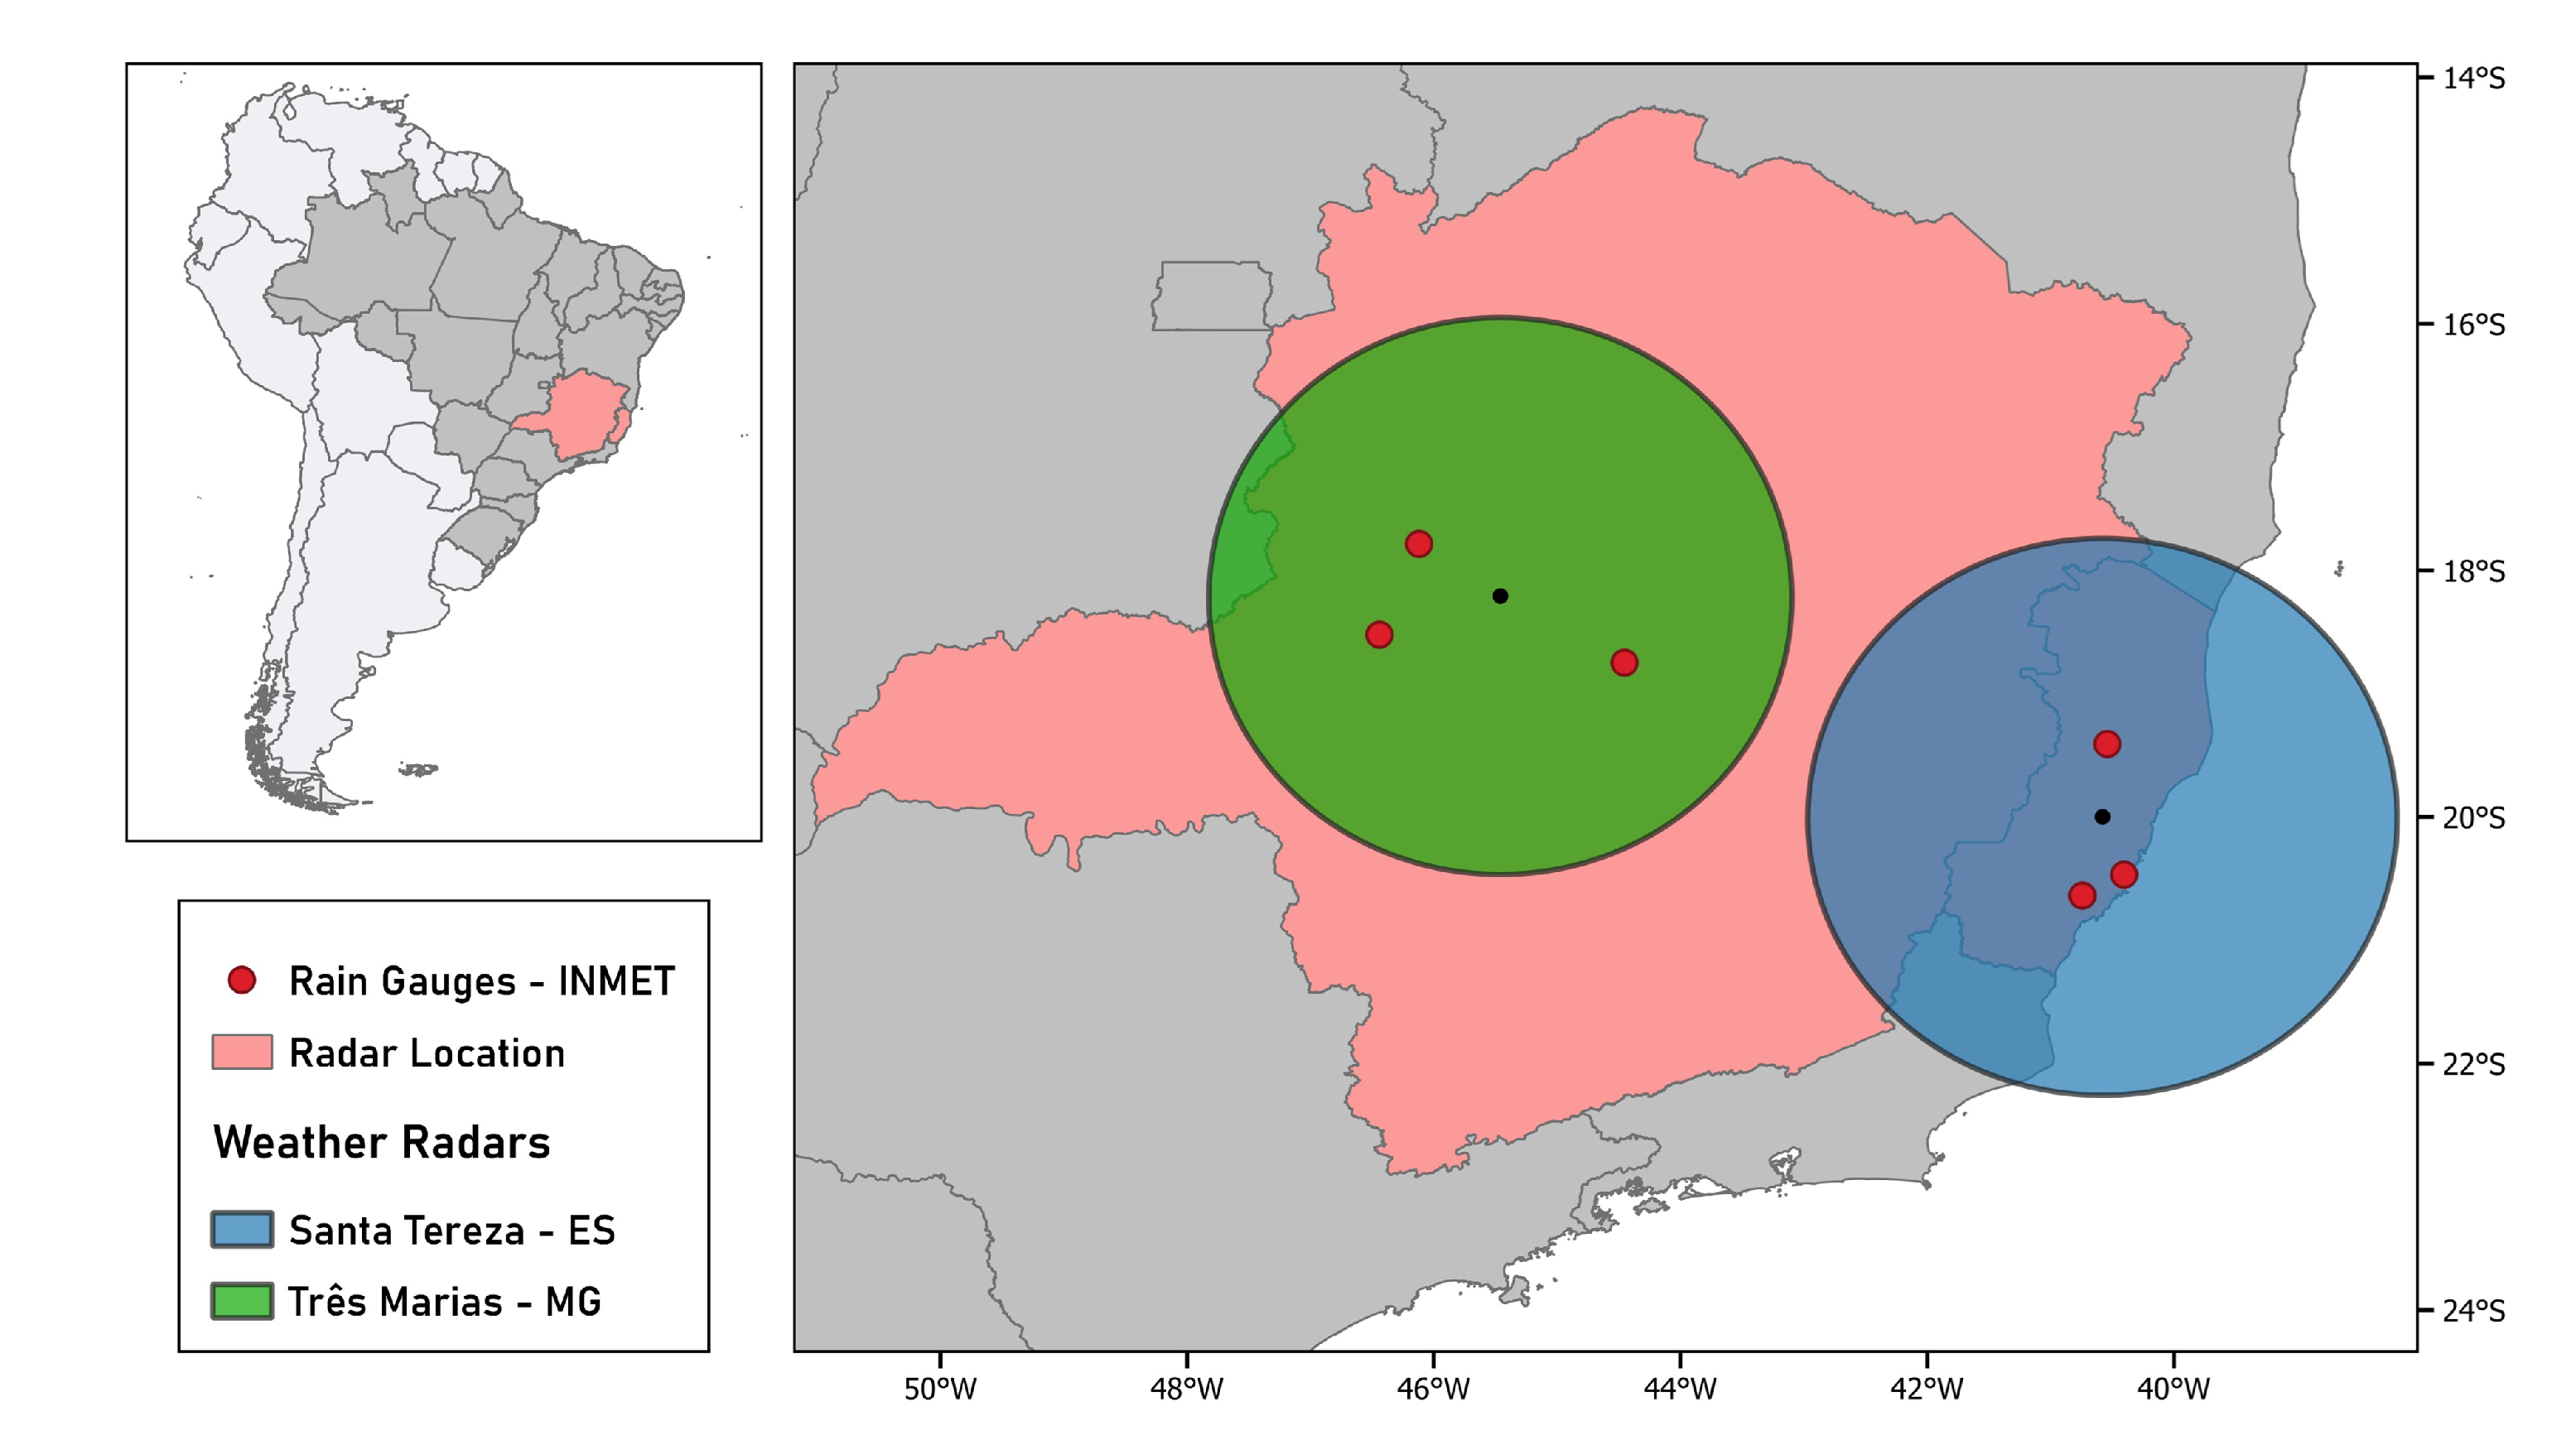
3.5.4. Southeast Region
4. Conclusions
Author Contributions
Funding
Institutional Review Board Statement
Informed Consent Statement
Data Availability Statement
Acknowledgments
Conflicts of Interest
References
- Alvares, C.A. Köppen’s climate classification map for Brazil. Meteorologische Zeitschrift 2013, 22, 711–728. [Google Scholar] [CrossRef]
- Brooks, H.E.; Stensrud, D.J. Climatology of heavy rain events in the United States from hourly precipitation observations. Monthly Weather Review 2000, 4, 1194–1201. [Google Scholar] [CrossRef]
- Konrad, C. E. Synoptic-scale features associated with warm season heavy rainfall over the interior southeastern United States. Weather and Forecasting 1997, 12, 557–571. [Google Scholar] [CrossRef]
- Groisman, P.Y.; Knight, R.W.; Karl, T.R. Changes in intense precipitation over the central United States. Journal of Hydrometeorology 2012, 13, 47–66. [Google Scholar] [CrossRef]
- Dolif, G.; Nobre, C. Improving extreme precipitation forecasts in Rio de Janeiro, Brazil: are synoptic patterns efficient for distinguishing ordinary from heavy rainfall episodes? Atmospheric Science Letters 2012, 13, 216–222. [Google Scholar] [CrossRef]
- Teixeira, M.S.; Satyamurty, P. Dynamical and synoptic characteristics of heavy rainfall episodes in southern Brazil. Atmospheric Science Letters 2007, 135, 598–617. [Google Scholar] [CrossRef]
- Liebmann, B.; Jones, C.; de Carvalho, L.M. Interannual variability of daily extreme precipitation events in the state of Sao Paulo, Brazil. Journal of Climate 2001, 14, 208–218. [Google Scholar] [CrossRef]
- Carvalho, L.M.; Jones, C.; Liebmann, B. Extreme precipitation events in southeastern South America and large-scale convective patterns in the South Atlantic convergence zone. Journal of Climate 2002, 15, 2377–2394. [Google Scholar] [CrossRef]
- Groisman, P.Y.; Knight, R.W.; Karl, T.R. Heavy precipitation and high streamflow in the contiguous United States: Trends in the twentieth century. Bulletin of the American Meteorological Society 2001, 82, 219–246. [Google Scholar] [CrossRef]
- Lima, K.C.; Satyamurty, P.; Fernández, J.P.R. Large-scale atmospheric conditions associated with heavy rainfall episodes in Southeast Brazil. Theoretical and Applied Climatology 2010, 101, 219–246. [Google Scholar] [CrossRef]
- Pristo, M.V.D.J.; Dereczynski, C.P.; Souza, P.R.D.; Menezes, W.F. Climatologia de Chuvas Intensas no Município do Rio de Janeiro. Revista Brasileira de Meteorologia 2018, 33, 615–630. [Google Scholar] [CrossRef]
- Murphy, A.M.; Ryzhkov, A.; Zhang, P. Columnar vertical profile (CVP) methodology for validating polarimetric radar retrievals in ice using in situ aircraft measurements. Journal of Atmospheric and Oceanic Technologya 2020, 37, 1623–1642. [Google Scholar] [CrossRef]
- Murphy, A.M.; Ryzhkov, A.; Zhang, P. Recent progress in dual-polarization radar research and applications in China. Advances in Atmospheric Sciences 2019, 36, 961–974. [Google Scholar]
- Queiroz, A. P. Monitoramento e Previsão Imediata de Tempestades Severas usando dados de Radar. Master Dissertation, National Institute for Space Research, São José dos Campos-SP, 2009. [Google Scholar]
- Uba, D. M. TATHU - Software para rastreio e análise do ciclo de vida de sistemas convectivos. National Institute for Space Research, São José dos Campos-SP, 2022.
- Cecchini, M.A.; Silva, D.; Maria, A.F.; Machado, L.A.T.; Morales, R.; Carlos, A.; Biscaro, T. Macrophysical and microphysical characteristics of convective rain cells observed during SOS-CHUVA. Journal of Geophysical Research: Atmospheres 2020, 125, e2019JD031187. [Google Scholar] [CrossRef]
- Greene, D.R.; Clark, R.A. Vertically integrated liquid water—A new analysis tool. Monthly Weather Review 2019, 100, 548–552. [Google Scholar] [CrossRef]
- Carey, L.D.; Rutledge, S.A. The relationship between precipitation and lightning in tropical island convection: A C-band polarimetric radar study. Monthly Weather Review 2020, 128, 2687–2710. [Google Scholar] [CrossRef]
- Sperling, V. B. Processos Físicos e Elétricos das Tempestades de Granizo na Região Sul do Brasil. Doctoral Thesis, National Institute for Space Research, São José dos Campos-SP, 2009. [Google Scholar]
- Sachidananda, M.; Zrnić, D.S. Rain rate estimates from differential polarization measurements. Journal of Atmospheric and Oceanic Technology 1987, 4, 588–598. [Google Scholar] [CrossRef]
- Zrnić, D.S.; Ryzhkov, A. Advantages of rain measurements using specific differential phase. Journal of Atmospheric and Oceanic Technology 1996, 13, 454–464. [Google Scholar] [CrossRef]
- Ryzhkov, A.V.; Giangrande, S.E.; Schuur, T.J. Rainfall estimation with a polarimetric prototype of WSR-88D. Journal of Applied Meteorology 2005, 44, 502–515. [Google Scholar] [CrossRef]
- Giangrande, S.E.; Ryzhkov, A.V. Estimation of rainfall based on the results of polarimetric echo classification. Journal of applied meteorology and climatology 2008, 47, 2445–2462. [Google Scholar] [CrossRef]
- Thompson, E.J.; Rutledge, S.A.; Dolan, B.; Thurai, M.; Chandrasekar, V. Dual-polarization radar rainfall estimation over tropical oceans. Journal of applied meteorology and climatology 2018, 57, 755–775. [Google Scholar] [CrossRef]
- Ryzhkov, A.V.; Zrnic, D.S. The title of the cited contribution. In Radar polarimetry for weather observations; Springer International Publishing: Cham, Switzerland, 2019. [Google Scholar]
- Bukovčić, P.; Ryzhkov, A.; Zrnić, D.; Zhang, G. Polarimetric radar relations for quantification of snow based on disdrometer data. Journal of Applied Meteorology and Climatology 2018, 57, 103–120. [Google Scholar] [CrossRef]
- Yuter, S.E.; Houze, R.A. Three-dimensional kinematic and microphysical evolution of Florida cumulonimbus. Part II: Frequency distributions of vertical velocity, reflectivity, and differential reflectivity. Monthly weather review 2018, 123, 1941–1963. [Google Scholar] [CrossRef]
- Markowski, P.M.; Dotzek, N.A. A numerical study of the effects of orography on supercells. Atmospheric research 2011, 100, 457–478. [Google Scholar] [CrossRef]
- Houze, R.A., Jr. Orographic effects on precipitating clouds. Reviews of Geophysics 2012, 50. [Google Scholar] [CrossRef]
- Machado, L.A.T.; Calheiros, A.J.P.; Biscaro, T.; Giangrande, S.; Silva Dias, M.A.F.; Cecchini, M.A.; Albrecht, R.; Andreae, M.O.; Araujo, W.F.; Artaxo, P.; et., al. Atmospheric Chemistry and Physics 2018, 18, 6461–6482. [CrossRef]
- Costa, I.C. Avaliação dos dados produzidos pela rede de radares meteorológicos de banda “S” localizados no centro sul do Brasil. Master of Science Thesis [in Portuguese], National Institute for Space Research, São José dos Campos-SP, 2007.
- Saraiva, I. ariabilidade regional das nuvens de chuva na Bacia Amazônica visto por uma rede de radares meteorológicos. Doctoral Thesis, National Institute for Amazon Research, Manaus-AM, 2016.
- Fujita, T. T. Tornadoes around the world. Weatherwise 1973, 26, 56–83. [Google Scholar] [CrossRef]
- Silva Dias, M. A. F. Editor 1, R. Pielke Sr., Editor 2, R. Pielke Jr., Eds., Vol II. 1999.
- Nascimento, E. L. Previsão de tempestades severas utilizando-se parâmetros convectivos e modelos de mesoescala: uma estratégia operacional adotável no Brasil. Revista Brasileira de Meteorologia 2005, 20, 121–140. [Google Scholar]
- Brooks, H.E. A global view of severe thunderstorms: Estimating the current distribution and possible future changes, Preprints. In Proceedings of AMS Severe Local Storms Special Symposium Atlanta, 2006.
- Zipser, E.J.; Cecil, D.J.; Liu, C.; Nesbitt, S.W.; Yorty, D.P. Where are the most intense thunderstorms on Earth? Bulletin of the American Meteorological Society 2006, 87, 1057–1072. [Google Scholar] [CrossRef]
- Stevens, A. P. Introduction to the basic drivers of climate. 2010.
- Krishnamurti, T. N., Stefanova, L., Misra, V. Tropical meteorology, 1979.
- Hastenrath, S. Climate dynamics of the tropics. Springer Science & Business Media 2012, 8, 1057–1072. [Google Scholar]
- Wallace, J., Hobbs, P. V. In Atmospheric science: an introductory survey; Elsevier; 2006.
- Sohn, B. J. Characteristic features of warm-type rain producing heavy rainfall over the Korean Peninsula inferred from TRMM measurements. Monthly Weather Review 2013, 141, 3873–3888. [Google Scholar] [CrossRef]
- Song, H. J. Idealized numerical experiments on the microphysical evolution of warm-type heavy rainfall. Journal of Geophysical Research: Atmospheres 2017, 122, 1685–1699. [Google Scholar] [CrossRef]
- Sohn, B. J., Ryu, G. H., Song, H. J. Observational Characteristics of Warm-Type Heavy Rainfall. Satellite Precipitation Measurement 2020, 745–759.
- INPE. Observational Characteristics of Warm-Type Heavy Rainfall. Climanálise 1986.
- Kumjian, M. R. Principles and Applications of Dual-Polarization Weather Radar. Journal of Operational Meteorology 2013a, 1, 1. [Google Scholar] [CrossRef]
- Kumjian, M. R. Principles and Applications of Dual-Polarization Weather Radar. Part II: Warm-and Cold-Season Applications. Journal of Operational Meteorology 2013b, 1. [Google Scholar] [CrossRef]
- Kumjian, M.R. The anatomy and physics of Z DR columns: Investigating a polarimetric radar signature with a spectral bin microphysical model. Journal of Applied Meteorology and Climatology 2014, 53, 1820–1843. [Google Scholar] [CrossRef]
- Tobin, D.M.; Kumjian, M.R. Microphysical and polarimetric radar modeling of hydrometeor refreezing. Journal of the Atmospheric Sciences 2021, 78, 1965–1981. [Google Scholar] [CrossRef]
- Segall, J.H.; French, M.M.; Kingfield, D.M.; Loeffler, S.D.; Kumjian, M.R. Storm-scale polarimetric radar signatures associated with tornado dissipation in supercells. Weather and Forecasting 2022, 37, 3–21. [Google Scholar]
- Picca, J. C.; Kumjian, M. R.; Ryzhkov, A. V. ZDR columns as a predictive tool for hail growth and storm evolution. In Proceedings of 25th Conf. on Severe Local Storms, 2010.
- Dalman, D. M. et al. Cataloging rapid-scan observations of Z DR columns in supercells. In Proceedings of 29th Conference on Severe Local Storms, Stowe, VT, USA, 2018.
- Picca, J. C.; Snyder, J. C. and Ryzhkov, A.V. An observational analysis of ZDR column trends in tornadic supercells. In Proceedings of 37th Conf. on Radar Meteorology, Norman, OK, Amer. Meteor. Soc., 5A. 5, 2015.
- Ryzhkov, A.V.; Schuur, T.J.; Burgess, D.W.; Zrnic, D.S. Polarimetric tornado detection. Journal of applied meteorology 2005, 44, 557–570. [Google Scholar] [CrossRef]
- Kumjian, M.R.; Ryzhkov, A.V. Polarimetric signatures in supercell thunderstorms. Journal of applied meteorology and climatology 2008, 47, 1940–1961. [Google Scholar] [CrossRef]
- Romine, G.S.; Burgess, D.W.; Wilhelmson, R.B. A dual-polarization-radar-based assessment of the 8 May 2003 Oklahoma City area tornadic supercell. Journal of applied meteorology and climatology 2008, 136, 2849–2870. [Google Scholar] [CrossRef]
- Kumjian, M.R.; Ryzhkov, A.V.; Melnikov, V.M.; Schuur, T.J. Rapid-scan super-resolution observations of a cyclic supercell with a dual-polarization WSR-88D. Monthly weather review 2010, 138, 3762–3786. [Google Scholar] [CrossRef]
- Snyder, J.C.; Bluestein, H.B.; Venkatesh, V.; Frasier, S.J. Observations of polarimetric signatures in supercells by an X-band mobile Doppler radar. Monthly weather review 2013, 141, 3–29. [Google Scholar] [CrossRef]
- Tribuna Online. Available online: https://tribunaonline.com.br/previsaodotempo/alfredo-chaves-e-a-cidade-que-recebeu-mais-chuva-em-janeiro-no-brasil-diz-instituto-60662 (accessed on 20 May 2022).
- Villarini, G.; Krajewski, W.F. Review of the different sources of uncertainty in single polarization radar-based estimates of rainfall. Surveys in Geophysics 2010, 31, 107–129. [Google Scholar] [CrossRef]
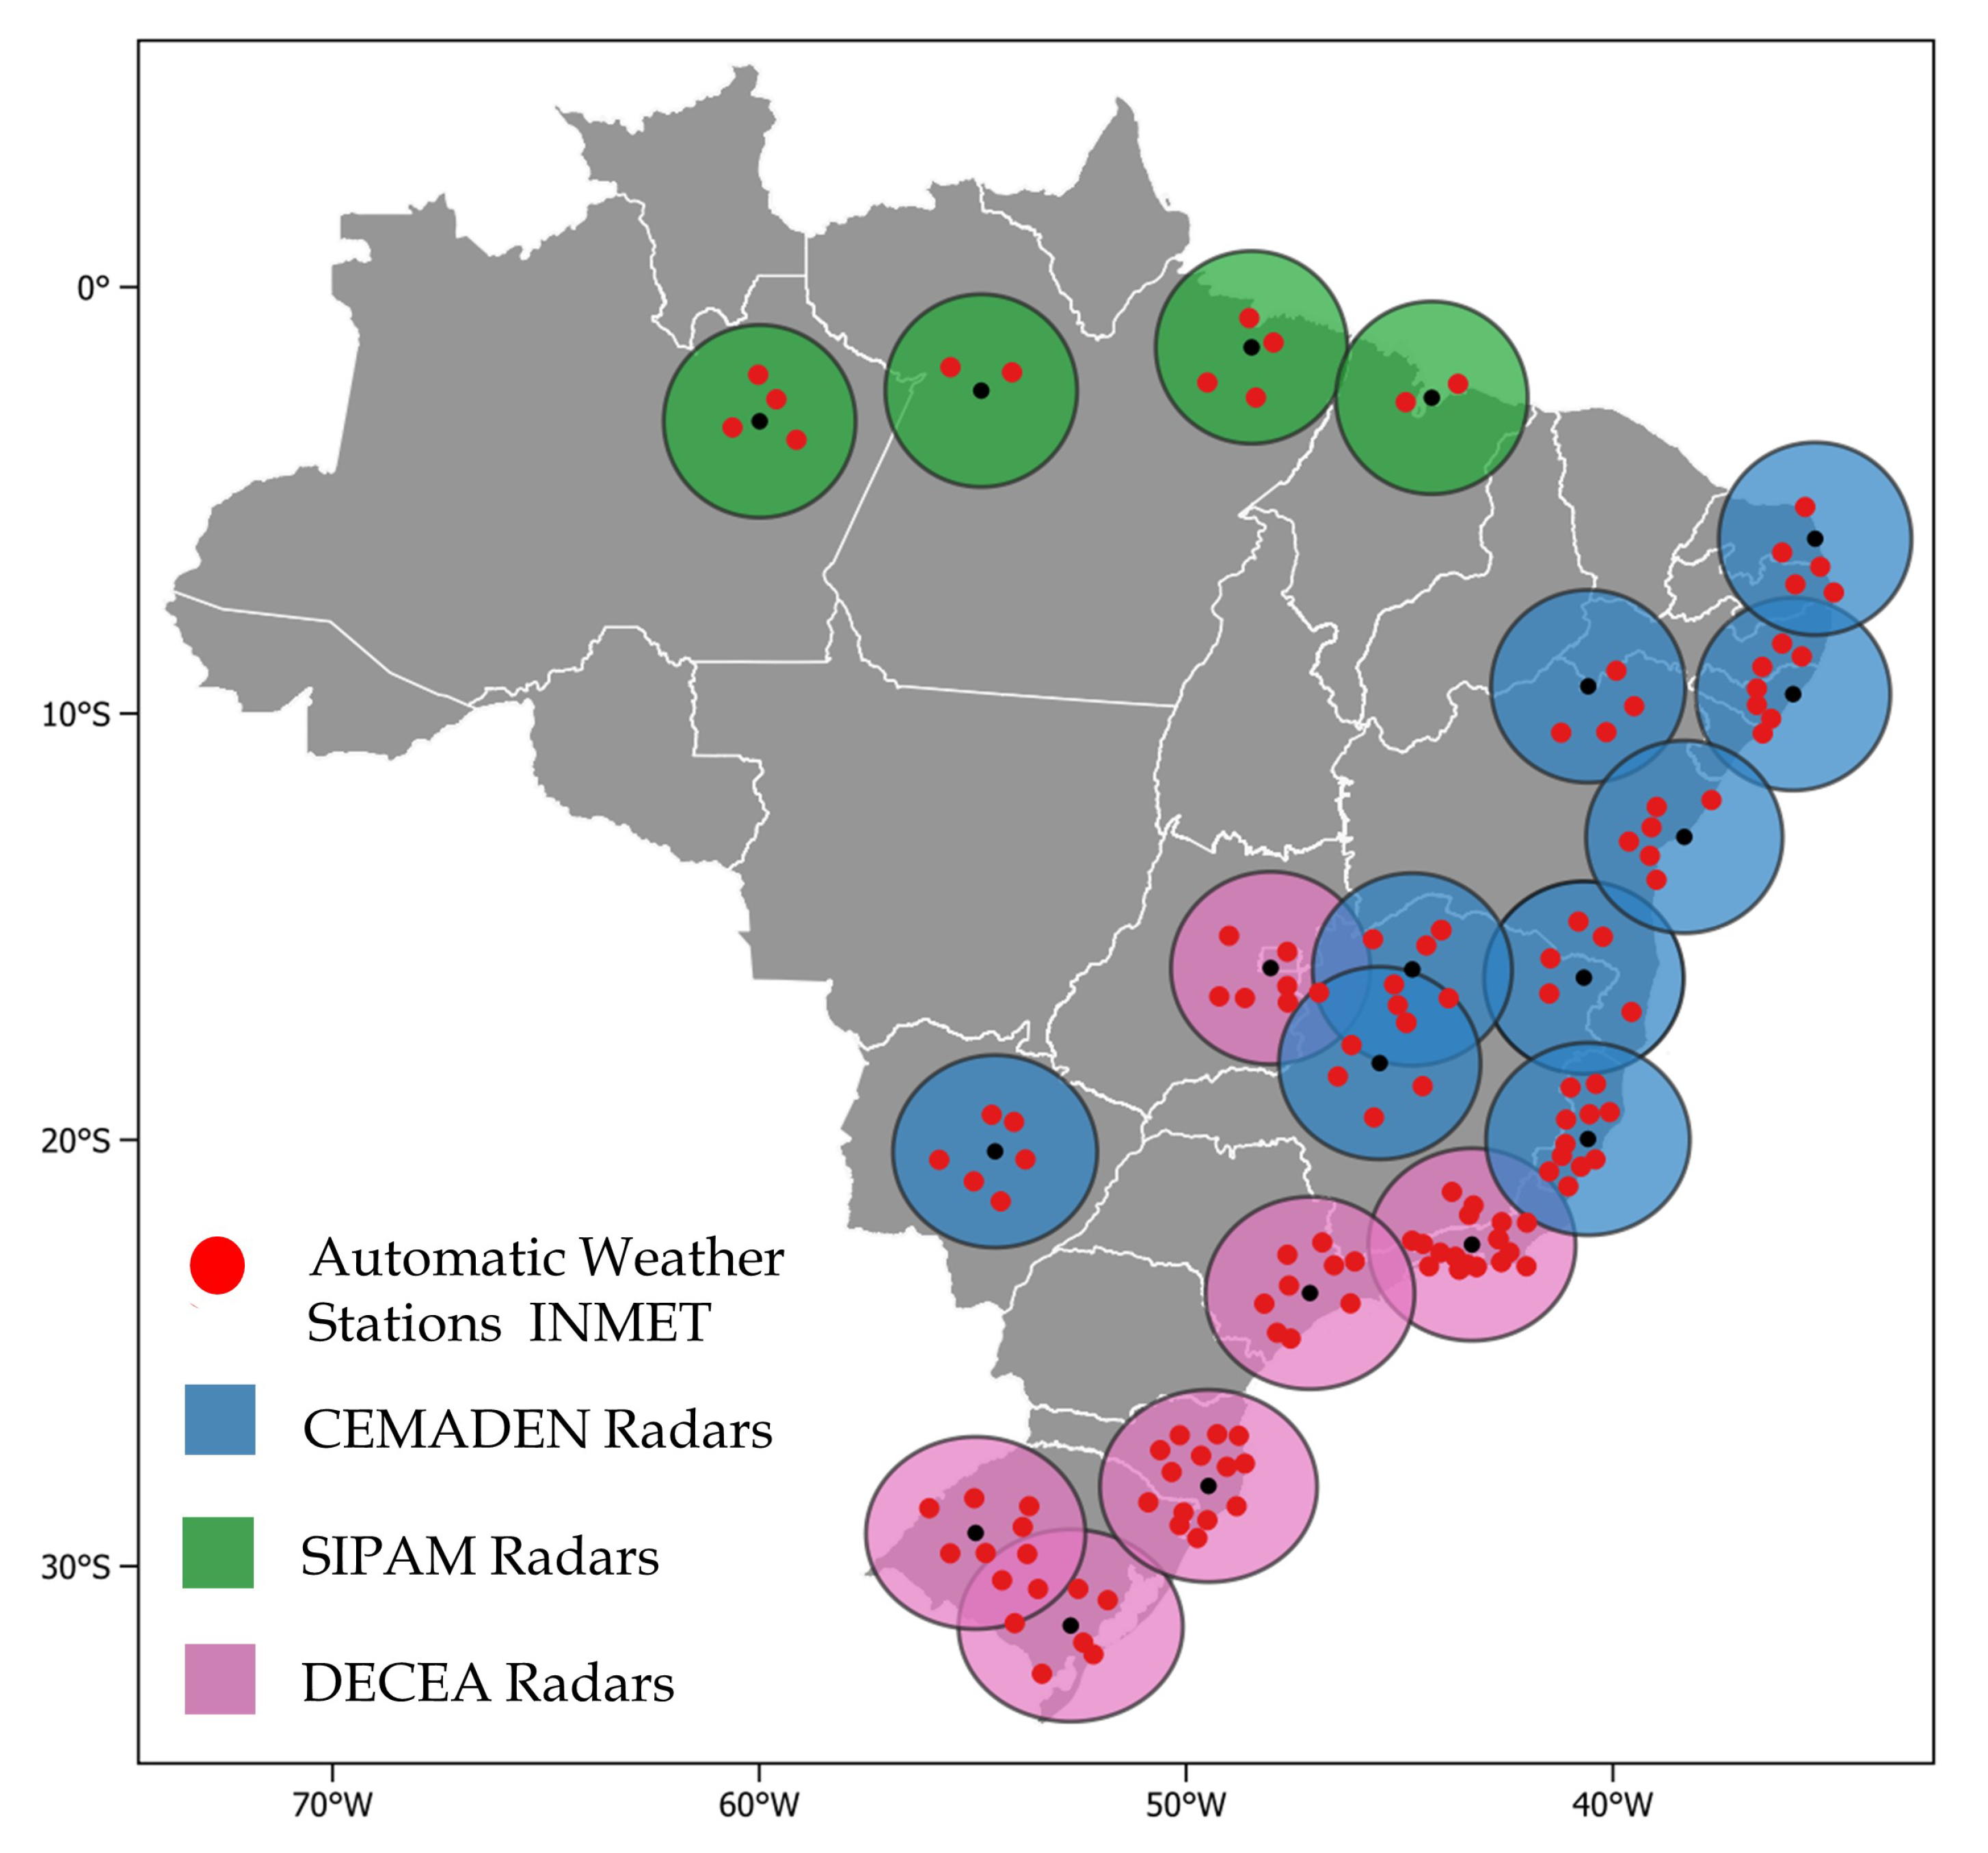
| Radar/ OP | UF | Polarization | Frequency |
|---|---|---|---|
| Almenara/ CEMADEN | MG | Dual-polarization | 10 min |
| Jaraguari/ CEMADEN | MS | Dual-polarization | 12 min |
| Maceio/ CEMADEN | AL | Dual-polarization | 10 min |
| Natal/ CEMADEN | RN | Dual-polarization | 10 min |
| Petrolina/ CEMADEN | PE | Dual-polarization | 10 min |
| Salvador/ CEMADEN | BA | Dual-polarization | 10 min |
| Santa Tereza/ CEMADEN | ES | Dual-polarization | 10 min |
| São Francisco/ CEMADEN | MG | Dual-polarization | 10 min |
| Três Marias/ CEMADEN | MG | Dual-polarization | 10 min |
| Canguçu/ DECEA | RS | Single polarization | 10 min |
| Gama/ DECEA | GO | Single polarization | 10 min |
| Morro da Igreja/ DECEA | SC | Single polarization | 10 min |
| Pico do Couto/ DECEA | RJ | Single polarization | 10 min |
| Santiago/ DECEA | RS | Single polarization | 12 min |
| São Roque/ DECEA | SP | Single polarization | 10 min |
| Manaus/ SIPAM | AM | Single polarization | 12 min |
| Santarém/ SIPAM | PA | Single polarization | 12 min |
| São Luiz/ SIPAM | MA | Single polarization | 12 min |
| Belém/ SIPAM | PA | Single polarization | 12 min |
| Region | Number of Events |
|---|---|
| South | 17 |
| Southeast | 29 |
| Midwest | 14 |
| North | 15 |
| Northeast | 08 |
Disclaimer/Publisher’s Note: The statements, opinions and data contained in all publications are solely those of the individual author(s) and contributor(s) and not of MDPI and/or the editor(s). MDPI and/or the editor(s) disclaim responsibility for any injury to people or property resulting from any ideas, methods, instructions or products referred to in the content. |
© 2024 by the authors. Licensee MDPI, Basel, Switzerland. This article is an open access article distributed under the terms and conditions of the Creative Commons Attribution (CC BY) license (http://creativecommons.org/licenses/by/4.0/).


