Preprint
Article

Dynamics of Halogen Molecule Vibrations in Molecular Crystals: Temperature and Halogen Dependency

Altmetrics

Downloads

104

Views

36

Comments

0

This version is not peer-reviewed

Submitted:

13 April 2024

Posted:

16 April 2024

You are already at the latest version

Alerts
Abstract
Raman spectra of [TeX6](Y2) (X, Y - Cl, Br, I) were recorded in the temperature range 5-300 K. The vibration frequency of molecular halogens as function on temperature and the type of halogen X- in the [TeX6]2- complex was obtained. The vibration frequency of the molecular halogen Y2 depends on the type of halogen X- complex [TeX6]2- The temperature dependence of the Y2 frequency is anomalous compared to what was expected for a conventional anharmonic oscillator. It is shown that the interpretation of the experimental results based on the concept of traditional chemical bonding is quite satisfactory in all cases. The study was motivated by the need to consider the mechanism of interaction in the X-Y2 contacts.
Keywords: 
Subject: Chemistry and Materials Science  -   Physical Chemistry

Introduction

The interaction of atoms with each other is determined by several components: electrostatic, polarization, exchange repulsion, charge transfer, and coupling [1]. Chemical bonds formed with the listed participants are called non-valent and are classified as weak. However, the bond becomes strong if molecular orbitals are occurred and electron density shared on them. In this case, the bond is usually called valent.
Among non-valent interactions, the halogen bonding has recently occupied a special place. According to the IUPAC definition [2], “A halogen bond occurs when there is evidence of a net attractive interaction between an electrophilic region associated with a halogen atom in a molecular entity and a nucleophilic region in another, or the same, molecular entity.” The formulation of the concept of halogen interaction is rather vague and allows us to refer to it any contact of a halogen atom with its surroundings without considering the details of the interaction. The halogen bonding, has been widely discussed in the literature [3,4] and works cited here]. Its role and significance in molecular crystals are still debated. Since it is not possible to consider the huge number of variants falling under this definition, in this work we have limited ourselves to describing the properties of X-Y2 contacts (X and Y are halogen atoms) and the interaction of Y2 molecules with each other in molecular crystals. The purpose of the present work is to consider the mechanism of interaction in these two types of contacts.
The main objective of this work was to examine how the vibration frequency of molecular halogens changes under various internal (composition) and external (temperature, pressure) conditions in order to clarify the nature of the interaction between molecular systems containing halogen atoms. The compounds [TeX6](Y2) were chosen as objects of study, where X, Y = Cl, Br, I, and molecular halogen Y2 form bridges between neighboring [TeX6]2− octahedra and are in contact with halogen atoms X of the same or another type ( Y − X contact). The composition of the crystals under study also included various counterions, which are not described in the text due to the insignificance or absence of their influence on the vibrational spectra of the main molecular form. Information on the effects of external pressure is taken from the literature. Raman spectra of fine-crystalline [TeX6](Y2) compounds were measured as function of temperature in the range 5 K – 300 K. It should be noted, however, that a complete series of [TeX6](Y2) compounds suitable for comparing the influence of halogen type in contacts Y – X, exists only for complexes [TeX6](I2), where X = Cl, Br, I. The synthesis of crystals with molecular groups Cl2 and Br2 at any X is either not always possible, or the resulting compounds do not have sufficient stability. Of course, these restrictions are dictated by the electronegativity ratio and chemical activity of the contacting halogen atoms. For this reason, the primary attention in the work was paid to the properties of compounds [TeX6](I2), where X = Cl, Br, I. Other possible structures [MeX6](Y2), (Me − metal) are considered as additional.
Another object of study in this work is molecular crystals of the halogens Cl2, Br2 and I2. They are of great interest because an external pressure transforms them into a monatomic phase with the formation of a continuous two-dimensional network of identically bonded halogen atoms [5]. In addition, it was noticed (and this is the most crucial effect for these crystals) that at low (0 - 5 GPA) pressure, the intramolecular halogen-halogen distance unexpectedly increases, and only at P > 5 GPA does the crystal response becomes normal [6]. At the same time, intermolecular distances demonstrate “correct” behavior over the entire pressure range. Based on Raman study of I2 crystals [7], it was found that the change in the wavenumbers of intra- and intermolecular vibrations in the temperature range 5 K – 300 K completely corresponds to what was observed in the experiments with pressure in crystalline bromine [6] with the only difference is that the change in inter- and intramolecular distances in the crystal in a given temperature range corresponds only to the initial region of the pressure range of 1-2 GPa. In both papers, the experiment was confirmed by quantum chemical calculations. The authors of [6,7] concluded that the reason for the anomalous decrease in the vibration frequency of I2 at low pressures is intermolecular interaction. Perhaps it is this interaction that provokes the transition of the I2 crystal from a molecular to a monatomic structure at high pressure. In addition it was also found that I2 molecules can generate one-dimensional chains in nano-sized channels [8].

Experimental

All compounds used in this work were synthesized over the past ten years in the group of Prof. Sergei Adonin (Nikolaev’s Institute of Inorganic Chemistry of Siberian Branch of Russian Academy of Sciences). Subsequently, publications containing a detailed description of the preparation of the corresponding compounds are cited in the text.
Raman spectra were collected using a LabRAM HR Evolution (Horiba) spectrometer with a CCD Symphony (JobinYvon) detector that provided 2048 pixels along the abscissa with the excitation by the 633 nm of He-Ne laser. At all temperatures, the spectra are measured in backscattering collection geometry with a Raman microscope. Spectral resolution was around 0.7 cm-1. Сlosed cycle He-cryostat (DE210AF-GMX-20-OM type of ARS Company, USA) provides a temperature range from 5 to 300 K.

Results and Discussion

Figure 1 shows typical Raman spectra of [TeX6](Y2) at room temperature. The positions of the band maxima are indicated only for the stretching vibrations of Cl2 (spectrum 1), Br2 (2) and I2 (3). The remaining modes relate to vibrations of [TeX6]2− octahedra, the study of which is beyond the scope of the present work and are not considered here. In some cases, the spectra also contain vibrational lines of counterions, which are also not considered. Table 1 lists the vibration wavenumber of Y2 and the length of the X–I and I–I bonds. As can be seen from the table, in [TeX6](I2) compounds, which represent a complete series of halogen type X, the mode frequency ν(I2) depends significantly on X, and the interpretation of this effect is one of the goals of this work.
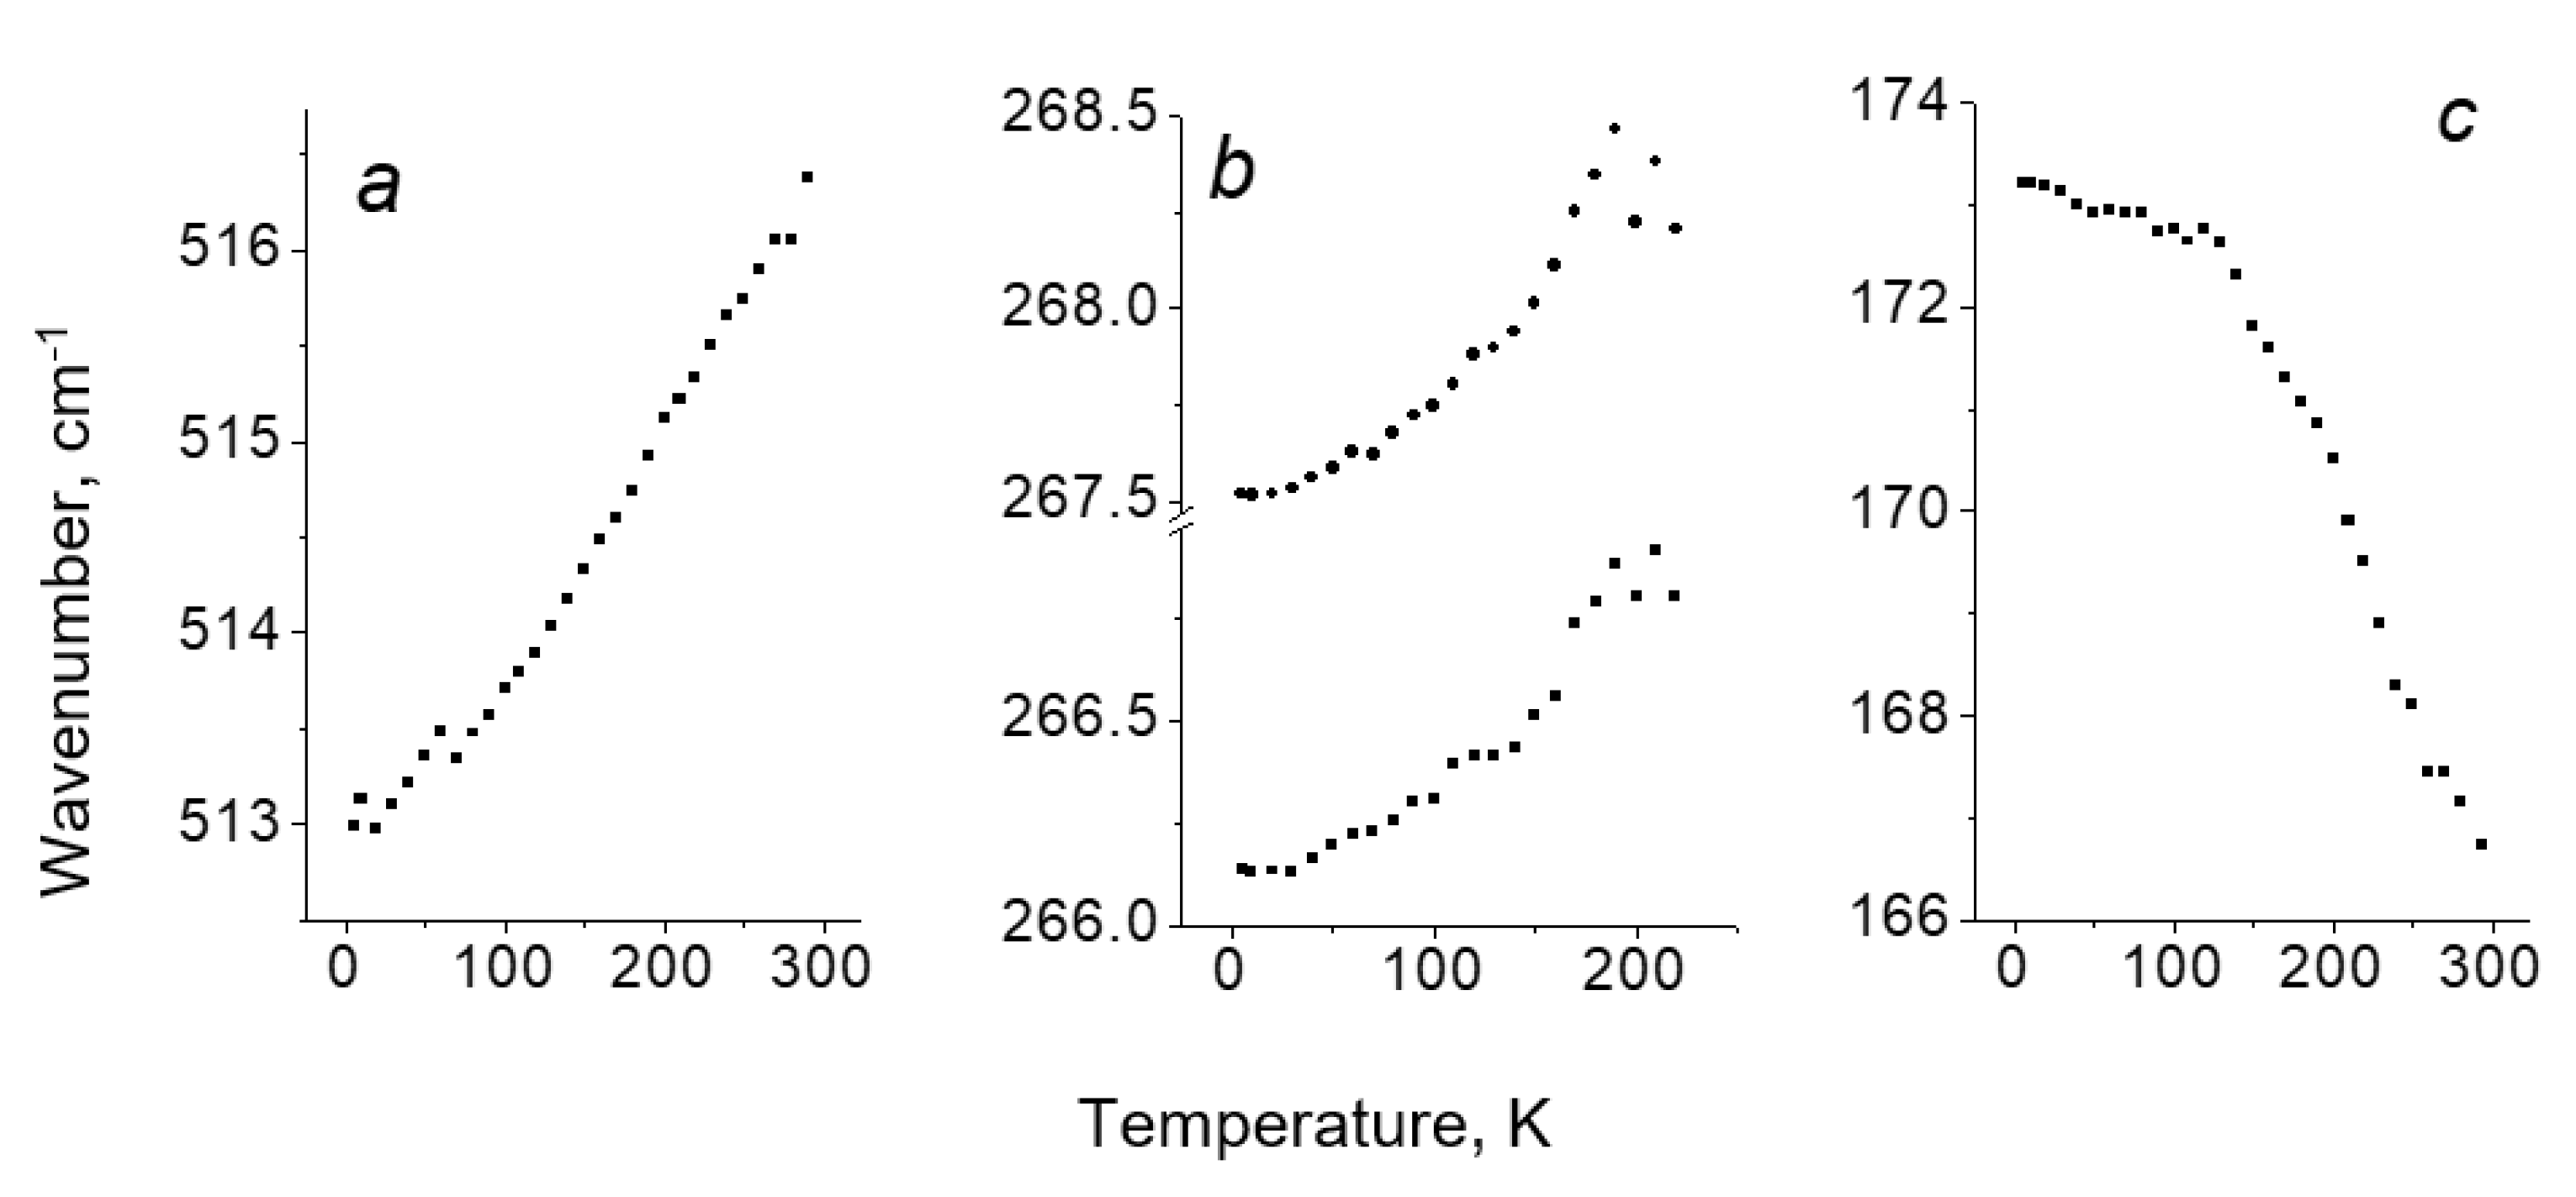
Figure 2 shows vibration wavenumber of Cl2, Br2 and I2 molecular halogens vs temperature for three different [TeX6](Y2) compounds. Vibration frequencies of ν(Cl2) (Figure 2a) and ν(Br2) (Figure 2b) decrease upon cooling down. This behavior is anomalous since, as is well known, the vibration frequency of a conventional anharmonic oscillator should increase with decreasing temperature (see, for example, Ref. [29,30]). An interpretation of the observed anomaly is another goal of the work. At the same time, the frequency of the ν(I2) mode in [TeI6](I2) (Figure 2c) shows the expected positive shift with decreasing temperature, and this difference in the temperature behavior of the vibration frequencies of the molecular halogens also needs to be interpreted.
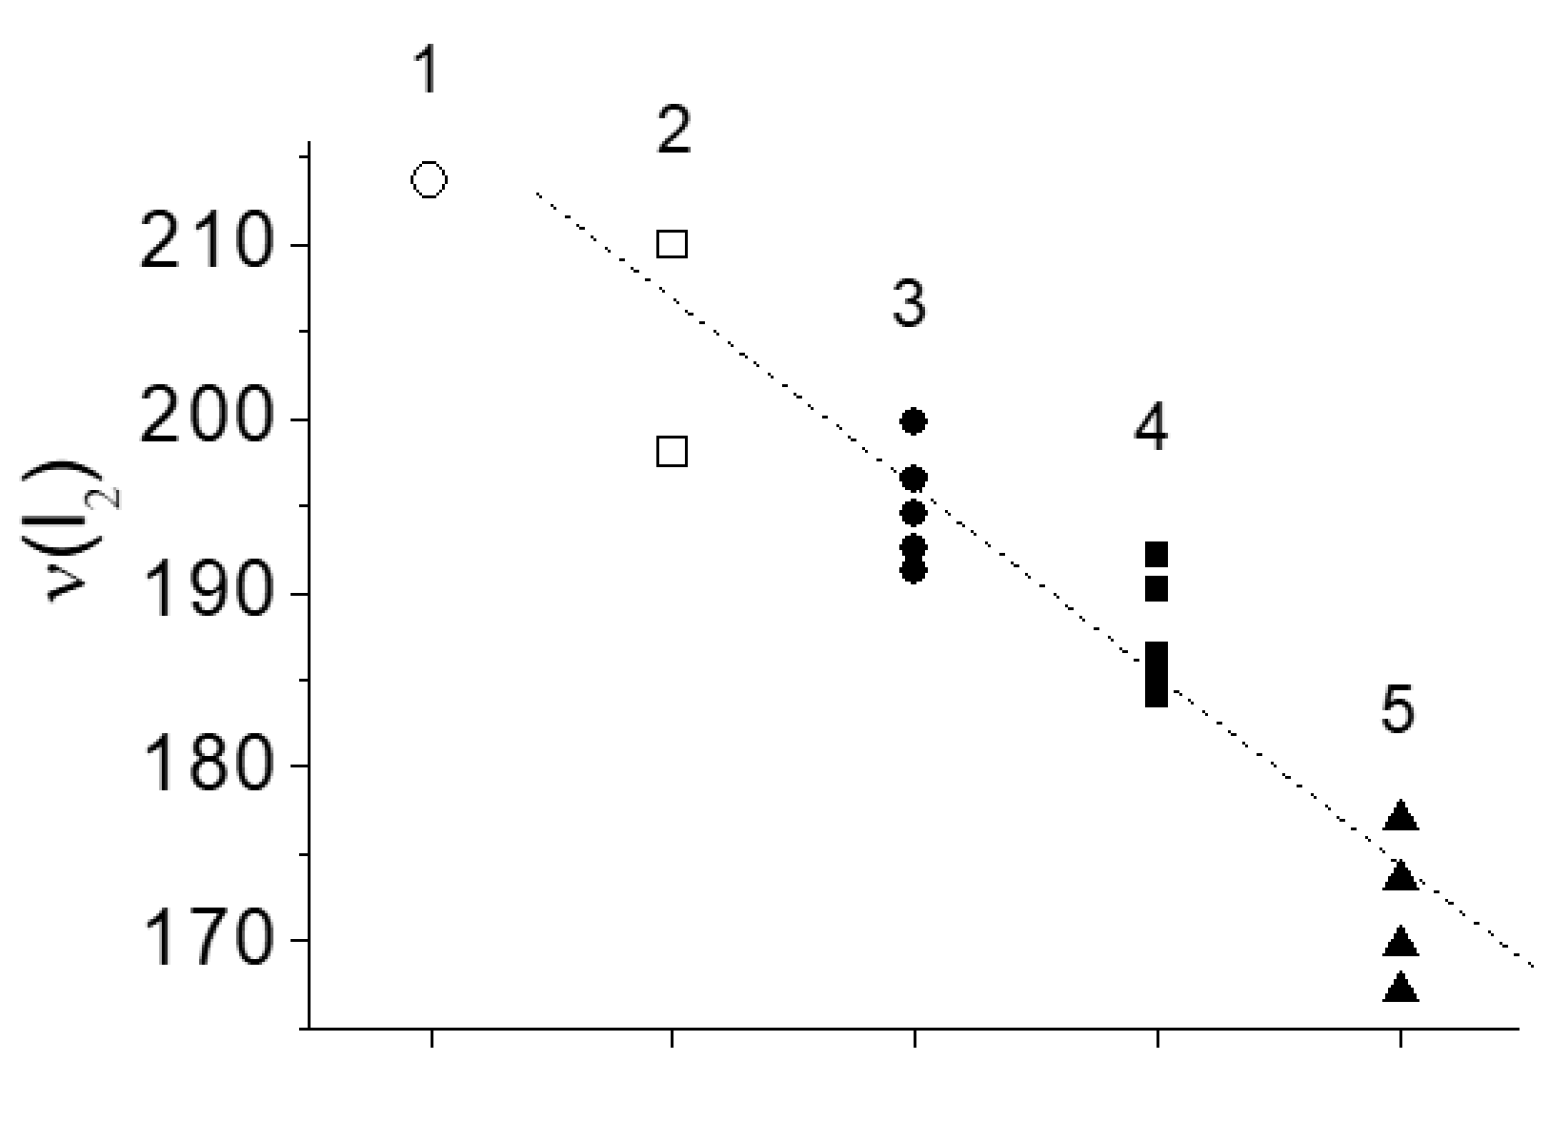
Figure 3 shows the vibration frequency of halogen dimer I2 at various contacts.To find out why the vibration frequency of I2 depends on the placement environment, it is necessary to consider the mechanism of formation of Y2 vibration frequency.
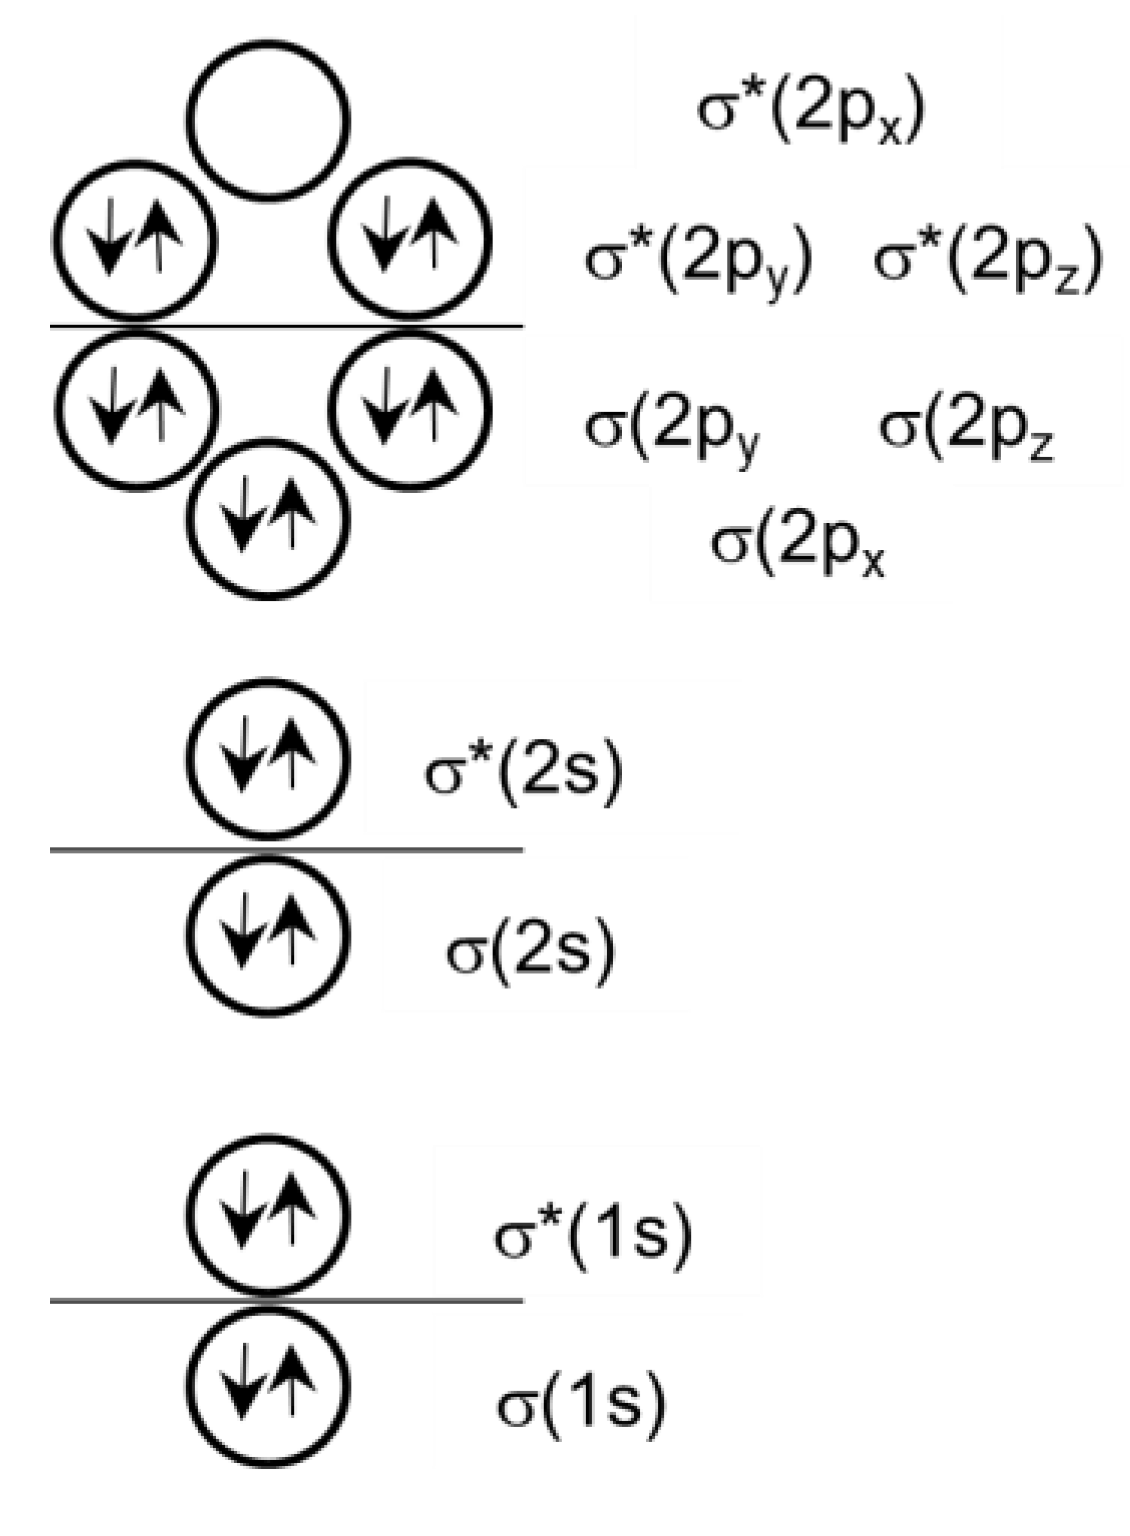
The outer electronic shell of halogen atoms is s2p5. All molecular orbitals in the Y2 molecule are occupied except for the σ*(2px) term (LUMO), which is entirely unoccupied (Figure 4). On the other hand, halogen X in the [TeX6]2− complex has a saturated outer electron shell (HOMO). Its charge state is X due to bonding with the complexing metal Te(IV) and charge migration from the counterion in the crystal lattice. An excess negative charge of the halogen atom in the [TeX6]2− complex provokes the spreading of electron density to antibonding σ*(2px) orbital of Y2. It will results in a weakening of the intramolecular Y−Y bond and a decrease in Y2 vibrational frequency.
Charge spreading to the unoccupied antibonding orbital σ*(2px) of the I2 dimer in [TeX6](I2) compounds is limited by the energy ratio of the dimer LUMO and the [TeX6]2− HOMO. The less the energy of the electronic term X in [TeX6]2− compare to the energy of σ*(2px) orbital of Y2, the smaller the charge shift to the Y2. The outer electronic shell of Cl atoms is 3s23p5. On the energy scale, these states are located significantly lower than the state of the antibonding orbital σ*(2px) of the I2 dimer, whose electronic configuration is 5s25p5. For this reason, the charge transfer from Cl to I2 in [TeCl6](I2) is negligibly small. The same, but to a lesser extent, applies to [TeBr6](I2). However, the HOMO energy of the I ion is quite comparable to the LUMO energy of the I2 dimer, and the charge spreading from I to I2 in [TeI6](I2) will be more significant than in the two previous cases. It agrees with the observed dependence of ν(I2) on the type of halogen X in the [TeX6](I2) series (Table 1, Figure 3).
Thus, the assumption of charge transfer from the surrounding cavity and from the halogen atom X in [TeX6](I2) compounds to the unoccupied orbital of the Y2 dimer is the only correct one for the interpretation of the experimental data given in Table 1 and Figure 3. Another reliable experiment confirming the proposed mechanism of interaction of halogen atoms in the contact X−Y2 is the temperature dependence of the Y2 vibrational frequency. It is presented in the next paragraph

Temperature Dependence of ν(Y2) in [TeX6](Y2)

The temperature of the crystal determines the population of the vibrational states of Y2 molecules. As the temperature decreases, the vibrations freeze out, i.e., decrease in vibrational quantum number. In an anharmonic oscillator, which is described by the 6-12 potential of Lennard-Jones, it should result in a shortening of bond lengths, i.e., Te−X, X−Y and Y−Y bond lengths in the case, and an increase in their vibration frequency (see Ref. [29,30] for details). On the other hand, the vibration frequency of Y2 should fall at the X−Y bond lengths shortening due to an increase in the population of the σ*(2px) orbital of the Y2. The compromise between these two processes determines the temperature dependence of the vibration frequency ν(Y2). It is the temperature dependence that makes it possible to determine which of the two processes, anharmonicity of vibrations or a change in the population of the antibonding σ*(2px) orbital, prevails in the temperature dependence of the ν(Y2).
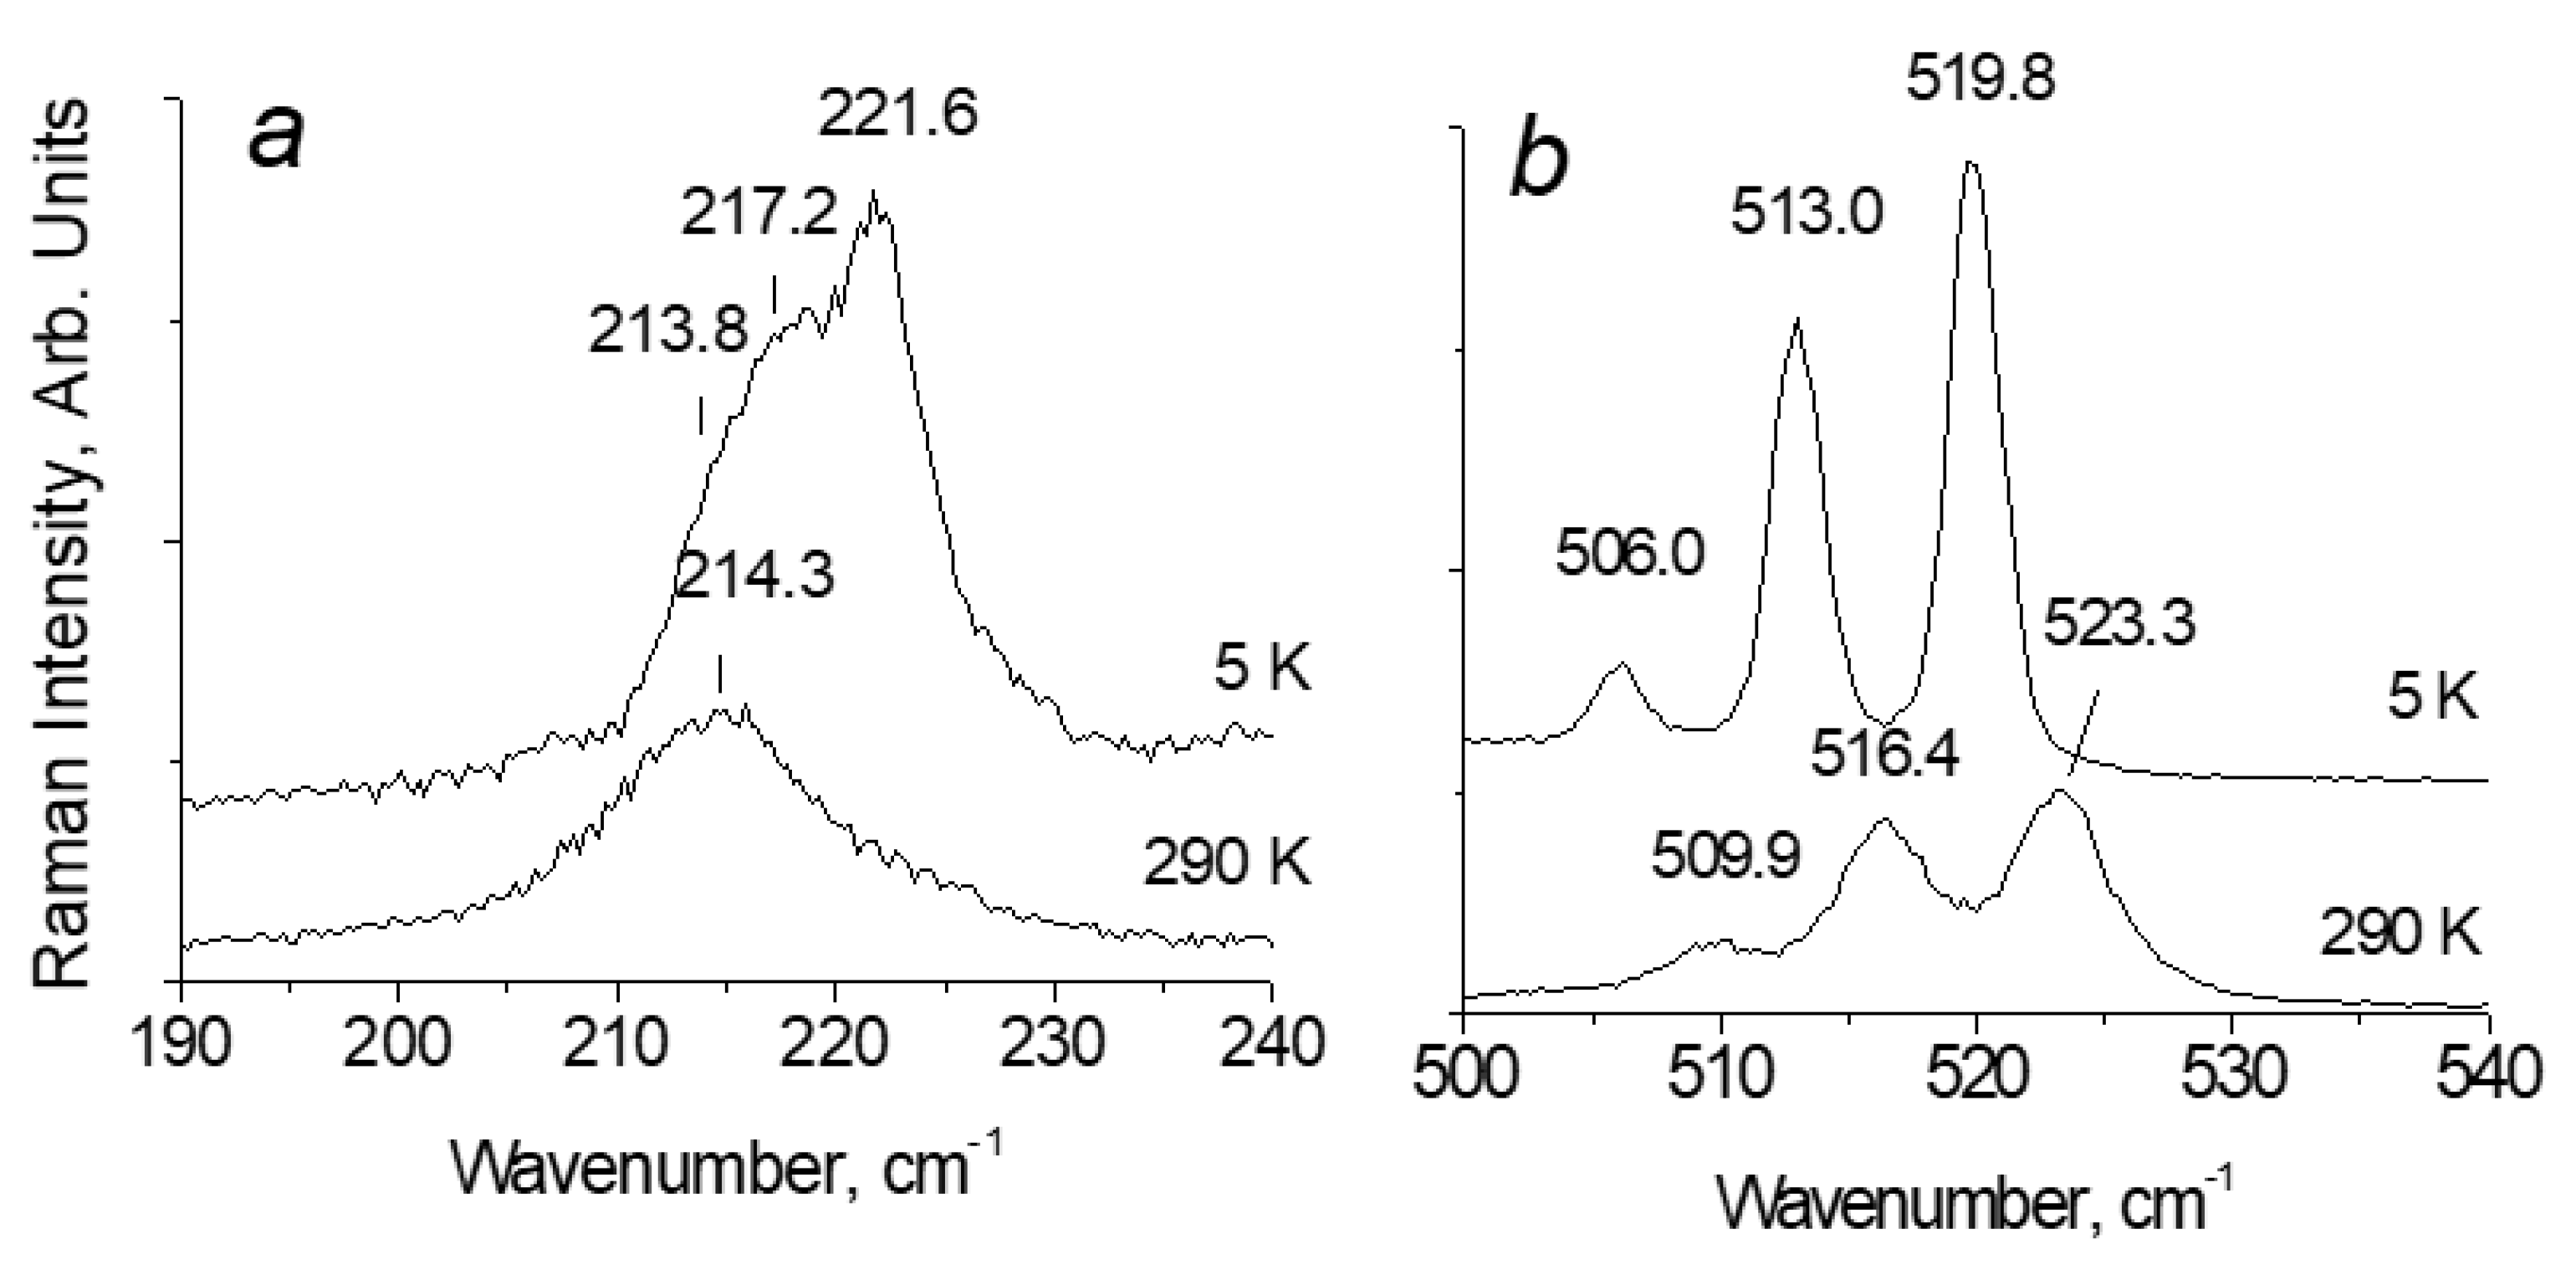
The vibration frequency of Cl2 in the lattice is about 540 cm-1 (Table 1). The population of the first exited vibrational state is negligible (about 0.08 at room temperature). In other words, in the temperature range 5 K – 300 K, only a transition from the zero vibrational state to the first excited state is observed in the vibrational spectrum and the anharmonic contribution to the frequency of the Cl2 stretching vibration does not change with temperature. At the same time, the frequency of translational modes of the Cl2 dimer is much lower, about 220 cm-1 (Figure 5), and the population of the first excited state of this mode is 0.5 – 0.6 at room temperature. Consequently, its freezing will affect the length of Cl−Cl2 and the population of the σ*(2px) orbital of Cl2. For this reason, the ν(Cl2) stretching mode shows a strong decrease in the range of 5 K – 300 K compared to ν(Br2) and ν(I2) (Figure 2).
Figure 5 shows the spectra of the compound [TeCl6](Cl2) at 5 K and 290 K in the frequency range of stretching (around 500 cm-1) and translational (around 200 cm-1) vibrations of Cl2. The splitting of the band of stretching and translational vibrations of Cl2 into three components is associated with the isotopic composition of chlorine and makes their assignment reliable. The ratio of the natural content of the heavy isotope 37Cl and the light isotope 35Cl can be taken with sufficient accuracy as 0.25:0.75. In this case, the number of pairs with heavy, mixed composition and light isotopes in the crystal should be in a ratio of 1 16 : 6 16 : 9 16 . The observed ratio of the integral intensities of the three translation and three stretching modes corresponds with the calculated values with great accuracy. To indicate the frequency of Cl2 vibration we will use the peak position of the mid mode.
It can be seen that if the wavenumber of the intramolecular mode of Cl2 decreases from 516 cm-1 at 290 K to 513 cm-1 at 5 K, then the wavenumber of the translational mode of Cl2 increases from 214 cm-1 to 217 cm-1 at the same temperature range, which confirms the above assignment of the temperature dependence of vibration frequencies. In other words, these results highlight that strengthening of intermolecular interactions [TeX6]2− − Y2 provokes to weakening of intramolecular bonds.
However, in all [TeI6](I2) species, the ν(I2) increases at cooling down (Figure 2 c). This means that the contribution of charge transfer from [TeI6]2− to the antibonding orbital of the I2 dimer either changes very little or even decreases with decreasing temperature in contrary to a similar process in [TeCl6](Cl2) and [TeBr6](Br2). This effect should not be confused with the composition dependence (Figure 3) obtained at room temperature only. This somewhat unusual result can be understood if we take into account the parameters of the halogen atoms. The empirical atomic radius of iodine (1.4 Å) is significantly larger than that of Br (1.15 Å) and Cl (1.0 Å) atoms. It means probably that bromine and chlorine atoms can track the anharmonic shortening of the Te-X bond lengths in the [TeX6]2− octahedron at cooling down. Still, iodine atoms cannot do it because of their large size and an emergence of steric hindrance.
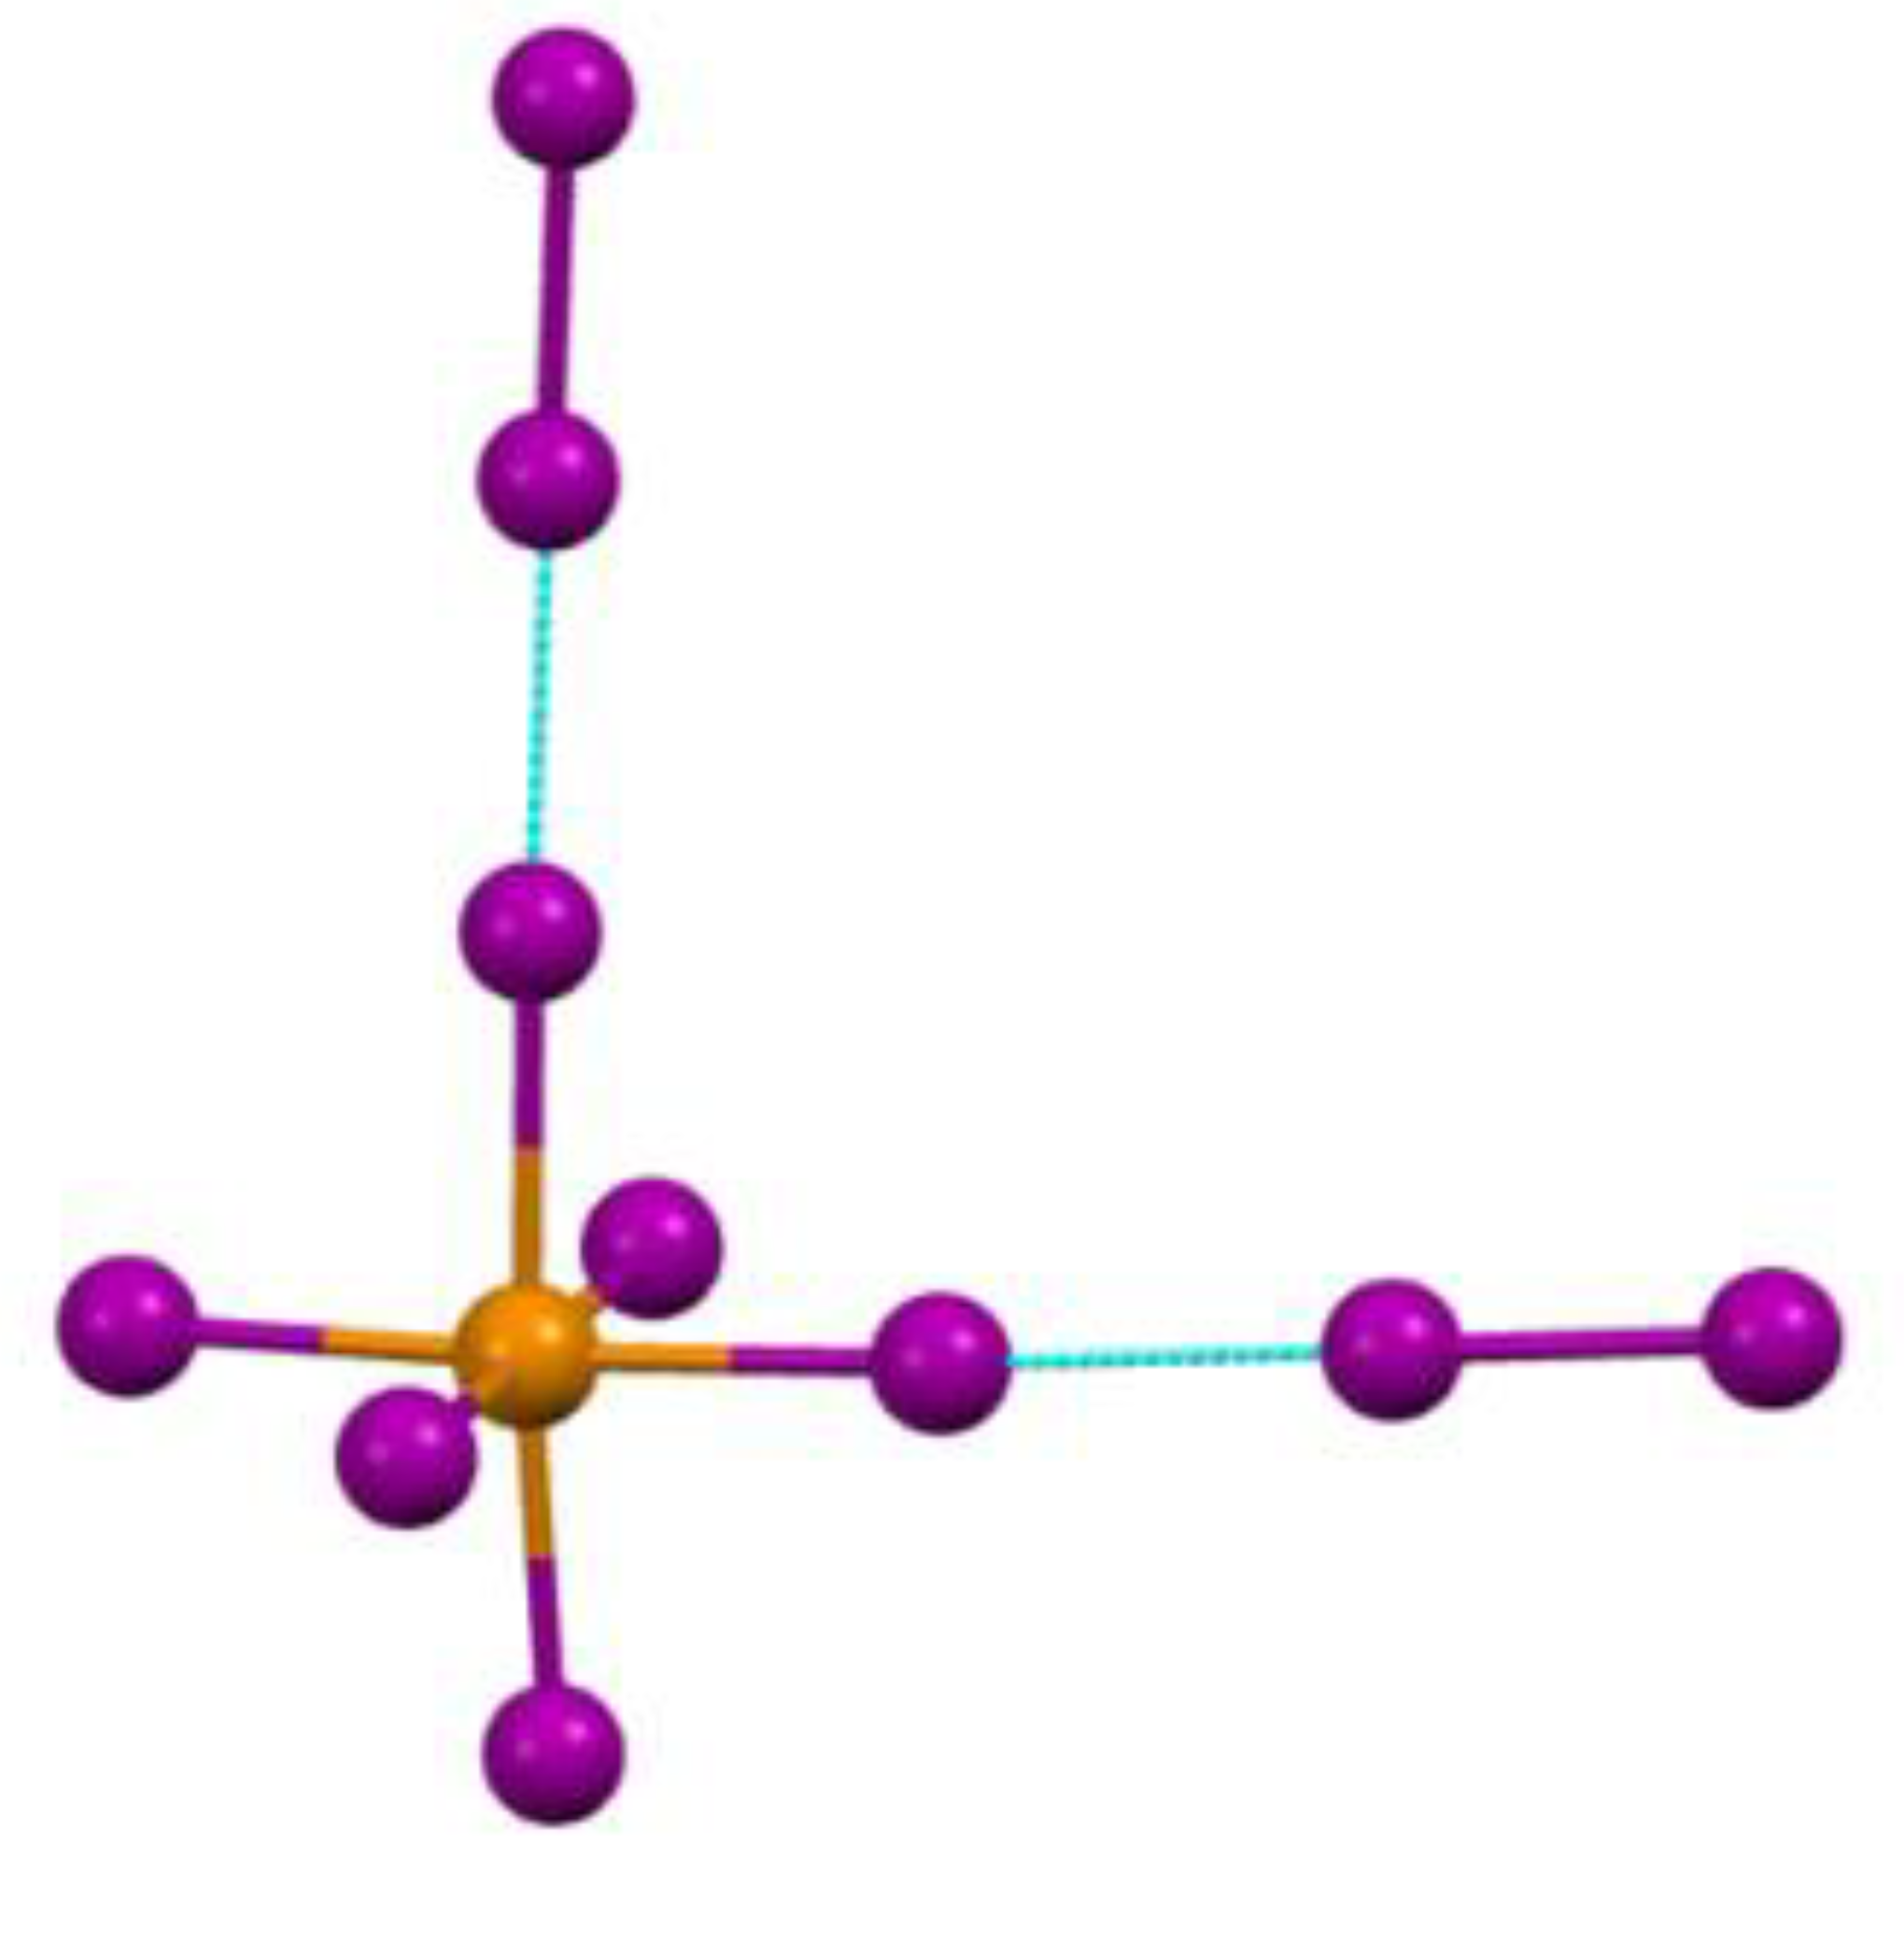
Of the six Te−X bonds, the maximum effect from steric restrictions will be obtained by the two weakest Te−X bonds, the halogen atoms of which have additional bonds with neighboring Y2 dimers. (Figure 6, which shows a fragment of the crystal structure).
It is these two bonds of the complex that will not be able to respond to a decrease in temperature, and the charge acquired by the corresponding iodine atoms during interaction with Te(IV) may either not change or even decrease with decreasing temperature, just like the charge transferred from these two I to the antibonding orbital I2. At the same time, the population of the I2 vibrational mode drops from 0.8 at room temperature to 0.0 at 5 K, suggesting a noticeable anharmonic effect. This explains the difference in the temperature behavior of the ν(Y2) in [TeI6](I2) compared to [TeCl6](Cl2) and [TeBr6](Br2) (Figure 2).
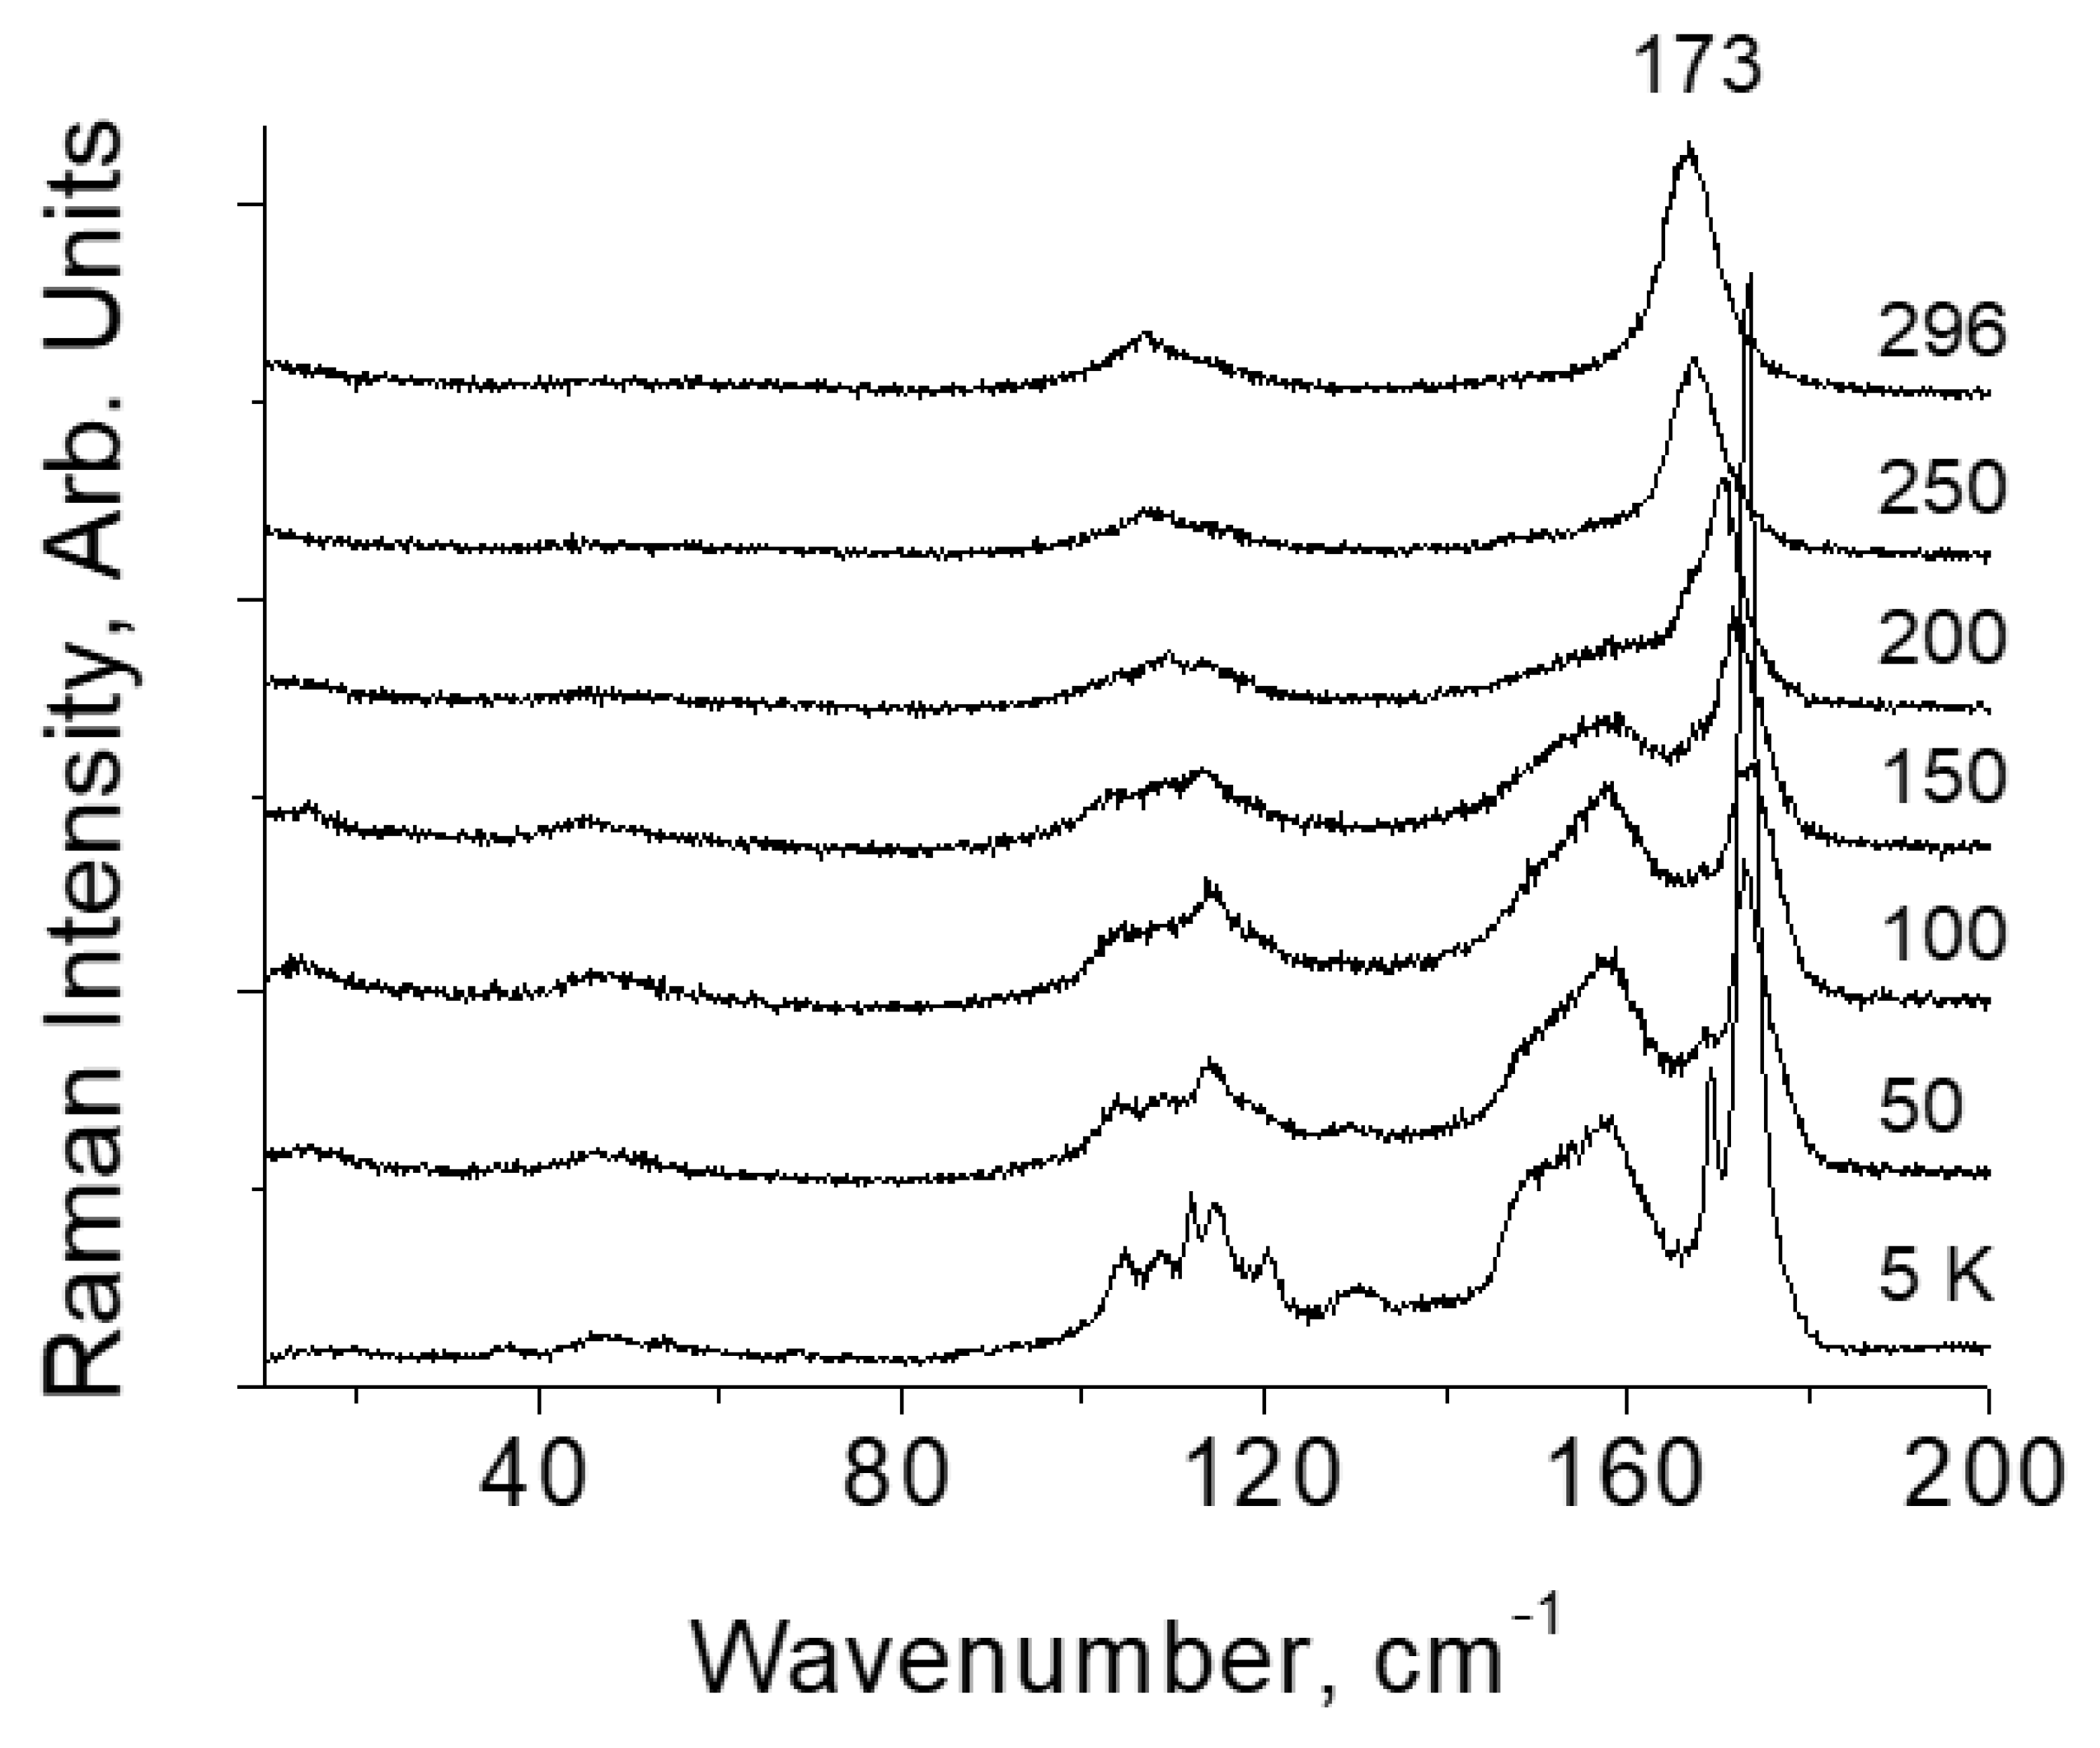
The assumption of steric hindrance in the [TeI6]2− octahedron is confirmed experimentally. Figure 7 shows the spectra of [TeI6](I2) at various temperatures. In the low-temperature spectrum, two packets of vibrational modes are observed, i.e., in the region of 110 cm-1 and 160 cm-1. The first of them relates to Raman-active (symmetric), and the second to IR-active (asymmetric) vibration modes of the [TeI6]2− octahedron [31]. Asymmetric modes arise in the spectrum at T < 200 K. The arising of vibrations forbidden in the Raman spectrum means a distortion of the octahedron, in which various (short and long) Te–I bonds appear in the structure. This phenomenon is not observed in [TeCl6](Cl2) and [TeBr6](Br2).

Halogen Crystals Cl2, Br2, I2

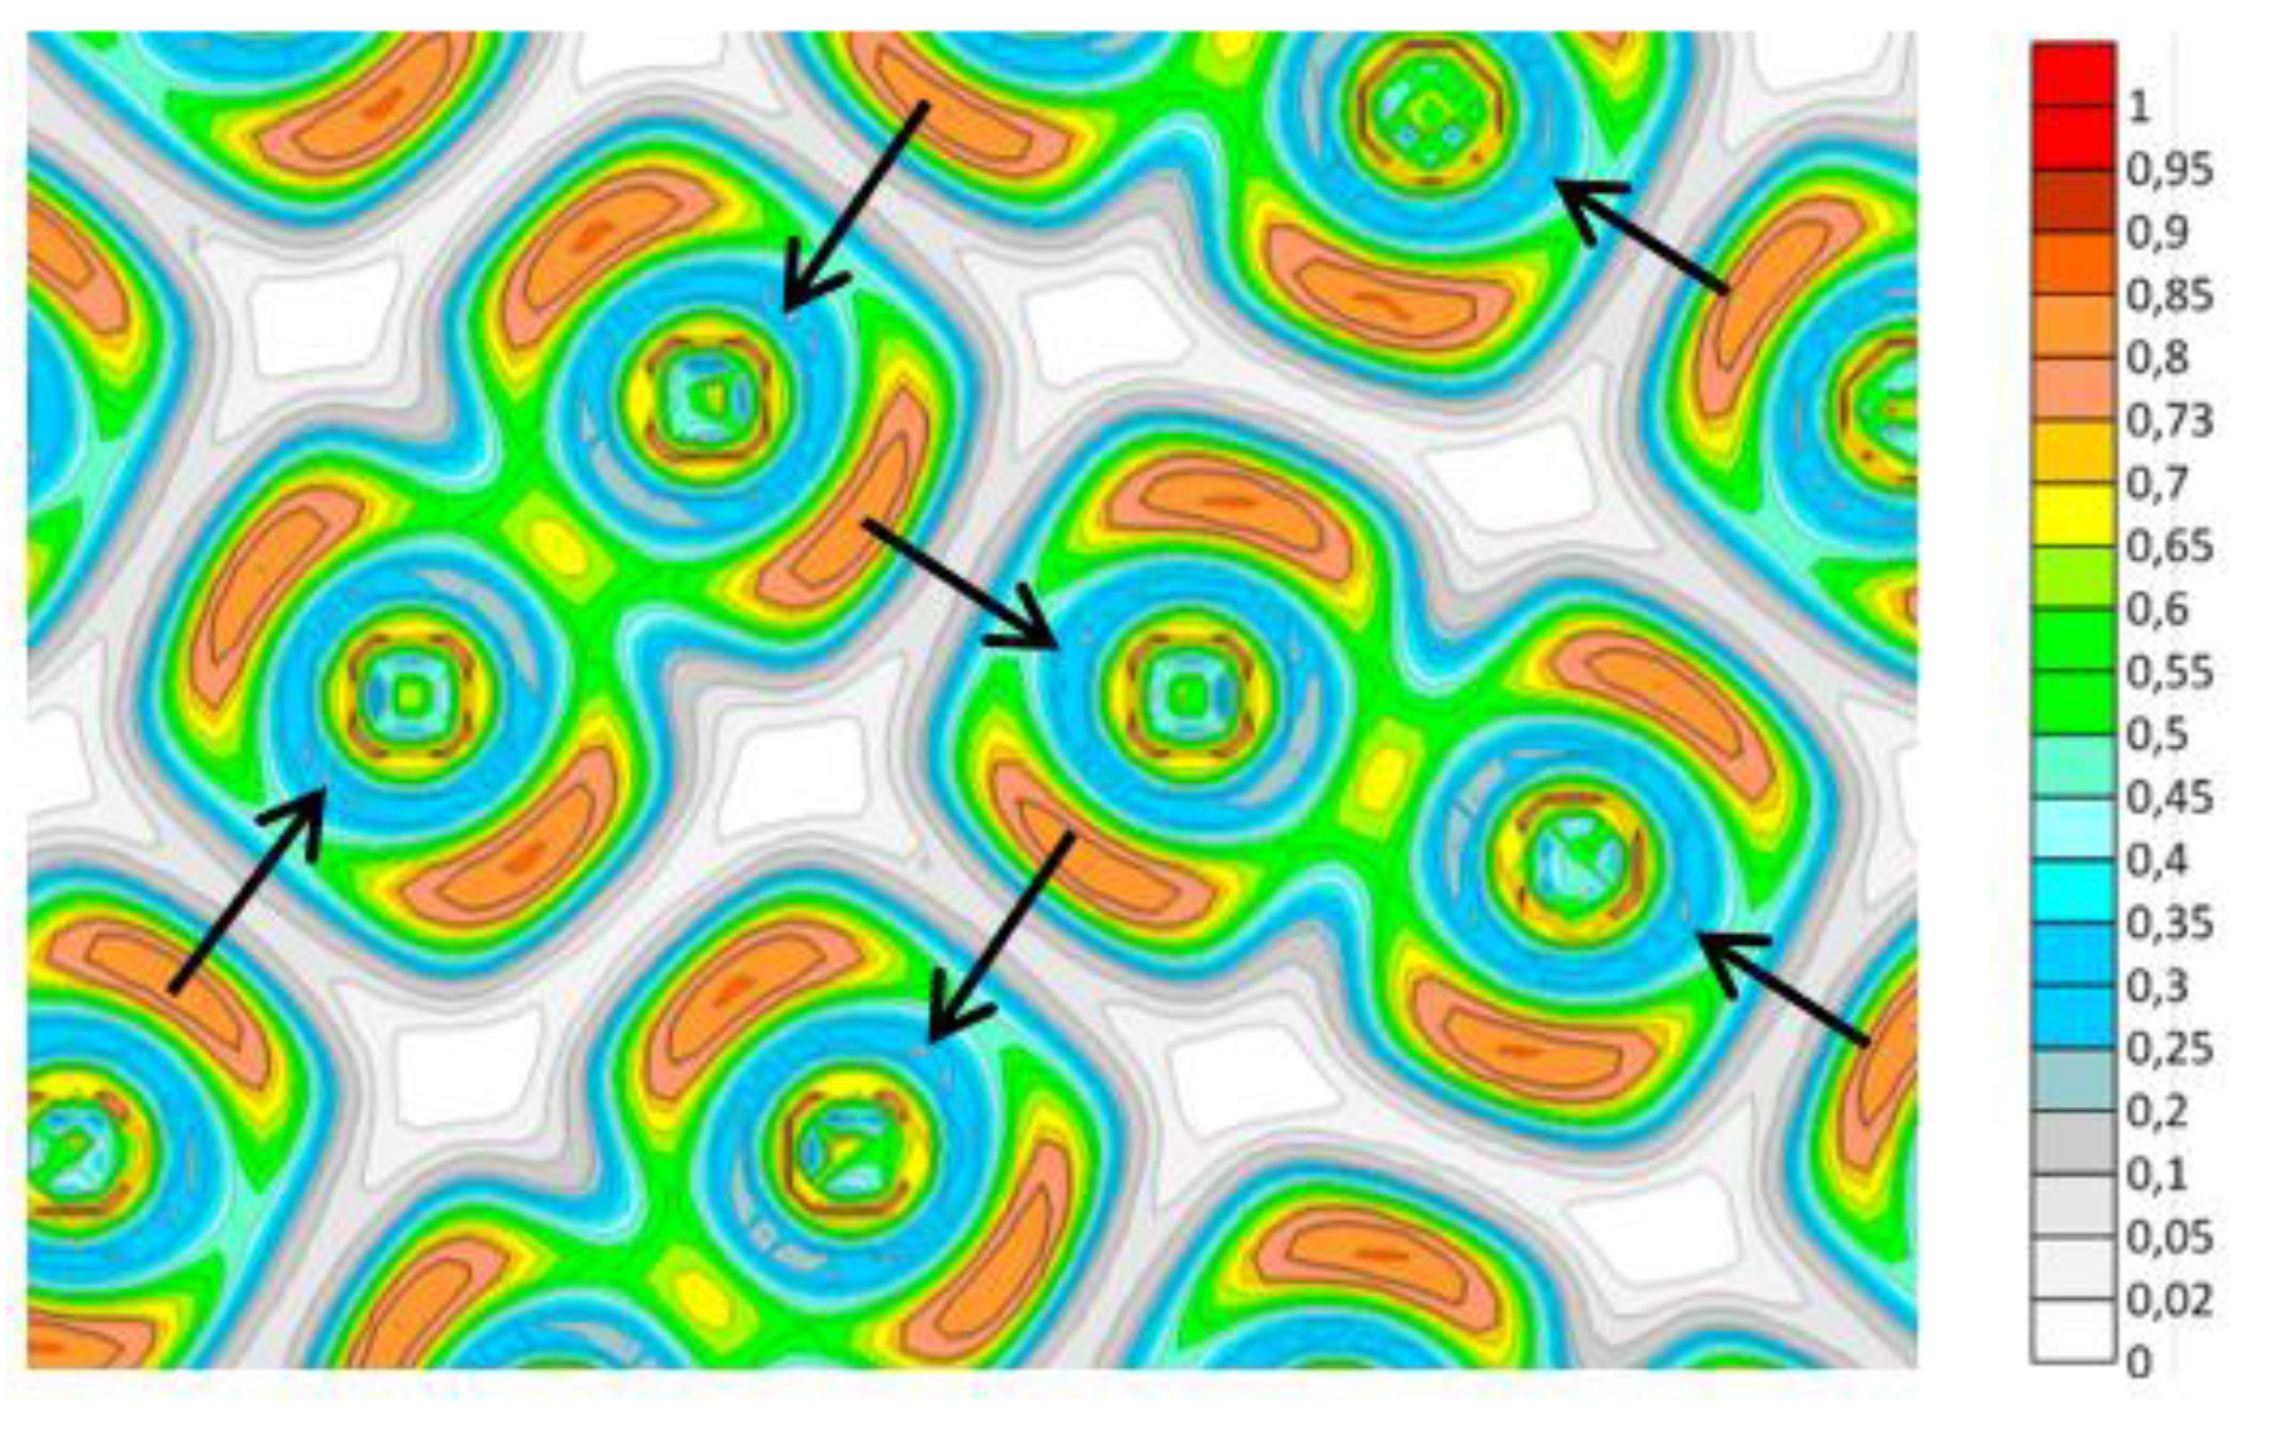
The crystal structures of the halogens Cl2, Br2, and I2, as well as chalcogens, for example, O2, are very similar between them. Figure 8 shows the layout of I2 molecules in the plane of the I2 crystal and the value of the electron localization function calculated in [7].
As mentioned above, the LUMO of the I2 molecule is σ*(2px), and HOMO is π*(2py, 2pz). I2 molecules are located in the crystal relative to each other in such a way that the occupied π*(2py) orbital of each molecule can interact with the unoccupied σ*(2px) orbital of the neighboring molecule (shown by arrows in Figure 8). This interaction is more substantial the lower the temperature of the crystal. For this reason, the frequency of the I2 stretching vibration decreases slightly with decreasing temperature (Figure 3 in Ref. [7]) even despite the decrease in the anharmonic contribution.
Intermolecular interaction in halogen crystals is much weaker than intramolecular ones. In other words, the spring that characterizes intermolecular interaction is much weaker than the spring that determines intramolecular bonding. In an experiment with external pressure, at low pressure, the weak spring compresses first, and then, after a certain threshold (3–5 GPA), when the resource for shortening the intermolecular distance ends, the firm spring of the intramolecular bond begins to compress. But the first of the two processes is a decrease in frequency ν(I2), and the second one is its increase. Such a nonmonotonic dependence of ν(I2) in I2 crystals was obtained experimentally and in calculations [7]. A similar effect was observed also in solid oxygen O2 (see Figure 3 in Ref. [32]). This is unsurprising, since the crystal structure of halogens and chalcogens as well as population of their molecular orbitals are very similar. Thus, the observed effects in both types of crystals, I2 and O2, with changes in temperature or pressure, are in good agreement with the model of intermolecular interaction proposed in this work.

Valent or Non-Valent Bonding?

All experimentally observed phenomena given above are interpreted from the point of view of the interaction of molecular orbitals, i.e., traditional chemical (valent) interaction.
The definition of halogen bonding (see above) does not include the possibility of electron density spreading from one halogen atom to another. If, however, such spreading occurs, then the halogen bonding will not differ from an ordinary (valent) chemical bonding. The dependences of the Y2 vibration frequency on temperature (Figure 2) and composition (Figure 3) are formed when the population of the antibonding σ*(2px) orbital of the molecular halogen changes. The latter occurs due to the spreading of electron density from X to σ*(2px) orbital of Y2, which is possible with valent bonding. Hence, the presented experimental data cannot be implemented within the halogen bonding concept.

Conclusion

The assignment of the vibrational spectra of halogen atoms at the X−Y2 contact or in the Y2 crystals on the basis of traditional chemical (valent) interaction is quite successful and reasonable, and there is no need to introduce an additional halogen bonding. On the other hand, this work concerns only a very limited number of chemical compounds containing halogen atoms, and it is not excluded that there exist such compounds where the bonding between halogen atoms can be realized only under the condition of interaction of nucleophilic and electrophilic fragments.
The work may be useful in the design of new materials, as well as in the study of biomolecular and functional systems.

References

  1. Umeyama, H.; Morokuma, K. The origin of hydrogen bonding. An energy decomposition study. J. Am. Chem. Soc. 1977, 99, 1316–1332. [Google Scholar] [CrossRef]
  2. Desiraju, G.R.; Ho, P.S.; Kloo, L.; Legon, A.C.; Marquardt, R.; Metrangolo, P.; Politzer, P.; Resnati, G.; Rissanen, K. Pure Appl Chem. 2013, 85, 1711–1713. [Google Scholar] [CrossRef]
  3. Cavallo, G.; Metrangolo, P.; Milani, R.; Pilati, T.; Priimagi, A.; Resnati, G.; Terraneo, G. The Halogen Bond. Chem. Rev. 2016, 116, 2478–2601. [Google Scholar] [CrossRef]
  4. Yi Wang; Xinrui Miao; Wenli Deng. Halogen Bonds Fabricate 2D Molecular Self-Assembled Nanostructures by Scanning Tunneling Microscopy. Crystals 2020, 10, 1057. [Google Scholar] [CrossRef]
  5. Takemura Kenichi; Sato Kyoko; Fujihisa Hiroshi; Onoda Mitsuko. Modulated structure of solid iodine during its molecular dissociation under high pressure. NATURE, 2003, 423, 971–974. [Google Scholar] [CrossRef]
  6. 6. Min Wu; John S Tse; Yuanming Pan. Anomalous bond length behavior and a new solid phase of bromine under pressure. Scientific Reports. [CrossRef]
  7. Yushina, I.D.; Kolesov, B.A. Interplay of Intra- and Intermolecular Interactions in Solid Iodine at Low Temperatures: Experimental and Theoretic Spectroscopy Study. J. Phys. Chem. A 2019, 123, 4575–4580. [Google Scholar] [CrossRef]
  8. Dingdi Wang; Haijing Zhang; William W. Yu; Zikang Tang. Thermal Evolution of One-Dimensional Iodine Chains. J. Phys. Chem. Lett. 2017, 8, 2463–2468. [Google Scholar] [CrossRef]
  9. Aggarwal, R.L.; Farrar, L.W.; Di Cecca, S.; Jeys, T.H. Raman spectra and cross sections of ammonia, chlorine, hydrogen sulfide, phosgene, and sulfur dioxide toxic gases in the fingerprint region 400-1400 cm−1. AIP Advances 2016, 6, 025310. [Google Scholar] [CrossRef]
  10. Gill, E.B.; Steele, D. The Raman spectrum of liquid chlorine. MolecularPhysics: An International Journal at the Interface Between Chemistry and Physics. [CrossRef]
  11. Cahill, J.E.; Leroi, G.E. Raman Spectra of Solid Chlorine and Bromine. J. Chem. Phys. 1969, 51, 4514. [Google Scholar] [CrossRef]
  12. Dah-Min Hwang; Hua Chang. Observation of Anti-Stokes Resonance Raman Signals of Gaseous Bromine with 5145 Å Excitation. J. Chinese Chem. Soc. 1979, 26, 1–4. [CrossRef]
  13. Stammreich, H. The Raman Spectrum of Bromine. Phys. Rev. [CrossRef]
  14. Branigan, E.T.; van Staveren, M.N.; Apkarian, V.A. Janda K. Chem. Phys. 2010, 2010132(4), 044503. [Google Scholar] [CrossRef]
  15. Branigan, E.T.; Halberstadt, N.; Apkarian, V.A. Solvation dynamics through Raman spectroscopy: Hydration of Br2 and Br3−, and solvation of Br2 in liquid bromine. J. Chem. Phys. 2011, 134, 174503. [Google Scholar] [CrossRef]
  16. Felmy, H.M.; Clifford, A.J.; Schafer Medina, A.; Cox, R.M.; Wilson, J.M.; Lines, A.M.; Bryan, S.A. On-Line Monitoring of Gas-Phase Molecular Iodine Using Raman and Fluorescence Spectroscopy Paired with Chemometric Analysis. Environ. Sci. Technol. 2021, 55, 3898–3908. [Google Scholar] [CrossRef]
  17. Huong, P.V. Raman spectra and structure of iodine and bromine intercalated fullerenes C60 and C70. Solid State Comm., 1993, 88, 23–26. [Google Scholar] [CrossRef]
  18. Wenhao Guo; Dingdi Wang; Juanmei Hu; Z. K. Tang; Shengwang Du. Raman spectroscopy of iodine molecules trapped in zeolite crystals. Appl. Phys. Lett. 2011, 98, 043105. [Google Scholar] [CrossRef]
  19. Magana, J.R.; Lannin, J.S. Role of density in Raman scattering of iodine. Phys. Rev. B, 1988, 37, 2475–2482. [Google Scholar] [CrossRef]
  20. Usoltsev, A.N.; Adonin, S.A.; Kolesov, B.A.; Novikov, A.S.; Fedin, V.P.; Sokolov, M.N. Opening the third century of polyhalide chemistry: Thermally stable complex with “trapped” dichlorine. Chem. Eur. J. 2020, 26, 13776–13778. [Google Scholar] [CrossRef]
  21. Usoltsev, A.N.; Korobeynikov, N.A.; Kolesov, B.A.; Novikov, A.S.; Samsonenko, D.G.; Fedin, V.P.; Sokolov, M.N.; Adonin, S.A. Rule, Not Exclusion: Formation of Dichlorine-Containing Supramolecular Complexes with Chlorometalates(IV). Inorganic Chemistry 2021, 60, 4171–4177. [Google Scholar] [CrossRef]
  22. Korobeynikov N., A. , Usoltsev A.N. Sokolov M.N., Novikov A.S., Adonin S.A., Polymeric polyiodo-chlorotellurates(IV): new supramolecular hybrids within the halometalate chemistry. [CrossRef]
  23. Usoltsev, A.N.; Adonin, S.A.; Abramov, P.A.; Novikov, A.S.; Shayapov, V.R.; Plyusnin, P.E.; Korolkov, I.V.; Sokolov, M.N.; Fedin, V.P. 1D and 2D polybromotellurates (IV): structural studies and thermal stabilityEur. Eur. J. Inorg. Chem. 2018, 3264–3269. [Google Scholar] [CrossRef]
  24. Novikov, A.V.; Usoltsev, A.N.; Adonin, S.A.; Bardin, A.A.; Samsonenko, D.G.; Shilov, G.V.; Sokolov, M.N.; Stevenson, K.J.; Aldoshin, S.M.; Fedin, V.P.; Troshin, P.A. Tellurium complex polyhalides: narrow bandgap photoactive materials for electronic applications. J. Mater. Chem. A, 2020, 8, 21988. [Google Scholar] [CrossRef]
  25. Kiriyama, H.; Nishizaki, K. Crystal structure and molecular motion of tetramethylammonium hexaiodotellurate(IV)-iodine (1/1) compound. Bull. Chem. Soc. Jpn., 1986, 59, 2415–2419. [Google Scholar] [CrossRef]
  26. Adonin, S.A.; Usoltsev, A.N.; Novikov, A.S.; Kolesov, B.A.; Fedin, V.P.; Sokolov, M.N. One- and Two-Dimensional Iodine-Rich Iodobismuthate(III) Complexes: Structure, Optical Properties, and Features of Halogen Bonding in the Solid State. Inorg. Chem. 2020, 59, 3290–3296. [Google Scholar] [CrossRef] [PubMed]
  27. Usoltsev, A.N.; Korobeynikov, N.A.; Novikov, A.S.; Plyusnin, P.E.; Kolesov, B.A.; Fedin, V.P.; Sokolov, M.N.; Adonin, S.A. One-dimensional diiodine–iodobismuthate(III) hybrids cat3{[Bi2I9](I2)3}: Syntheses, stability, and optical properties. Inorganic Chemistry 2020, 59, 17320–17325. [Google Scholar] [CrossRef] [PubMed]
  28. Usoltsev, A.N.; Korobeynikov, N.A.; Novikov, A.S.; Shayapov, V.R.; Korolkov, I.V.; Samsonenko, D.G.; Fedin, V.P.; Sokolov, M.N.; Adonin, S.A. One-Dimensional Supramolecular Hybrid Iodobismuthate (1-EtPy)3{[Bi2I9](I2)0.75}: Structural Features and Theoretical Studies of I⋅⋅⋅I Non-Covalent Interactions. Journal of Cluster Science 2021, 32, 787–791. [Google Scholar] [CrossRef]
  29. Kolesov, B.A. , Experimental determination of vibrational anharmonic contributions. J. Raman Spectrosc. 2013, 44, 1786–1788. [Google Scholar] [CrossRef]
  30. Kolesov B., A. How the vibrational frequency varies with temperature. J. Raman Spectrosc. 2017, 48, 323–326. [Google Scholar] [CrossRef]
  31. Vazquez-Fernandez, I.; Mariotti, S.; Hutter, O.S.; Birkett, M.; Veal, T.D.; Hobson, T.D.C.; Phillips, L.J.; Danos, L.; Nayak, P.K.; Snaith, H.J.; Wei Xie; Sherburne M. P.; Asta M.; Durose K. Vacancy-Ordered Double Perovskite Cs2TeI6 Thin Films for Optoelectronics. Chem. Mater. 2020, 32, 6676–6684. [Google Scholar] [CrossRef]
  32. Akahama, Y.; Kawamura, H. High-pressure Raman spectroscopy of solid oxygen. Phys. Rev. B, 1966, 54, R15602–R15605. [Google Scholar] [CrossRef]
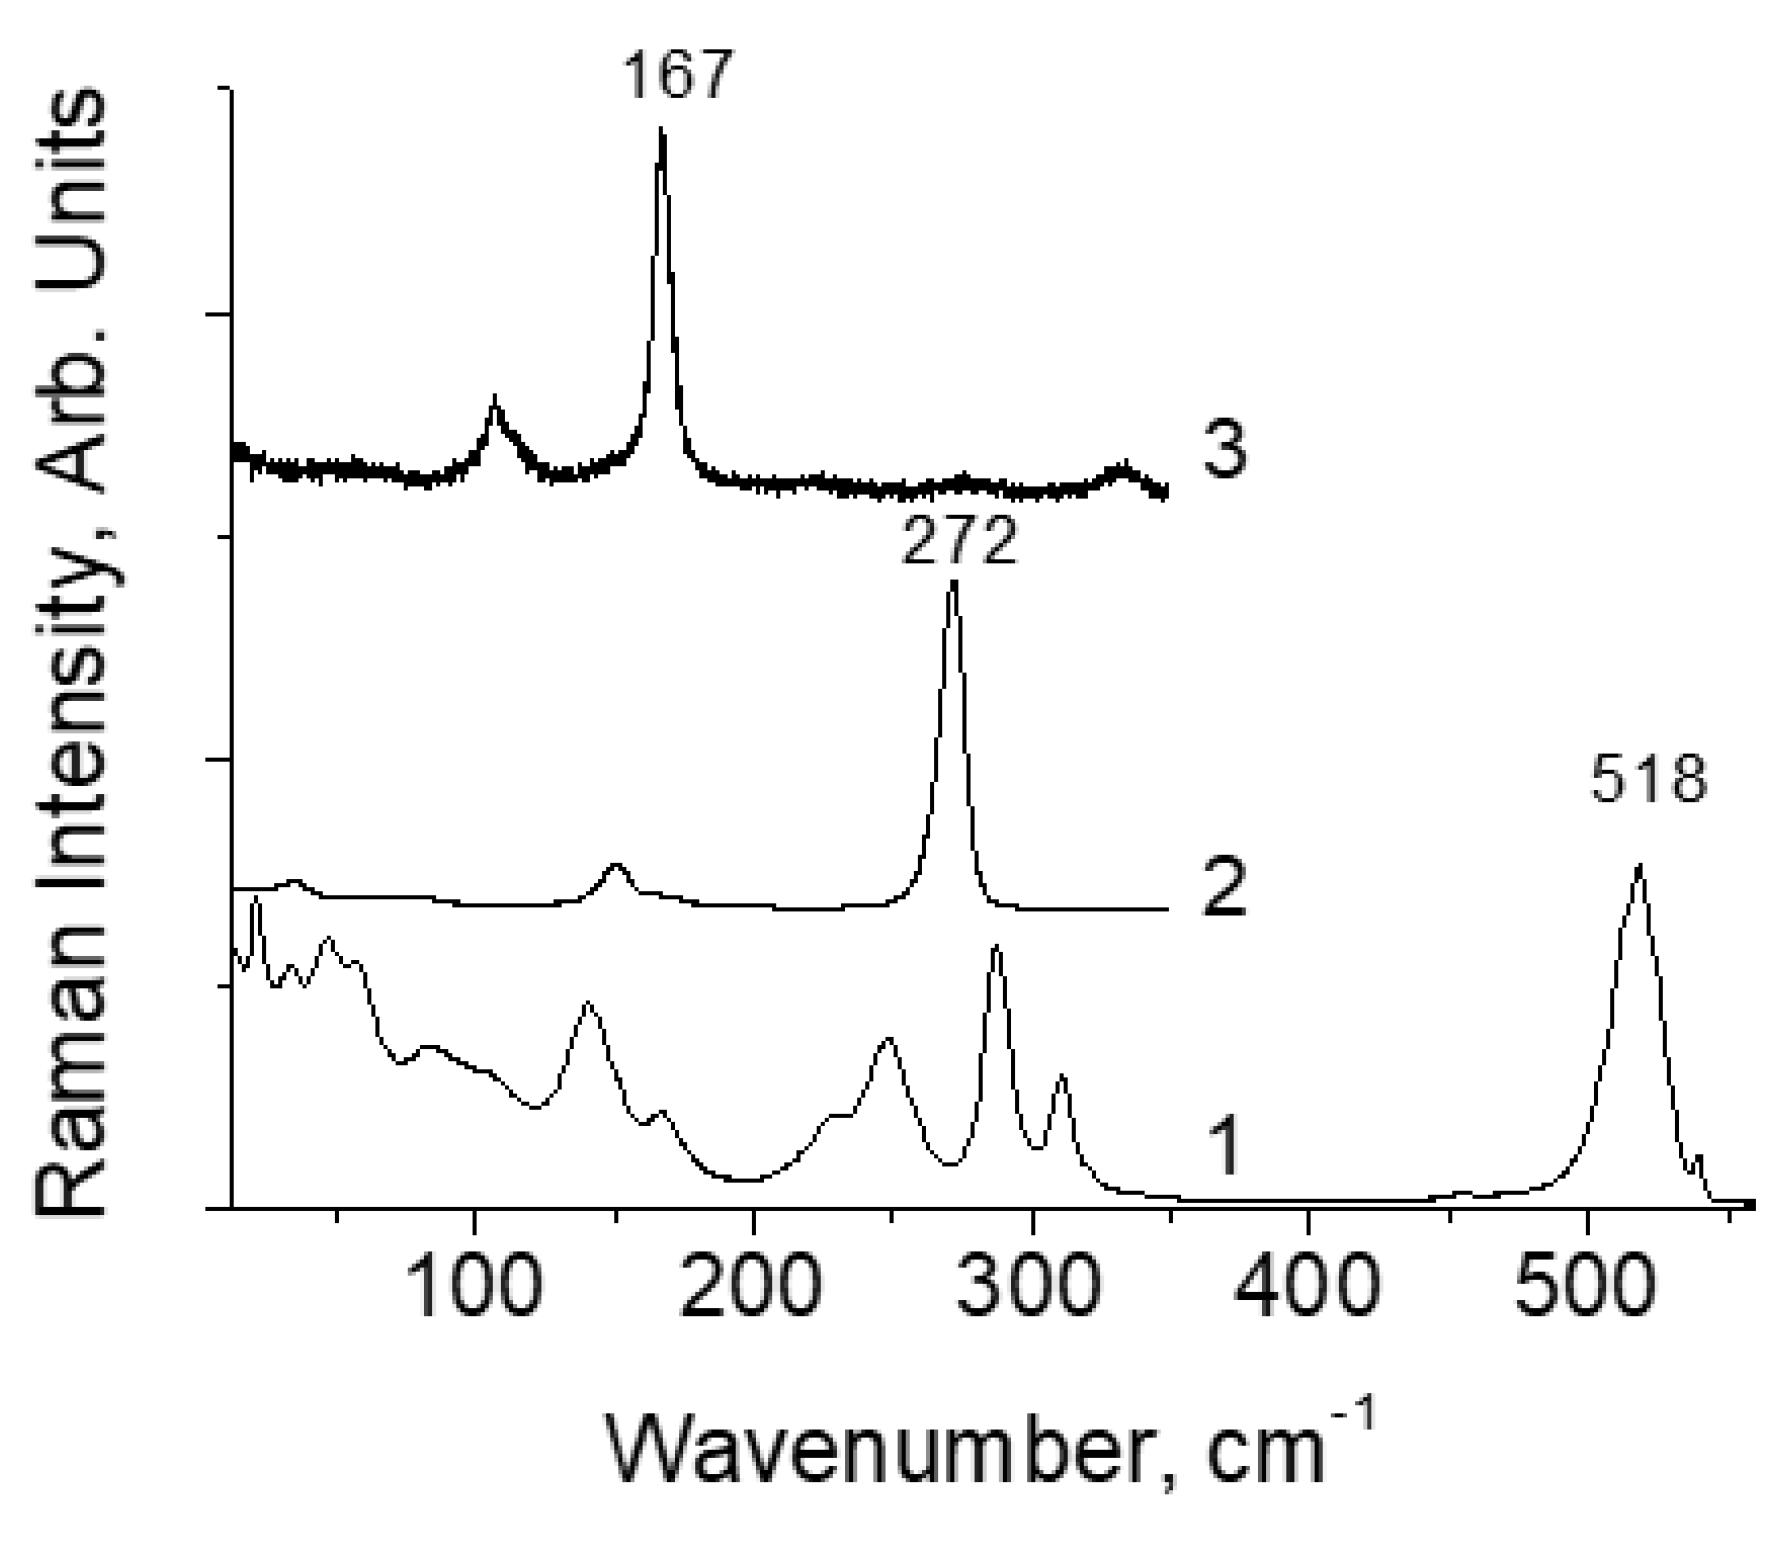
Figure 1. Raman spectra of [TeX6](Y2) compounds at room temperature. 1 − [TeCl6](Cl2), 2 − [TeBr6](Br2), 3 − [TeI6](I2).
Preprints 103832 g001
Figure 2. Peak position of the Y2 vibrational bands as a function of temperature. (a) – [TeCl6](Cl2), (b) – [TeBr6](Br2), (c) – [TeI6](I2). In the [TeBr6](Br2), two close modes are observed at 266 and 267 cm-1, which overlap at T > 220 K, and correct decomposition of the broad band into two components becomes difficult. The observation of two modes instead of one in the compound with bromine is probably due to partial disordering of the crystal lattice.
Preprints 103832 g002
Figure 3. Vibration frequency I2 vs type of contact. 1 – I2 in gas [16], 2 − I2 in cavity [17,18], 3 − [TeCl6](I2), 4 − [TeBr6](I2), 5 − [MeI6](I2) (Me – Te, Bi). The numerical data are taken from Table 1. The dashed line was drawn by eye.
Preprints 103832 g003
Figure 4. Orbital occupation in I2.
Preprints 103832 g004
Figure 5. Translational (a) and stretching (b) vibrations of Cl2 molecular fragment in [TeCl6](Cl2) at 5 K and 290 K.
Preprints 103832 g005
Figure 6. Fragment of [TeI6](I2) crystal structure.
Preprints 103832 g006
Figure 7. Arising of bands of forbidden vibrations of the [TeI6]2− octahedron with decreasing temperature [TeI6](I2).
Preprints 103832 g007
Figure 8. The layout of I2 molecules and distribution of values of the electron localization function in the I2 crystal plane (from Ref. [7]). The arrows indicate the directions of the expected interaction of the π*(2py)-orbitals of the I2 with the unoccupied σ*(2px)-orbital of the neighboring molecular halogens. The axis designations refer to the internal coordinates of the molecular halogen.
Preprints 103832 g008
Table 1. Vibration frequencies of molecular halogens Y2. For Br2 and I2 in halogen crystals, two frequency values are given, ν1 (sym) and ν2 (asym). Cl2 vibrations in the spectrum are represented by three components related to different isotopic compositions; the table lists the frequency values of the mid component corresponding to the mixed composition of isotopes in Cl2. Different entries for the same compound, for example [TeBr6]I2, refer to the synthesis of that compound at different time and under different conditions.
Compound ν(Y-Y), cm-1 d(Y-Y), Å d(Y-X), Å Reference
Cl2 (Gas) 554, 547, and 539 [9]
Cl2 (Liquid) 532, 540, 547 [10]
Cl2 (Solid) 540 (15 K) [11]
Br2 (Gas) 323.2, [12]
Br2 (Cavity) 300 in C60 [13]
Br2 (Liquid) 318.6 [14]
Br2 (Solid) 297 (15 K), 302 [11,15]
I2 (Gas) 213.7 [16]
I2 (Cavity) 197-198 in C60, C70, 208-213 in zeolites [17,18]
I2 (Liquid) 204 [19]
I2 (Solid) 180, 189.7 [7]
[TeCl6]Cl2 505 2.007 2.951 [20,21]
513 2.002 3.155
498 2.006 2.98
[TeCl6]I2 191.2 2.7 3.19 [22]
196.6 2.694 3.0-3.2
196.5 2.692 3.127
192.5 2.704 3.213
194.5 2.695 3.177
[TeBr6]Br2 266.8 2.333 3.0-3.04 [23]
271.6 2.324 3.04
[TeBr6]I2 192.1 2.69 3.1-3.18 [24]
184.0 2.715 3.201
169.3 2.71 3.27
192.2 2.693 3.1
190.2 2.73-2.74 3.14-3.3
186.5 2.707 3.32
[TeI6](I2) 167.1 2.748 3.261 [25]
[BiI6](I2) 173.5 2.749 3.527 [26,27,28]
177.0 2.731 3.323
169.8 2.761 3.519
Disclaimer/Publisher’s Note: The statements, opinions and data contained in all publications are solely those of the individual author(s) and contributor(s) and not of MDPI and/or the editor(s). MDPI and/or the editor(s) disclaim responsibility for any injury to people or property resulting from any ideas, methods, instructions or products referred to in the content.
Copyright: This open access article is published under a Creative Commons CC BY 4.0 license, which permit the free download, distribution, and reuse, provided that the author and preprint are cited in any reuse.
Prerpints.org logo

Preprints.org is a free preprint server supported by MDPI in Basel, Switzerland.

Subscribe

© 2024 MDPI (Basel, Switzerland) unless otherwise stated