Submitted:
15 April 2024
Posted:
16 April 2024
You are already at the latest version
Abstract
Keywords:
1. Introduction
2. Method
2.1. Local Mode Equivalent Mass Identification Method Based on Natural Mode Method
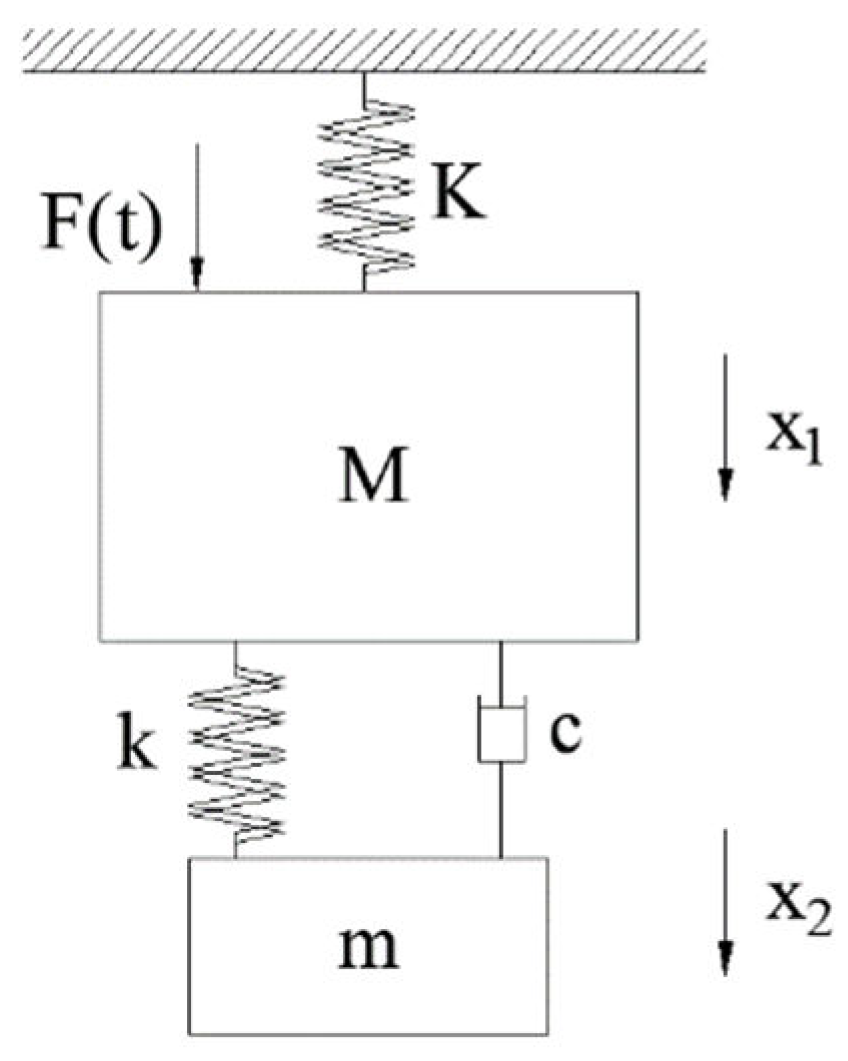
2.1.1. Optimal Parameter Design of TMD based on Fixed Point Theory
2.2. Local Mode Equivalent Mass Solution Method
2.3. Conversion Method of Concentration Quality Matrix
3. Finite Element Analysis of 100m X-Bow Local Vibration
3.1. 1100. m X-Bow Local Vibration Test
| Modal | 6L20 | 8L20 |
|---|---|---|
| Rated power | 1200kW | 1600kW |
| Rated speed | 1000RPM | 1000RPM |
| Weight | 9.3t | 11t |
| Number | 2 | 2 |
3.2. Local Vibration Control Analysis of TMD
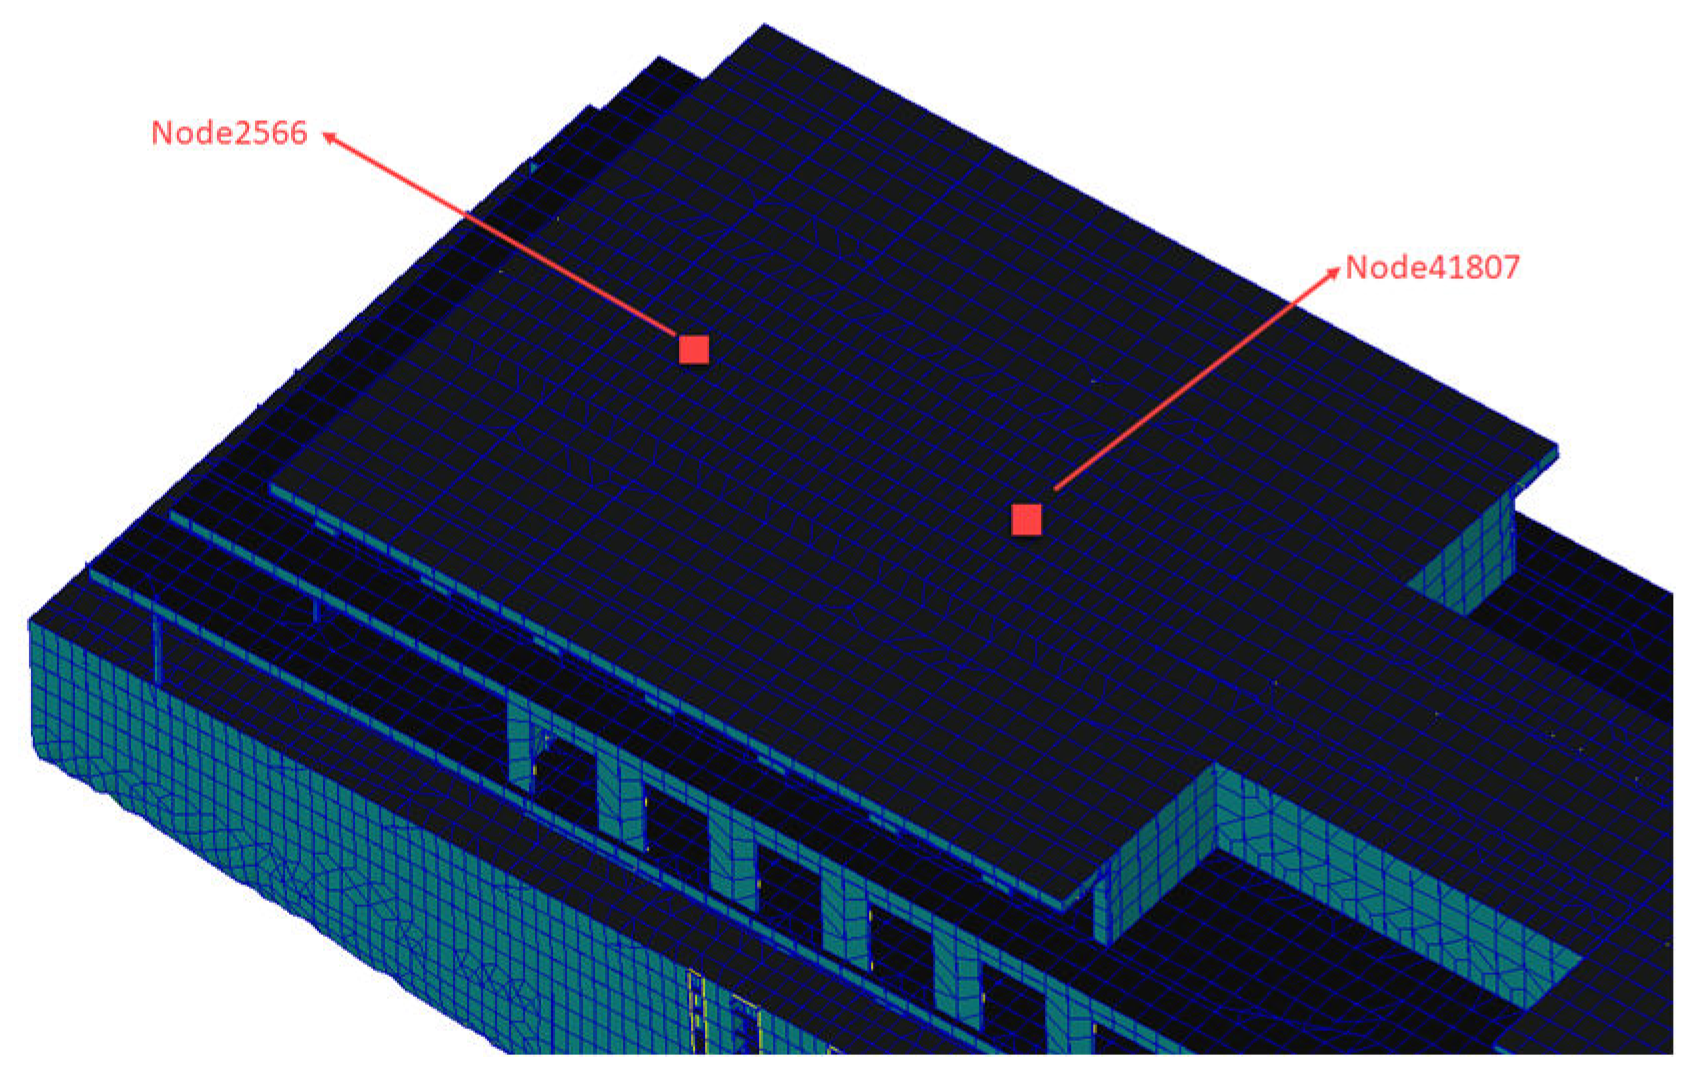
4. Conclusions
- According to the global mode equivalent mass solution method and the spatial destruction principle of local mode mass, a solution method of single local mode equivalent mass in mixed modes is proposed, and the single local mode equivalent mass of the seventh layer sun deck in 100m X-Bow polar exploration cruise ship is solved by using this method.
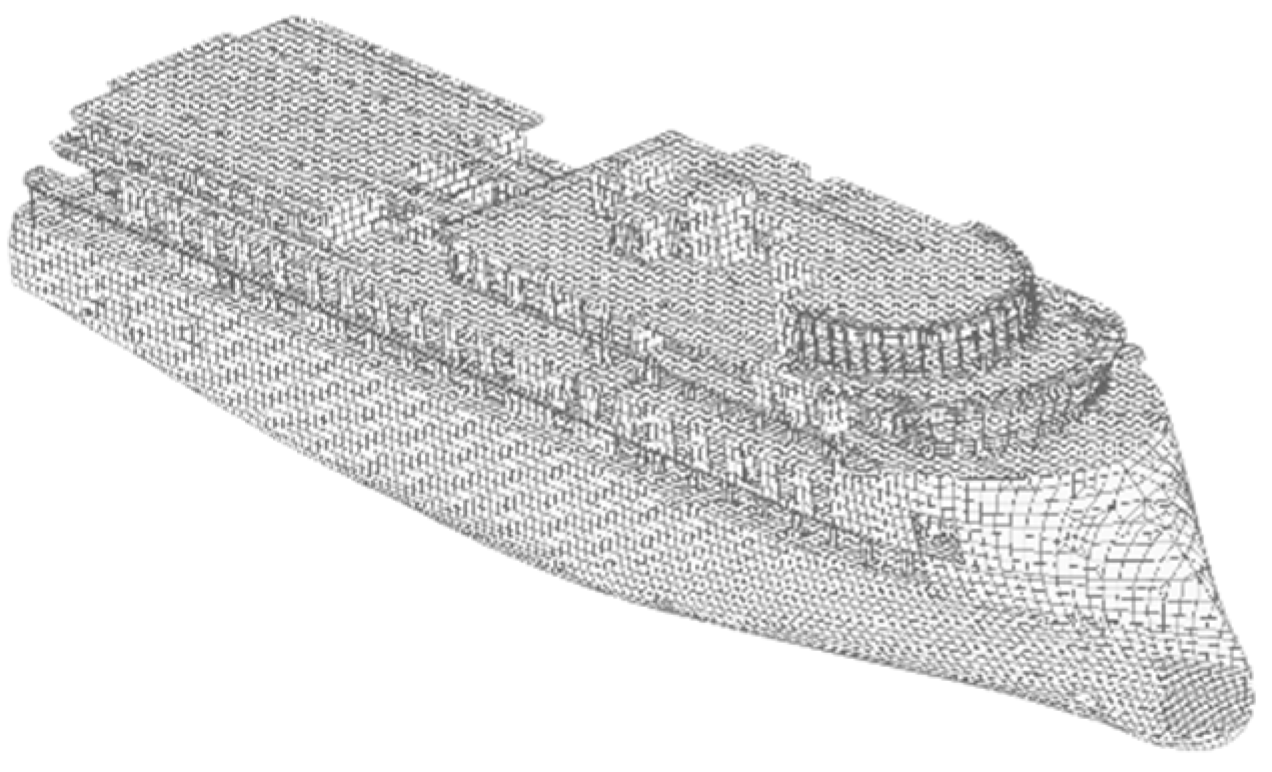
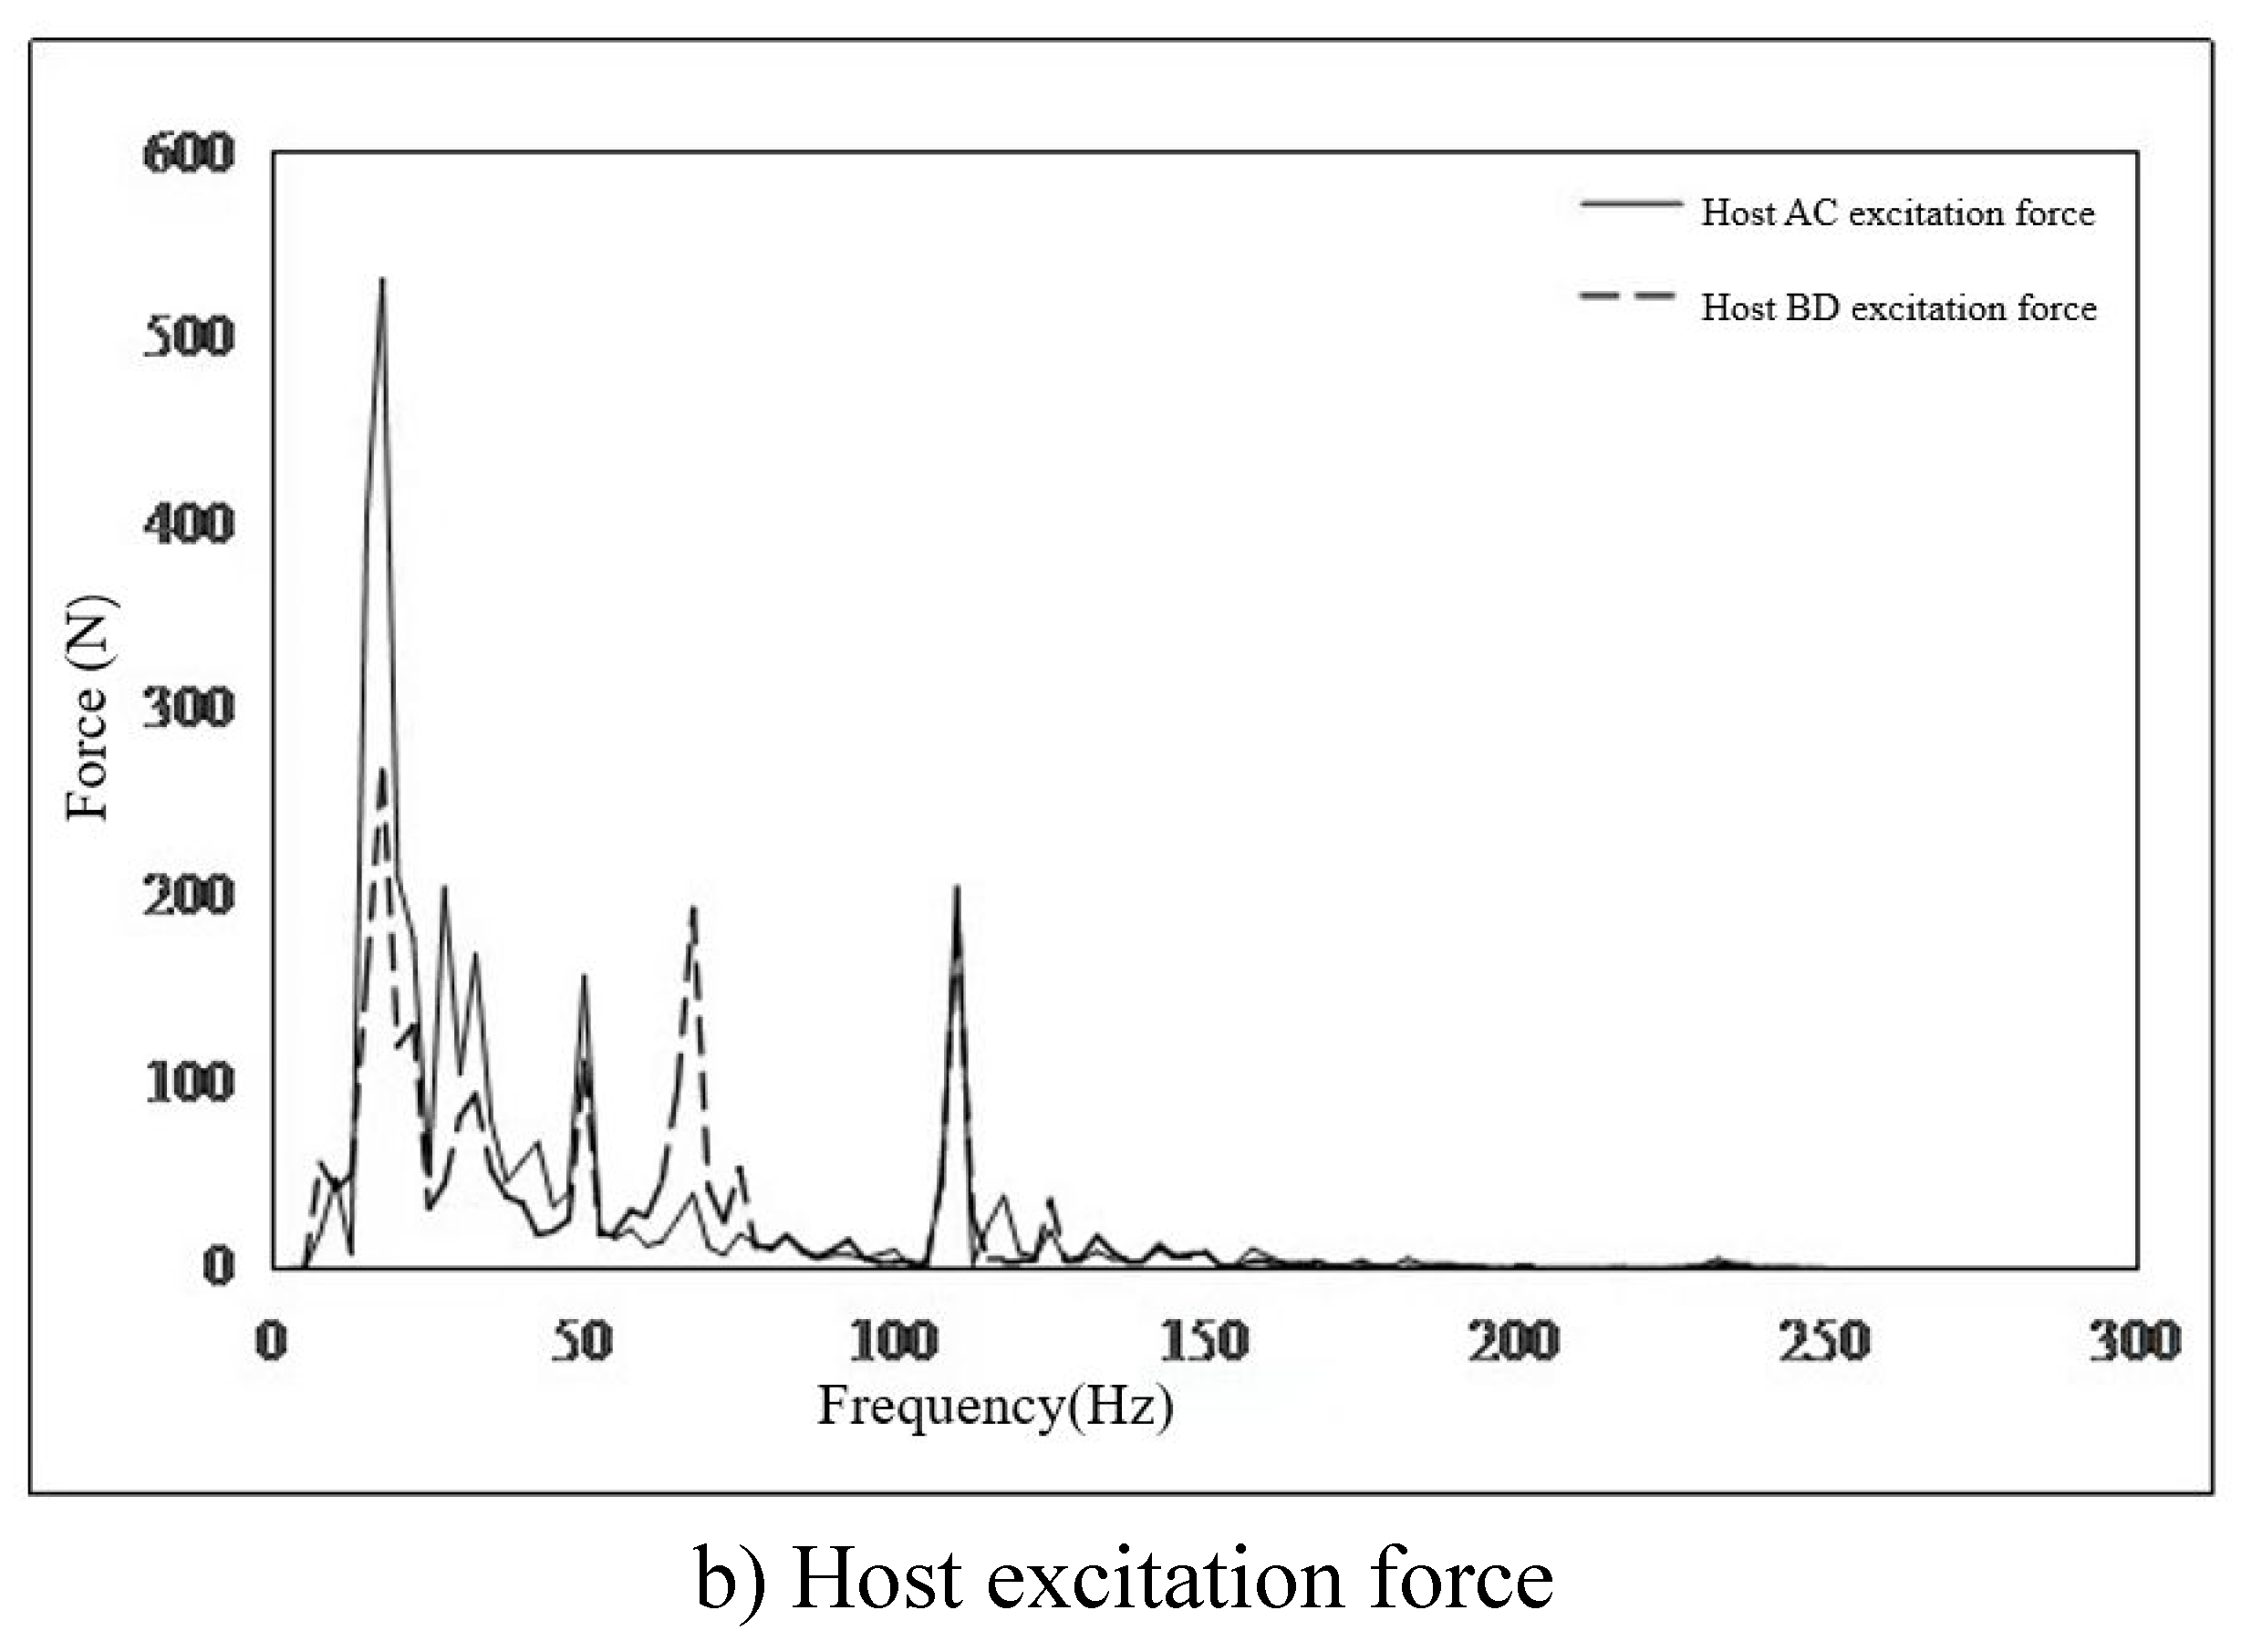
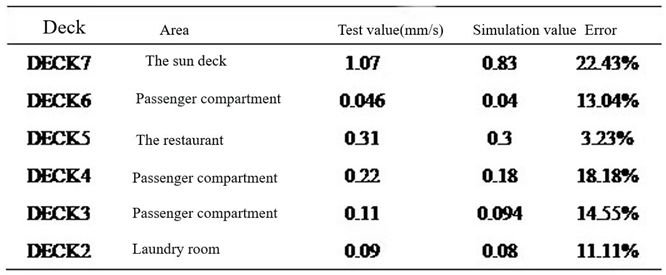
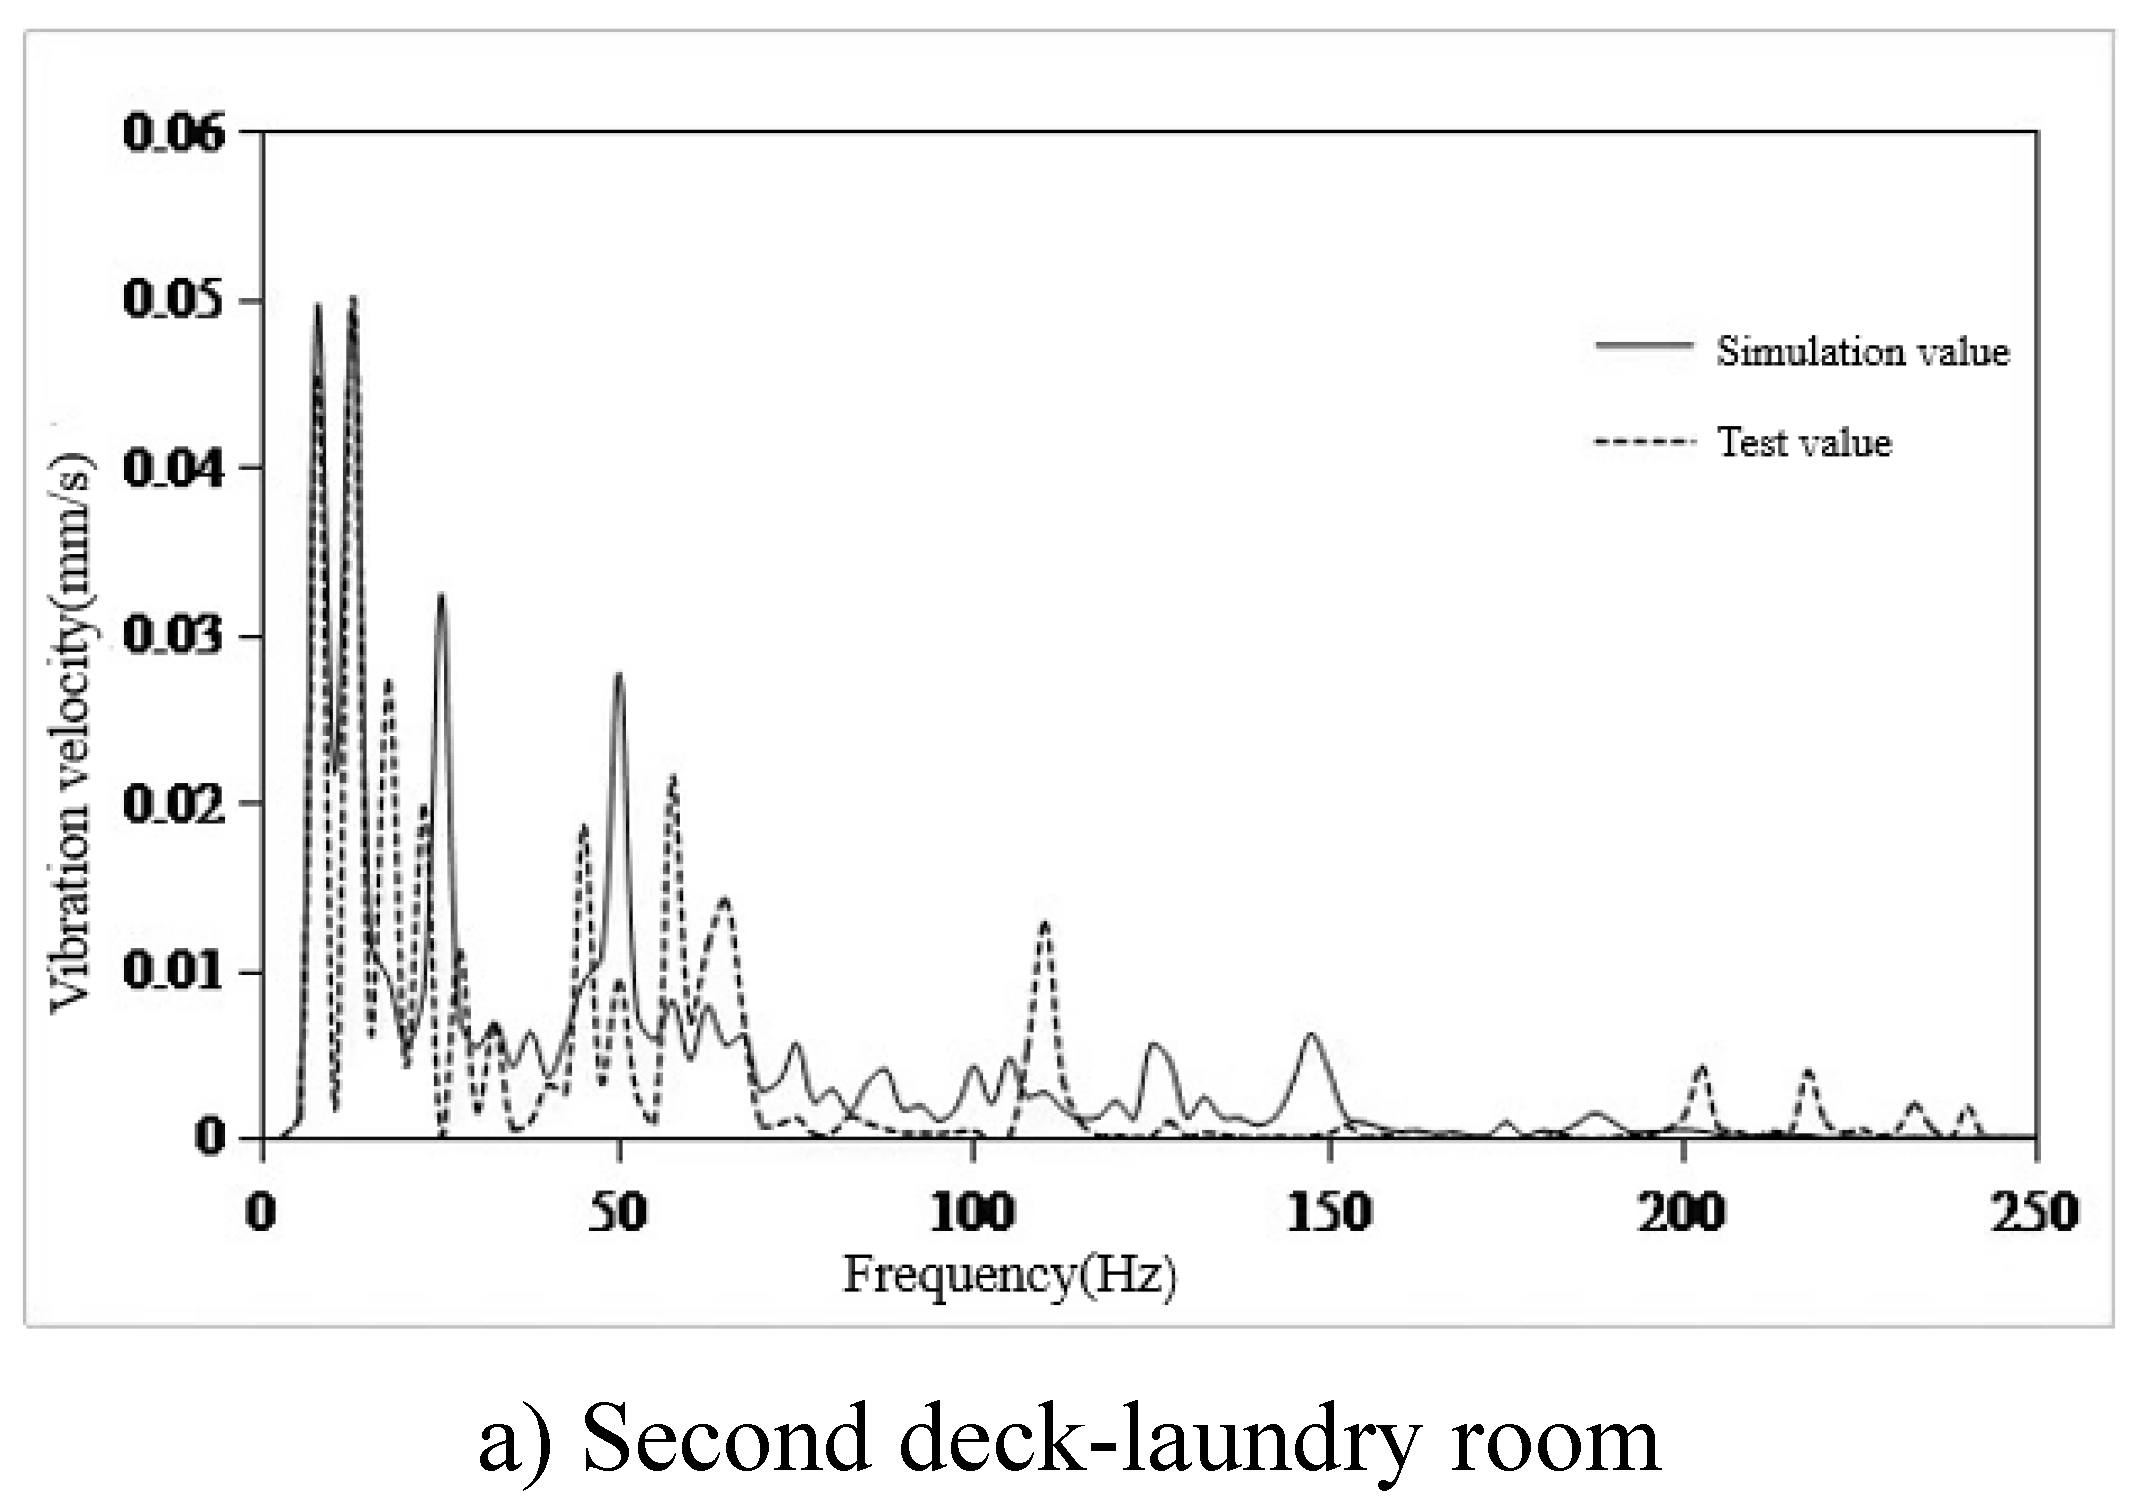
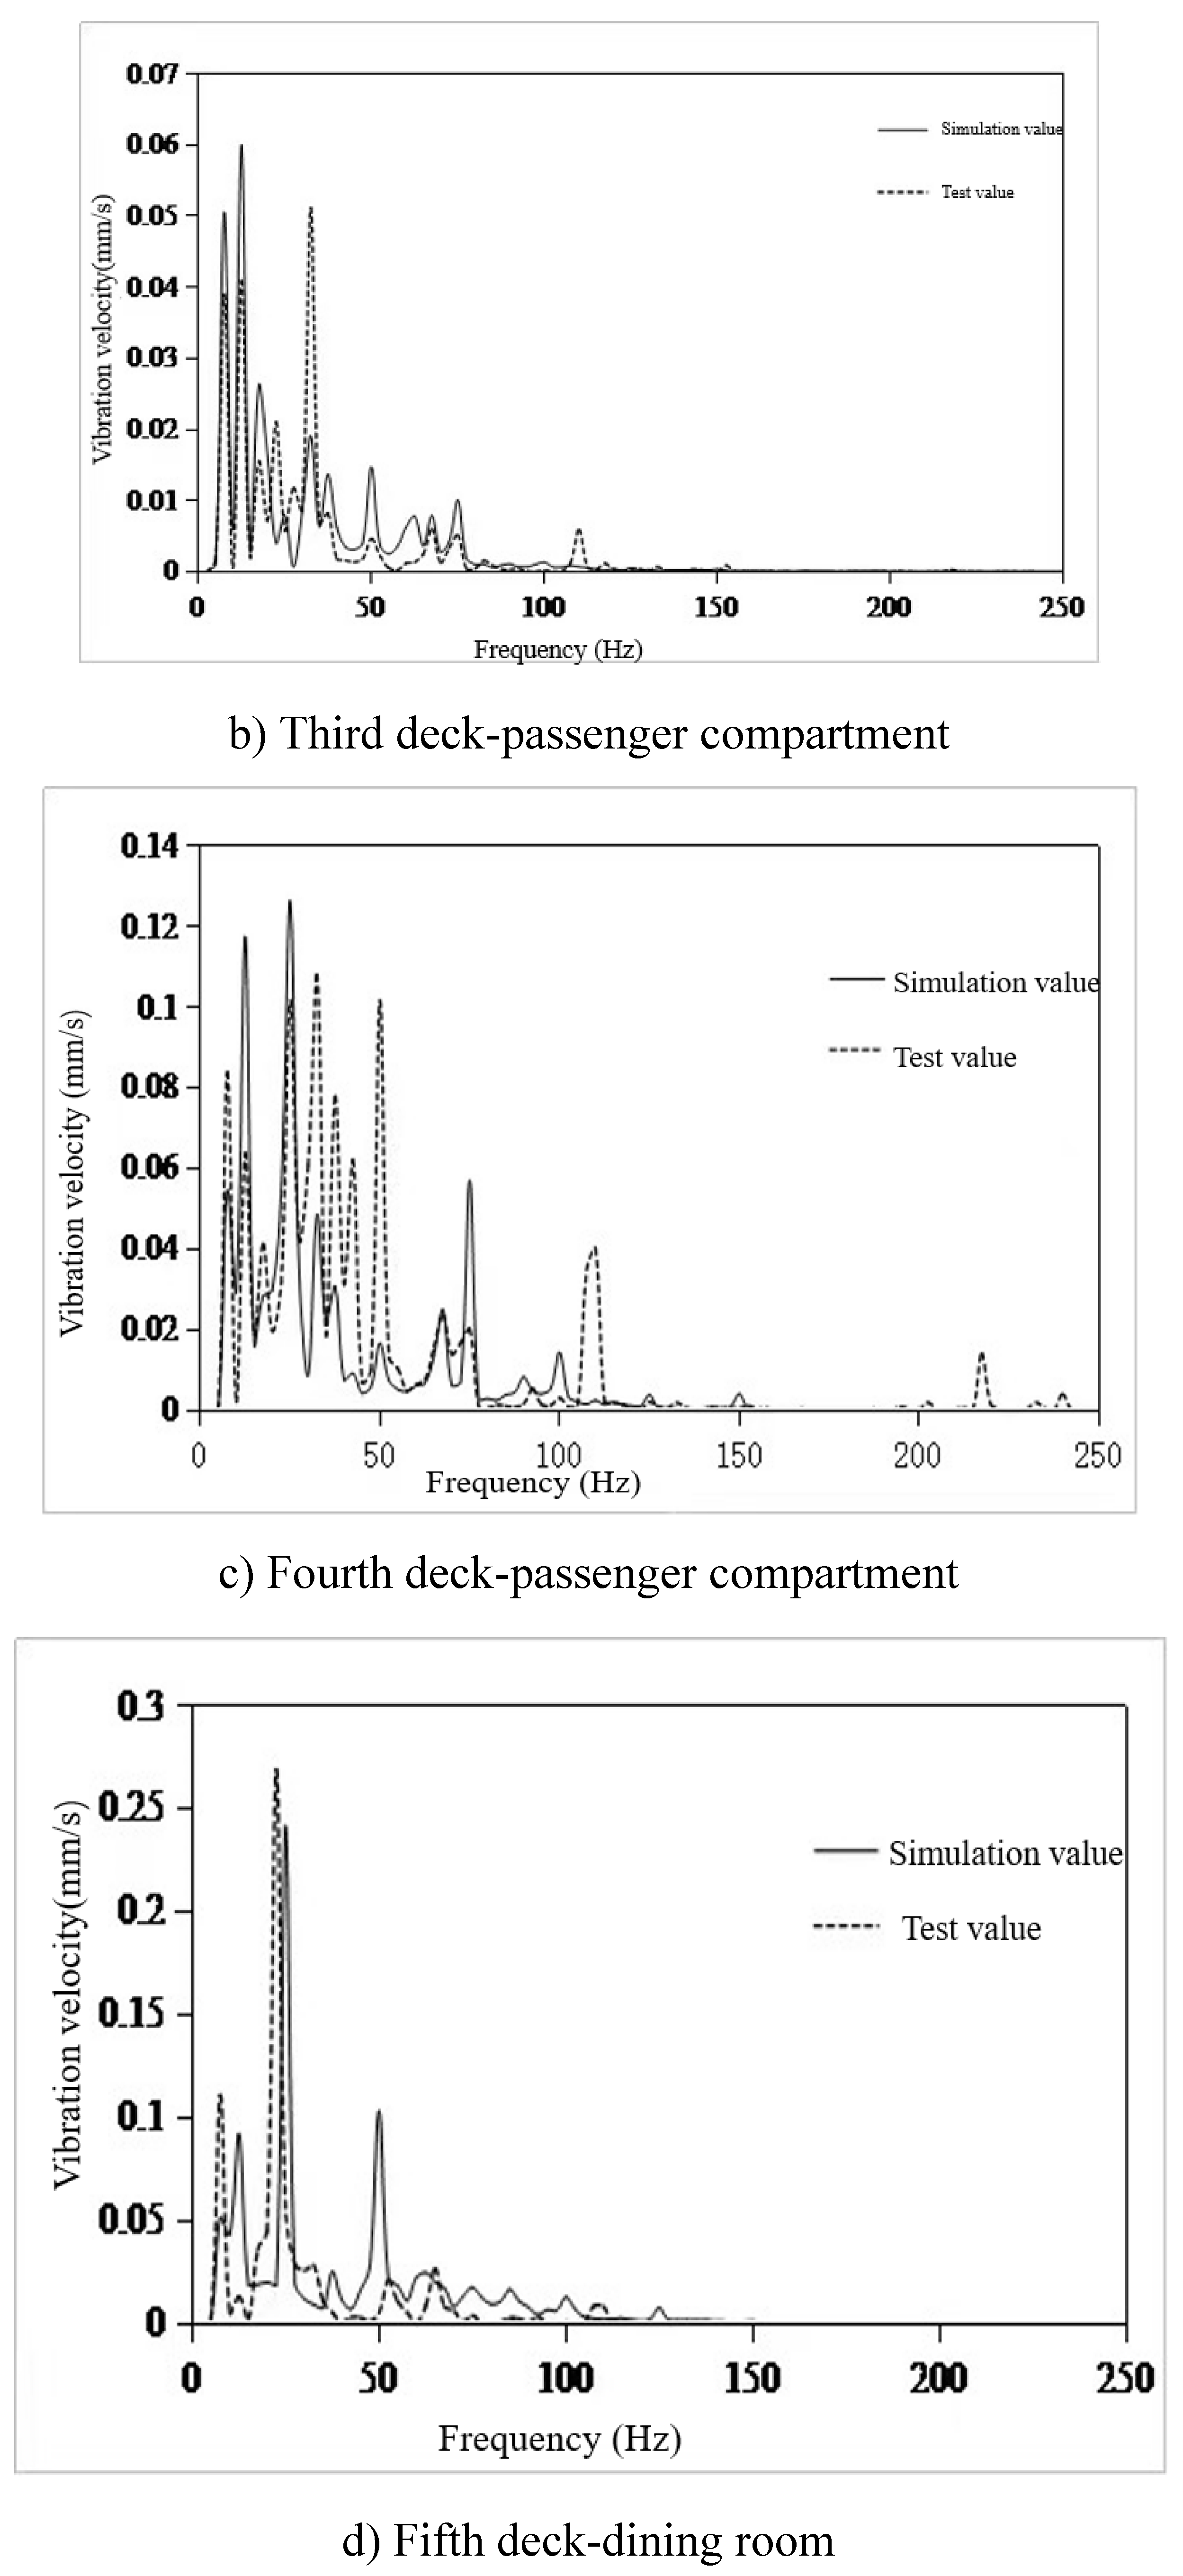
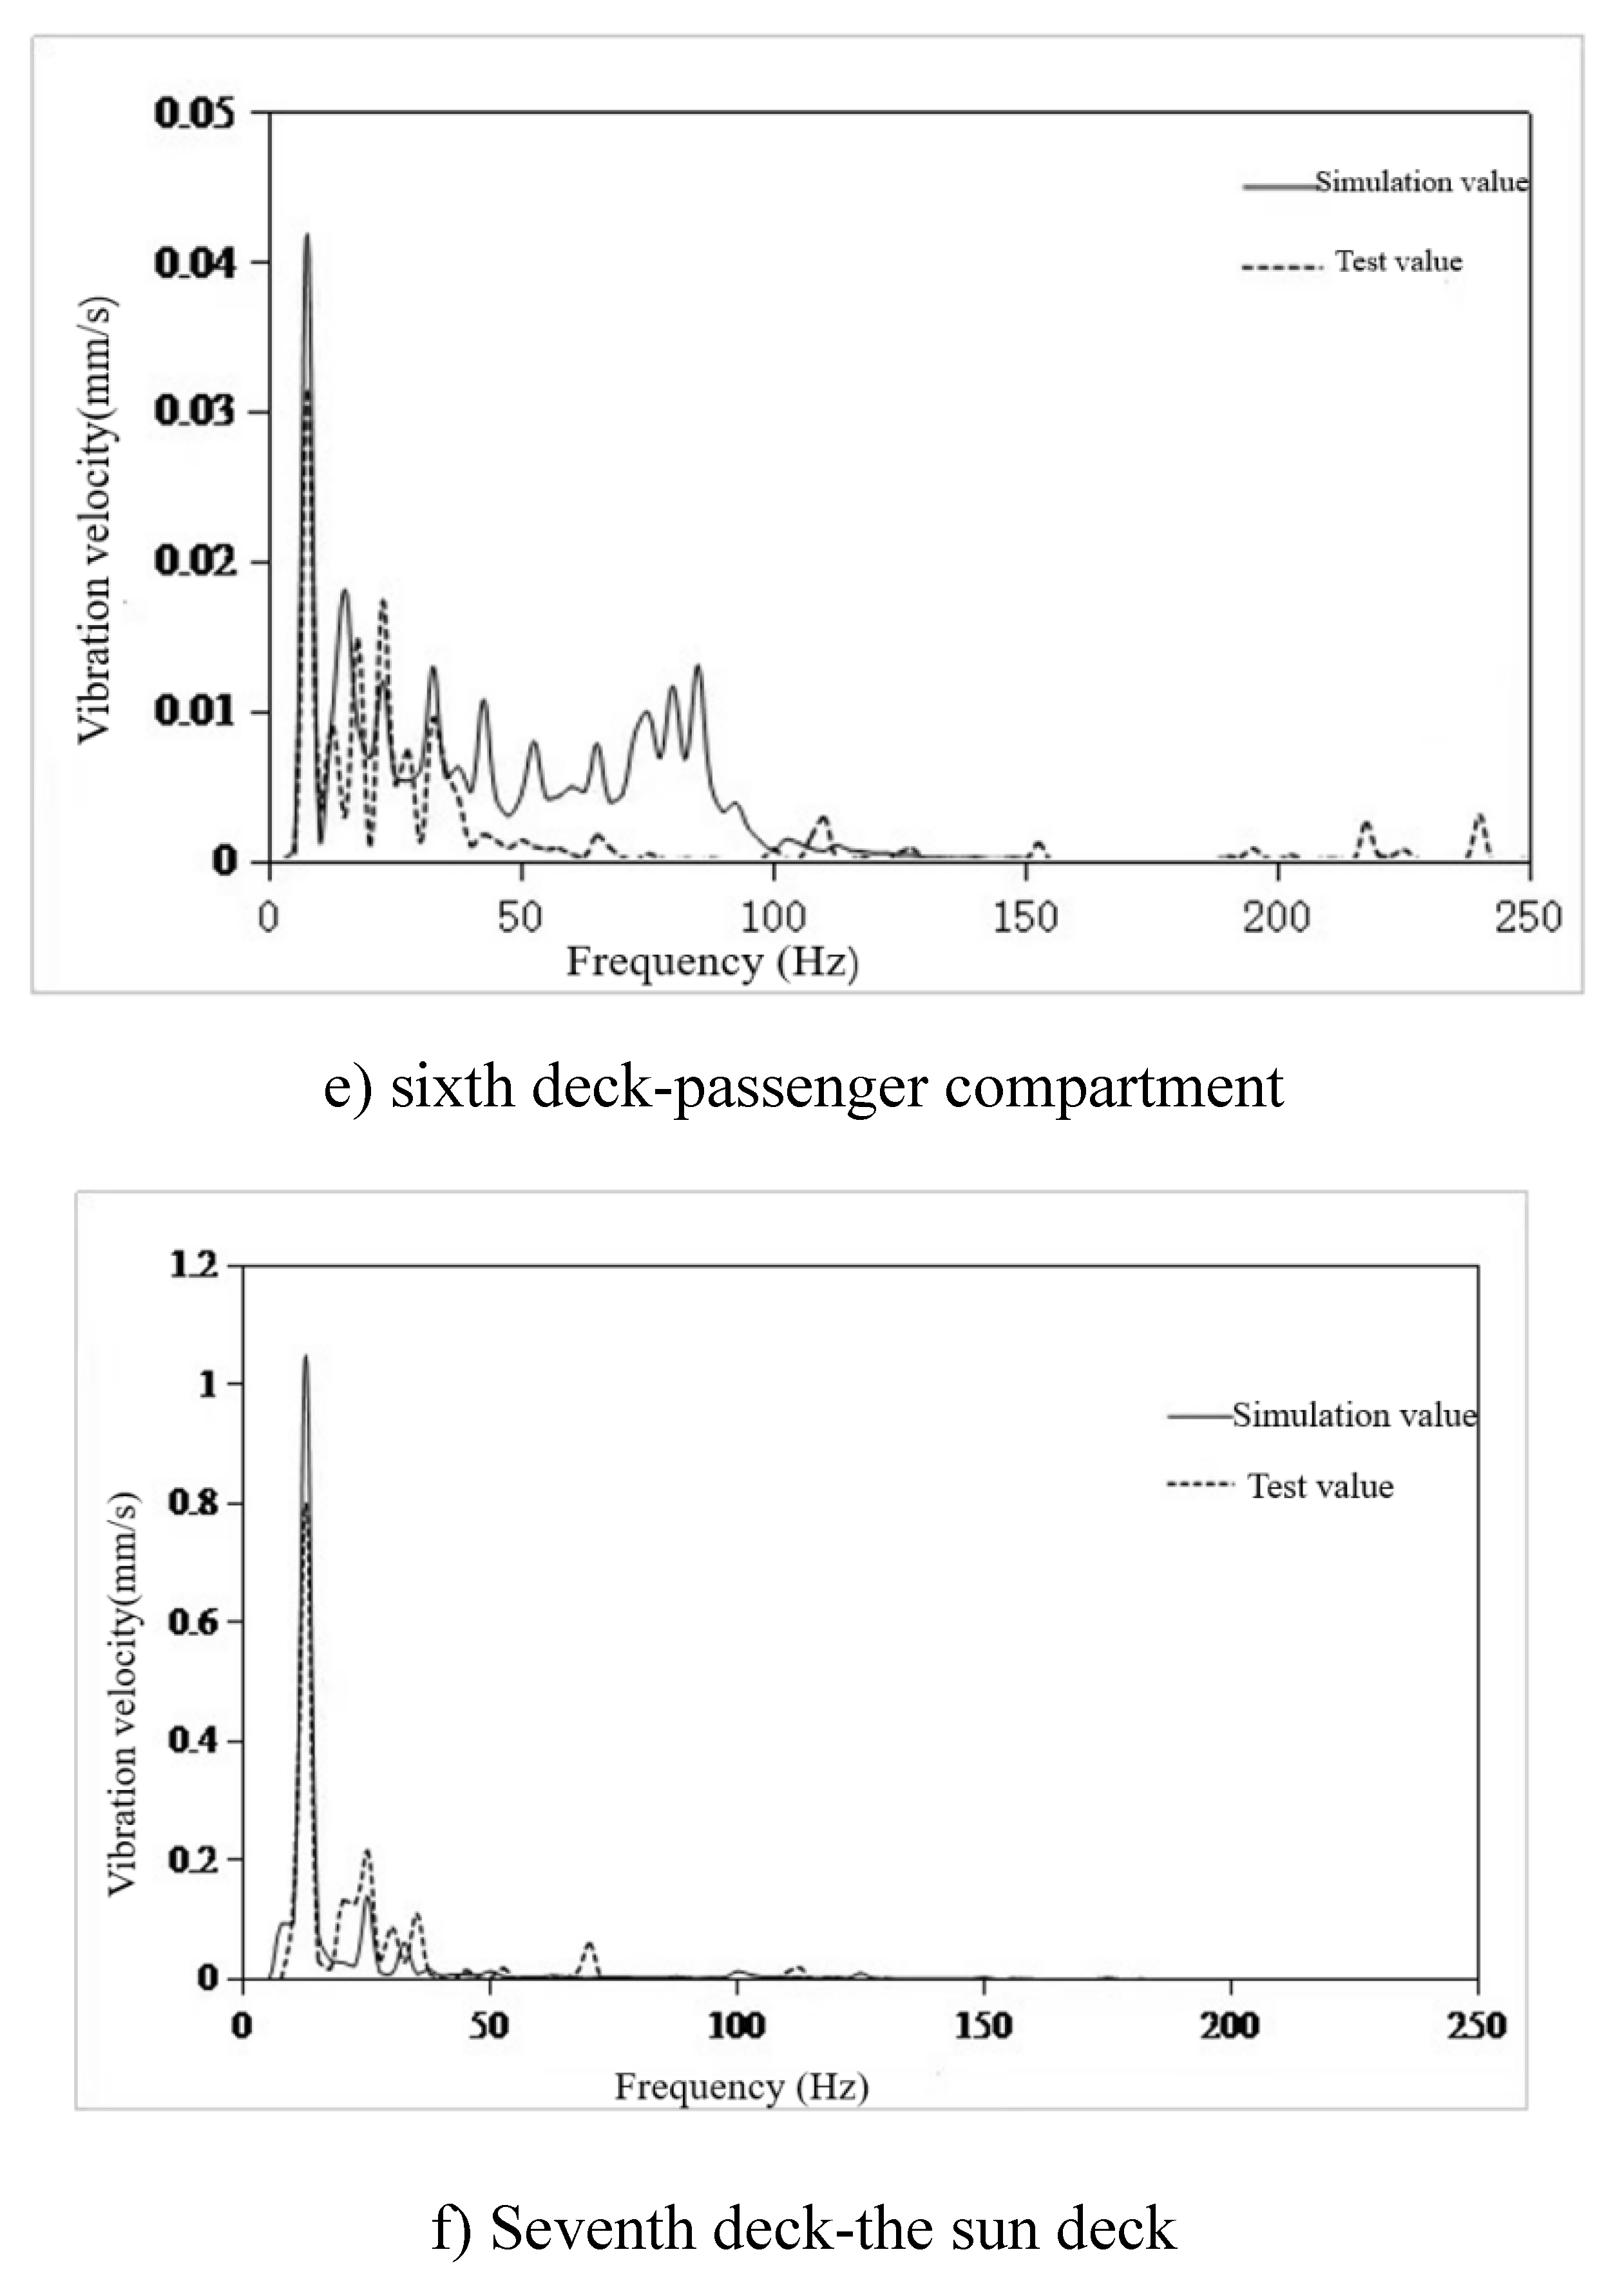
- The finite element model of 100m X-Bow polar cruise ship was established to predict the structural vibration response. Six typical cabins were selected, and the simulation value of vibration response of these six cabins was compared with the test value. The frequency response curve trend was basically the same, and the effective value error of vibration response was within 22%, but the difference was only 0.24mm/s. The error can be ignored, so the simulation results meet the engineering accuracy requirements, and verify the effectiveness of the model, which can be used for vibration control analysis.
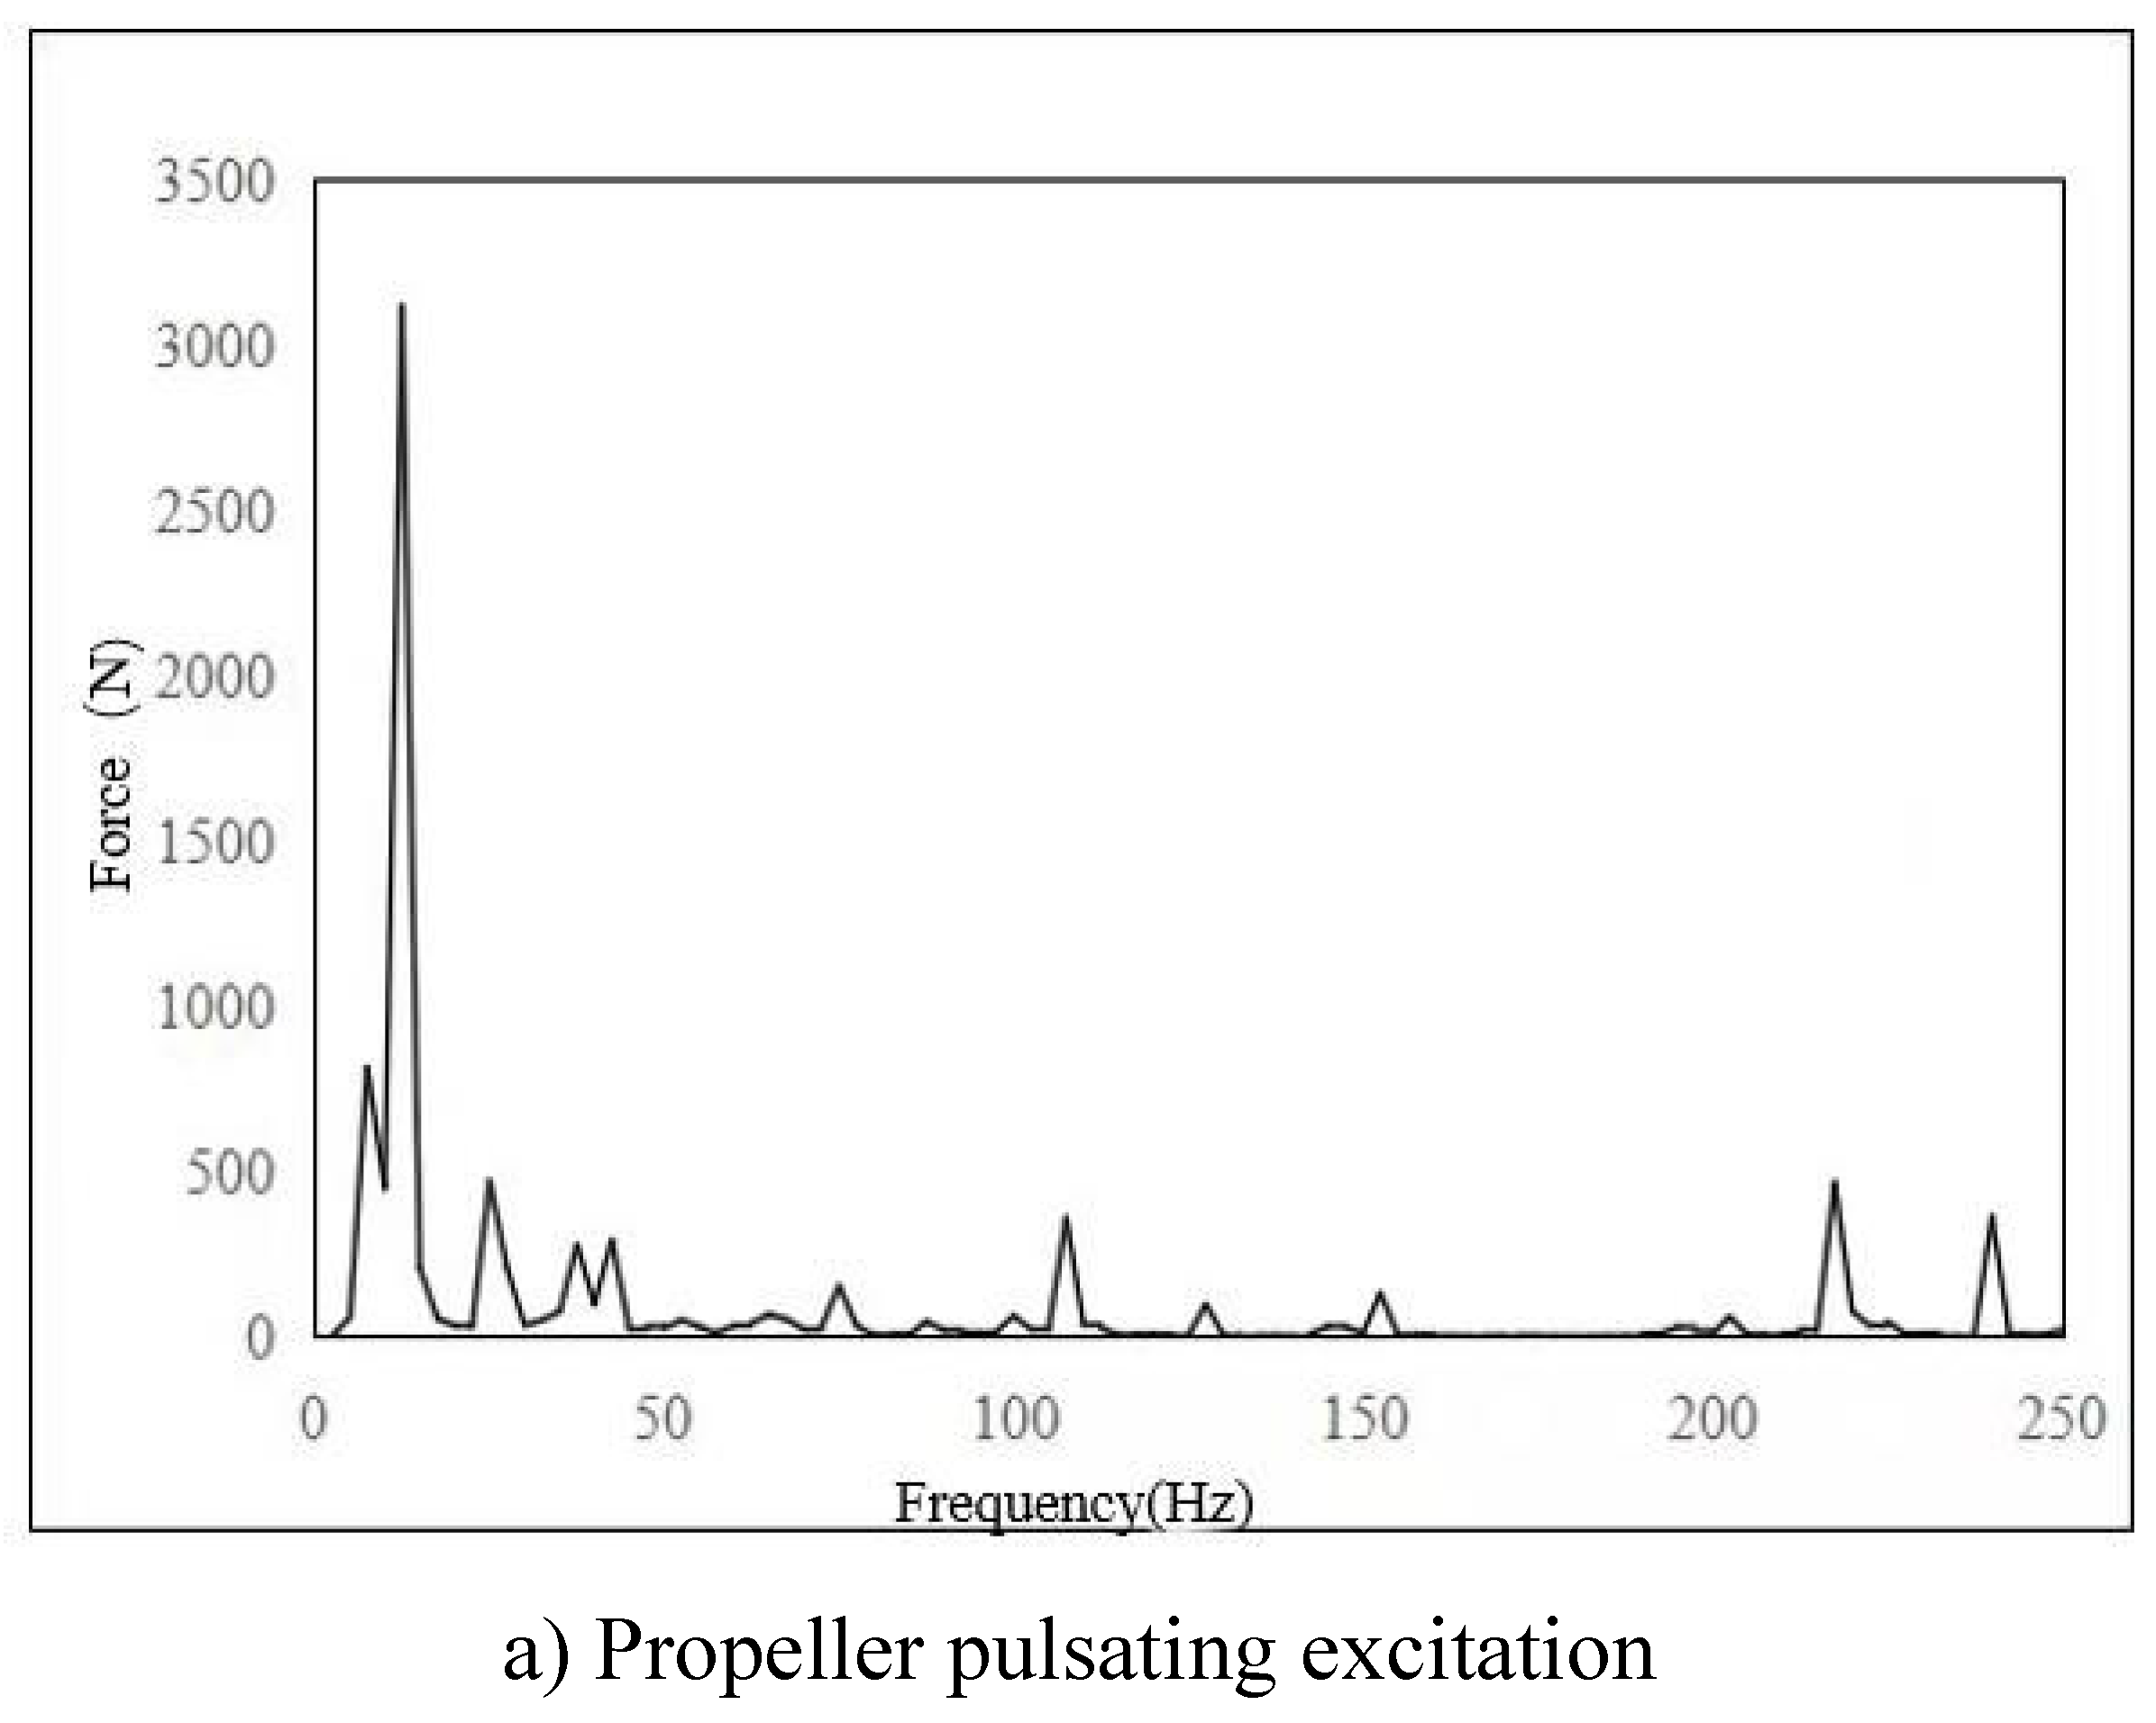
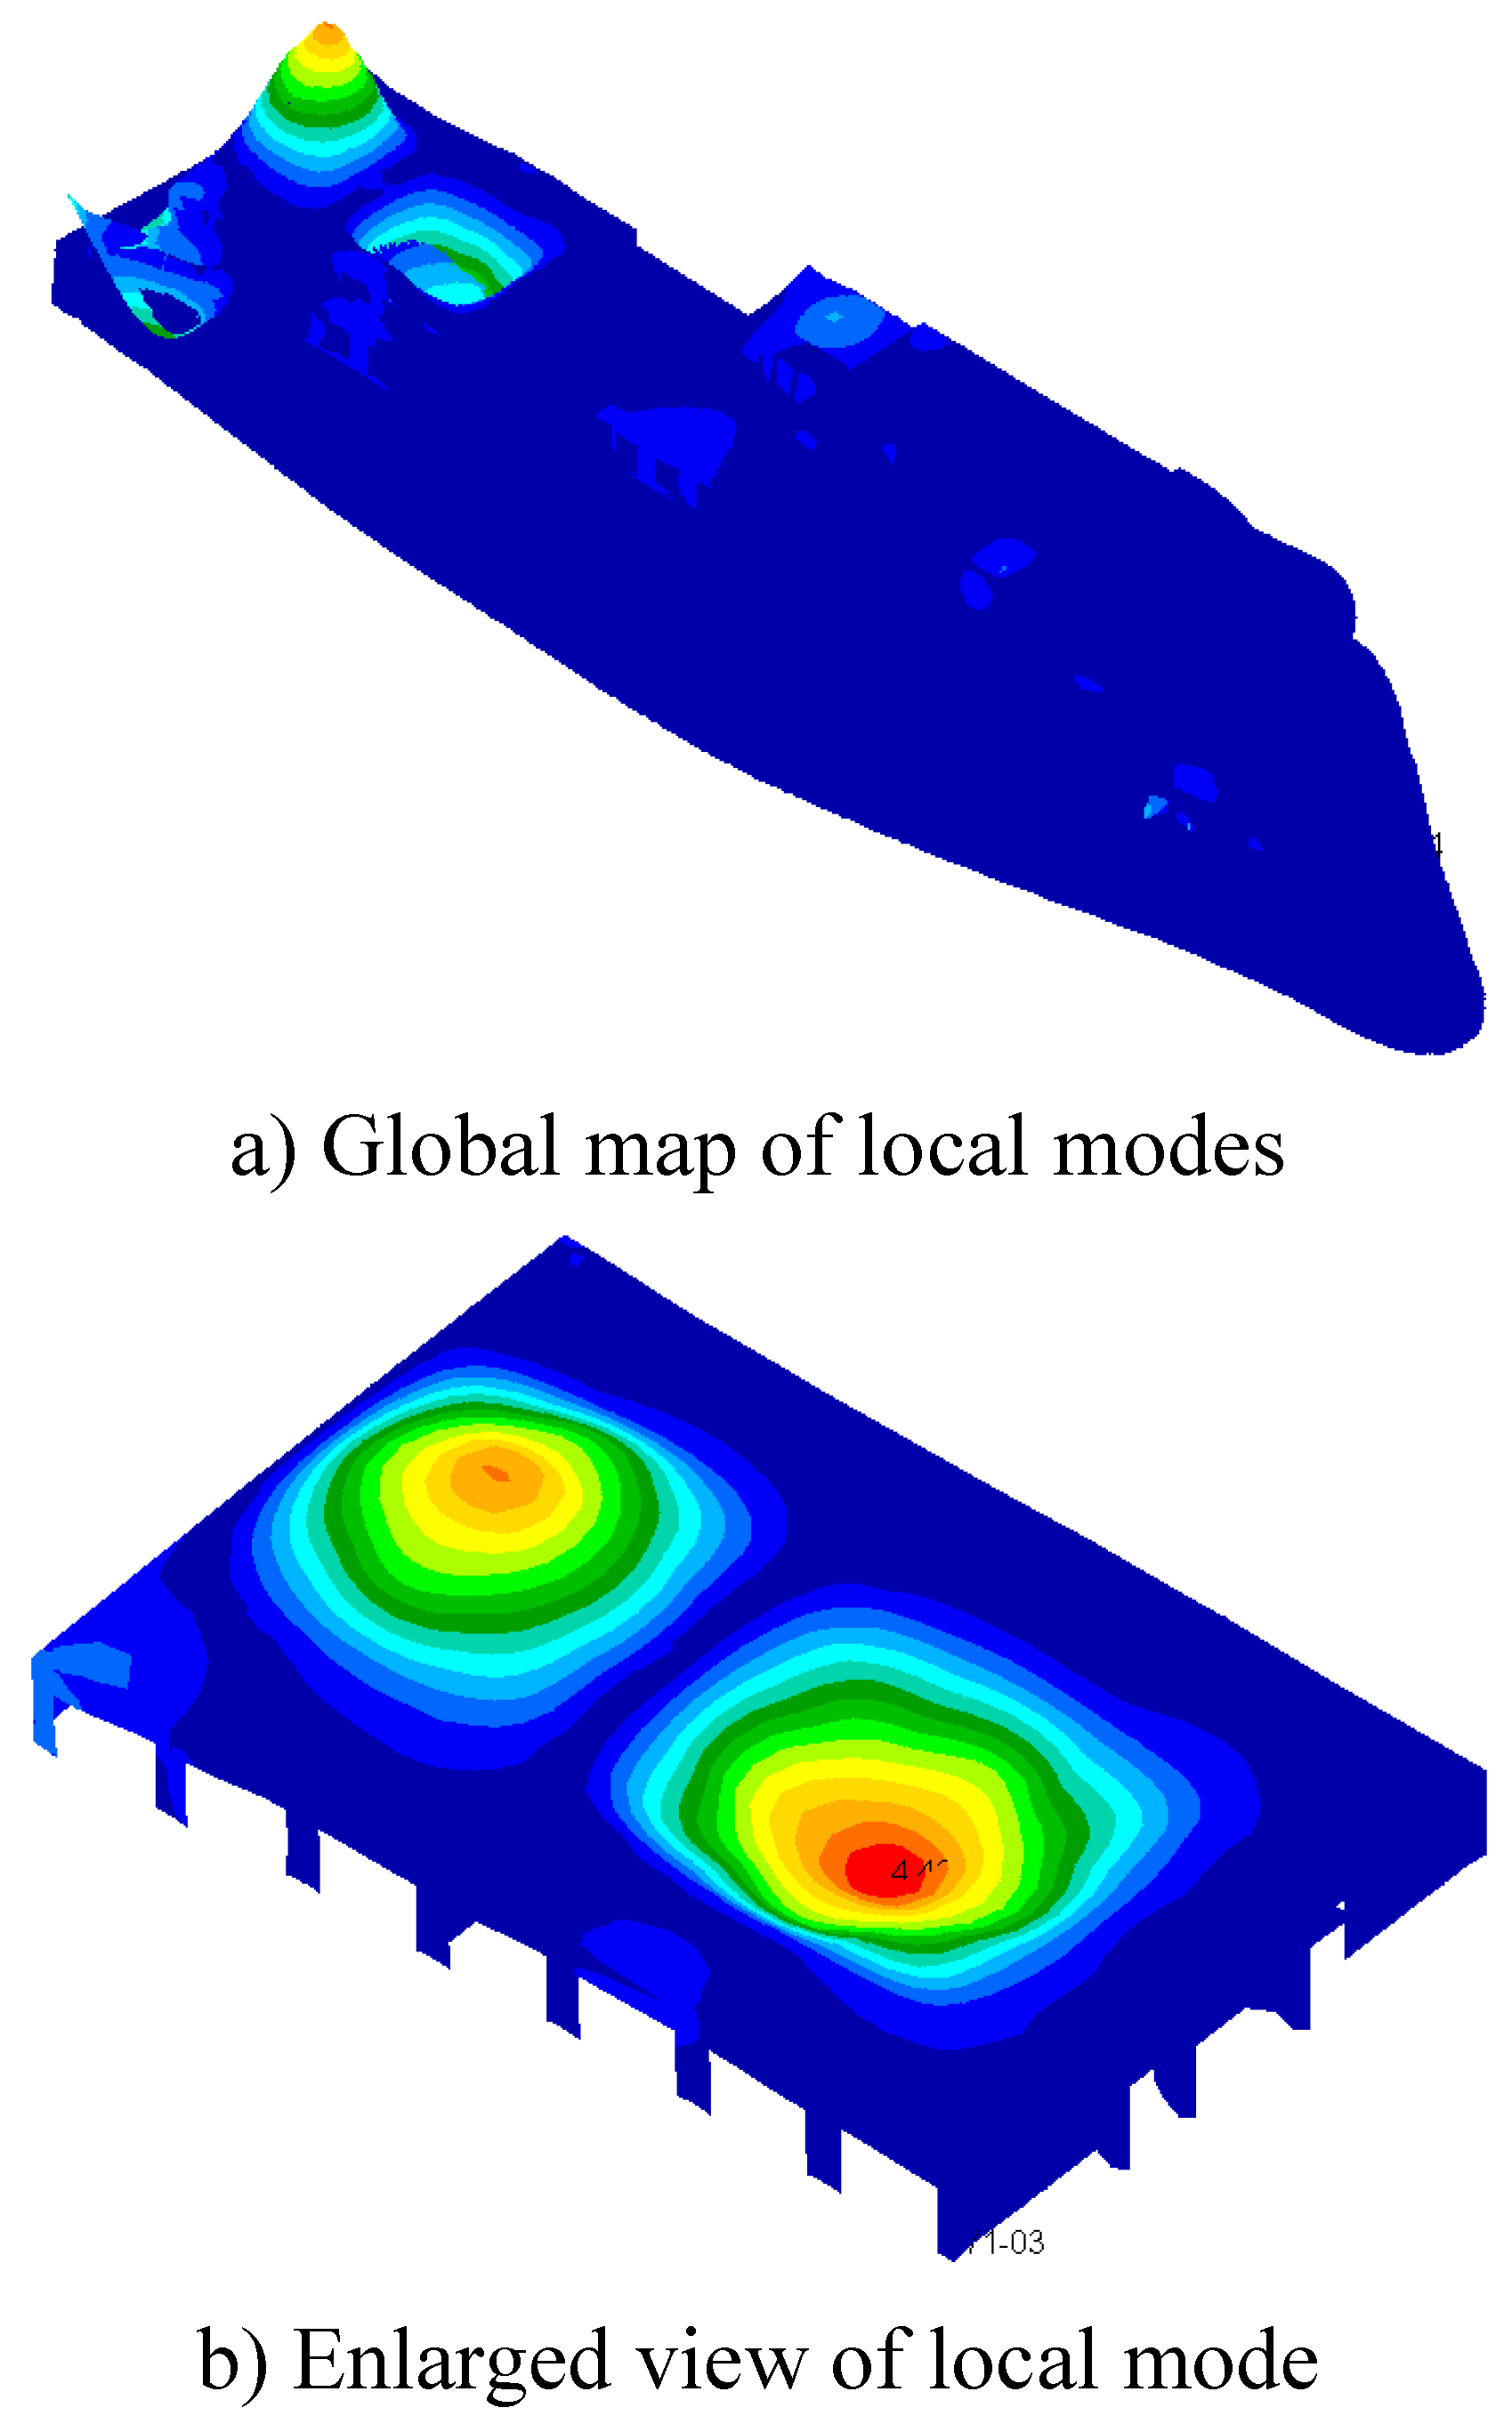
- The main excitation frequency was determined to be 12.5Hz. Based on this frequency, the local mode search of the whole ship model was carried out, and the search range was 11.25Hz-13.75Hz. Finally, the natural frequency of the seventh layer sun deck was determined to be in the range of 11.25Hz-13.75Hz, which was consistent with the propeller excitation blade frequency, and there was resonance risk. This area is the area with the largest test response, and the vibration speed is 1.07mm/s. It is necessary to control the vibration in this area.
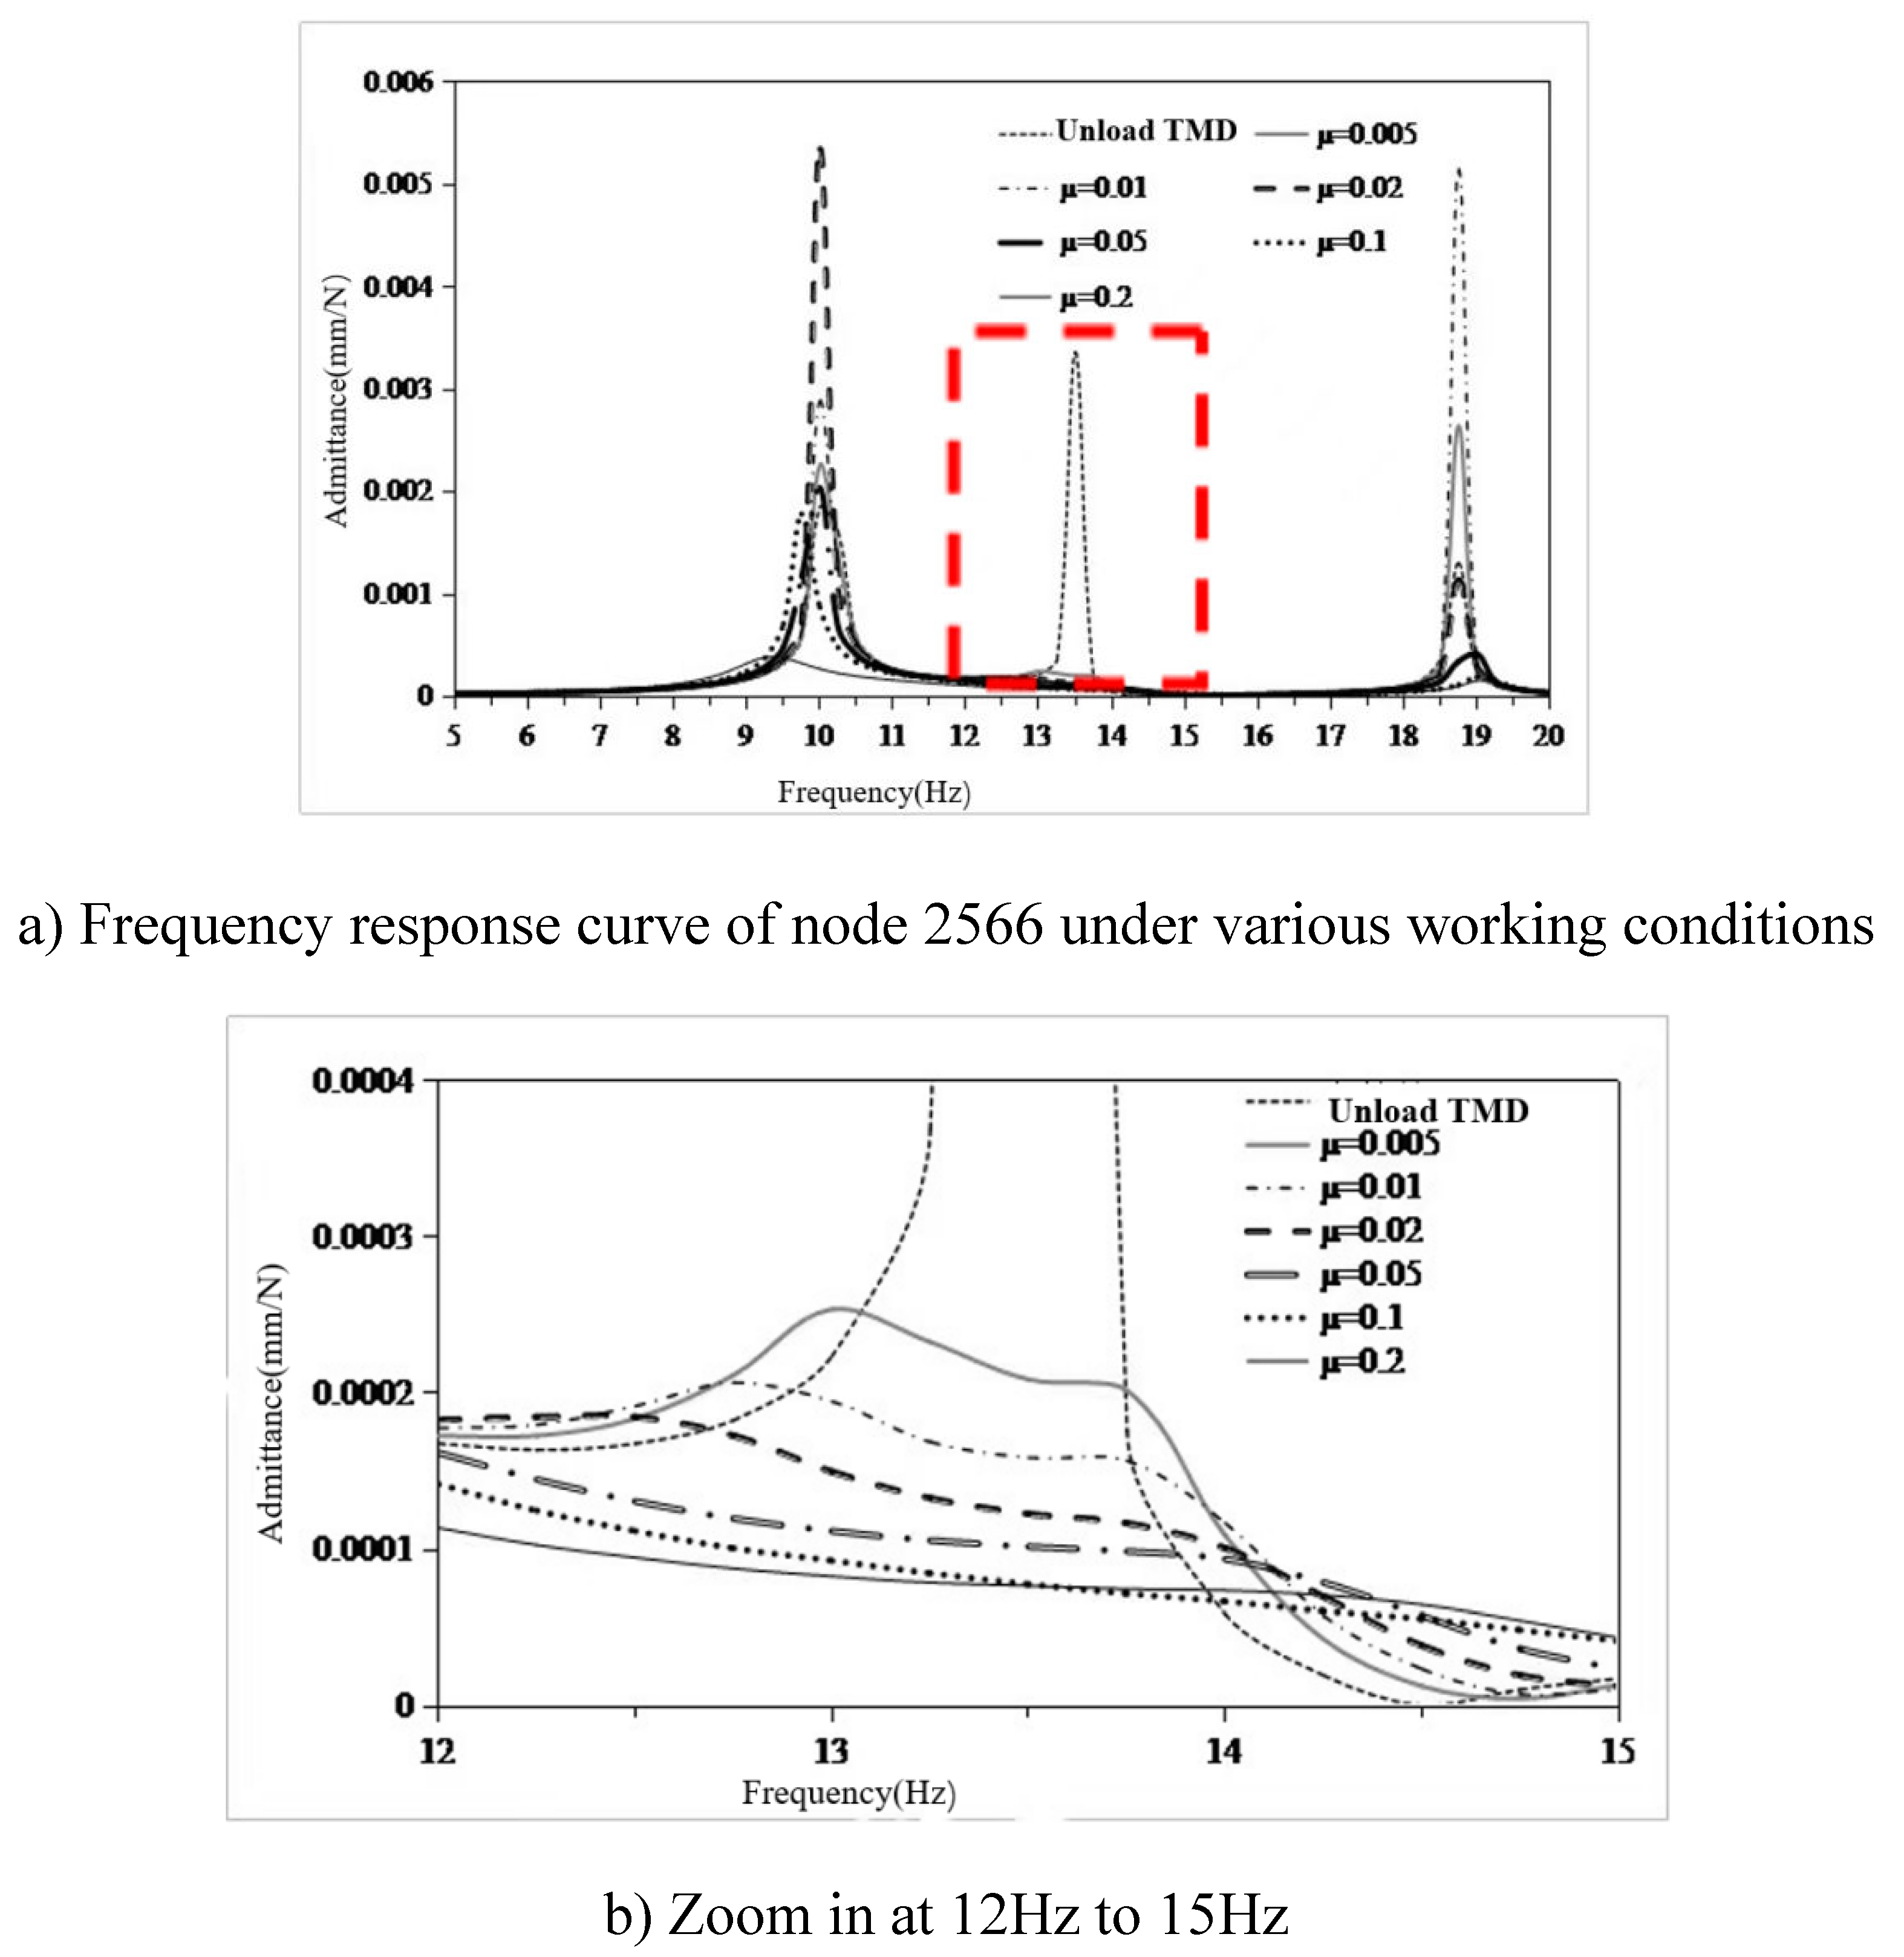
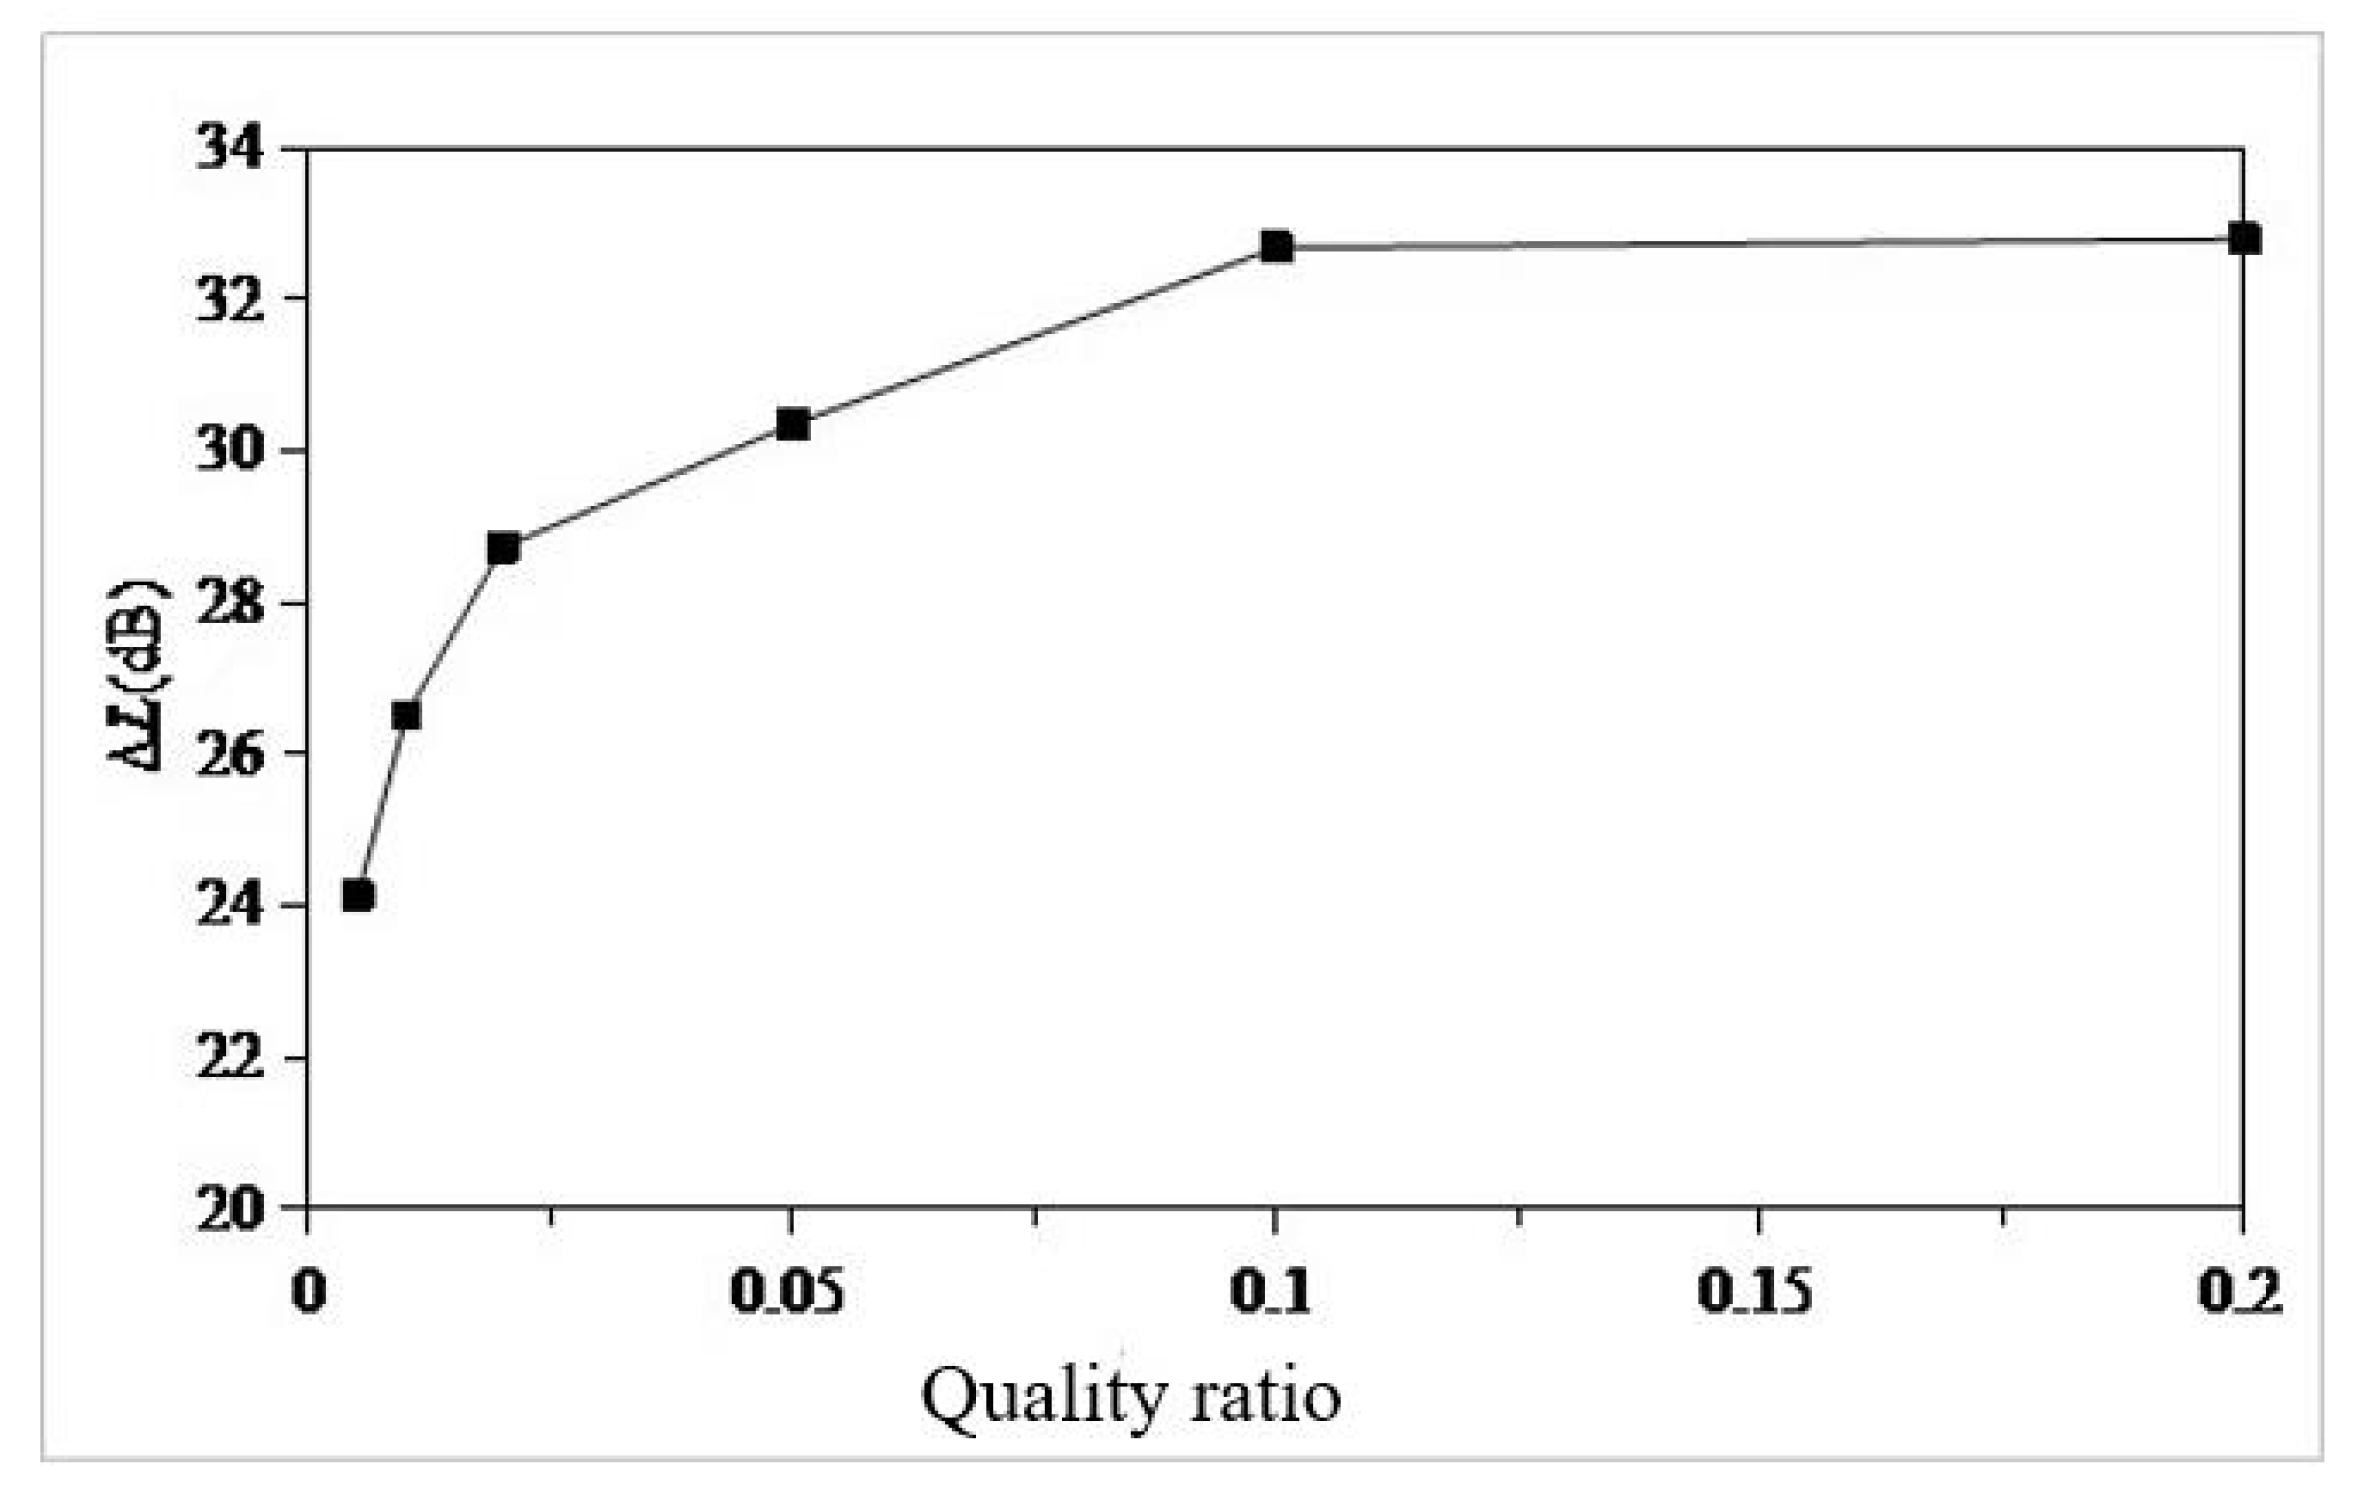
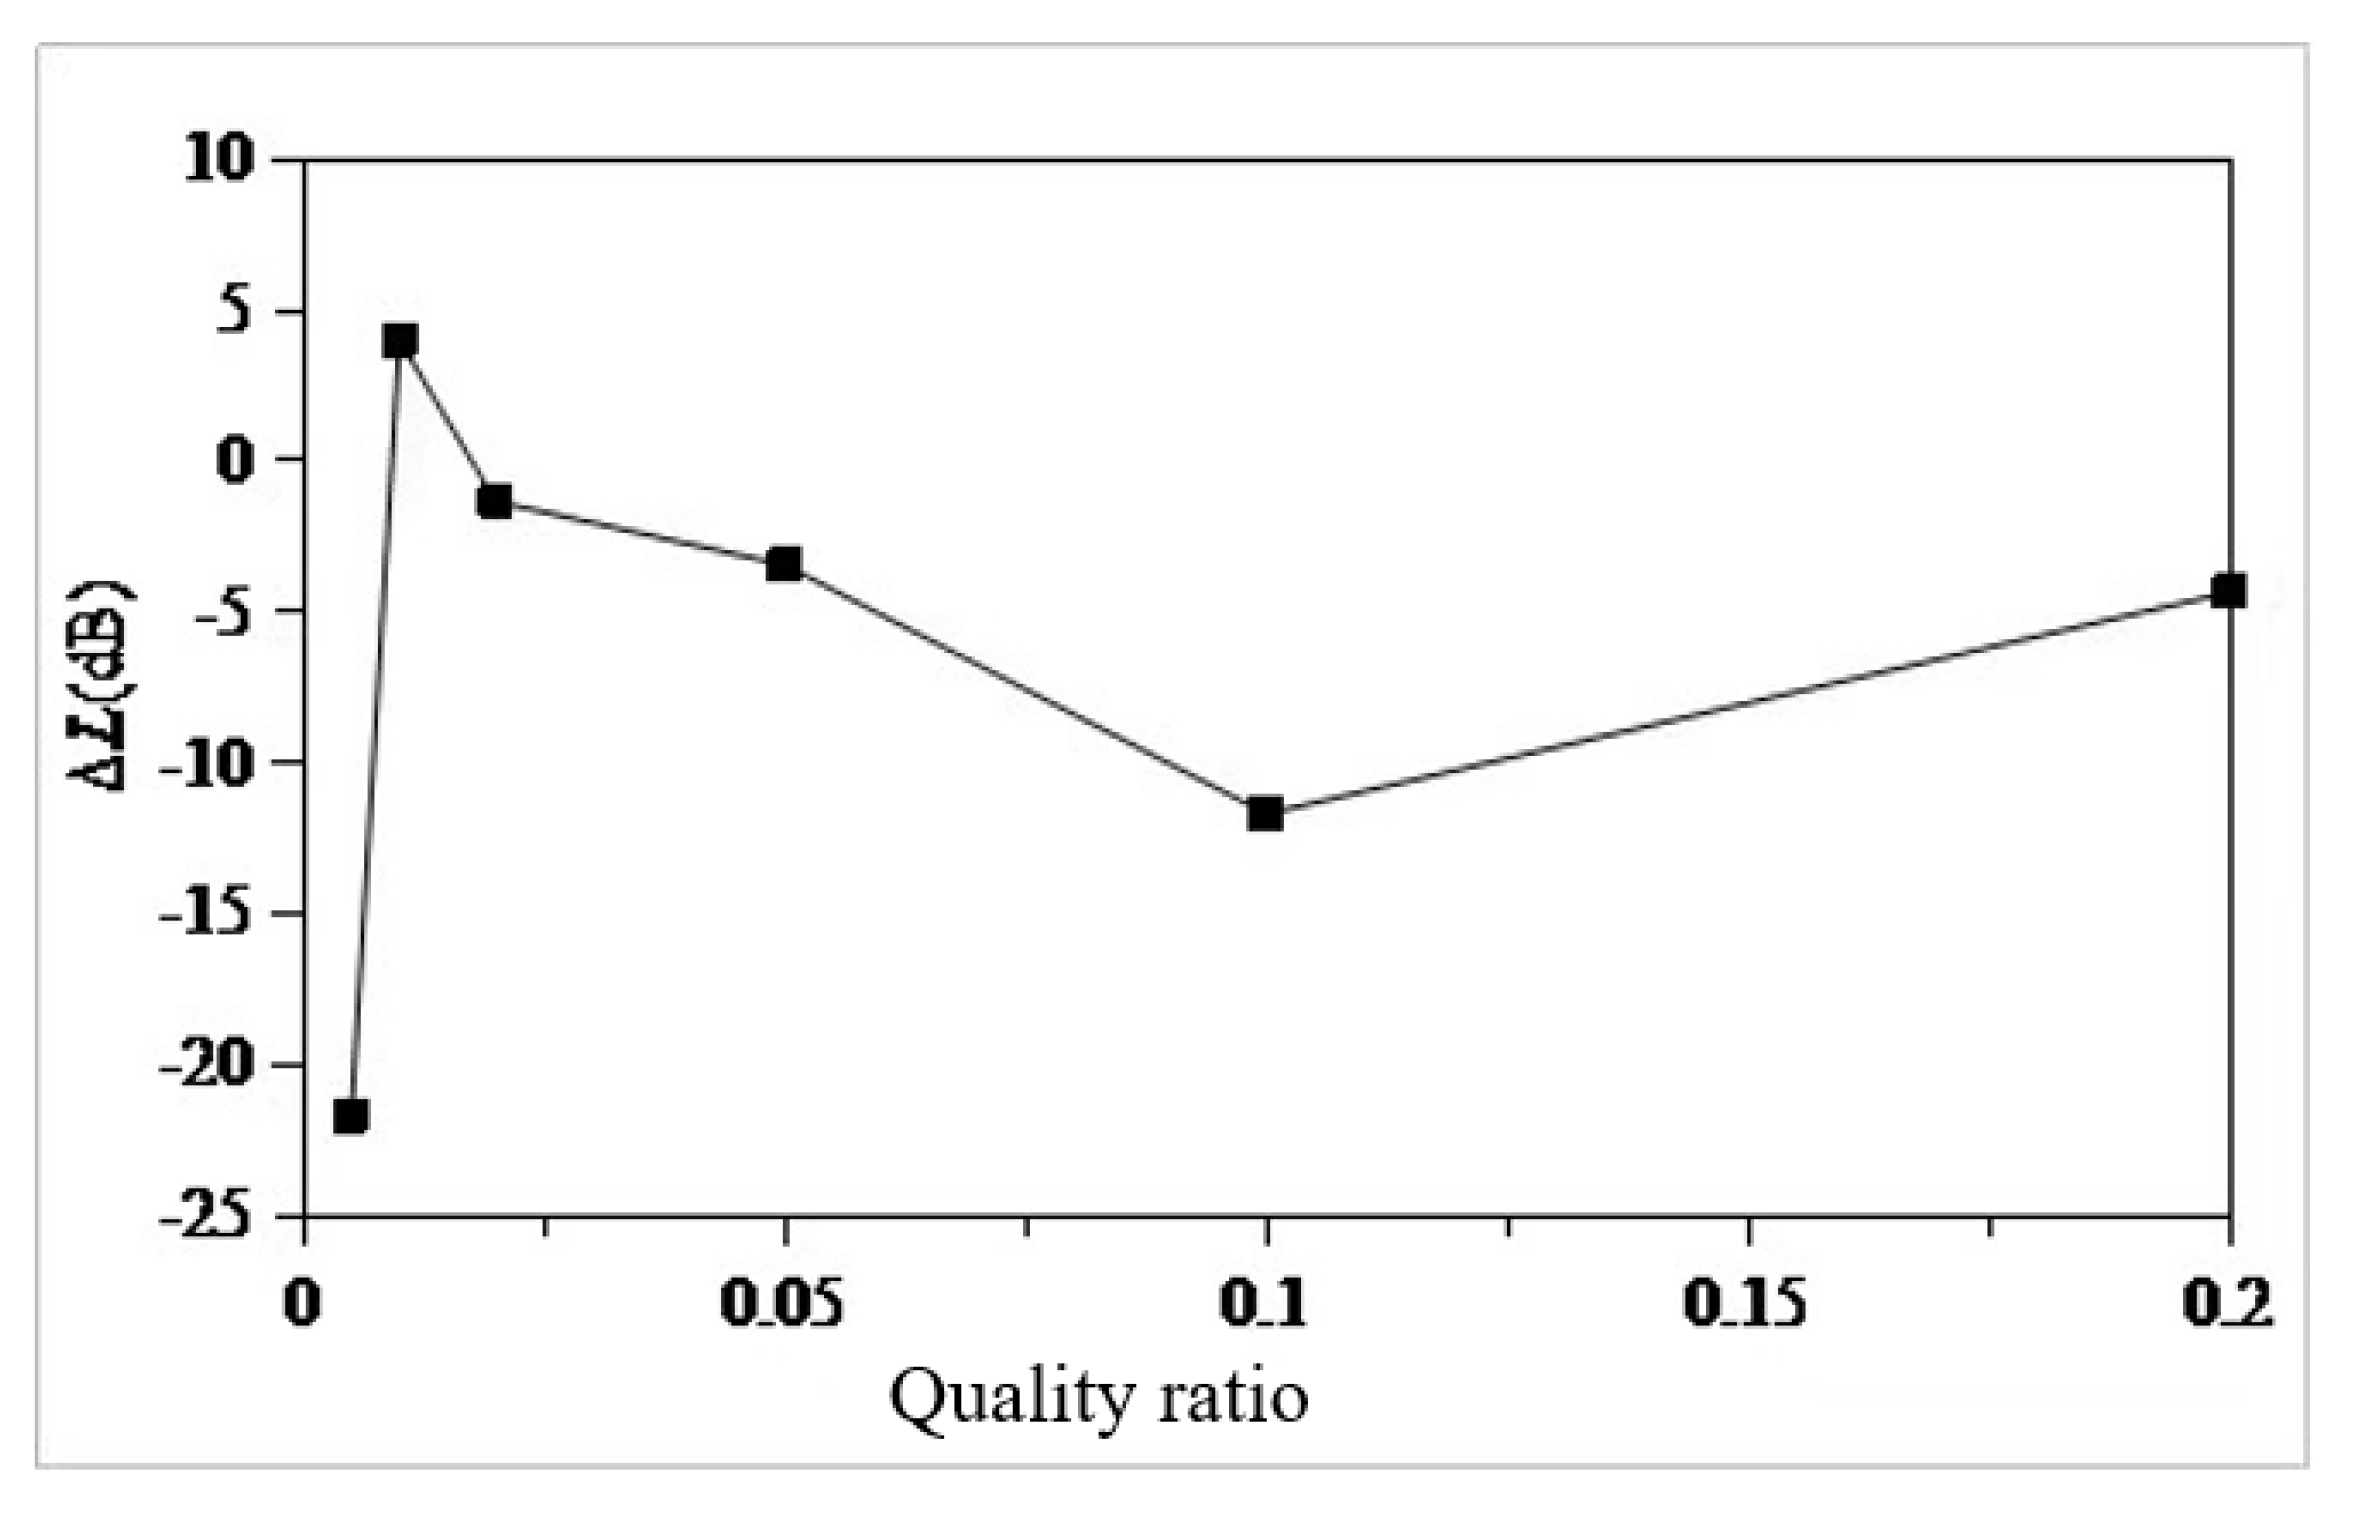
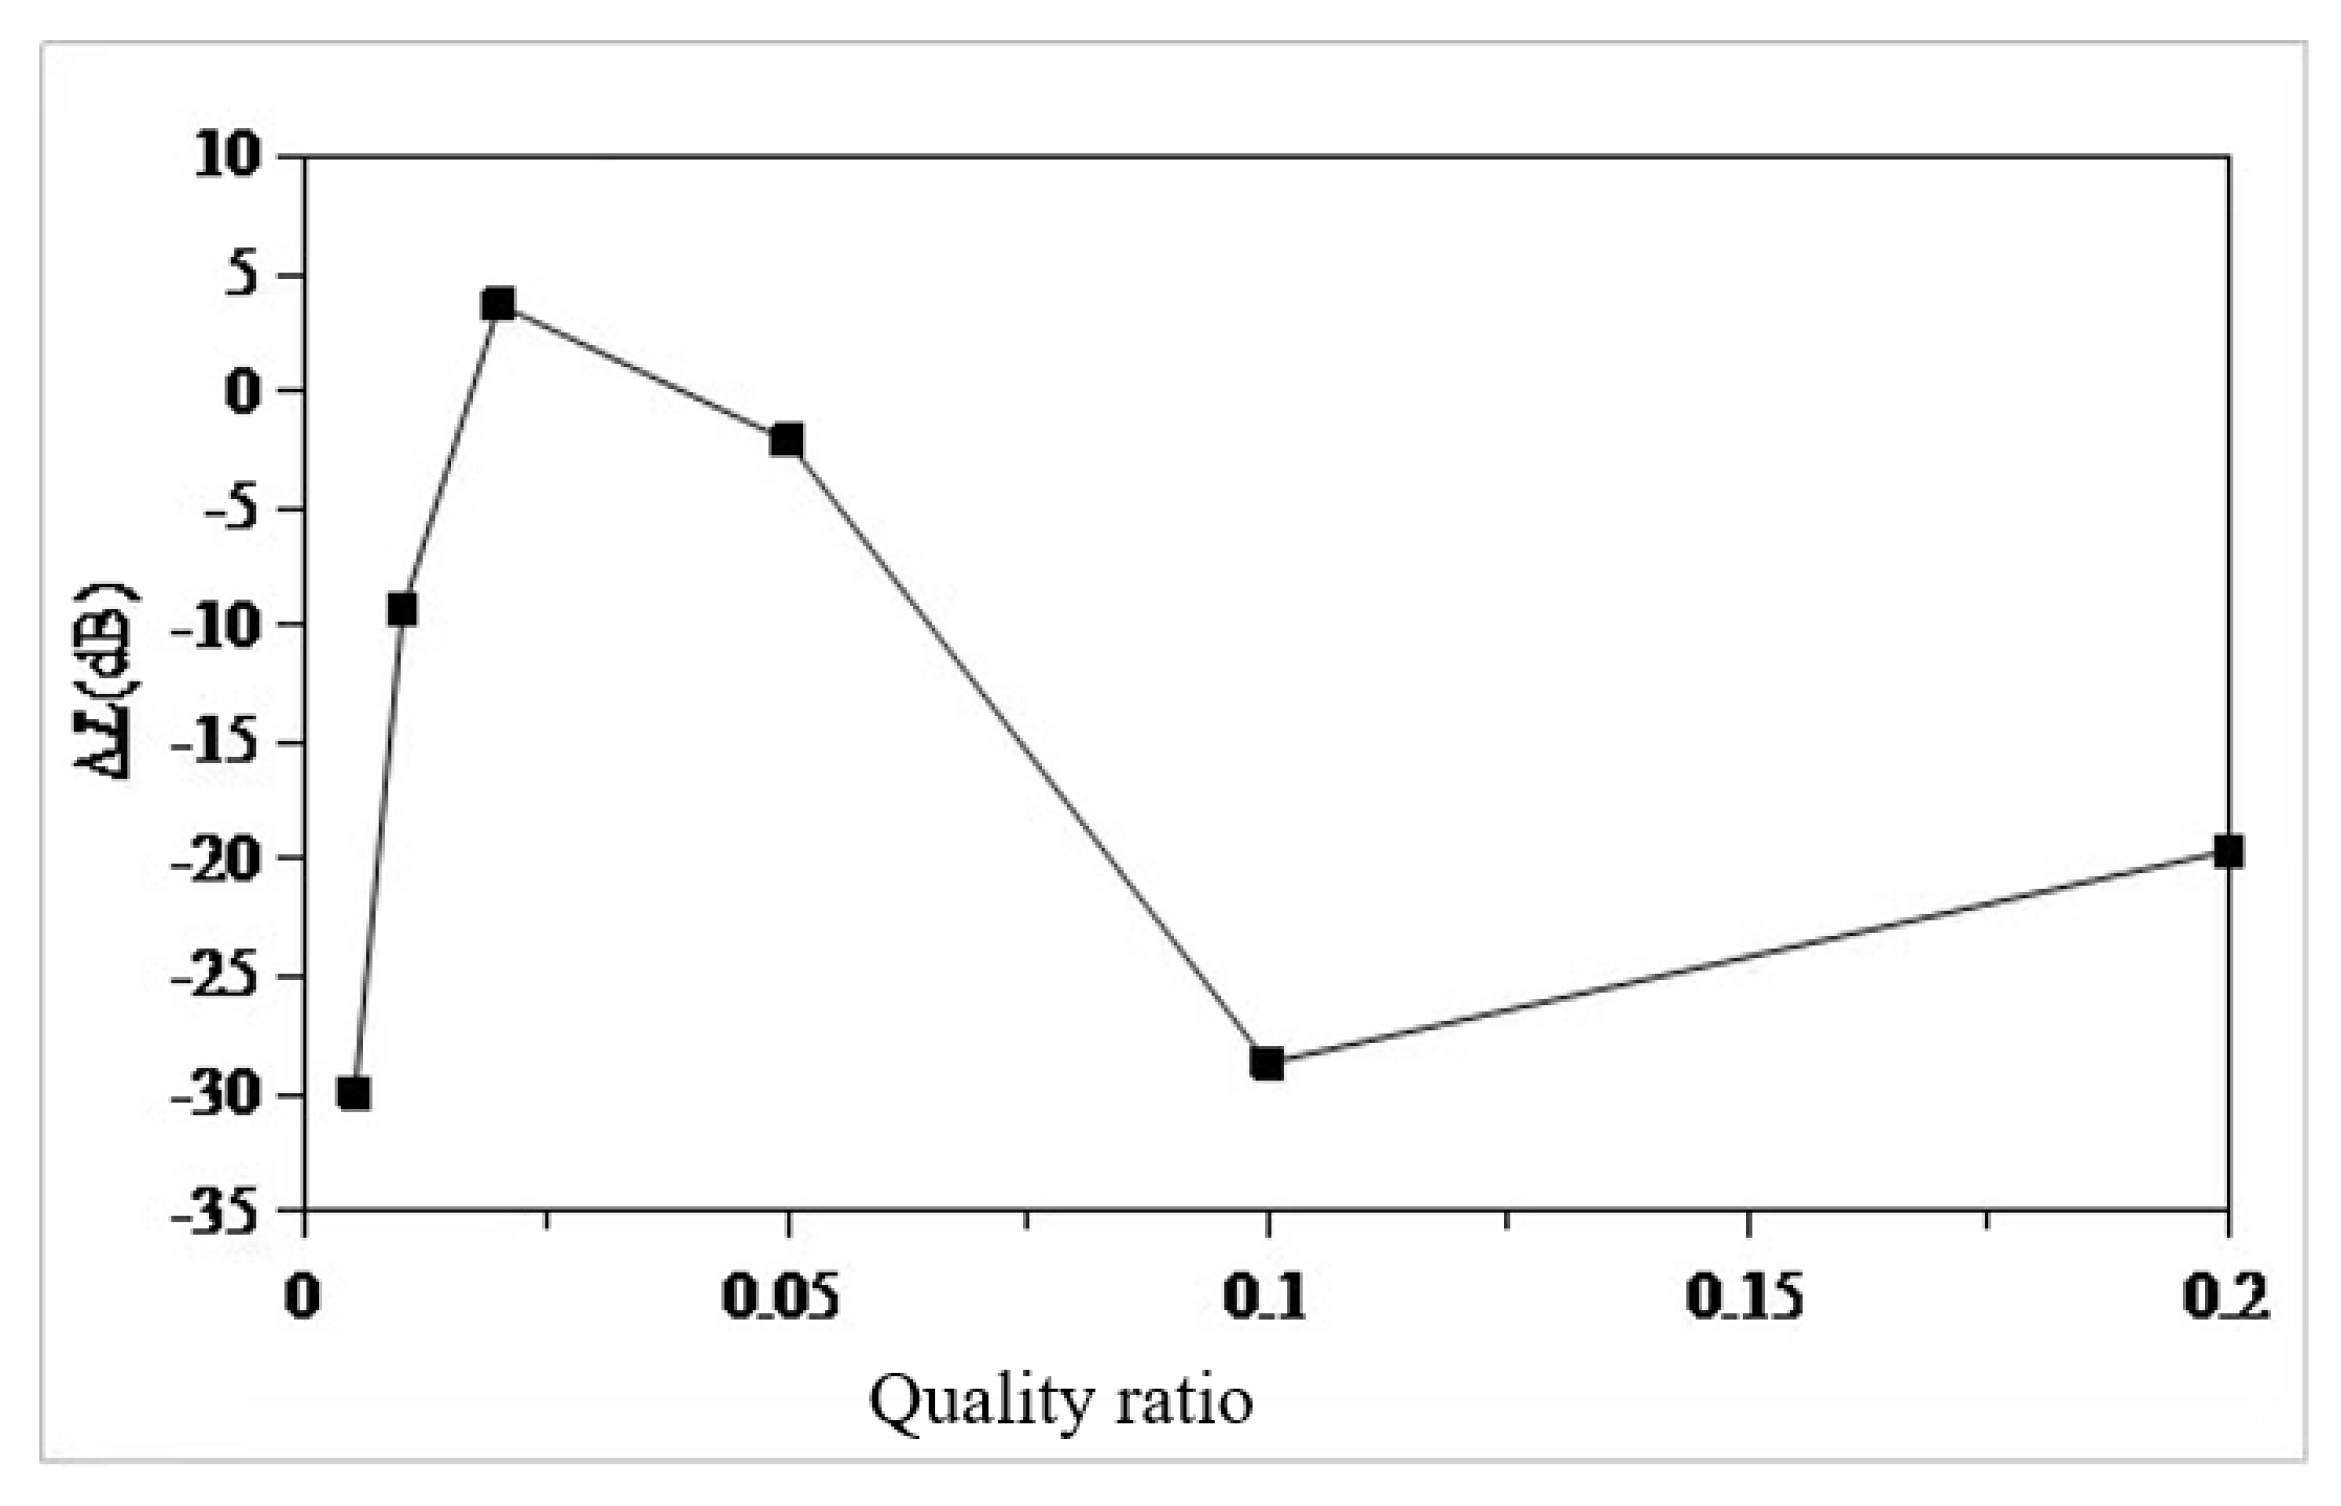
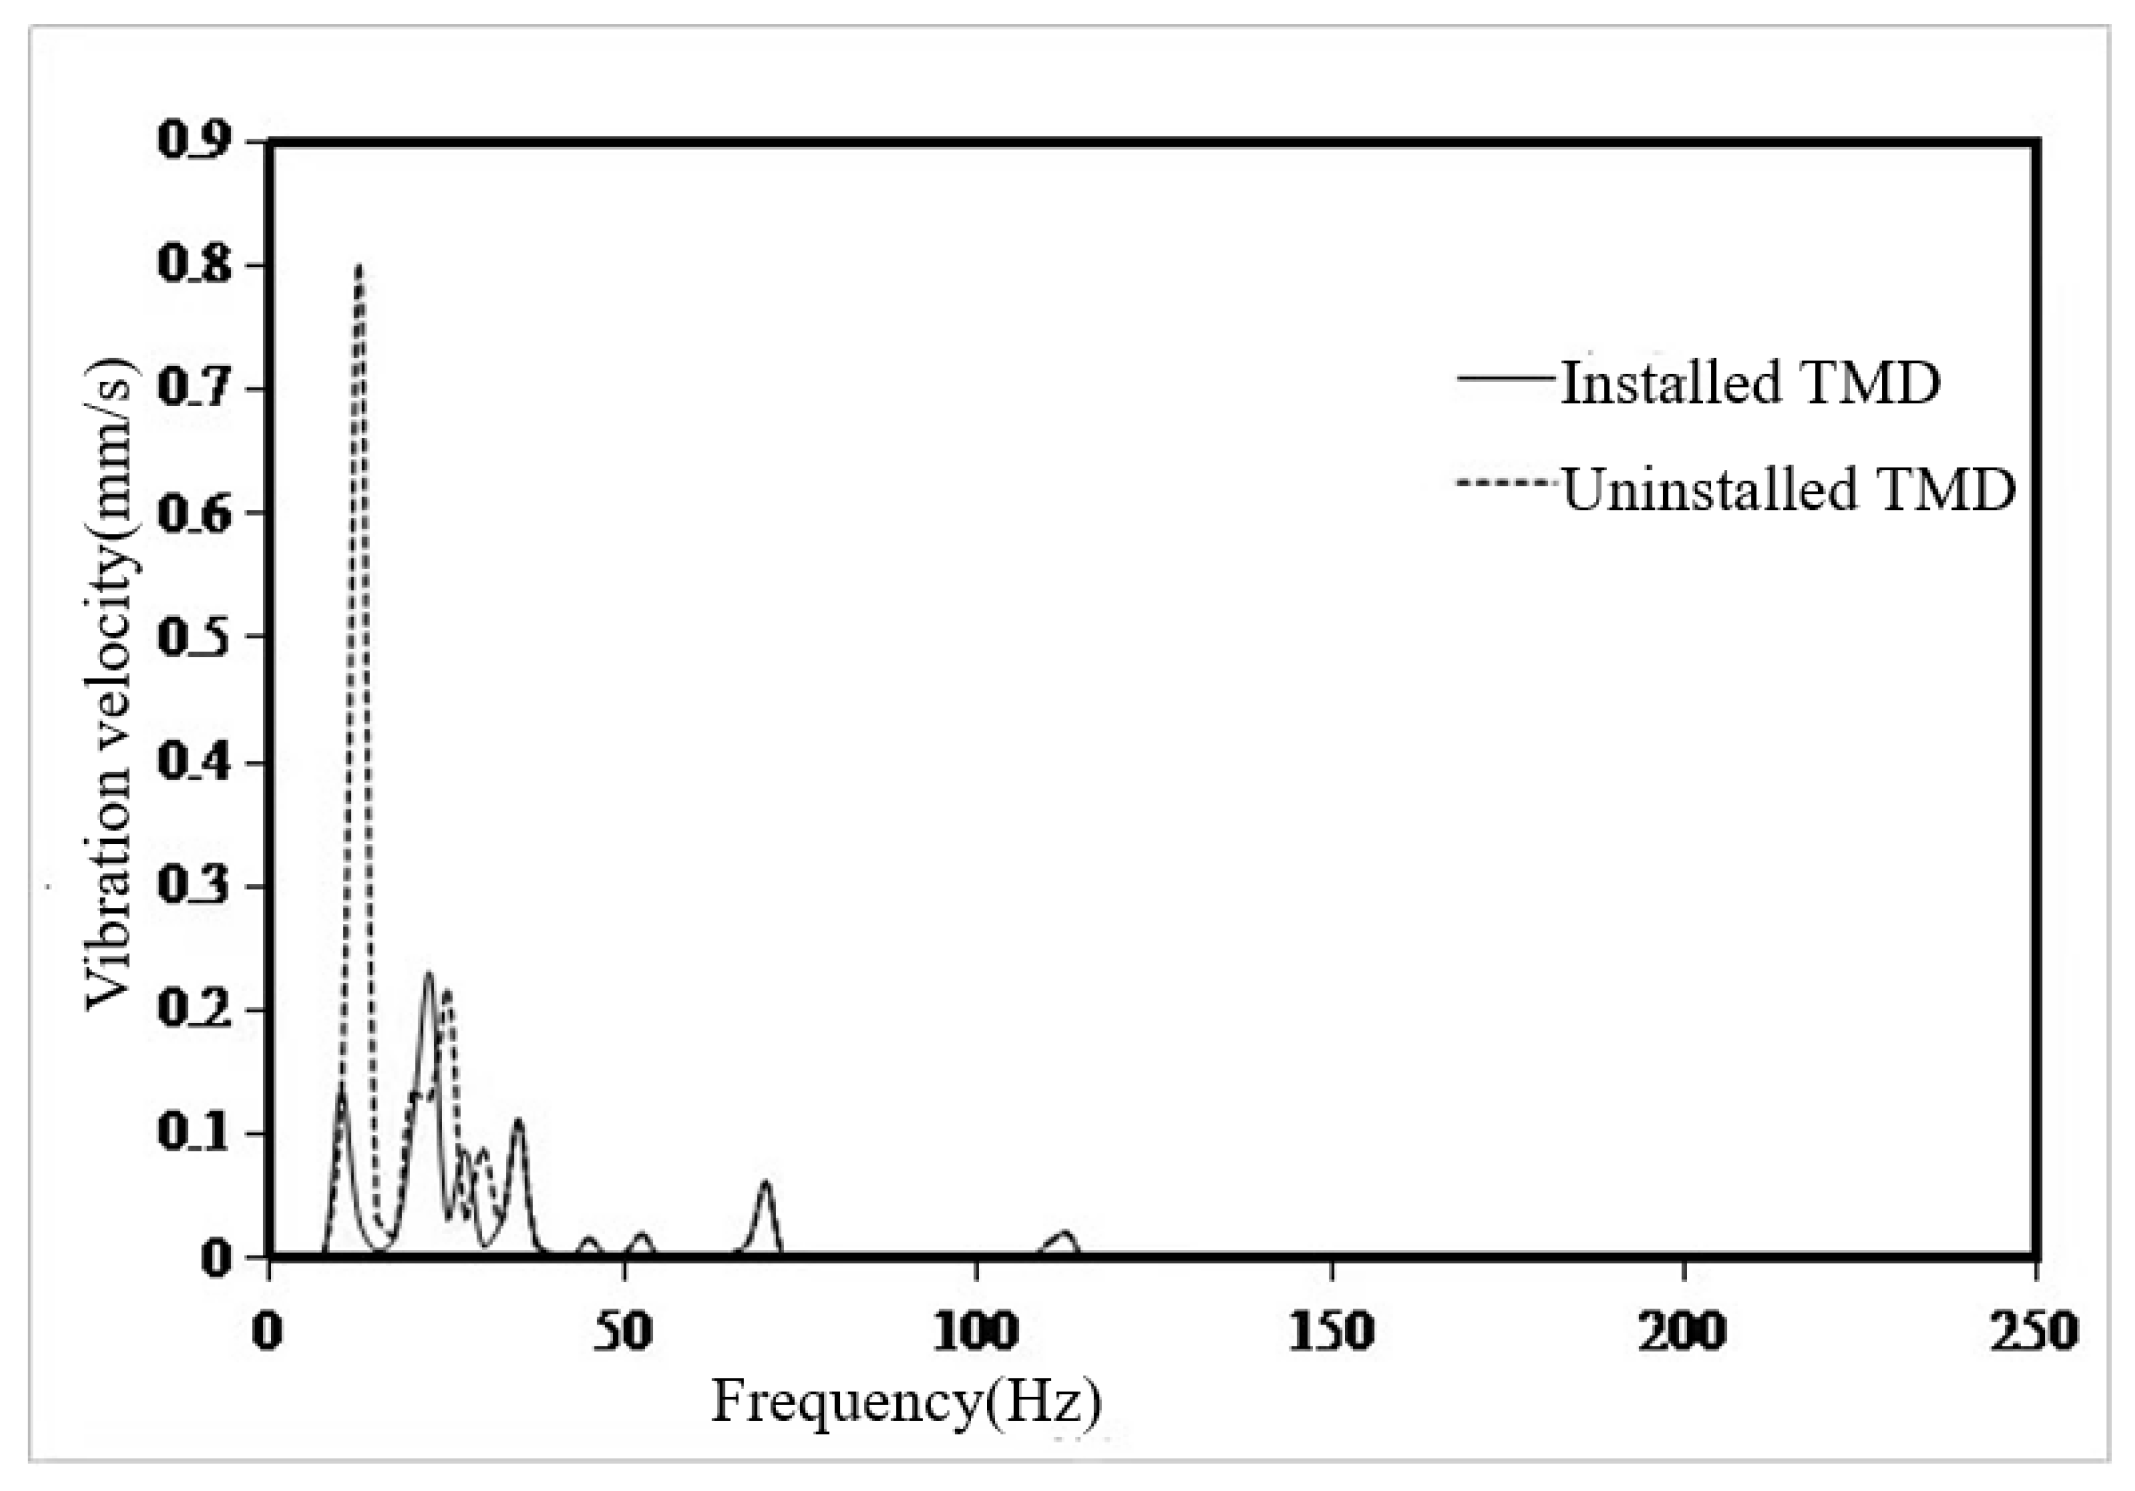
- Using the local mode equivalent mass solution method, the local equivalent mass of the seventh layer of the sun deck is solved. The mass ratio µ is set as 0.005,0.01,0.02,0.05,0.1,0.2. According to the six mass ratios, the six optimal parameters of TMD are determined. The optimal mass ratio of TMD in this region is determined to be 0.05. When the mass ratio of TMD is 0.05, the TMD has the vibration absorption effect of 31dB at 13.4Hz, and the amplitude response at 10Hz and 18.8Hz also has certain control effect, which are 3dB and 2dB respectively. The overall control frequency band is flat and the robustness is good. After TMD was installed on the model loaded with excitation source, the response around 13.4Hz decreased from 0.8mm/s to 0.13mm/, indicating that TMD has a good control effect.
Funding
Conflicts of Interest
References
- DNVGL.Vibration analysis report [R].U11058_101-012,2018.
- Shuai Bing. Local Vibration Analysis of a Container Ship Engine-room and Superstructure [D]. Guangzhou: South China University of Technology,2014.
- Zhang Yuan. Numerical Simulation and Measurement of Local Vibration of Small Coastal Research Ship [D]. Zhoushan: Zhejiang Ocean University,2015.
- Li Xiu-yan. Research on Vibration Prediction and Local structure Optimization of tuna longline Fishing Vessel [D]. Dalian: Dalian Ocean University,2019.
- Zhang Qiang. Study on Vibration Reduction of Stern of 1000 ton First Class refined Oil Product Ship [D]. Dalian: Dalian University of Technology, 2017.
- ZONG Zhi-xiang, WEN Yong-peng. Design method for multiple dynamic absorbers to reduce the vibration of a urban-rail vehicle body [J]. Journal of vibration and shock, 2020,39(02):154-162.
- ZHANG Ya-xin,LEI Xiao-yan. A model test study on controlling vibration of an elevated track box girder structure with TMD [J]. Journal of vibration and shock, 2021,40(16):220-226+233.
- TANG Si-cong,WANG Hai-long. Combined optimal design of MTMD system parameter and location applied in reducing floor vibration induced by human-induced loads [J]. Journal of vibration and shock, 2019,38(16):217-223.
- LIAN Ji-jian,ZHAO Yue. Vibration reduction of offshore wind turbine tube infrastructures based on EC-TMD [J]. Journal of vibration and shock, 2019,38(19):20-25.
- YANG Ying,JIN Licheng. TMD Vibration reduction analysis and optimal layout for submerged floating tunnel tube under moving load [J].Journal of Vibration and Shock,2024,43(01):165-171.
- Rahul Rana,Soon T T. Parametric study and simplified design of tuned mass dampers [J]. Engineering Structures, 1998 , 20(3):193-204.
- LI Bing, LIU Guangshuo. Numerical Simulation of Micro-vibration Response of Steel Structure Workshop under Vehicle Load and TMD Vibration Control [J]. Journal of Shenyang Jianzhu University(Natural Science), 2023, 39 (06): 970-978.
- CHEN Ling-shuang,LI Shu-jin. Pounding Tuned Mass Damperfor Vibration Control of Barge-type Floating Offshore Wind Turbine Subjected to Combined Wind and Wave Excitations [J]. Journal of Wuhan University of Technology, 2023, 45 (08): 88-94,132.
- ZHANG Kaidong, TIAN Shizhu. Application of Air Damping Type TMD in Human-induced Vibration Control [J]. Noise and Vibration Control, 2023, 43 (03): 249-253,281.
- Su Z, Zheng Z, Huang X, et al. Research on dynamic vibration absorber with negative stiffness for controlling longitudinal vibration of propulsion shafting system [J]. Ocean Engineering, 2022, 264: 112375.
- Ghasemi M R, Shabakhty N, Enferadi M H. Vibration control of offshore jacket platforms through shape memory alloy pounding tuned mass damper (SMA-PTMD) [J]. Ocean Engineering, 2019, 191: 106348.
- Wu J, Zhu H, Sun Y, et al. Reduction of flexural vibration of a fluid-filled pipe with attached vibration absorbers [J]. International Journal of Pressure Vessels and Piping, 2021, 194: 104525.
- ZHU da-zhuang,XIONG shi-shu. Study of vibration damping of wind turbine towers by rotary inertia tuned mass dampers [J]. Construction & Design for Engineering,2021,69(23);31-33,36.
- Bei Hu Yidong. Dynamic Vibration Absorber and Its Application [M]. China Machinery Publishing,2013.
- LIU Zhen-zhen,JIANG Guo-he. Vibration characteristics of a 100 m new type of polar exploration cruise [J]. Journal of vibration and shock, 2021,40(06):212-219.


| Quality ration | The total quality of TMD(T) | The total rigidity of TMD(N/m) | ||
| 0.50% | 0.017 | 122.8 | 0.995 | 0.043 |
| 1% | 0.035 | 243 | 0.99 | 0.06 |
| 2% | 0.069 | 476.7 | 0.98 | 0.085 |
| 5% | 0.173 | 1124.7 | 0.95 | 0.13 |
| 10% | 0.346 | 2049.5 | 0.91 | 0.185 |
| 20% | 0.69 | 3444.3 | 0.83 | 0.25 |
Disclaimer/Publisher’s Note: The statements, opinions and data contained in all publications are solely those of the individual author(s) and contributor(s) and not of MDPI and/or the editor(s). MDPI and/or the editor(s) disclaim responsibility for any injury to people or property resulting from any ideas, methods, instructions or products referred to in the content. |
© 2024 by the authors. Licensee MDPI, Basel, Switzerland. This article is an open access article distributed under the terms and conditions of the Creative Commons Attribution (CC BY) license (http://creativecommons.org/licenses/by/4.0/).


