Submitted:
15 April 2024
Posted:
16 April 2024
You are already at the latest version
Abstract
Keywords:
1. Introduction
2. Magnetar QPOs
3. Crustal Equilibrium
4. Shear Modulus
5. Crustal Torsional Oscillations
5.1. Torsional Oscillations Excited in the Spherical Nuclei
5.2. Torsional Oscillations Excited in the Spherical and Cylindrical Nuclei
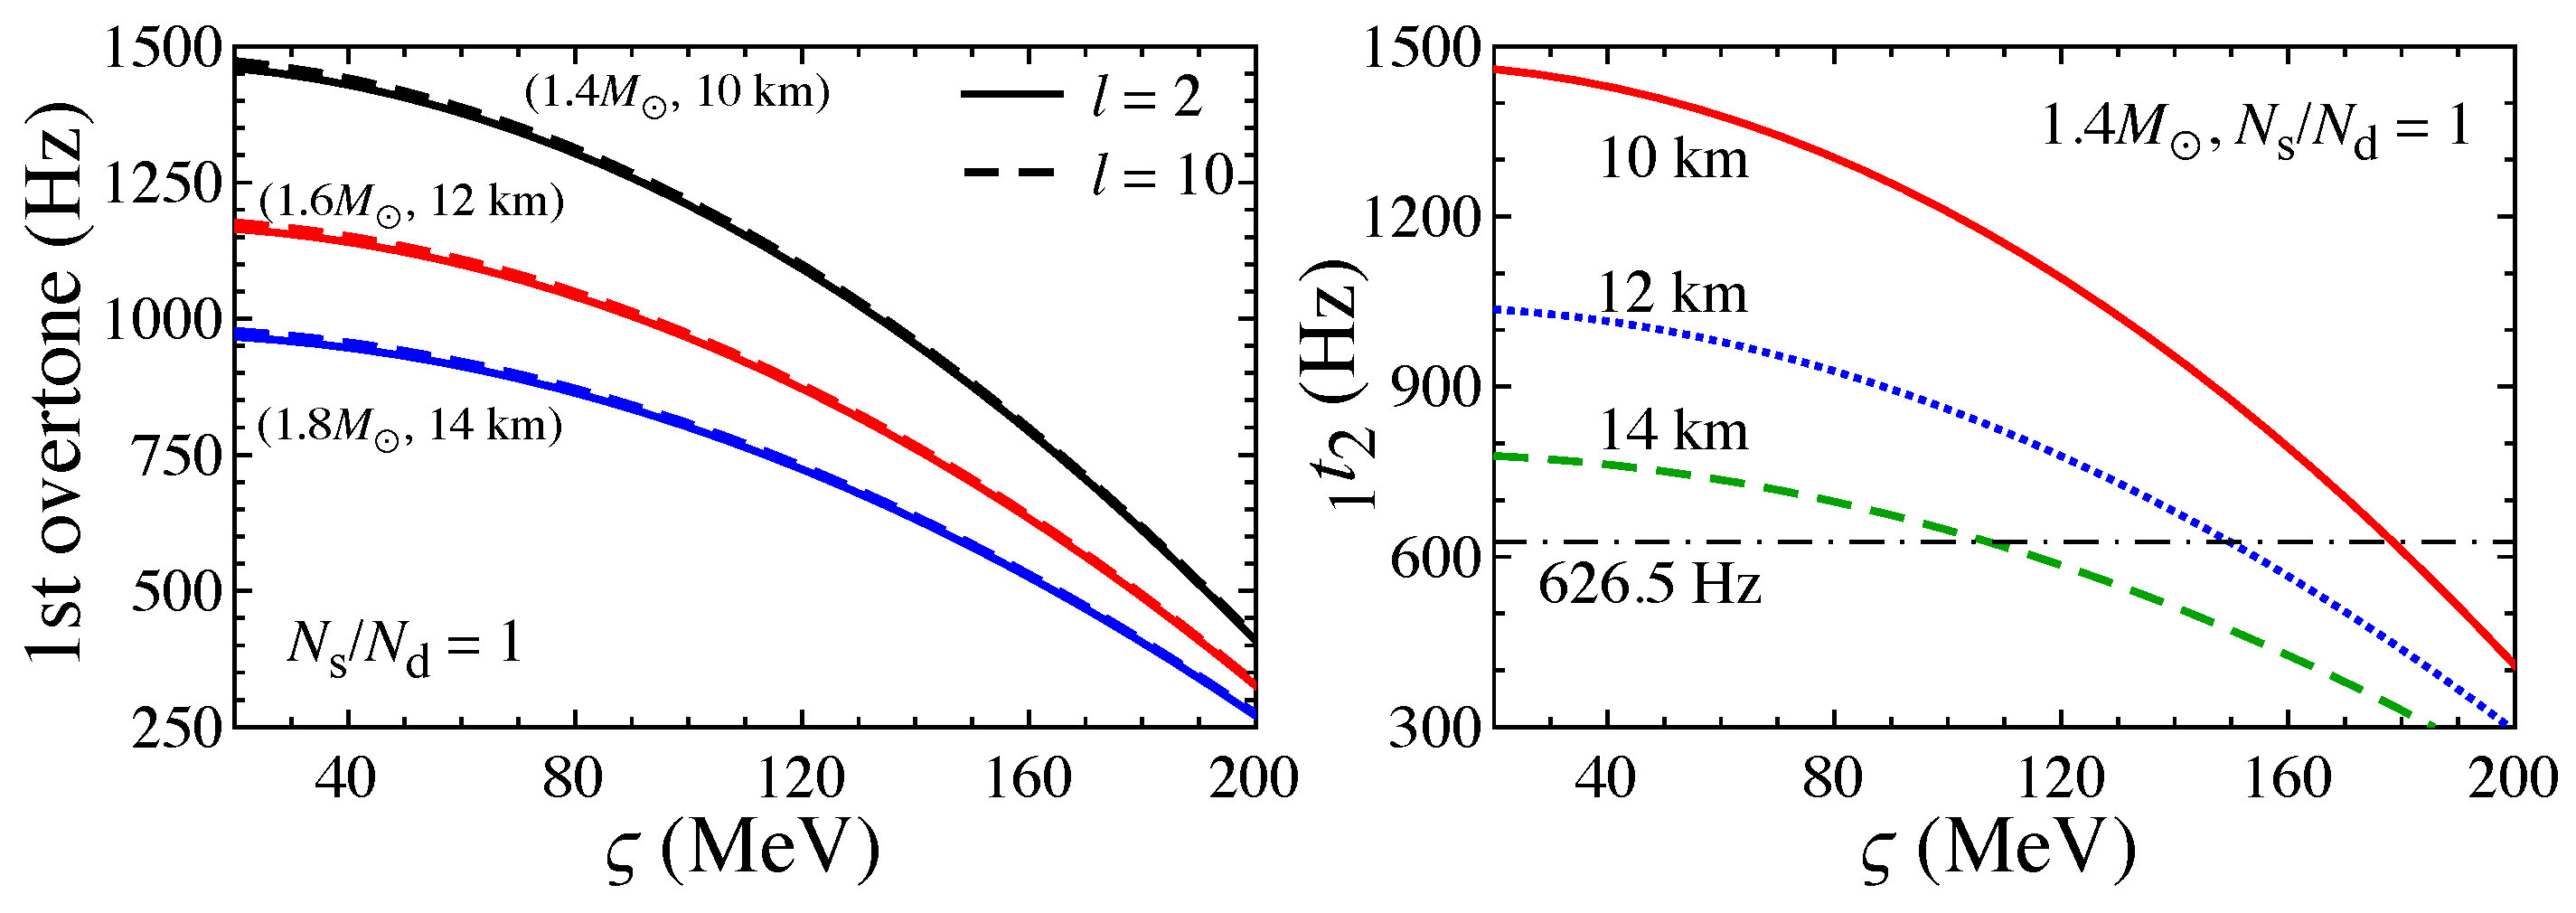
5.3. Torsional Oscillations Excited in the Cylindrical-Hole and Spherical-Hole Nuclei
5.4. Constraint on a Neutron Star Model for GRB 200415A
6. Shear and Interface Oscillations
7. Discussion and Conclusions
Funding
Institutional Review Board Statement
Informed Consent Statement
Data Availability Statement
Acknowledgments
Conflicts of Interest
Abbreviations
| QPOs | Quasi-periodic oscillations |
| SGR | Soft-gamma repeater |
| EOSs | Equations of state |
| TOV | Tolman-Oppenheimer-Volkoff |
References
- Shapiro, S.L.; Teukolsky, S.A. Black Holes, White Dwarfs, and Neutron Stars: The Physics of Compact Objects; Wiley-Interscience: New York, 1983. [Google Scholar]
- Shlomo, S.; Kolomietz, V.M.; Colò, G. Deducing the nuclear-matter incompressibility coefficient from data on isoscalar compression modes. Eur. Phys. J. A 2006, 30, 23. [Google Scholar] [CrossRef]
- Tsang, M.B.; et al. Constraints on the symmetry energy and neutron skins from experiments and theory. Phys. Rev. C 2012, 86, 015803. [Google Scholar] [CrossRef]
- Khan, E.; Margueron, J. Determination of the density dependence of the nuclear incompressibility. Phys. Rev. C 2013, 88, 034319. [Google Scholar] [CrossRef]
- Stone, J.R.; Stone, N.J.; Moszkowski, S.A. Incompressibility in finite nuclei and nuclear matter. Phys. Rev. C 2014, 89, 044316. [Google Scholar] [CrossRef]
- Viñas, X.; Centelles, M.; Roca-Maza, X.; Warda, M. Density dependence of the symmetry energy from neutron skin thickness in finite nuclei. Eur. Phys. J. A 2014, 50, 27. [Google Scholar] [CrossRef]
- Newton, W.G.; Hooker, J.; Gearheart, M.; Murphy, K.; Wen, D.H.; Fattoyev, F.J.; Li, B.A. Constraints on the symmetry energy from observational probes of the neutron star crust. Eur. Phys. J. A 2014, 50, 41. [Google Scholar] [CrossRef]
- Oertel, M.; Hempel, M.; Klähn, T.; Typel, S. Equations of state for supernovae and compact stars. Rev. Mod. Phys. 2017, 89, 015007. [Google Scholar] [CrossRef]
- Li, B.A.; Krastev, P.G.; Wen, D.H.; Zhang, N.B. Towards understanding astrophysical effects of nuclear symmetry energy. Eur. Phys. J. A 2019, 55, 117. [Google Scholar] [CrossRef]
- Demorest, P.; Pennucci, T.; Ransom, S.; Roberts, M.; Hessels, J. A two-solar-mass neutron star measured using Shapiro delay. Nature (London) 2010, 467, 1081. [Google Scholar] [CrossRef]
- Antoniadis, J.; et al. A Massive Pulsar in a Compact Relativistic Binary. Science 2013, 340, 6131. [Google Scholar] [CrossRef]
- Cromartie, H.T.; et al. Relativistic Shapiro delay measurements of an extremely massive millisecond pulsar. Nat. Astron. 2020, 4, 72. [Google Scholar] [CrossRef]
- Fonseca, E.; et al. Refined Mass and Geometric Measurements of the High-mass PSR J0740+6620. Astrophys. J. 2021, 915, L12. [Google Scholar] [CrossRef]
- Abbott, B.P.; et al. (The LIGO Scientific Collaboration and the Virgo Collaboration). GW170817: Observation of Gravitational Waves from a Binary Neutron Star Inspiral. Phys. Rev. Lett. 2017, 119, 161101. [Google Scholar] [CrossRef] [PubMed]
- Annala, E.; Gorda, T.; Kurkela, A.; Vuorinen, A. Gravitational-Wave Constraints on the Neutron-Star-Matter Equation of State. Phys. Rev. Lett. 2018, 120, 172703. [Google Scholar] [CrossRef] [PubMed]
- Pechenick, K.R.; Ftaclas, C.; Cohen, J.M. Hot spots on neutron stars - The near-field gravitational lens. Astrophys. J. 1983, 274, 846. [Google Scholar] [CrossRef]
- Leahy, D.A.; Li, L. Including the effect of gravitational light bending in X-ray profile modelling. Mon. Not. R. Astron. Soc. 1995, 277, 1177. [Google Scholar] [CrossRef]
- Poutanen, J.; Gierlinski, M. On the nature of the X-ray emission from the accreting millisecond pulsar SAX J1808.4-3658. Mon. Not. R. Astron. Soc. 2003, 343, 1301. [Google Scholar] [CrossRef]
- Psaltis, D.; Özel, F. Pulse Profiles from Spinning Neutron Stars in the Hartle-Thorne Approximation. Astrophys. J. 2014, 792, 87. [Google Scholar] [CrossRef]
- Sotani, H.; Miyamoto, U. Systematical study of pulsar light curves with special relativistic effects. Phys. Rev. D 2018, 98. [Google Scholar] [CrossRef]
- Sotani, H. Light curves from highly compact neutron stars with spot size effect. Phys. Rev. D 2020, 101, 063013. [Google Scholar] [CrossRef]
- Riley, T.E.; et al. A NICER View of PSR J0030+0451: Millisecond Pulsar Parameter Estimation. Astrophys. J. 2019, 887, L21. [Google Scholar] [CrossRef]
- Miller, M.C.; et al. PSR J0030+0451 Mass and Radius from NICER Data and Implications for the Properties of Neutron Star Matter. Astrophys. J. 2019, 887, L24. [Google Scholar] [CrossRef]
- Riley, T.E.; et al. A NICER View of the Massive Pulsar PSR J0740+6620 Informed by Radio Timing and XMM-Newton Spectroscopy. Astrophys. J. 2021, 918, L27. [Google Scholar] [CrossRef]
- Miller, M.C.; et al. The Radius of PSR J0740+6620 from NICER and XMM-Newton Data. Astrophys. J. 2021, 918, L28. [Google Scholar] [CrossRef]
- Sotani, H.; Nishimura, N.; Naito, T. New constraints on the neutron-star mass and radius relation from terrestrial nuclear experiments. Prog. Theor. Exp. Phys. 2022, 2022, 041D01. [Google Scholar] [CrossRef]
- Sotani, H.; Ota, S. Neutron star mass formula with nuclear saturation parameters for asymmetric nuclear matter. Phys. Rev. D 2022, 106, 103005. [Google Scholar] [CrossRef]
- Sotani, H.; Naito, T. Empirical neutron star mass formula based on experimental observables. Phys. Rev. C 2023, 107, 035802. [Google Scholar] [CrossRef]
- Steiner, A.W.; Lattimer, J.M.; Brown, E.F. The Neutron Star Mass-Radius Relation and the Equation of State of Dense Matter. Astrophys. J. 2013, 765, L5. [Google Scholar] [CrossRef]
- Lattimer J., M. The Nuclear Equation of State and Neutron Star Masses. Annu. Rev. Nucl. Part. Sci. 2012, 62, 485. [Google Scholar] [CrossRef]
- Reed, B.T.; Fattoyev, F.J.; Horowitz, C.J.; Piekarewicz, J. Implications of PREX-2 on the Equation of State of Neutron-Rich Matter. Phys. Rev. Lett. 2021, 126, 172503. [Google Scholar] [CrossRef]
- Estee, J.; et al. Probing the Symmetry Energy with the Spectral Pion Ratio. Phys. Rev. Lett. 2021, 126, 162701. [Google Scholar] [CrossRef] [PubMed]
- Zenihiro, J.; et al. Neutron density distributions of 204,206,208Pb deduced via proton elastic scattering at Ep=295 MeV. Phys. Rev. C 2010, 82, 044611. [Google Scholar] [CrossRef]
- Sotani, H.; Iida, K.; Oyamatsu, K.; Ohnishi, A. Mass and radius formulas for low-mass neutron stars. Prog. Theor. Exp. Phys. 2014, 2014, 051E01. [Google Scholar] [CrossRef]
- Andersson, N.; Kokkotas, K.D. Gravitational Waves and Pulsating Stars: What Can We Learn from Future Observations? Phys. Rev. Lett. 1996, 77, 4134. [Google Scholar] [CrossRef] [PubMed]
- Andersson, N.; Kokkotas, K.D. Towards gravitational wave asteroseismology. Mon. Not. R. Astron. Soc. 1998, 299, 1059. [Google Scholar] [CrossRef]
- Sotani, H.; Tominaga, K.; Maeda, K.I. Density discontinuity of a neutron star and gravitational waves. Phys. Rev. D 2001, 65, 024010. [Google Scholar] [CrossRef]
- Sotani, H.; Kohri, K.; Harada, T. Restricting quark matter models by gravitational wave observation. Phys. Rev. D 2004, 69, 084008. [Google Scholar] [CrossRef]
- Sotani, H.; Yasutake, N.; Maruyama, T.; Tatsumi, T. Signatures of hadron-quark mixed phase in gravitational waves. Phys. Rev. D 2011, 83, 024014. [Google Scholar] [CrossRef]
- Passamonti, A.; Andersson, N. Towards real neutron star seismology: accounting for elasticity and superfluidity. Mon. Not. R. Astron. Soc. 2012, 419, 638. [Google Scholar] [CrossRef]
- Doneva, D.D.; Gaertig, E.; Kokkotas, K.D.; Kruüger, C. Gravitational wave asteroseismology of fast rotating neutron stars with realistic equations of state. Phys. Rev. D 2013, 88, 044052. [Google Scholar] [CrossRef]
- Kruüger, C.J.; Ho, W.C. G.; Andersson, N. Seismology of adolescent neutron stars: Accounting for thermal effects and crust elasticity. Phys. Rev. D 2015, 92, 063009. [Google Scholar] [CrossRef]
- Sotani, H. Neutron star asteroseismology and nuclear saturation parameter. Phys. Rev. D 2021, 103, 123015. [Google Scholar] [CrossRef]
- Sotani, H.; Kumar, B. Universal relations between the quasinormal modes of neutron star and tidal deformability. Phys. Rev. D 2021, 104, 123002. [Google Scholar] [CrossRef]
- Sotani, H.; Dohi, A. Gravitational wave asteroseismology on cooling neutron stars. Phys. Rev. D 2022, 105, 023007. [Google Scholar] [CrossRef]
- Sotani, H.; Takiwaki, T. Gravitational wave asteroseismology with protoneutron stars. Phys. Rev. D 2016, 94, 044043. [Google Scholar] [CrossRef]
- Sotani, H.; Kuroda, T.; Takiwaki, T.; Kotake, K. Probing mass-radius relation of protoneutron stars from gravitational-wave asteroseismology. Phys. Rev. D 2017, 96, 063005. [Google Scholar] [CrossRef]
- Morozova, V.; Radice, D.; Burrows, A.; Vartanyan, D. The Gravitational Wave Signal from Core-collapse Supernovae. Astrophys. J. 2018, 861, 10. [Google Scholar] [CrossRef]
- Torres-Forné, A.; Cerdá-Durán, P.; Passamonti, A.; Obergaulinger, M.; Font, J.A. Towards asteroseismology of core-collapse supernovae with gravitational wave observations – II. Inclusion of space-time perturbations. Mon. Not. R. Astron. Soc. 2019, 482, 3967. [Google Scholar] [CrossRef]
- Sotani, H.; Sumiyoshi, K. Determination of properties of protoneutron stars toward black hole formation via gravitational wave observations. Phys. Rev. D 2019, 100, 083008. [Google Scholar] [CrossRef]
- Sotani, H.; Takiwaki, T. Avoided crossing in gravitational wave spectra from protoneutron star. Mon. Not. R. Astron. Soc. 2020, 498, 3503. [Google Scholar] [CrossRef]
- Sotani, H.; Takiwaki, T.; Togashi, H. Universal relation for supernova gravitational waves. Phys. Rev. D 2021, 104, 123009. [Google Scholar] [CrossRef]
- Israel, G.L.; et al. The Discovery of Rapid X-Ray Oscillations in the Tail of the SGR 1806-20 Hyperflare. Astrophys. J. 2005, 628, L53. [Google Scholar] [CrossRef]
- Strohmayer, T.E.; Watts, A.L. Discovery of Fast X-Ray Oscillations during the 1998 Giant Flare from SGR 1900+14. Astrophys. J. 2005, 632, L111. [Google Scholar] [CrossRef]
- Strohmayer, T.E.; Watts, A.L. The 2004 Hyperflare from SGR 1806-20: Further Evidence for Global Torsional Vibrations. Astrophys. J. 2006, 653, 593. [Google Scholar] [CrossRef]
- Huppenkothen, D.; et al. Quasi-periodic oscillations in short recurring bursts of the soft gamma repeater J1550-5418. Astrophys. J. 2014, 787, 128. [Google Scholar] [CrossRef]
- Huppenkothen, D.; Heil, L.M.; Watts, A.L.; Göğüş, E. Quasi-Periodic Oscillations in Short Recurring Bursts of the magnetars SGR 1806-20 and SGR 1900+14 Observed With RXTE. Astrophys. J. 2014, 795, 114. [Google Scholar] [CrossRef]
- Miller, M.C.; Chirenti, C.; Strohmayer, T.E. On the Persistence of QPOs during the SGR 1806-20 Giant Flare. Astrophys. J. 2019, 871, 95. [Google Scholar] [CrossRef]
- Castro-Tirado, A.J.; et al. Very-high-frequency oscillations in the main peak of a magnetar giant flare. Nature 2021, 600, 621. [Google Scholar] [CrossRef]
- Sotani, H.; Kokkotas, K.D.; Stergioulas, N. Torsional oscillations of relativistic stars with dipole magnetic fields. Mon. Not. Roy. Astron. Soc. 2007, 375, 261. [Google Scholar] [CrossRef]
- Gabler, M.; Cerdá-Durán, P.; Font, J.A.; Muller, E.; Stergioulas, N. Magneto-elastic oscillations of neutron stars II: exploring different magnetic field configurations. Mon. Not. Roy. Astron. Soc. 2013, 430, 1811. [Google Scholar] [CrossRef]
- Gabler, M.; Cerdá-Durán, P.; Stergioulas, N.; et al. Constraining properties of high-density matter in neutron stars with magneto-elastic oscillations. Mon. Not. Roy. Astron. Soc. 2018, 476, 4199. [Google Scholar] [CrossRef]
- Steiner, A.W.; Watts, A.L. Constraints on Neutron Star Crusts from Oscillations in Giant Flares. Phys. Rev. Lett. 2009, 103, 181101. [Google Scholar] [CrossRef]
- Gearheart, M.; Newton, W.G.; Hooker, J.; Li, B.A. Upper limits on the observational effects of nuclear pasta in neutron stars. Mon. Not. Roy. Astron. Soc. 2011, 418, 2343. [Google Scholar] [CrossRef]
- Sotani, H.; Nakazato, K.; Iida, K.; Oyamatsu, K. Probing the Equation of State of Nuclear Matter via Neutron Star Asteroseismology. Phys. Rev. Lett. 2012, 108, 201101. [Google Scholar] [CrossRef] [PubMed]
- Sotani, H.; Nakazato, K.; Iida, K.; Oyamatsu, K. Effect of superfluidity on neutron star oscillations. Mon. Not. Roy. Astron. Soc. 2013, 428, L21. [Google Scholar] [CrossRef]
- Sotani, H.; Nakazato, K.; Iida, K.; Oyamatsu, K. Possible constraints on the density dependence of the nuclear symmetry energy from quasi-periodic oscillations in soft gamma repeaters. Mon. Not. Roy. Astron. Soc. 2013, 434, 2060. [Google Scholar] [CrossRef]
- Deibel, A.T.; Steiner, A.W.; Brown, E.F. Magnetar giant flare oscillations and the nuclear symmetry energy. Phys. Rev. C 2014, 90, 025802. [Google Scholar] [CrossRef]
- Sotani, H.; Iida, K.; Oyamatsu, K. Astrophysical implications of double-layer torsional oscillations in a neutron star crust as a lasagna sandwich. Mon. Not. Roy. Astron. Soc. 2019, 489, 3022. [Google Scholar] [CrossRef]
- Troja, E.; Rosswog, S.; Gehrels, N. Precursors of short gamma-ray bursts. Astrophys. J. 2010, 723, 1711. [Google Scholar] [CrossRef]
- Tsang, D.; Read, J.S.; Hinderer, T.; Piro, A.L.; Bondarescu, R. Resonant Shattering of Neutron Star Crusts. Phys. Rev. Lett. 2012, 108, 011102. [Google Scholar] [CrossRef]
- Tsang, D. Shattering Flares During Close Encounters of Neutron Stars. Astrophys. J. 2013, 777, 103. [Google Scholar] [CrossRef]
- Duncan, R.C.; Thompson, C. Formation of Very Strongly Magnetized Neutron Stars: Implications for Gamma-Ray Bursts. Astrophys. J. 1992, 392, L9. [Google Scholar] [CrossRef]
- Thompson, C.; Duncan, R.C. The soft gamma repeaters as very strongly magnetized neutron stars - I. Radiative mechanism for outbursts. Mon. Not. R. Astron. Soc. 1995, 275, 255. [Google Scholar] [CrossRef]
- Sotani, H.; Kokkotas, K.D.; Stergioulas, N. Neutron star mass-radius constraints using the high-frequency quasi-periodic oscillations of GRB 200415A. Astron. Astrophys. 2023, 676, A65. [Google Scholar] [CrossRef]
- Oyamatsu, K. Nuclear shapes in the inner crust of a neutron star. Nuclear Physics A 1993, 561, 431. [Google Scholar] [CrossRef]
- Pethick, J.; Ravenhall, D.G. Matter at Large Neutron Excess and the Physics of Neutron-Star Crusts. Annu. Rev. Nucl. Part. Sci. 1995, 45, 429. [Google Scholar] [CrossRef]
- Oyamatsu, K.; Iida, K. Saturation of Nuclear Matter and Radii of Unstable Nuclei. Prog. Theor. Phys. 2003, 109, 631. [Google Scholar] [CrossRef]
- Oyamatsu, K.; Iida, K. Symmetry energy at subnuclear densities and nuclei in neutron star crusts. Phys. Rev. C 2007, 75, 015801. [Google Scholar] [CrossRef]
- Oyamatsu, K. Nuclear masses and the equation of state of nuclear matter. Prog. Theor. Exp. Phys. 2023, 2023, 063D03. [Google Scholar] [CrossRef]
- Sotani, H.; Iida, K.; Oyamatsu, K. Probing crustal structures from neutron star compactness. Mon. Not. R. Astron. Soc. 2017, 470, 4397. [Google Scholar] [CrossRef]
- Sotani, H. Shear and interface modes in neutron stars with pasta structures. Phys. Rev. D 2023, 107, 123025. [Google Scholar] [CrossRef]
- Lattimer, J.M. The Equation of State of Hot Dense Matter and Supernovae. Annu. Rev. Nucl. Part. Sci. 1981, 31, 337. [Google Scholar] [CrossRef]
- Strohmayer, T.; van Horn, H.M.; Ogata, S.; Iyetomi, H.; Ichimaru, S. The Shear Modulus of the Neutron Star Crust and Nonradial Oscillations of Neutron Stars. Astrophys. J. 1991, 375, 679. [Google Scholar] [CrossRef]
- Ogata, S.; Ichimaru, S. First-principles calculations of shear moduli for Monte Carlo–simulated Coulomb solids. Phys. Rev. A 1990, 42, 4867. [Google Scholar] [CrossRef] [PubMed]
- Baiko, D.A. Shear modulus of neutron star crust. Mon. Not. R. Astron. Soc. 2011, 416, 22. [Google Scholar] [CrossRef]
- Kobyakov, D.; Pethick, C.J. Dynamics of the inner crust of neutron stars: Hydrodynamics, elasticity, and collective modes. Phys. Rev. C 2013, 87, 055803. [Google Scholar] [CrossRef]
- Sotani, H. Electron screening effects on crustal torsional oscillations. Phys. Lett. B 2014, 730, 166. [Google Scholar] [CrossRef]
- Kobyakov, D.; Pethick, C.J. Elastic properties of polycrystalline dense matter. Mon. Not. R. Astron. Soc. 2015, 449, L110. [Google Scholar] [CrossRef]
- Sotani, H.; Togashi, H.; Takano, M. Effects of finite sizes of atomic nuclei on shear modulus and torsional oscillations in neutron stars. Mon. Not. R. Astron. Soc. 2022, 516, 5440. [Google Scholar] [CrossRef]
- Pethick, C.J.; Potekhin, A.Y. Liquid crystals in the mantles of neutron stars. Phys. Lett. B 1998, 427, 7. [Google Scholar] [CrossRef]
- Caplan, M.E.; Schneider, A.S.; Horowitz, C.J. Elasticity of Nuclear Pasta. Phys. Rev. Lett. 2018, 121, 132701. [Google Scholar] [CrossRef] [PubMed]
- Pethick, C.J.; Zhang, Z.-W.; Kobyakov, D.N. Elastic properties of phases with nonspherical nuclei in dense matter. Phys. Rev. C 2020, 101, 055802. [Google Scholar] [CrossRef]
- Sotani, H.; Iida, K.; Oyamatsu, K. Probing nuclear bubble structure via neutron star asteroseismology. Mon. Not. Roy. Astron. Soc. 2017, 470, 4397. [Google Scholar] [CrossRef]
- Schumaker, B.L.; Thorne, K.S. Torsional oscillations of neutron stars. Mon. Not. Roy. Astron. Soc. 1983, 203, 457. [Google Scholar] [CrossRef]
- Sotani, H.; Iida, K.; Oyamatsu, K. Constraints on the nuclear equation of state and the neutron star structure from crustal torsional oscillations. Mon. Not. Roy. Astron. Soc. 2018, 479, 4735. [Google Scholar] [CrossRef]
- Chamel, N. Neutron conduction in the inner crust of a neutron star in the framework of the band theory of solids. Phys. Rev. C 2012, 85, 035801. [Google Scholar] [CrossRef]
- Chamel, N. Band structure effects for dripped neutrons in neutron star crust. Nucl. Phys. A 2005, 747, 109. [Google Scholar] [CrossRef]
- Carter, B.; Chamel, N.; Haensel, P. Entrainment coefficient and effective mass for conduction neutrons in neutron star crust: simple microscopic models. Nucl. Phys. A 2005, 748, 675. [Google Scholar] [CrossRef]
- Watanabe, G.; Pethick, C.J. Superfluid Density of Neutrons in the Inner Crust of Neutron Stars: New Life for Pulsar Glitch Models. Phys. Rev. Lett. 2017, 119, 062701. [Google Scholar] [CrossRef]
- Hansen, C.J.; Cioffi, D.F. Torsional oscillations in neutron star crusts. Astrophys. J. 1980, 238, 740. [Google Scholar] [CrossRef]
- Sotani, H. Constraints on Pasta Structure of Neutron Stars from Oscillations in Giant Flares. Mon. Not. Roy. Astron. Soc. 2011, 417, L70. [Google Scholar] [CrossRef]
- Sotani, H.; Iida, K.; Oyamatsu, K. Possible identifications of newly observed magnetar quasi-periodic oscillations as crustal shear modes. New Astron. 2016, 43, 80. [Google Scholar] [CrossRef]
- Sotani, H. Empirical formula of crustal torsional oscillations. Phys. Rev. D 2016, 93, 044059. [Google Scholar] [CrossRef]
- Bauswein, A.; Just, O.; Janka, H.-T.; Stergioulas, N. Neutron-star Radius Constraints from GW170817 and Future Detections. Astrophys. J. 2017, 850, L34. [Google Scholar] [CrossRef]
- Capano, C.D.; et al. Stringent constraints on neutron-star radii from multimessenger observations and nuclear theory. Nat. Astron. 2020, 4, 625. [Google Scholar] [CrossRef]
- Dietrich, T.; et al. Multimessenger constraints on the neutron-star equation of state and the Hubble constant. Science 2020, 370, 1450. [Google Scholar] [CrossRef] [PubMed]
- Romani, R.W.; et al. PSR J0952-0607: The Fastest and Heaviest Known Galactic Neutron Star. Astrophys. J. 2022, 934, L17. [Google Scholar] [CrossRef]
- Yoshida, S.; Lee, U. Nonradial oscillations of neutron stars with a solid crust. Astron. Astrophys. 2002, 395, 201. [Google Scholar] [CrossRef]
- Finn, L.S. Non-radial pulsations of neutron stars with a crust. Mon. Not. Roy. Astron. Soc. 1990, 245, 82. [Google Scholar] [CrossRef]
- Gudmundsson, E.H.; Pethick, C.J.; Epstein, R.I. Structure of neutron star envelopes. Astrophys. J. 1983, 272, 286. [Google Scholar] [CrossRef]
- Sotani, H. Shear oscillations in neutron stars and the nuclear symmetry energy. Phys. Rev. D 2024, 109, 023030. [Google Scholar] [CrossRef]
- Piro, A.L.; Bildsten, L. Neutron Star Crustal Interface Waves. Astrophys. J. 2005, 619, 1054. [Google Scholar] [CrossRef]
- Sotani, H. Effect of nuclear saturation parameters on a possible maximum mass of neutron stars. Phys. Rev. C 2017, 95, 025802. [Google Scholar] [CrossRef]
- Maruyama, T.; Chiba, S.; Schulze, H.-J.; Tatsumi, T. Hadron-quark mixed phase in hyperon stars. Phys. Rev. D 2007, 76, 123015. [Google Scholar] [CrossRef]
- Xia, C.-J.; Maruyama, T.; Yasutake, N.; Tatsumi, T.; Shen, H.; Togashi, H. Systematic study on the quark-hadron mixed phase in compact stars. Phys. Rev. D 2020, 102, 023031. [Google Scholar] [CrossRef]
- Sotani, H.; Maruyama, T.; Tatsum, T. Shear oscillations in the hadron-quark mixed phase. Nucl. Phys. A 2013, 2013 906, 37. [Google Scholar] [CrossRef]
- Lau, S.Y.; Yagi, K. Probing hybrid stars with gravitational waves via interfacial modes. Phys. Rev. D 2021, 103, 063015. [Google Scholar] [CrossRef]
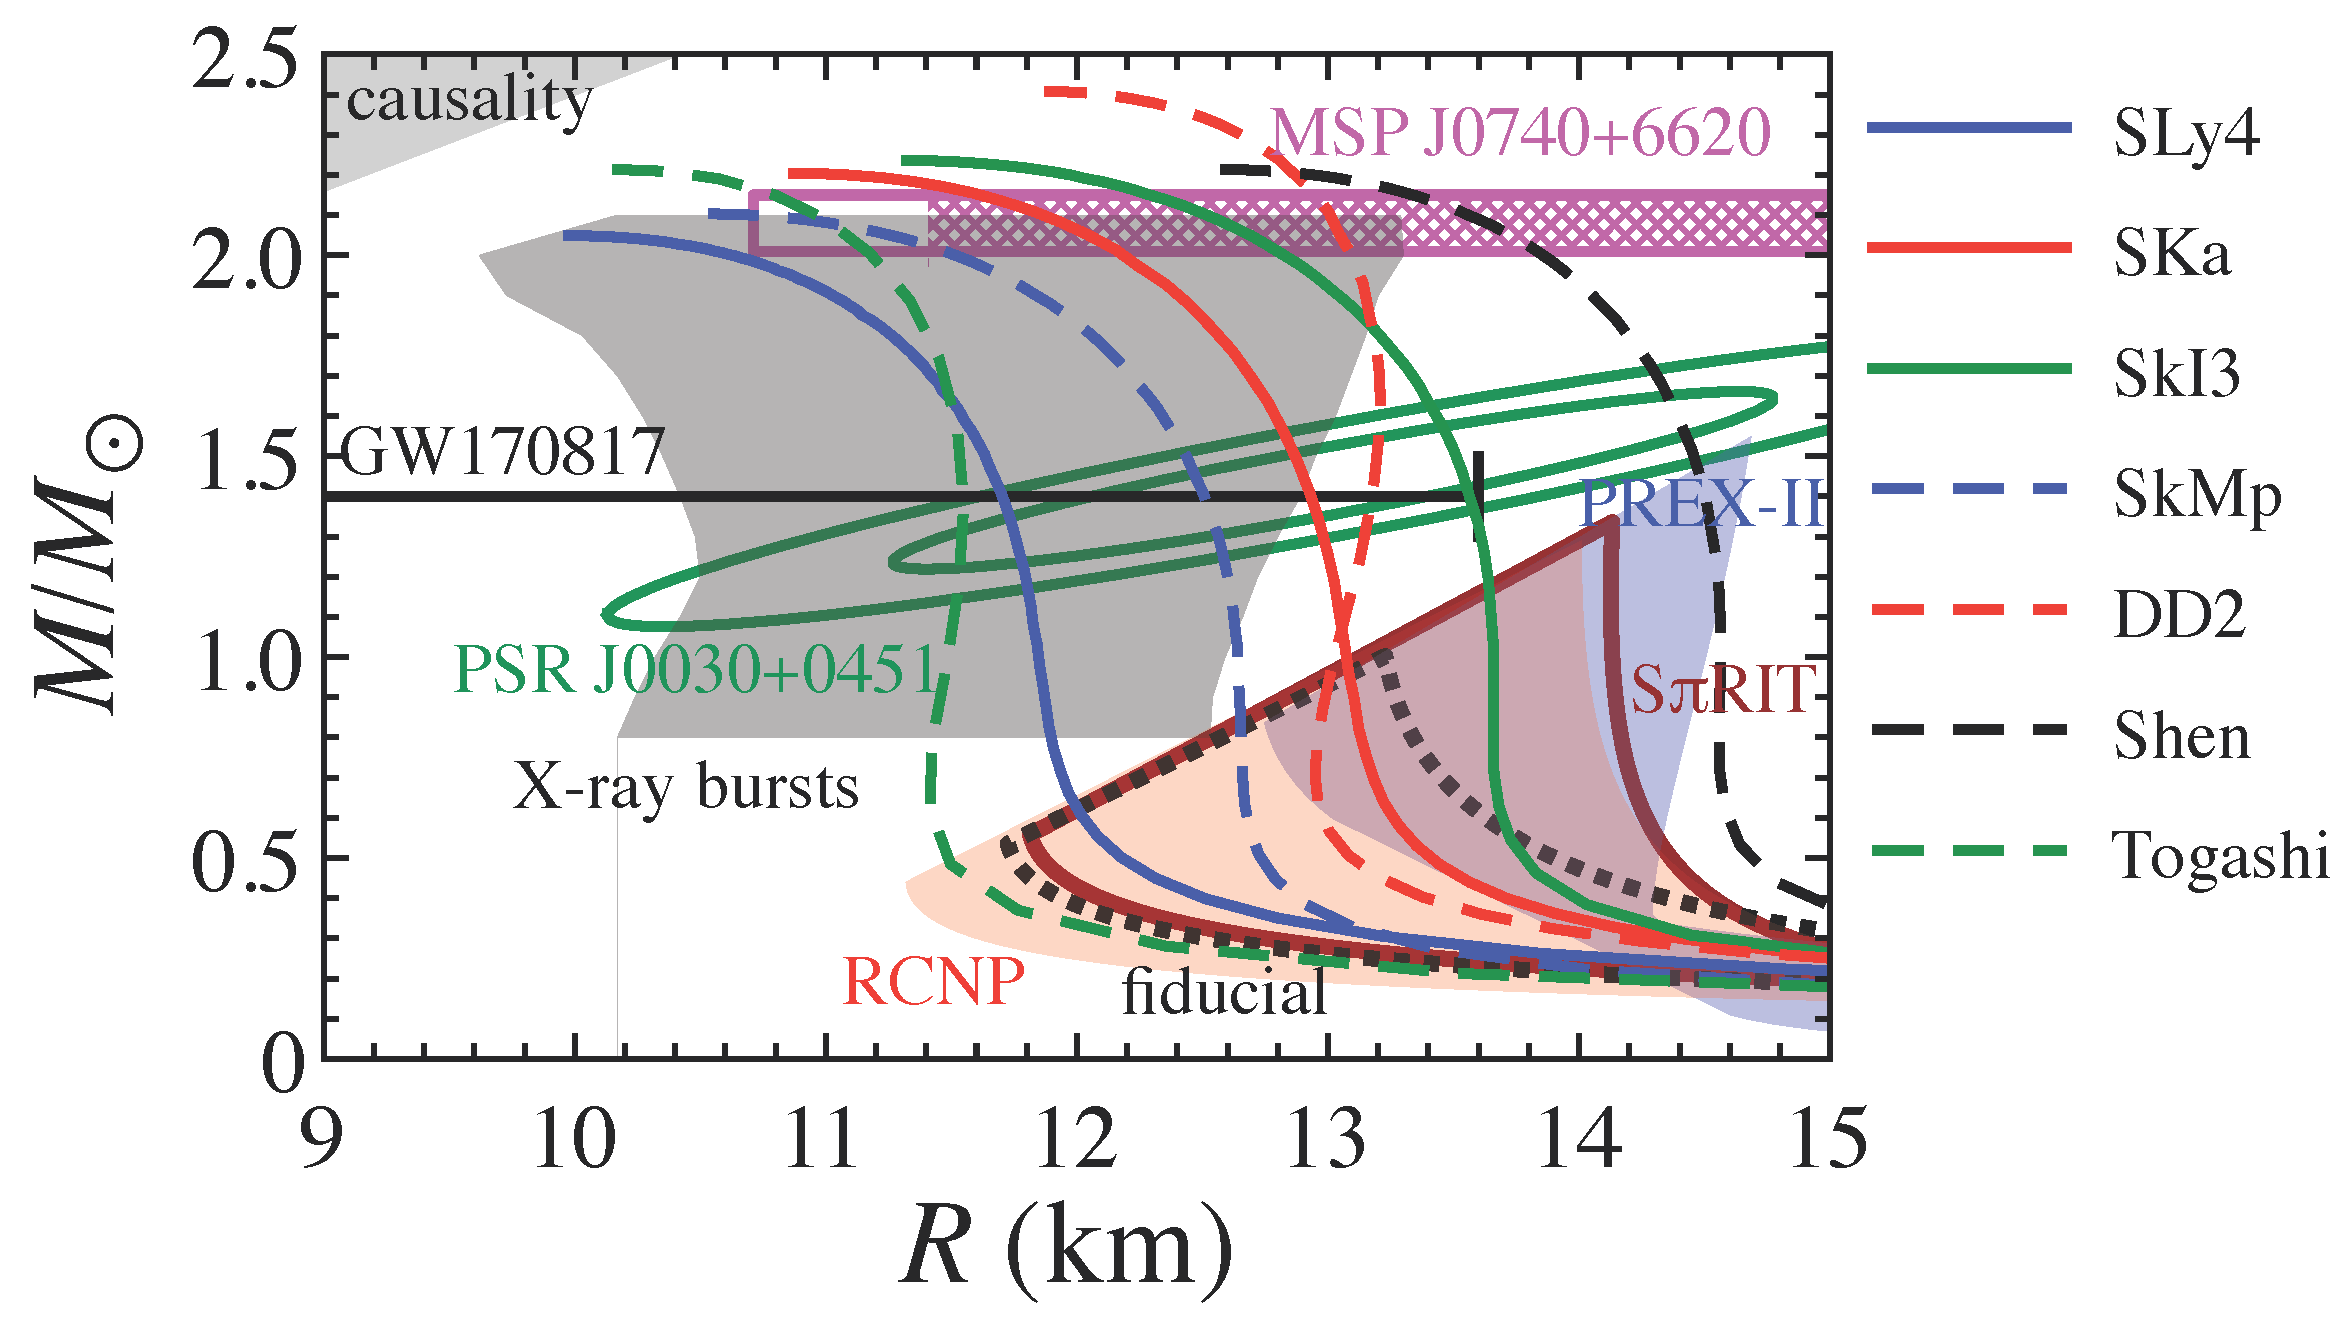
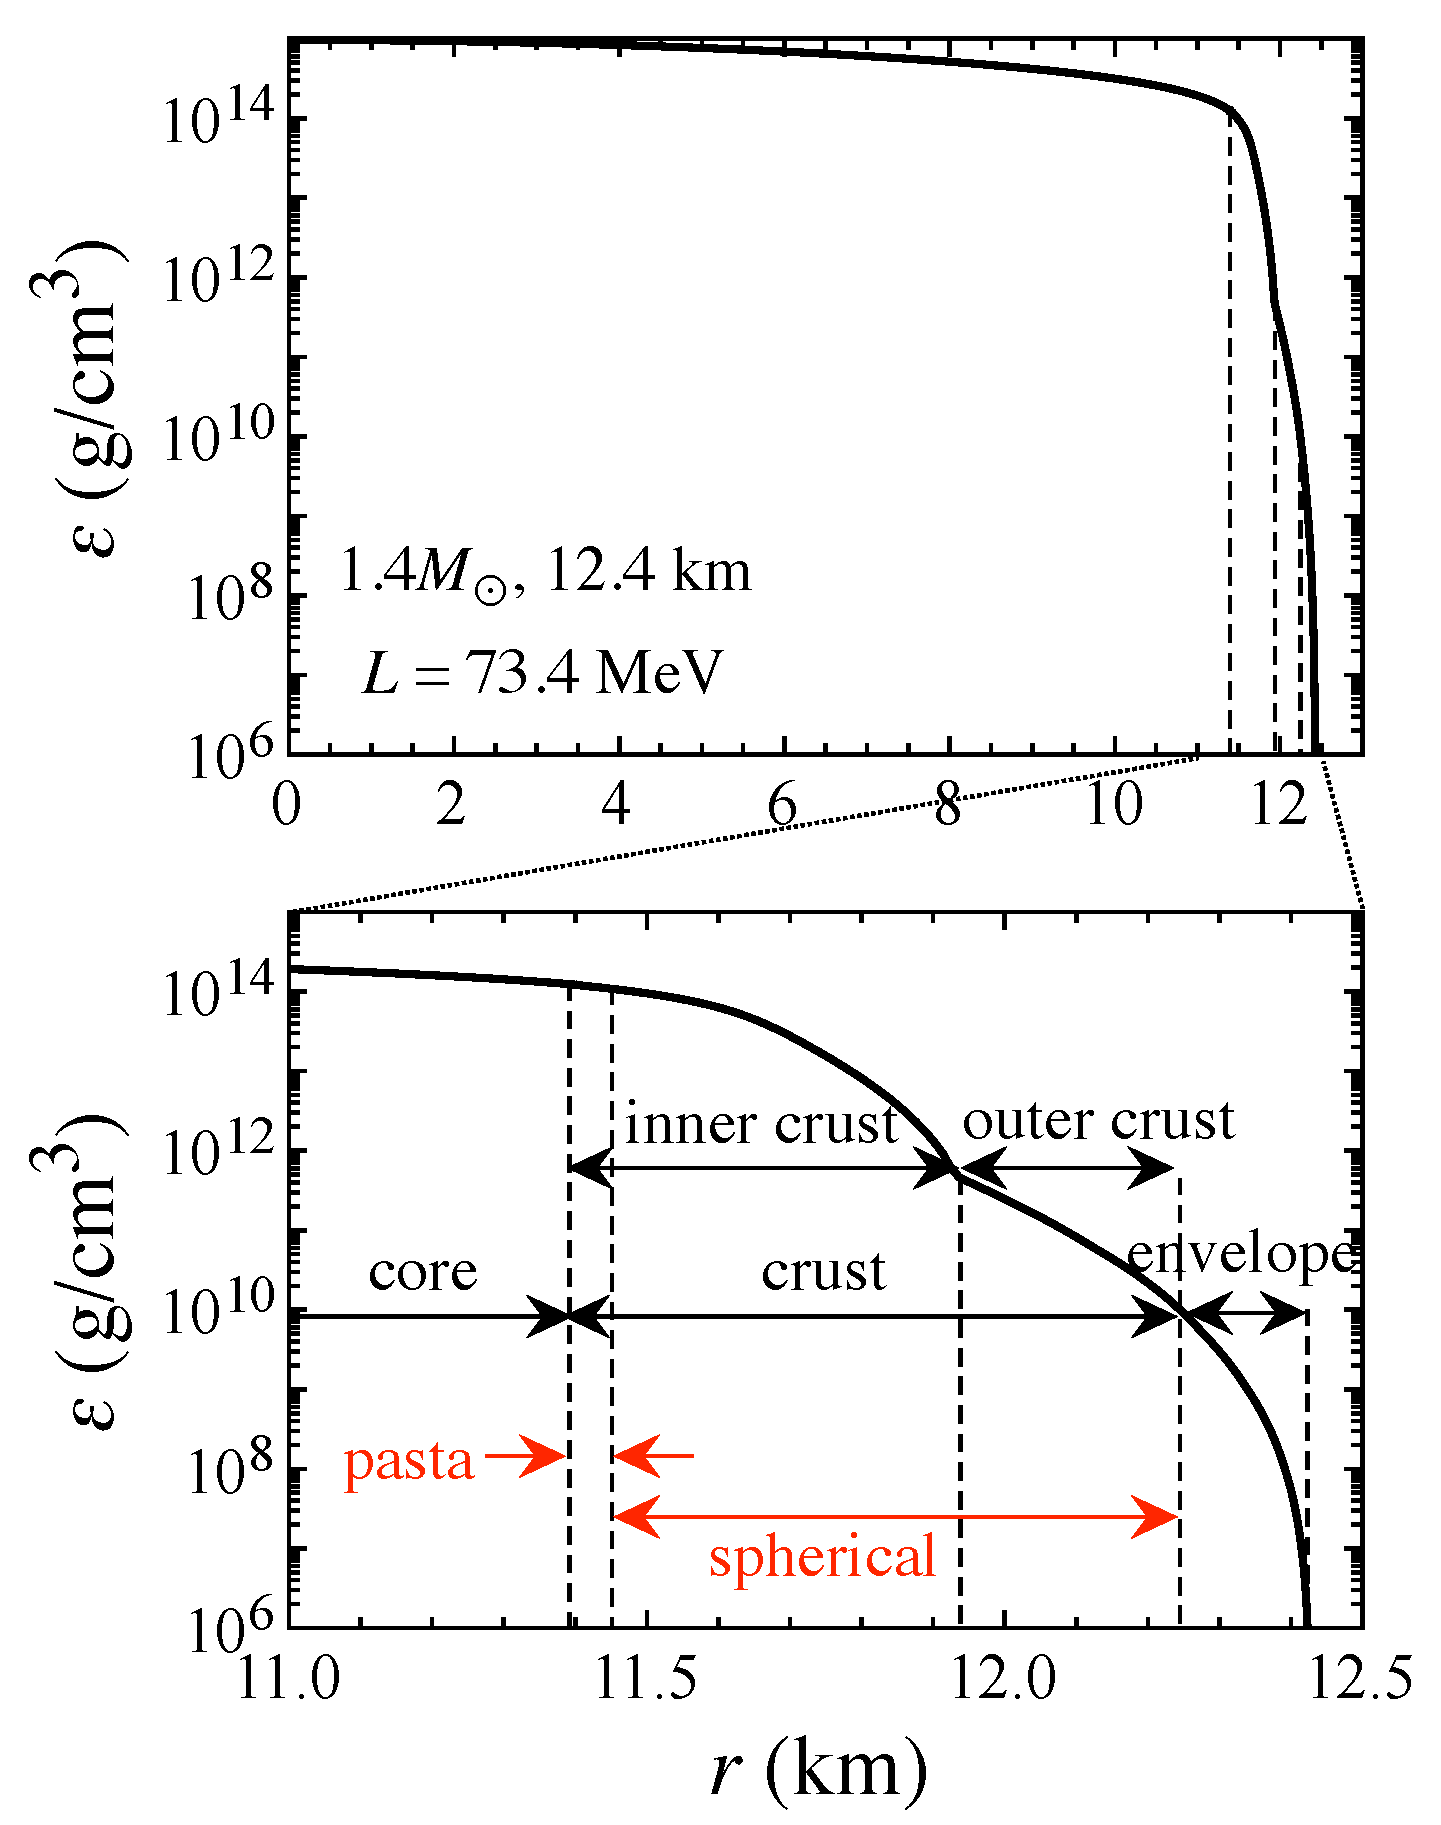
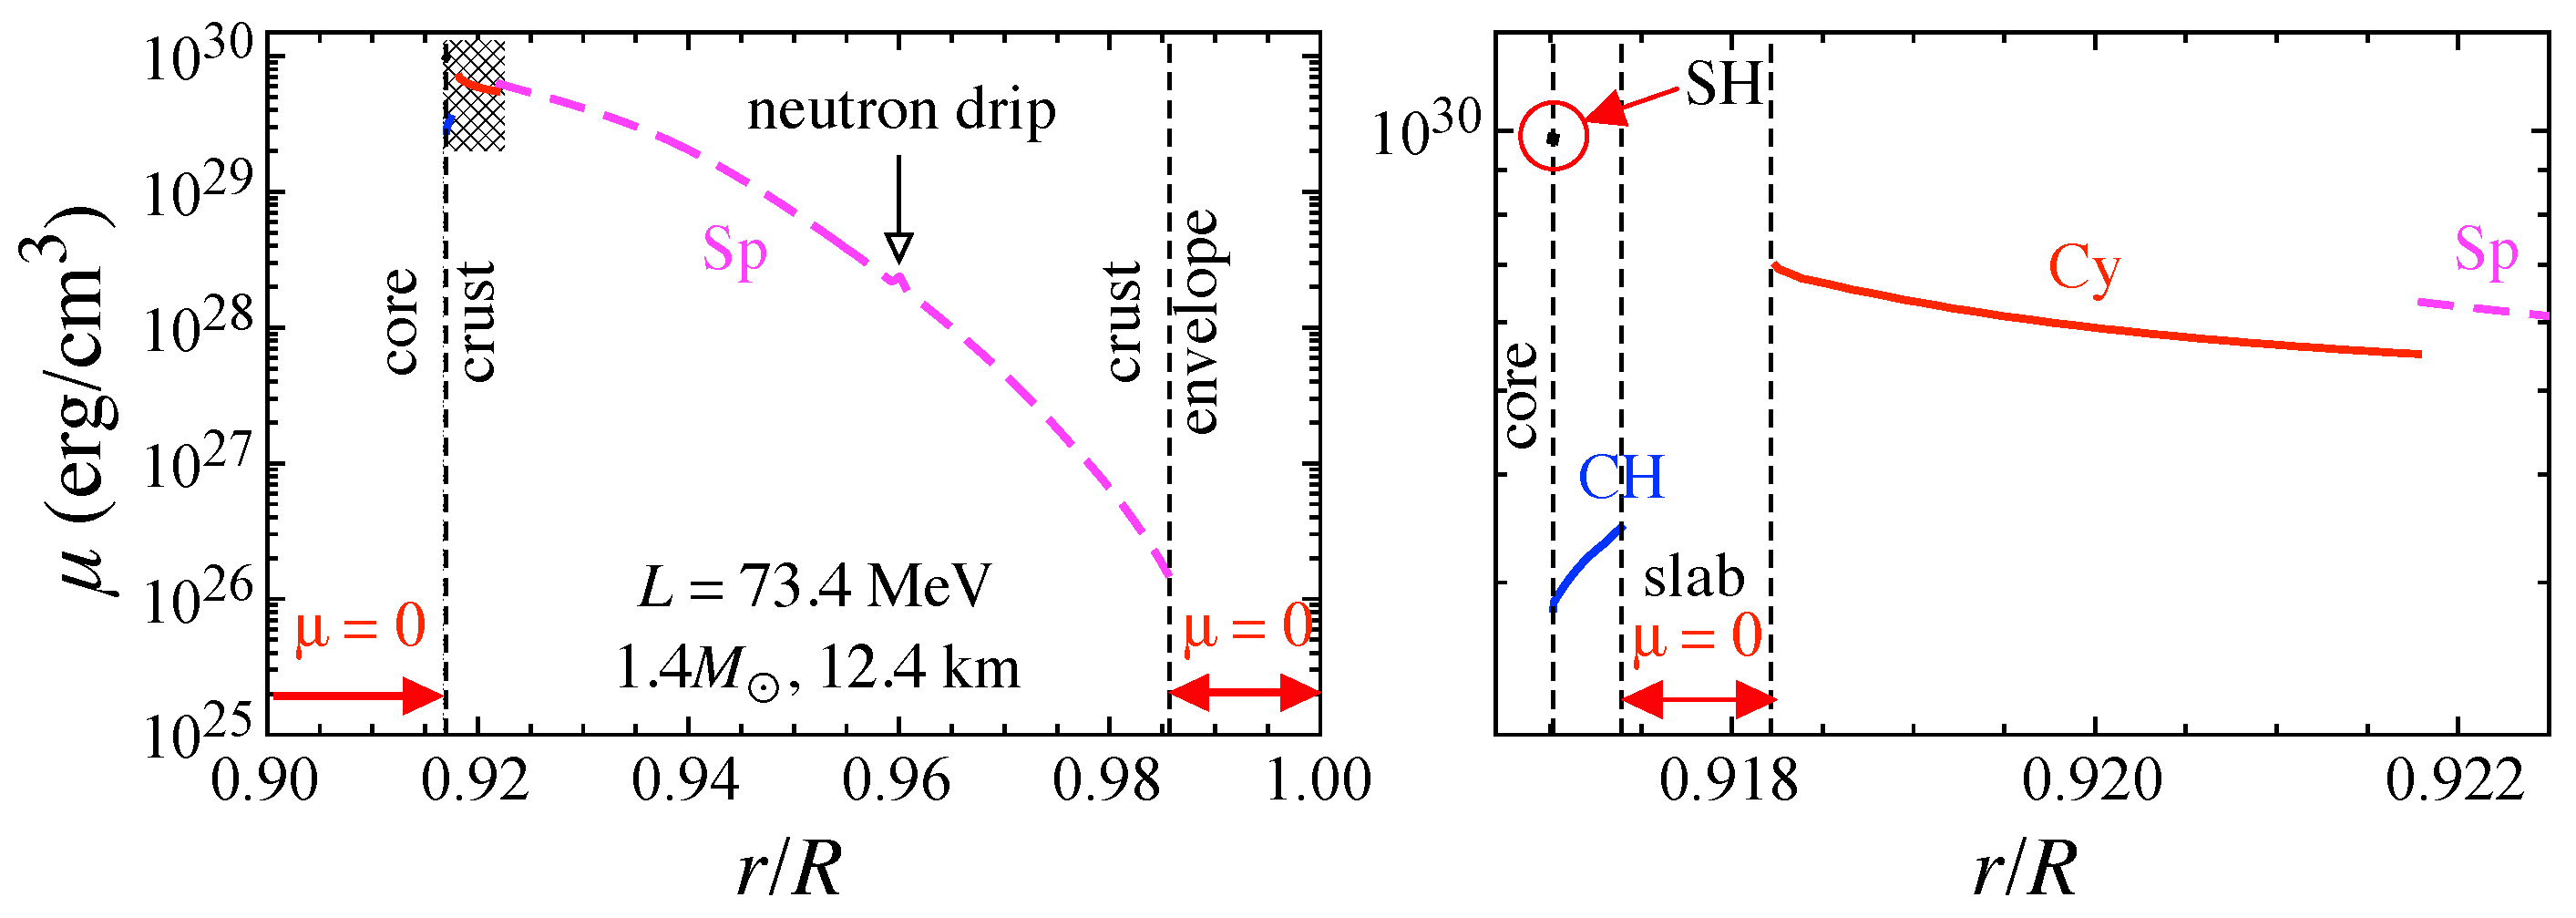
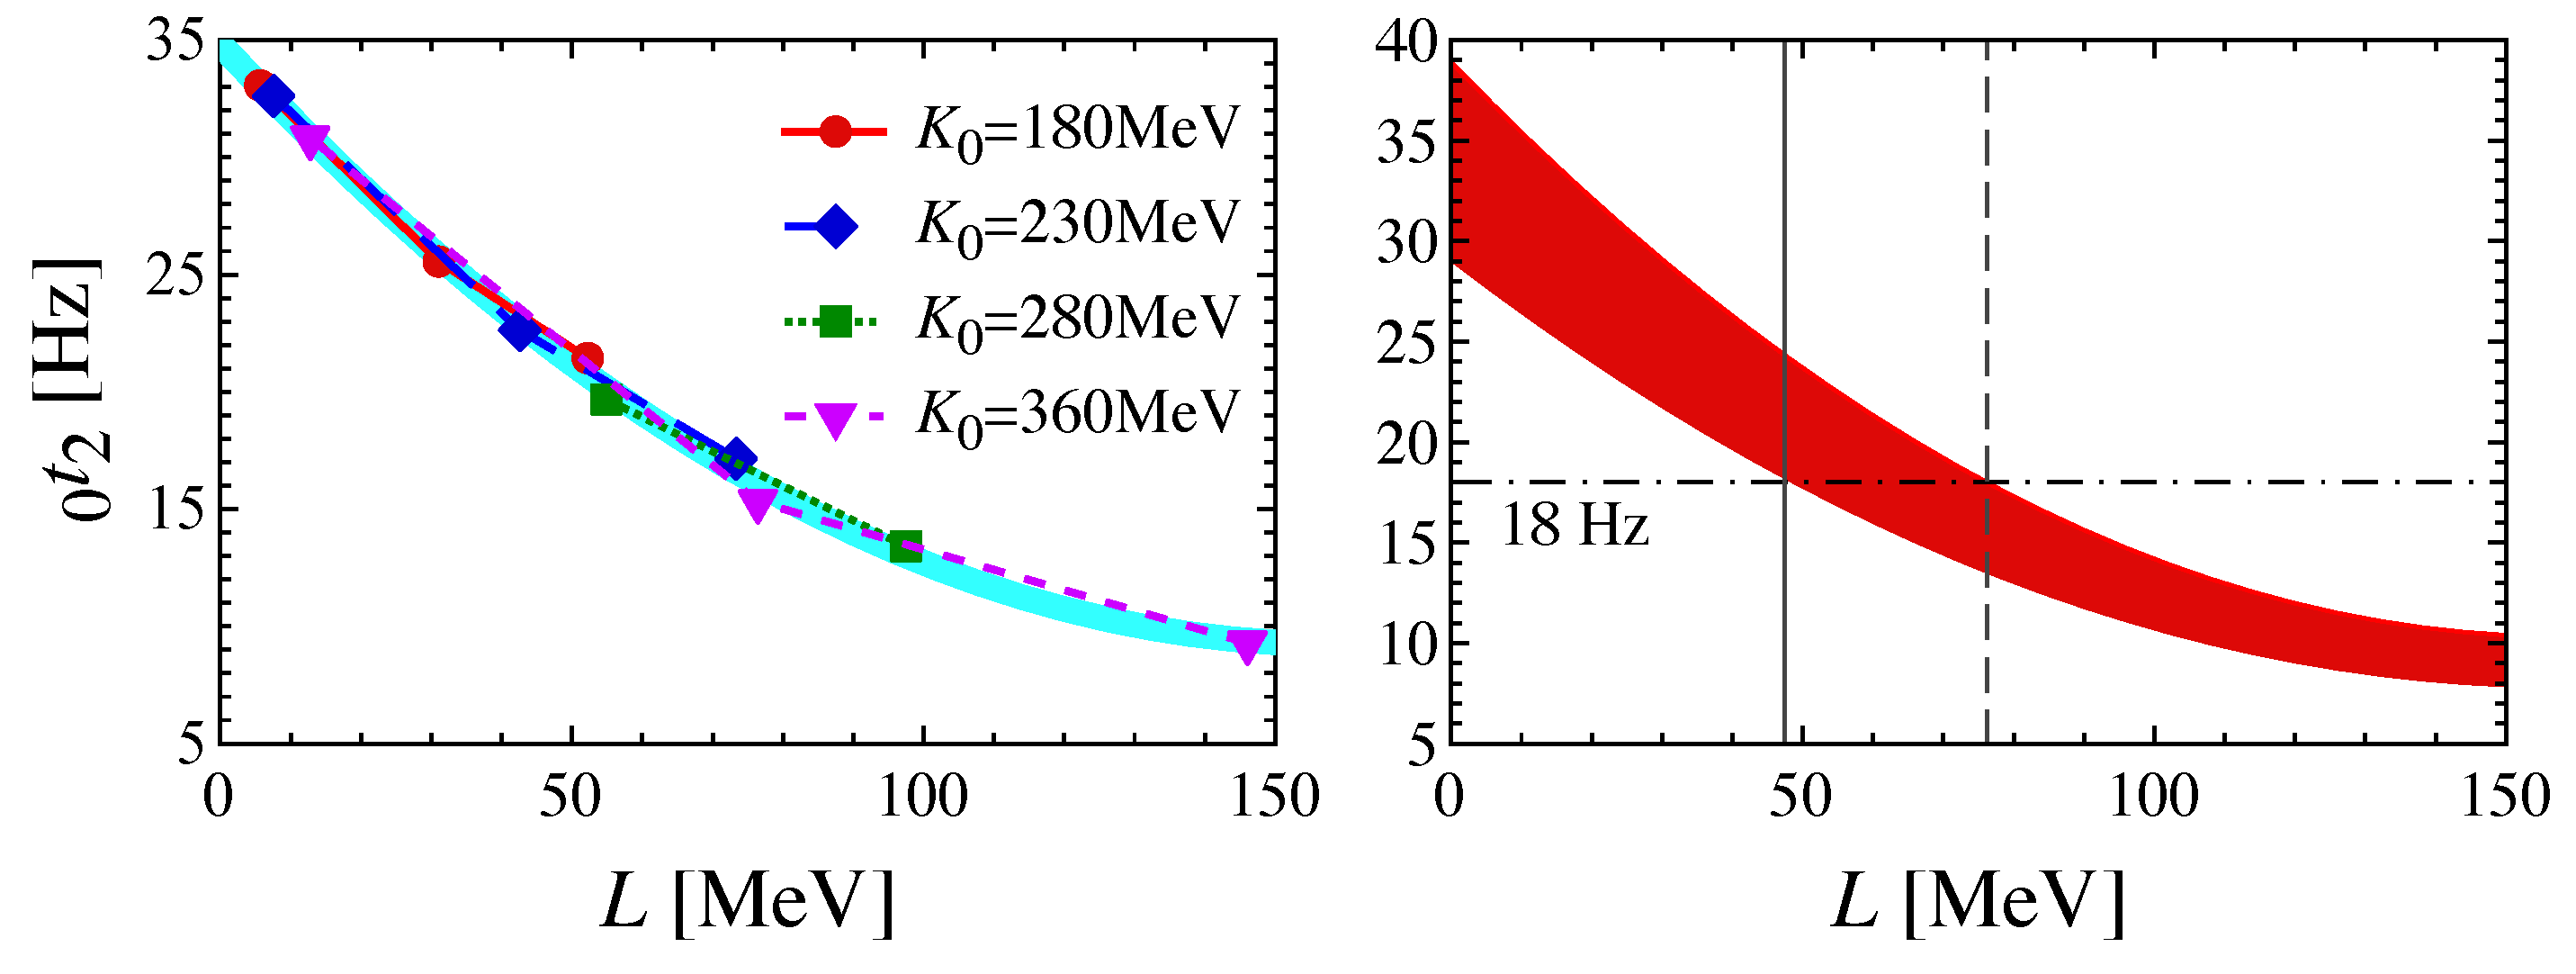
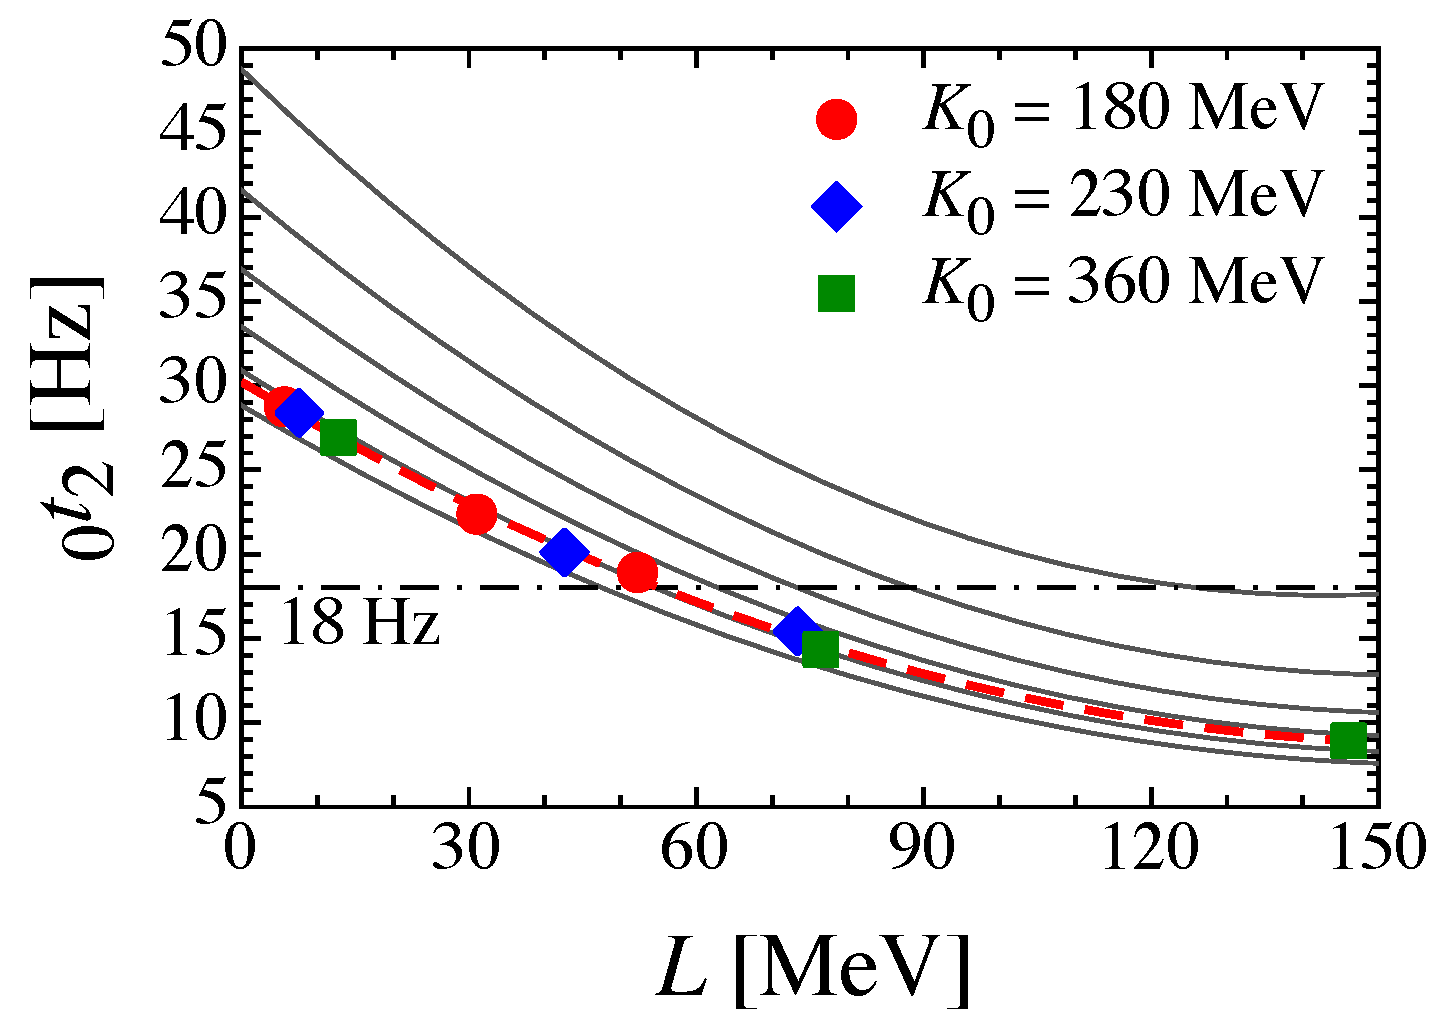
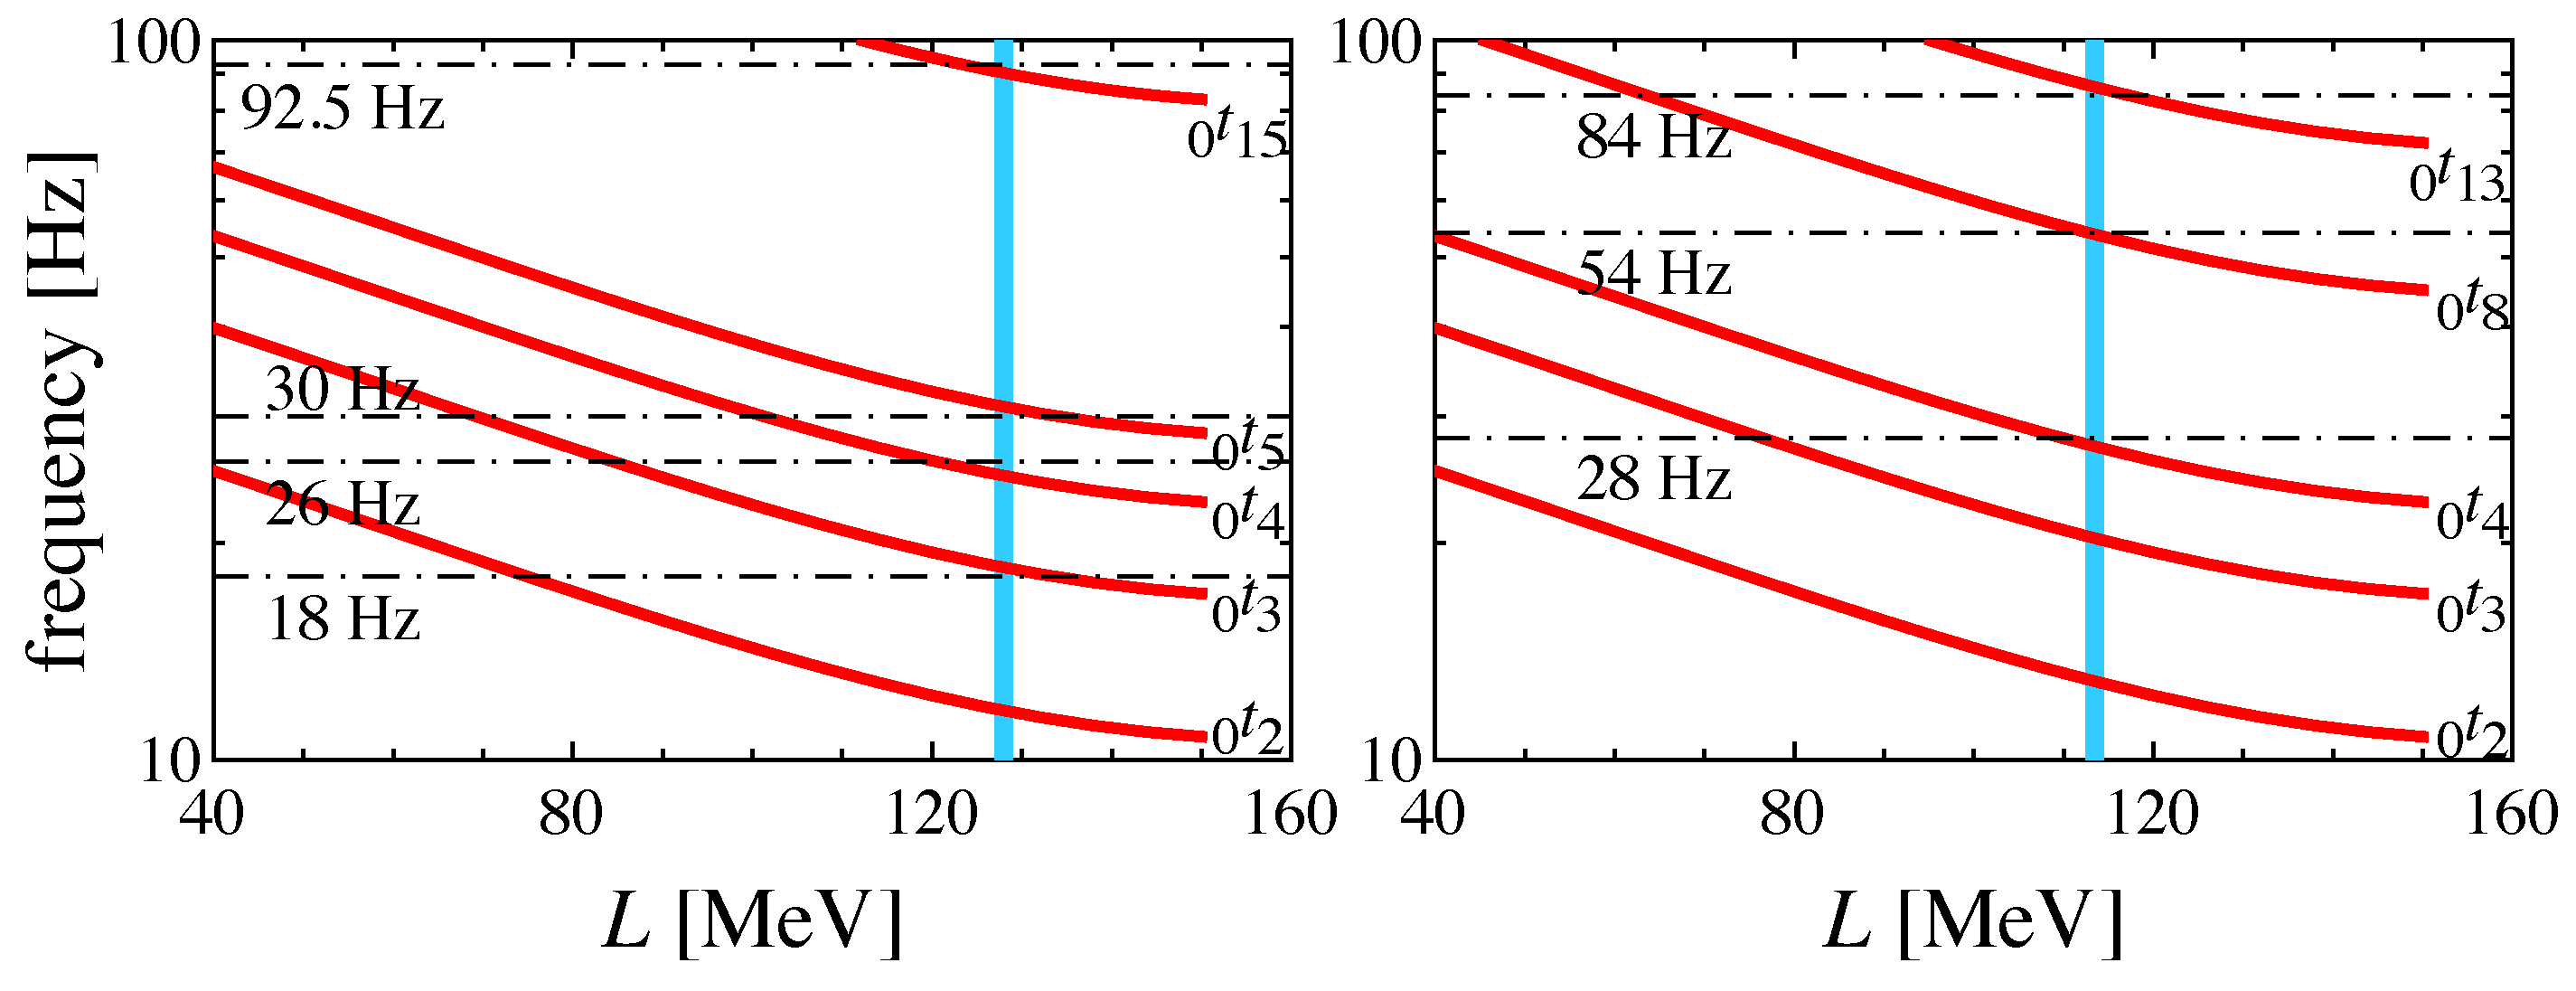
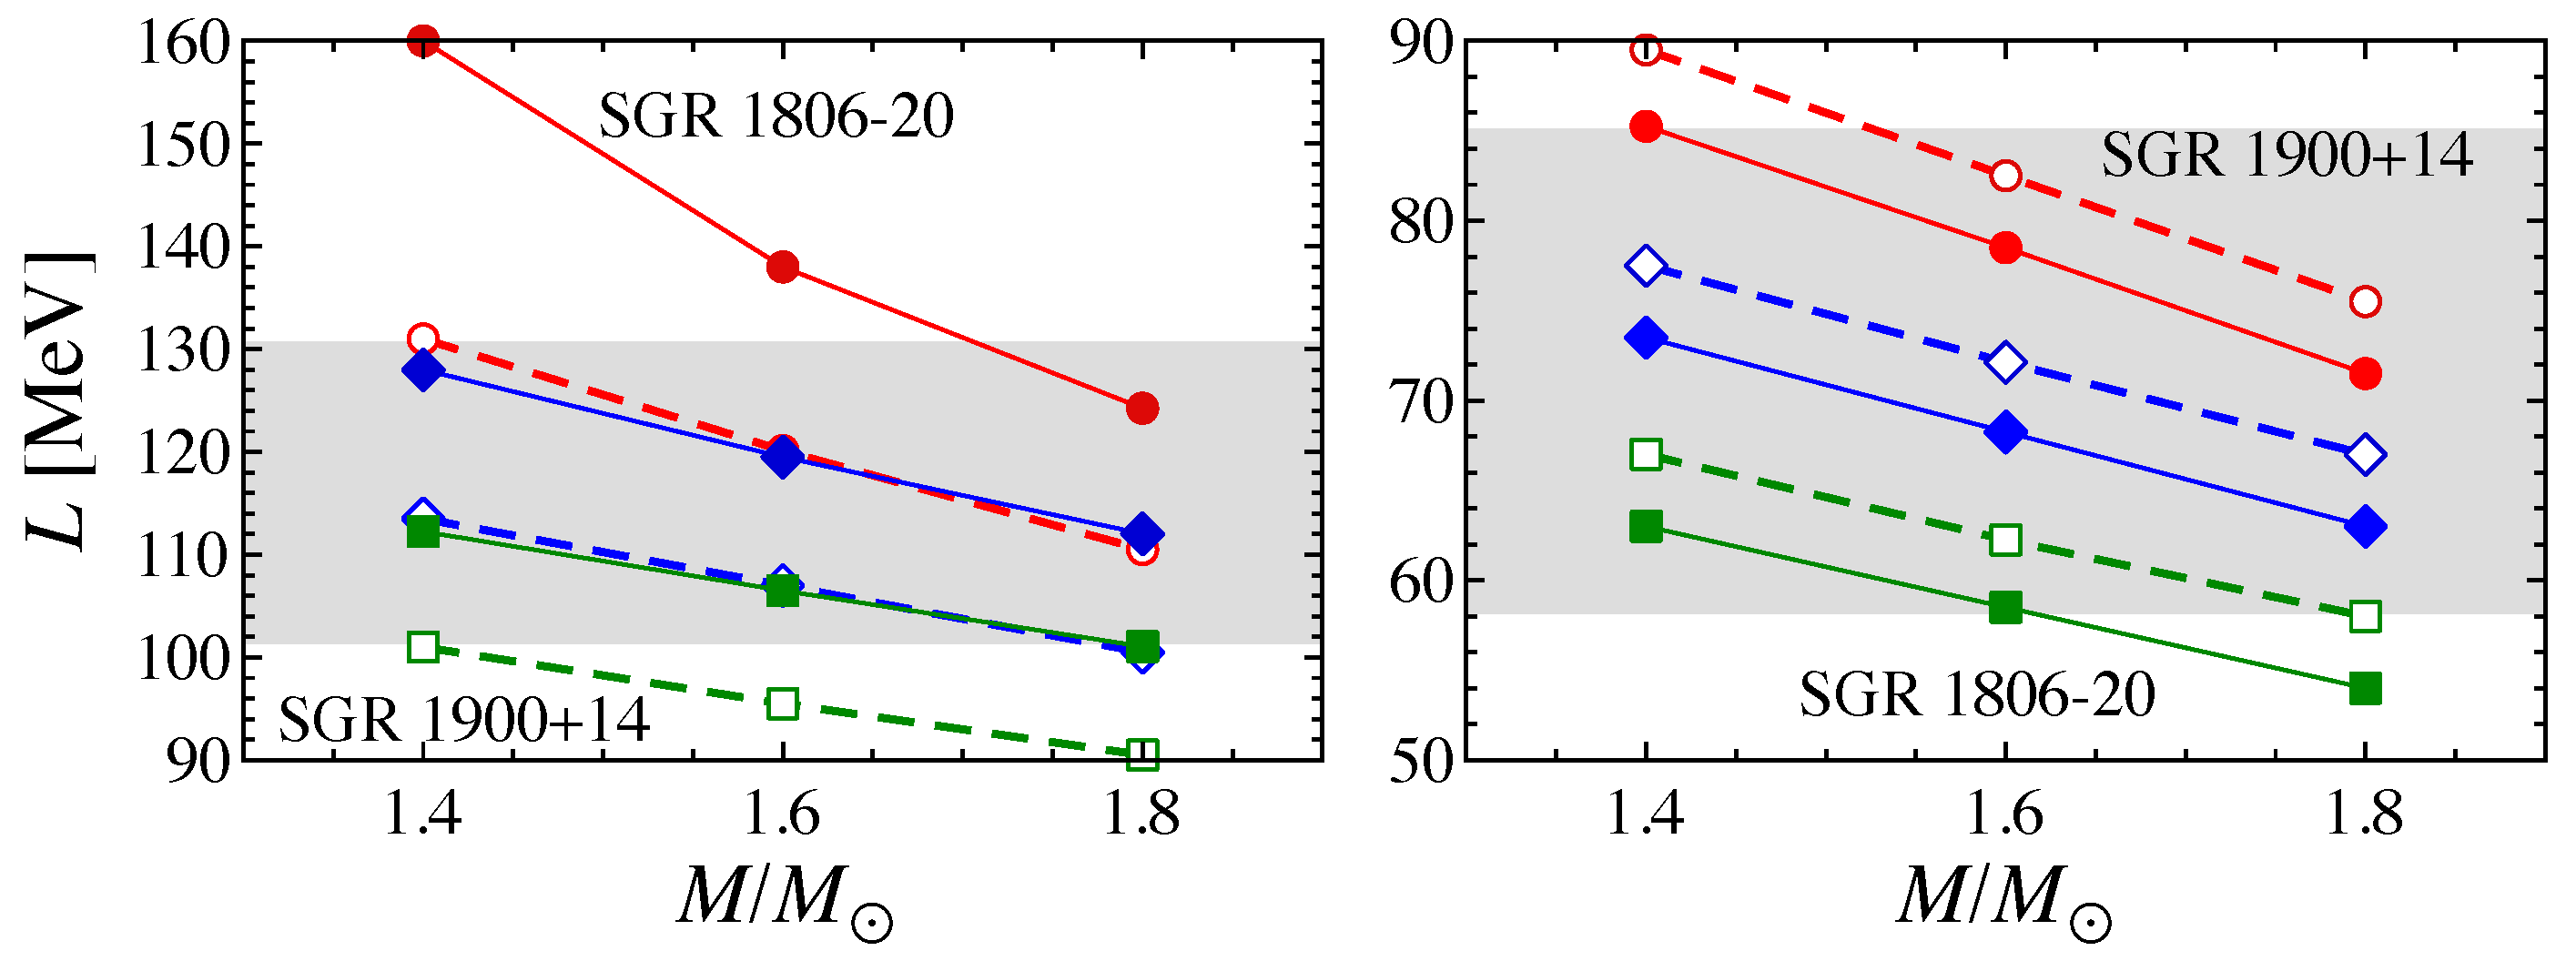
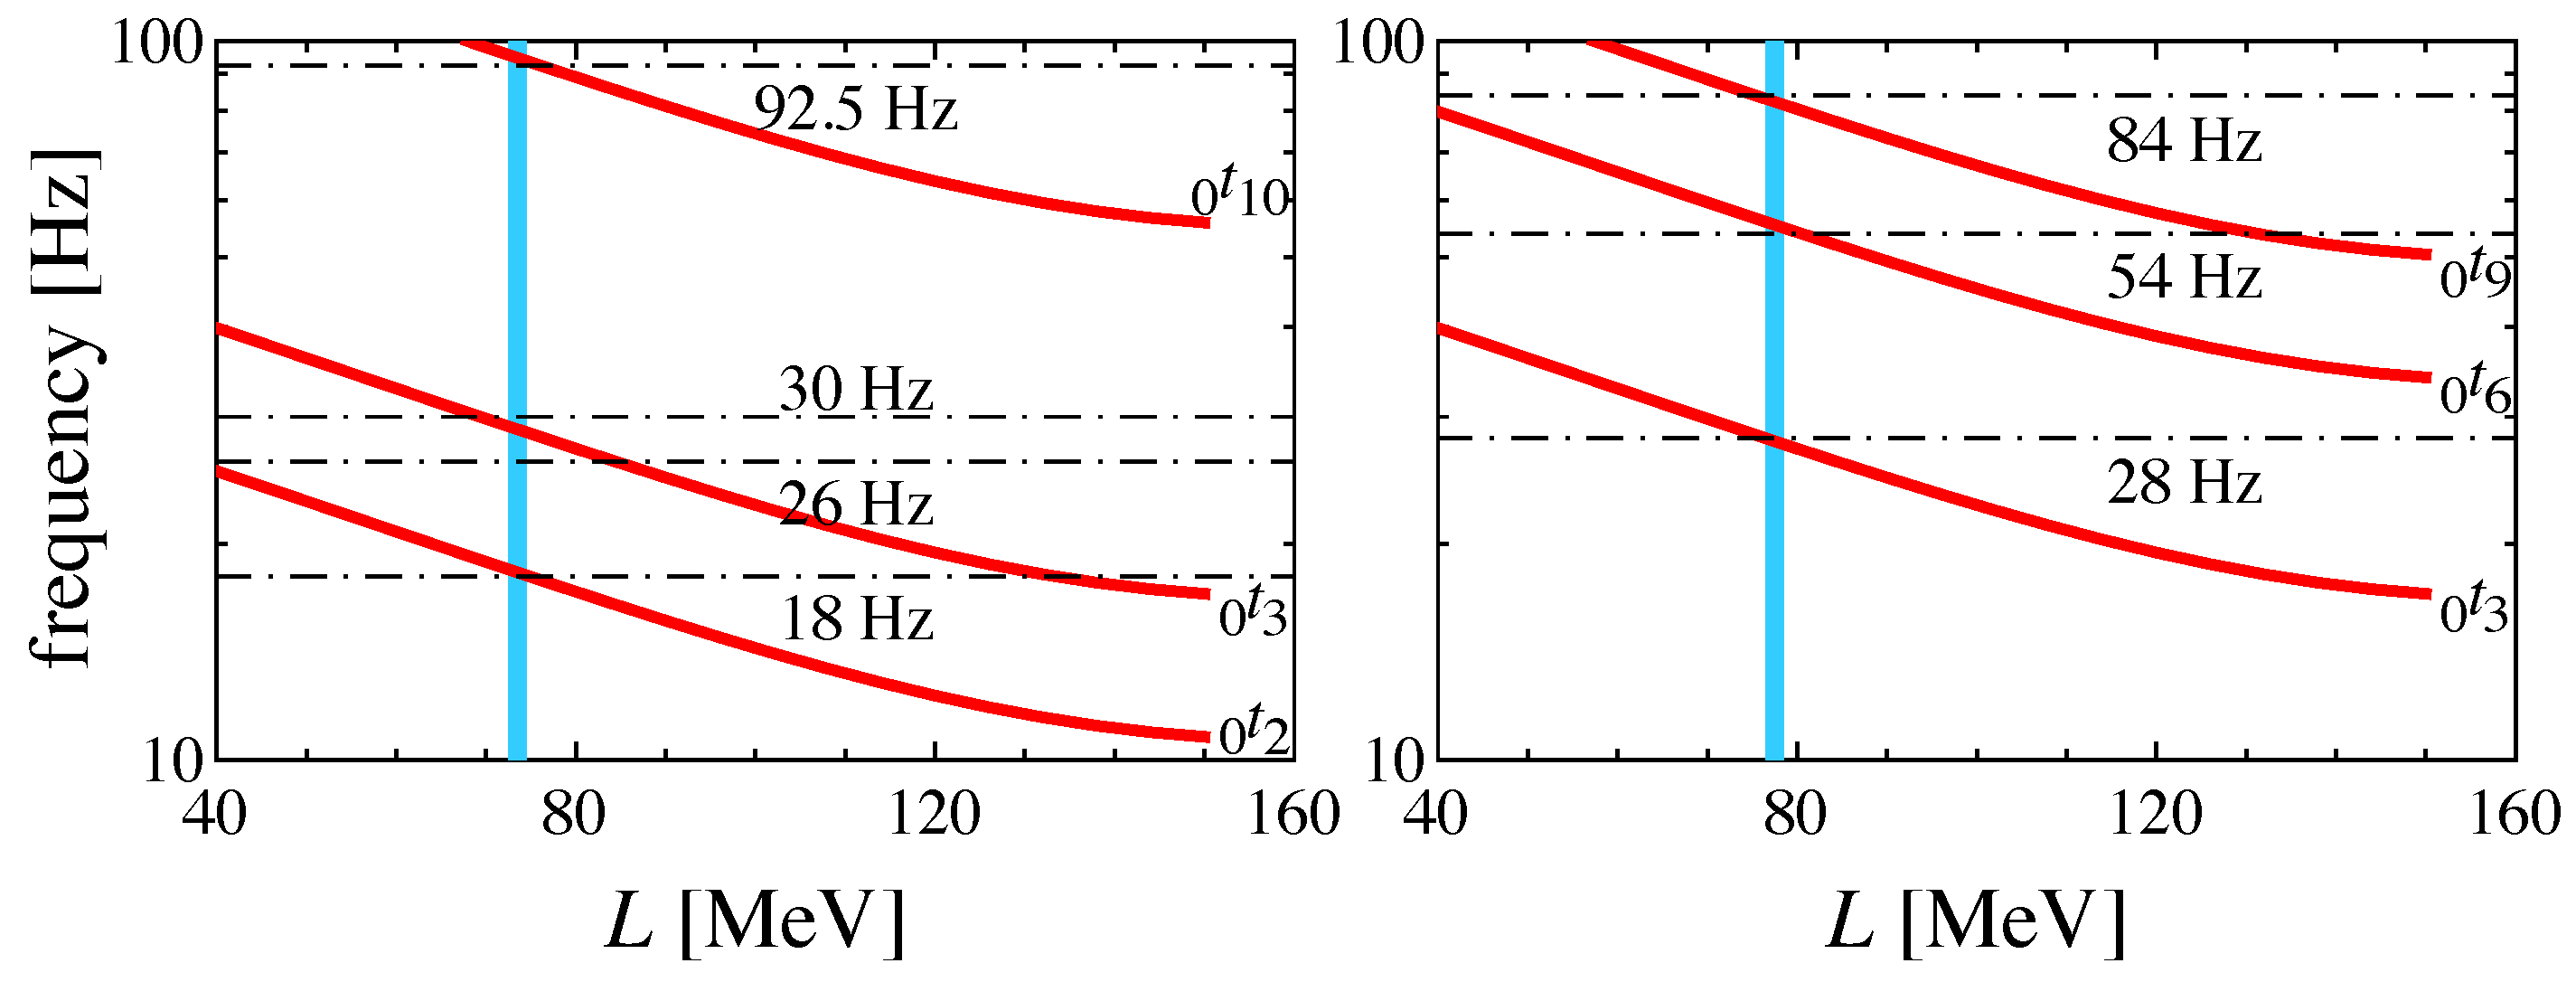
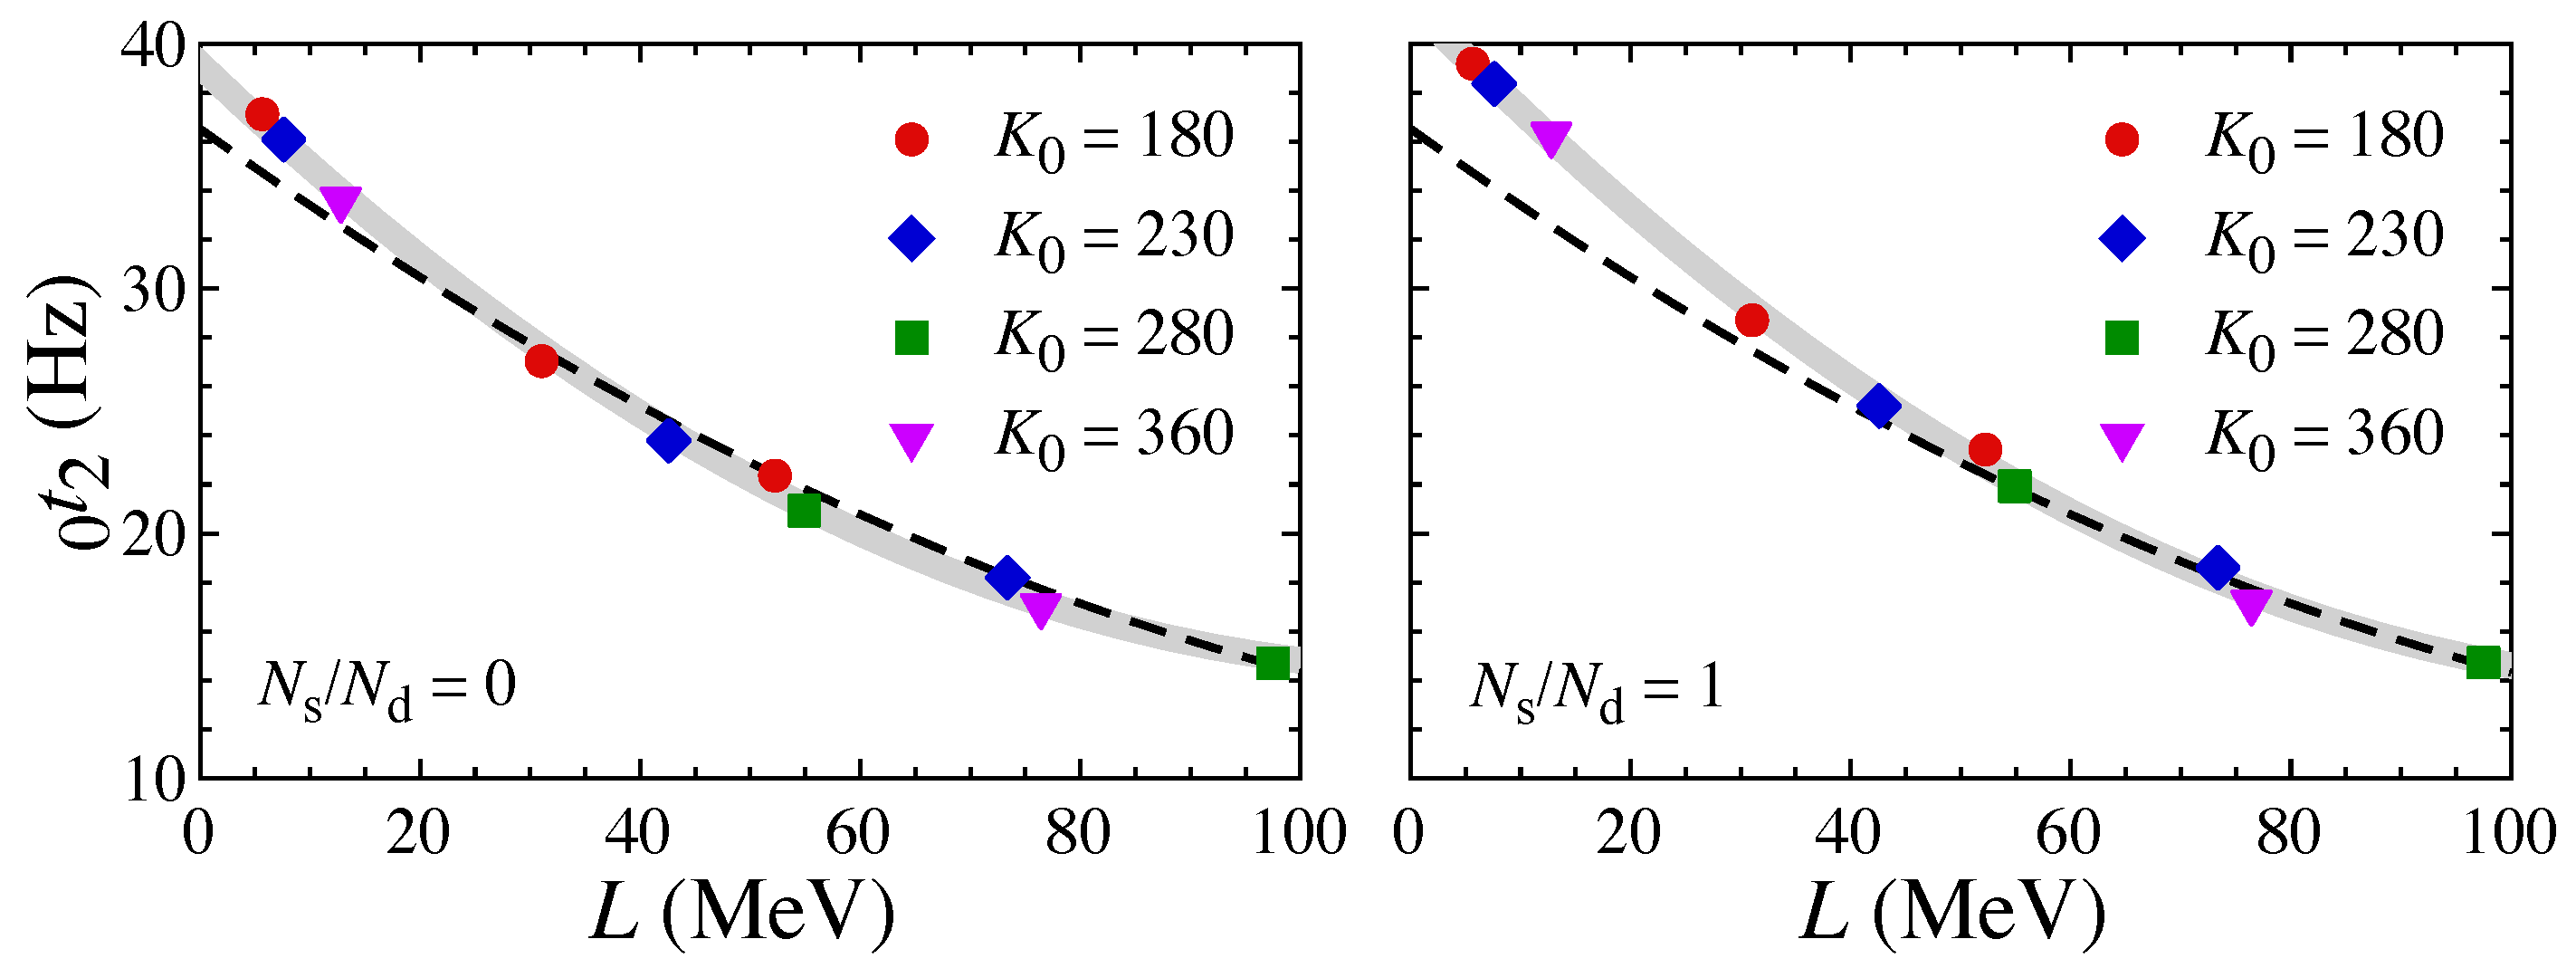
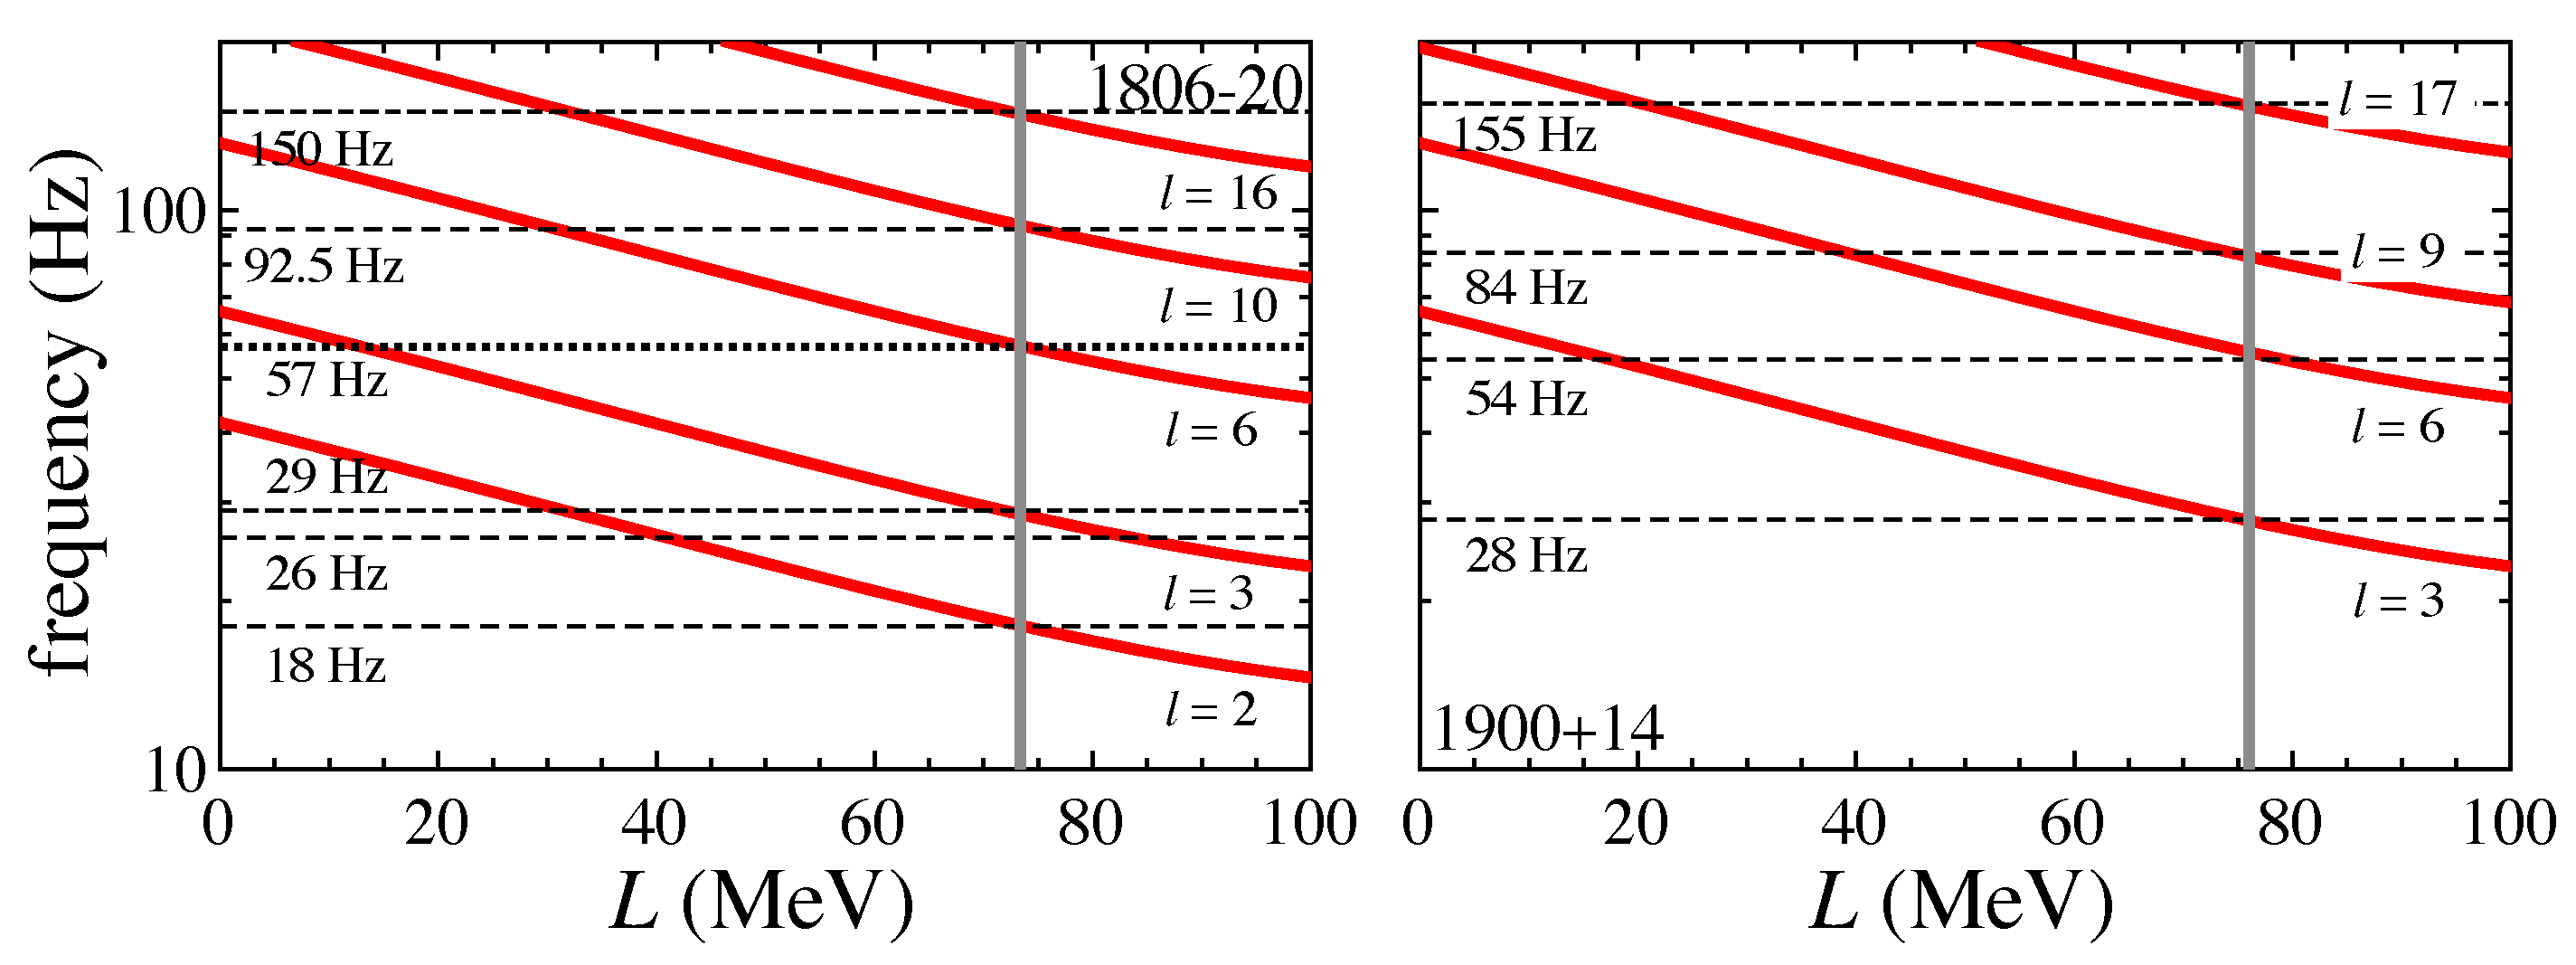

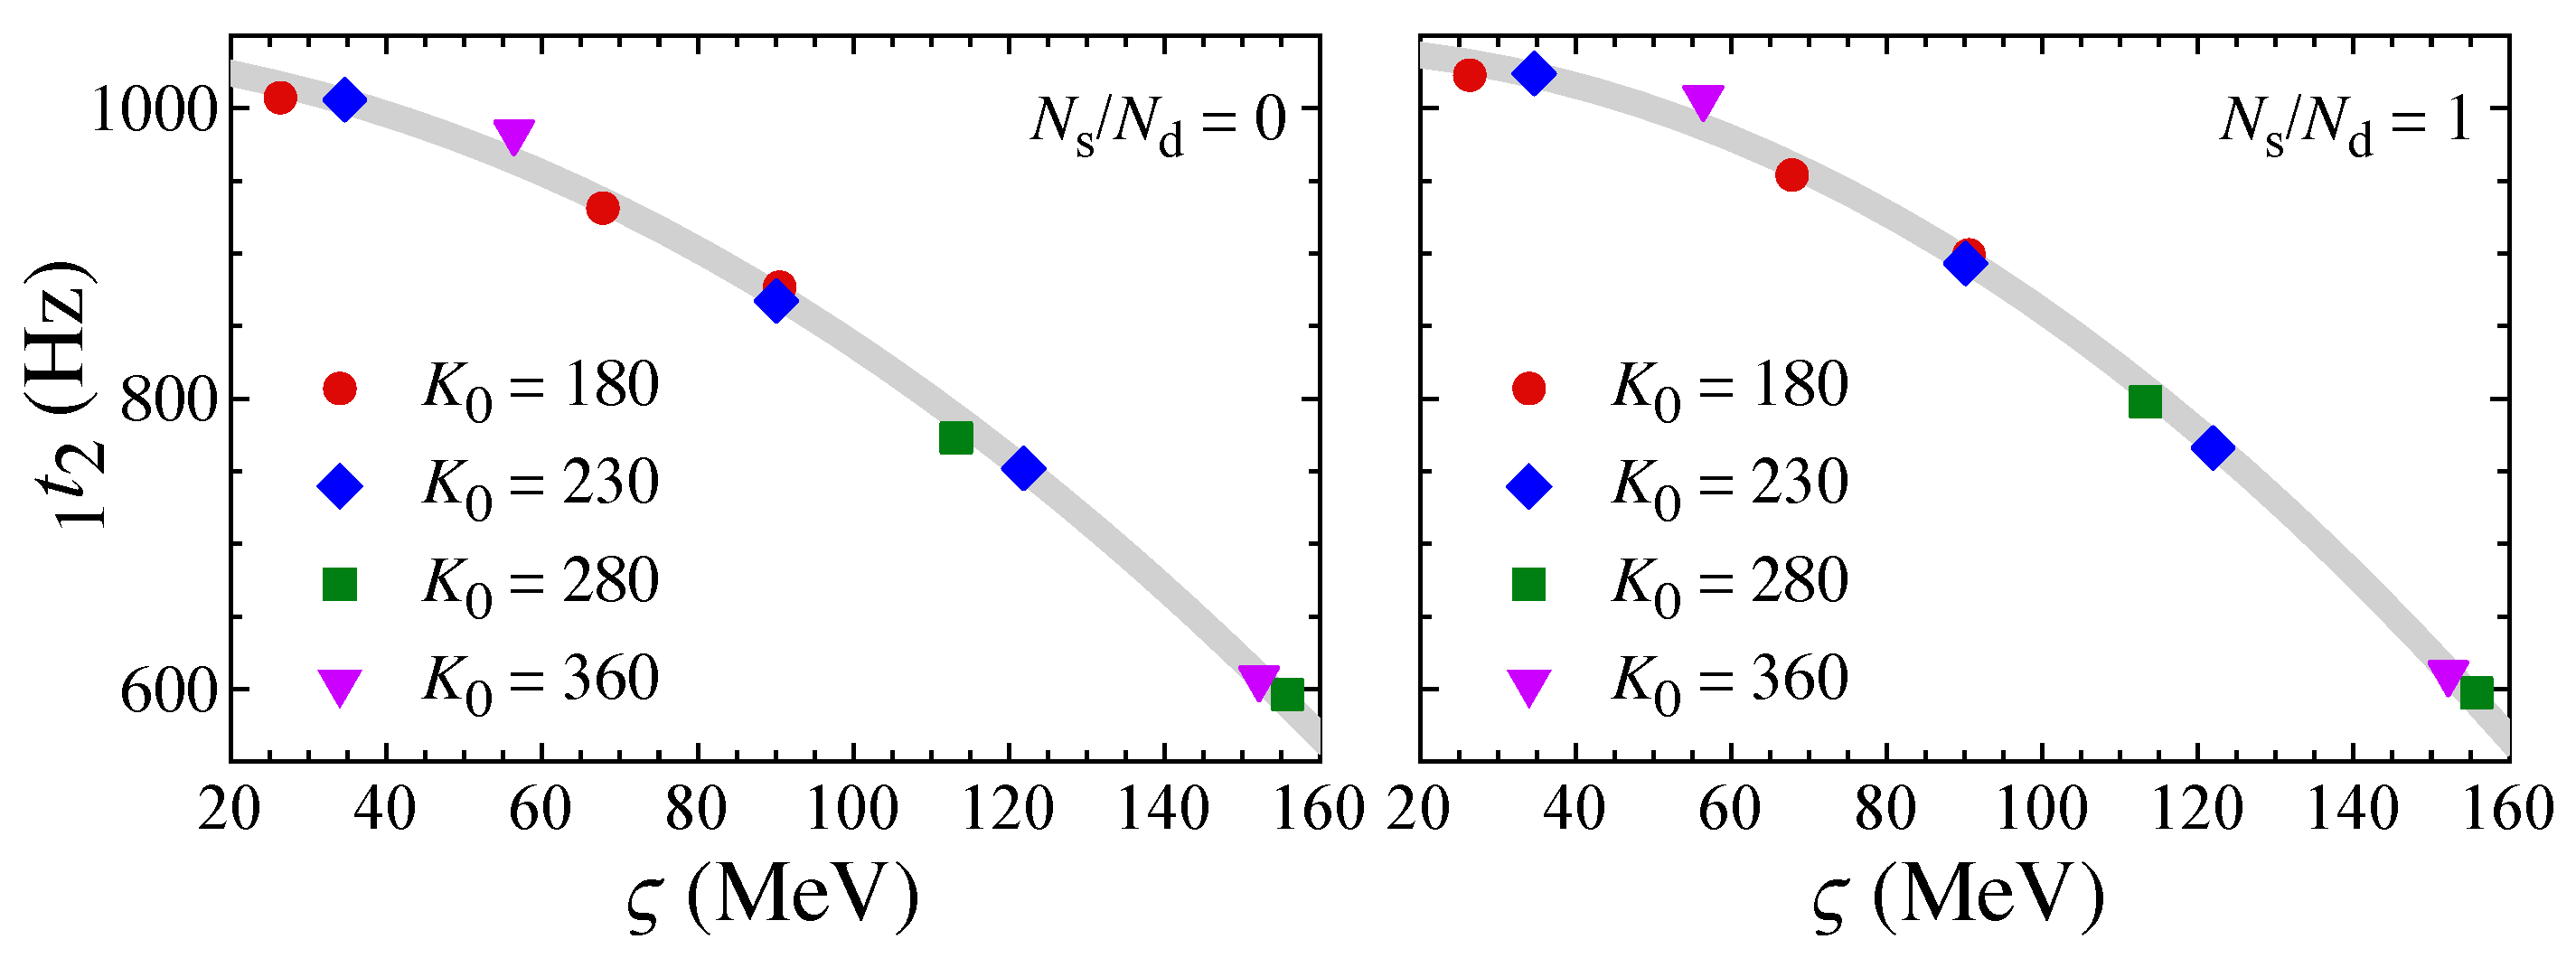
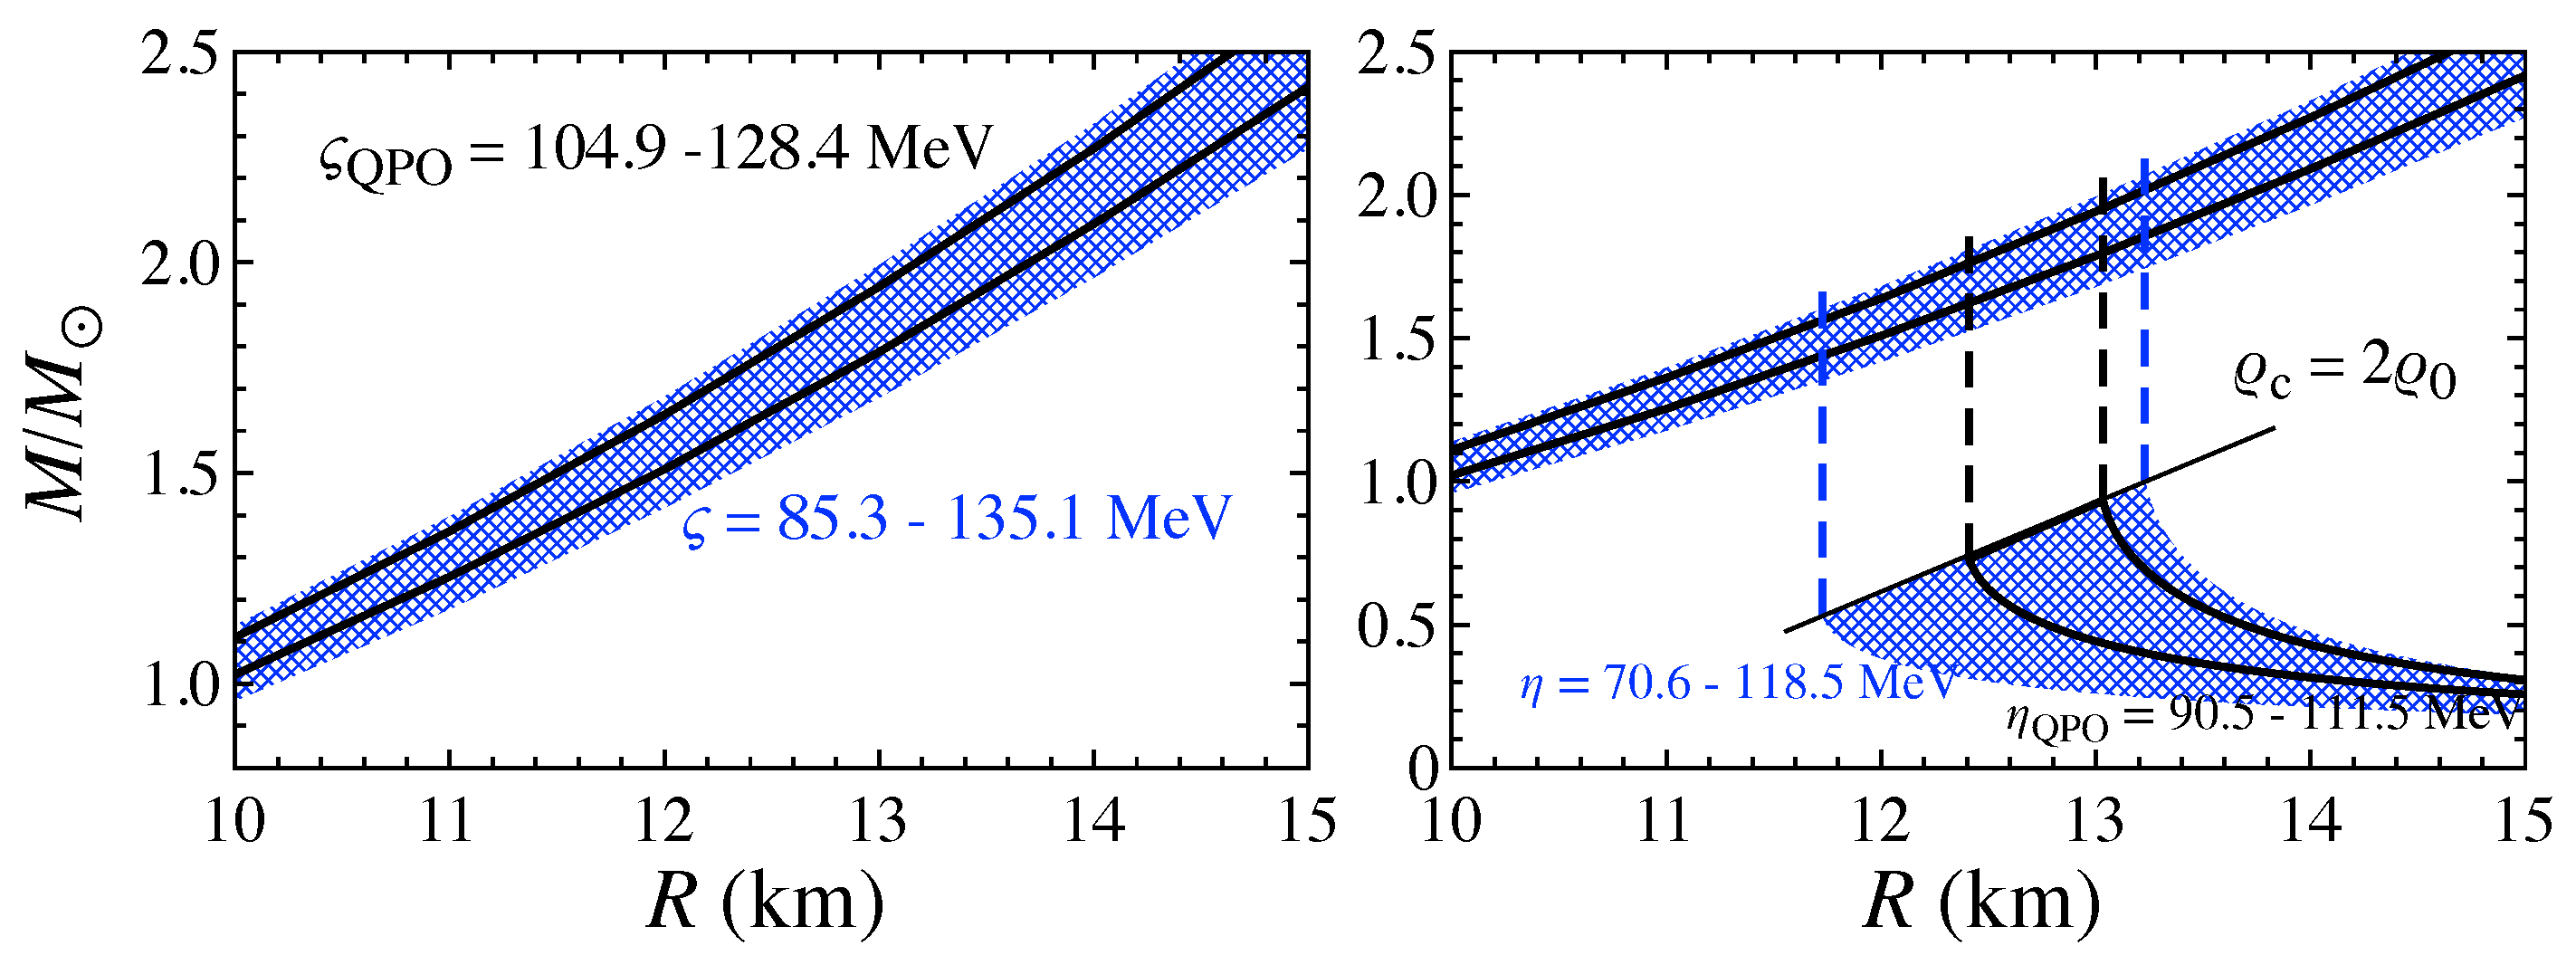
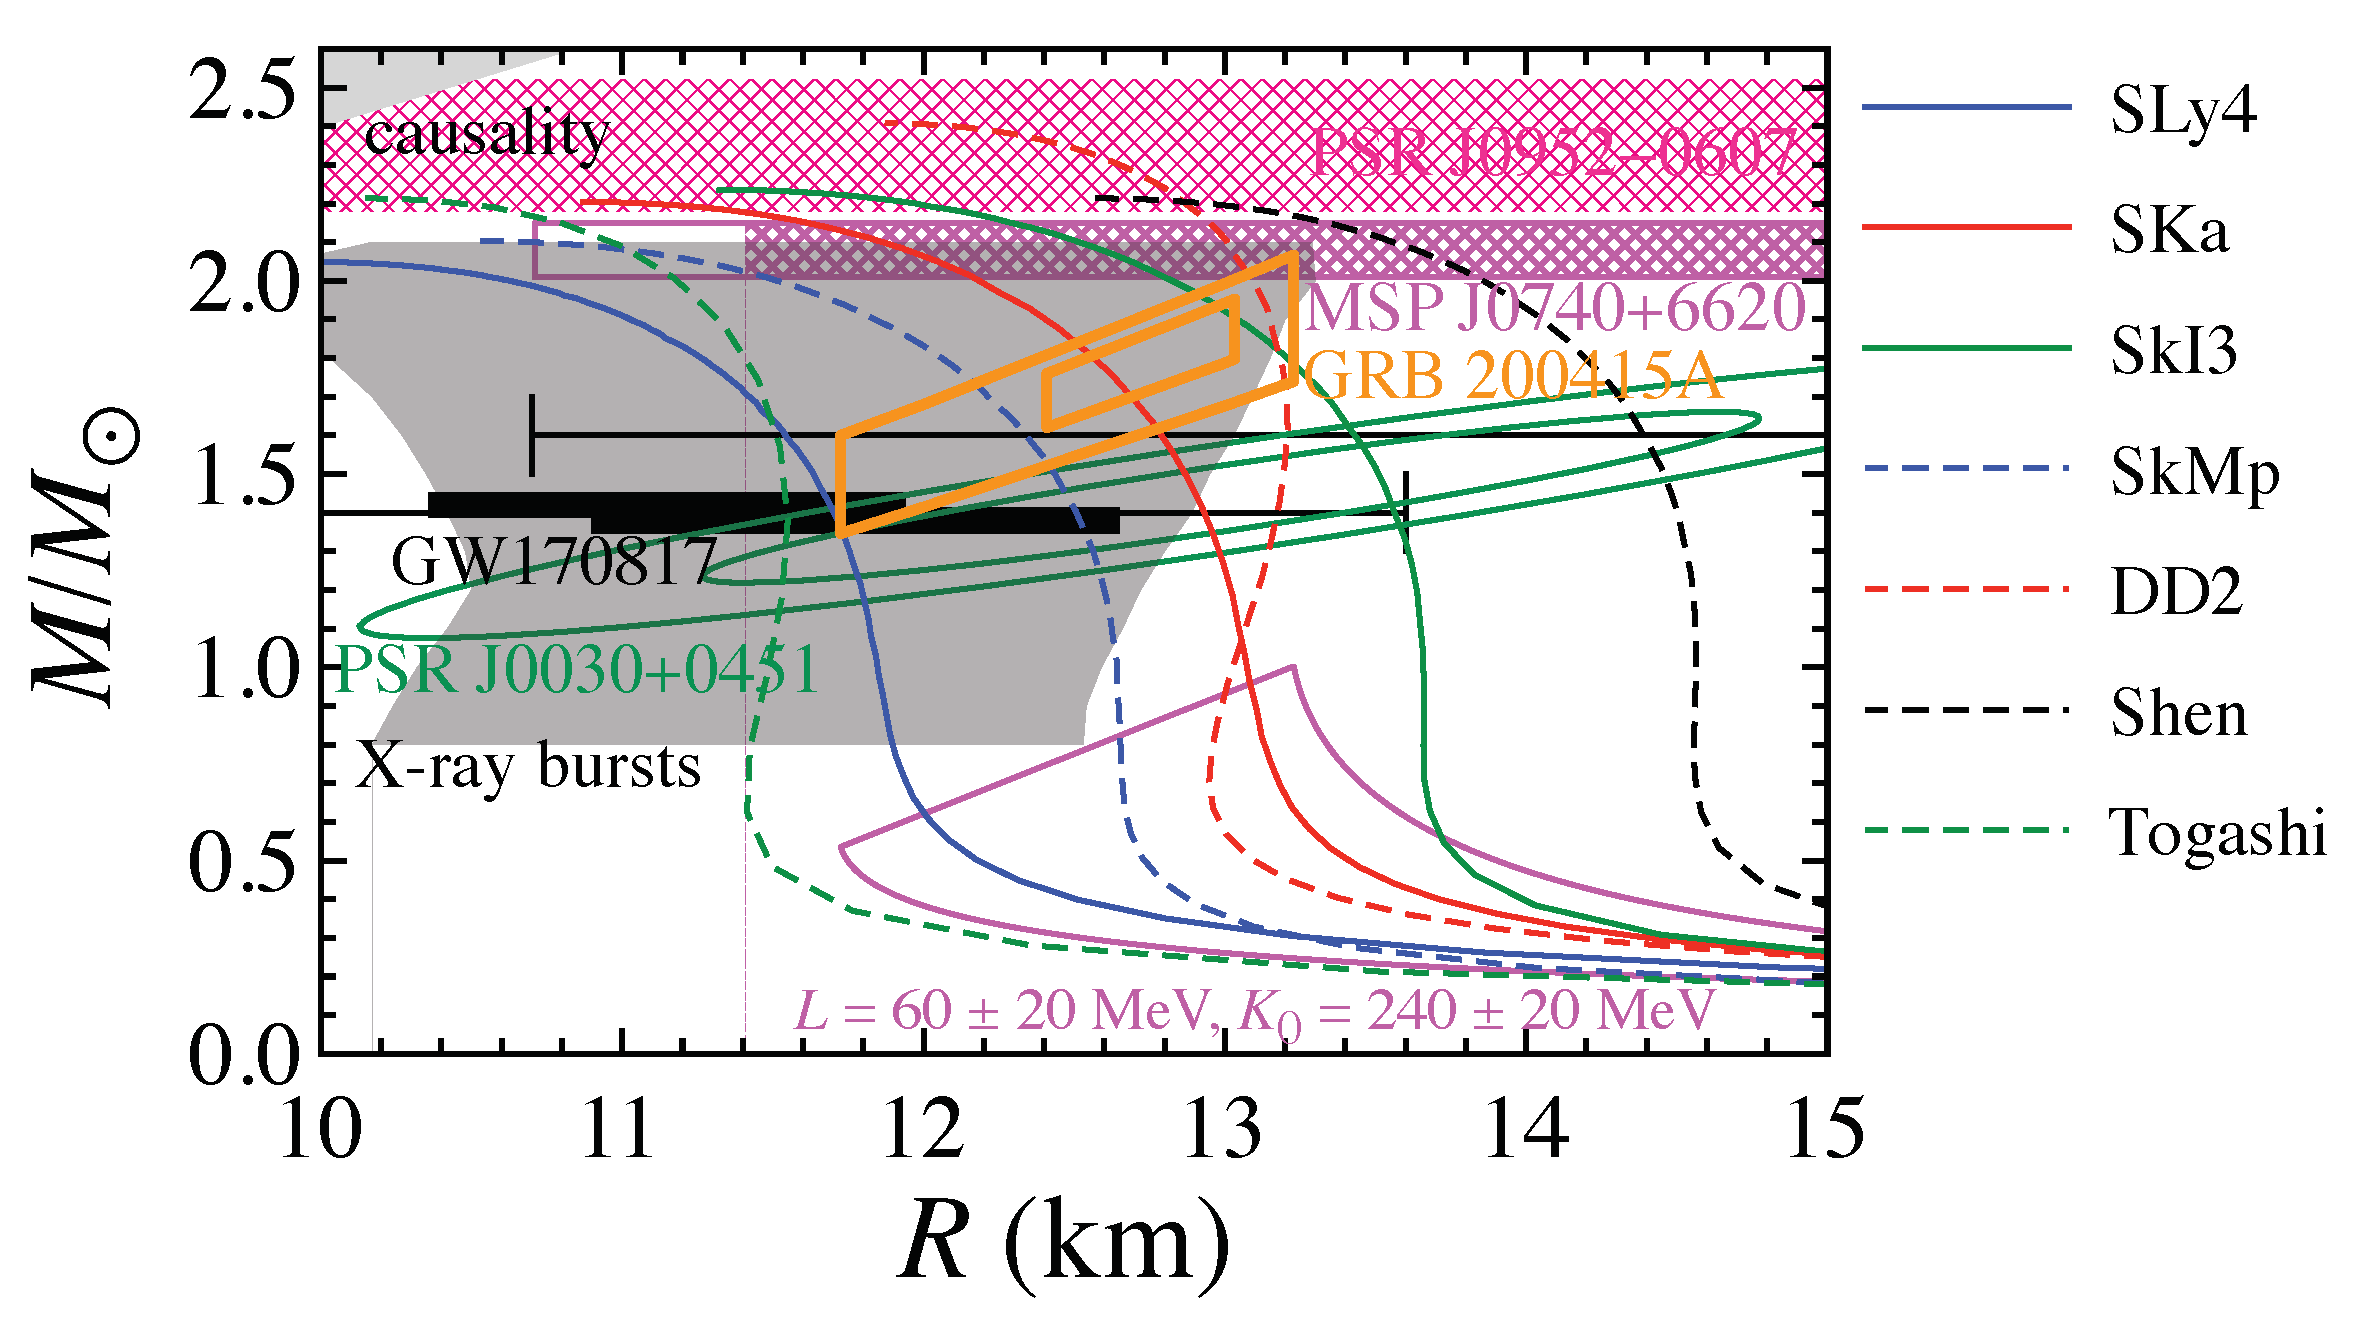
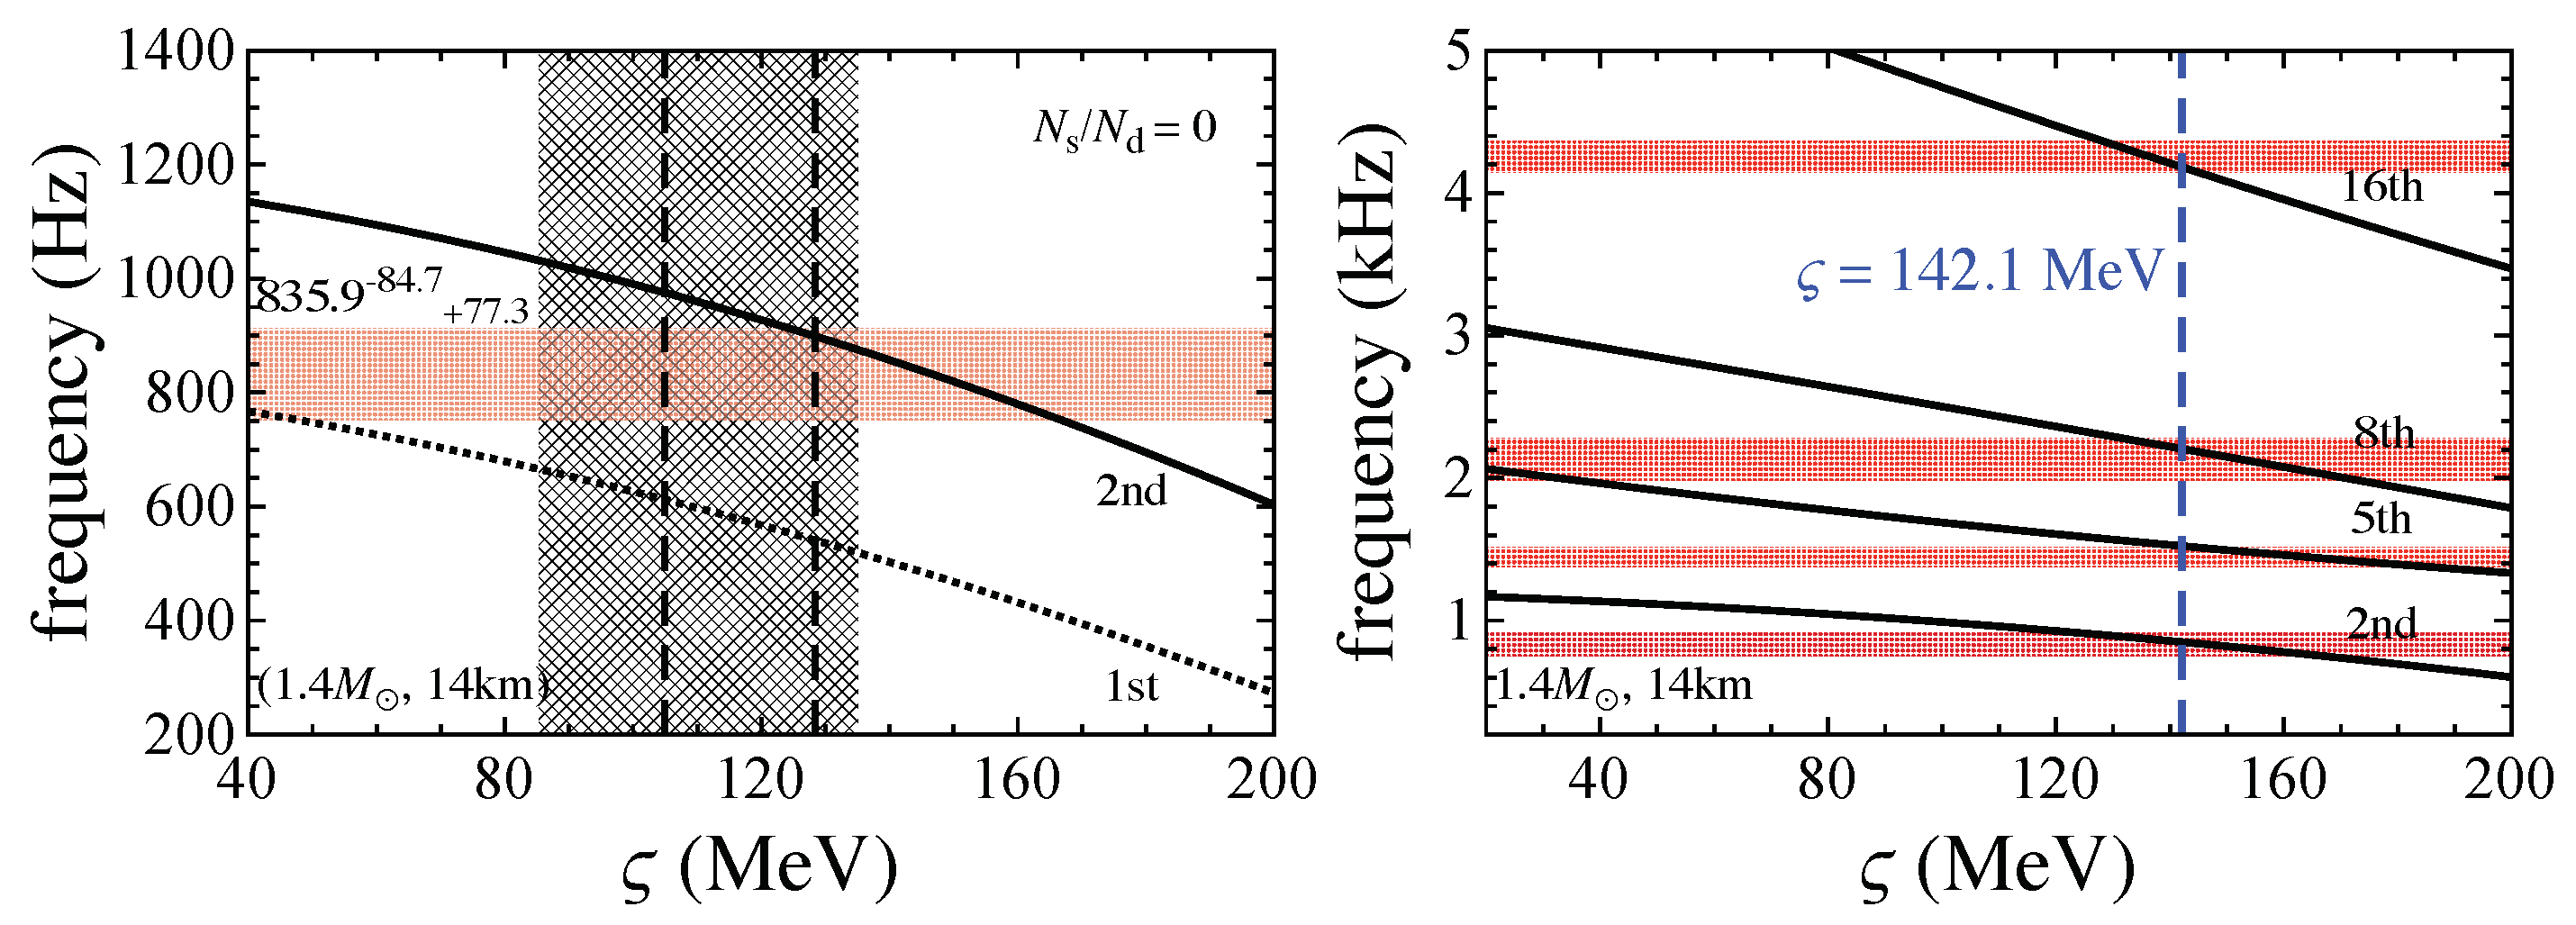
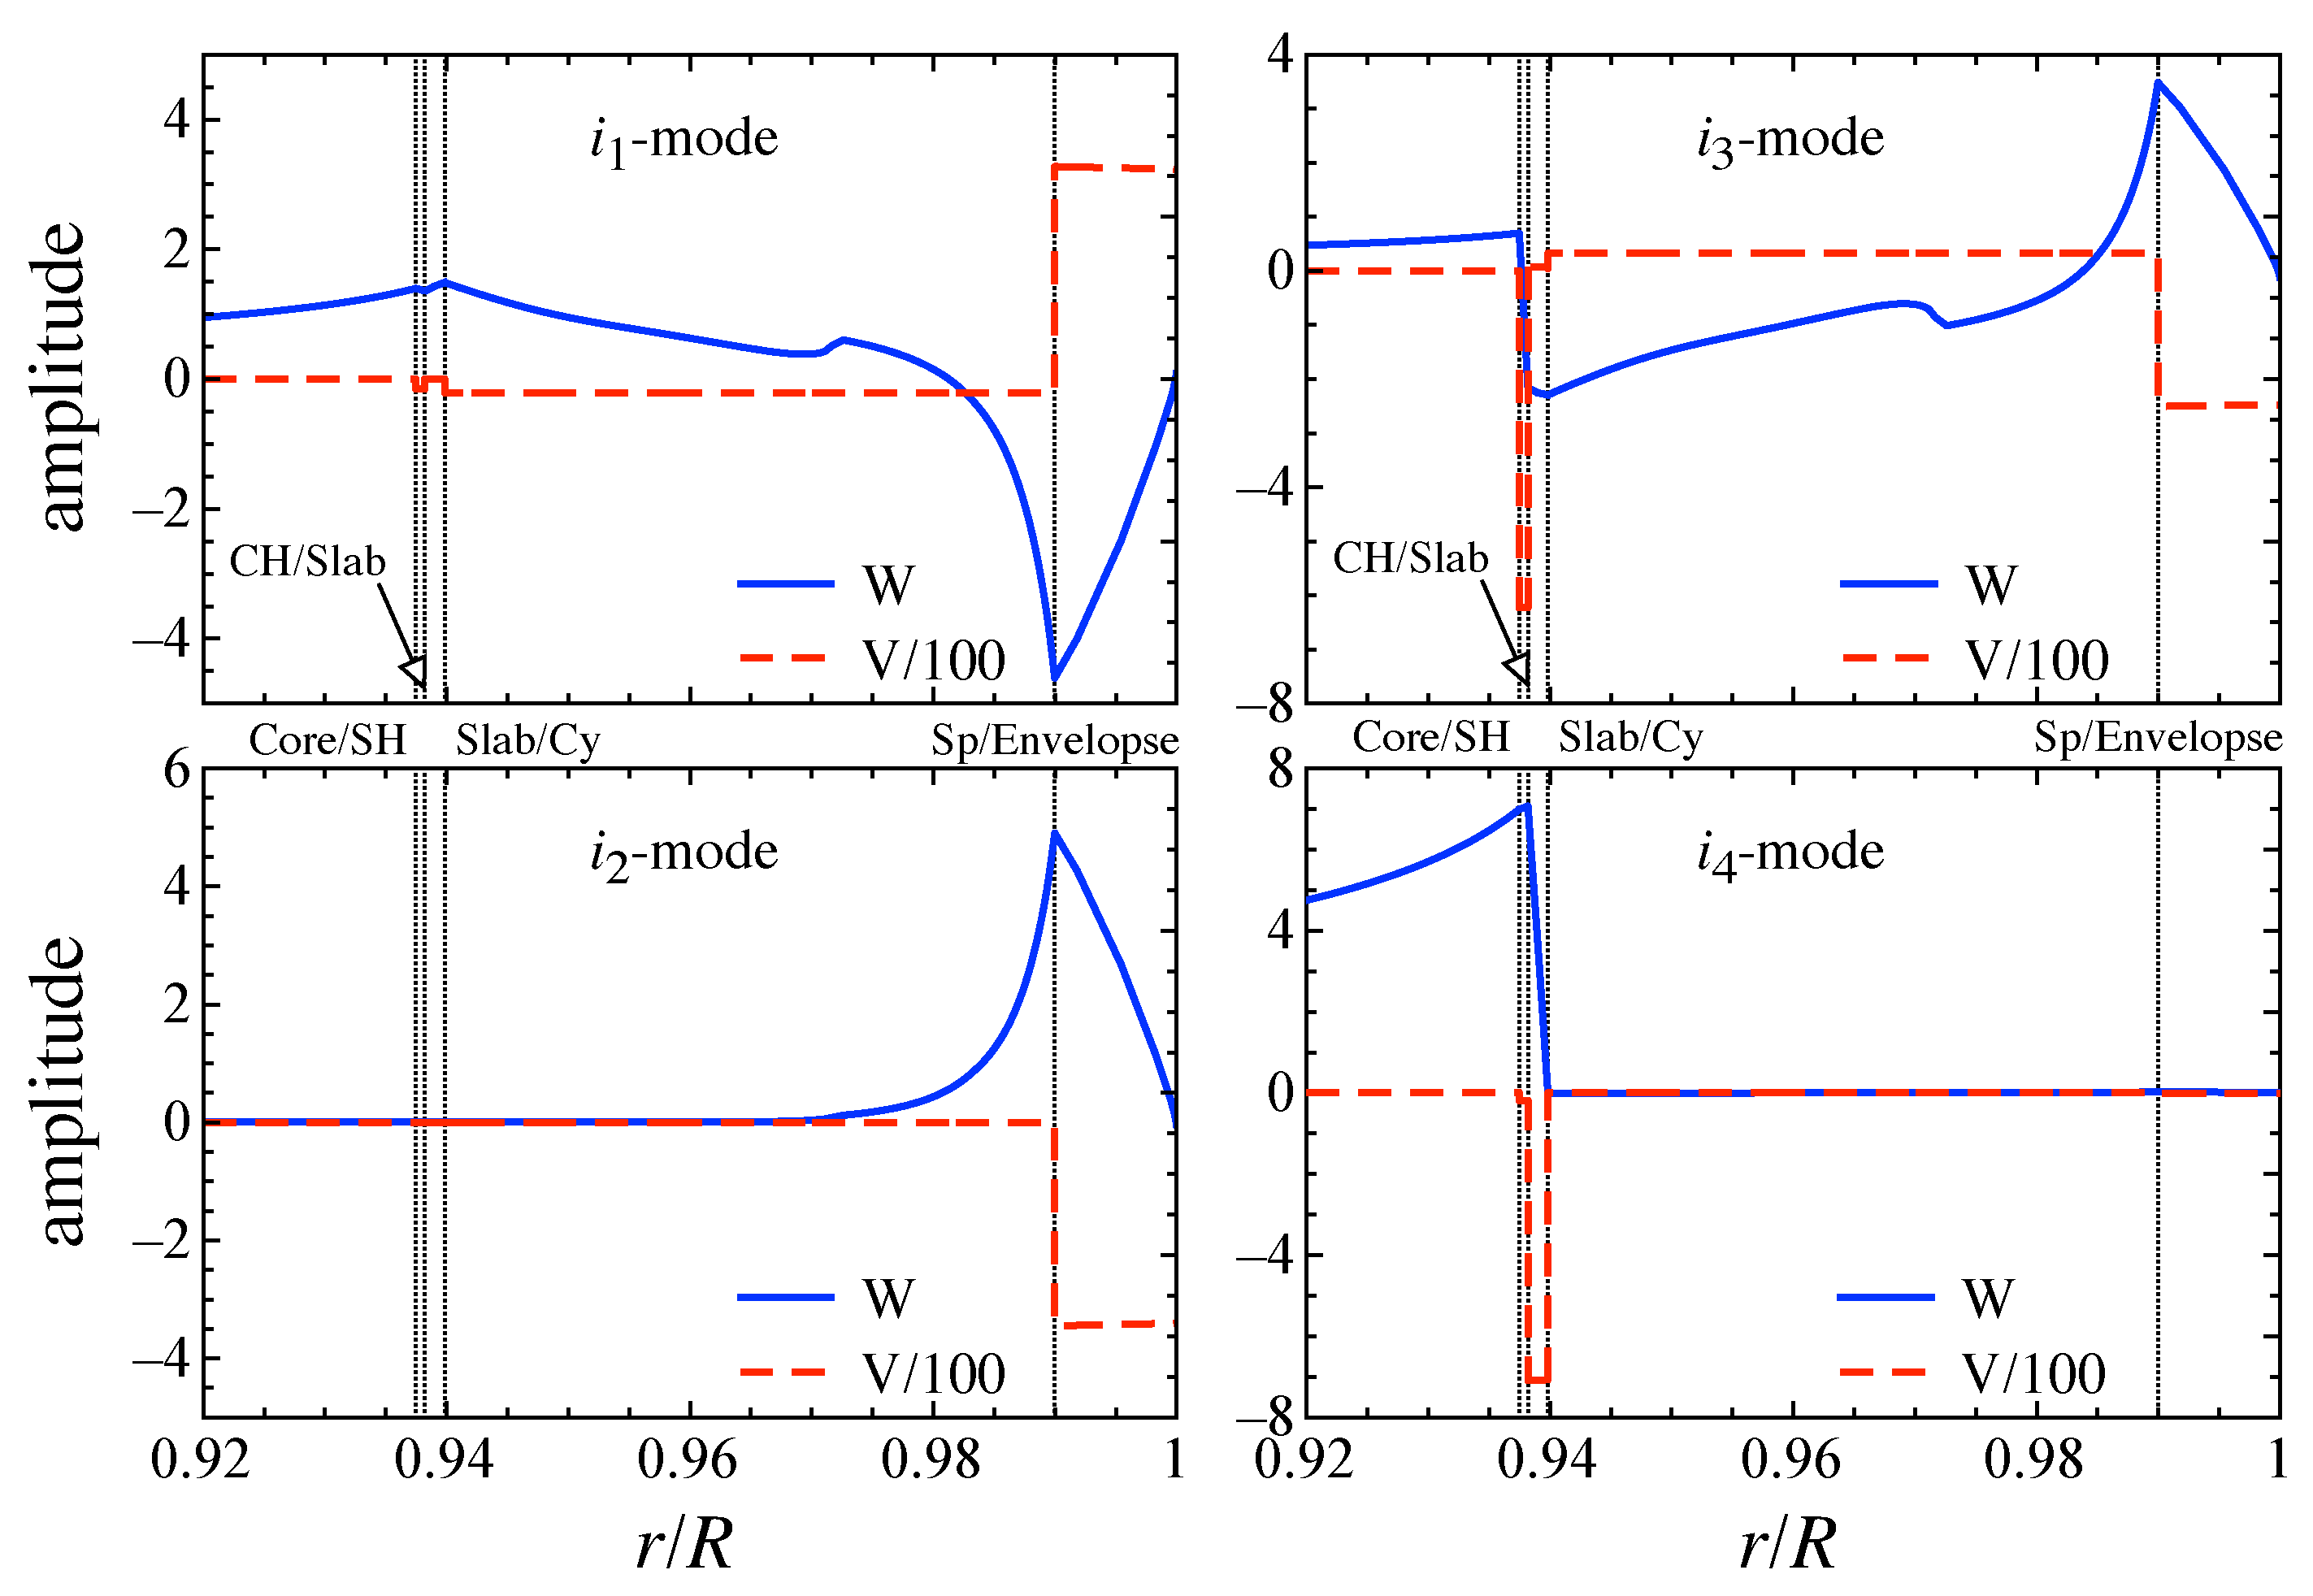

| (MeV) | (MeV fm3) | L (MeV) | SP-C (fm−3) | C-S (fm−3) | S-CH (fm−3) | CH-SH (fm−3) | SH-U (fm−3) |
|---|---|---|---|---|---|---|---|
| 180 | 1800 | 5.7 | 0.06000 | 0.08665 | 0.12039 | 0.12925 | 0.13489 |
| 180 | 600 | 17.5 | 0.05849 | 0.07986 | 0.09811 | 0.10206 | 0.10321 |
| 180 | 350 | 31.0 | 0.05887 | 0.07629 | 0.08739 | 0.09000 | 0.09068 |
| 180 | 220 | 52.2 | 0.06000 | 0.07186 | 0.07733 | 0.07885 | 0.07899 |
| 230 | 1800 | 7.6 | 0.05816 | 0.08355 | 0.11440 | 0.12364 | 0.12736 |
| 230 | 600 | 23.7 | 0.05957 | 0.07997 | 0.09515 | 0.09817 | 0.09866 |
| 230 | 350 | 42.6 | 0.06238 | 0.07671 | 0.08411 | 0.08604 | 0.08637 |
| 230 | 220 | 73.4 | 0.06421 | 0.07099 | 0.07284 | 0.07344 | 0.07345 |
| 280 | 1800 | 9.6 | 0.05747 | 0.08224 | 0.11106 | 0.11793 | 0.12286 |
| 280 | 600 | 30.1 | 0.06218 | 0.08108 | 0.09371 | 0.09577 | 0.09623 |
| 280 | 350 | 54.9 | 0.06638 | 0.07743 | 0.08187 | 0.08314 | 0.08331 |
| *280 | 220 | 97.5 | 0.06678 | — | — | — | 0.06887*1 |
| 360 | 1800 | 12.8 | 0.05777 | 0.08217 | 0.10892 | 0.11477 | 0.11812 |
| 360 | 600 | 40.9 | 0.06743 | 0.08318 | 0.09197 | 0.09379 | 0.09414 |
| *360 | 350 | 76.4 | 0.07239 | 0.07797 | 0.07890 | — | 0.07918*2 |
| *360 | 220 | 146.1 | — | — | — | — | 0.06680*3 |
Disclaimer/Publisher’s Note: The statements, opinions and data contained in all publications are solely those of the individual author(s) and contributor(s) and not of MDPI and/or the editor(s). MDPI and/or the editor(s) disclaim responsibility for any injury to people or property resulting from any ideas, methods, instructions or products referred to in the content. |
© 2024 by the authors. Licensee MDPI, Basel, Switzerland. This article is an open access article distributed under the terms and conditions of the Creative Commons Attribution (CC BY) license (http://creativecommons.org/licenses/by/4.0/).


