1. Introduction
Compounds with a large number of phenolic structural units, known as polyphenols, have a significant impact on the quality of wine in terms of organoleptic properties and effects on human health [1, 2]. This class of compounds not only influences the sensory properties of wine and the stability of subsequent oxidative processes, but also causes the activation of antioxidant and anti-inflammatory processes that lead to inhibition of platelet aggregation and reduce the risk of heart disease and stroke [
3]. Recent studies suggest that polyphenol-containing substances have a small direct antioxidant effect in the human body and that the metabolites formed by the consumption of polyphenol-rich foods play a significant positive role [
4]. Due to the above-mentioned advantages of polyphenolic compounds, there is a growing interest in the development and application of different analytical methods for their characterization in real samples: colorimetric, gravimetric, precipitation and chromatographic methods, vibrational spectroscopy, electrochemical methods, mass spectrometry, nuclear magnetic resonance and surface plasmon resonance [5-7]. Previous studies have shown that electrochemical methods have considerable potential due to the simplicity of the procedure, rapid detection, cost-effectiveness, high sensitivity and selectivity. In particular, voltammetric techniques using electrodes made of carbon paste and various modifiers and binders have shown improved properties compared to unmodified carbon electrode material.
As far as we know, the application of voltammetric methods using carbon paste electrodes modified with TiO
2 nanoparticles is rather limited. Mostly carbon electrodes with TiO
2 nanoparticles have been used for the quantitative and qualitative analysis of various inorganic, organic and biologically active substances. Mao et al. demonstrated the possibility of mercury detection using a glassy carbon electrode modified with TiO
2 nanoparticles and multi-walled carbon nanotubes dispersed in a cationic surfactant. The tested electrode showed high selectivity for mercury in the presence of other interfering metal ions [
8]. The study by Darzi et al. presented the development of a carbon electrode modified with TiO
2 nanoparticles for the voltammetric characterization of pramipexole (a pharmaceutical formulation) in biological samples. The proposed electrode showed good selectivity and sensitivity to the analyte investigated [
9]. A carbon electrode modified with a nanocomposite modifier (TiO
2 nanofibers, graphene oxide nanosheets) was used for the electrochemical characterization of adenine. An increase in the peak current and electron transfer kinetics as well as a decrease in the overpotential during adenine oxidation on the surface of the tested electrode was observed [
10]. Mashhadizadeh and Afshar determined clozapine in blood plasma samples using an electrode paste containing 33 wt% kerosene oil and 6 wt% TiO
2 nanoparticles [
11]. The test results showed that the presence of TiO
2 nanoparticles in the electrode material caused an increase in the electroactive surface area of the electrode, improved sensitivity and an increase in the intensity of the anodic current maximum.
In general, it can be stated that the properties of the carbon electrode modified with TiO
2 nanoparticles are significantly influenced by the type and quantity of the binding material and the proportion of TiO
2 nanoparticles in the electrode paste. Carbon electrodes modified with TiO
2 nanoparticles using paraffine oil are characterized by good sensitivity, selectivity of the tested substances, reproducibility and repeatability with a low detection limit [
12]. In a previous work, Mićin et al. have shown that the optimal composition of the modified electrode material is 40 vol% paraffin oil and 8 wt% TiO
2 nanoparticles in terms of morphological, physicochemical and electrochemical properties of the tested electrode materials [
13].
As far as we know, the possibility of using a sensor based on carbon and paraffin oil modified with TiO
2 nanoparticles (MCPE/np TiO
2) for the characterization of polyphenolic compounds in wines has not been investigated so far. However, a modified carbon paste electrode with TiO
2 nanoparticles has been used for the electrochemical characterization gallic acid [
14] as the most important wine polyphenol. Cyclic voltammetry and differential pulse voltammetry tests showed a lower resistance to electron transfer and a significant improvement of the oxidation current peak. The high analytical performance was attributed to the good biocompatibility and high conductivity of the TiO
2 nanoparticles. The width of the range of the linear voltammetric response and the limit of detection value indicated good sensitivity of the electrode [
14].
The aim of this work is to advance the characterization of selected polyphenolic compounds in a model wine solution and a series of natural wine samples using cyclic voltammetry at a TiO
2-modified CPE electrode. The data processing approach developed by Espinoza et al. is applied, which allows a physical interpretation of the electrochemical behavior of such complex systems [
15]. The purpose of our work is to pave the way for an integrated sensor/data processing system for the quantitative characterization of polyphenolic compounds in wine, which are related to the sensory properties of wine and could contribute to a more comprehensive characterization of polyphenols in winemaking.
2. Materials and Methods
Chemicals
Unmodified and modified carbon pastes were prepared using extra purity graphite powder, particle size <50 μm, Merck, Germany, paraffin oil, Merck, Germany, diethyl ether, p.a., Lachner, Czech Republic and TiO
2 nanoparticles (np TiO
2), trade name AEROXIDE® TiO
2P, Evonik Industries AG, Germany. The size of nanoparticles is 10-50 nm predominantly distributed in the range of 15 to 25 nm [
16].
Ethyl alcohol, 99.8%, LACH:NER, Czech Republic, tartaric acid Sigma-Aldrich, Germany, sodium hydroxide, LACH:NER, Czech Republic, (+)-catechin, Roth, Germany, caffeic acid (≥ 98 %), Sigma-Aldrich, Germany, trans-resveratrol (≥ 98 %), Cayman chemical, USA, quercetin (≥ 98 %), Molecule group, England and gallic acid (98 %), Acros organics, Belgium were used in electrolyte solutions for the characterization of polyphenolic compounds. The investigated wines were three commercially available types of red wine were (Cabernet sauvignon (CS), pH = 3.41, alcohol conc. 13.5 vol %; Merlot (ME), pH = 3.19, alcohol conc. 13.5 vol %, Vranac (VR), pH = 3.19 , alcohol conc. 11.5 vol %), three types of white wine were (Temjanika (TE), pH = 3.14, alcohol conc. 11.5 vol %, Graševina (GR), pH = 2.92, alcohol conc. 10.5 vol %, Chardonny (CH), pH = 3.07, alcohol conc. 12.5 vol %) and one type of rose wine (Belrose Mediteranee Rose (RO), pH = 3.1, alcohol conc. 12.5 vol %). Distilled water with a conductivity of 4 μS/m was used for the preparation of all solutions.
Preparation of unmodified carbon paste
The unmodified carbon paste was prepared by manually mixing graphite powder (3 g) and paraffin oil (1.09 mL) in a bowl and stored in a closed plastic container at room temperature. The paste was used 24 hours after preparation.
Preparation of modified carbon paste
The modified carbon paste was prepared by dispersing a mixture of graphite powder (4.6 g) and TiO
2 nanoparticles (0.4 g) in 50 mL of diethyl ether with constant stirring and heating to a temperature of 40 °C. The mixture was then evaporated. After evaporation of the diethyl ether, the graphite powder (3 g), in which the TiO
2 particles were dispersed, was mixed with paraffin oil (1.09 mL). Homogenization was carried out by manual mixing in a ceramic bowl according to the procedure described [
11]. The prepared modified carbon paste was stored in a closed plastic box at room temperature and used 24 hours after preparation.
Preparation of a modified carbon electrode
The body of the working electrode is made of commercially available Teflon in the form of a tube (length 200 mm, diameter 20 mm) with a cavity at the end of the electrode body (length 10 mm, diameter 2.4 mm, surface area 0.045216 cm2). The electrical contact was made with a copper wire (diameter 1 mm) fixed in the electrode body. The prepared unmodified/modified paste is pressed into the body of the working electrode. The active surface of the electrode is polished with filter paper to obtain a smooth electrode surface. Pressing a new amount of paste and polishing the electrode surface was performed immediately before each experimental measurement.
Electrochemical characterization of polyphenolic compounds
Polyphenols prevalent in wine such as gallic acid (GA), caffeic acid (CA), catechin (CT), quercetin (QV) and resveratrol (RE) [
17] were selected as model polyphenolic compounds and used for electrochemical characterization. The measurements were performed by cyclic voltammetry (CV) on a potentiostat/galvanostat device (PAR 273A, Princeton Applied Research, USA) and in an electrochemical cell with a volume of 50 mL, consisting of a working electrode, a reference electrode (Ag/AgCl 3.5 M) and a counter electrode (platinum plate, surface area 2.4 cm
2). The unmodified carbon electrode (CPE) and the modified carbon electrode (MCPE/npTiO
2) were used as working electrodes. The experiments were performed without mixing at room temperature 23±1°C with three consecutive measurements. The cyclic voltammograms were analyzed using Powersuite 2.40 software. All potentials are given relative to the reference electrode. The working electrolyte solution was a 0.3 mM solution (unless otherwise stated) of a polyphenolic compound in a model wine solution (tartaric acid 0.033 M, 12% v/v ethanol) with a pH of 3.6 (quercetin solution pH of 2.6). The pH of the working electrolyte was corrected by adding solid NaOH and checked with a pH meter (CONSORT C861). A model wine solution was used to determine the oxidation potentials exhibited by phenolic compounds in wine [
18]. The measurement of real wine samples was carried out without prior processing of the sample. The change in the concentration of polyphenolic compounds in natural wine samples was performed by diluting the wine sample with a model wine solution. Cyclic voltammograms were recorded in the potential range from -100 mV to 1500 mV with a potential change rate of 200 mV/s unless otherwise stated.
Mathematical analysis of voltammograms
The formal electrooxidation potential of the polyphenolic compounds was determined by identifying the inflection point obtained by the first derivative of the cyclic voltammogram function. Specifically, the potentials where the first derivative function is zero (i.e. where it intersects the x-axis) correspond to the potential values of the anode current peaks. In addition, the potentials where the first derivative function reaches its maximum coincide with the inflection points [
15]. The application software EXCEL 2016 and MATH 10 were used to process the cyclic voltammograms to determine the inflection point.
3. Results
Characterization of the selected polyphenolic compounds: GA, CA, CT, QV and RE in model wine solutions was carried out.
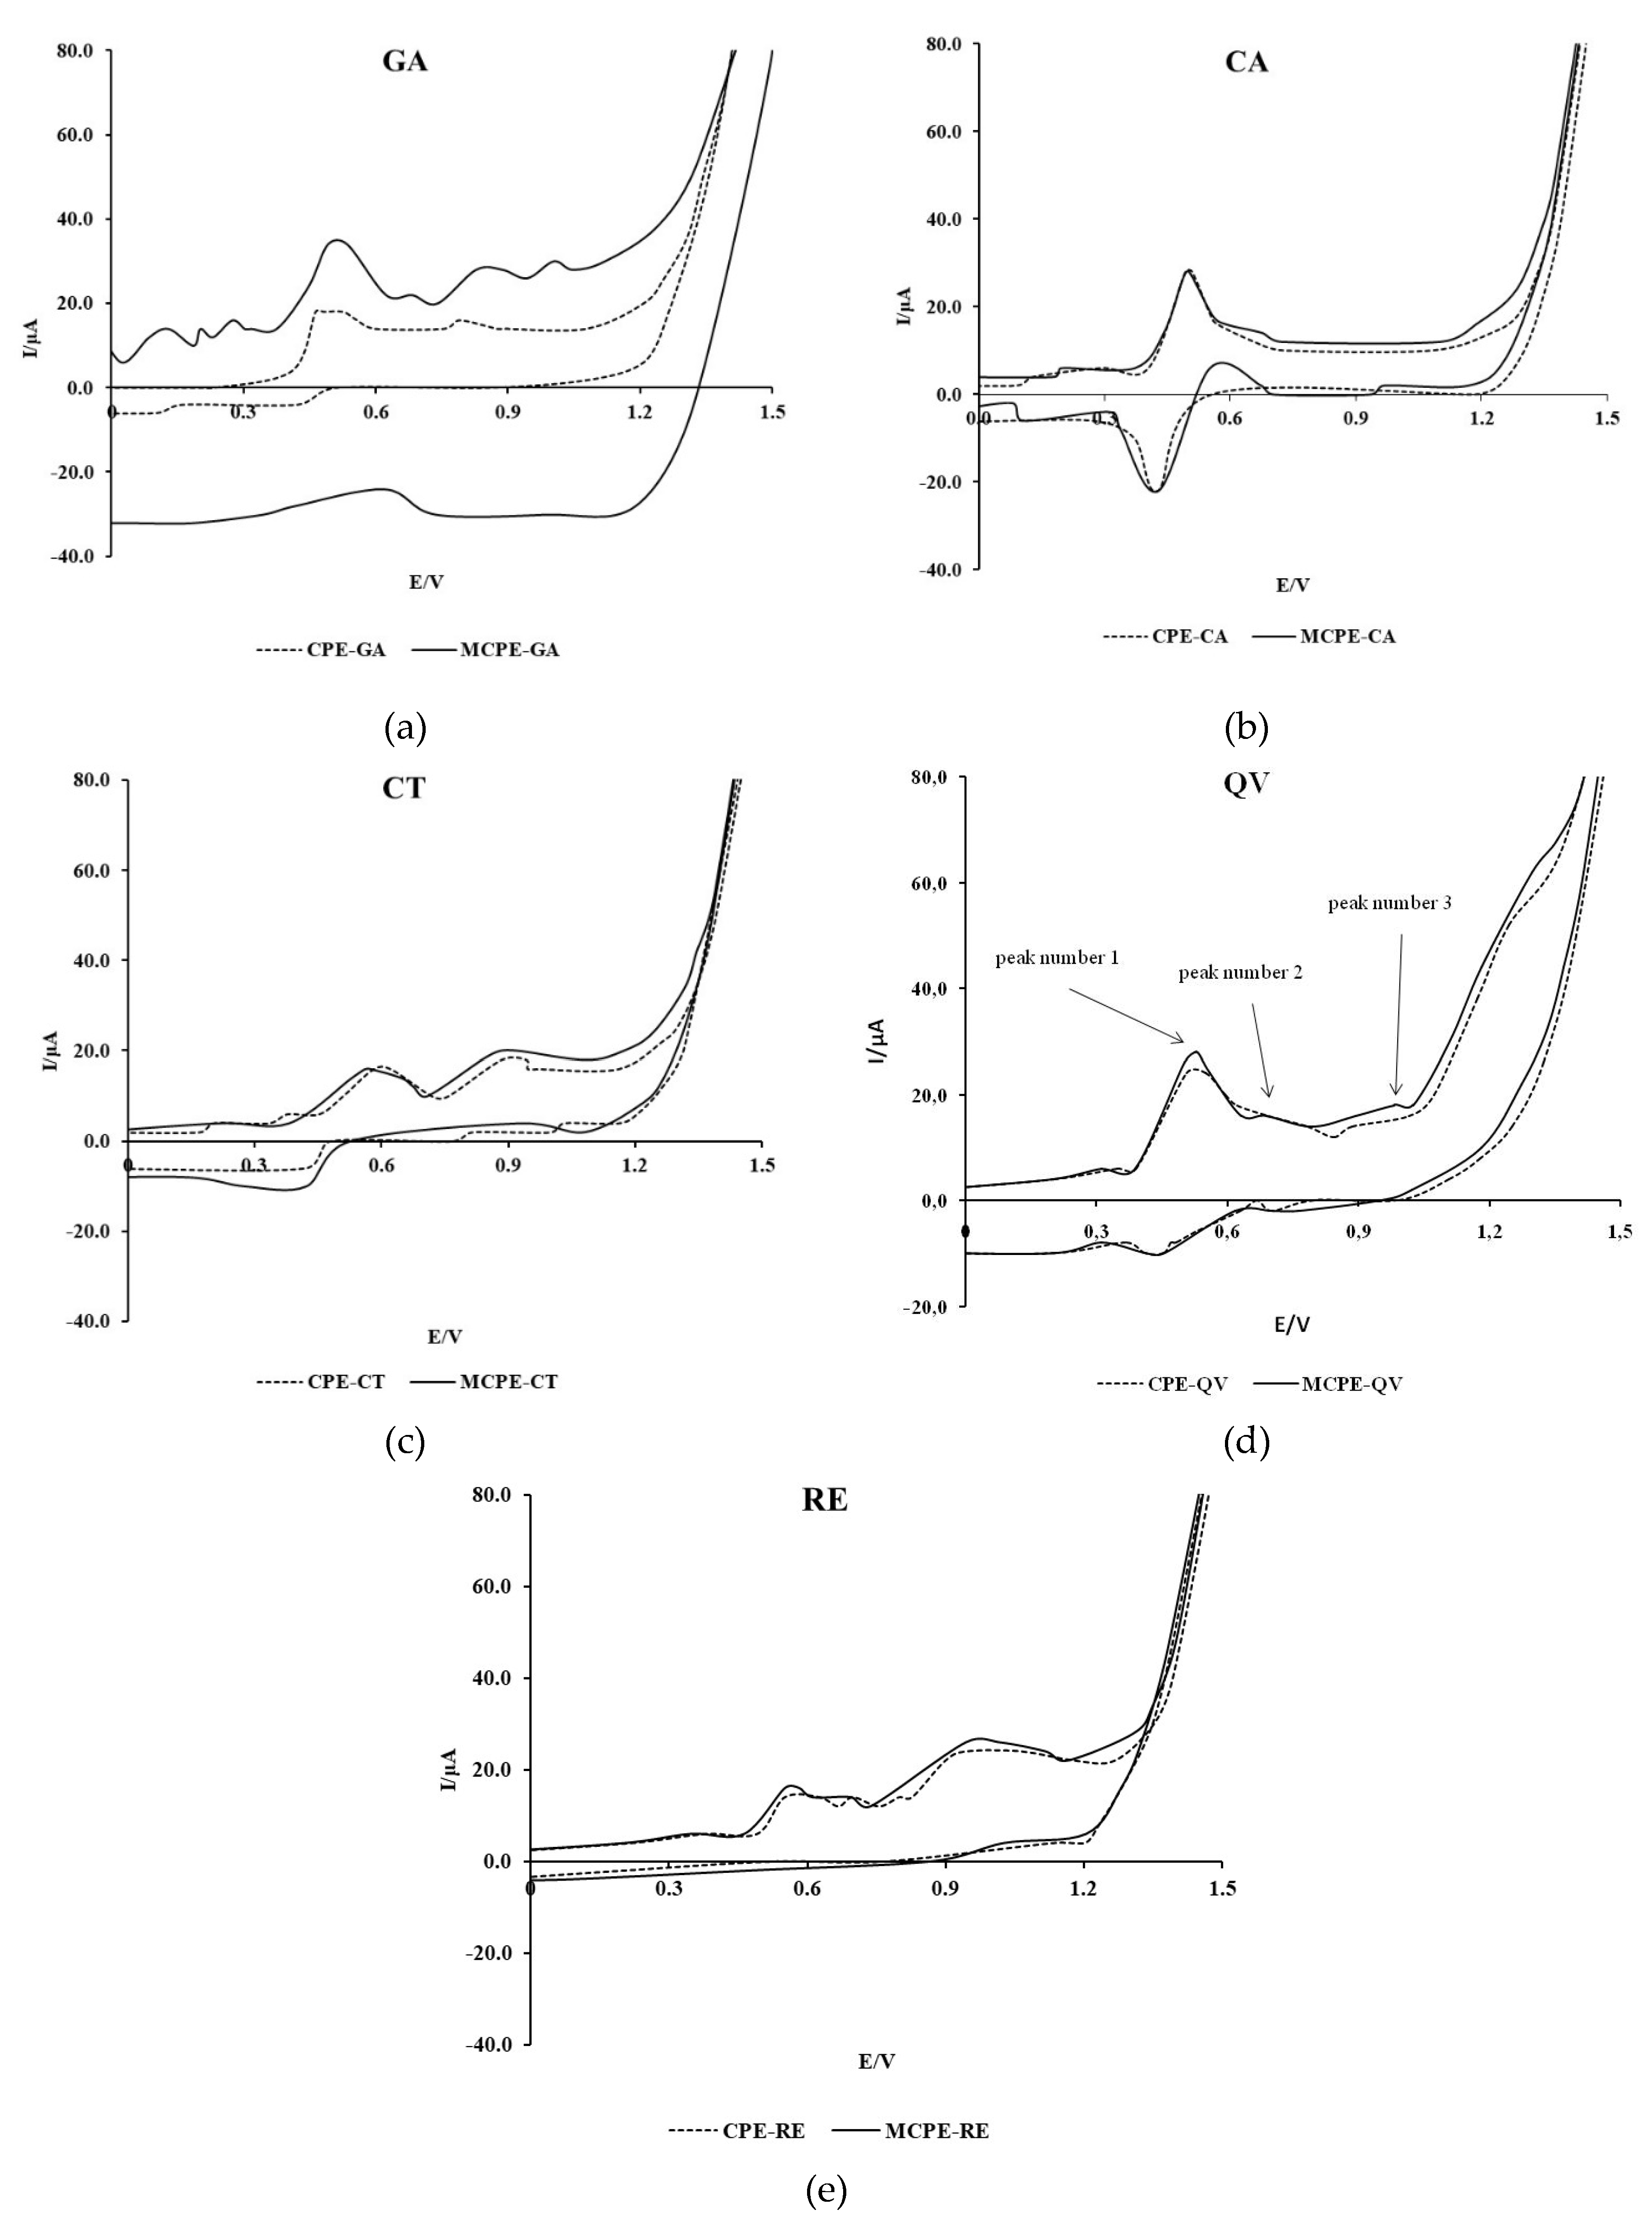
Figure 1 shows the cyclic voltammograms of the tested polyphenolic compounds recorded with CPE and MCPE/np TiO
2.
The values of the formal oxidation potential and the anodic peak potentials and currents (
Table 1) were determined from the derivative function of the cyclic voltammograms for GA, CT, QV and RE. Considering the reversible character of the electrooxidation of CA, the value of the formal potential for CA was determined from the half-wave potential.
The voltammogram of GA recorded with CPE shows two anodic peaks at the potentials of 0.50 and 0.80 V, whereas the voltammogram of GA recorded with MCPE/npTiO2 shows two anodic peaks at the potentials of 0.53 and 0.85 V. In addition, the voltammogram recorded with MCPE/npTiO2 shows a third anodic peak of lower intensity at a potential of 1.21 V. The estimated formal oxidation potential of GA recorded with MCPE/npTiO2 is shifted towards slightly more negative values at 0.39 V compared to the estimated potential of 0.42 V obtained with CPE. The intensity of the GA anodic current peaks increases significantly when using the modified electrode. No pronounced cathodic current peak can be observed in the GA voltammograms, which indicates the predominant irreversibility of the reaction.
The cyclic voltammogram recorded in a 0.3 mM CA solution in the potential range from -0.1 to 1.0 V using CPE shows identical values of the formal potential and the potential of the anodic wave peak compared to the voltammogram recorded using MCPE/npTiO2, where the intensity of the anodic peak current did not increase. The results show a pronounced anodic current peak at a potential of 0.50 V and a cathodic current peak at a potential of 0.43 V. The formal oxidation potential has a value of 0.47 V. The shape of the recorded voltammogram shows the reversibility of the electrochemical oxidation process of CA.
In CT, QV and RE, the difference between peak current intensities on CPE and MCPE/npTiO2 is much smaller than in GA, and the effect of CPE modification on formal oxidation potentials and current peak potentials is mixed and in the range of tens of mV. Similar to GA, the electrooxidation of these compounds is predominantly irreversible. For QV, two additional higher potential anodic current peaks are observed in the voltammogram recorded with MCPE/npTiO2 compared to CPE.
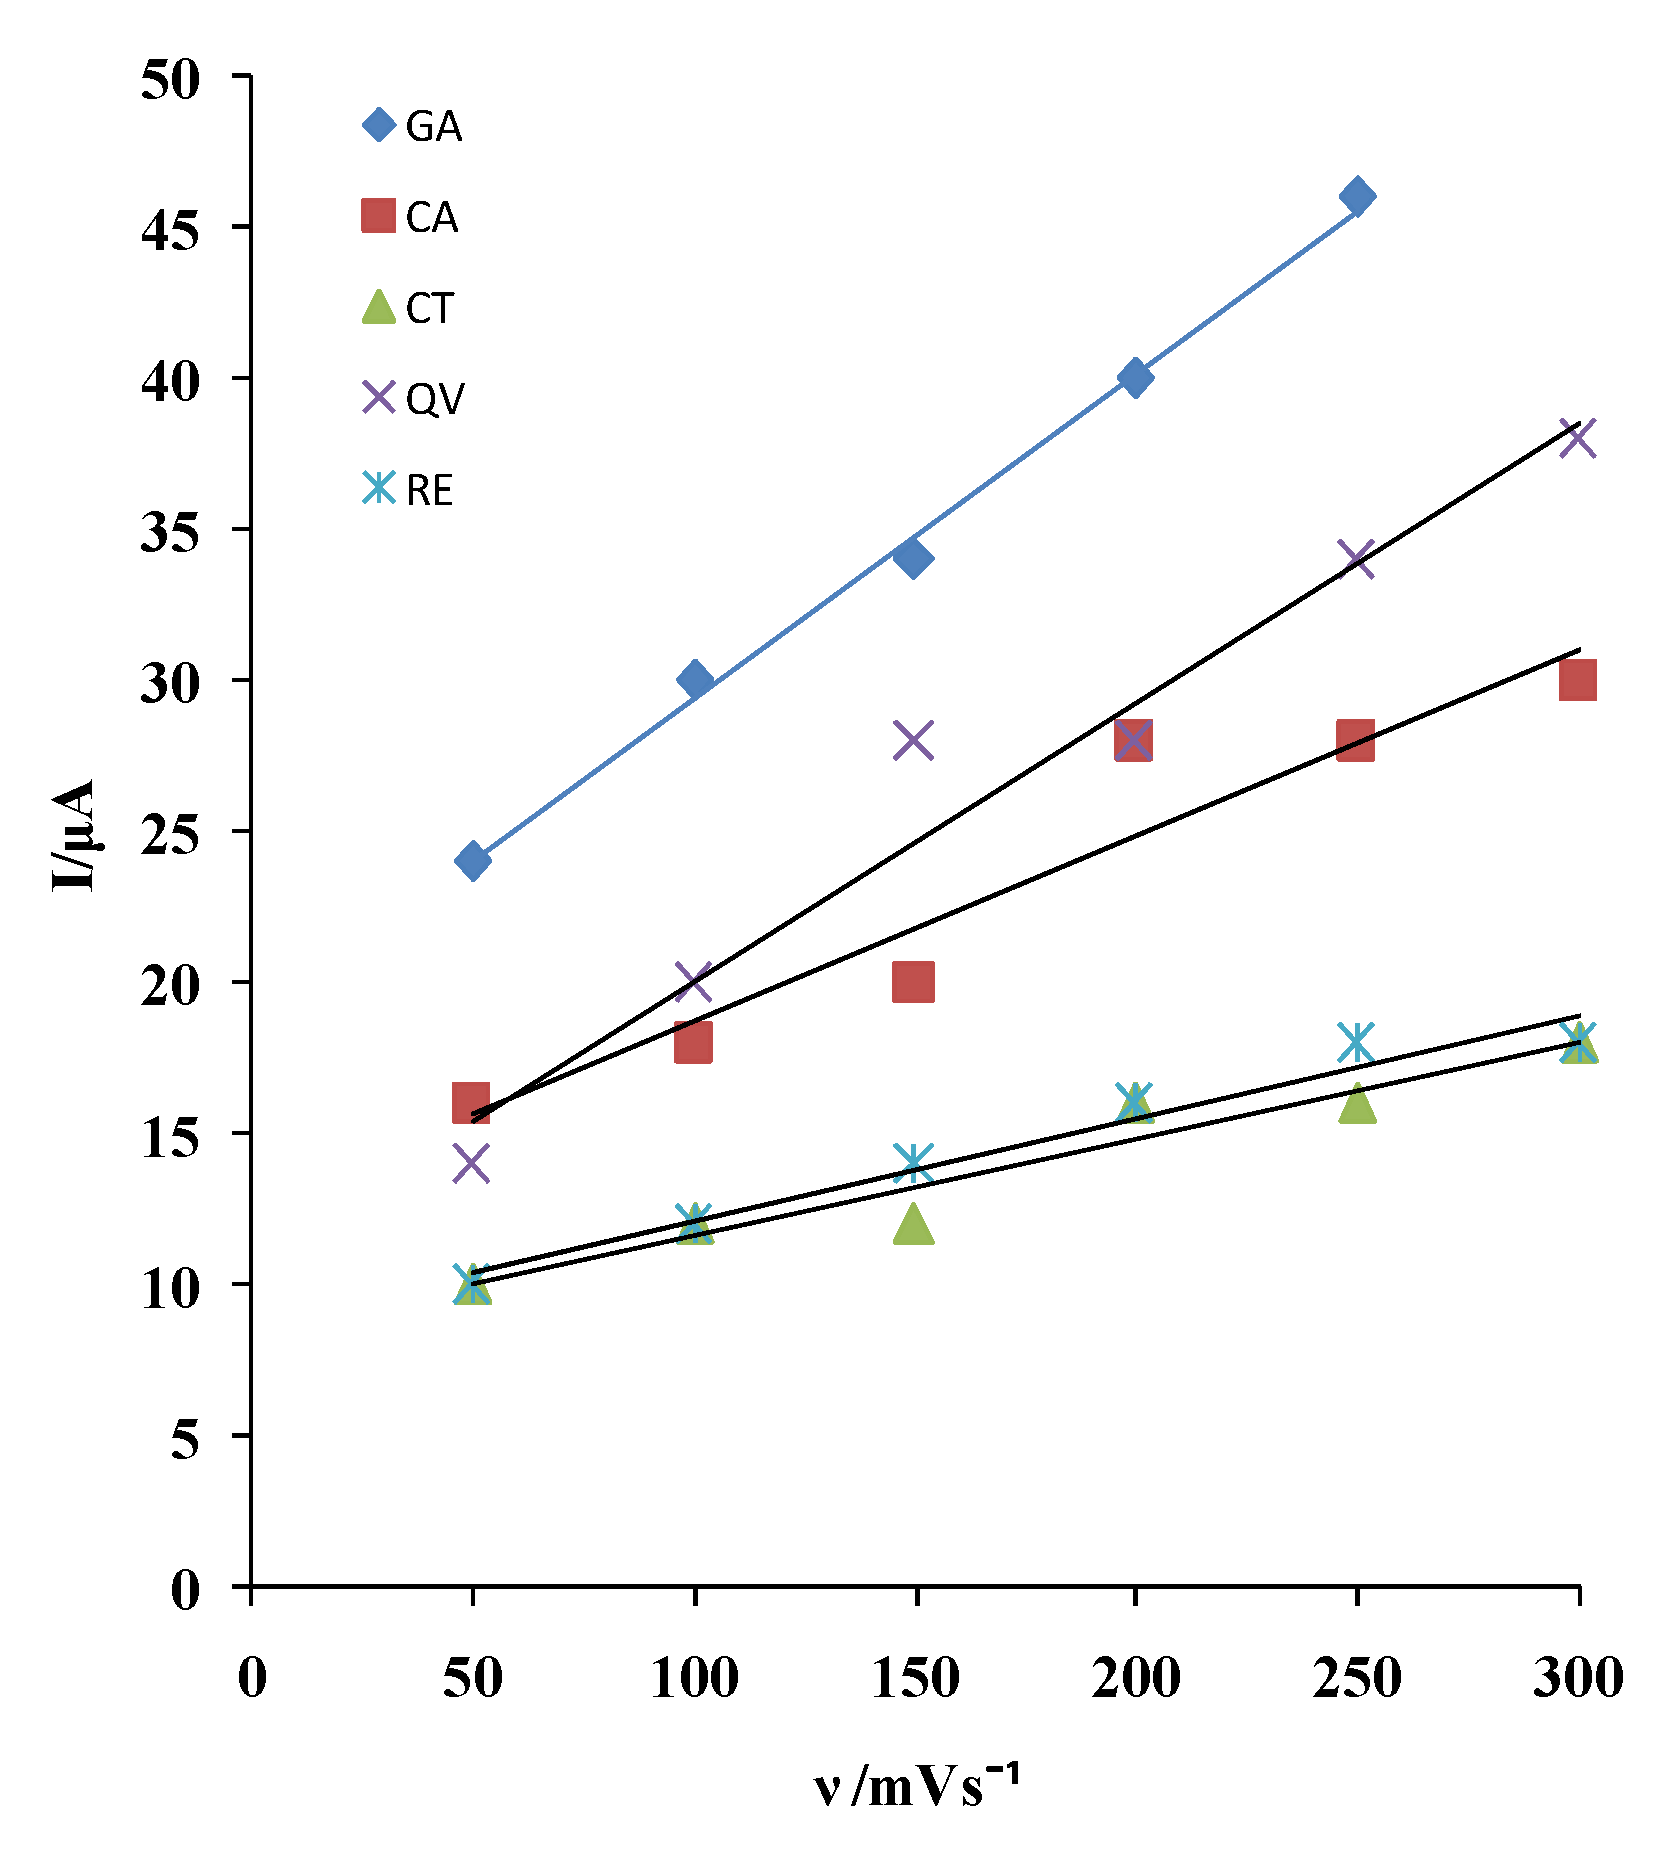
Based on the dependence of the anodic current peak on the rate of potential change, an assessment was made of the type of electrode process influencing the rate of electrochemical oxidation of the tested polyphenolic compounds on MCPE/npTiO
2 electrode (
Figure 2).
The dependence of the anodic current on the rate of potential change is given by the expressions in
Table 2.
The first anodic current peak depends linearly on the rate of potential change, which indicates that the electrode reactions of the tested polyphenols take place under the influence of adsorption.
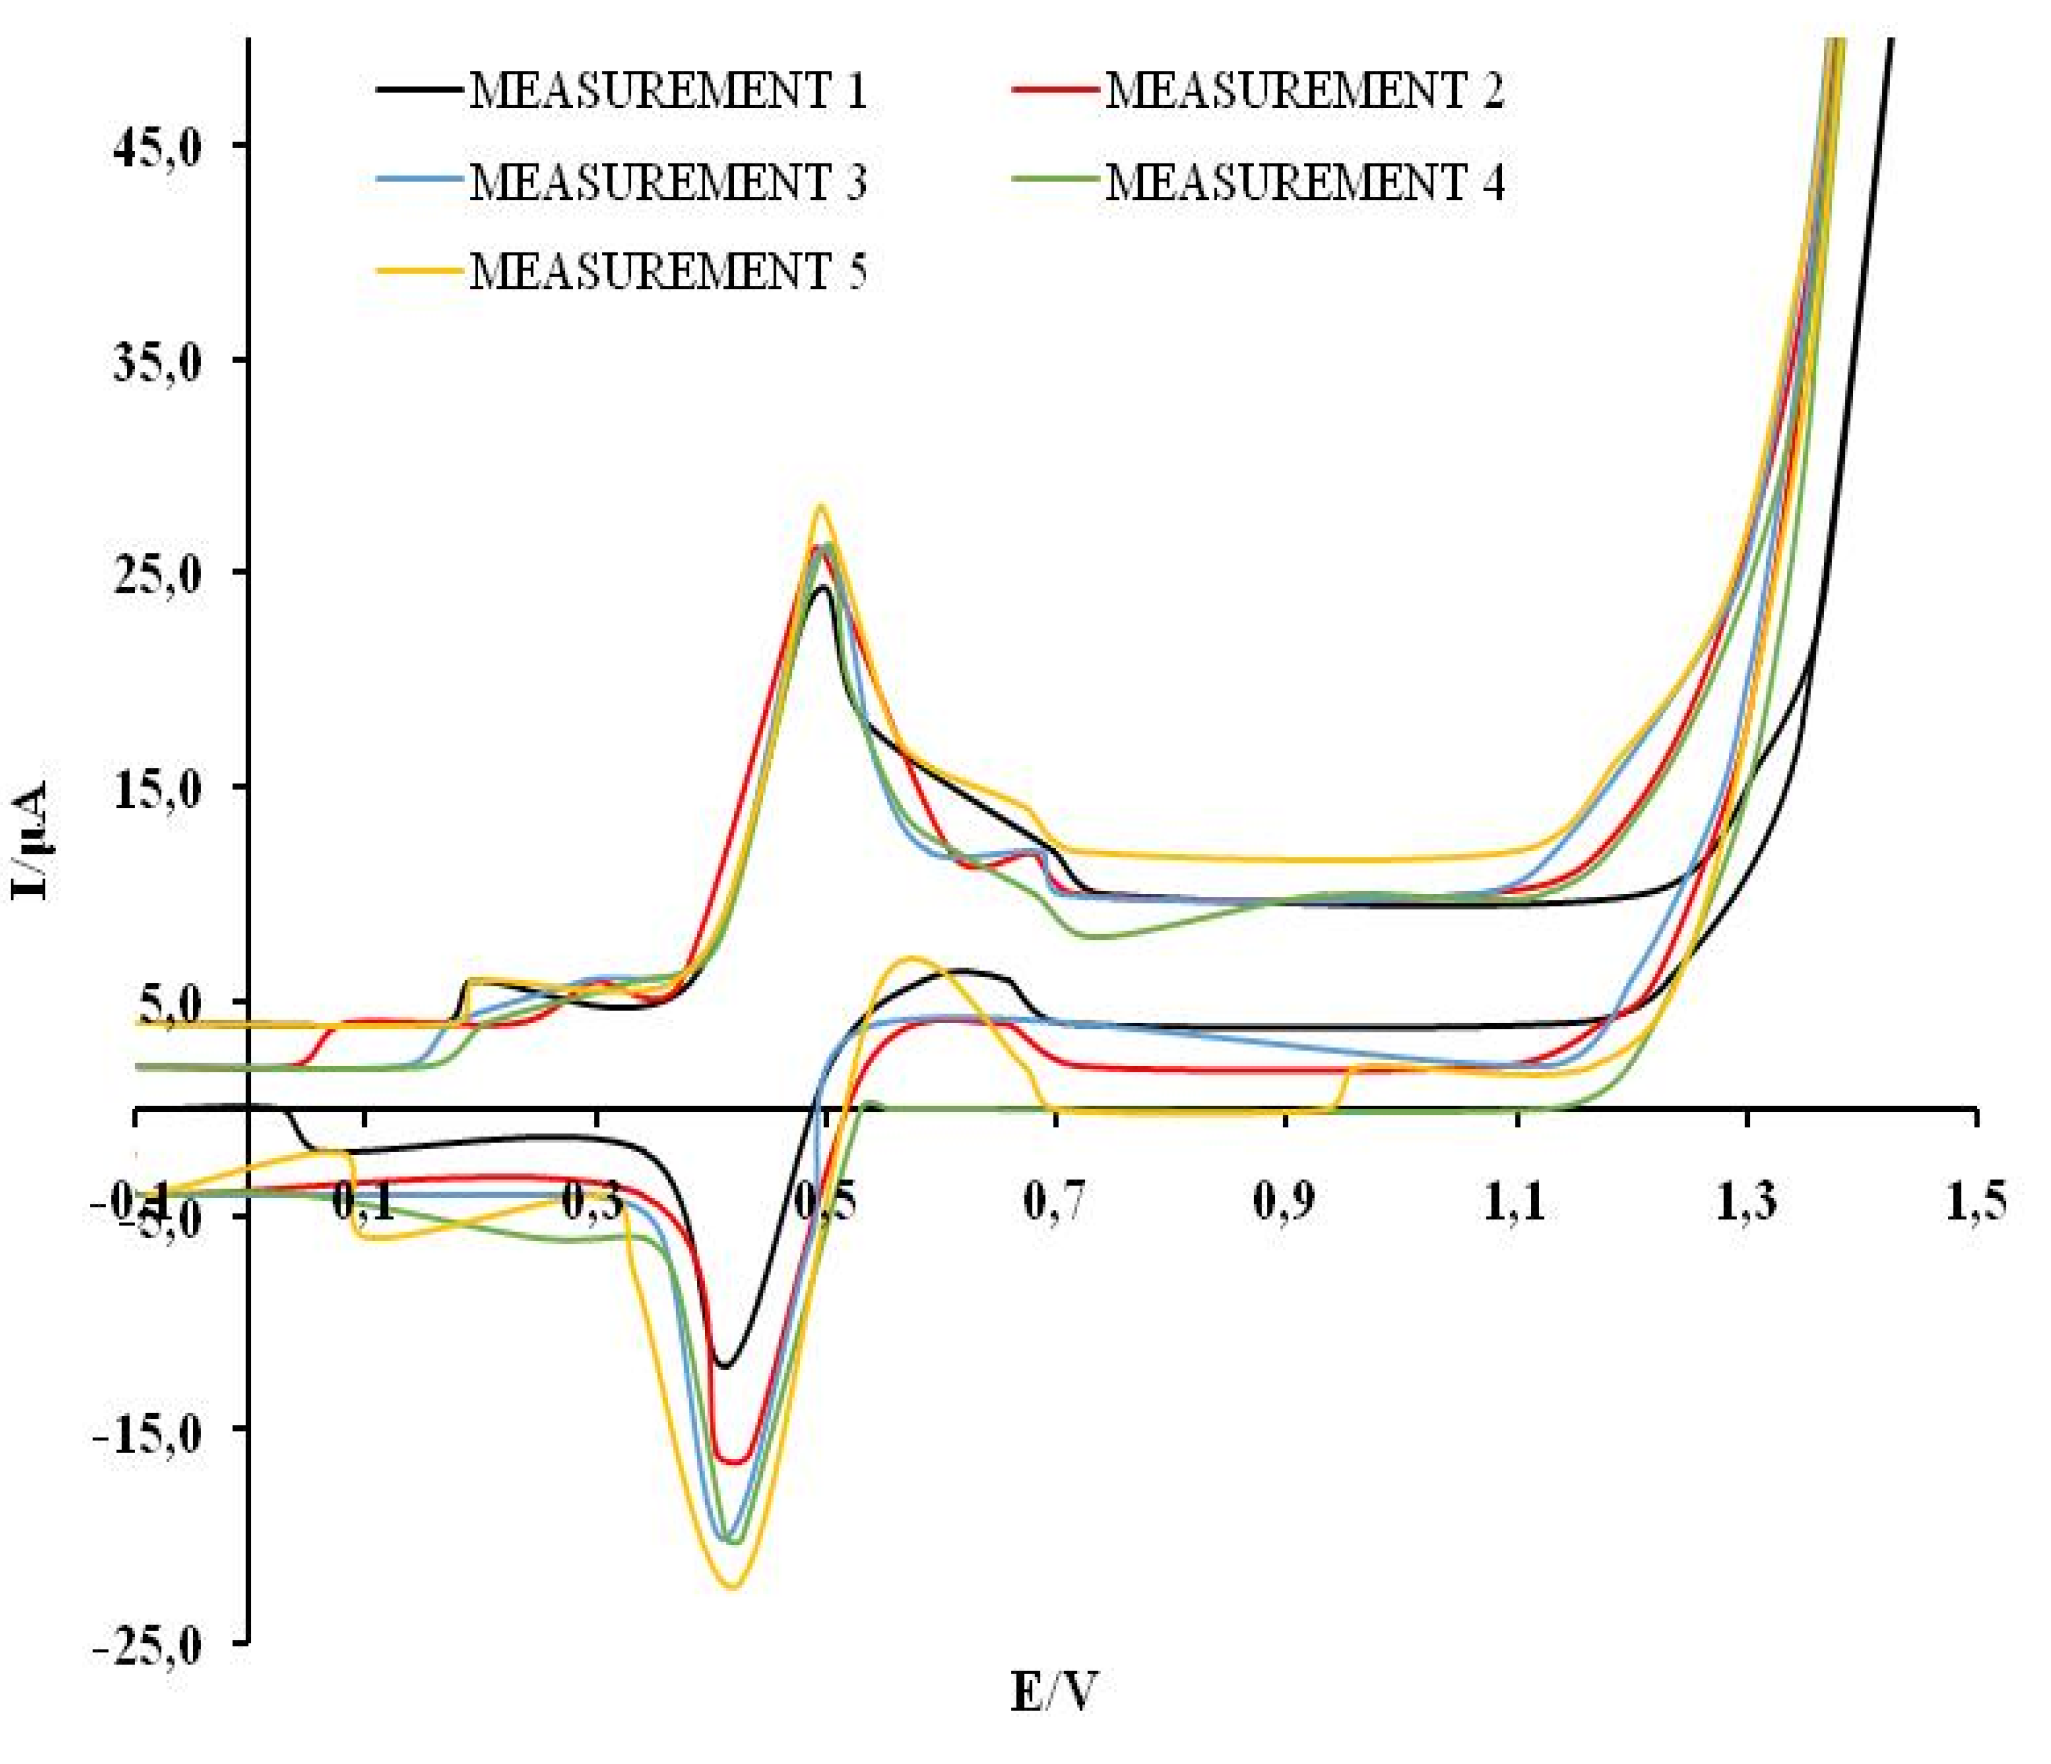
The reproducibility of the results was examined by recording five cyclic voltammograms of 0.3 mM solutions of GA, CA, CT, QV and RE in a model wine solution. The analysis was done on the basis of the value of the first anodic current peaks. The relative standard deviation (RSD) values are RSDGA= 13.1 %, RSDCA=5.44 %, RSDCT=1.41 %, RSDQV=11.78 %, RSDRE=5.73 %, which indicates the degree of reproducibility of measurements using MCPE/np TiO
2. The representative graph showing reproducibility measurement is shown for CA in
Figure 4.
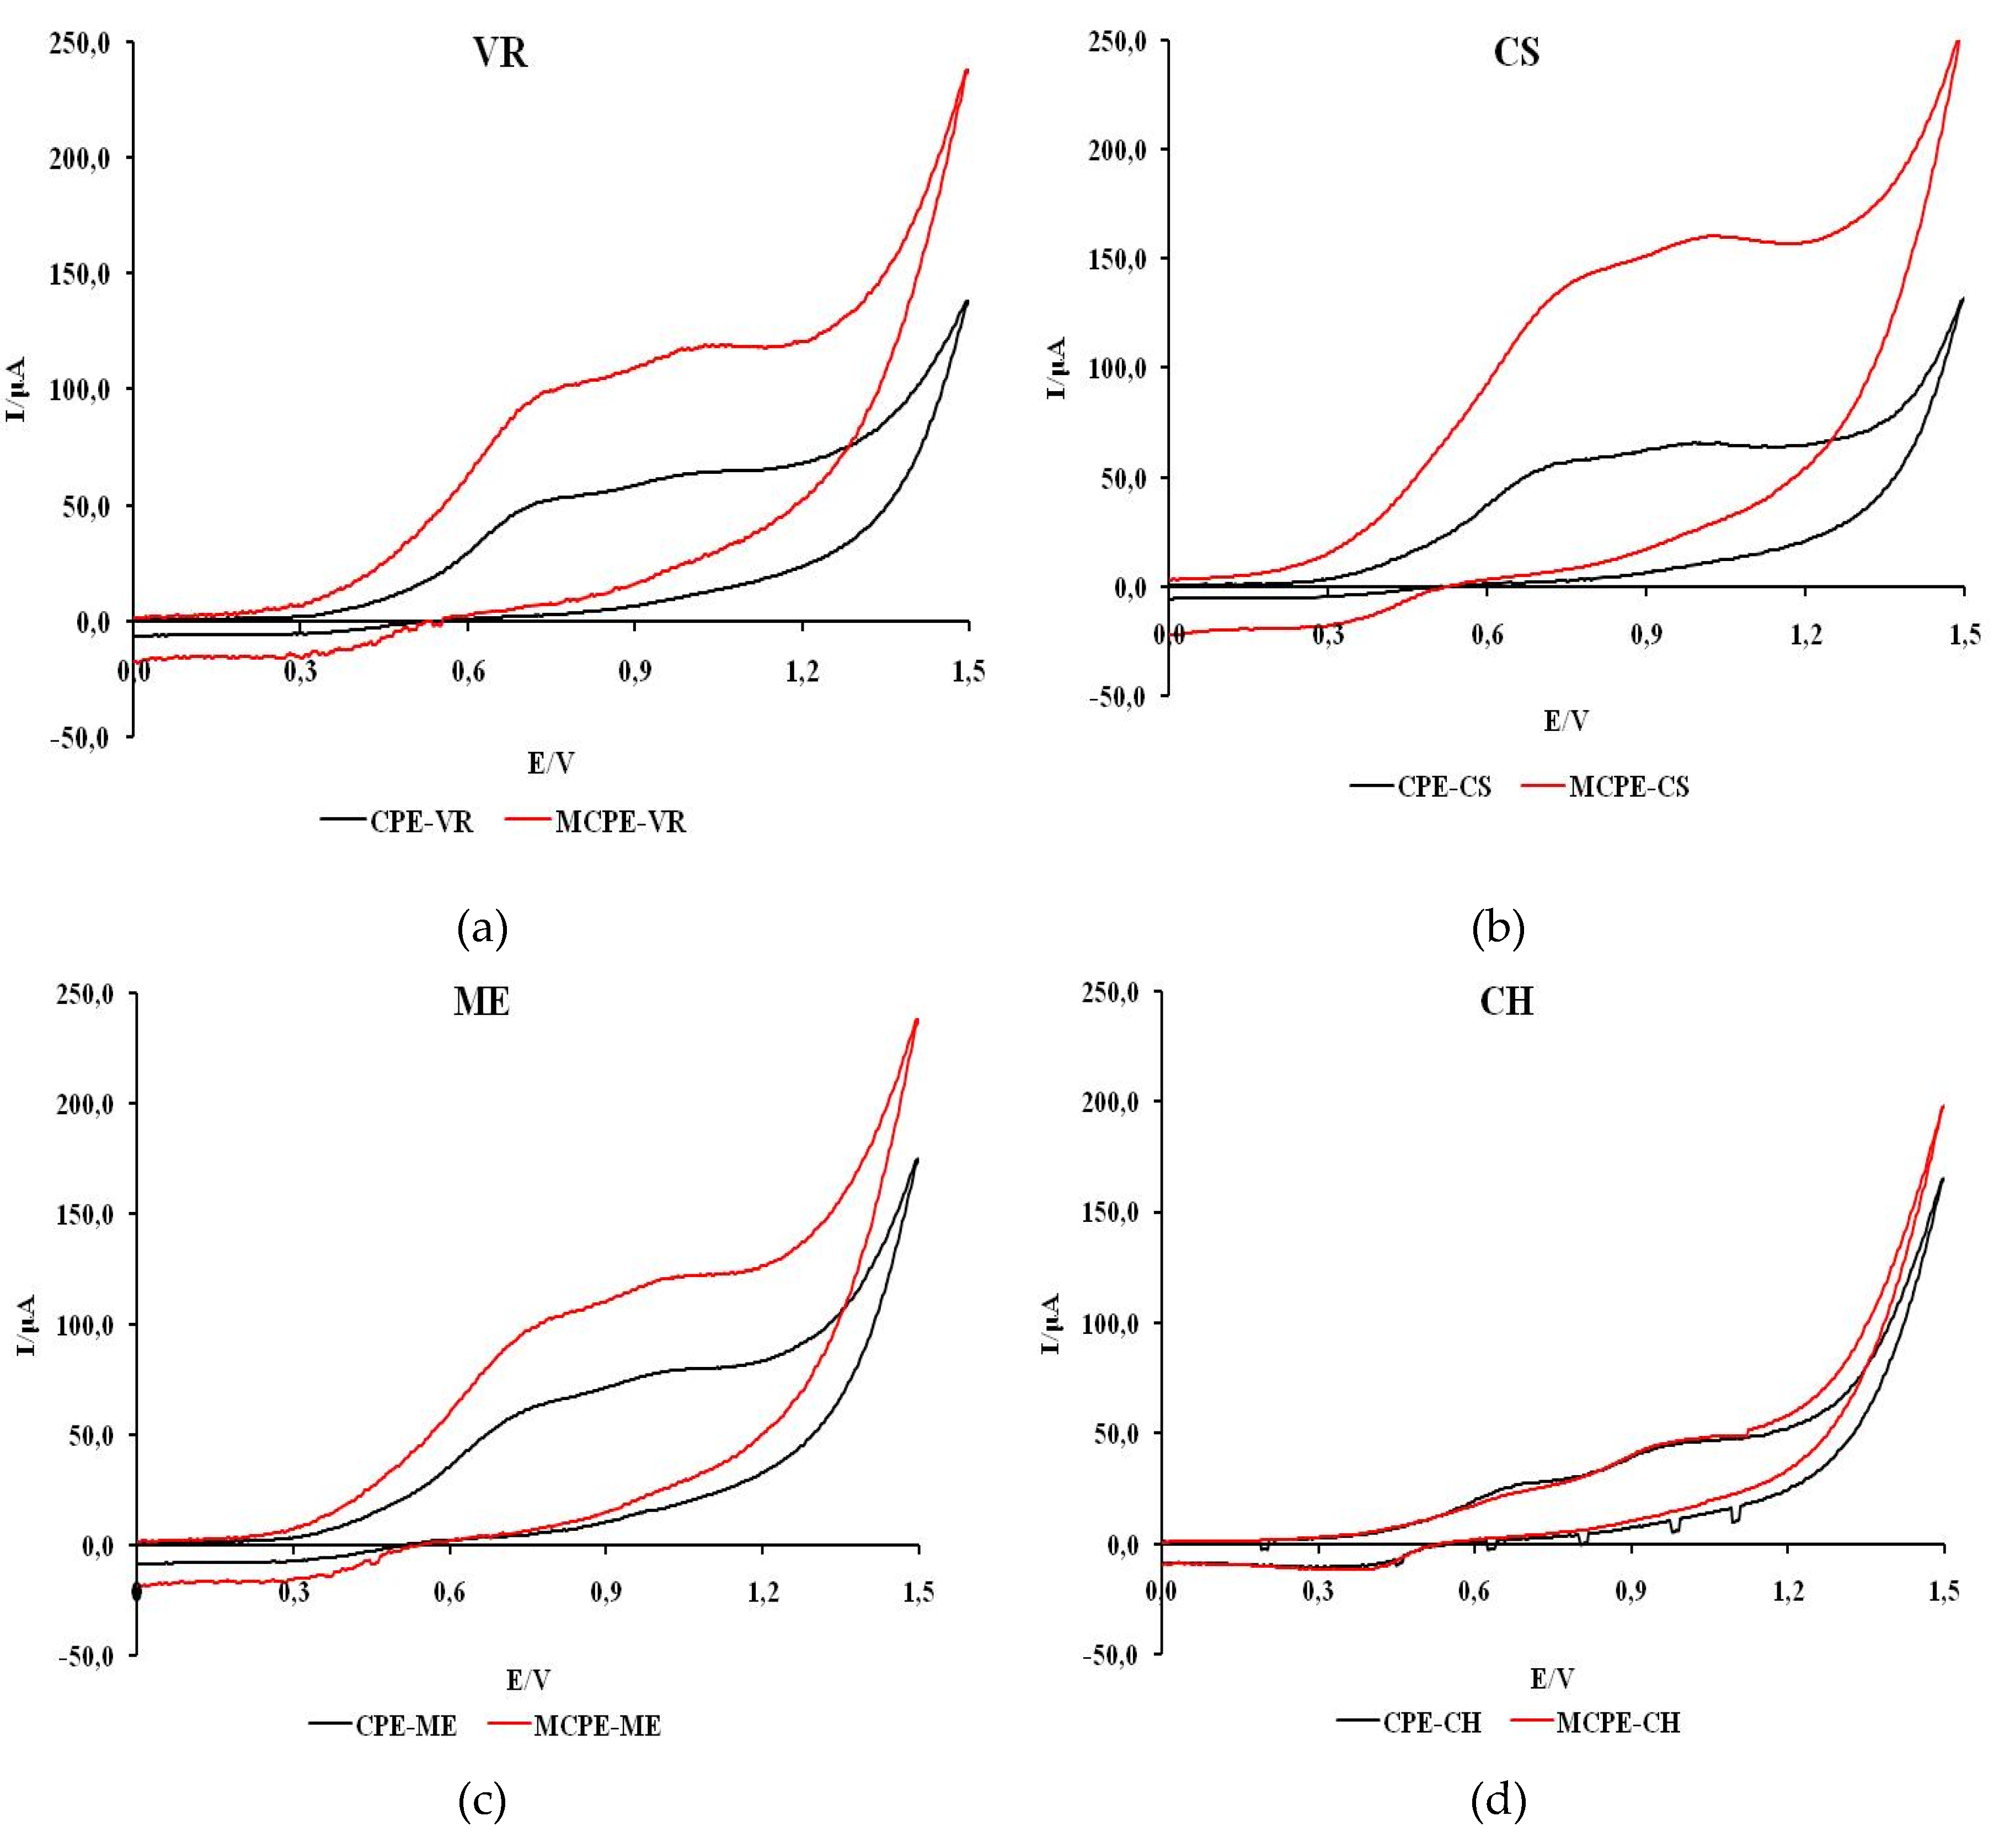
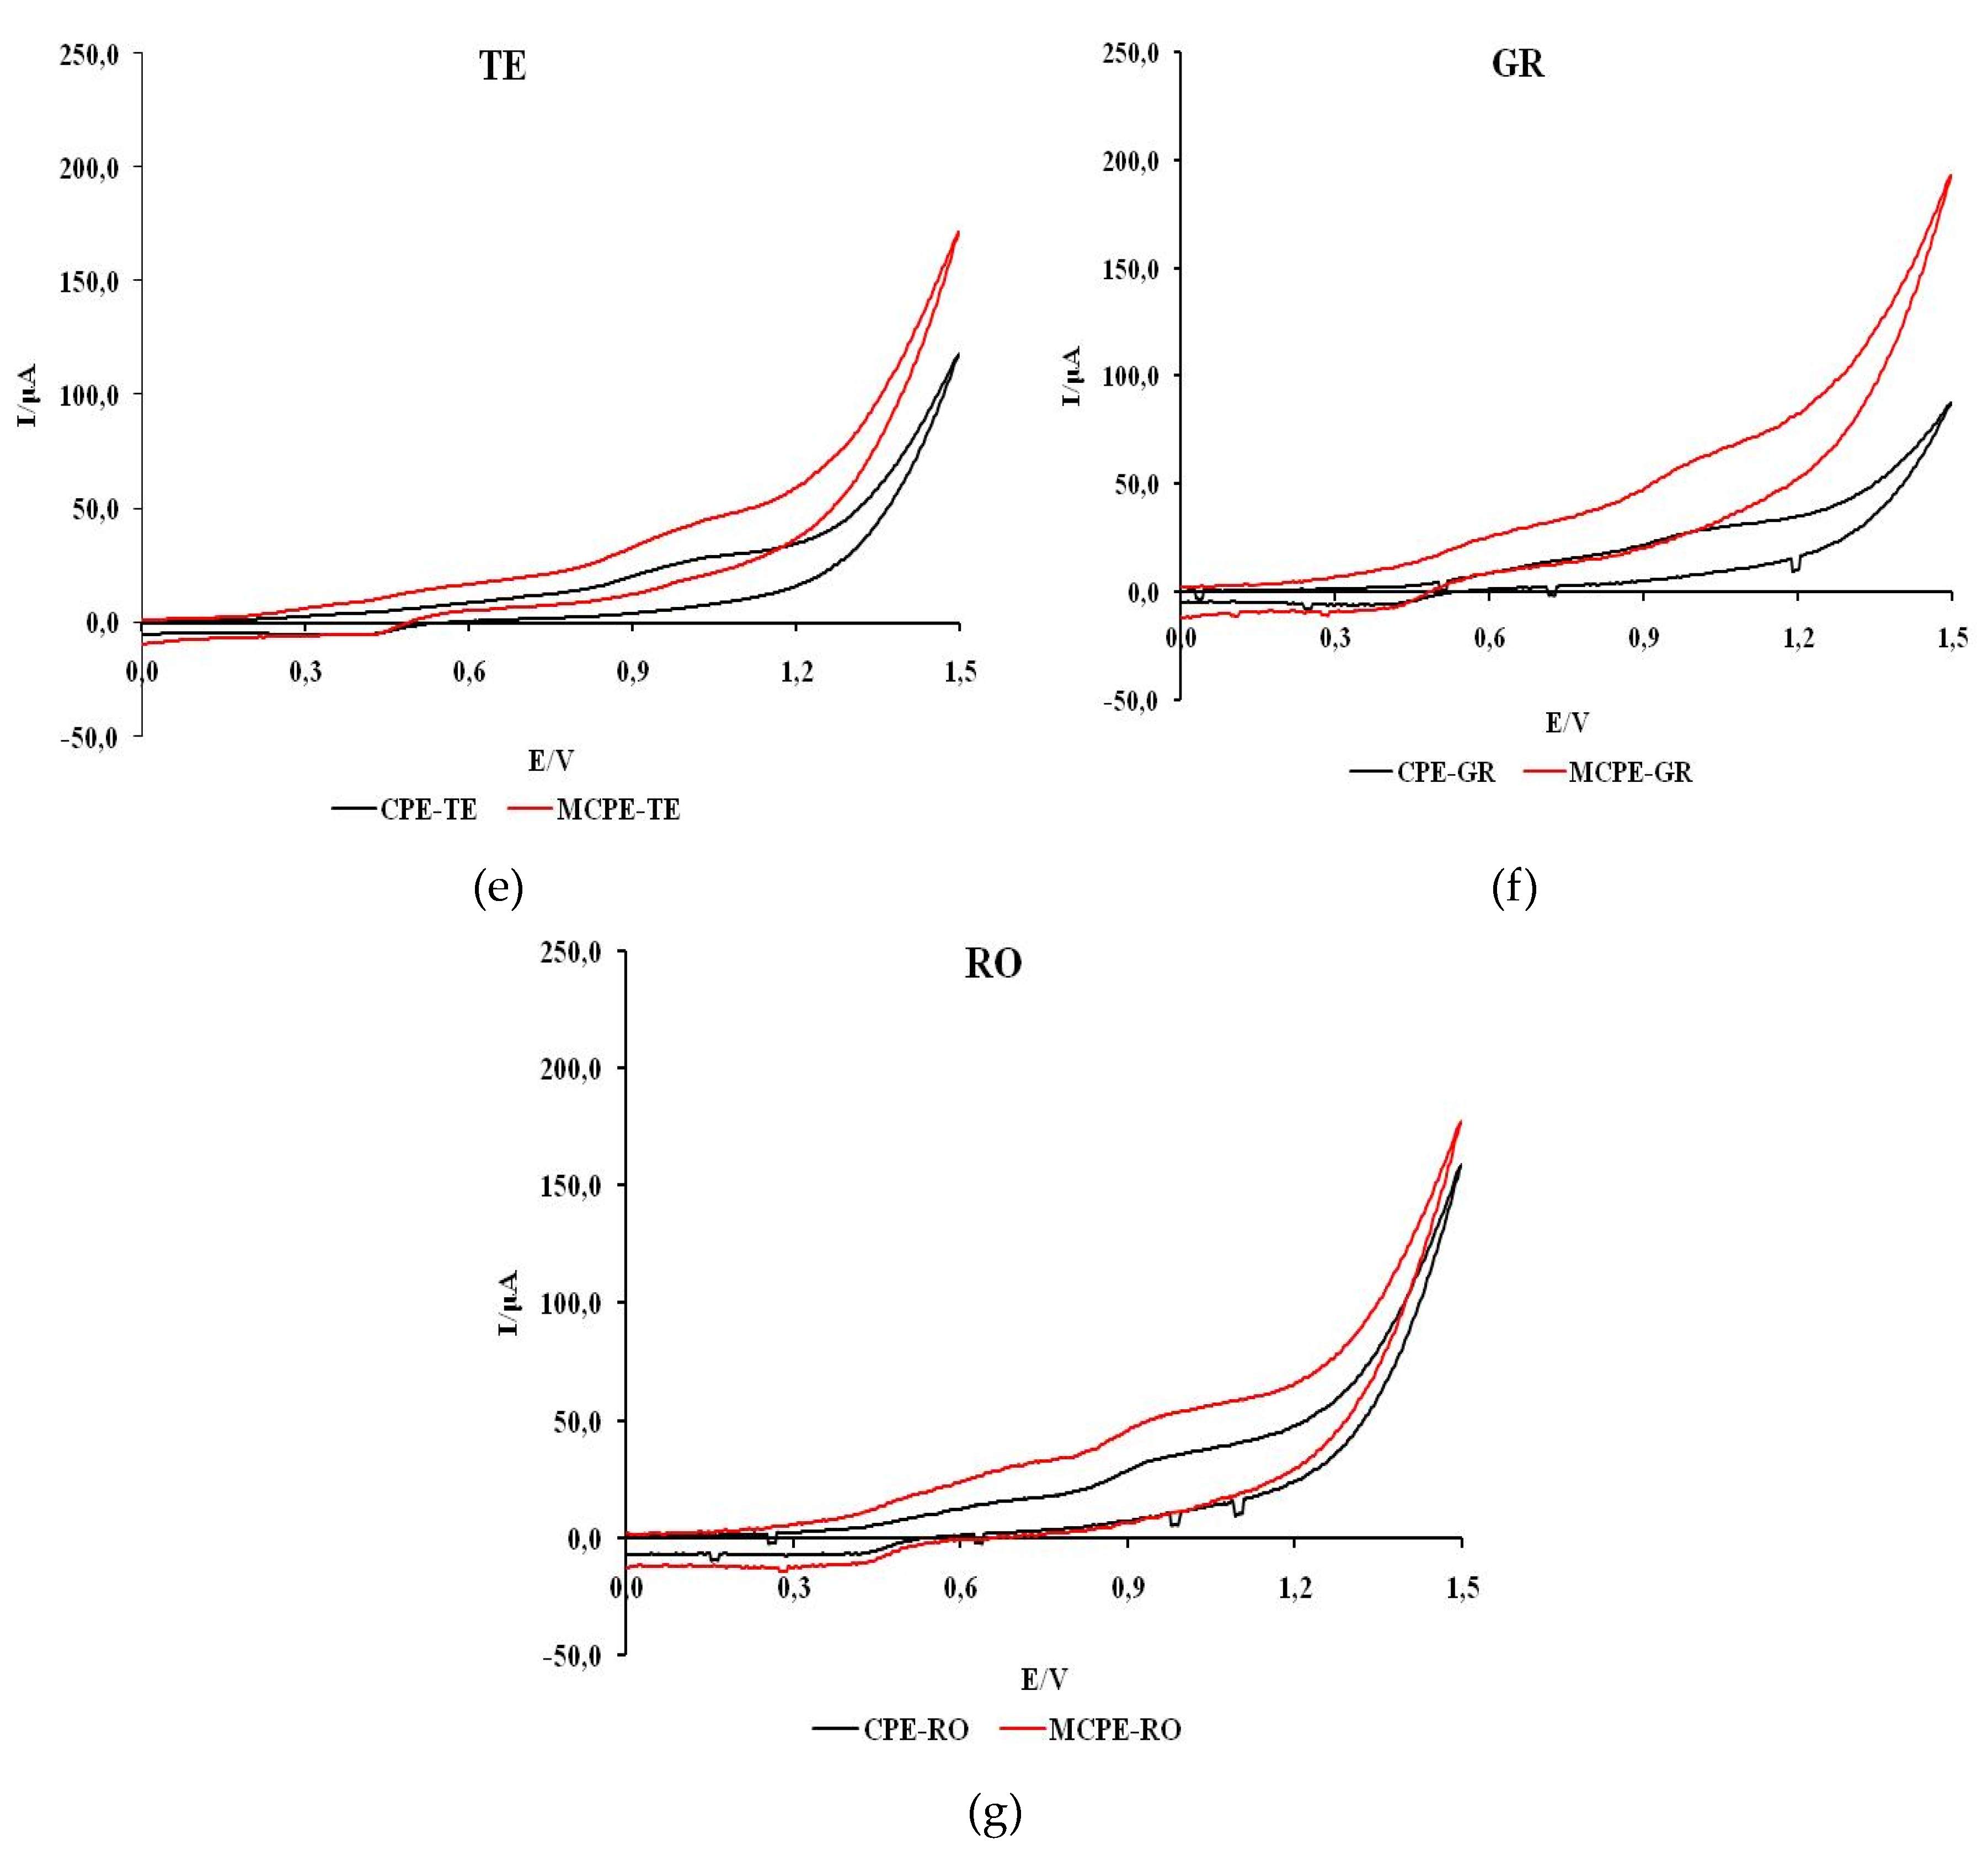
Figure 5 shows cyclic voltammograms recorded in natural wine samples with unmodified and modified carbon electrodes.
Estimated values of formal oxidation potential, the anodic peak potentials and current intensities calculated from the derivative function of the cyclic voltammograms obtained for wine samples on CPE and MCPE/np TiO
2 electrodes are shown in
Table 4.
The voltammograms of all wines except CH, which shows one peak, show two anodic current peaks. Also, a more intense current response with MCPE/npTiO2 compared to CPE was observed in all wines except CH. The shape of the voltammograms of all wine samples indicates that the process of oxidation of the tested samples is predominantly irreversible.
The values of the estimated formal oxidation potential of the first anodic wave for red and rosé wine samples (VR, ME, CS, RO) obtained with CPE are in the potential range of 0.56 to 0.63 V and on MCPE/np TiO2 in the potential range of 0.62 to 0.82 V. The potentials of the first anodic current peak are between 0.72 and 0.86 V and between 0.75 and 0.86 V when unmodified or modified electrodes are used.
For white wine samples (CH, TE, GR) on CPE, the formal oxidation potential of the first anodic wave is in the range of 0.62 to 0.63 V, while on MCPE/np TiO2 the formal oxidation potential is in the range of 0.40 to 0.51 V. The potentials of the first anodic current peak are between 0.69 and 1.01 V and 0.62 to 0.79 V when unmodified or modified electrodes are used.
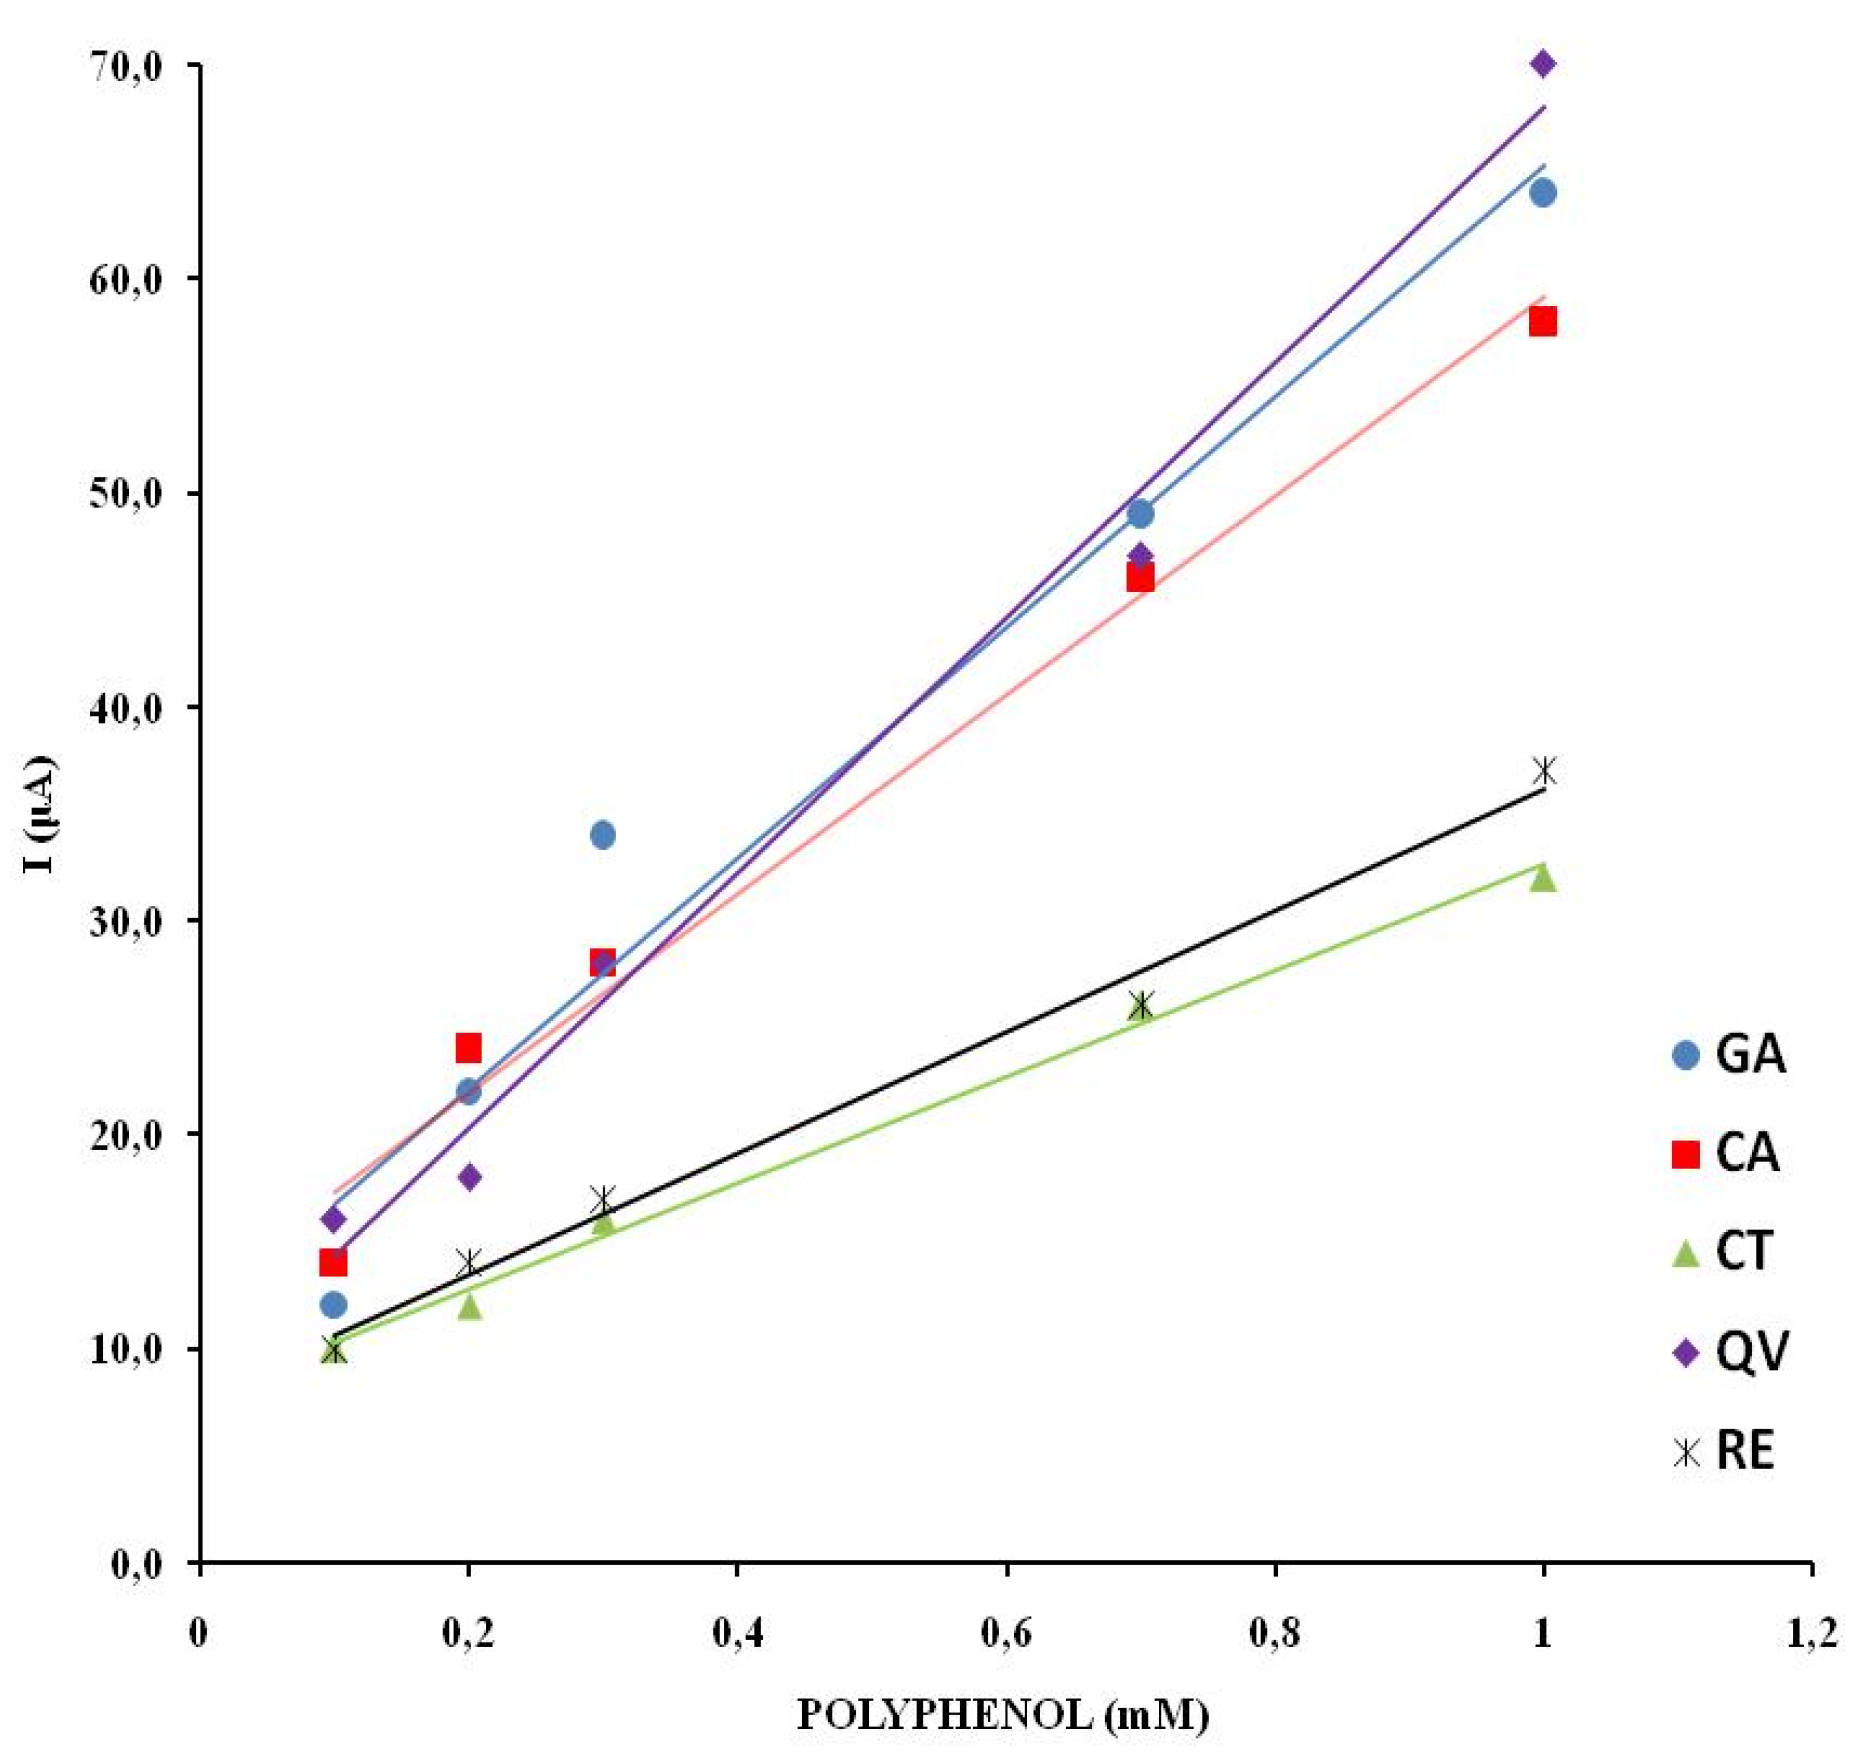
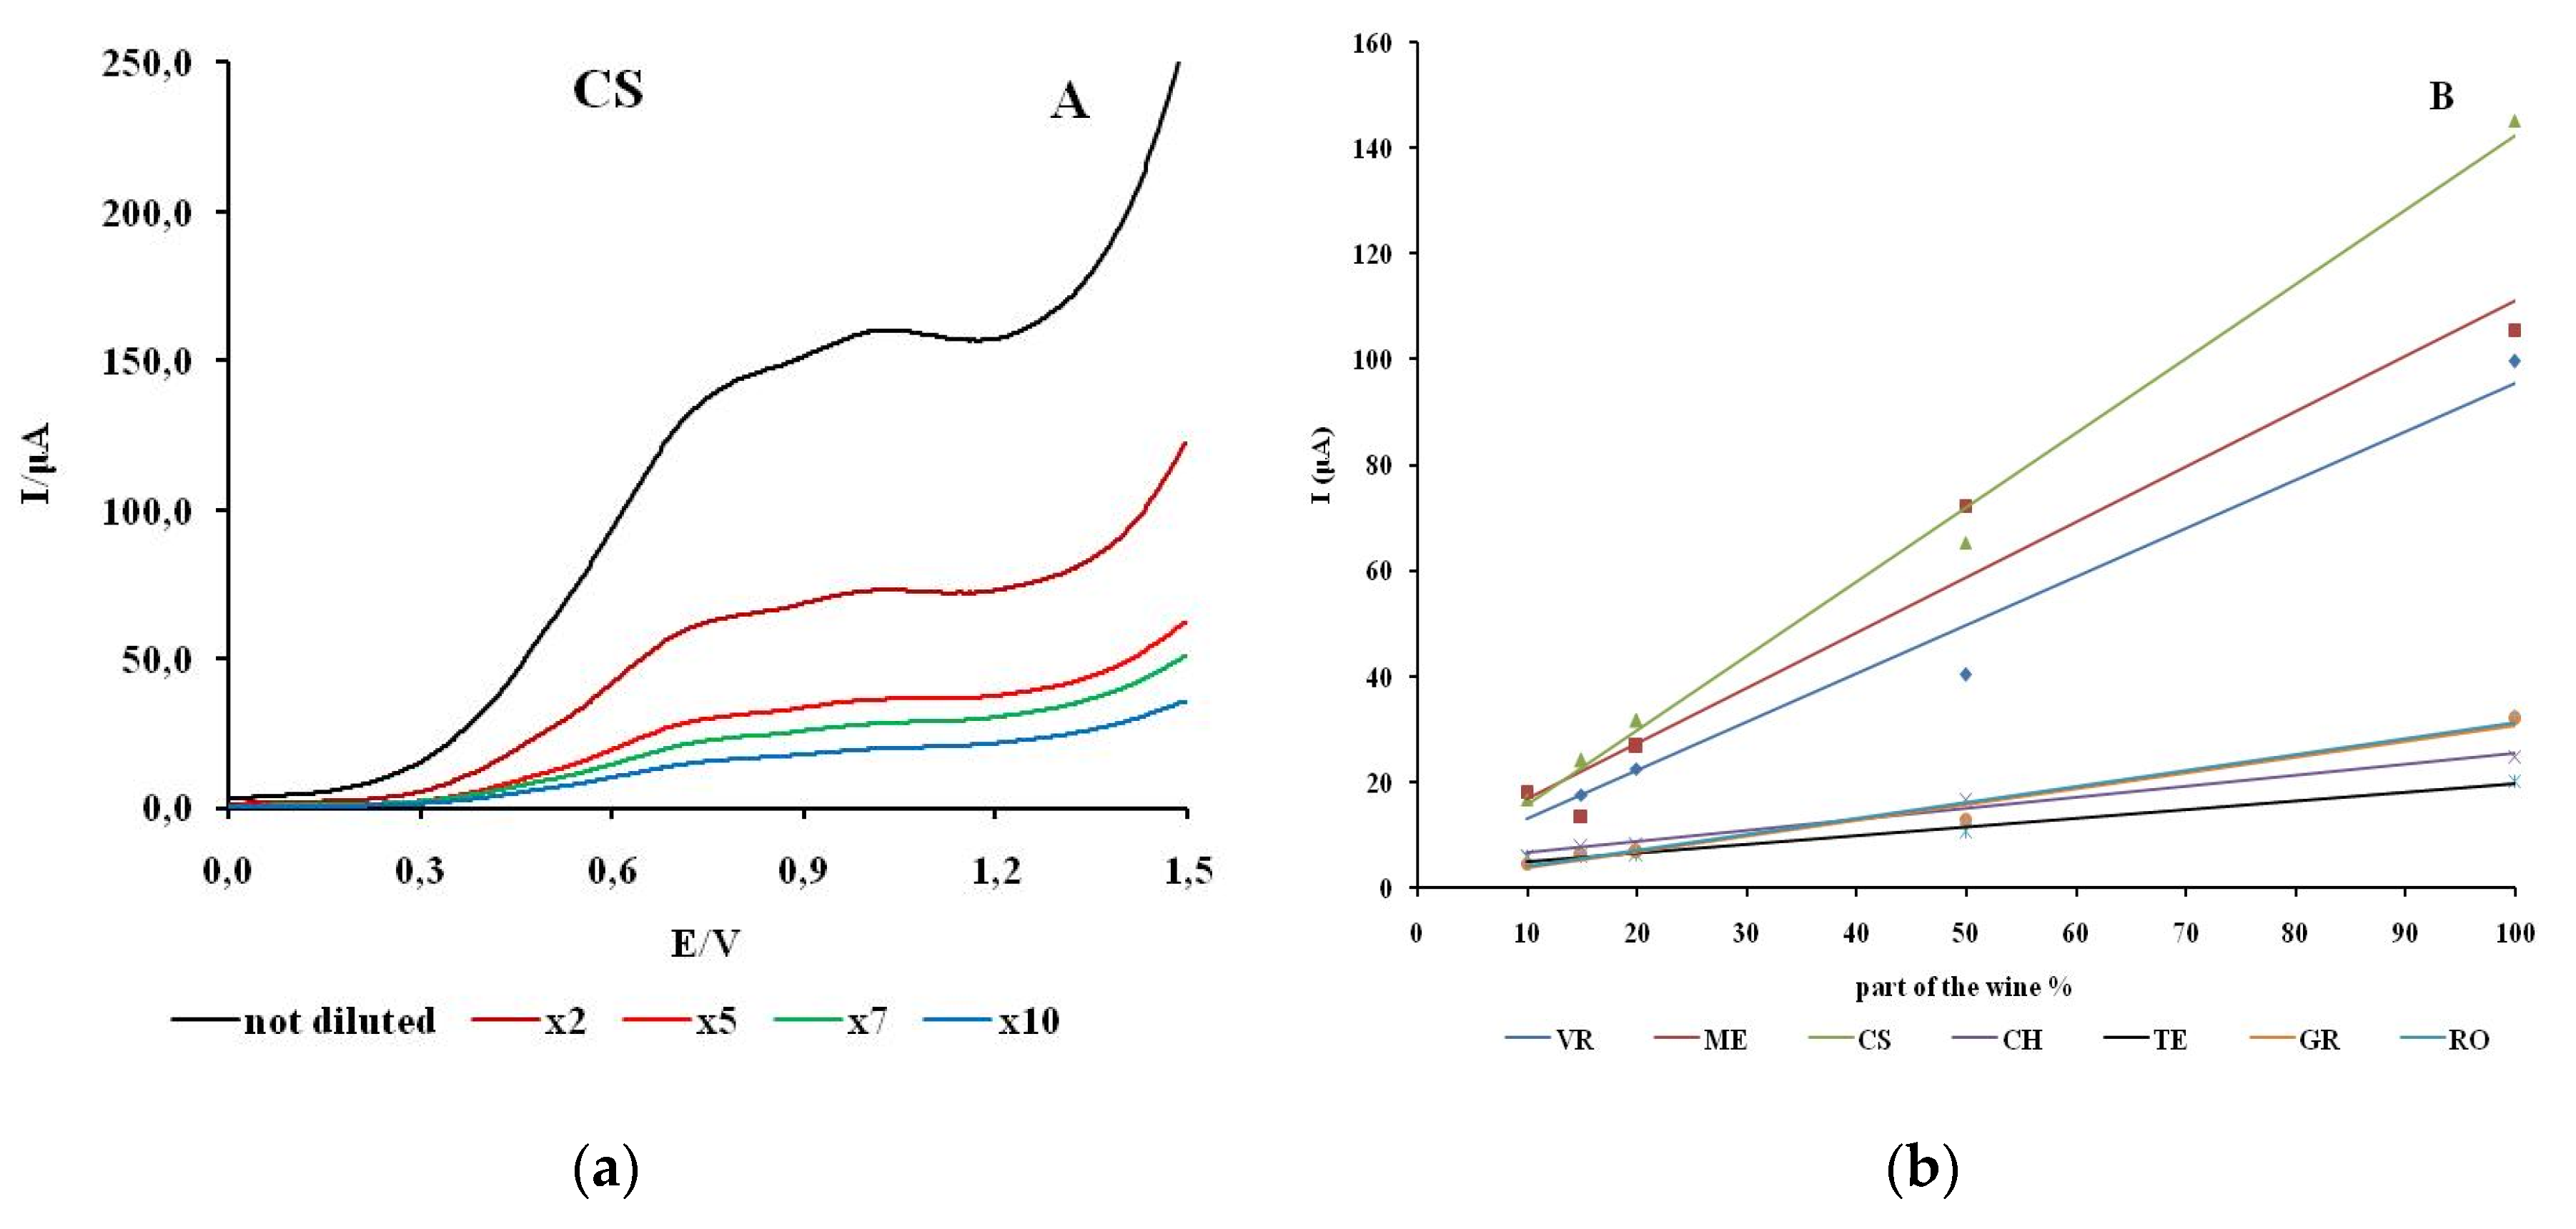
The linearity of response was investigated by recording cyclic voltammograms of wine samples with different concentrations of polyphenols. The concentration of the electroactive substances in the real wine samples is changed by adding an appropriate amount of model wine solution. The anodic branch of the cyclic voltammograms for different proportions of wine for CS is shown in
Figure 6. The CV of electrolytes with different proportions of wine for VR, ME, CH, GR, TE, RO are shown in the supplementary material (
Figure S1).
The first anodic current peak shows a linear dependence on the concentration of the electroactive species in all natural wine samples examined. The highest degree of linear dependence in the range of wine content from 10 to 100% was observed for CS (R2 = 0.9947). The samples TE and CH showed a similar degree of linear dependence (R2 =0.9885; R2 =0.9833). The values of the linear dependence of the wine samples ME, VR, GR and RO are in the range R2 =0.9500– 0.9734.
4. Discussion
The results show that the voltammetric reaction of anodic oxidation of GA (gallic acid) with MCPE/np TiO
2 exhibits much more pronounced current maxima than with the CPE. In addition, the voltammogram of the electrolytic oxidation of GA with MCPE/np TiO
2 shows a third anodic current peak, which is consistent with previous results. According to the studies of Chikere et al. the first anodic peak corresponds to the formation of the semiquinone radical, while the second current peak is caused by the oxidation of the third -OH-galloyl groups [
19]. Ziyatdinova et al. discovered that the observed third anodic peak is due to the dimerization of the semiquinone radical to ellagic acid [
20].
Regarding the effect of electrode modification on the anodic current, mixed effects on the formal oxidation potential and anodic peak potential are observed and lies in the range of just a few tens of mV. The shifts in potential, both negative and positive, are attributed to the catalytic and adsorptive effects of the modified electrodes. Carbon electrodes modified with nanoparticles have been shown to have increased Faraday current intensity and shifted the electrochemical reaction potential when compared to unmodified carbon electrodes [
21]. TiO
2 nanoparticles have been shown to cause a shift in the GA electrooxidation potential toward negative values, lowering the energy barrier during electron transfer [
22]. Similarly, by using a glassy carbon electrode modified with reduced graphene oxide, gallic acid is electrooxidized by adsorption. This modification has the potential to change to the anodic current peak to more positive values [
23].
Electrode modification had no effect on the electrooxidation of CA. The potential values of the anodic and cathodic current peaks during the electrooxidation of CA are consistent with previous studies by Manikandan et al. who showed that the anodic current peak represents the orthoquinone formation reaction that accompanies the electrooxidation of CA. They also showed that the oxidation reaction of CA occurs through the transfer of two electrons [
24].
The cyclic voltammogram of CT electrooxidation with MCPE/np TiO
2 shows a slightly more intense anodic current peak compared to the anodic current peak obtained with CPE. Two anodic and one cathodic current maxima are observed. The mechanism of electrochemical oxidation of CT proposed by Janeiro et al. is via a two-step one-electron oxidation of ortho-phenolic groups bound to the B-ring in the structure of CT, where the reaction mechanism is significantly affected by the concentration of CT and the pH of the electrolyte. It was shown that the first anodic peak corresponds to the first stage of the oxidation of the 3,4-dihydroxyl groups of catechol and is fully reversible, which explains the cathodic current peak. The second anodic peak is related to the second oxidation step, the oxidation of the hydroxyl groups on the resorcinol unit of the CT structure and is completely irreversible, with CT being strongly adsorbed on the electrode surface [
25]. The linear dependence of the anodic current peak on the rate of potential change suggests that the CT electrooxidation process at the modifying electrode is controlled by adsorption. Similar results were presented in the study by Senocak et al. It was shown that the anodic oxidation of catechins at a glassy carbon electrode modified with single-walled carbon nanotubes functionalized with subphthalocyanine takes place under the influence of adsorption [
26].
In the voltammogram of the anodic oxidation of QV with MCPE/np TiO
2, a slightly higher first current peak and the occurrence of the second and third anodic current peaks allow the conclusion that the modified electrode has a higher sensitivity compared to the unmodified electrode. According to studies by Sokolová et al., the first oxidation peak corresponds to the two-electron oxidation of the 3´,4´-dihydroxybenzo group, which is quasi-reversible. The second anodic wave corresponds to the oxidation of the formed product at the potential of the first anodic wave. The third anodic peak corresponds to the oxidation of the hydroxyl groups at positions C5 and C7 of the benzo ring. The process of electrooxidation of the product formed at the potential of the first anodic wave and of the hydroxyl groups at positions C5 and C7 of the benzene ring is characterized by irreversibility [
27]. The dependence of the anodic current peak on the rate of potential change shows a linear dependence, indicating the adsorption control of the QV oxidation process. In the study by Saritha et al. the adsorption control of the QV electrooxidation process was observed on the surface of a carbon electrode modified with ZnO nanoparticles and carbon nanosheets [
28].
The observed anodic current peaks in the cyclic voltammogram of RE electrooxidation are in agreement with the results of Corduneanu et al. who showed that the first anodic current peak corresponds to the oxidation of the phenolic part, while the second anodic current peak corresponds to the oxidation of the resorcinol part of the RE structure [
29]. The dependence of the intensity of the anodic current peak on the rate of potential change showed a linear dependence, indicating that the RE electrooxidation process is controlled by adsorption. Similar results were shown in a study by Liu et al. using a graphene-modified glassy carbon electrode [
30].
Cyclic voltammograms of natural wine samples recorded with a modified electrode are characterized by an increasingly more pronounced current wave compared to voltammograms recorded with an unmodified electrode, starting from CH that has shown no improvement to CS that has shown most improvement. Improved characteristics of the TiO
2 nanoparticle-modified electrode material were also observed in the study by Manunjath et al. The modified electrode showed better redox kinetics in the electrooxidation of paracetamol, which is a substituted monophenol, which manifested itself in a more pronounced anodic current wave and potential shift [
31].
Furthermore, the observed linear relationship between peak current of the examined wine polyphenols and scan rate suggests that the rate of adsorption and desorption at the electrode is directly proportional to scan rate. This behavior results from the interaction of the electrochemical reaction's kinetics and the adsorption process. The slopes from
Table 2 that describe the linear relationship of the first anodic current peak of polyphenolic compounds on the scan rate on the MCPE/np TiO
2 electrode are GA, QV:CA:CT, and RE, respectively, and are approximately 3:2:1. This suggests that GA and QV adsorb with similar kinetics, while other polyphenols adsorb more slowly. However, GA has the highest current.
The significant increase in the GA voltammetric signal on the MCPE/np TiO
2 electrode compared to other studied polyphenols can be explained by the higher affinity for adsorption on TiO
2 nanoparticles. Titanium dioxide particles in aqueous solutions are known to interact with dihydroxyaromatic compounds, resulting in well-defined surface complexes. Arajuo et al. reported that catechol and GA bind to TiO
2 via two adjacent -OH groups, and that the -COOH moiety of GA plays no role in Ti atom complexation [
32]. Adsorption across neighboring -OH groups can be represented schematically using the following equations (1) and (2):
whereby the equilibrium is described by the Langmuir-type stability constants. For GA and catechol, deprotonated species showed much higher stability constants of 27.1 and 24.70 than protonated species, which had stability constants of 4.90 and 4.70. This illustrates that the polyphenol's ability to deprotonate at the pH of the testing solution, which in this case is 3.6 for the model wine solution, has a significant influence on its adsorption affinity.
Deprotonation is indicated by the pK
a values of the -OH groups. GA has the lowest pK
a1 constants (
Table S1) and the highest degree of deprotonation at a model wine solution pH of 3.6, which, combined with the dependence of the stability constant on pH, explains its higher adsorption affinity compared to other compounds. Arajuo et al. found that deprotonating the carboxyl group increases affinity in the pH range of 3.2 to 5.2, owing to increased Lewis basicity of the anion. Indeed, the isotherms of gallic acid overlap at pH 3.75 and 6.15, indicating that GA adsorption is facilitated near the model wine's pH of 3.6. Further, they have also demonstrated that the maximum surface coverage by the adsorbed compound varies as a result of different adsorption affinities, and it is reasonable to assume that compounds with higher adsorption affinity produce a stronger voltammetric signal [
32].
The shape of the voltammogram recorded in natural wine samples indicates the irreversible character of the oxidation process of electroactive polyphenols, which can be attributed to the pronounced tendency of polyphenolic compounds and their electrooxidation products to adsorb on the electrode surface of MCPE/np TiO
2 and CPE [
25,
27].
Cyclic voltammograms recorded in wine samples with a modified electrode exhibit an increasingly noticeable current wave compared to voltammograms recorded with an unmodified electrode, progressing from CH, which showed no improvement over CPE, to CS, which showed the most improvement. Manunjath et al. found improved properties in the TiO
2 nanoparticle-modified electrode material. The modified electrode demonstrated better redox kinetics in the electrooxidation of paracetamol, which is a substituted monophenol, which manifested itself in a more pronounced anodic current wave [
31].
The anodic current peaks in the voltammograms of white wines are significantly less amplified by the electrode modification than the current peaks in the voltammograms of red and rose wines, which is consistent with the higher gallic acid concentrations in red wines compared to white wines. These results are consistent with the study by Gutiérrez-Escobar et al. in which significantly lower concentrations of polyphenolic compounds, including GA, were found in natural samples of white wines compared to red wines [6, 7].
For all wine samples, the average estimated formal oxidation potential of the first current wave is 0.60 ± 0.03 V on CPE and 0.56 ± 0.09 V on MCPE/np TiO
2. For both the modified and unmodified electrodes, the average estimated formal oxidation potential of the second current wave was 0.91 ± 0.03 V and 0.89 ± 0.03 V, respectively. For the CPE electrode, the average estimated potential of the first current peak is 0.84 ± 0.10 V, and for the MCPE/np TiO
2 electrode, it is 0.77 ± 0.09 mV. For both the modified and unmodified electrodes, the average second anodic peak potential is 1.07 ± 0.02 V and 1.07 ± 0.04 V, respectively. The positive and negative shifts occur within a few tens of millivolts, and they may be the result of a combination of adsorption and electrocatalytic processes on TiO
2. It can be assumed that several polyphenolic compounds, in addition to those tested separately in this work, are co-adsorbed on the surface of the working electrode. As demonstrated by Mahotkina and Kilmartin, the presence of substances used in the production process, whose function is to inhibit the oxidation process of the polyphenolic compounds present in the wine, has a significant impact on the potential value and intensity of the peak of the anodic current wave of wine samples [
33]. Cyclic voltammograms of solutions of individual polyphenols (CA, CT, QV) in a model solution and cyclic voltammograms of natural red and white wine samples recorded with a glassy carbon electrode are shown along with the effects of glutathione, ascorbic acid, and sodium metabisulfite (which dissociates into SO
2 in solution). Sulfur dioxide increases anodic current while decreasing cathodic current due to its interaction with quinones generated during polyphenol oxidation. A similar effect has been found with glutathione [
33].
Based on the results presented in this study, it can be assumed that the enhancement of gallic acid oxidation occurs selectively on TiO
2 nanoparticles when they are introduced into the carbon paste. We hypothesize that the selective signal enhancement is proportional to the GA concentration in the solution, allowing a measurement in an undiluted sample that shows a linear decrease of the anodic current signal with dilution. A similar effect was observed on cobalt oxide nanoparticles by Chikere et al. [
34]. This hypothesis would need to be confirmed by independent gallic acid measurements in wine samples, which is beyond the scope of this study. However, the foundation for the operating principle of a wine sensor that selectively amplifies the response of the mixture component based on adsorption affinity has been established.
The use of a sensor that selectively enhances the reaction of GA could be very interesting for wine production. A recent study investigated how gallic acid imparts an astringent taste to white and red wine and influences gastric acid secretion by activating the bitter taste receptor [
35]. Xin-Ke Zhang et al. investigated how the addition of gallic acid and ellagic acid before fermentation affects wine quality and composition during the aging process. They found that the addition of gallic acid improved the extraction of total anthocyanins and the copigmentation effect, resulting in wines with greater blackness, redness, yellowness and saturation [
36].
