1. Introduction
During last decades a changes in mean and heavy precipitation in Europe have been documented [
1,
2,
3], as well as in particular regions in Europe [
4,
5,
6,
7,
8]. Obviously, the effect of heavy rainfall depends not only of its intensity, but also on whether the days with rainfall are evenly distributed over time or whether they occur as consequtive days with rain, so called wet spells [
9,
10]. Furthermore, the wet spells and their opposite, dry spells together determine the European hydroclimate. Prolonged dry weather has negative implications for society: including water security, wildfire risk, agriculture and energy production. Extreme dry spells contribute to meteorological, agriculture and hydrological droughts. Dry spells negatively affect water quality, and in combination with high temperatures, they can cause toxic algal blooms, which additionally result in the oxygen content decrease in the water [
11,
12,
13], threatening the live of fishes and other aquatic organisms. Prolonged wet weather, on the other hand, may favor flooding.
Wet and dry spell analysis usually covers their duration and frequency of occurrence [
10,
14,
15]. However, the time of their appearance during a year is equally important. Changes in the timing of dry and wet spells were rarely analysed, their occurrence in vegetation period is much more dangerous than in the rest of the year.
Contemporary warming significantly affects precipitation, not so much of its totals, but to a much greater extent to its distribution [
16]. There is a lot of signs that precipitation events became less frequent [
17], more intense [
18] and with higher extremes [
19,
20]. Studies that examine trends in dry and wet spell duration show that trends are different at different locations. Groisman and Knight [
21] have shown that the average duration of dry episodes in warm season in central United States has significantly increased. Similar results were found in the southwestern United States by Mc Cabe et al. [
22] and in Argentina by Llano and Penalba [
23]. In Europe, Schmidli and Frei [
7] have shown increase in dry spell duration in southern part of Switzerland, but only in spring. Zolina et al. [
10] have found that the duration of dry spells decreases over Scandinavia and in southern Europe in both winter and summer, but over the Netherlands dry periods are longer also during both warm and cold seasons. Breinl et al. [
11] analysed the longest dry spells in western, southern and northern Europe. They have shown that in northern Europe decreasing trends dominate, in southern Europe on Peninsula increasing trends dominate and in central Europe the picture is very diverse.
According to wet spells, Zolina et al. [
10] have shown the growth of their duration in northern Europe and central European Russia in winter and over the Netherlands during both winter and summer. In summer well spell became shorter over northern Russia and Scandinavia, The increase in wet spell duration in the second half of twentieth century over Swiss Alps was shown by Schmidli and Frei [
7] and in Poland by Wibig [
14].
Paton [
24] have shown that the choice of the spell definition has a very significant impact on the result. She suggested using precise definitions and being very carefull when comparing results in case of different results.
In Poland dry and wet spells based on consecutive days with precipitation ≤ 0 mm or > 0 mm were used [
17] or the Standardized Precipitation Index (SPI) [
25,
26], but there is lack of papers on the spatial and temporal variability of the frequency of dry and wet days and dry and wet spells. The aim of this study is to fill this gap and present the spatial and temporal variability of the frequency of dry and wet days and dry and wet spells against the background of changes in precipitation and atmospheric circulation. Data and methods used in this study are described in chapter 2. The chapter 3 presents the following: spatial distribution and trends of precipitation (3.1), dry day frequencies and their changes (3.2), dry spell frequency changes (3.3), wet day frequencies and their changes (3.4), wet spell frequency changes (3.5) and relations of dry and wet day frequencies with selected atmospheric circulation indices (3.6). Discussion and summary are provided in chapter 4.
2. Data and Methods
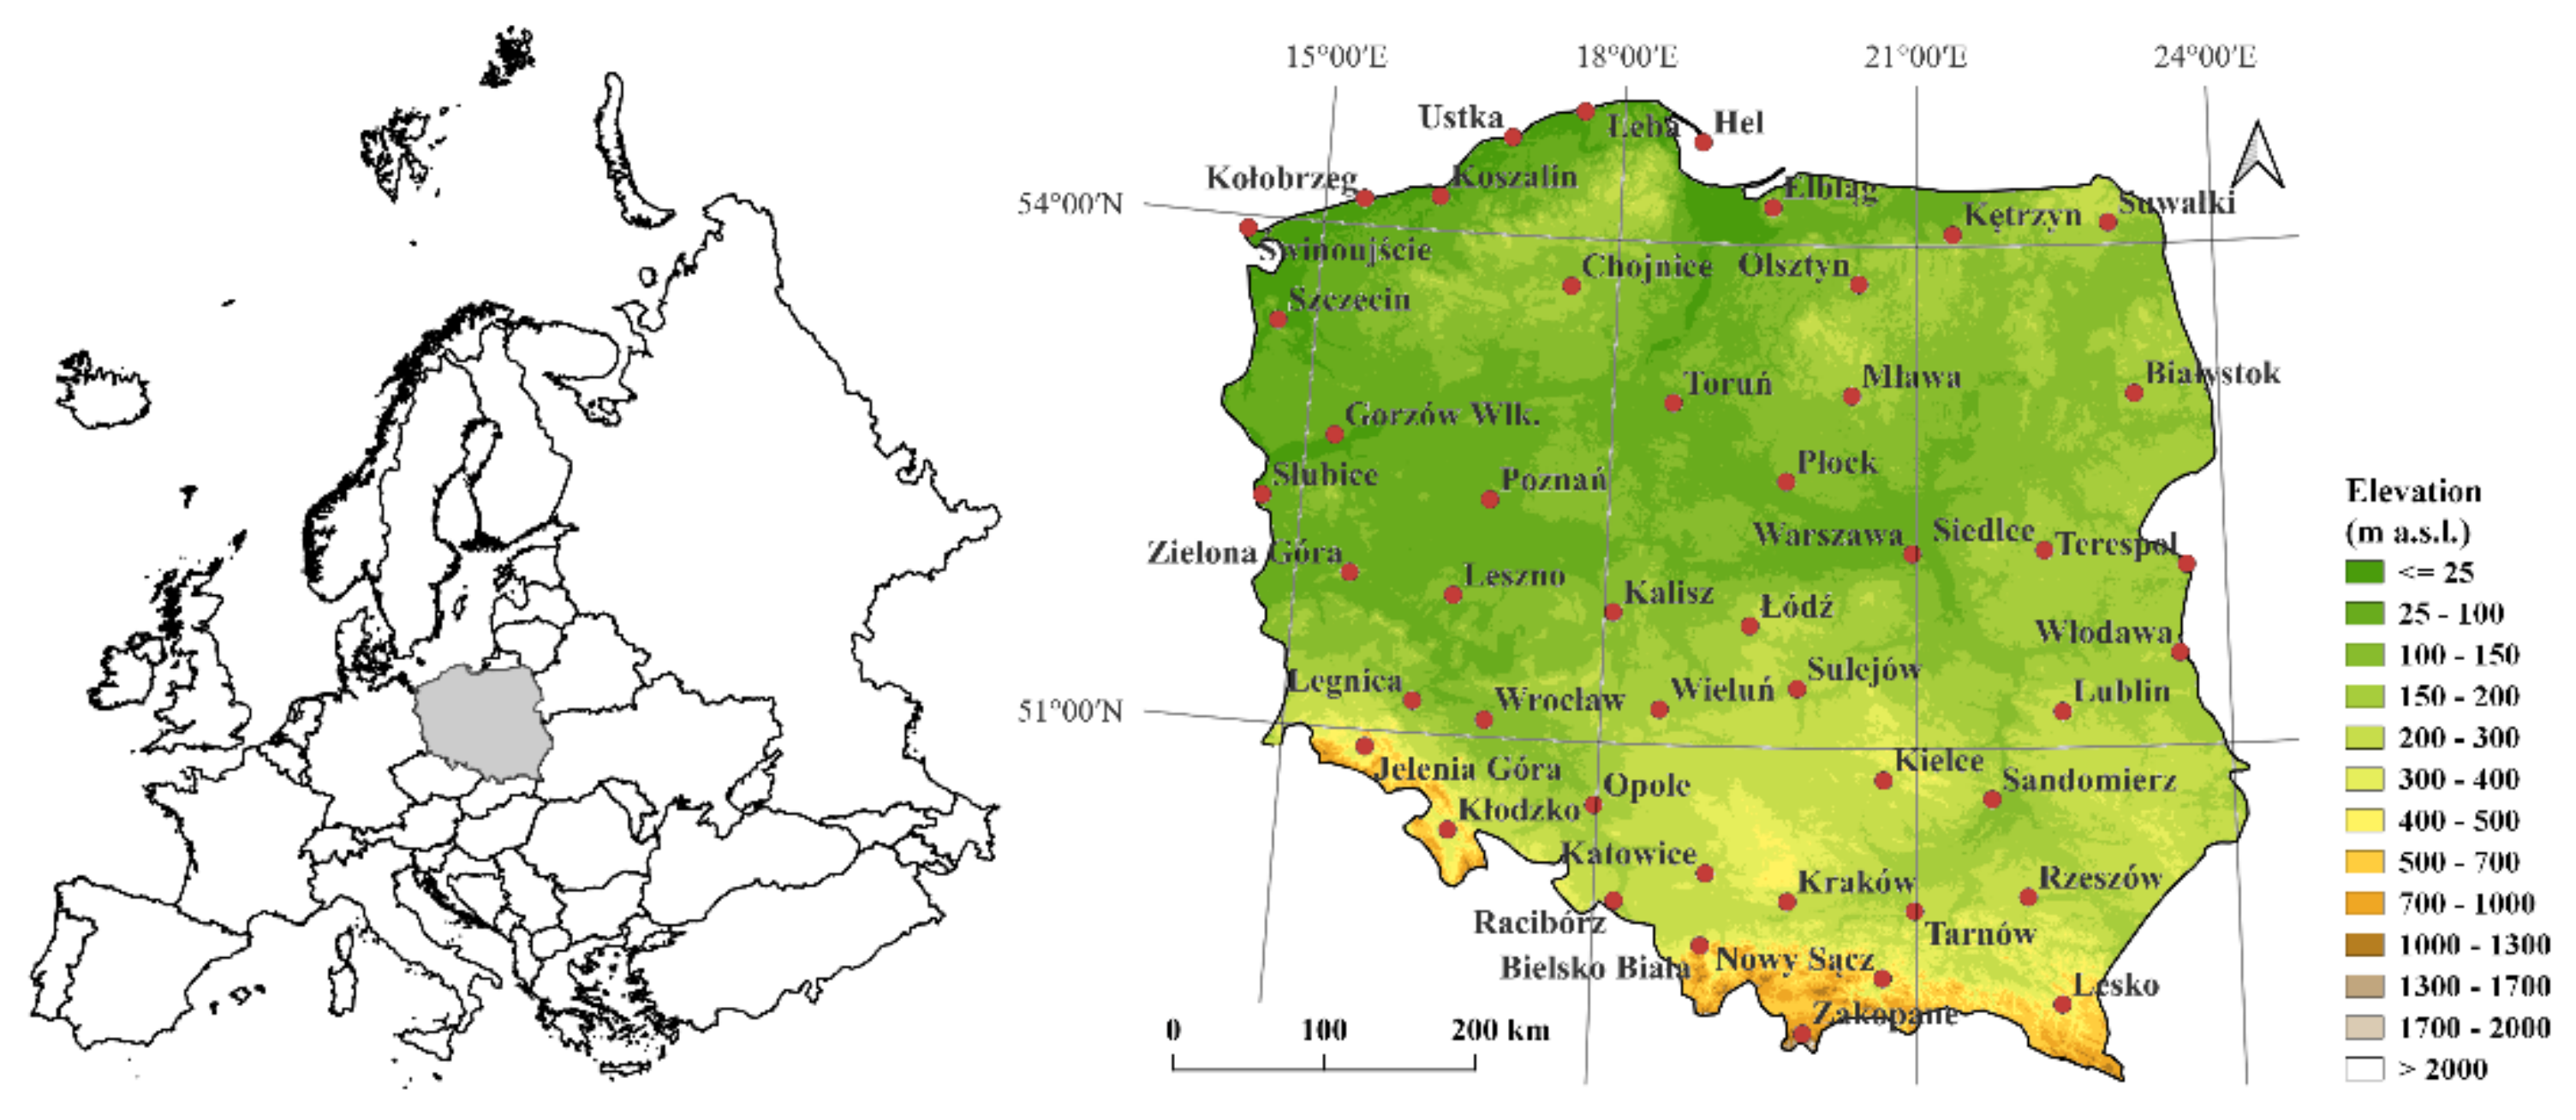
The study is based on daily precipitation totals from 46 meteorological stations in Poland for the years 1966-2023. Their location is shown in
Figure 1. The data comes from the Institute of Meteorology and Water Management—National Research Institute (IMWM-NRI). Stations with full data series and located below 1000 m a.s.l. were selected. Poland is a lowland country, the percentage of areas located above 1000 m a.s.l. is less than 1%.
Seven circulation indices were used to investigate the influence of atmospheric circulation on precipitation and dry and wet day frequencies in Poland. The Greenland Blocking Index (GBI) defined by Hanna et al. [
27] was taken from psl.noaa.gov/gcos_wgsp/Timeseries/Data/gbi.mon.data (accessed 13th Apr. 2023). The Atlantic Multidecadal Oscillation index (AMO) was calculated by Enfield et al. [
28], data was taken from www1.ncdc.noaa.gov/pub/data/cmb/ersst/v5/index/ersst.v5.amo.dat (accessed 13th Apr. 2023). Arctic Oscillation index (AO) is constructed by projecting the monthly mean 1000-hPa height anomalies on the Northern Hemisphere north from 20 ºN onto the leading Empirical Orthogonal Function (EOF) mode. Data were taken from cpc.ncep.noaa.gov/products/precip/CWlink/daily_ao_index/monthly.ao.index.b50.current.ascii (accessed 13th Apr. 2023). The remaining indices are the North Atlantic index (NAO), East Atlantic index (EA), Scandinavian index (SCAND) and Eastern Europe / Western Russia index (EA/WR). The procedure used to calculate them is based on the Rotated Principal Component Analysis (RPCA) described by Barnston and Livezey [
29]. Data were taken from
https://ftp.cpc.ncep.noaa.gov/wd52dg/data/indices/tele_index.nh (accessed 13th Apr. 2023). All indices cover the period from 1966 to 2023, only in the case of the GBI data for the last three months of 2023 were not available yet.
IMWM-NRI provides daily precipitation totals with an accuracy of 0.1 mm. Separately, it provides information about, so called unmeasureable precipitation, when its sum is less than 0.1 mm. In this paper dry days are defined as days with precipitation below 0.1 mm, a days with precipitation at least 1 mm are defined as wet days. The threshold of 1 mm in definition of wet days was applied for easier comparison with studies in other regions (Ye, 2018, Zolina 2010). However, the days with precipitation between 0.1 and 0.9 mm are not analyzed at all. Dry spell at particular stations was defined as sequence of at least 7 consecutive dry days between the two nearest dates on which at least 0.1 mm of precipitation was recorded. Dry spell in Poland was defined as a sequence of at least 7 consecutive days in which dry spells continue on at least 12 stations. A condition of 12 stations was chosen because it means that it is dry in an area covering more than 25% of the country. In further part of this study, dry spell means dry spell in Poland.
The adoption of similar conditions in the definitione of wet spell caused that only a few wet spells could be distibnguished in the whole analyzed period. The requirements had to be significantly lowered. Ultimately, wet spell at particular stations was defined as sequence of at least 5 consecutive wet days between the two nearest dates on which precipitation below 1 mm was recorded. Wet spell in Poland was defined as a sequence of at least 5 consecutive days in which dry spells continue on at least 9 stations. A condition of 9 stations means that it is wet in an area covering about 20% of the country. As in case of dry spell, in further part of this study, wet spell means wet spell in Poland.
Trends in monthly values of precipitation, dry and wet days at stations were calculated using the Sen-Theil estimator of slope [
30,
31] and Mann-Kendall test [
32]. Both are nonparametric methods that do not require a normal distribution of the analyzed time series. Non-parametric statistics are much less affected by the presence of outliers and give robust results also for non-normally distributed series [
33].
The Pearson correlation coefficient was used to analyze the relationships between atmospheric circulation and the area average values of monthly precipitation totals and monthly frequencies of dry and wet days. The area averages values were calculated as averages from all stations. Statistical significance of all tests were assessed at the o.o5% level. All maps were prepared in Surfer 20 using the kriging method.
3. Results
3.1. Precipitation Totals and Their Long-Term Changes
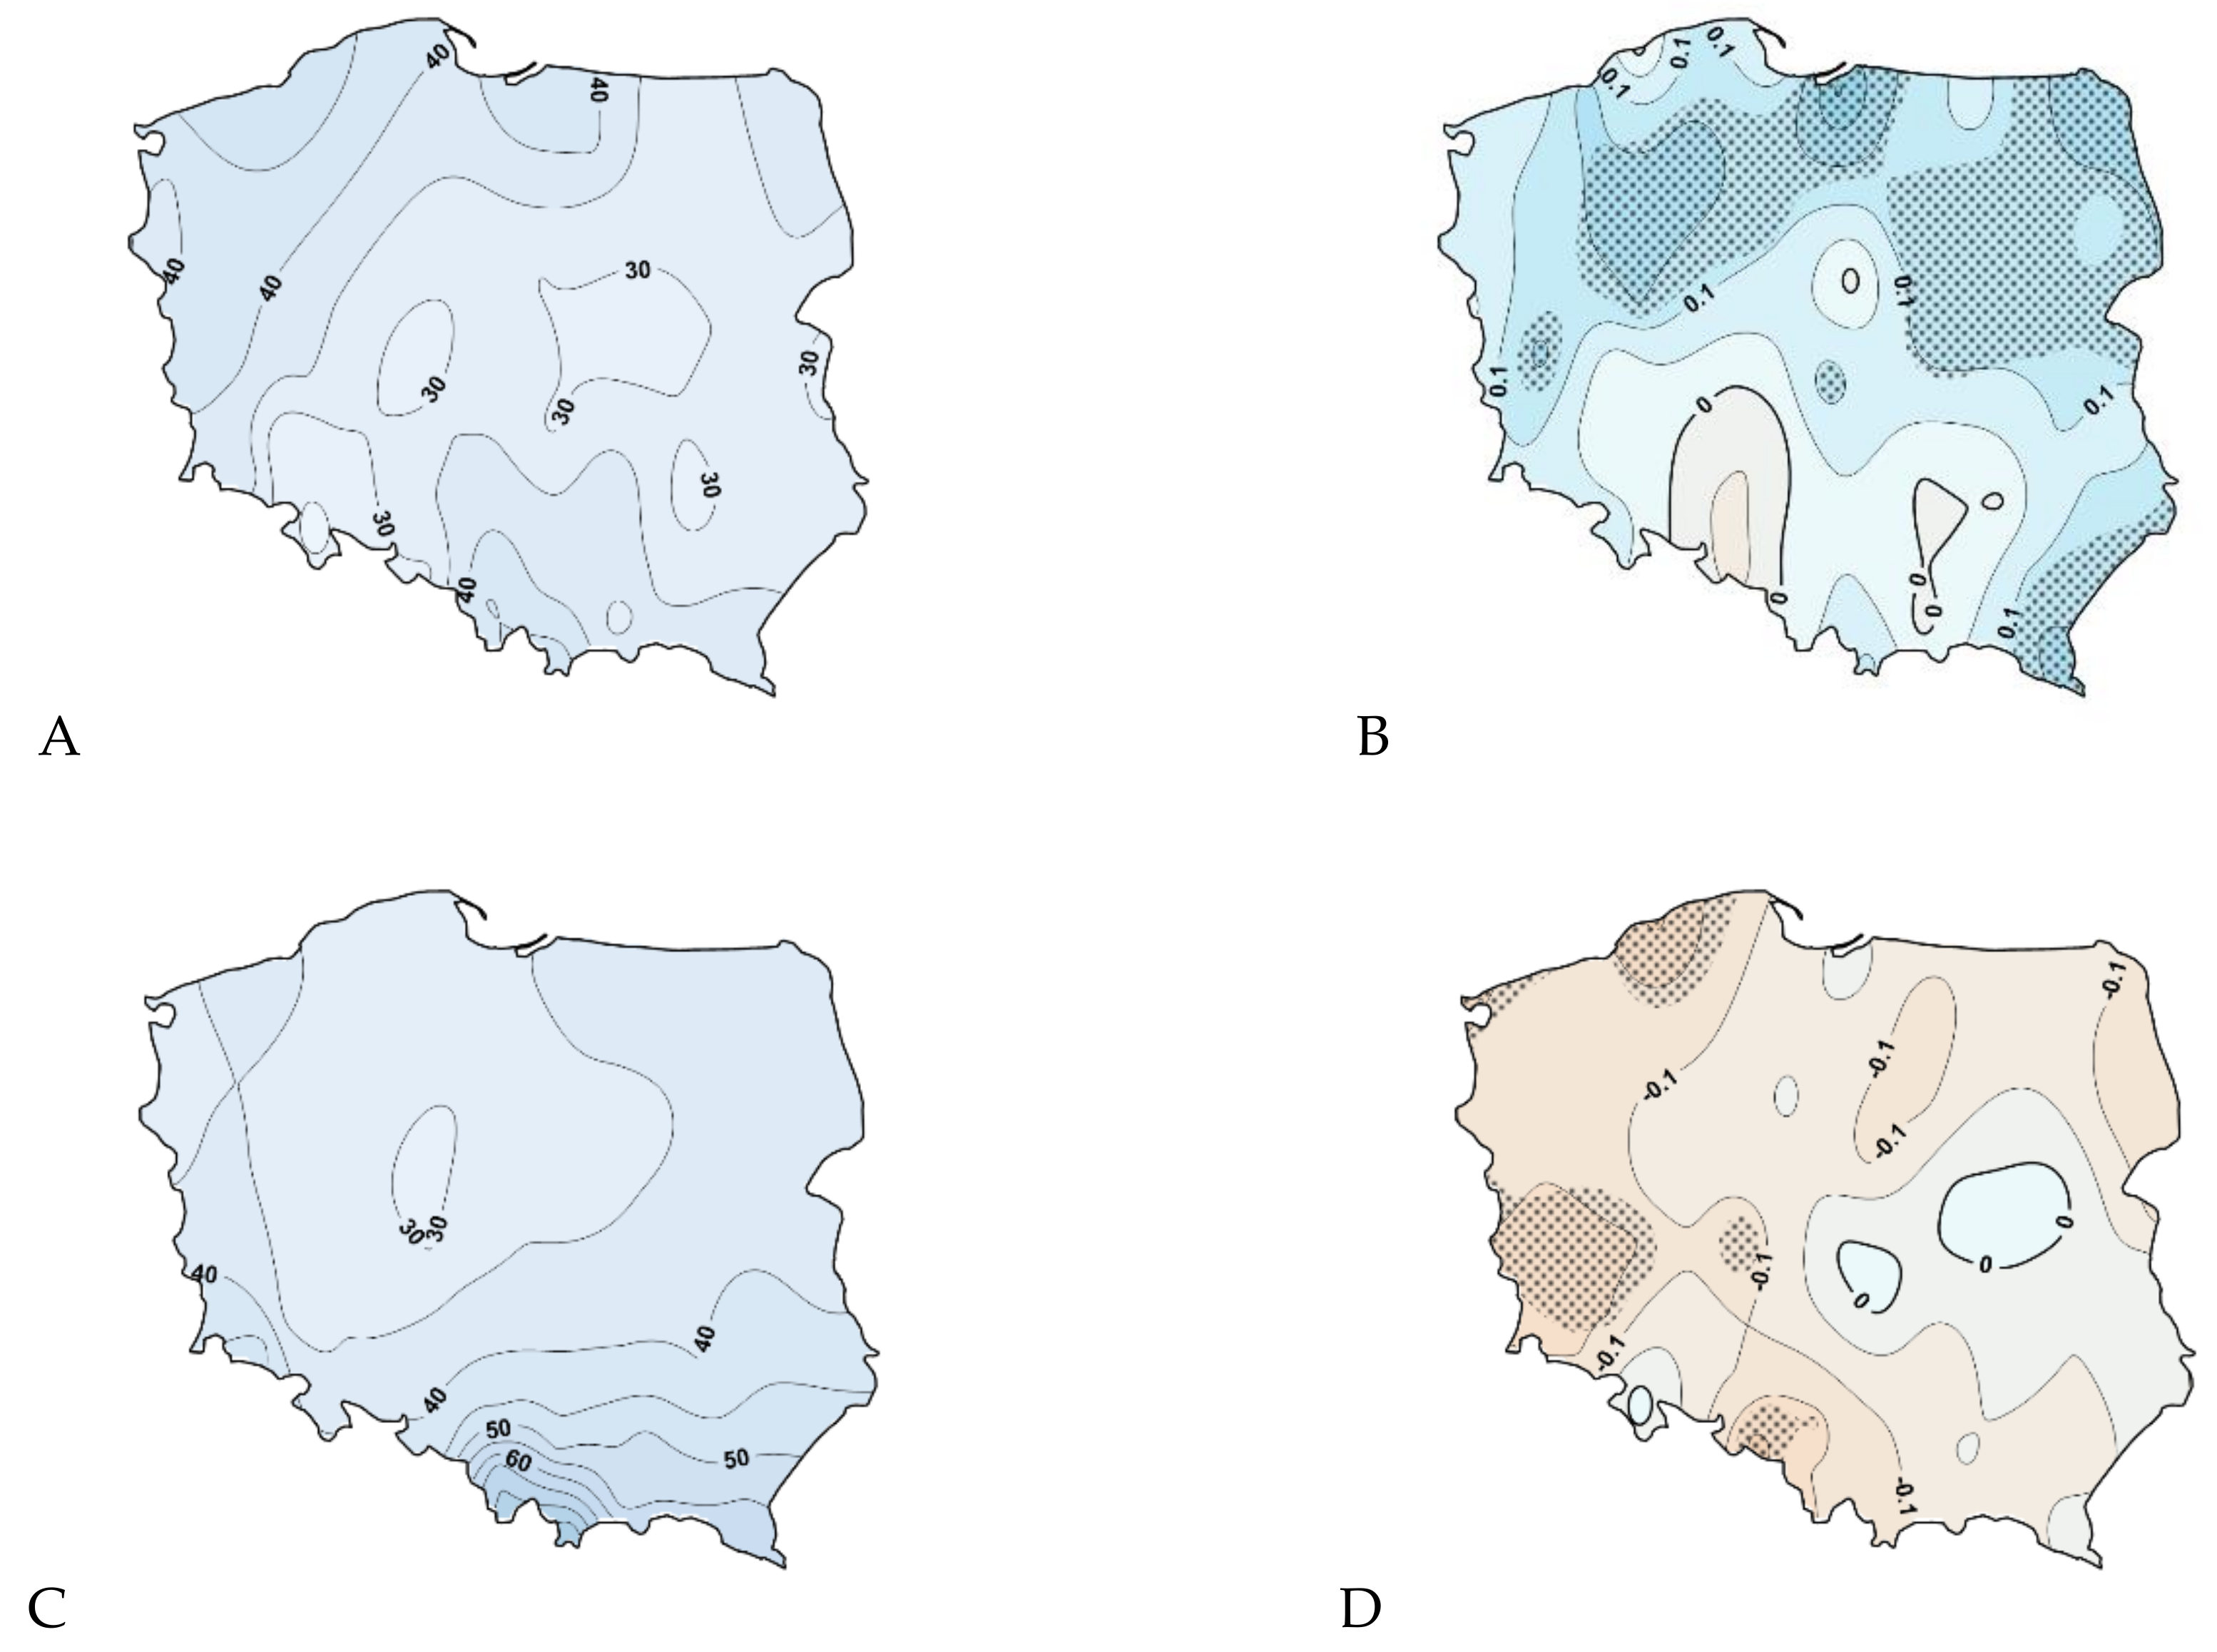
In analysed period, the average annual precipitation in Poland in the area below 100 m a.s.l. was 623 mm. Its spatial distribution strongly depends on terrain and is the lowest in central Poland reaching minimum in Kalisz amounting to 501 mm. On the coast and likeland hills in northern Poland precipitation is of the order of magnitude of 600-700 mm, similarly to souther Poland. In the foothils exceeds 800 mm, reaching 1132mm in Zakopane (
Figure 2a). Longterm changes in precipitation are small, in the western part of the country precipitation increases slightly, in the eastern part in decreases (
Figure 2b). Changest rarely exceed 2mm y
−1, which given the high variability from year to year, means that they are mostly statistically insignificant. On the 46 analyzed stations, precipitation increased significantly in 7 of them and decreased significantly in one.
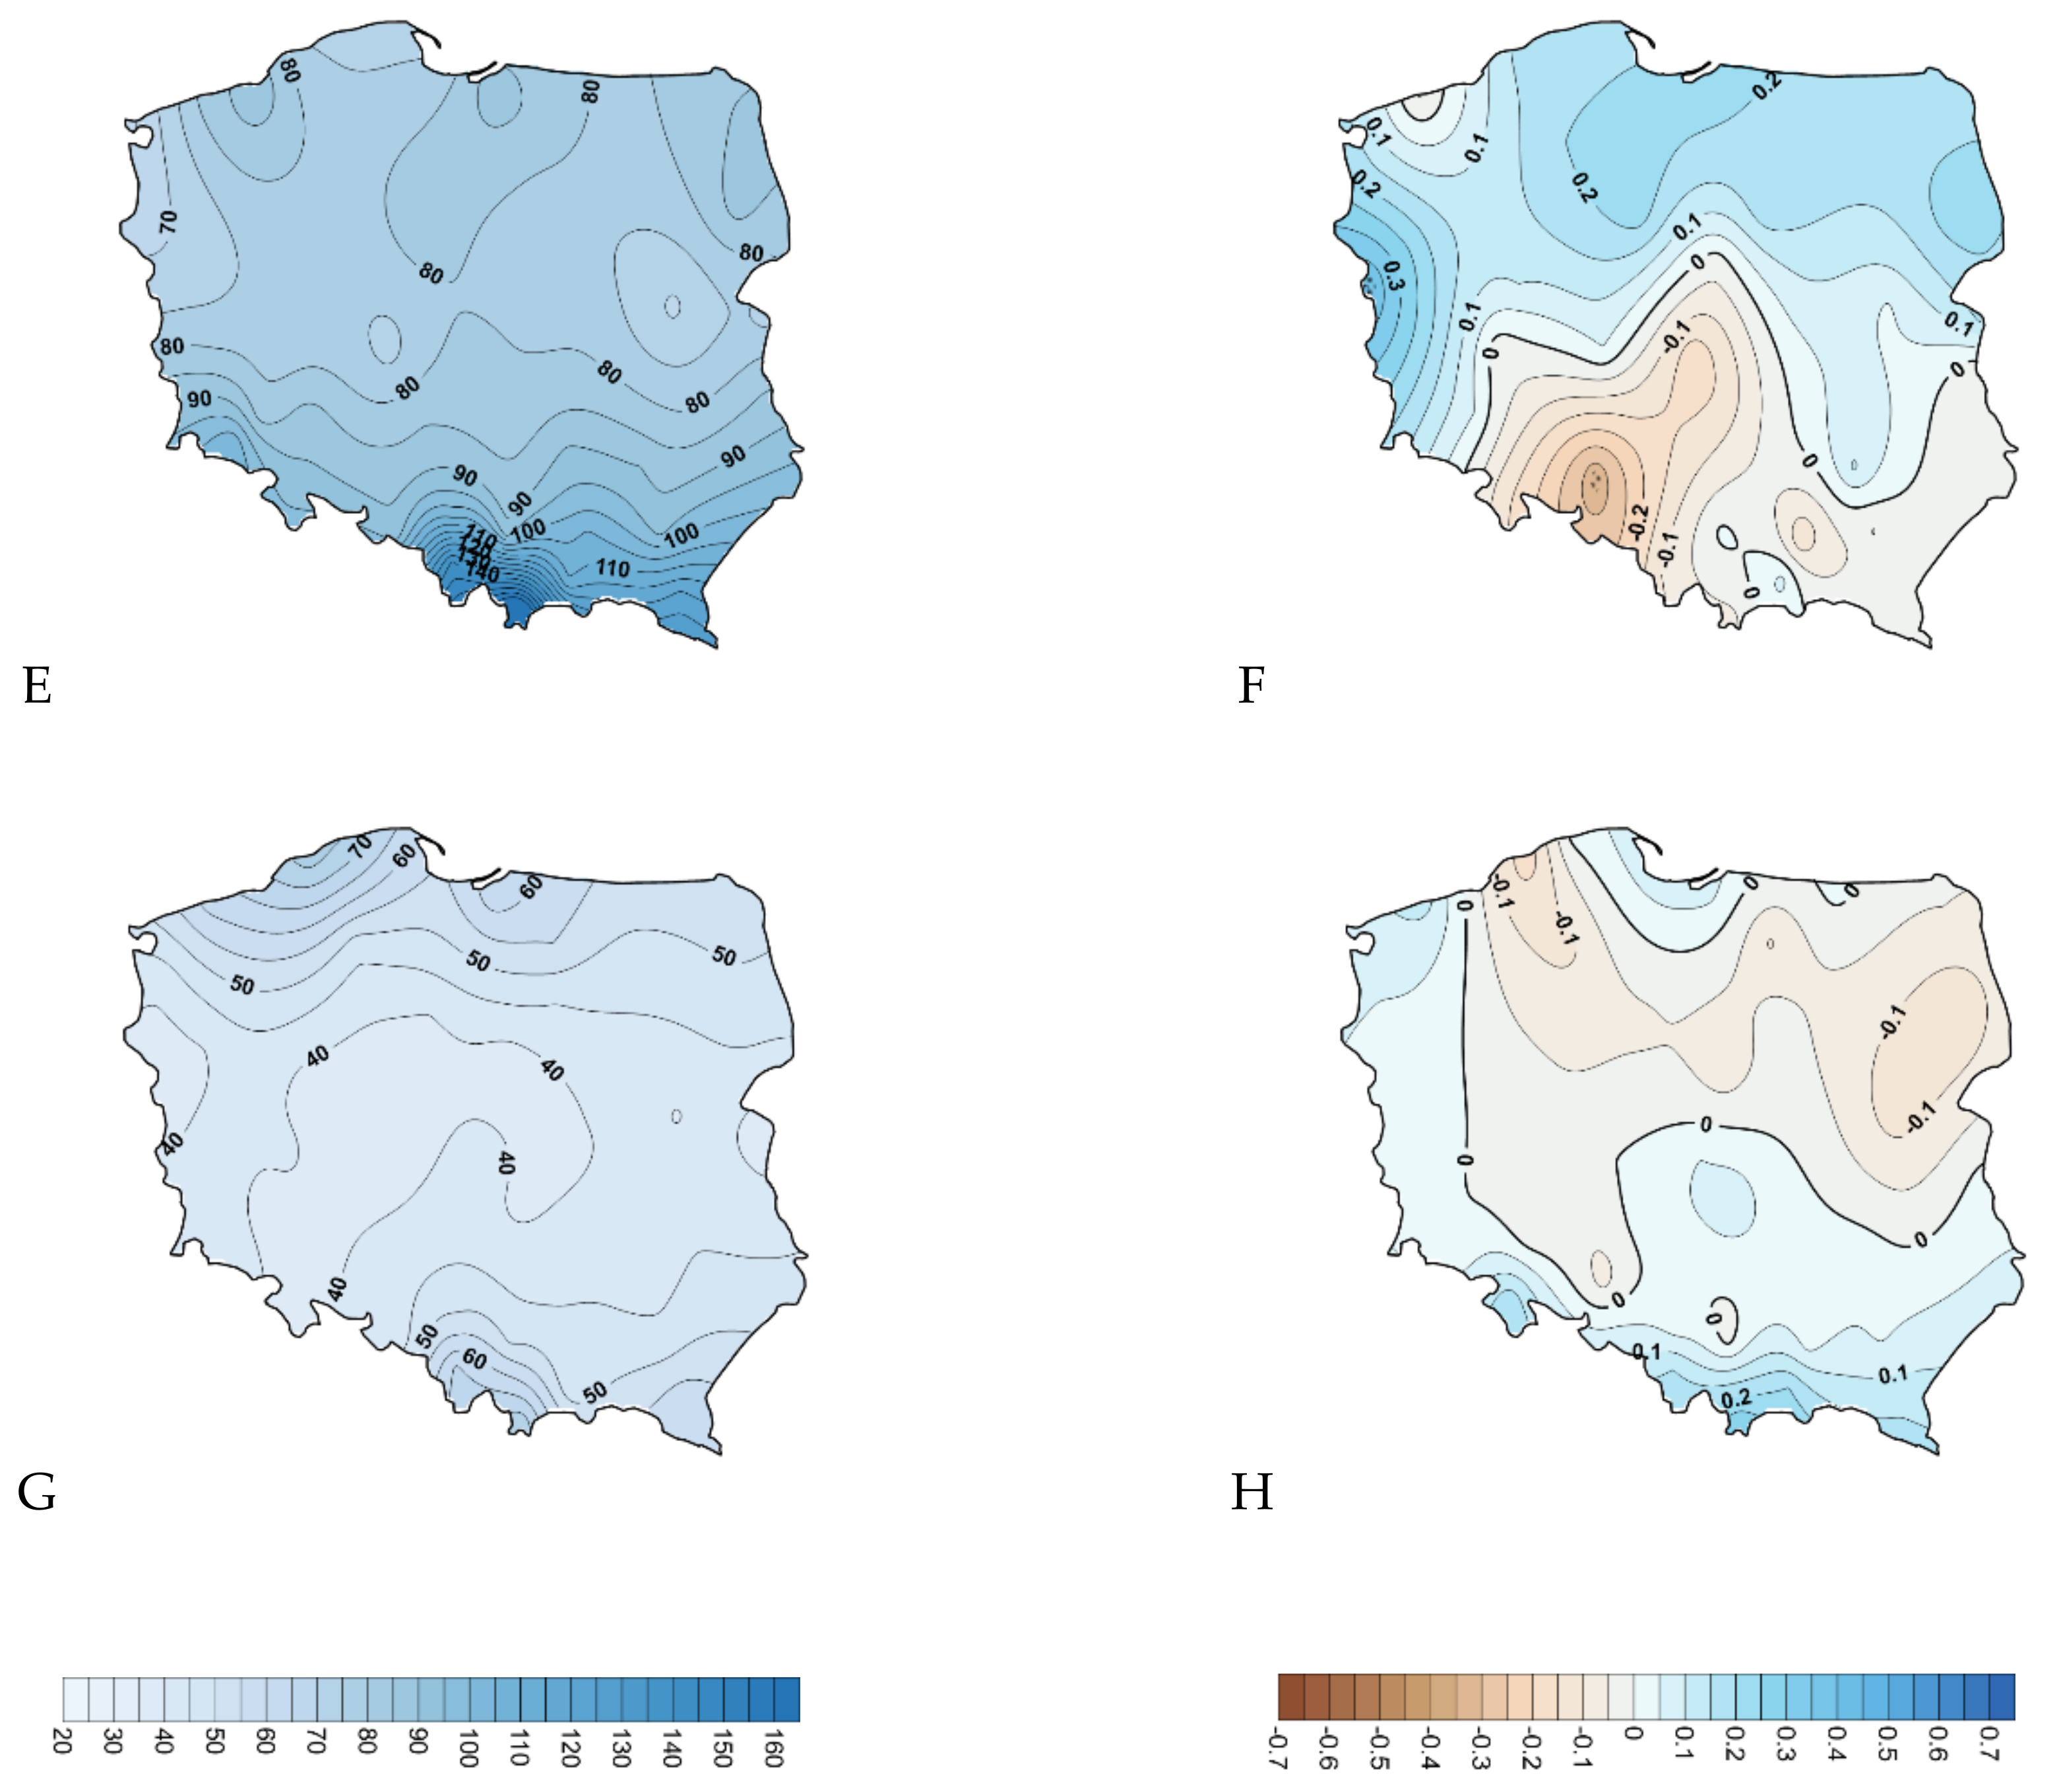
The precipitation annual pattern in Poland is typical for the interior of the continent in the temperate zone. The lowest precipitation falls in January and February, averaging around 33 and 30 mm respectively. The highest precipitation falls in July, averaging around 87 mm (
Figure 3). Long-term precipitation trends are generaly small, but diverse both over the course of the year and over space. In the winter months precipitation increases in the north and east, statistically significant in vast areas, and slighly decreases in the south. In spring, rainfall changes are insignificant in all month except April, when they decrease significantly in the west of the country. Summer begins with the significant decrease of the rainfall in the center of the country and in the south. Then in July there is a slight increase in the rainfall in the north and west, and in the August there is a significant increase in the rainfall in the north and decrease in the south. In the first autumn month, September, the picture is exactly opposite of August, rainfall decreases in the north and increases in the south. In October changes are small and nonsignificant and in November the precipitation strongly decreases in the whole country.
3.2. Dry Days
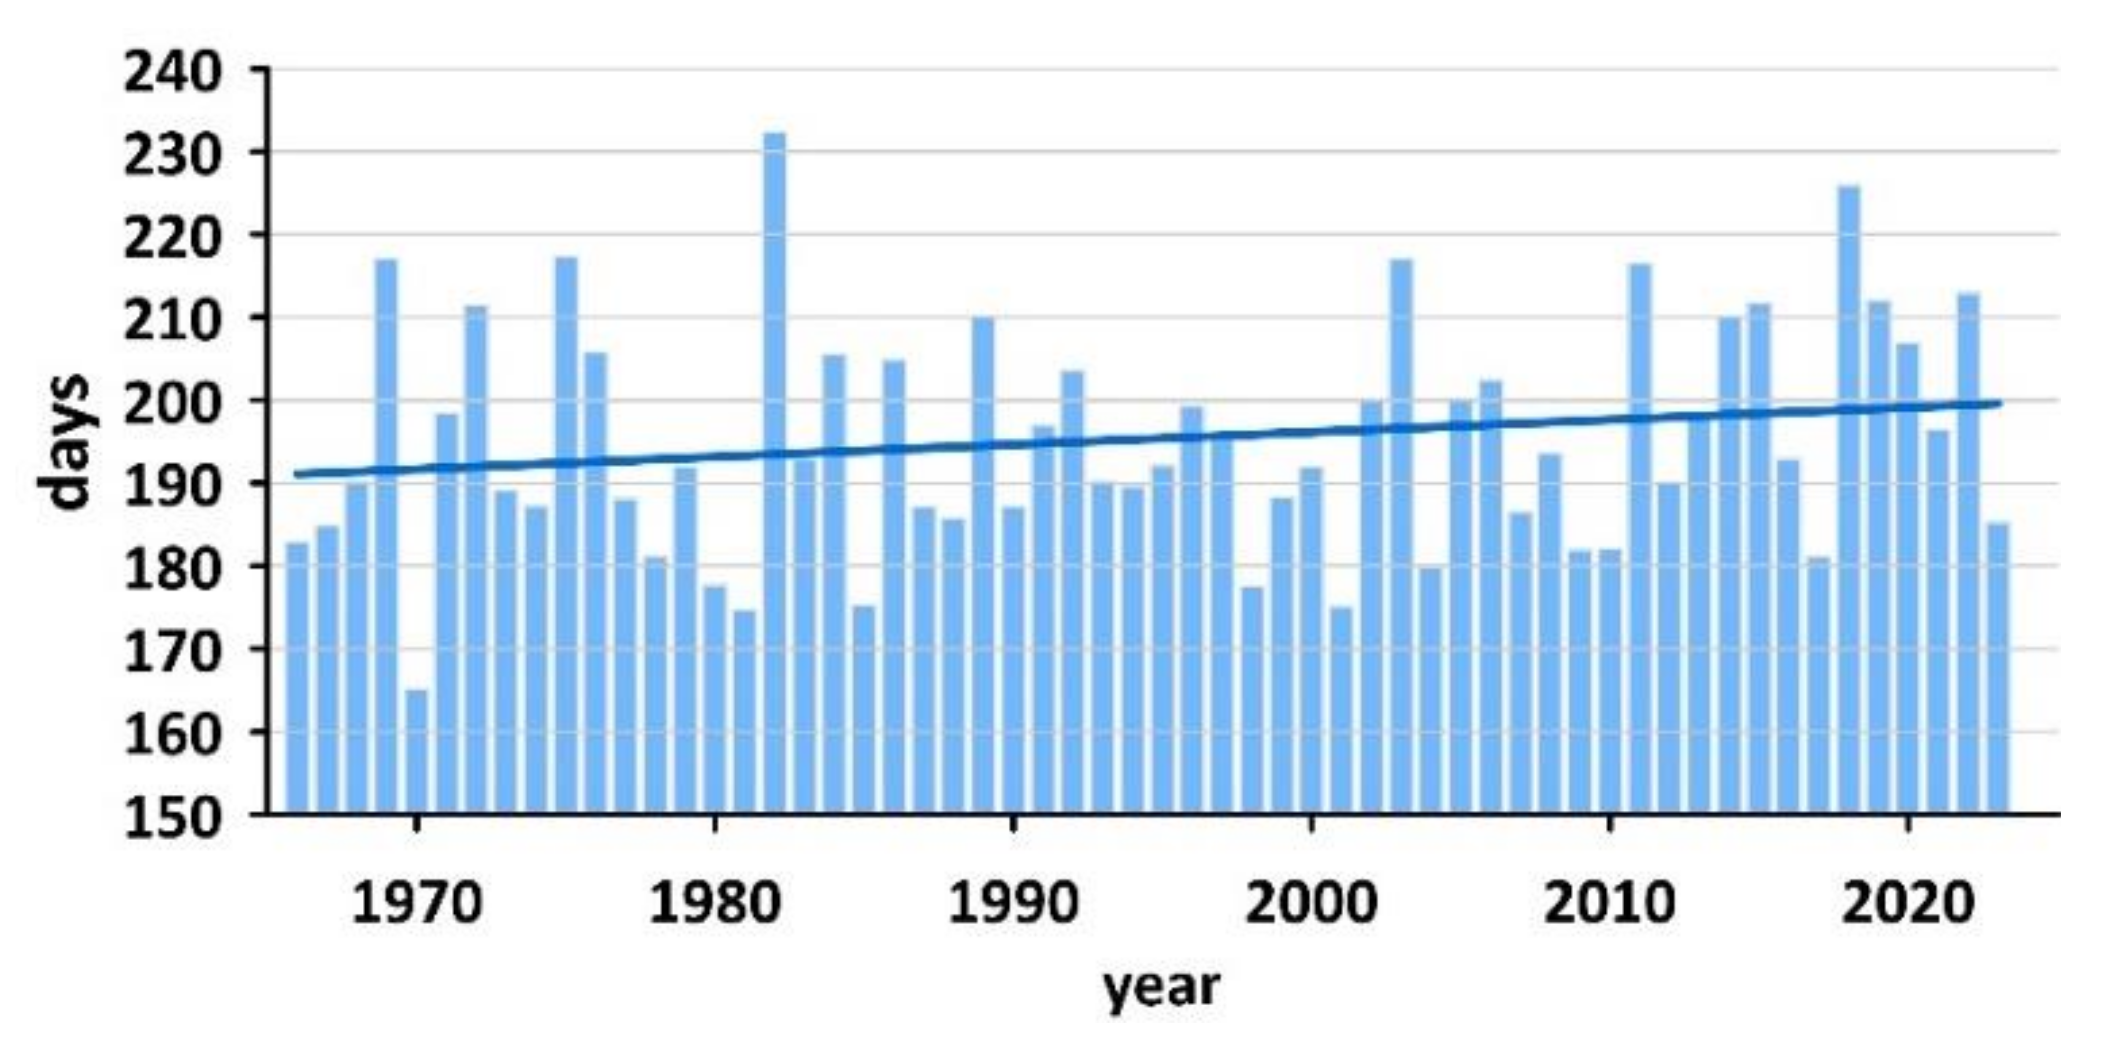
There are on average 195 dry days in Poland, which is slightly more than half of all days. On individual stations this number ranges from 183 in Bielsko-Biała to 211 in Kalisz. In the annual course the lowest number of dry days occurred in December—13.9 and the highest in August, about 18.4. The course of the average number of dry days in Poland in the period 1966-2023 is shown in
Figure 4. There is a large variability of such days from year to year. The smallest number of dry days occurred in 1967, when there were 158 such days. The most dry days were in 1982, when there were as many as 235 of them. The number od dry days increased slightly in the analyzed period, but the change was not statistically significant.
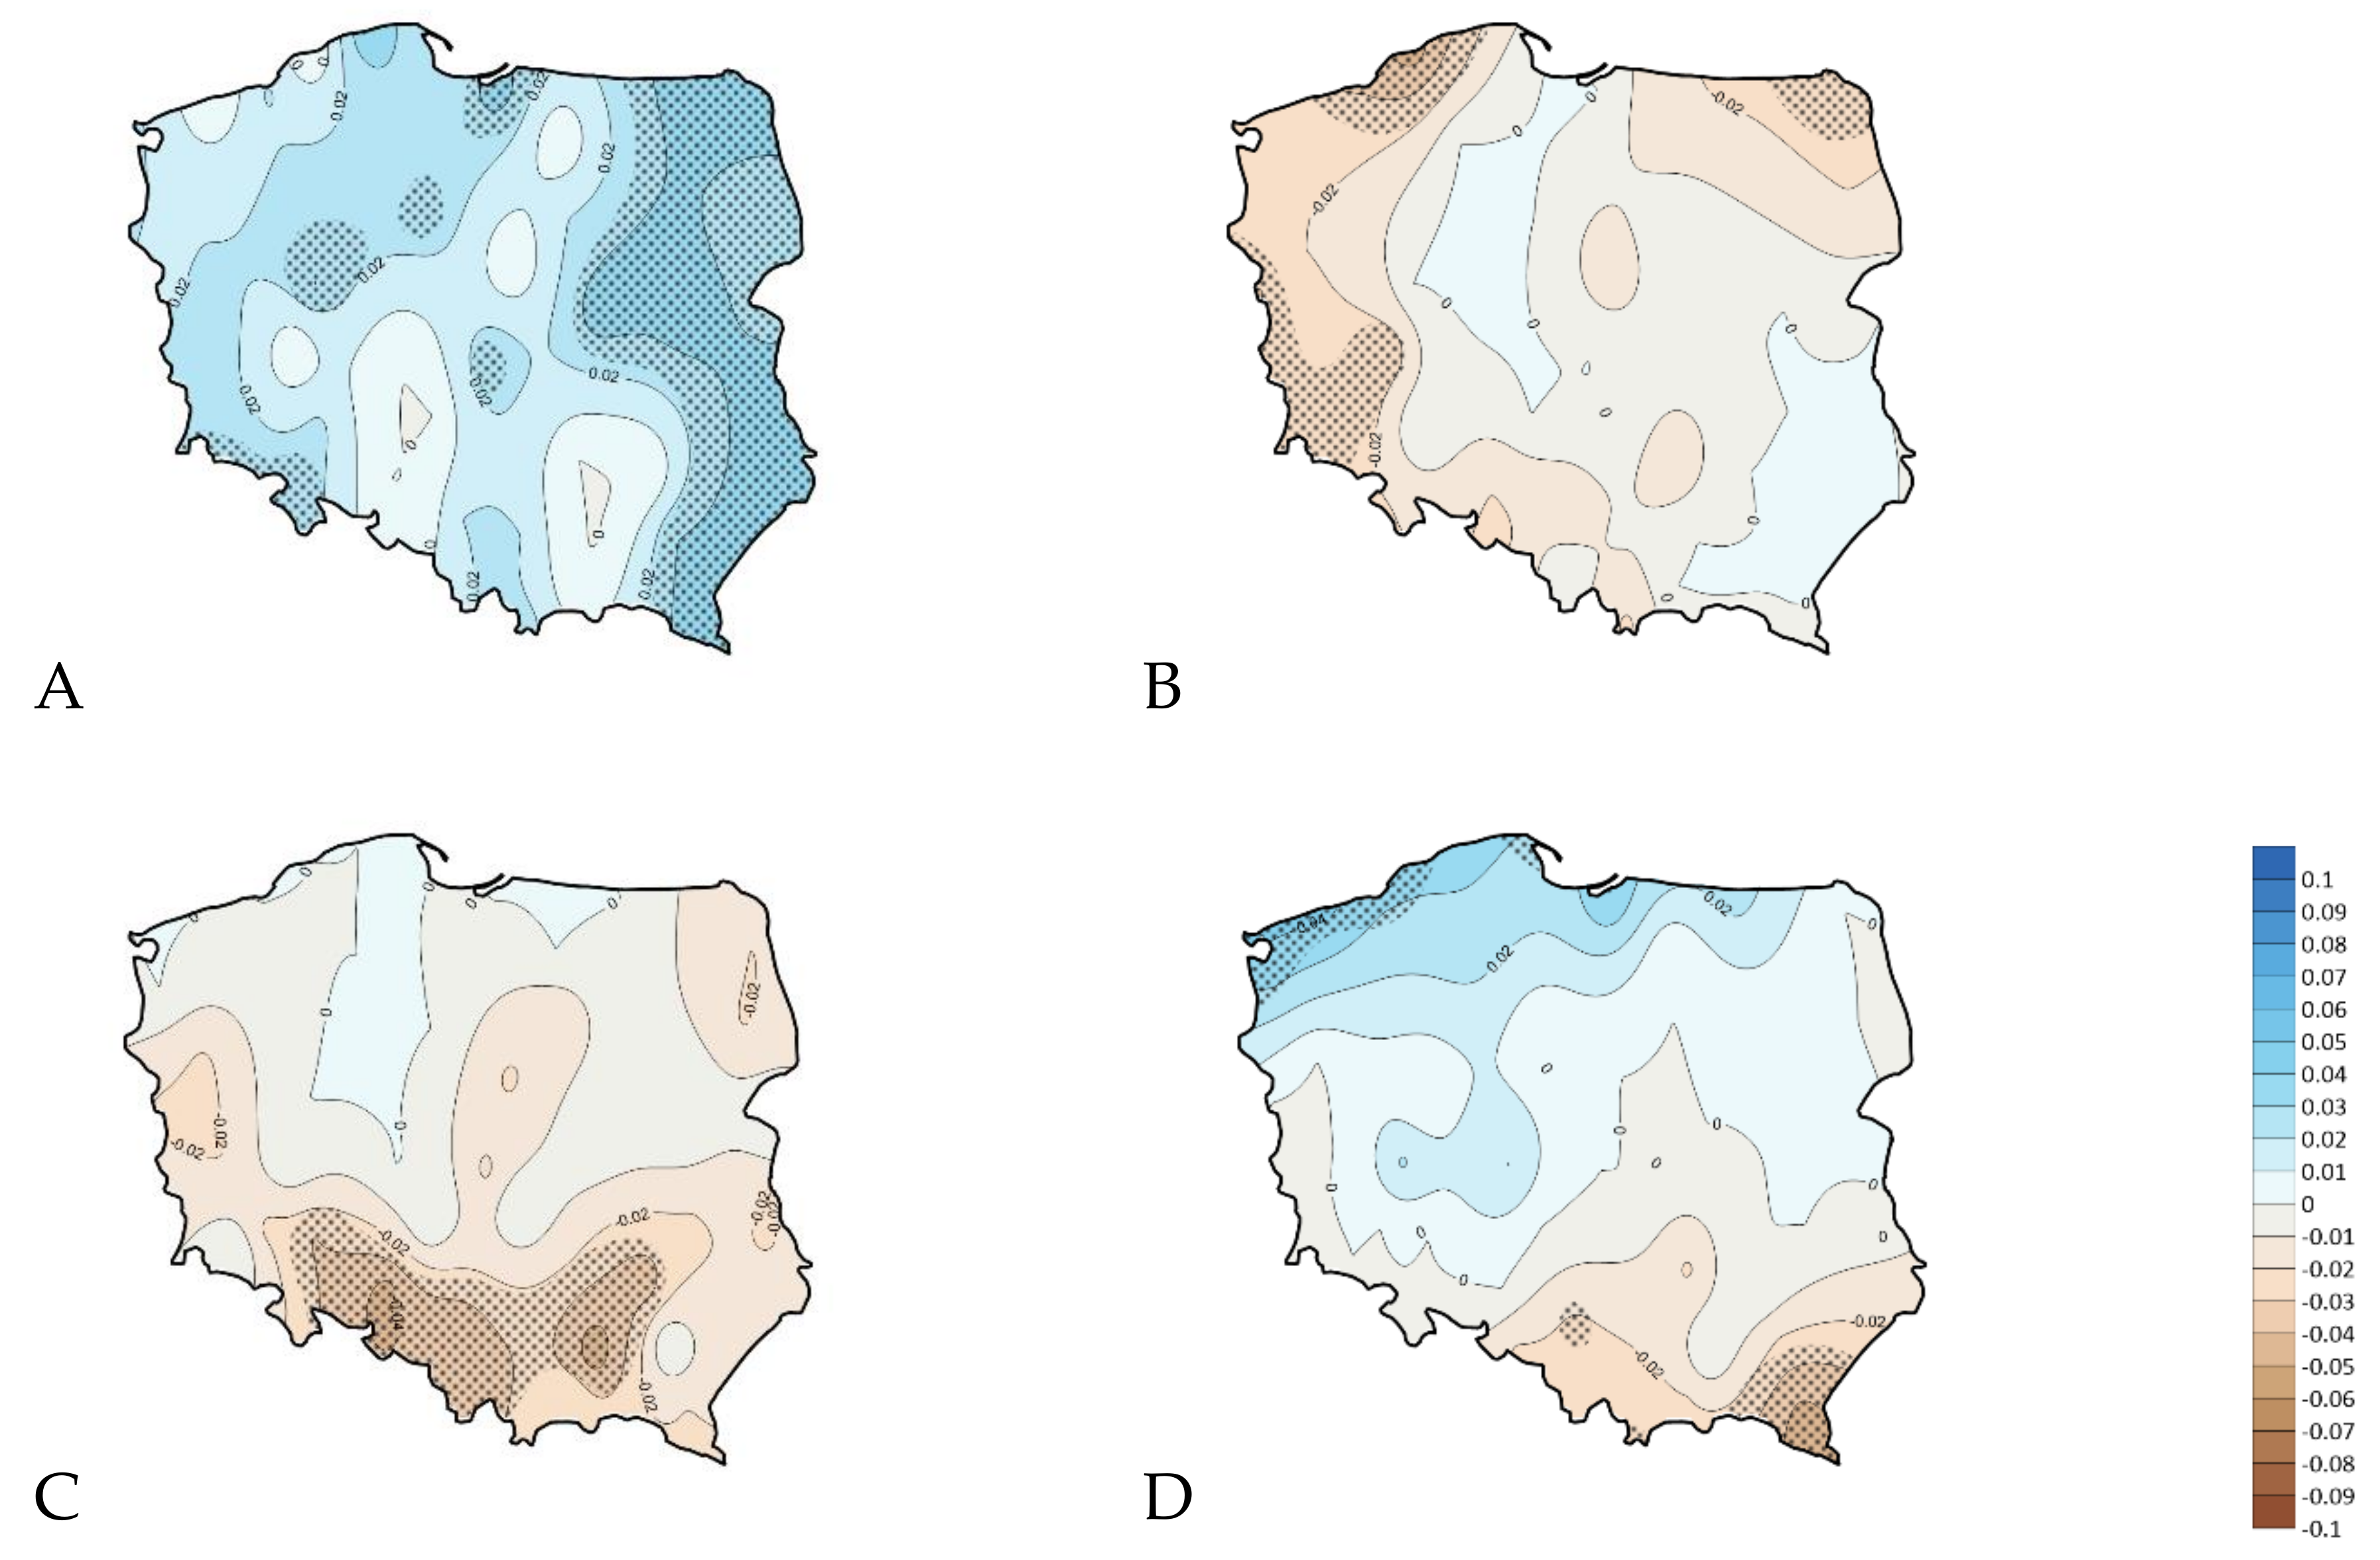
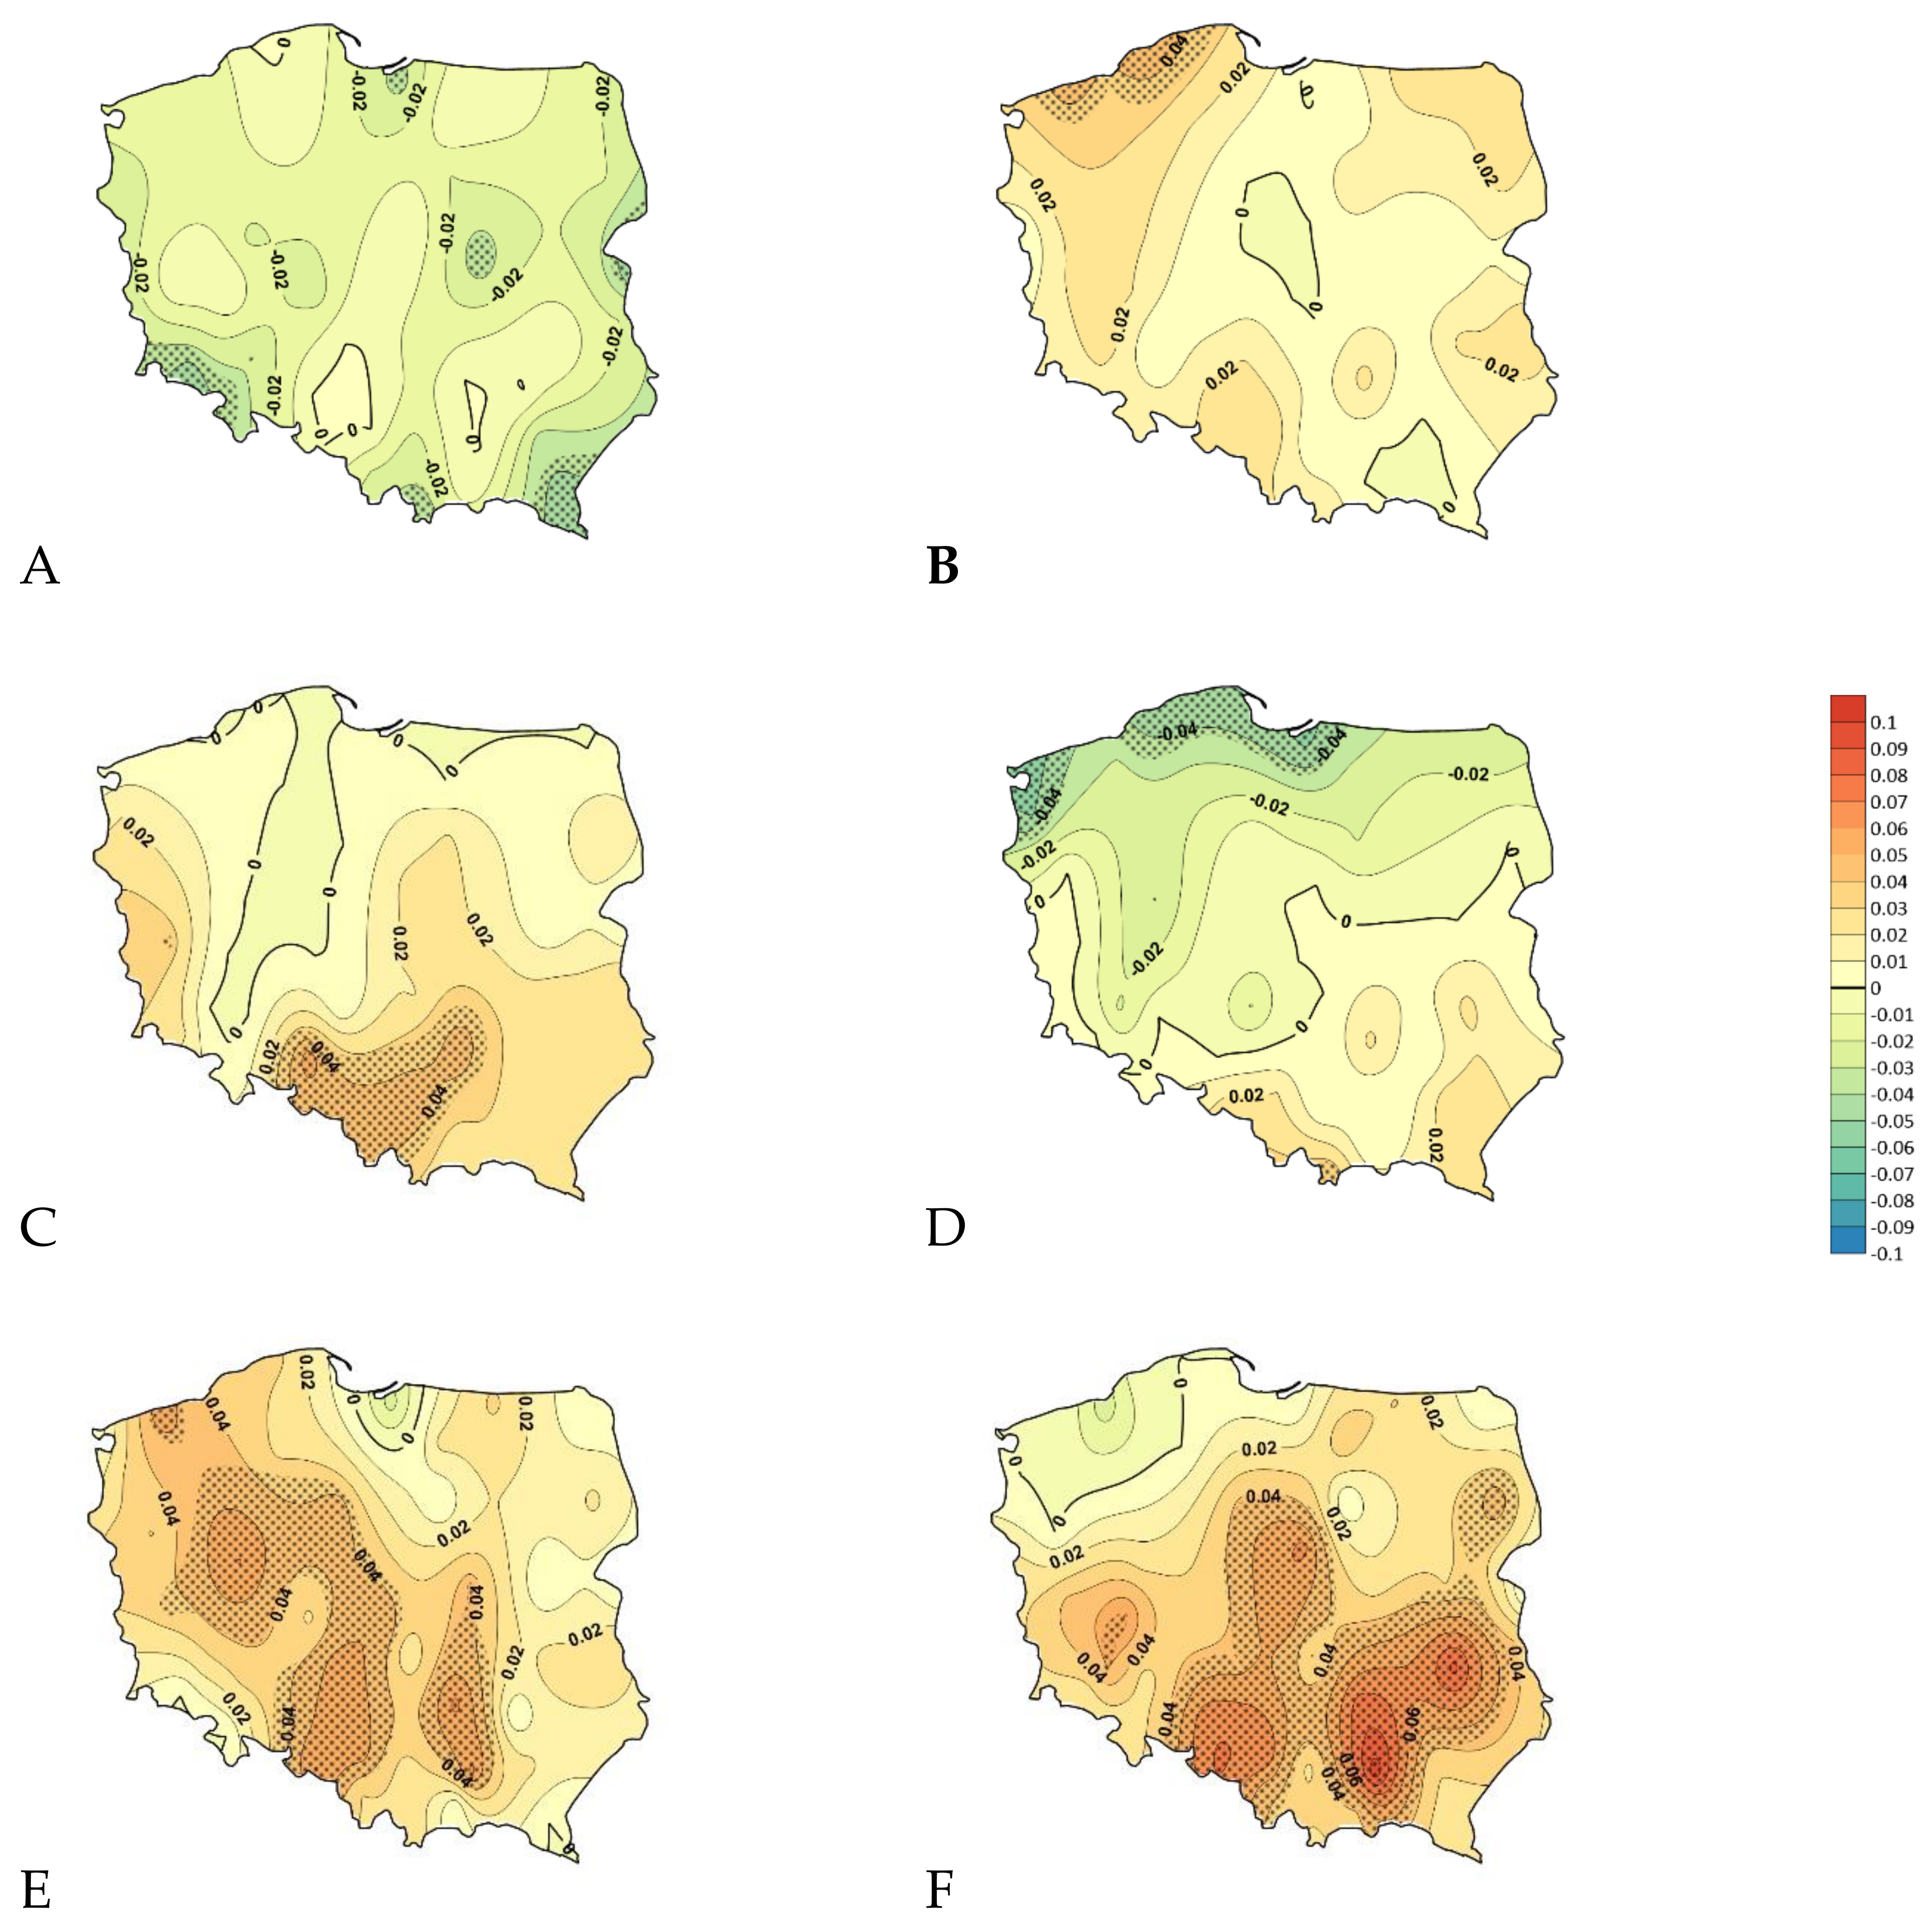
Trends in number of dry days are characterized by high spatial variability and are different in different months. A few examples are shown in
Figure 5. In January decreasing trends dominate, and in some places they are statistically significant. In February, May and October a patchy pattern is visible with small and insignificant changes. In April positive trends dominate , and at the seaside they are significant. Number of dry days is increasing also in June. This time significant changes occur at the south. In August the decrease in dry days occur in the north, significant at the seaside and increase in the south. Exactly opposite picture of changes is observed in September. Here the significant increase in dry days occurs in the northern Poland. In November and December the increasing trend in number of dry days is visible and it is statistically significant over a large area. This is an important change, because these two months were characterized by the lowest frequency of dry days. What is also disturbing is the increase in the number of dry days at the beginning and in the first part of the growing season in April and June.
3.3. Dry Spells
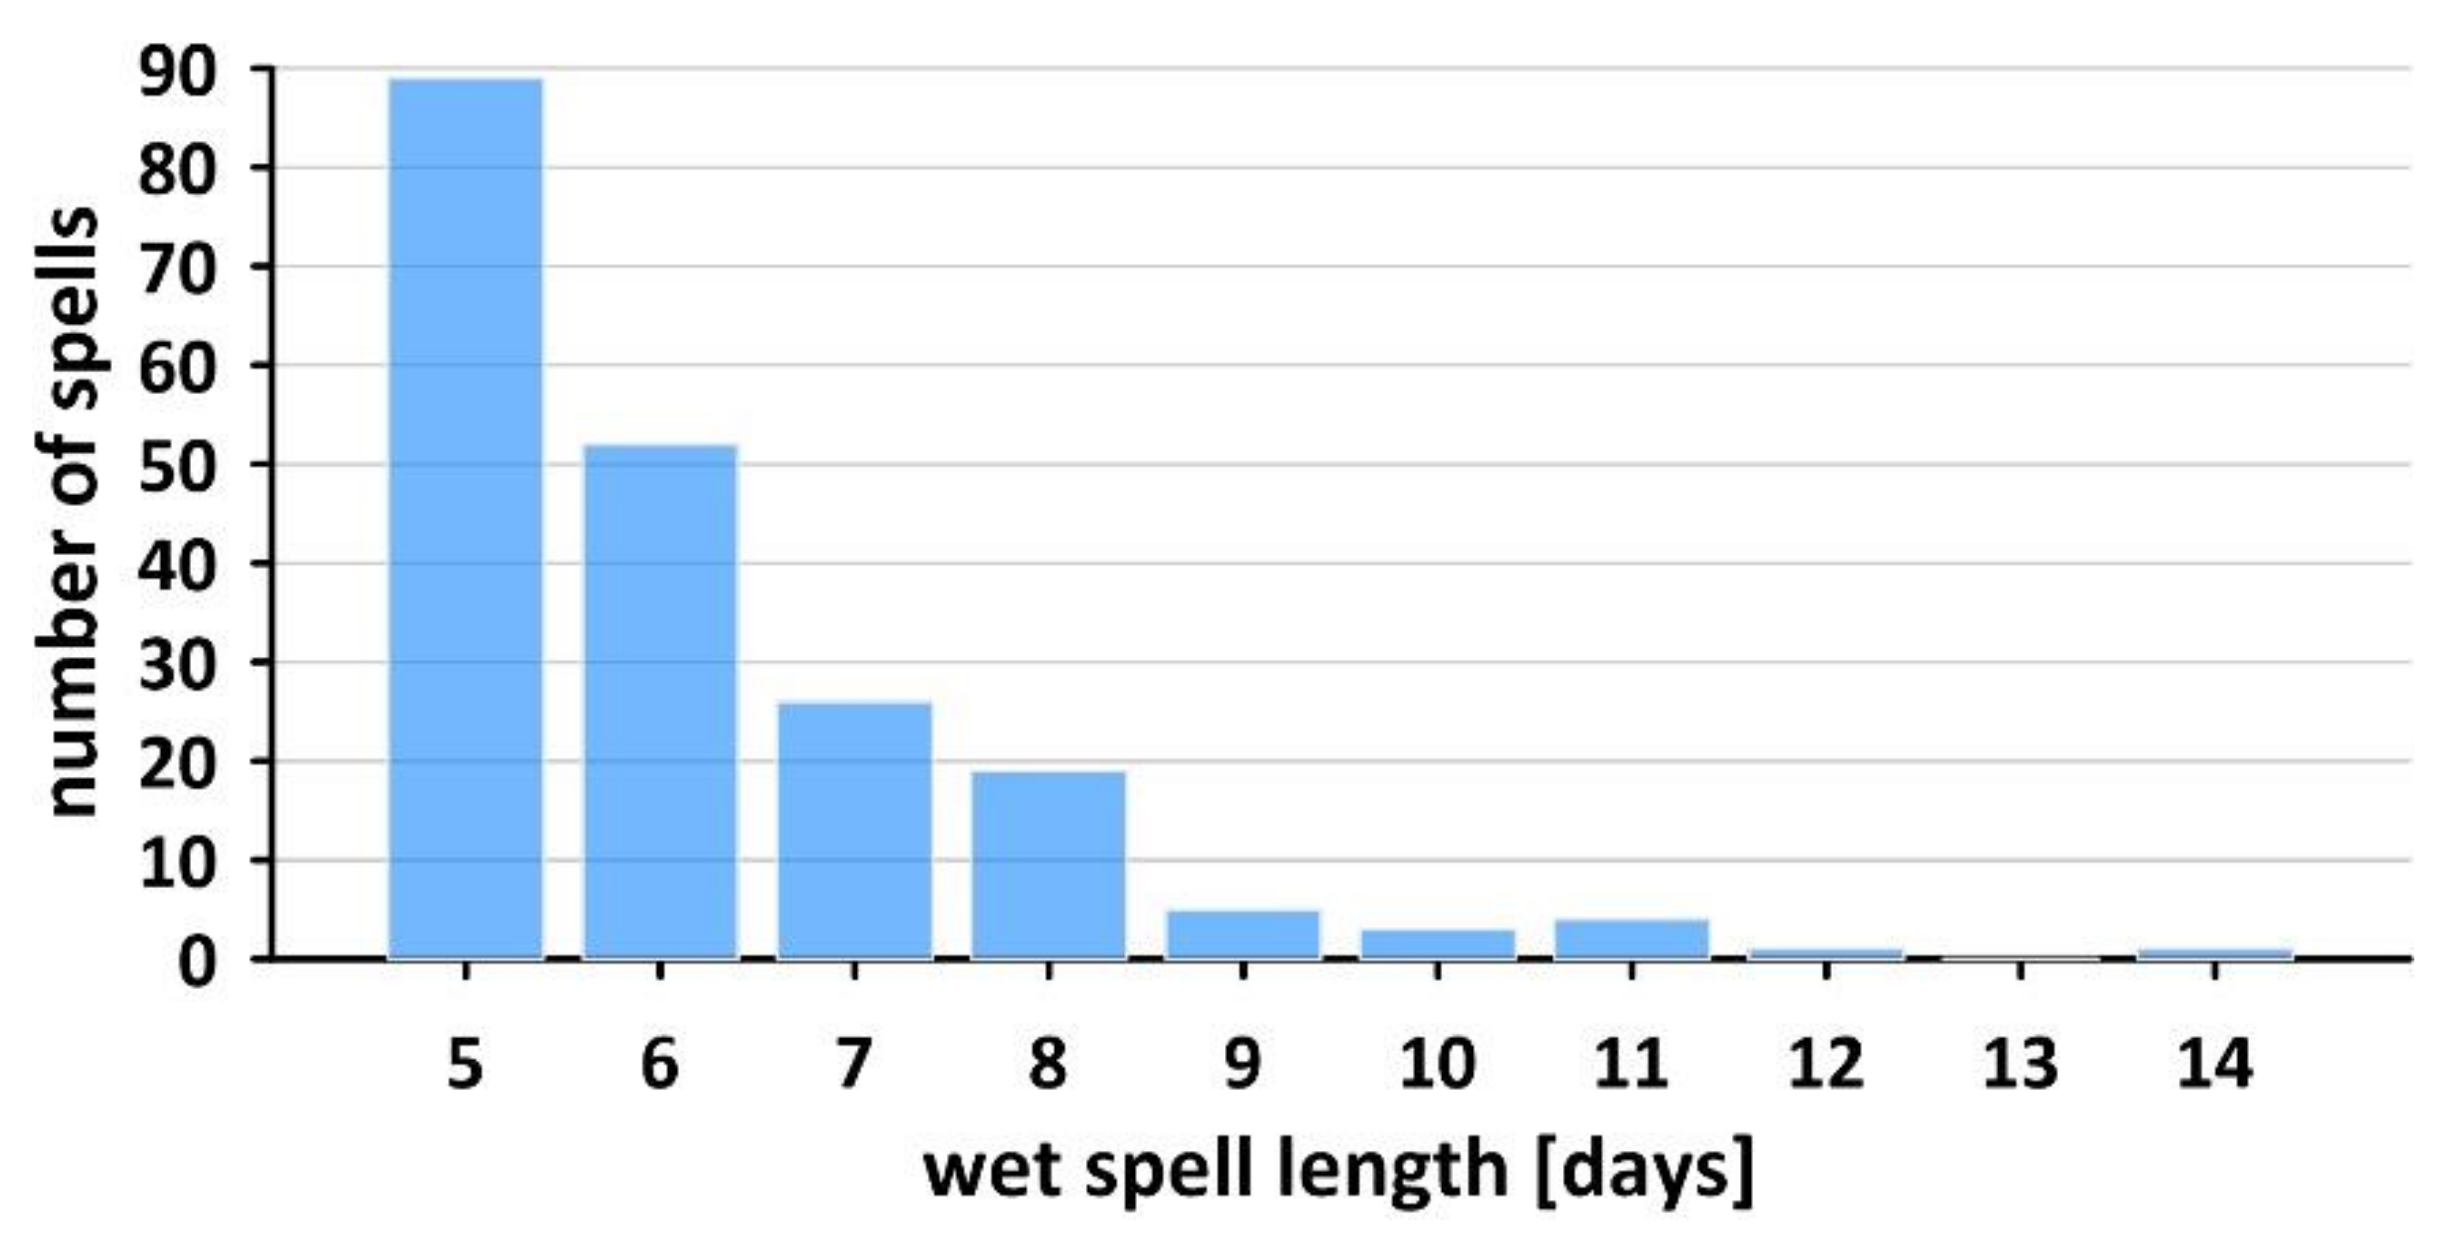
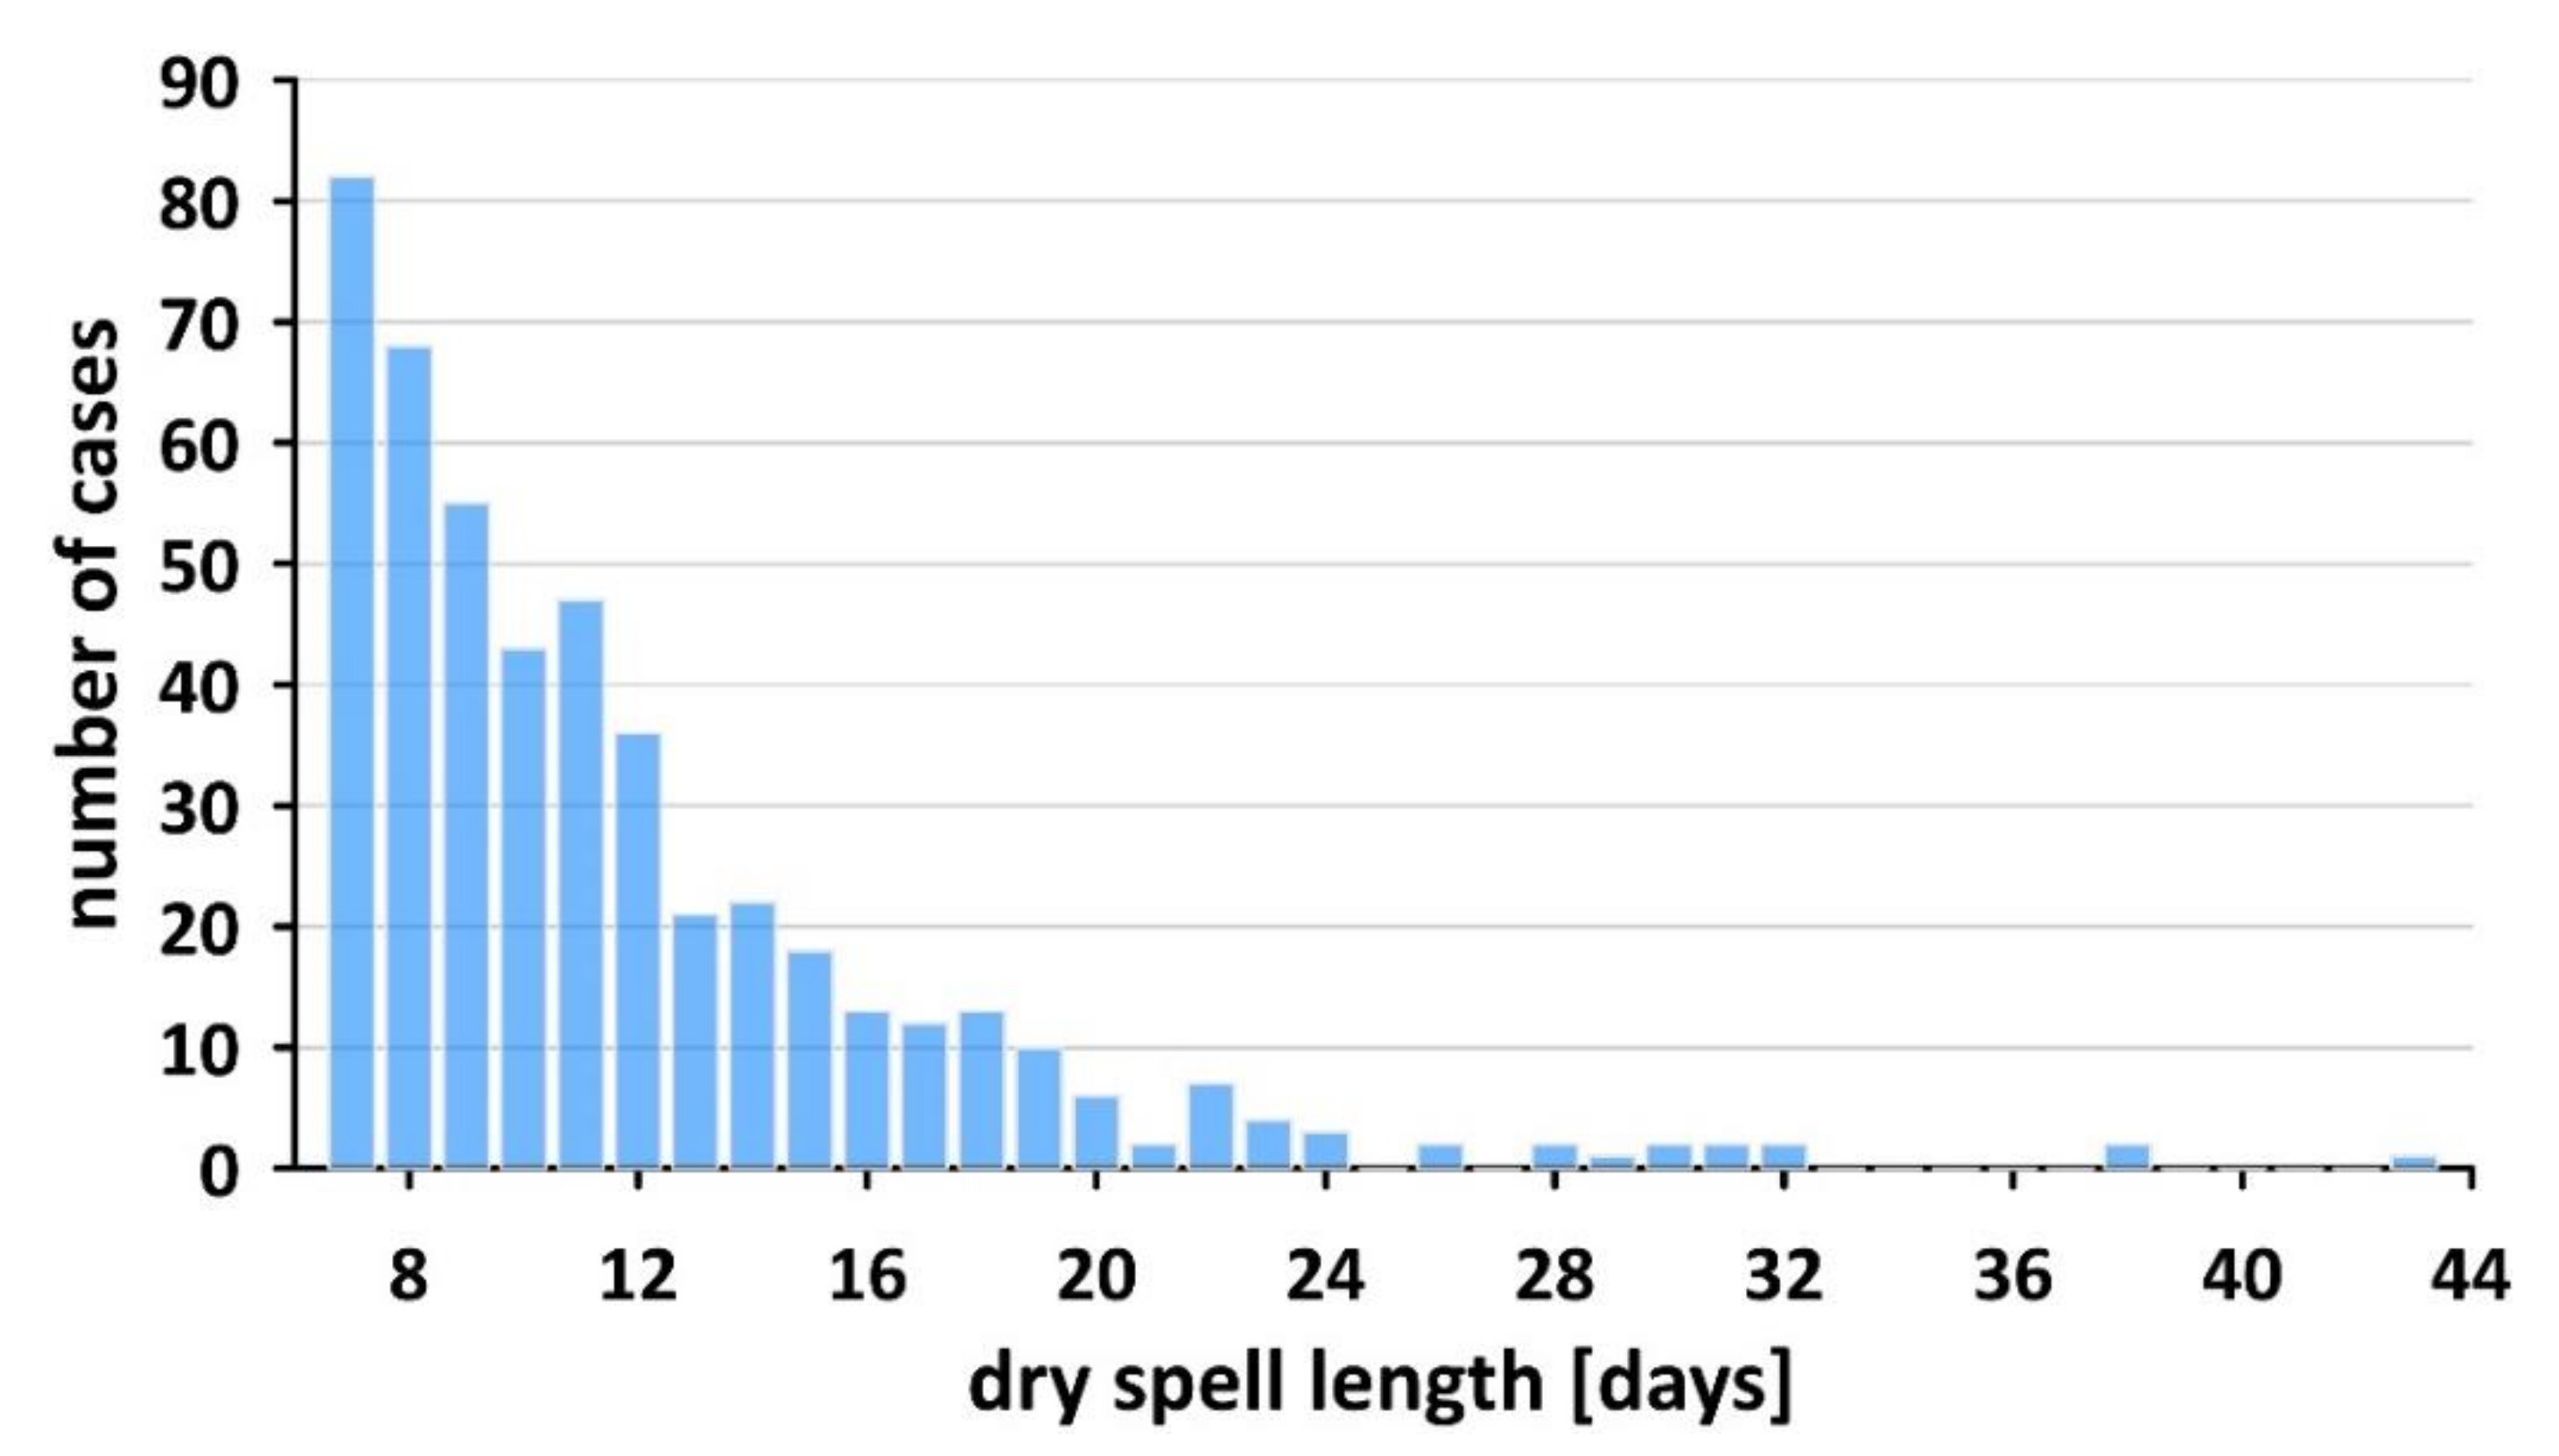
Based on adopted definition, 476 dry spells were distingushed in the analyzed period, on average 8.2 per year. There were a total of 5601 days in these spells, on average 96.5 per year. It means that dry spells cover more than 26% of all days. The distribution of spells depending on their duration is presented in
Figure 6, and the ten longest ones are summerized in
Table 1. The number of spells quickly decreases as their lenght increases.The longest spell lasted 43 days, the tenth spell lasted only 29 days. 36 spells lasted at least 20 days and 271 spells lasted at least 10 days.
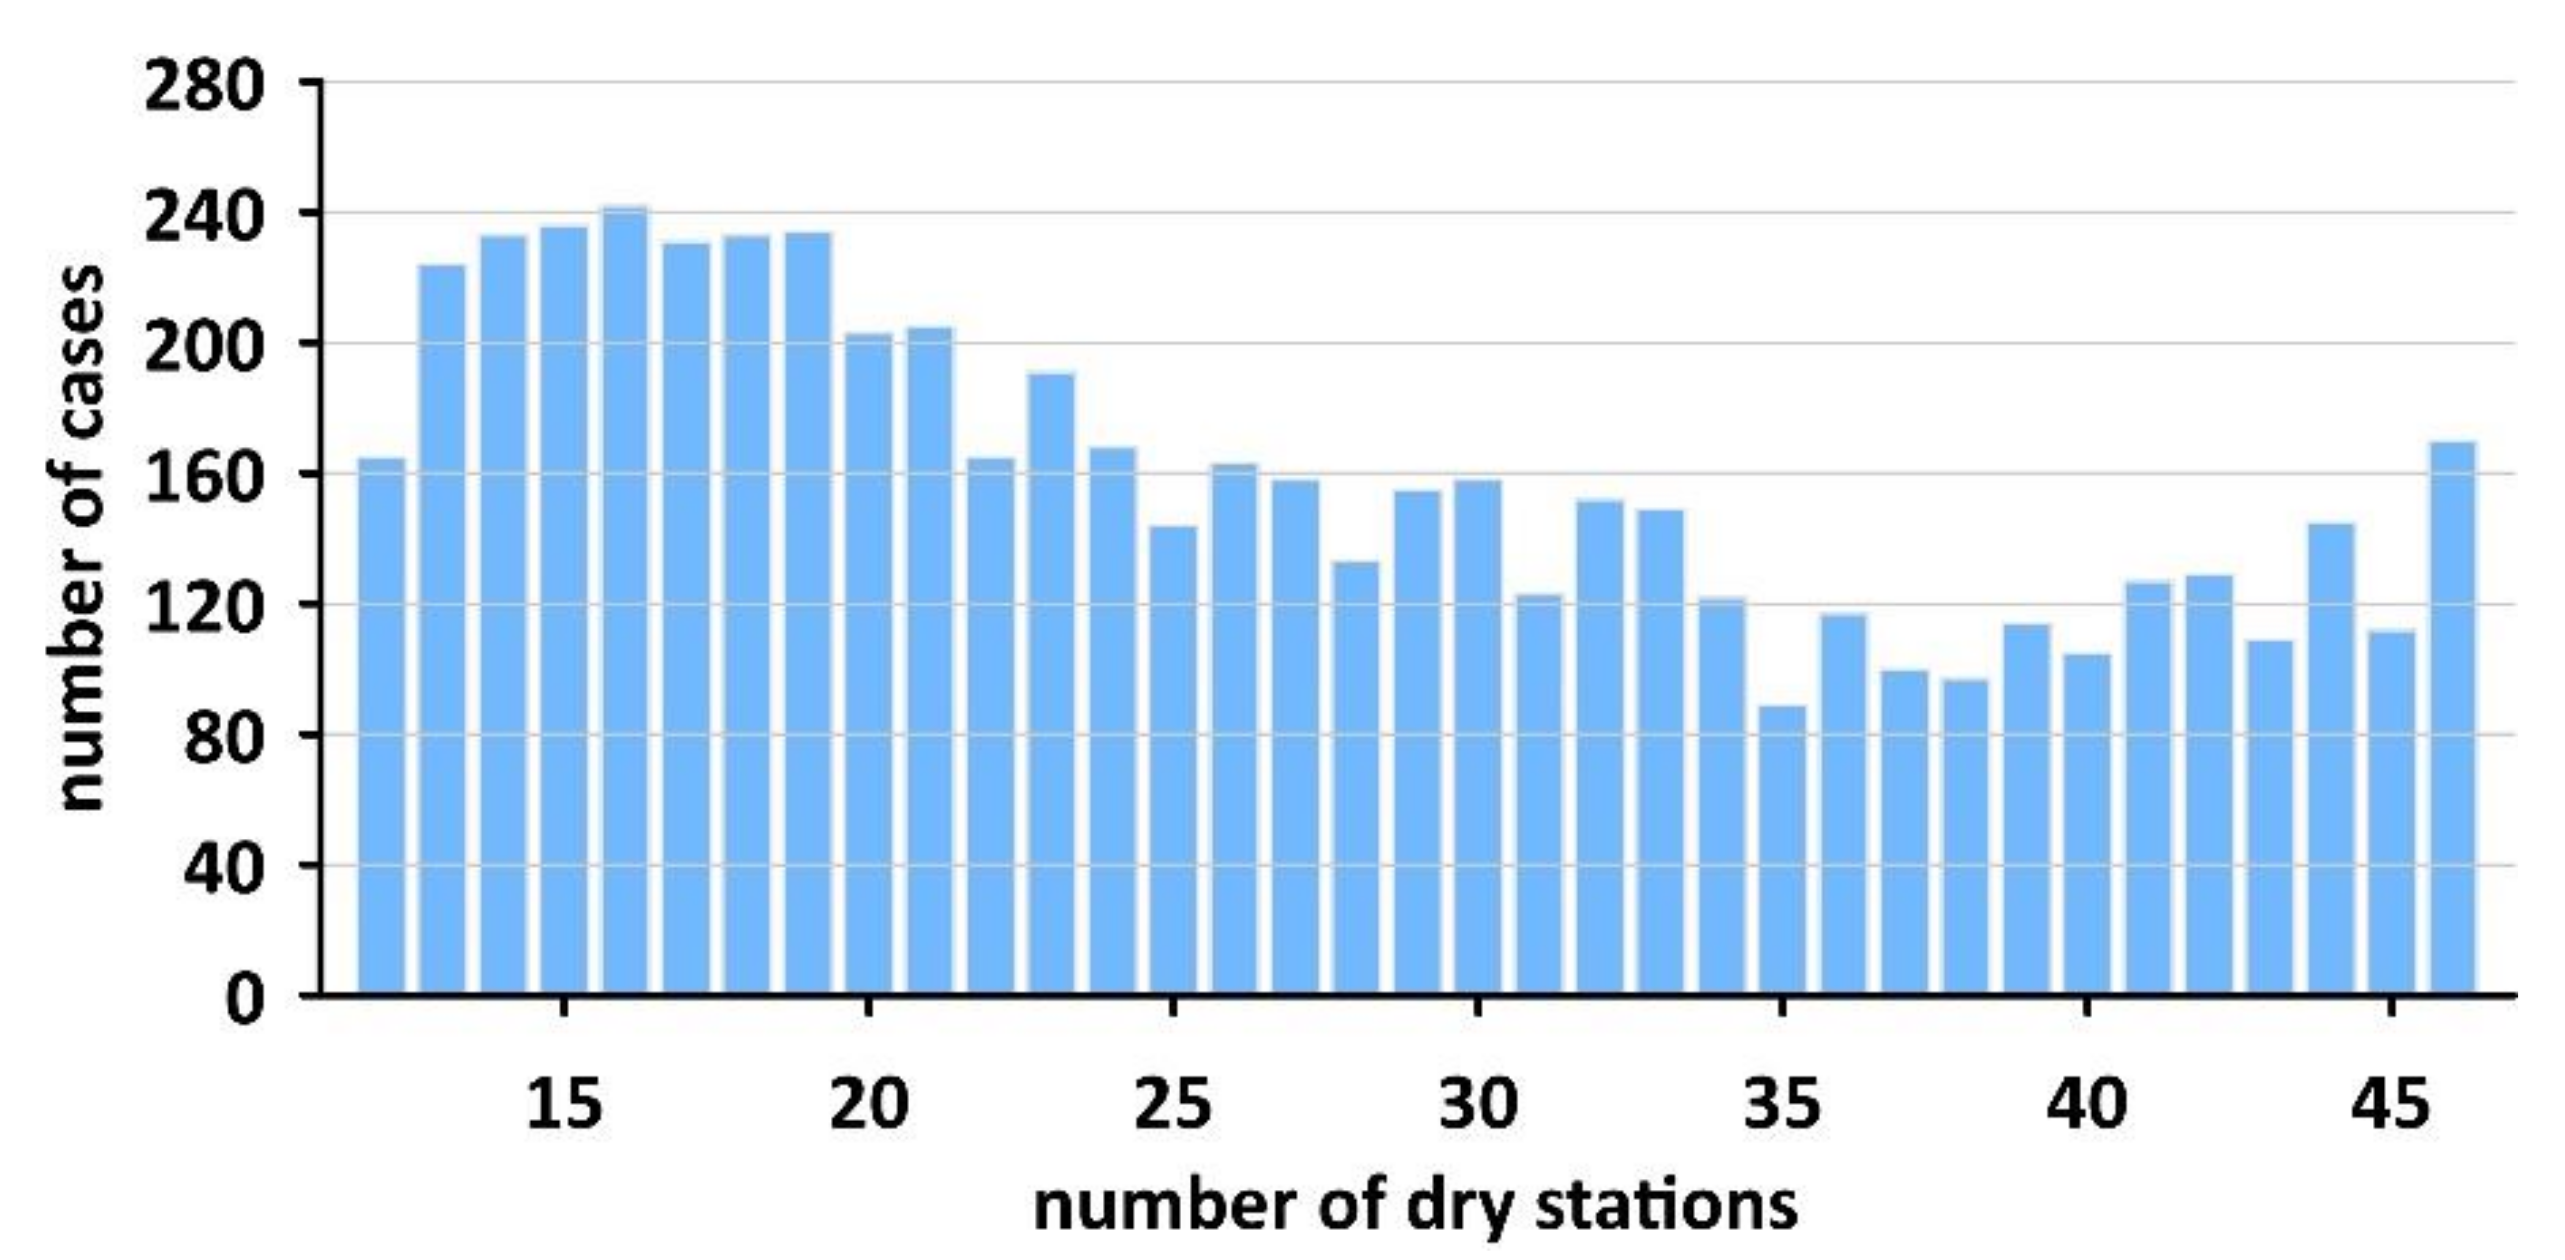
Among the ten longest spells only two occurred before 2000, and the remaining eight in the period 2000-2023. Moreover, 6 occurred in April, May or June, i.e., at the beginning and in first part of the growing season. The spatial extent of dry spells is measured by the number of stations where no rainfall was recorded. For each dry spell day the number of stations where no precipitation was recorded was calculated, and the results are shown in
Figure 7. No precipitation was recorded on 13 -19 stations on more than 200 days. In more than 150 days the lack of precipitation was observed at 12, 17-19, 26 and all 46 stations. In the remaining cases the number of days varied from 89 to 150.
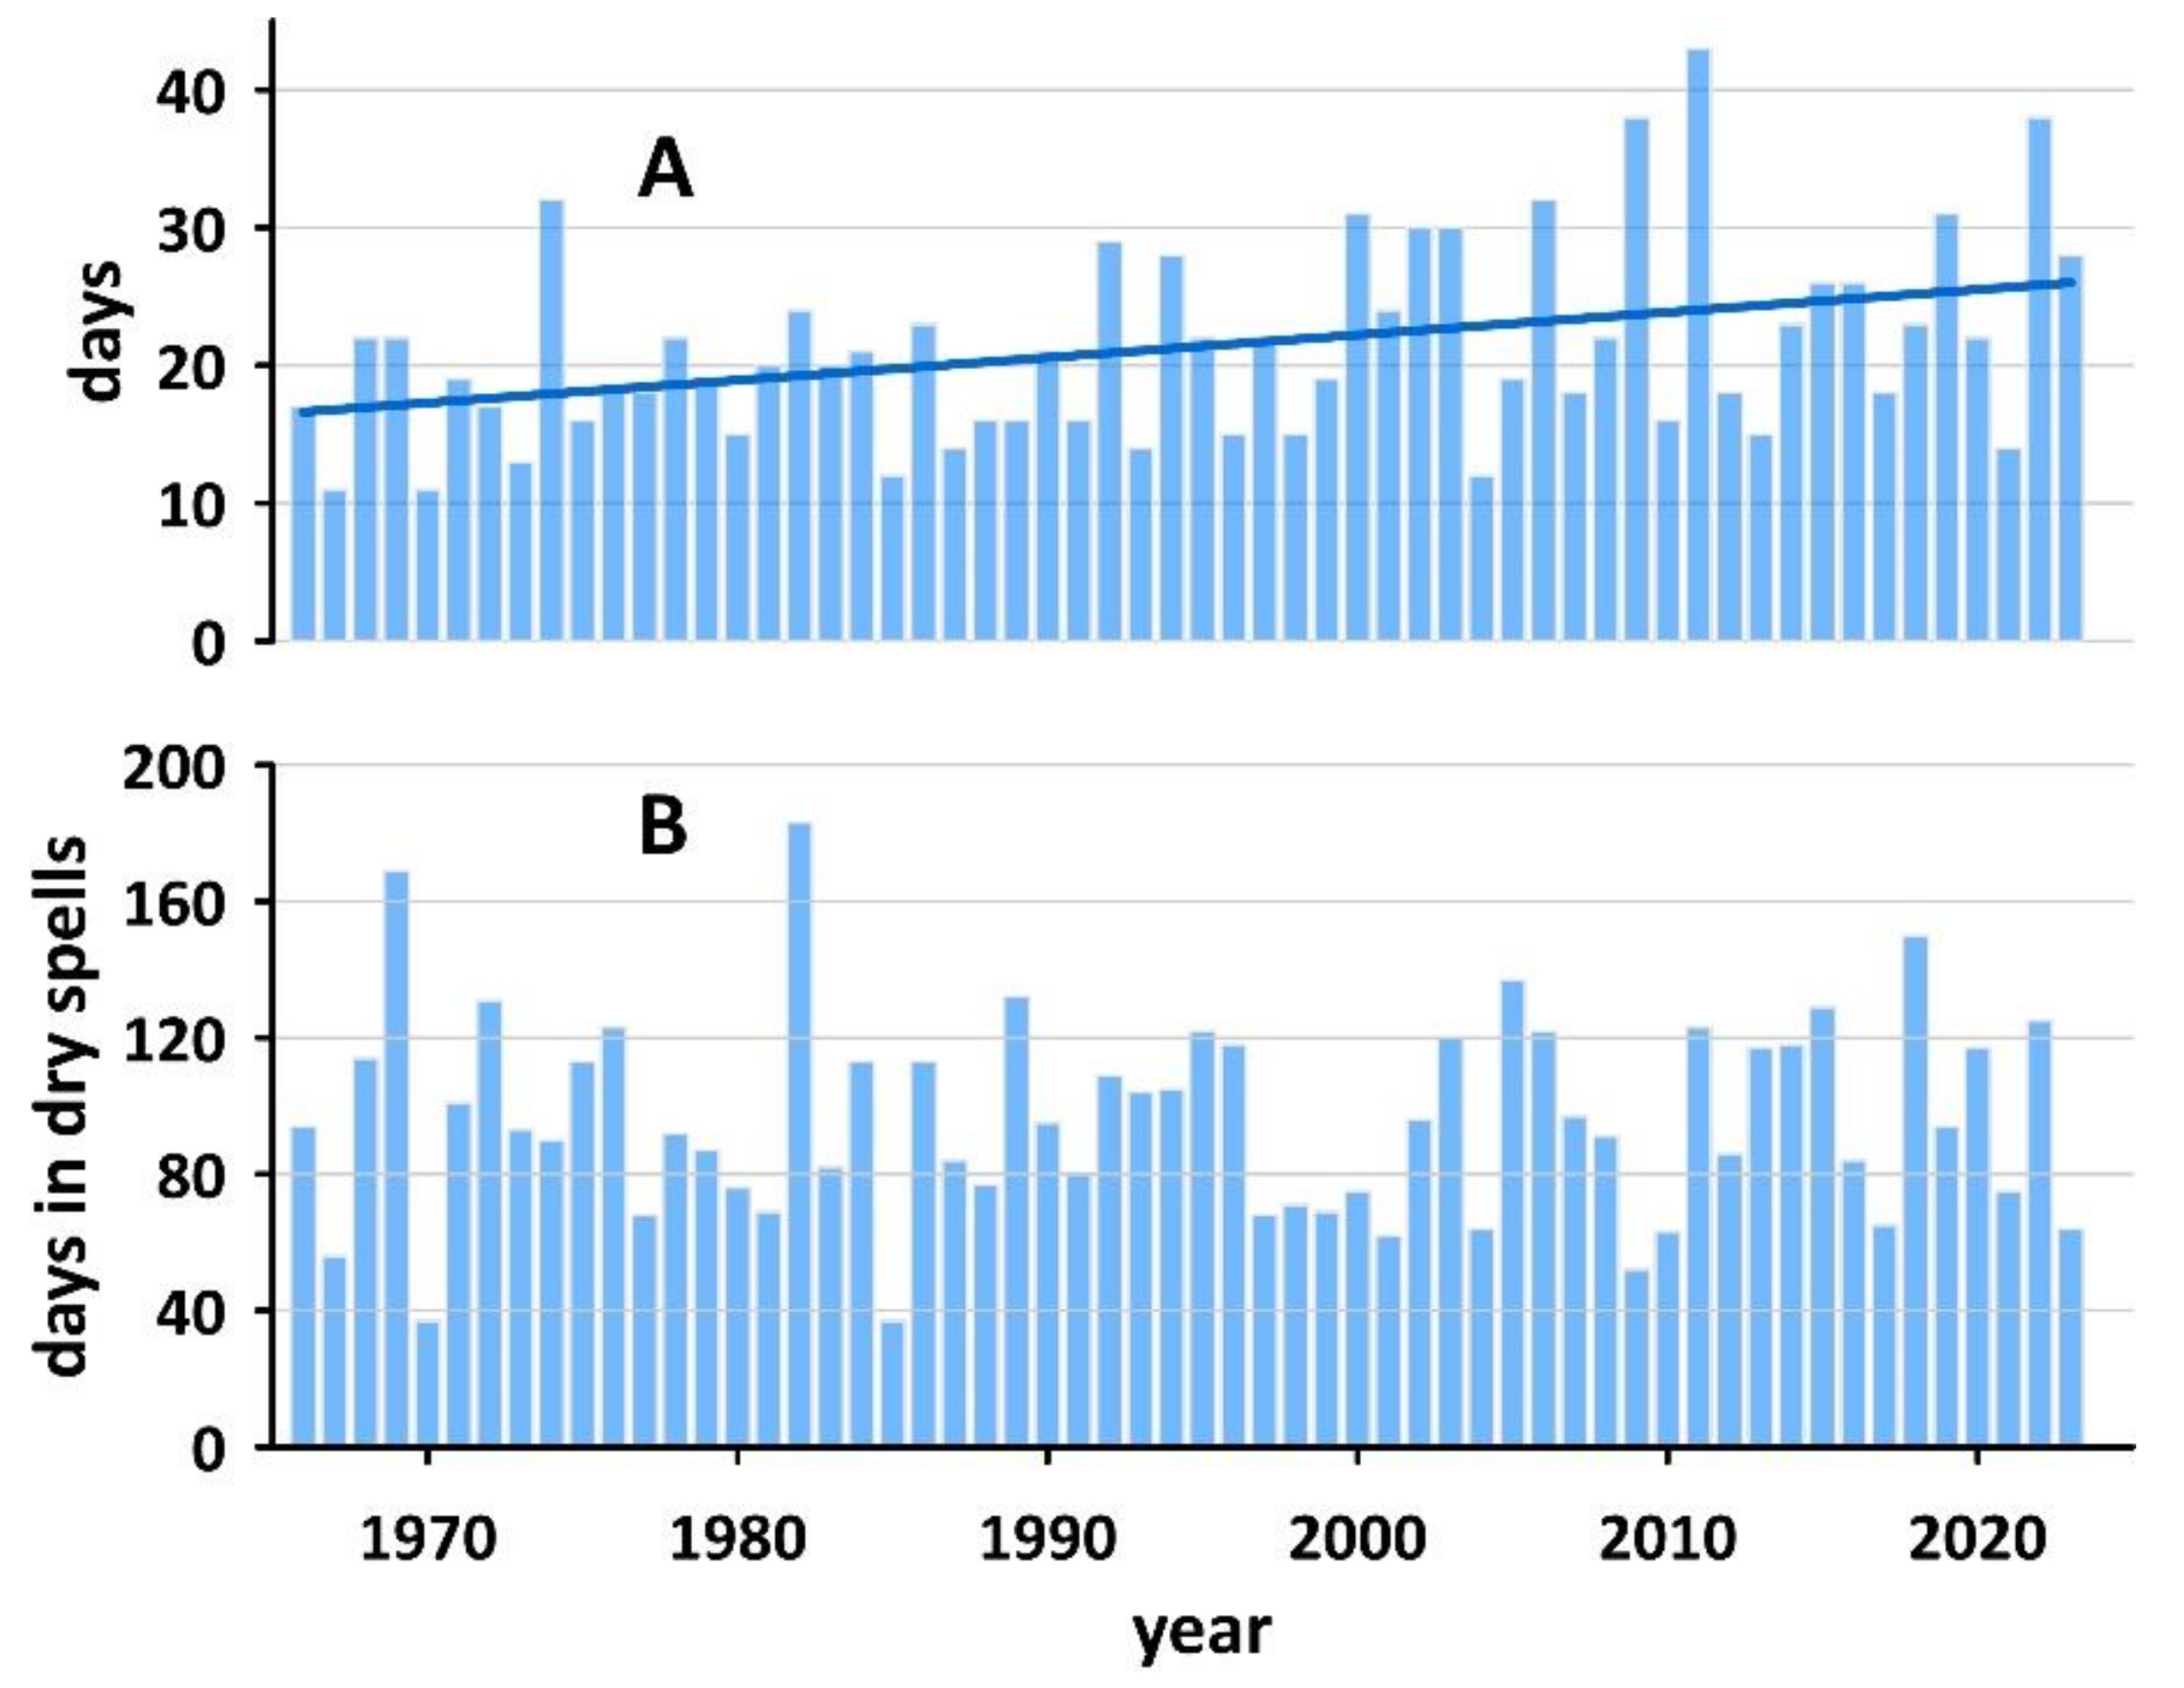
The longest dry spell in the year varies from 11 in 1967 and 1970 to 43 in 2011. Statistically significant increase was observed of 1.6 days per 10 year (
Figure 8A). The average annual number of dry spell days and varied widely from 37 in 1970 to 183 days in 1982. Fluctuations from year to year are high but there is no long-term trend (
Figure 8B).
3.4. Wet Days
In Poland there are significantly fewer days with precipitation 1 mm or higher (later called wet days) than dry days. There are on average 105 wet days, which is slightly less than 30% of all days. On individual stations this number ranges from 81 in Legnica to 128 in Gorzów. In the annual course the lowest number of wet days occurred in February and April—7.6 and the highest in July, about 10.2. The course of the average number of wet days in Poland in the period 1966-2023 is shown in
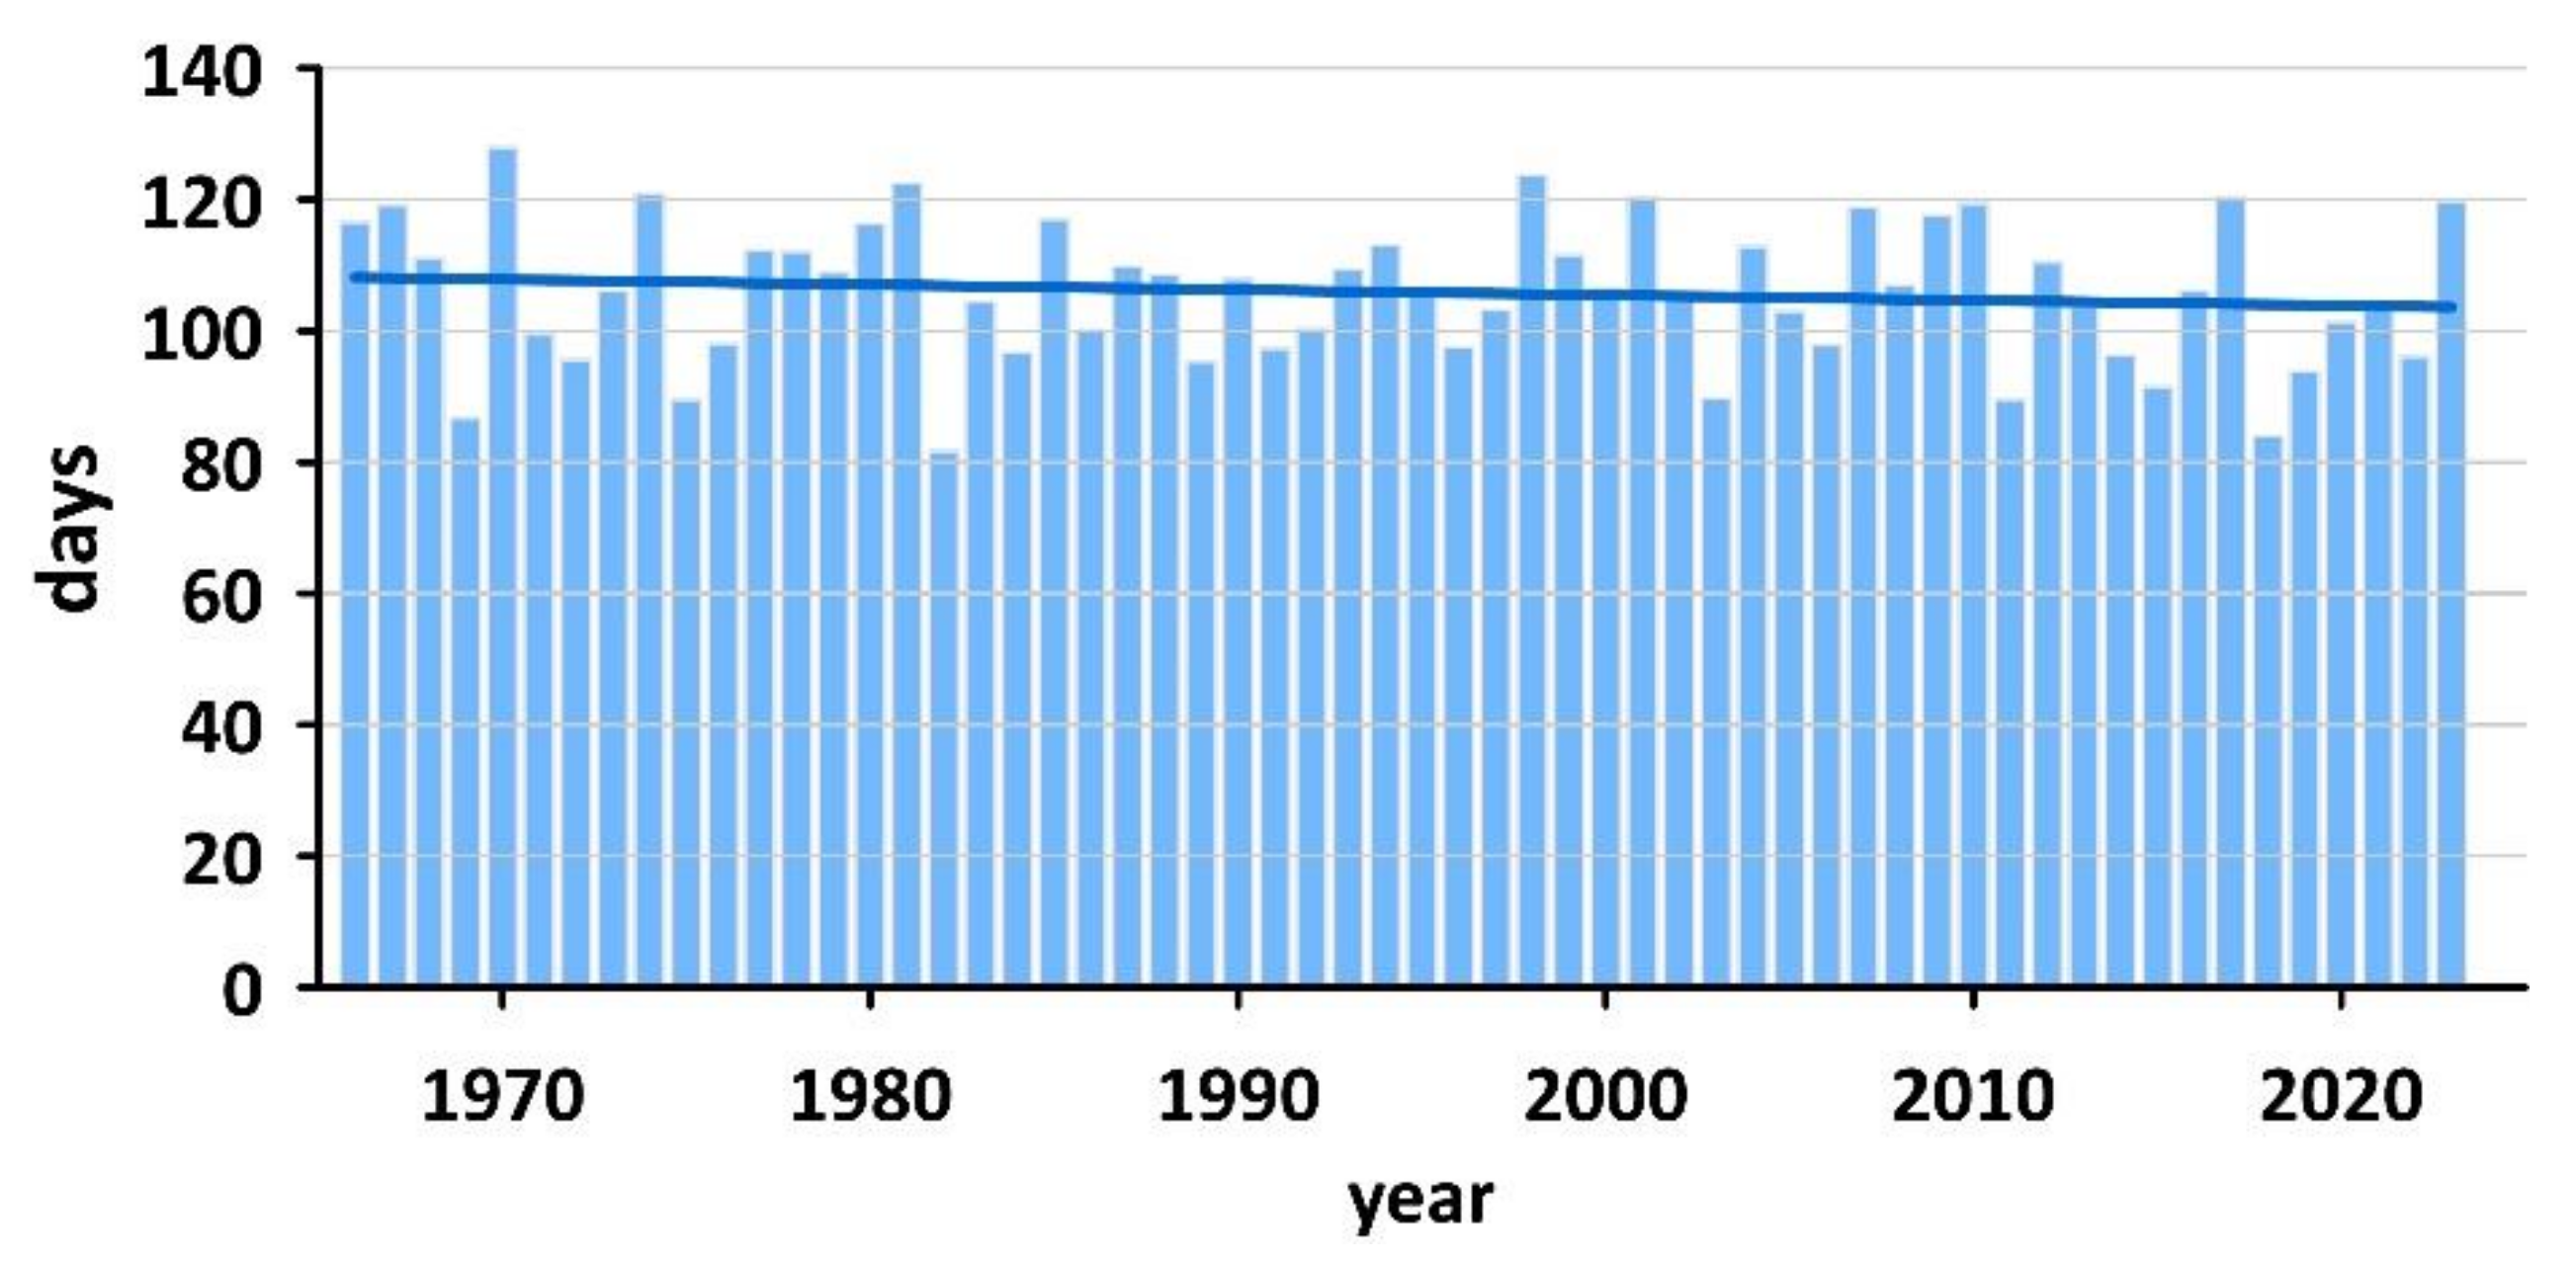
Figure 9. There is a large variability of such days from year to year. The smallest number of wet days occurred in 1982, when there were 81 such days. It was also a year with the highest number of days without precipitation. The most wet days were in 1970, when there were as many as 128 of them. The number od wet days decreased slightly in the analyzed period, but the change was not statistically significant.
3.5. Wet Spells
Based on adopted definition, 200 wet spells were distingushed in the analyzed period, on average less than 4 per year. There were a total of 1236 days in these spells, on average 21.3 per year. Even though the definitione of wet spells is much less demanding, there are definitely fewer of them. It means that wet spells cover less than 6% of all days. The distribution of spells depending on their duration is presented in
Figure 10, and the nine longest ones are summerized in
Table 2. The number of spells quickly decreases as their lenght increases.The longest spell lasted 14 days, the tenth spell lasted only 9 days. They are much shorter in comparison with dry spells.
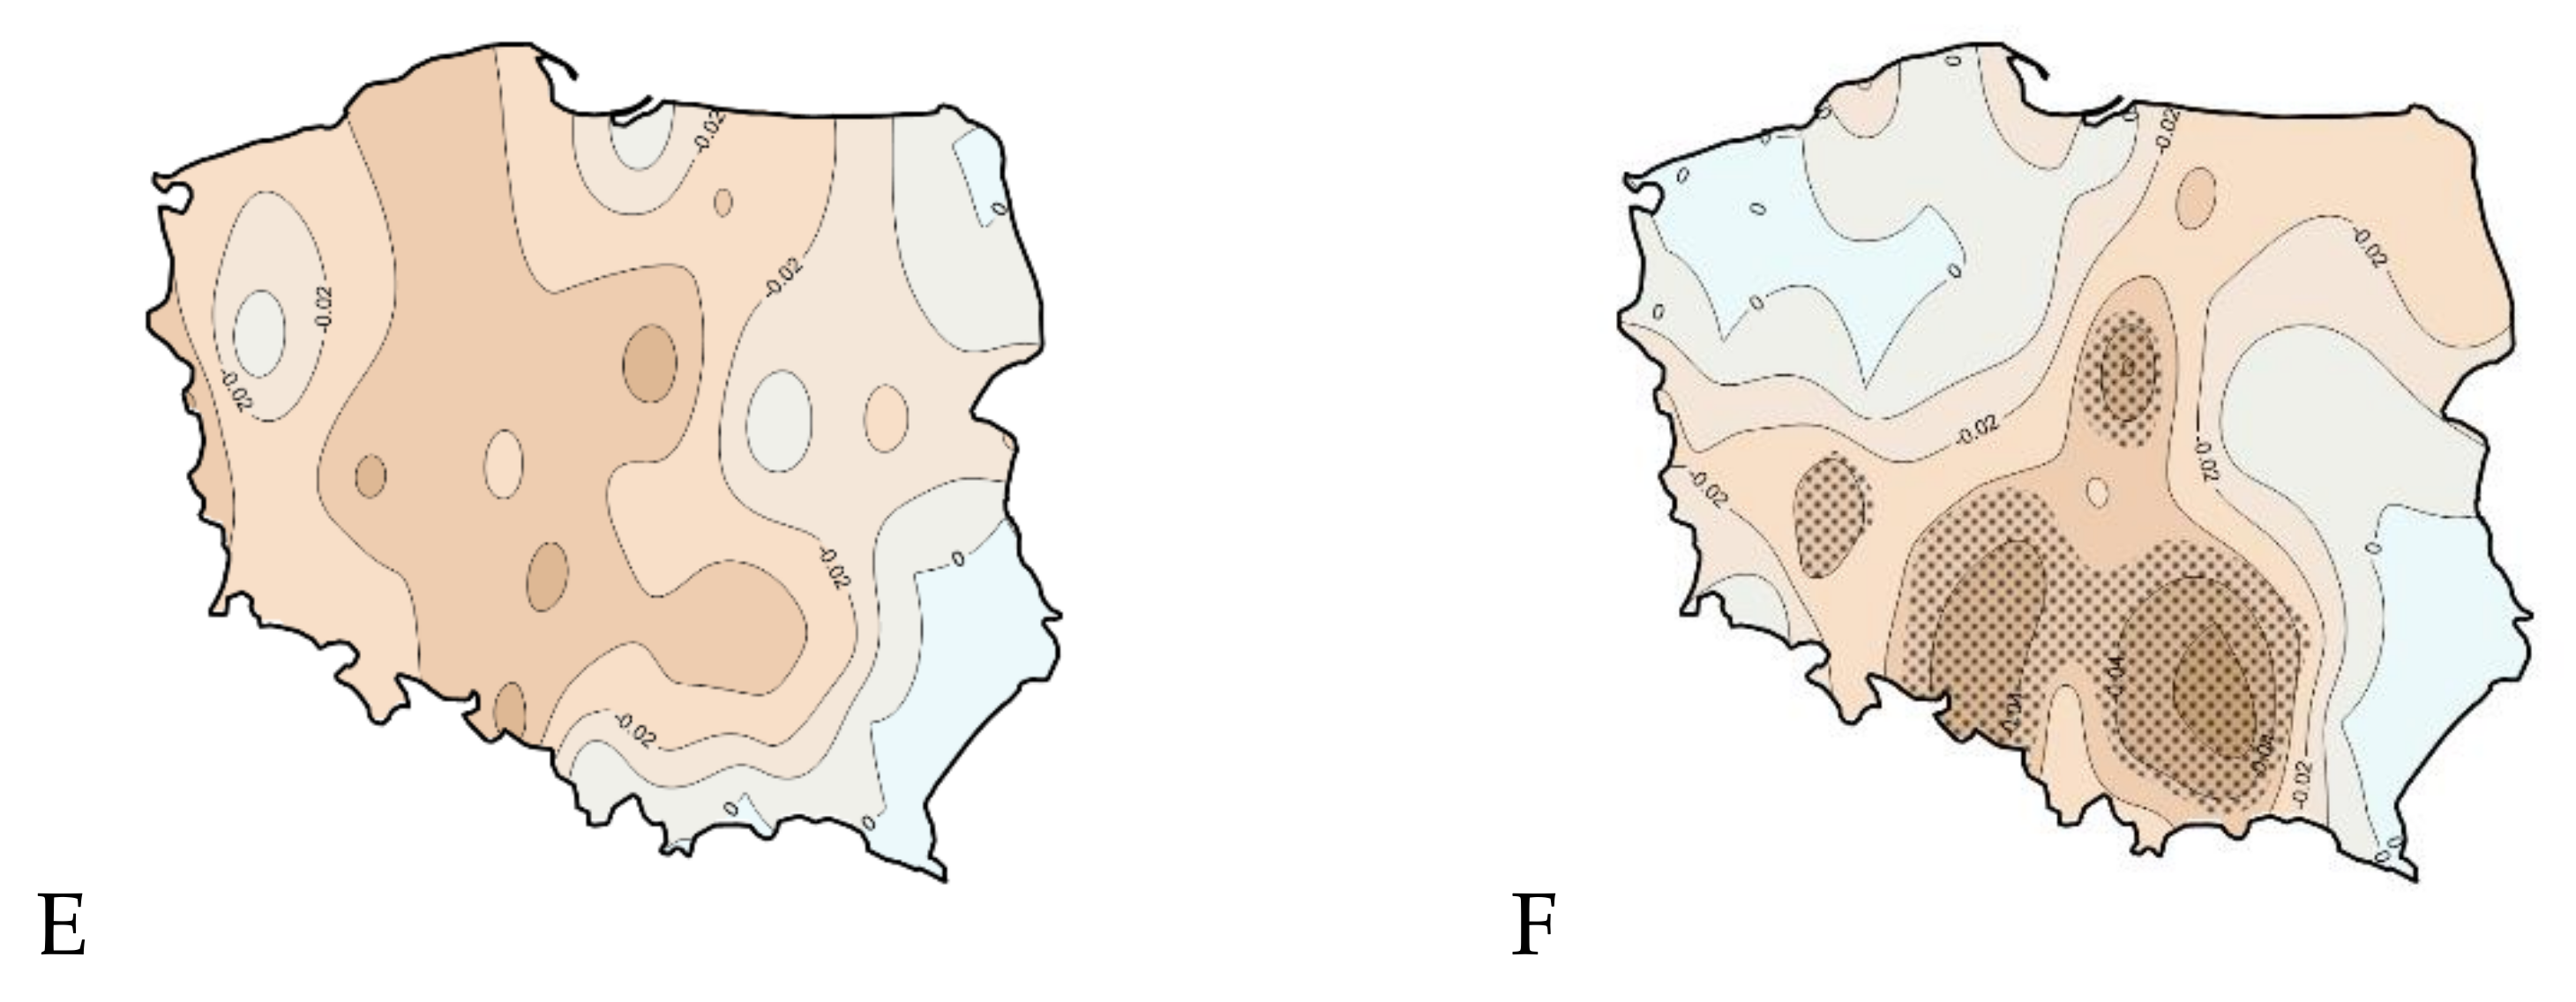
Figure 10.
Trends in the number of wet days in six selected months in Poland in the period 1966-2023: January (A), April (B), June (C), August (D), November (E) and December (F). Areas with statistical significant changes are dotted.
Figure 10.
Trends in the number of wet days in six selected months in Poland in the period 1966-2023: January (A), April (B), June (C), August (D), November (E) and December (F). Areas with statistical significant changes are dotted.
Figure 11.
The distribution of wet spells in relations to their lenght.
Figure 11.
The distribution of wet spells in relations to their lenght.
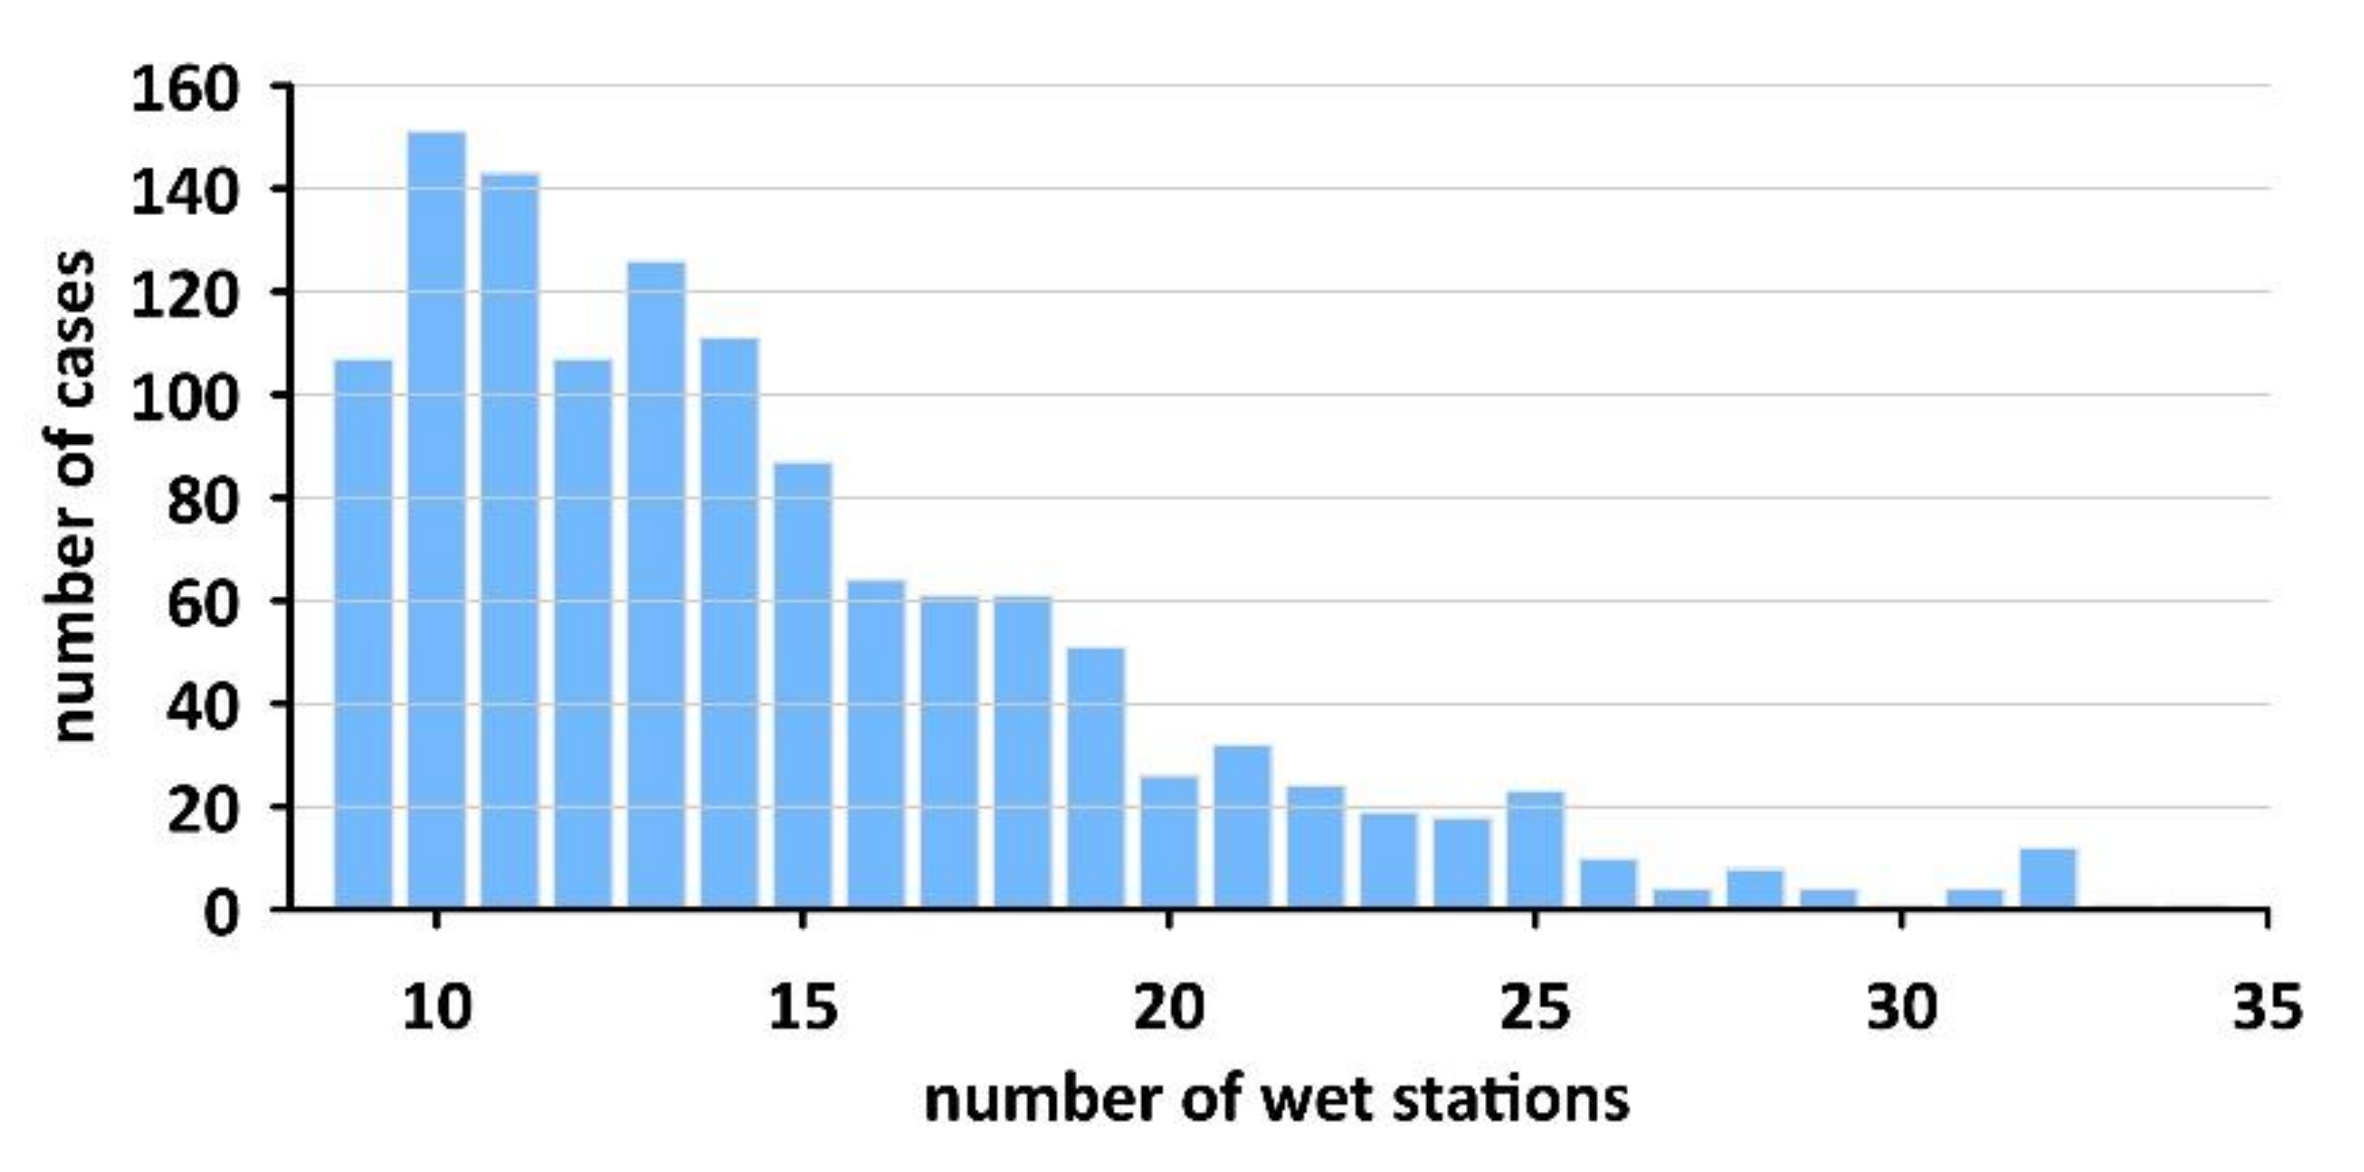
The nine longest spells occurred in the middle of analyzed period, between 1980 and 2014. Two of them happened in the same 1998 year. 5 occurred in Autumnu and early winter and only 3 during the growing season. During only three of the the total precipitattion was higher than 100 mm. The spatial extent of wet spells, measured by the number of stations where at least 1 mm of precipitation was observed is generaly lower than area cover by dry spells. The greatest reach of wet spells reached 34 stations out of 46, i.e., less than 74% of the country area. Only 86 spells cover more than a half of country, less than 2 wet spells per year.
Figure 12.
Number of wet spell days depending on the number of station where at least 1 mm of precipitation was recorded.
Figure 12.
Number of wet spell days depending on the number of station where at least 1 mm of precipitation was recorded.
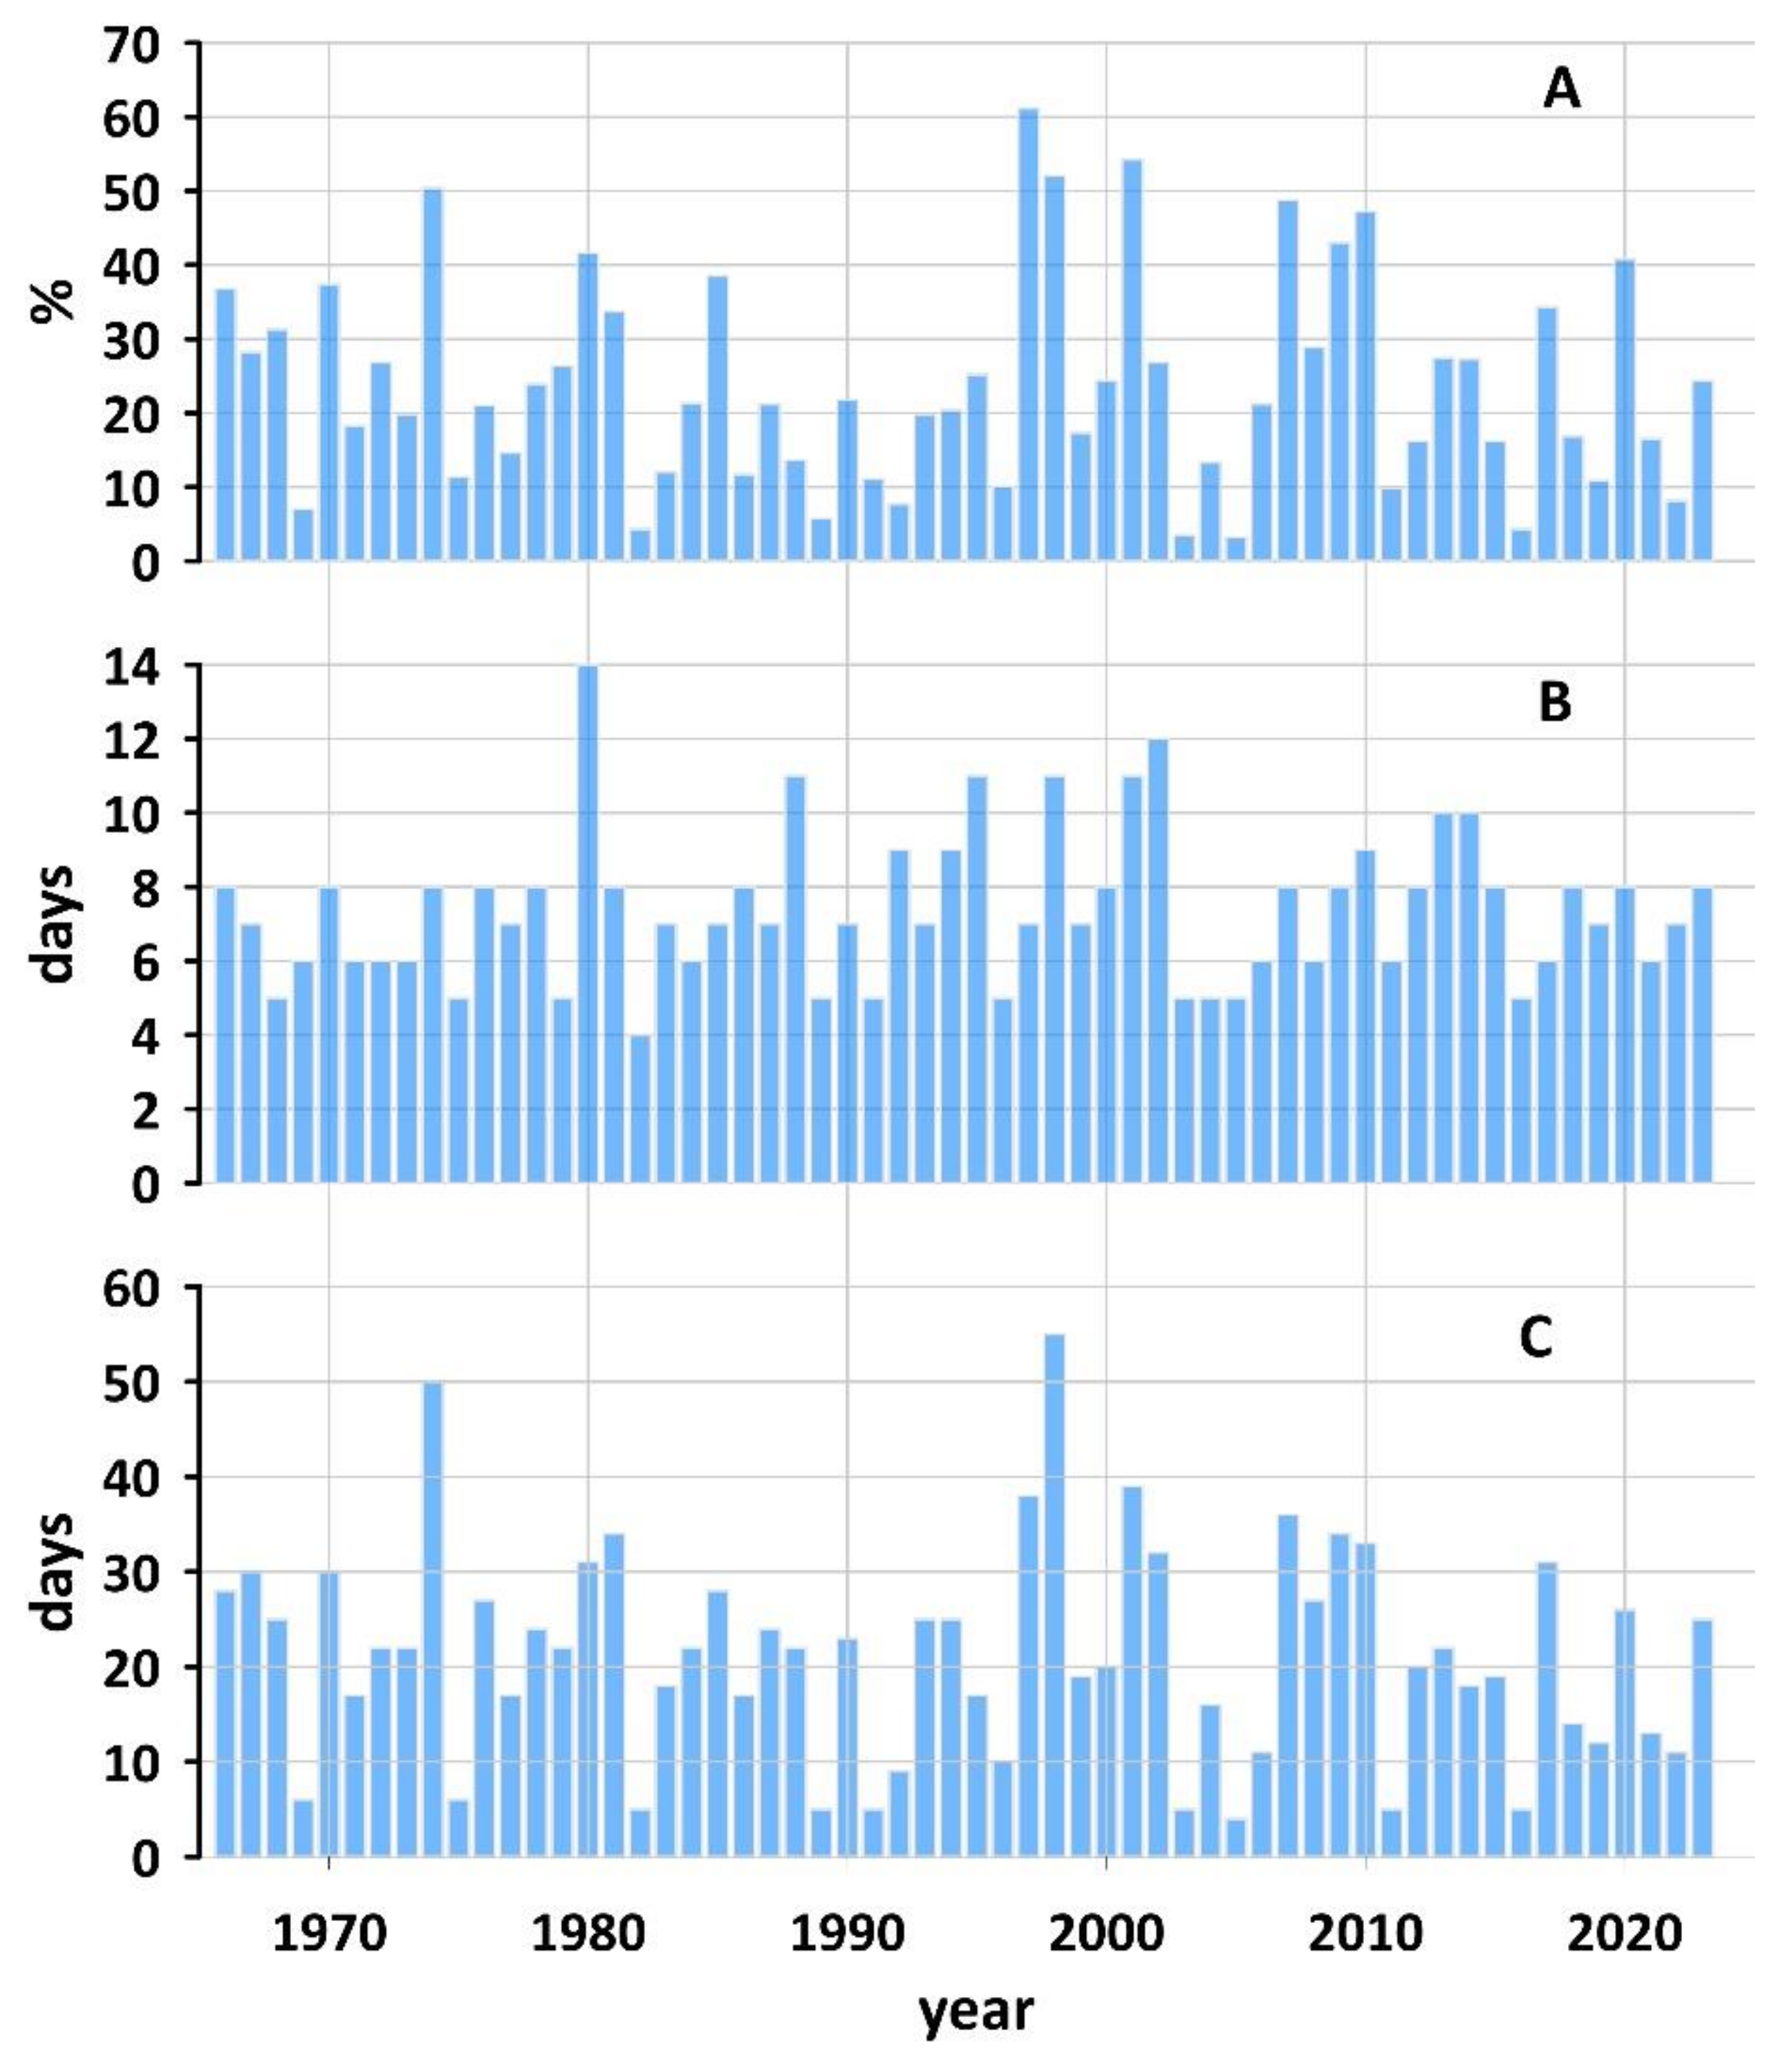
The longest wet spell in the year varied from 5 in nine years uniformly distributed in analyzed period to 14 in 1980 (
Figure 8B). The average annual number of wet spell days was 21.3 and varied widely from 4 in 2005 (the only wet spell started in the previous year) to 55 days in 1998, when two very long wet spells occurred. Fluctuations from year to year are very high but there is no long-term trend (
Figure 8C). The annual total precipitation in wet spells expressed as a percentage of average annual precipitation varied from a 3.2% in 2005 to more 61.2% in 1997, when there was extended flooding in Odra valley in western Poland (
Figure 13A). More than fifty percent of average annual precipitation in wet spells also occurred in 2001 (54.3%) and 1998 (52.0%).
3.6. Relation of Dry and Wet Spells with Atmospheric Circulation
The purpose of this chapter was to provide a preliminary analysis of what relationships can be expected. This is a kind of reconnaissance before undertaking detailed research. It was assumed that if a certain type of circulation favors the occurrence of dry or humid days, the effect should be visible in an area larger than the station’s surroundings, therefore average area rainfall sums and the frequency of dry and humid days were calculated. A wide range of circulation indices was selected that could affect precipitation rates in Poland. They were: the Atlantic Multidecadal Oscillation (AMO), the Greenland Blocking Index (GBI), the North Atlantic Oscillation (NAO), the East Atlantic pattern (EA), the Scandinavian pattern (SCAND), the East Atlantic / Western Russia pattern (EA/WR and the Arctic Oscillation (AO). Then, Pearson’s correlation coefficients were calculated.
Table 3,
Table 4 and
Table 5 contain only the values of statistically significant correlations with precipitation totals (
Table 3), dry day frequencies (
Table 4) and wet day frequencies (
Table 5).
AMO represents the temperature of the North Atlantic and has only an indirect impact by heating and humidifying the air masses flowing over Poland from the Atlantic. Its effect on precipitation and wet and dry day frequencies is probable only in February, probable because one significant result at level 5% in 12 attempts can happen by chance. There is a slightly greater probability that the EA type influences precipitation in early autumn. Type EA in the positive phase is characterized by the presence of a low pressure system over the North Atlantic (NA) and a high pressure wedge reaching from the Azores High area over Poland and further to the northeast. This increased pressure may promote lower precipitation, fewer wet days, and more dry days. GBI is associated with the presence of an anticyclone in Greenland, in Poland it favors a lower frequency of dry days in the warm season from May to September and, at the same time, to a slightly lesser extent, higher rainfall and a higher frequency of wet days. NAO and AO are associated with a slightly higher frequency of dry days in summer and autumn, at the same time with lower rainfall and a lower frequency of wet days. Type EA/WR in the positive phase is characterized by the presence of two low pressure systems, one over the North Atlantic (NA) and a second over western Russia. High pressure system is present in western and central Europe. This increased pressure may promote lower precipitation, fewer wet days, and more dry days. Scandinavian pattern in its positive phase is characterized by the presence of high pressure system over Scandinavia In cold season, from October to March with the except of December this type promote lower precipitation, fewer wet days, and more dry days.
On the other hand, looking at particular months, it is clear that precipitation in December is resistant to the influence of the studied circulation indices. In turn, at the turn of summer and autumn, in September and August, these influences tend to be most visible.
4. Discussion and Summary
The average annual precipitation total has not been changing considerably in Poland. It is well seen when comparing the average annual total in the period 1966-2023 from this paper (623 mm) with results of other authors and different periods: 633 mm in 1881-190 [
34], 605 in 1901-1980 [
35], 601 mm in 1891-1990 and 606 in 1951-1970 [
36], 590 mm in 1951-2000 [
37]. Similar results were observed in neighboring countries. In Germany Brienen et al. [
38] noticed that tendencies in precipitation in Germany over the twentieth century are variable and are very sensitive to the considered time period. It was shown that since 1950 annual precipitation increases in Northern Europe and decreases in part of Southern Europe [
39]. However, despite the lack of significant changes in annual rainfall totals, there are many studies indicating that changes in precipitation in Germany are season and even month specific [
40,
41]. Many authors point out that the seasonality of rainfall changes, winter rainfall increases and summer precipitation decreases [
34,
40,
42,
43].
Moving to monthly scale revealed that changes in individual seasons are not uniform. Winter begins in December , in which monthly precipitation totals increase in the north and slightly in the east , and decrease in the south and slightly in the west as well. The area of increase in the number of dry days covers almost all of Poland except the coast. This suggests that over a significant area, warming is associated with fewer days with precipitation, but higher daily totals. In January and February an increase in precipitation and the number of wet days is clearly seen with a decrease in the number of dry days, a trend which is usually attributed to the entire winter.
Of the three spring months, the strongest changes are observed in April, Precipitation is significantly decreasing in almost the entire country, in the north and west significantly, In the same regions, the number of dry days is increasing, the number of wet days is decreasing with less intensity, which would suggest a decrease in the abundance of precipitation, expressed by the average total per day with precipitation. In March, there is a clear an increase in dry days, and decrease in the number of wet days most strongly in the center and on the coast, While precipitation totals are lower only on the coast and in the centre, which is also likely due to changes in precipitation abundance. In May, on the other hand, no change in rainfall pattern is observed.
During the summer months, precipitation decreases in the south and increases in the north. A similar picture characterizes changes in the frequency of dry and wet days. Such north-south gradient of rainfall trends (wetter on the north/drier on the south) in midlatitudes in Europe was suggested by many authors [
39,
44]. In Poland it is observed only in summer.
Changes in the autumn months are also quite varied. September is drier in the north of the country, with more rainfall in the south. The number of wet days decreases significantly in the north and remains virtually unchanged in the south, while the number of dry days increases practically throughout the country, but most strongly in the north. Such an arrangement should also be associated with a change in rainfall abundance. In October, changes are relatively small. A slight increase in precipitation is observed in the south and west, as well as in the area of the Gulf of Gdansk at the mouth of the Vistula River. Consistent with this trend, changes occur in the frequencies of dry and wet days. Very strong changes are recorded in November, everywhere except in the southeastern parts of Poland precipitation decreases, and the number of dry days increases accordingly, and decreases wet and these changes are significant over a significant area. The turn of autumn and winter, November and December, until recently symbols of gloomy rainy weather, are now increasingly drier, with the weather until recently more typical of October. Rainy weather is observed more and more often in January. The above considerations suggest that the analysis of changes in abundance of precipitation could yield interesting results.
There is a large disproportion between the persistence and extent of dry and wet spells. In the case of dry spells, 7 days was assumed as the minimum duration and occurrence in at least 12 stations, i.e., over 25% of the country are. Dry spells covered 5601 days. i.e., 96.5 on average per year and over 26% of all days. If the same condition were adopted in the definition of wet spell, it would be possible to distinguish only a few of them, covering a total of 65 days, i.e., on average just over 1 per year. Therefore, the requirements were reduced to 5 days and 9 stations (20% of country area). Despite this, only 1236 days were included in the wet spells, i.e., 21.3 on average per year and less than 6% of all days. This result confirms that dry spells are related to the presence of high pressure systems over Poland, the persistence and spatial extent of which is usually longer than duration of cyclonic weather [
45]. The only significant long-term trend in series of different characteristics of dry and wet spells concerns the duration of the longest dry spell in the year. This result is consistent with the suggested increase in high pressure system persistence in Central Europe [
46].
Preliminary analysis of the impact of atmospheric circulation on the occurrence of dry and wet spells indicates high seasonal variability. In cold season, the Scandinavian type has the greatest influence, the presence of high pressure system over Scandinavia favors dry weather. In summer, precipitation and dry and wet spell occurrence are influenced by the NAO, AO, type EA and presence of high pressure system over Greenland. In spring and autumn, EA/WR type influences can be noticed. However, this topic requires more detailed analysis.
Funding
This research was funded by National Science Center (NC), grant number 2019/33/B/ST10/01136.
Data Availability Statement
Acknowledgments
In this section, you can acknowledge any support given which is not covered by the author contribution or funding sections. This may include administrative and technical support, or donations in kind (e.g., materials used for experiments).
Conflicts of Interest
The author declares no conflicts of interest.
References
- Klein Tank, A.M.G.; Können, G.P. Trends in indices of daily temperature and precipitation extremes in Europe, 1946–99. J. Clim. 2003, 16, 3665–3680. [Google Scholar]
- Zolina, O.; Simmer, C.; Kapala, A.; Gulev, S. On the robustness of the estimates of centennial-scale variability in heavy precipitation from station data over Europe. Geophys. Res. Lett. 2005, 32, L14707. [Google Scholar] [CrossRef]
- Zolina, O.; Simmer, C.; Belyaev, K.; Kapala, A.; Gulev, S.K. Improving estimates of heavy and extreme precipitation using daily records from European rain gauges. J. Hydrometeor. 2009, 10, 701–716. [Google Scholar] [CrossRef]
- Groisman, P.Ya.; and Coauthors. Changes in the probability of heavy precipitation: Important indicators of climatic change. Climatic Change 1999, 42, 243–283. [CrossRef]
- Łupikasza, E.B.; Haensel, S.; Matschullat, J. Regional and seasonal variability of extreme precipitation trends in southern Poland and central-eastern Germany 1951–2006. Int. J. Climatol. 2011, 31, 2249–2271. [Google Scholar] [CrossRef]
- Zolina, O.; Simmer, C.; Kapala, A.; Bachner, S.; Gulev, S.K.; Maechel, H. Seasonally dependent changes of precipitation extremes over Germany since 1950 from a very dense observational network. J. Geophys. Res. 2008, 113, D06110. [Google Scholar] [CrossRef]
- Schmidli, J.; Frei, C. Trends of heavy precipitation and wet and dry spells in Switzerland during the 20th century. Int. J. Climatol. 2005, 25, 753–771. [Google Scholar]
- Brunetti, M.; Maugeri, M.; Monti, F.; Nanni, T. Changes in daily precipitation frequency and distribution in Italy over the last 120 years. J. Geophys. Res. 2004, 109, D05102. [Google Scholar] [CrossRef]
- Ulbrich, U.; Brücher, T.; Fink, A.H.; Leckebusch, G.C.; Krüger, A.; Pinto, J.G. The central European floods of August 2002: Part 1—Rainfall periods and flood development. Weather 2003, 58, 371–377. [Google Scholar] [CrossRef]
- Zolina, O.; Simmer, C.; Belyaev, K.; Gulev, S.K.; Koltermann, P. Changes in the duration of European wet and dry spells during the last 60 years. J. Clim. 2013, 26, 2022–2047. [Google Scholar] [CrossRef]
- Breinl, K.; Di Baldassarre, G.; Mazzoleni, M.; Lun, D.; Vico, G. Extreme dry and wet spells face changes in their duration and timing. Environ. Res. Lett. 2020, 15, 074040. [Google Scholar] [CrossRef]
- Whitehead, P.G.; Wilby, R.L.; Battarbee, R.W.; Kernan, M.; Wade., A.J. A review of the potential impacts of climate change on surface water quality. Hydrol. Sci. J. 2009, 54, 101–123. [Google Scholar] [CrossRef]
- Mosley, L.M. Drought impacts on the water quality of freshwater systems; review and integration. Earth Sci. Rev. 2015, 40, 203–214. [Google Scholar] [CrossRef]
- Wibig, J. Dry spells and droughts in Poland, 1951-2006.Extended Abstracts, Ninth European Conf. on Applied Meteorology, 2009, Vol. 6, Toulouse, France, European Meteorological Society, EMS2009-141.
- Ye, H.C. Changes in duration of dry and wet spells associated with air temperatures in Russia. Environ. Res. Lett. 2018, 13, 034036. [Google Scholar] [CrossRef]
- Meehl, G., Stocker, T.F., Collins, W.D., Friedlingstein, P., Gaye, A.T., Gregory, J.M., Kitoh, A., Knutti, R., Murphy, J.M., Noda, A., et al. (2007) Global climate projections. In: Solomon, S., Qin, D., Manning, M., Chen, Z., Marquis, M., Averyt, K.B., Tignor, M. and Miller, H.L. (Eds.) Climate Change 2007: The Physical Science Basis. Contribution of Working Group I to the Fourth Assessment Report of the Intergovernmental Panel on Climate Change. Cambridge and New York, NY: Cambridge University Press.
- Ye, H.C. Changes in frequency of precipitation types associated with surface air temperature over northern Eurasia during 1936-1990. J. Clim. 2008, 21, 5807–5819. [Google Scholar] [CrossRef]
- Ye, H.C.; Fetzer, E.J.; Behrangi, A.; Wong, S.; Lambrigtsen, B.H.; Wang, C.Y.; Cohen, J.; Gamelin, B.L. Increasing daily precipitation intensity associated with warmer air temperatures over Northern Eurasia. J. Clim. 2016, 29, 623–636. [Google Scholar] [CrossRef]
- Lenderink, G.; van Meijgaard, E. Increase in hourly precipitation extremes beyond expectations from temperature changes. Nat. Geosci. 2008, 1, 511–514. [Google Scholar] [CrossRef]
- Wibig, J.; Piotrowski, P. Impact of the air temperature and atmospheric circulation on extreme precipitation in Poland. Int. J. Climatol 2018, 38, 4533–4549. [Google Scholar] [CrossRef]
- Groisman, P.Ya.; Knight, R.W. Prolonged Dry Episodes over Conterminous United States: New Tendencies Emerging during the last 40 Years. J. Clim. 2008, 21, 1850–1862. [CrossRef]
- McCabe, G.J.; Legates, D.R.; Lins, H.F. Variability and trends in dry day frequency and dry event length in the southwestern United States. J. Geophys. Res. Atmos. 2010, 115, D07108. [Google Scholar] [CrossRef]
- Llano, M.P.; Penalba, O.C. A climatic analysis of dry sequences in Argentina. Int. J. Climatol. 2011, 4, 504–513. [Google Scholar] [CrossRef]
- Paton, E. Intermittency analysis of dry spell magnitude and timing using different spell definitions. J. Hydrol. 2022, 608, 127645. [Google Scholar] [CrossRef]
- Kuśmierek-Tomaszewska, R.; Żarski, J. Assessment of Meteorological and Agricultural Drought Occurrence in Central Poland in 1961–2020 as an Element of the Climatic Risk to Crop Production. Agriculture. 2021, 11, 855. [Google Scholar] [CrossRef]
- Araźny, A.; Bartczak, A.; Maszewski, R.; Krzemiński, M. The influence of atmospheric circulation on the occurrence of dry and wet periods in Central Poland in 1954-2018. Theor. Appl. Clim. 2021, 146, 1079–1095. [Google Scholar] [CrossRef]
- Hanna, E.; Cropper, T.E.; Hall, R.J.; Cappelen., J. Greenland Blocking Index 1851-2015: A regional climate change signal. Int. J. Climatol. 2016, 36, 4861. [Google Scholar] [CrossRef]
- Enfield, D.B.; Mestas-Nunez, A.M.; Trimble, P.J. The Atlantic Multidecadal Oscillation and its relationship to rainfall and river flows in the continental U.S. Geophys. Res. Lett. 2001, 28, 2077–2080. [Google Scholar] [CrossRef]
- Barnston, A.G.; Livezey, R.E. Classification, Seasonality and Persistence of Low-Frequency Atmospheric Circulation Patterns. Mon. Wea. Rev. 1987, 115, 1083–1126. [Google Scholar] [CrossRef]
- Sen, P.K. Estimates of the regression coefficient based on Kendall’s tau. JASA 1968, 63, 1379–1389. [Google Scholar] [CrossRef]
- Theil, H. A rank-invariant method of linear and polynomial regression analysis. In: Henri Theil’s contributions to economics and econometrics, Advanved Studies in Theoretical and Applied Econometrics, Vol 23 (eds) Raj, B.; Koerts, J. Springer, Dordrecht. 1992, 345–381.
- Mann, H.B. Nonparametric tests against trend. Econometrica 1945, 13, 245–259. [Google Scholar] [CrossRef]
- Lanzante, J.R. Resistant, robust and non-parametric techniques for the analysis of climate data: Theory and examples, including applications to historical radiosonde station data. Int. J. Climatol. 1996, 16, 1197–1226. [Google Scholar] [CrossRef]
- Łupikasza, E.; Małarzewski, Ł. Precipitation Change. In: Climate Change in Poland: Past, Present, Future. Ed. Falarz, M., Springer Climate, 2021, 349-373.
- Kożuchowski, K. Zmienność opadów atmosferycznych w Polsce w stuleciu 1881-1980. Acta Geogr. Lodz. 1985, 48, 158. [Google Scholar]
- Zawora, T.; Janur, E.; Olszańska, A.; Skowera, B. Porównanie norm opadów atmosferycznych na obszarze Polski. [Comparison of precipitation norms in Poland]. Ann. UMCS Sect. B 2000/2001, 40/41, 391–398. [Google Scholar]
- Kożuchowski, K.; Żmudzka, E. 100-year series of areally averaged temperatures and precipitation totals in Poland. Acta Univ Wratisl 2542, Studia Geogr. 2003, 75, 116–122. [Google Scholar]
- Brienen, S.; Kapala, A.; Māchel, H.; Simmer, C. Regional centennial precipitation variability over Germany from extended observation records. Int J Climatol. 2013, 33, 2167–2184. [Google Scholar] [CrossRef]
- Kovats, R.S., Valentini, R., Bouwer, L.M., Georgopoulou, E., Jacob, D., Martin, E., Rounsevell, M., Soussana, J.-F. Europe. In: Barros, V.R., Field, C.B., et al., Eds.; Climate Change 2014: Impacts, Adaptation, and Vulnerability. Part B: Regional Aspects. 2014, Contribution of Working Group II to the Fifth Assessment Report of the IPCC. Cambridge University Press, Cambridge, United Kingdom and New York, NY, USA, 1267–1326.
- Degirmendžić, J.; Kożuchowski, K.; Żmudzka, E. Changes of air temperature and precipitation in Poland in the period 1951–2000 and their relationship to atmospheric circulation. Int J Climatol. 2004, 24, 291–310. [Google Scholar] [CrossRef]
- Murawski, A.; Zimmer, J.; Merz, B. High spatial and temporal organization of changes in precipitation over Germany for 1951–2006. Int J Climatol. 2016, 36, 2582–2597. [Google Scholar] [CrossRef]
- Pińskwar, I.; Choryński, A.; Graczyk, D.; Kundzewicz, Z.W. Observed changes in precipitation totals in Poland. Geografie 2019, 124, 237–264. [Google Scholar] [CrossRef]
- Szwed, I. Variability of precipitation in Poland under climate change. Theor Appl Climatol. 2019, 135, 1003–1015. [Google Scholar] [CrossRef]
- Becker, A., Finger, P., Meyer-Christoffer, A., Rudolf, B., Schamm, K., Schneider, U., Ziese, M. A description of the global land-surface precipitation data products of the Global Precipitation Climatology Centre with sample applications including centennial (trend) analysis from 1901–present. Earth Syst. Sci. Data. 2013, 5, 71–99.
- Araźny, A., Bartczak, A.; Maszewski, R.; Krzemiński, M. The influence of atmospheric circulation on the occurrence of dry and wet periods in Central Poland in 1954-2018. Theor. Appl. Clim. 2021, 146, 1079–1095. [CrossRef]
- Kyselý, J.; Domonokos, P. Recent increase in persistence of atmospheric circulation over Europe: Comparison with long-term variations since 1881. Int. J. Climatol. 2006, 26, 461–483. [Google Scholar] [CrossRef]
Figure 1.
Location of meteorological stations.
Figure 1.
Location of meteorological stations.
Figure 2.
Average annual precipitation totals in Poland in the period 1966-2023 (A) and their long-term trends (A). Areas with statistically significant trend are dotted.
Figure 2.
Average annual precipitation totals in Poland in the period 1966-2023 (A) and their long-term trends (A). Areas with statistically significant trend are dotted.
Figure 3.
Average monthly precipitation sums and their trends in the period 1966-2023, AB—January, CD—April, EF- July, GH—October. The eareas of statistically significant trends are dotted.
Figure 3.
Average monthly precipitation sums and their trends in the period 1966-2023, AB—January, CD—April, EF- July, GH—October. The eareas of statistically significant trends are dotted.
Figure 4.
The annual numbers of dry days averaged on the area of Poland in the period 1966-2023 with the linear trend line.
Figure 4.
The annual numbers of dry days averaged on the area of Poland in the period 1966-2023 with the linear trend line.
Figure 5.
Trends in the number of dry days in six selected months in Poland in the period 1966-2023: January (A), April (B), June (C), August (D), November (E) and December (F). Areas with statistical significant changes are dotted.
Figure 5.
Trends in the number of dry days in six selected months in Poland in the period 1966-2023: January (A), April (B), June (C), August (D), November (E) and December (F). Areas with statistical significant changes are dotted.
Figure 6.
The distribution of dry spells in relations to their lenght.
Figure 6.
The distribution of dry spells in relations to their lenght.
Figure 7.
Number of dry spell days depending on the number of station where no precipitation was recorded.
Figure 7.
Number of dry spell days depending on the number of station where no precipitation was recorded.
Figure 8.
The lenght of the longest spell in the year (A) and annual number of dry spell days (B).
Figure 8.
The lenght of the longest spell in the year (A) and annual number of dry spell days (B).
Figure 9.
The annual numbers of wet days averaged on the area of Poland in the period 1966-2023 with the linear trend line.
Figure 9.
The annual numbers of wet days averaged on the area of Poland in the period 1966-2023 with the linear trend line.
Figure 13.
The total precipitation in wet spells expressed as a percentage of average annual precipitation (A), lenght of the longest spell in the year (B) and annual number of wet spell days (C).
Figure 13.
The total precipitation in wet spells expressed as a percentage of average annual precipitation (A), lenght of the longest spell in the year (B) and annual number of wet spell days (C).
Table 1.
Ten the longest dry spells in Poland.
Table 1.
Ten the longest dry spells in Poland.
| Number |
Begin |
End |
Length in days |
| 1 |
21.10.2011 |
2.12.2011 |
43 |
| 2 |
29.03.2009 |
5.05.2009 |
38 |
| 3 |
24.02.2022 |
2.04.2022 |
38 |
| 4 |
19.03.1974 |
19.04.1974 |
32 |
| 5 |
28.06.2006 |
29.07.2006 |
32 |
| 6 |
17.04.2000 |
17.05.2000 |
31 |
| 7 |
28.03.2019 |
27.04.2019 |
31 |
| 8 |
15.08.2002 |
13.09.2002 |
30 |
| 9 |
7.02.2003 |
8.03.2003 |
30 |
| 10 |
12.05.1992 |
9.06.1992 |
29 |
Table 2.
Nine the longest wet spells in Poland.
Table 2.
Nine the longest wet spells in Poland.
| Number |
Begin |
End |
Length in days |
Precipitation in mm |
| 1 |
29.06.1980 |
12.7.1980 |
14 |
121 |
| 2 |
19.10.2002 |
30.10.2002 |
12 |
60 |
| 3 |
4.12.1988 |
14.12.1988 |
11 |
43 |
| 4 |
26.08.1995 |
5.09.1995 |
11 |
128 |
| 5 |
25.10.1998 |
4.11.1998 |
11 |
60 |
| 6 |
7.09.2001 |
17.09.2001 |
11 |
87 |
| 7 |
28.02.1998 |
9.03.1998 |
10 |
38 |
| 8 |
27.05.2013 |
5.06.2013 |
10 |
91 |
| 9 |
8.05.2014 |
17.05.2014 |
10 |
117 |
Table 3.
Corelation coefficients between monthly precipitation totals averaged over all stations in Poland and selected circulation indices. Only statistically significant correlation values are reported.
Table 3.
Corelation coefficients between monthly precipitation totals averaged over all stations in Poland and selected circulation indices. Only statistically significant correlation values are reported.
| Month |
AMO |
GBI |
NAO |
EA |
SCAND |
EA/WR |
AO |
| Jan. |
- |
- |
- |
- |
-0.50 |
- |
- |
| Feb. |
0.35 |
- |
- |
- |
-0.54 |
- |
- |
| Mar. |
- |
- |
- |
- |
-0.36 |
- |
- |
| Apr. |
- |
- |
- |
- |
- |
-0.36 |
- |
| May |
- |
- |
- |
- |
- |
-0.31 |
- |
| Jun. |
- |
- |
- |
- |
- |
- |
- |
| Jul. |
- |
- |
- |
- |
0.41 |
-0.29 |
- |
| Aug. |
- |
0.35 |
-0.31 |
- |
- |
- |
-0.35 |
| Sep. |
- |
0.27 |
-0.28 |
-0.35 |
- |
- |
-0.59 |
| Oct. |
- |
- |
- |
-0.25 |
- |
- |
-0.36 |
| Nov. |
- |
- |
-0.41 |
- |
-0.30 |
-0.39 |
- |
| Dec. |
- |
- |
- |
- |
- |
- |
- |
Table 4.
Corelation coefficients between monthly dry day frequencies averaged over all stations in Poland and selected circulation indices. Only statistically significant correlation values are reported.
Table 4.
Corelation coefficients between monthly dry day frequencies averaged over all stations in Poland and selected circulation indices. Only statistically significant correlation values are reported.
| Month |
AMO |
GBI |
NAO |
EA |
SCAND |
EA/WR |
AO |
| Jan. |
- |
- |
- |
- |
0.60 |
- |
- |
| Feb. |
- |
- |
- |
- |
0.49 |
- |
- |
| Mar. |
- |
- |
- |
- |
0.30 |
0.28 |
- |
| Apr. |
- |
- |
- |
- |
- |
0.44 |
- |
| May |
- |
-0.25 |
- |
- |
- |
- |
- |
| Jun. |
- |
-0.29 |
0.40 |
- |
- |
- |
0.35 |
| Jul. |
- |
-0.27 |
0.37 |
- |
|
0.29 |
- |
| Aug. |
- |
-0.37 |
0.41 |
- |
- |
- |
0.29 |
| Sep. |
- |
-0.26 |
0.28 |
0.48 |
- |
- |
0.49 |
| Oct. |
- |
- |
- |
- |
0.53 |
|
0.26 |
| Nov. |
- |
- |
0.34 |
- |
-0.30 |
0.46 |
- |
| Dec. |
- |
- |
- |
- |
- |
- |
- |
| |
|
|
|
|
|
|
|
Table 5.
Corelation coefficients between monthly wet day frequencies averaged over all stations in Poland and selected circulation indices. Only statistically significant correlation values are reported.
Table 5.
Corelation coefficients between monthly wet day frequencies averaged over all stations in Poland and selected circulation indices. Only statistically significant correlation values are reported.
| Month |
AMO |
GBI |
NAO |
EA |
SCAND |
EA/WR |
AO |
| Jan. |
- |
- |
- |
- |
-0.53 |
- |
- |
| Feb. |
0.28 |
- |
- |
- |
-0.58 |
- |
- |
| Mar. |
- |
- |
- |
- |
-0.38 |
- |
- |
| Apr. |
- |
- |
- |
- |
- |
-0.41 |
- |
| May |
- |
- |
- |
- |
- |
- |
- |
| Jun. |
- |
0.28 |
-0.39 |
- |
- |
- |
-0.34 |
| Jul. |
- |
- |
-0.34 |
- |
|
-0.28 |
- |
| Aug. |
- |
0.35 |
-0.38 |
- |
- |
- |
-0.28 |
| Sep. |
- |
0.25 |
-0.26 |
-0.46 |
- |
- |
-0.54 |
| Oct. |
- |
- |
- |
- |
-0.31 |
- |
-0.29 |
| Nov. |
- |
- |
-0.37 |
- |
-0.46 |
-0.41 |
- |
| Dec. |
- |
- |
- |
- |
- |
- |
- |
| |
|
|
|
|
|
|
|
|
Disclaimer/Publisher’s Note: The statements, opinions and data contained in all publications are solely those of the individual author(s) and contributor(s) and not of MDPI and/or the editor(s). MDPI and/or the editor(s) disclaim responsibility for any injury to people or property resulting from any ideas, methods, instructions or products referred to in the content. |
© 2024 by the author. Licensee MDPI, Basel, Switzerland. This article is an open access article distributed under the terms and conditions of the Creative Commons Attribution (CC BY) license (http://creativecommons.org/licenses/by/4.0/).
