Preprint
Article

Spatial Development and Coupling Coordination of Society-Physics-Informational Smart City:A Case Study on Thirty Capitals in China

Altmetrics

Downloads

95

Views

46

Comments

0

A peer-reviewed article of this preprint also exists.

This version is not peer-reviewed

Submitted:

17 April 2024

Posted:

17 April 2024

You are already at the latest version

Alerts
Abstract
Smart City has emerged as the mainstream paradigm for urban governance innovation, sustainable development, and strategy upgrades, which is drawing attention from scholars worldwide. However, current frameworks for Smart City assessment remain incomplete and simplistic. In is paper, 30 national or provincial capitals in China were selected and we designed a tri-dimensional SPI model—Social, Physical, and Information Space—for smart city spatial development assessment. Utilizing methods such as entropy weighting, coupled coordination degree models, and the Dagum Gini coefficient, this study assesses the spatial development and coupled coordination of 30 cities from 2011 to 2019. Finally, by means of BP neural networks, the study examines the contribution of each indicator to the spatial coupled coordination. The results indicated that with a narrowing disparity in development speeds among different regions, the spatial coupled coordination development level of smart capitals in China has steadily increased, presenting a pattern of staggered distribution. Moreover, the IS subsystem plays the most significant role in coupled coordination. The significance of this research lies in its tri-dimensional spatial perspective of the spatial development and coupled coordination differences of the Smart City, providing evidence-based support for the regional layout and optimization in China.
Keywords: 
Subject: Social Sciences  -   Geography, Planning and Development

1. Introduction

Since the 21st century, as the process of modernization has accelerated worldwide, the economic, social, and spatial structures of major cities have become unprecedentedly complex [1]. A series of urban diseases, such as population expansion, uneven resource distribution, and ecological degradation caused by urban sprawl, have become increasingly prominent. To address these challenges and promote sustainable urban development, a series of emerging concepts such as digital cities, smart cities, low-carbon cities, resilient cities, and knowledge cities have emerged. Among them, smart cities, due to their ability to effectively perceive and diagnose urban problems, have distinct advantages in resilience building[2], security risk governance [3,4], ecological environment protection[5], and sustainable development. They are regarded as a set of technological solutions for "comprehensive transformation, all-round empowerment, and revolutionary reshaping" of urban governance. Consequently, governments worldwide have attached great importance to and put into practice the concept of smart cities[6].
The concept of smart cities first appeared at the International Conference on Smart Communities in San Francisco in 1990. After IBM clearly proposed the concept in 2008, it sparked a global trend of smart city construction. Many developed countries and regions such as the United States, the European Union, Japan, and Singapore have regarded the smartification of cities as the mainstream of future urban development, actively exploring innovative models of smart urban governance and digital technology. However, with the deepening of smart city construction, the concerns and risks arising from the complexity of smart city governance have gradually emerged[7]. Especially under the influence of a construction concept dominated by technological empowerment in the long term, problems such as digital marginalization, worsening digital inequality, misuse of citizen data, and violations of privacy[8] and security have emerged, to a certain extent, revealing the inefficiency, disorder, and imbalance of smart city space.
Against this backdrop, it is increasingly recognized that scientifically effective evaluation schemes are crucial for promoting the sustainable development of smart cities. Therefore, various smart city evaluation tools, frameworks, and indicator sets have been developed and designed[9]. On the one hand, academia systematically interprets the development direction, value positioning, and strategic choices of smart cities in theory, providing a theoretical basis for the design of smart city evaluation systems. This mainly involves the theoretical framework of smart city construction[10,11], governance innovation models[12,13], technological empowerment paths[14,15], and project planning decisions[16]. At the same time, it pays special attention to the practical difficulties[17,18], security risks[19], and opportunities and challenges[20] in the process of smart city construction. On the other hand, the industry, starting from a practical orientation, guides its construction direction by formulating norms and standard systems for smart cities. For example, in May 2023, the State Administration for Market Regulation issued the "New Smart City Evaluation Indicators," covering nine indicators including benefiting the people's services, precise governance, ecological livability, information infrastructure, information resources, industrial development, information security, innovative development, and citizen experience. Similarly, foreign countries have also issued a series of indicator systems, such as the Smart Sustainable City Development Index (SSCDI)[21] based on social, economic, environmental, cultural, and living dimensions and the European Smart City Evaluation System based on smart economy, smart public, smart governance, smart mobility, smart environment, and smart living dimensions. At the same time, academia has proposed risk management frameworks emphasizing security[22], NIST privacy frameworks[23], and information security risk assessment indicator systems[24].
Overall, the smart research community formed by academia and the industry provides rich thinking and insights for promoting the sustainable development of smart cities. However, it is easy to find that the existing evaluation indicator systems are still in a "systematic fragmentation" state. That is, although most evaluation indicator systems comprehensively assess the development of smart cities from a systemic perspective, the designed indicator systems lack clear theoretical foundations and fail to form a clear structural logic, resulting in evaluation results that can be explained in terms of systematicity and comprehensiveness but lack sufficient evidence in terms of structure and correlation. This provides a certain space for this study to explore the development of smart cities from a spatial integration perspective.
This study adopts the theoretical perspective of tri-dimensional space to examine the structural composition of smart cities. By constructing a spatially integrated evaluation indicator system for smart city development and using a modified coupled coordination model to evaluate the coupling coordination characteristics of smart cities in 30 provincial capitals and municipalities in China, and through the Dagum Gini coefficient decomposition method to analyze the differentiation of coupling coordination in different regions of China, the study explores the spatiotemporal evolution characteristics of smart city development in China, thus providing new empirical insights for the smart city research community.

2. Materials and Modeling

2.1. Study Area

In this study, we selected 30 national or provincial capitals as cases to analyze and evaluate their urban spatial coupling development level, and divided them into four regions according to their orientation: east, northeast, central and west (Figure 1). These cities are the core forces in the development of smart cities in various regions of China, and meanwhile ideal representatives for our research.

2.2. Literature Review and Modeling

Urban spatial analysis has always been a crucial topic of interest and a key paradigm followed by scholars. Starting from the 1920s, the Chicago School, represented by Georg Simmel, integrated spatial research with sociology, pioneering a new paradigm in urban studies[25]. Entering the 21st century, the upgrading innovation of emerging information technology has propelled the expansion and evolution of human living space forms, gradually transitioning from binary space to tri-dimensional space. Specifically, the transition from the past "physical-social" binary space to the coexistence of physical space, social space, and information space forms the new tri-dimensional space, leading to the evolution of new spatial theories.
From the perspective of smart city construction, it is inherently a process of spatial production and reconstruction. Understanding the construction and governance effects of smart cities cannot be separated from the analysis of urban space and its elements. In simple terms, the level of smart city construction is largely determined by the multiple spatial structures and their elements.
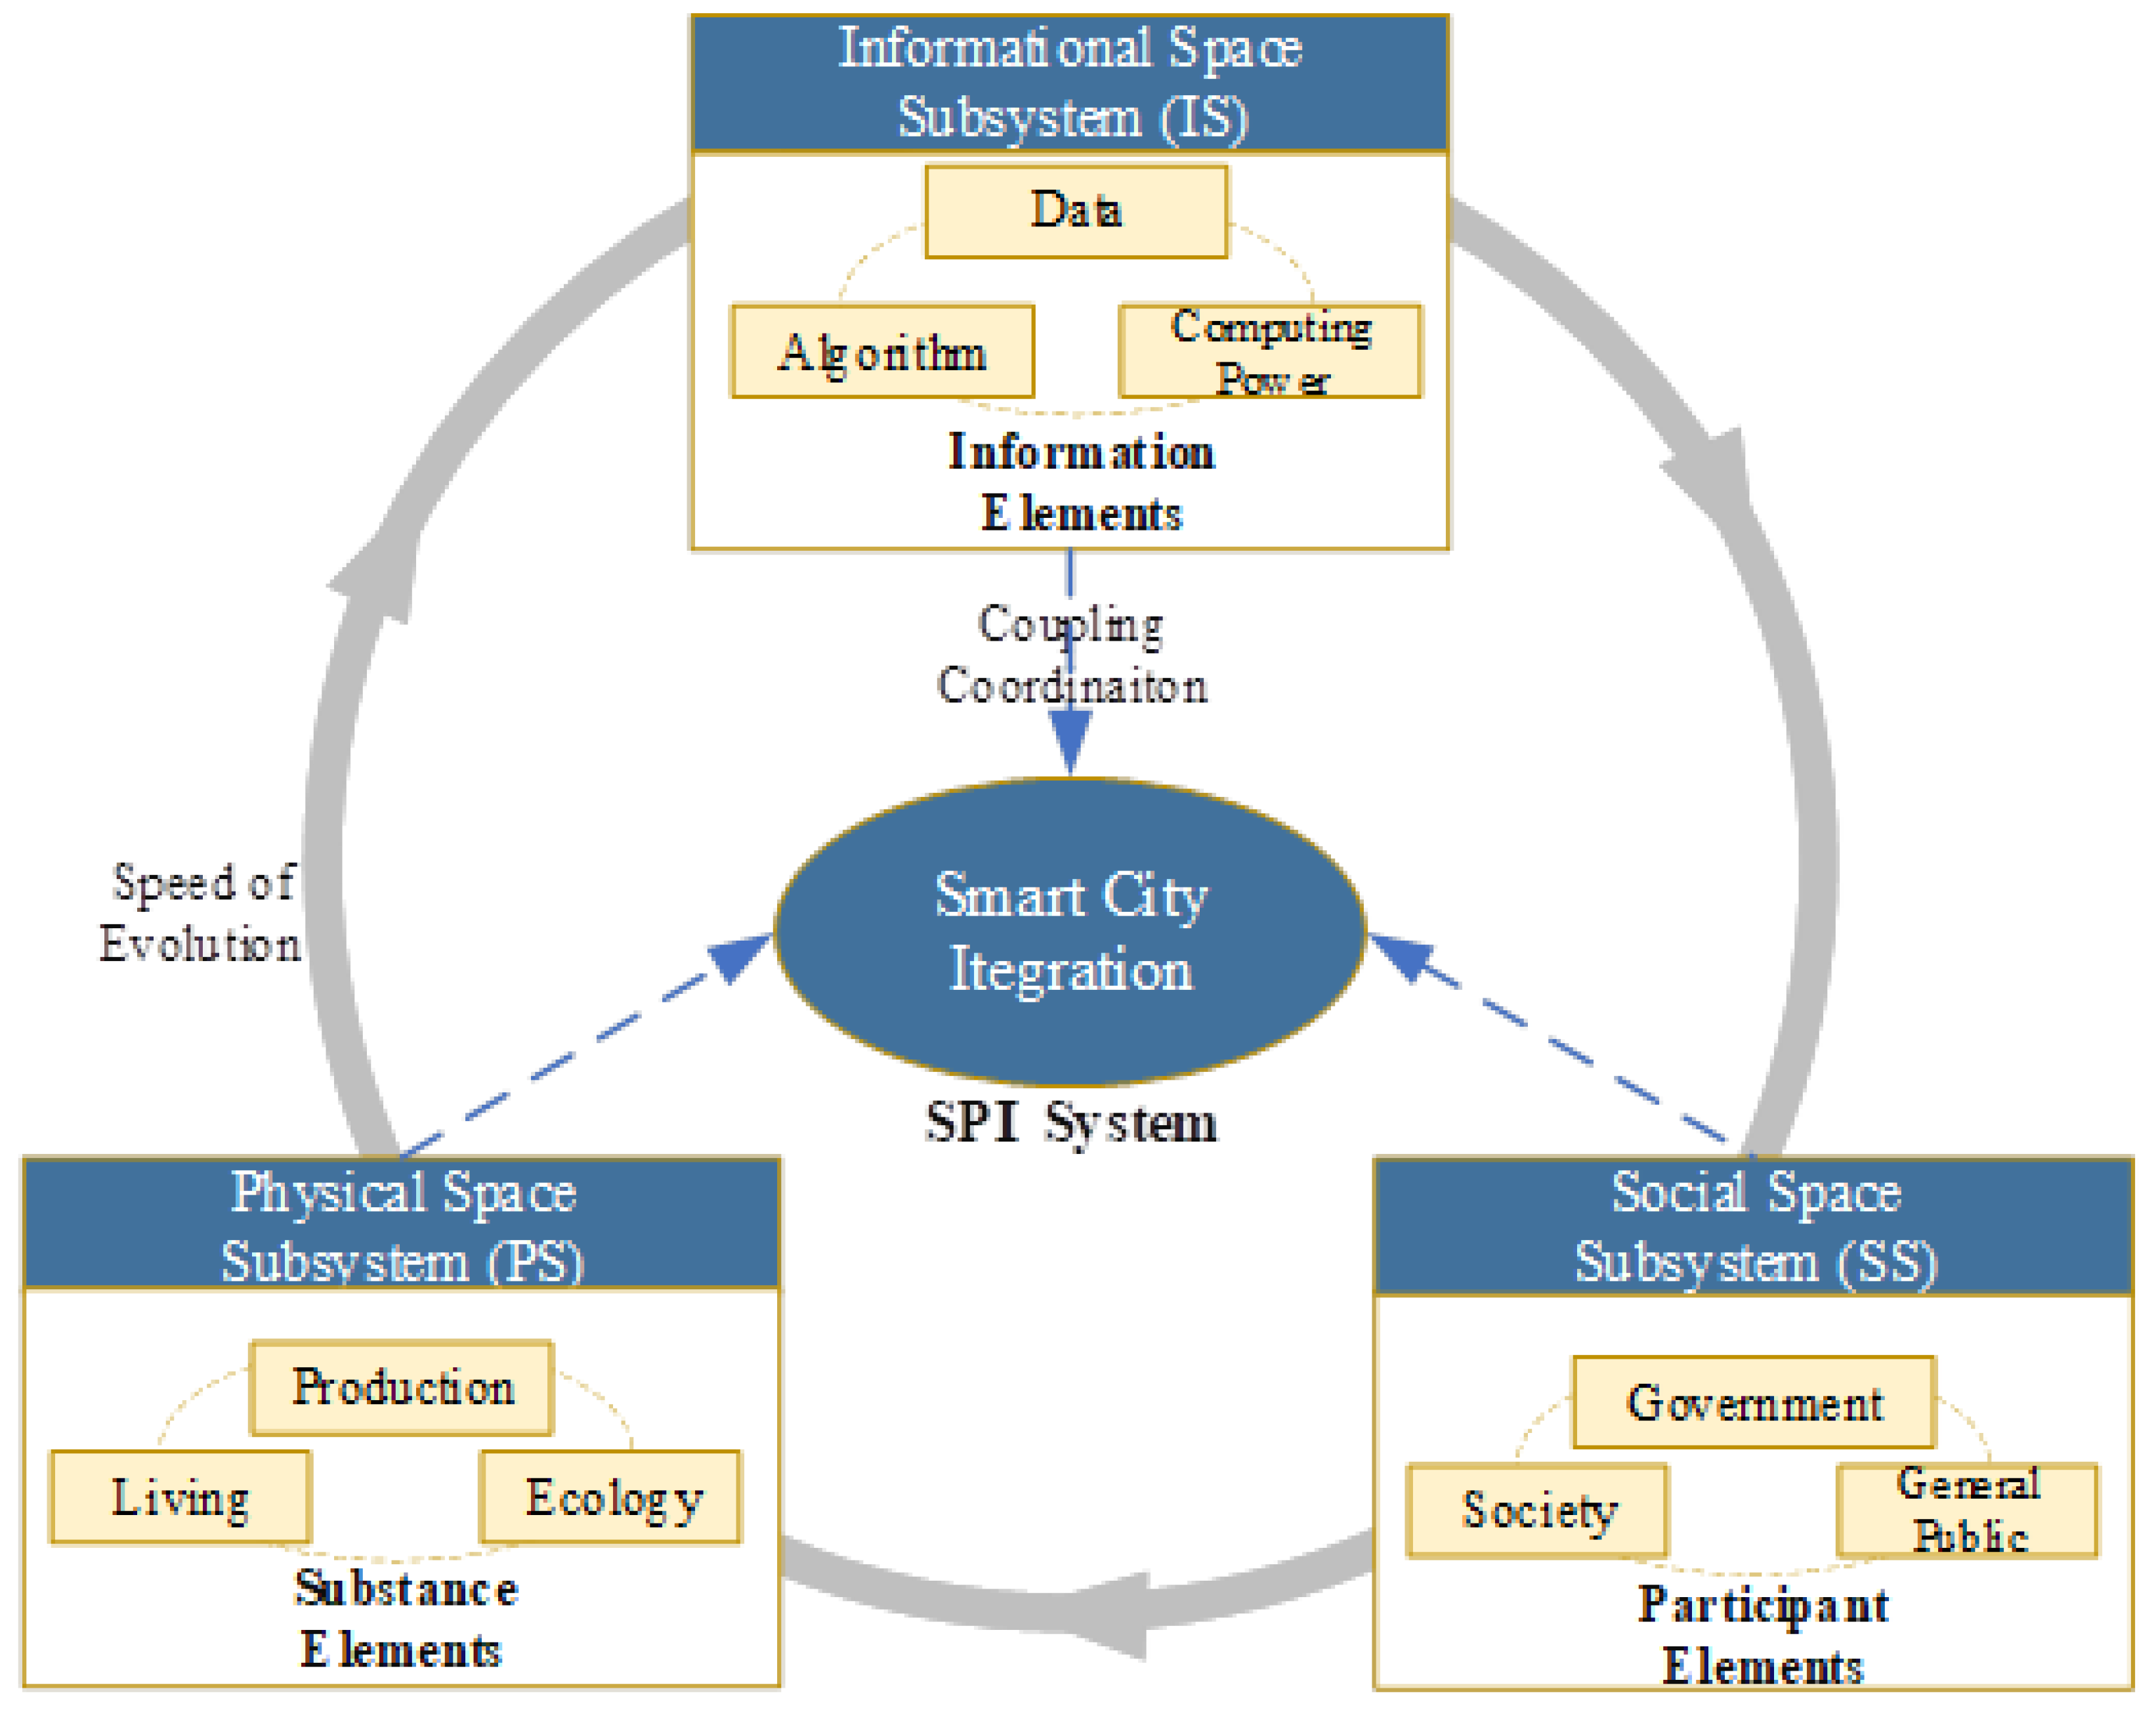
To clarify the spatial structural differences and the spatiotemporal evolution laws of smart city development, this study constructs an integrated model of smart city evaluation in tri-dimensional space (Figure 1). As a complex giant system, a smart city is the product of the coupled coordination of three subsystems: physical space, social space, and information space. Information space consists of a virtual network space composed of three core elements: data, computing power, and algorithms. Physical space is a tangible space composed of material elements in production, ecology, and daily life. Social space is formed by the interactive activities of multiple subjects such as government, society, and the public, including attitudes, behaviors, and values. Additionally, there is close interaction between each subsystem, forming the "physical-social" subsystem, "information-physical" subsystem, and "physical-social" binary subsystem.

2.3. Data Source and Processing

Considering the representativeness and availability of data, this study measures the spatial development level of smart cities in 30 provinces in China (excluding Tibet, Hong Kong, and Macau) from 2011 to 2019. According to the division standards of China's economic regions by the State Council, the cities can be divided into four major regions: Eastern, Central, Western, and Northeastern. In terms of data sources, socio-economic and statistical indicators mainly come from the "China Science and Technology Statistical Yearbook" and the "China Urban Statistical Yearbook" from 2012 to 2020, as well as the statistical yearbooks of the 30 provincial capitals and municipalities and their national economic and social development statistical bulletins. The network search index is sourced from the public attention index of Baidu Index[26]. The digital inclusive finance index comes from the "Peking University Digital Inclusive Finance Index Report." In addition, for individual years with missing data, interpolation methods are used to complete the dataset.
Figure 2. SPI Model of Smart City.
Preprints 104135 g002
Based on the SPI model, this study formulated a series of indices for smart city evaluation. As the model shown, the information space is centered around data as the basic element. Therefore, it focuses on information production and knowledge innovation at different stages of the data lifecycle, using technologies such as information equipment and the internet. This space follows the path of technical governance, and specifically extracts three major technical elements: data, algorithms, and computing power, emphasizing the innovation and application of urban smart technology. Based on this, three primary indicators are divided for description and subdivision, referring to existing research[27], and constructing six tertiary indicators at the information level (Table 1).
The physical space revolves around "objects" as the basic element. It refers to the ability to collect information relying on the objective geographical environment and various material elements when people are in complex urban spatial scenes, achieving resource optimization and emphasizing the environmental adaptability and situational dependency of governance. This space follows the path of urban planning, thus extracting three scenario elements: production, life, and ecology. Referring to existing research [28,29], 14 tertiary indicators are constructed (Table 2).
The social space is centered around "people" and aims to achieve cooperation and co-governance among multiple subjects and across departments. In the context of diversified social governance, the degree of coordination of interaction behaviors among various subjects will greatly affect decision-making effectiveness. This space follows the path of collaborative governance, thus extracting three key subject elements: government, society, and the public. Referring to previous achievements[30], 11 tertiary indicators are constructed. The specific evaluation indicators list is shown in Table 3.

3. Methods

3.1. Entropy Weight Method

To reduce the impact of subjective factors, this study employs the entropy weight method, which is a relatively objective weighting method. First, the data undergoes standardization processing. Since the indicators in the list have both positive and negative attributes, different standardization formulas are used for indicators of different attributes. The calculation steps are as follows:
X i j = x i j min x j m a x ( x j ) m i n x j
X i j = max x j x i j max x j min x j
Secondly, the determination of indicator weights is conducted. Referring to existing research [31,32], Formula (3) is used to calculate the proportion of the i-th sample under the j-th indicator, which is considered as the probability used in relative entropy calculation:
P i j = X i j i = 1 n X i j
where X i j represents the standardized sample data, and P i j ranges from 0 to 1.
Formula (4) is used to calculate the information entropy of each indicator:
e j = 1 ln n · i = 1 n P i j · l n P i j
Formula (5) (6) is used to calculate the information utility value and standardize to obtain the entropy weight of each indicator:
d j = 1 e j
W j = d j j = 1 m d j
After multiplying the weights obtained from the above calculations by the corresponding normalized indicator data, the parameter values of each indicator list are obtained.

3.2. Revised Coupling Coordination Model

Building upon the existing coupling coordination model, this study addresses the situation where the coupling degree C is distributed non-uniformly[33], and simulates its distribution uniformly. Additionally, to address the scenario where the coupling coordination model D loses the characteristics of coupling degree C and comprehensive evaluation index T during the analysis process, this study corrects the coupling coordination model D from a distance perspective by introducing the concept of norms, thereby retaining the characteristics of coupling degree C and comprehensive evaluation index T. Based on this revised coupling degree model, the calculated degree of coordinated development can more reasonably reflect the measure of coupling coordination and development level. The specific formula for the revised coupling coordination model is as follows:
C = 1 i > j , j = 1 n ( U i U j ) 2 m = 1 n 1 m × i = 1 n U i m a x U i 1 n 1
C = 1 U 3 U 1 2 + U 2 U 1 2 + U 3 U 2 2 3 × U 1 U 3 × U 2 U 3
D = C × T
T = α · U 1 + β · U 2 + γ · U 3
Where:
  • U1, U2 and U3 respectively represent the comprehensive evaluation indexes of the dimensions of information space, physical space, and social space;
  • C represents the coupling degree of the tri-dimensional space in smart city governance;
  • D represents the fusion coordination index of the tri-dimensional space in smart city governance, with a value range of [0,1];
  • T represents the comprehensive development index of the coupling system in smart city governance, reflecting the synergistic effects among the tri-dimensional space in smart city governance;
  • α, β and γ respectively refer to the contribution degrees of information space, physical space, and social space in the coupling system;
  • α + β + γ = 1 . The closer the value is to 1, the greater the contribution degree. This study considers the equal importance of the tri-dimensional space, hence α = β = γ = 1 3 .
  • Drawing from Wu Chuanqing[34] and Ge Shishuai[35] on the grading method of coupling coordination, this study divides coupling coordination into three degrees: disordered decline, transitional adjustment, and coordinated development. Furthermore, divides them into ten levels as shown in Table 4.

3.3. Dagum Gini Coefficient Decomposition Method

The Dagum Gini coefficient decomposition method has unique advantages in exploring spatial imbalance issues. The overall formula for calculating the Gini coefficient in smart cities is as follows:
G j h = i = 1 n j r = 1 n h y j i y h r / n j · n h Y j ¯ + Y h ¯
G = G w + G n b + G t = i = 1 n j G j j P j S j + j = 2 k h = 1 j 1 G j h P j · S h + P h · S j D j h + j = 1 k h = 1 j 1 G j h P j · S h + P h · S j 1 D j h
Where:
  • n represents the number of cities;
  • k represents the number of subgroups, representing the eastern, central, western, and northeastern regions in this study;
  • nj(nh) represents the number of cities in the j(h)-th subgroup;
  • j(h) represents the number of divisions in the subgroup, and i and r represent the number of cities within the subgroup;
  • G represents the overall Gini coefficient;
  • y j i ( y h r ) represents the coordination level of any city in the j(h)-th subgroup;
  • Y ¯ represents the average coordination level of the tri-dimensional space for all cities, calculated by j = 1 k i = 1 n j y j i / n ;
  • Gjh represents the Gini coefficient between the j-th subgroup and the j-th subgroup;
  • Y j ¯ represents the average coordination level of the j-th subgroup's tri-dimensional space;
  • Djh represents the relative influence between region j and region h.
Therefore, we decompose the Dagum Gini coefficient into three distinct components: the contribution of intra-group Gini coefficient G w to the overall Gini coefficient, the contribution of inter-group net value difference G n b to the overall Gini coefficient, and the contribution of hyperdensity G t . Their relationship is expressed as G = G w + G n b + G t .

3.4. Kernel Density Estimation Method

This study employs non-parametric Kernel density estimation to analyze the dynamic evolution trend of spatial coupling coordination in smart cities. The Kernel density function starts from the data itself, with weak dependence on the model and good statistical properties, making it widely used in studies on non-uniform spatial distributions. The specific formula is as follows:
f h X = 1 N i = 1 N K h X X i = 1 N h i = 1 N K X X i h
Where:
  • N represents the number of study objects, representing the number of smart cities in the observed area in this study;
  • Xi represents the observation value of each smart city's spatial coupling coordination in the observed area;
  • X represents the mean value of observation;
  • K(·) is the kernel function;
  • h represents the bandwidth which determines the precision of the Kernel density and the smoothness of the density graph. h = 0.9 N 4 5 is usually adopted (N is the sample size, S is the sample standard deviation).

3.5. BP Neural Network

The BP (Back Propagation) neural network is a non-linear adaptive information processing system composed of a large number of processing units. It mainly processes and memorizes information in a way that simulates the neural network processing and memory information in the brain. The main feature of the BP neural network is to propagate the error backward layer by layer in the form of local gradients to all hidden nodes in the lower layer through the backpropagation mechanism, reflected in the local gradients of the lower hidden nodes, and ultimately affect the update of various weights and thresholds, making the loss error of the network model minimal, thus achieving the nonlinear mapping between input and output.
In this study, 31 tertiary indicators from Table 1 of the smart city spatial list are selected as input nodes, and coupling coordination is selected as the output node. Therefore, there are 31 input layer nodes and 1 output layer node. The number of hidden layer nodes is determined by an empirical formula[36]:
K = m × n + α
Where:
  • m represents the number of input layer nodes;
  • n represents the number of output layer nodes;
  • α represents a constant between [0,10];
  • K represents the number of hidden layer nodes.
  • By observing the trend of mean square error (MSE) under different numbers of nodes using a step-by-step experimental method, the MSE value is minimized when the number of nodes increases to 13. Therefore, the optimal structure of the network is determined to be "31-13-1". Furthermore, using the constructed neural network for model training, the relationship between various factors and coupling coordination is identified. After all samples are trained and meet the accuracy requirements, the influence weights of various factors are obtained.

4. Results

4.1. Assessment of Smart City Spatial Development

4.1.1. Comprehensive Assessment of Smart City Spatial Development

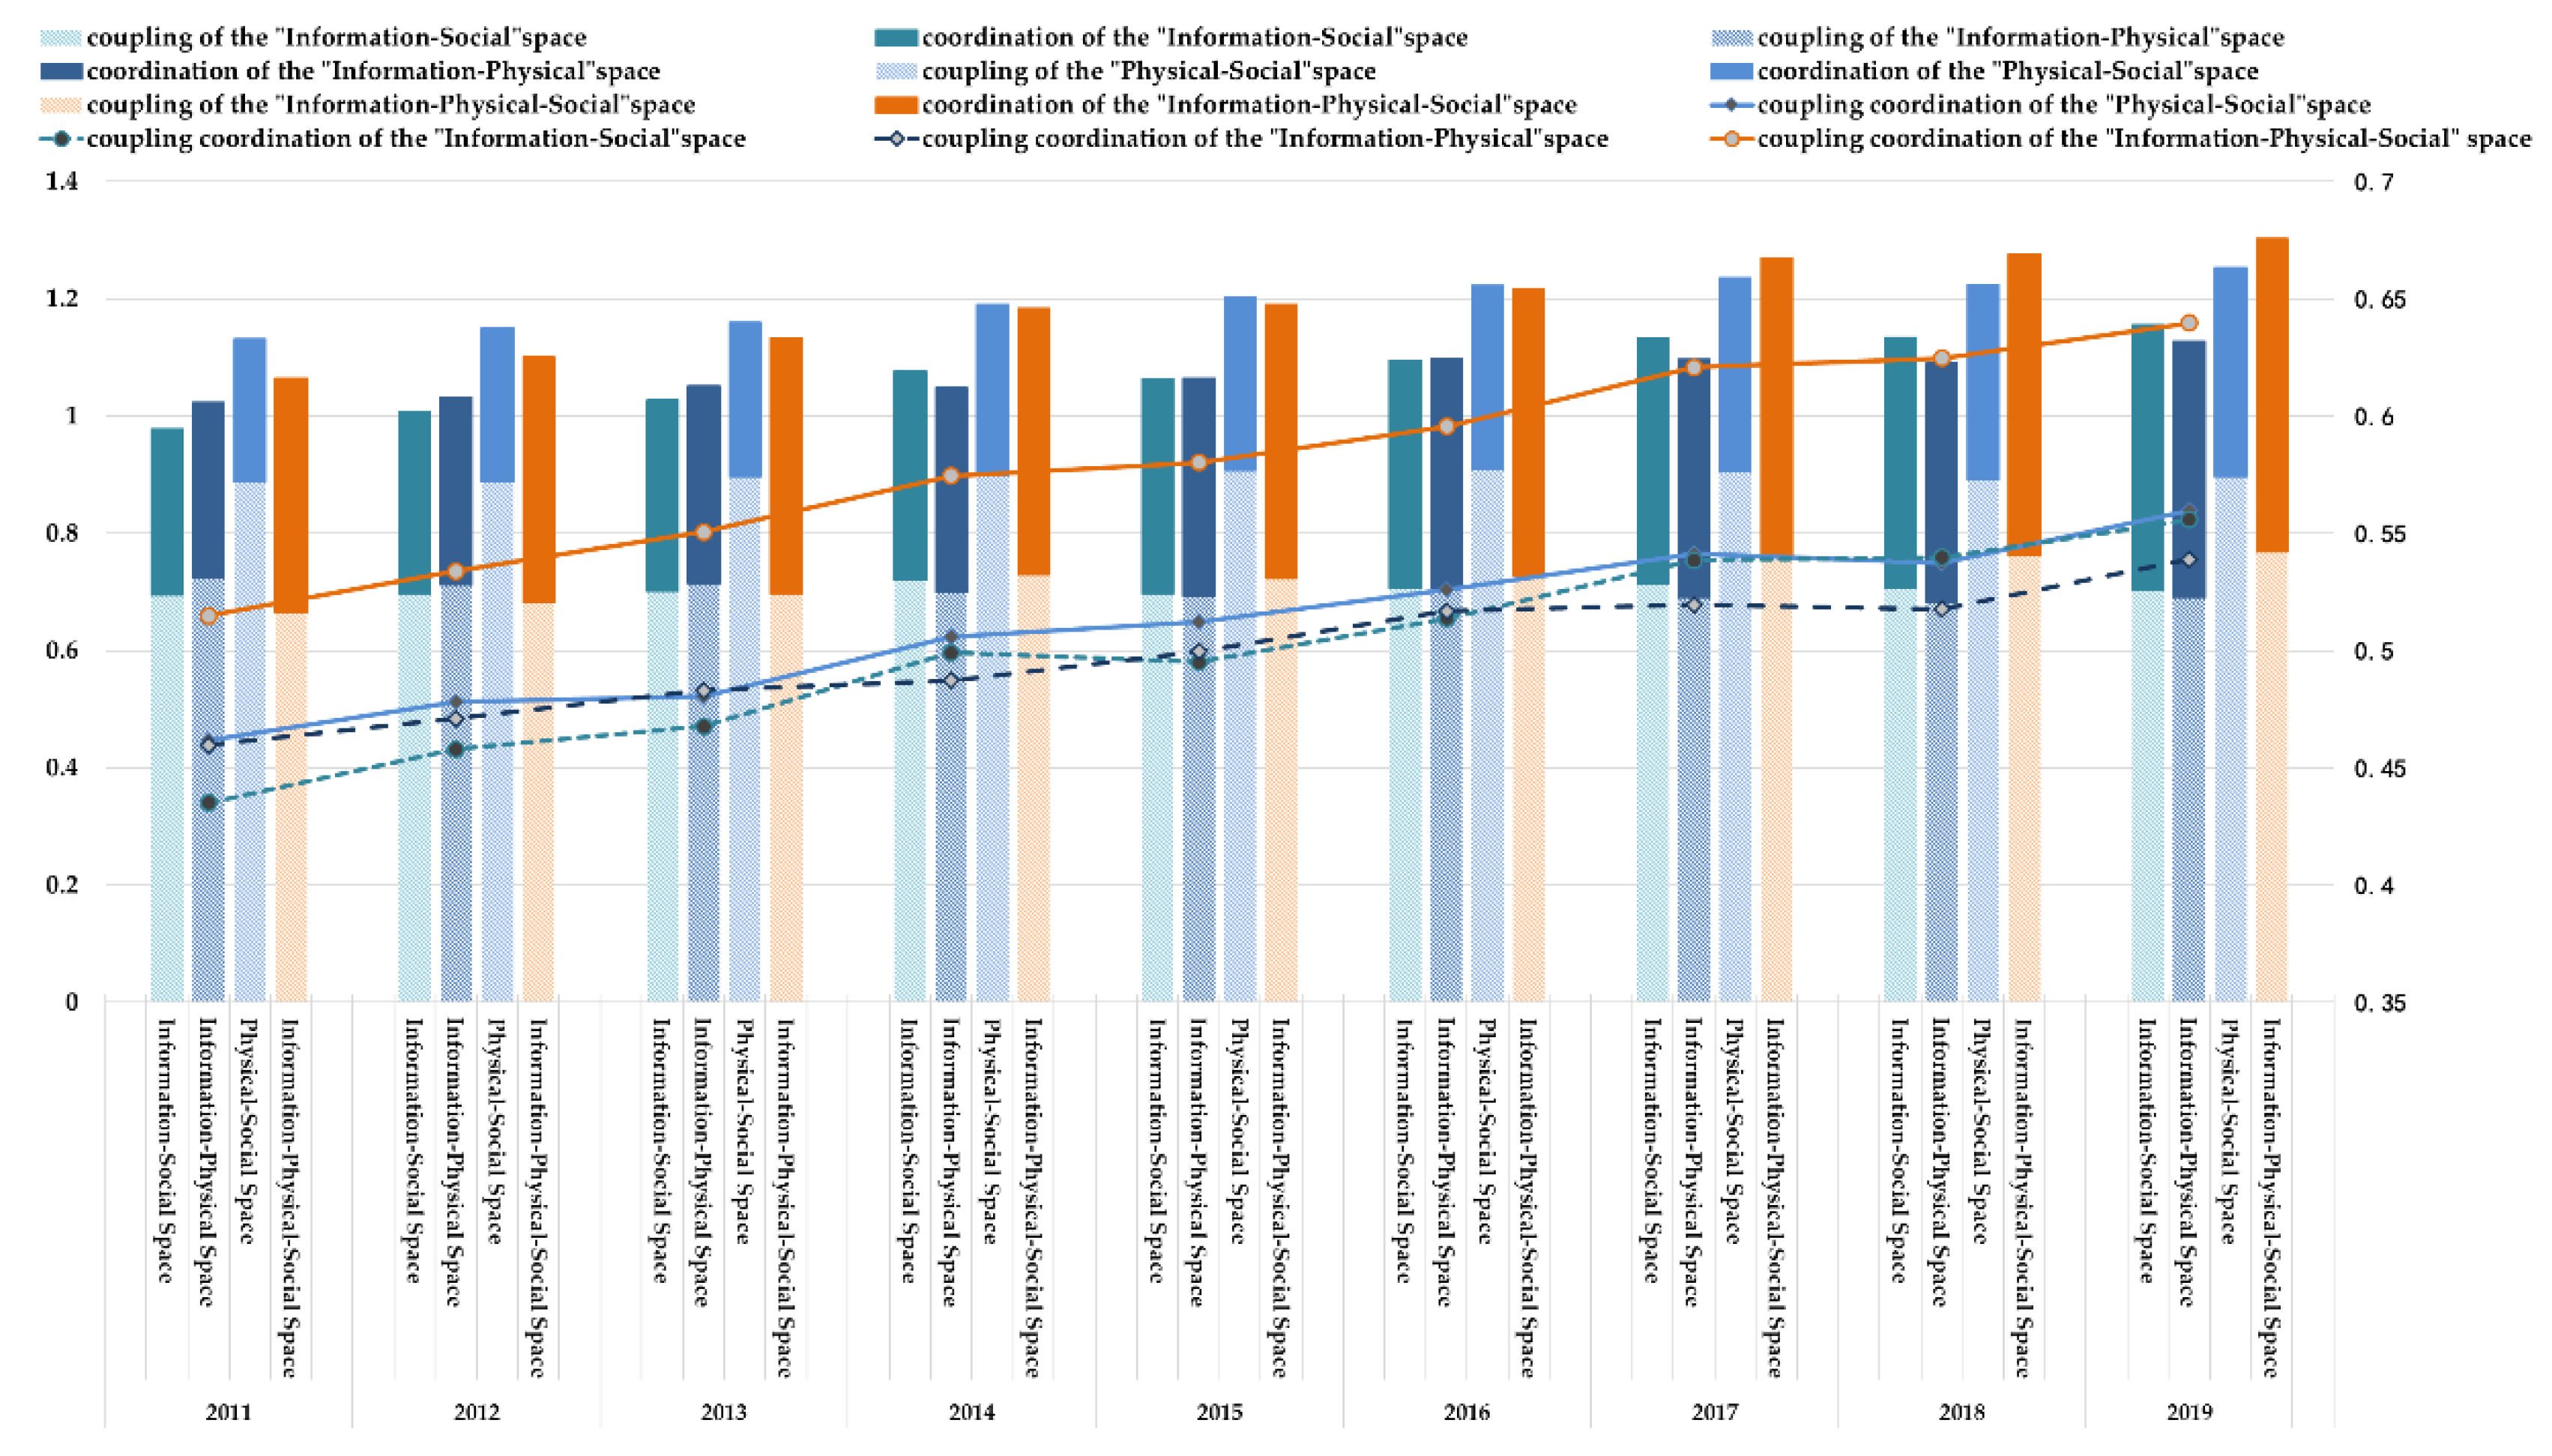
This study employs the entropy weight method to calculate the comprehensive assessment index of smart city spatial development in China from 2011 to 2019 (Figure 3). From the overall growth perspective, the annual average growth rate of smart cities from 2011 to 2014 showed slight fluctuations at a high level, followed by significant oscillations in growth after 2015, with an overall downward trend. In terms of the mean value, the comprehensive development level of smart cities in China steadily improved from 2011 to 2019, showing an upward trend year by year. Looking at the median, its trend changes synchronously with the mean, except for 2012, where the mean value was lower than the median from 2011 to 2017. However, after 2017, the mean value started to exceed the median. The similar trend and small difference between the mean and median of the comprehensive assessment index of smart city spatial development indicate relatively balanced development among provincial capitals and municipalities directly under the central government in China, with no significant disparities observed. Moreover, cities with initially lower development levels show noticeable improvements.
Furthermore, this study also conducts pairwise combinations of the tri-dimensional space to calculate the evaluation indices of the binary spatial subsystem (Figure 3). Overall, the four types of evaluation indices show a steady upward trend from 2011 to 2019. Regarding the scale of coupling coordination, before 2016, the "physical-social" space coupling dominated, playing a primary driving role in smart city development. However, after 2016, with the empowerment effect of information technology, the coupling effect of smart city spatial development becomes more prominent. Specifically, the evaluation index of "physical-social" space increased from 0.462 to 0.560, and the coupling coordination level rose from the "nearing disarray decline" to the "barely coordinated fusion" stage. Similarly, the evaluation index of "information-social" space rose from 0.435 to 0.556, with the coupling coordination level progressing from "nearing disarray decline" to "barely coordinated fusion." Likewise, the evaluation index of "information-physical" space increased from 0.460 to 0.539, and the coupling coordination level advanced from "nearing disarray decline" to "barely coordinated fusion." The differences in the evaluation indices of the three binary subsystems are not significant, indicating a relatively balanced development of the binary spatial development in China's smart city development process. Additionally, the evaluation index of "information-physical-social" space increased from 0.515 to 0.640, with the coupling coordination level advancing from "barely coordinated fusion" to "primary coordinated development." Compared to the other three types of evaluation indices, it demonstrates certain integration advantages, suggesting that the integration degree of China's smart city "information-physical-social" space is relatively superior. However, the coupling coordination of these binary subsystems is lower than that of the SPI system, indicating that the coordinated development of the "information-social" space, "physical-social" space, and "information-physical" space has not provided strong support for the coordinated development of the "information-physical-social" space.

4.1.2. Subsystems Assessment of Smart City Spatial Development

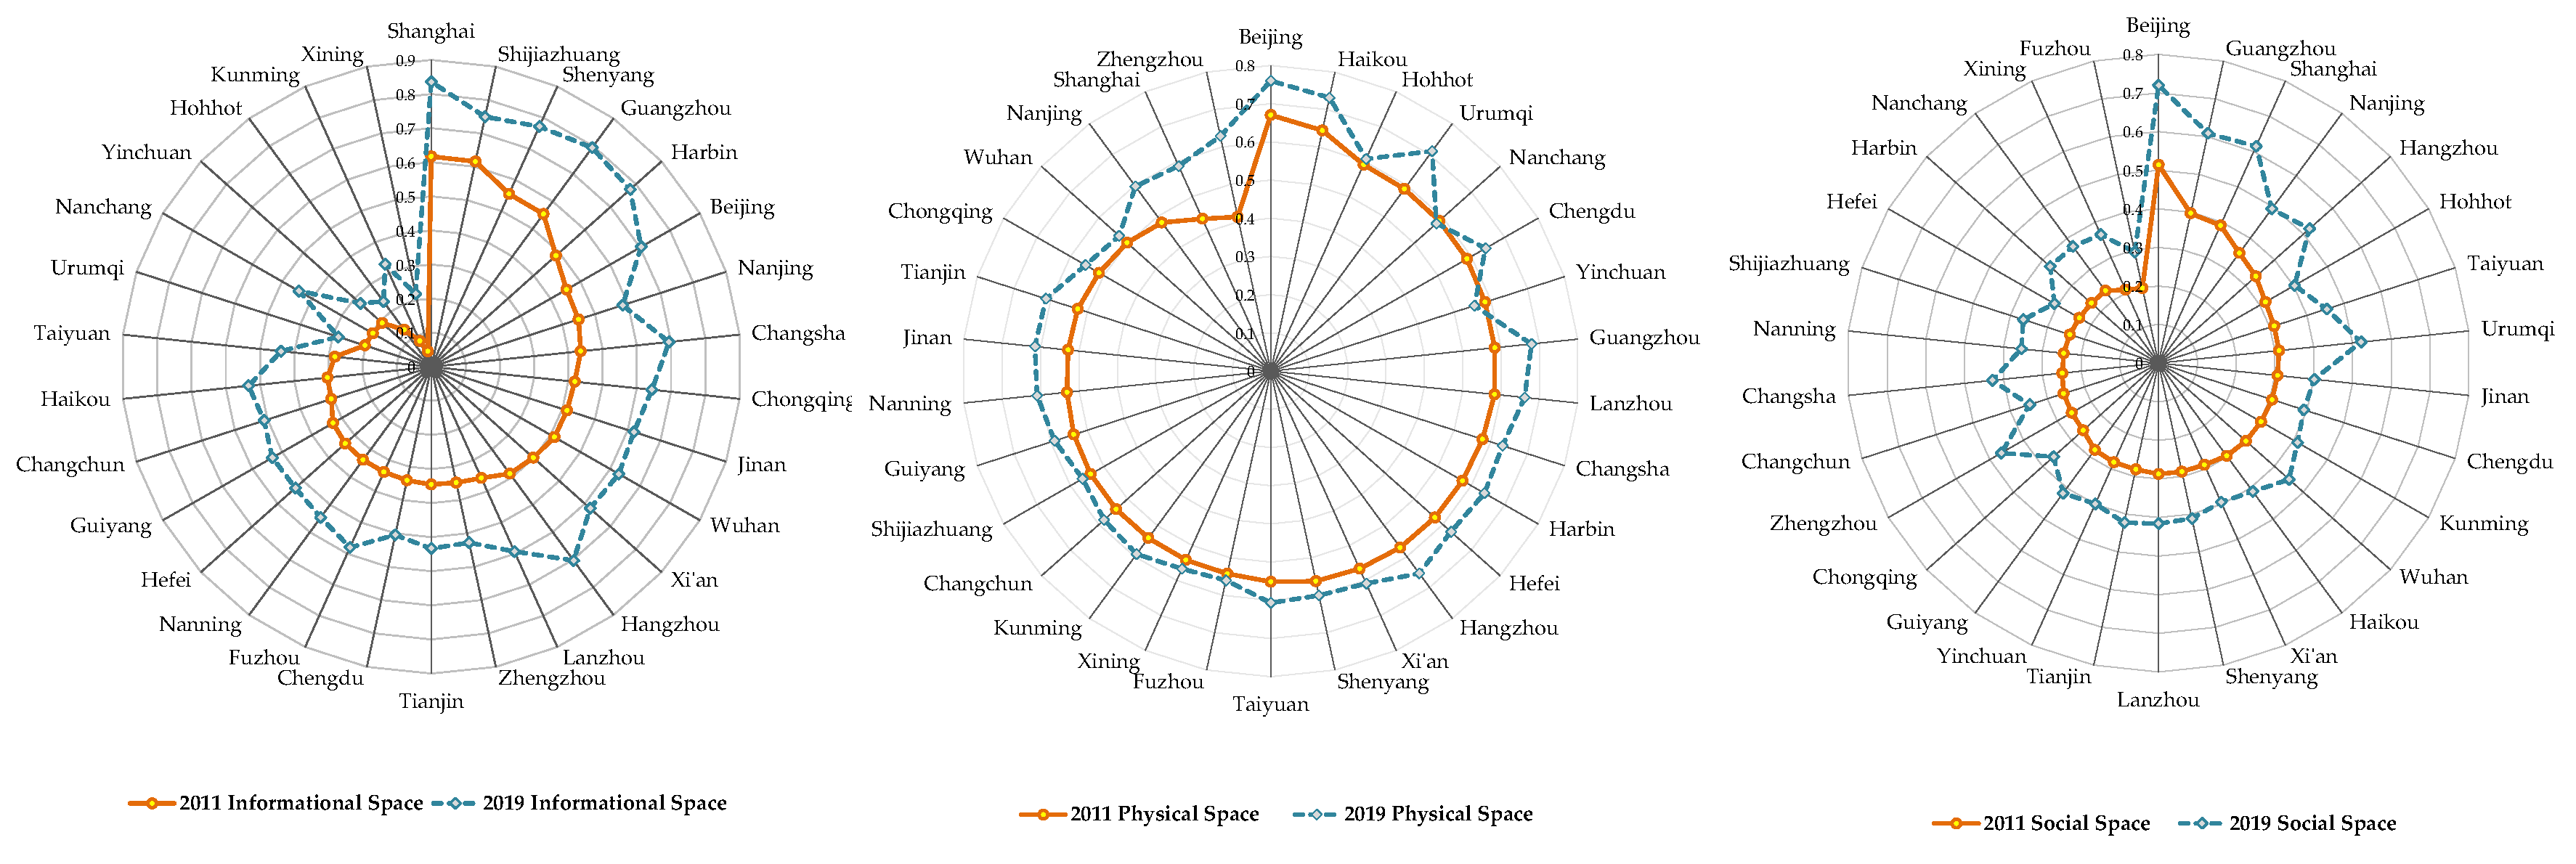
We evaluate the level of smart city spatial development in 2011 and 2019 (Figure 4). Compared to 2011, there has been an overall improvement in the level of smart city spatial development in 2019.
Specifically, observing the comprehensive index of the information space, there is a clear trend of "diffusion," indicating significant influence from the rapid iteration and upgrade of information technology over the past decade, particularly in reshaping the information space. Simultaneously, there is a significant development gap among smart cities, with polarization becoming more pronounced. In 2011, the top five cities were Shanghai (0.617), Shijiazhuang (0.615), Shenyang (0.555), Guangzhou (0.554), and Harbin (0.487), whereas in 2019, the top five cities were Shanghai (0.836), Guangzhou (0.795), Harbin (0.777), Shenyang (0.771), and Shijiazhuang (0.750).
From the perspective of the comprehensive index of the physical space, there is an overall trend of slight "fluctuation," with relatively small development gaps and a mature level of development among smart cities. In 2011, the top five cities were Beijing (0.670), Haikou (0.644), Hohhot (0.591), Urumqi (0.589), and Nanchang (0.588), while in 2019, the top five cities were Beijing (0.756), Haikou (0.731), Urumqi (0.711), Guangzhou (0.679), and Lanzhou (0.662).
In terms of the comprehensive index of the social space, there is an overall trend of significant "fluctuation," with some smart cities exhibiting more prominent development. In 2011, the top five cities were Beijing (0.514), Guangzhou (0.397), Shanghai (0.390), Nanjing (0.353), and Hangzhou (0.336), while in 2019, the top five cities were Beijing (0.720), Shanghai (0.615), Guangzhou (0.609), Urumqi (0.522), and Hangzhou (0.521).
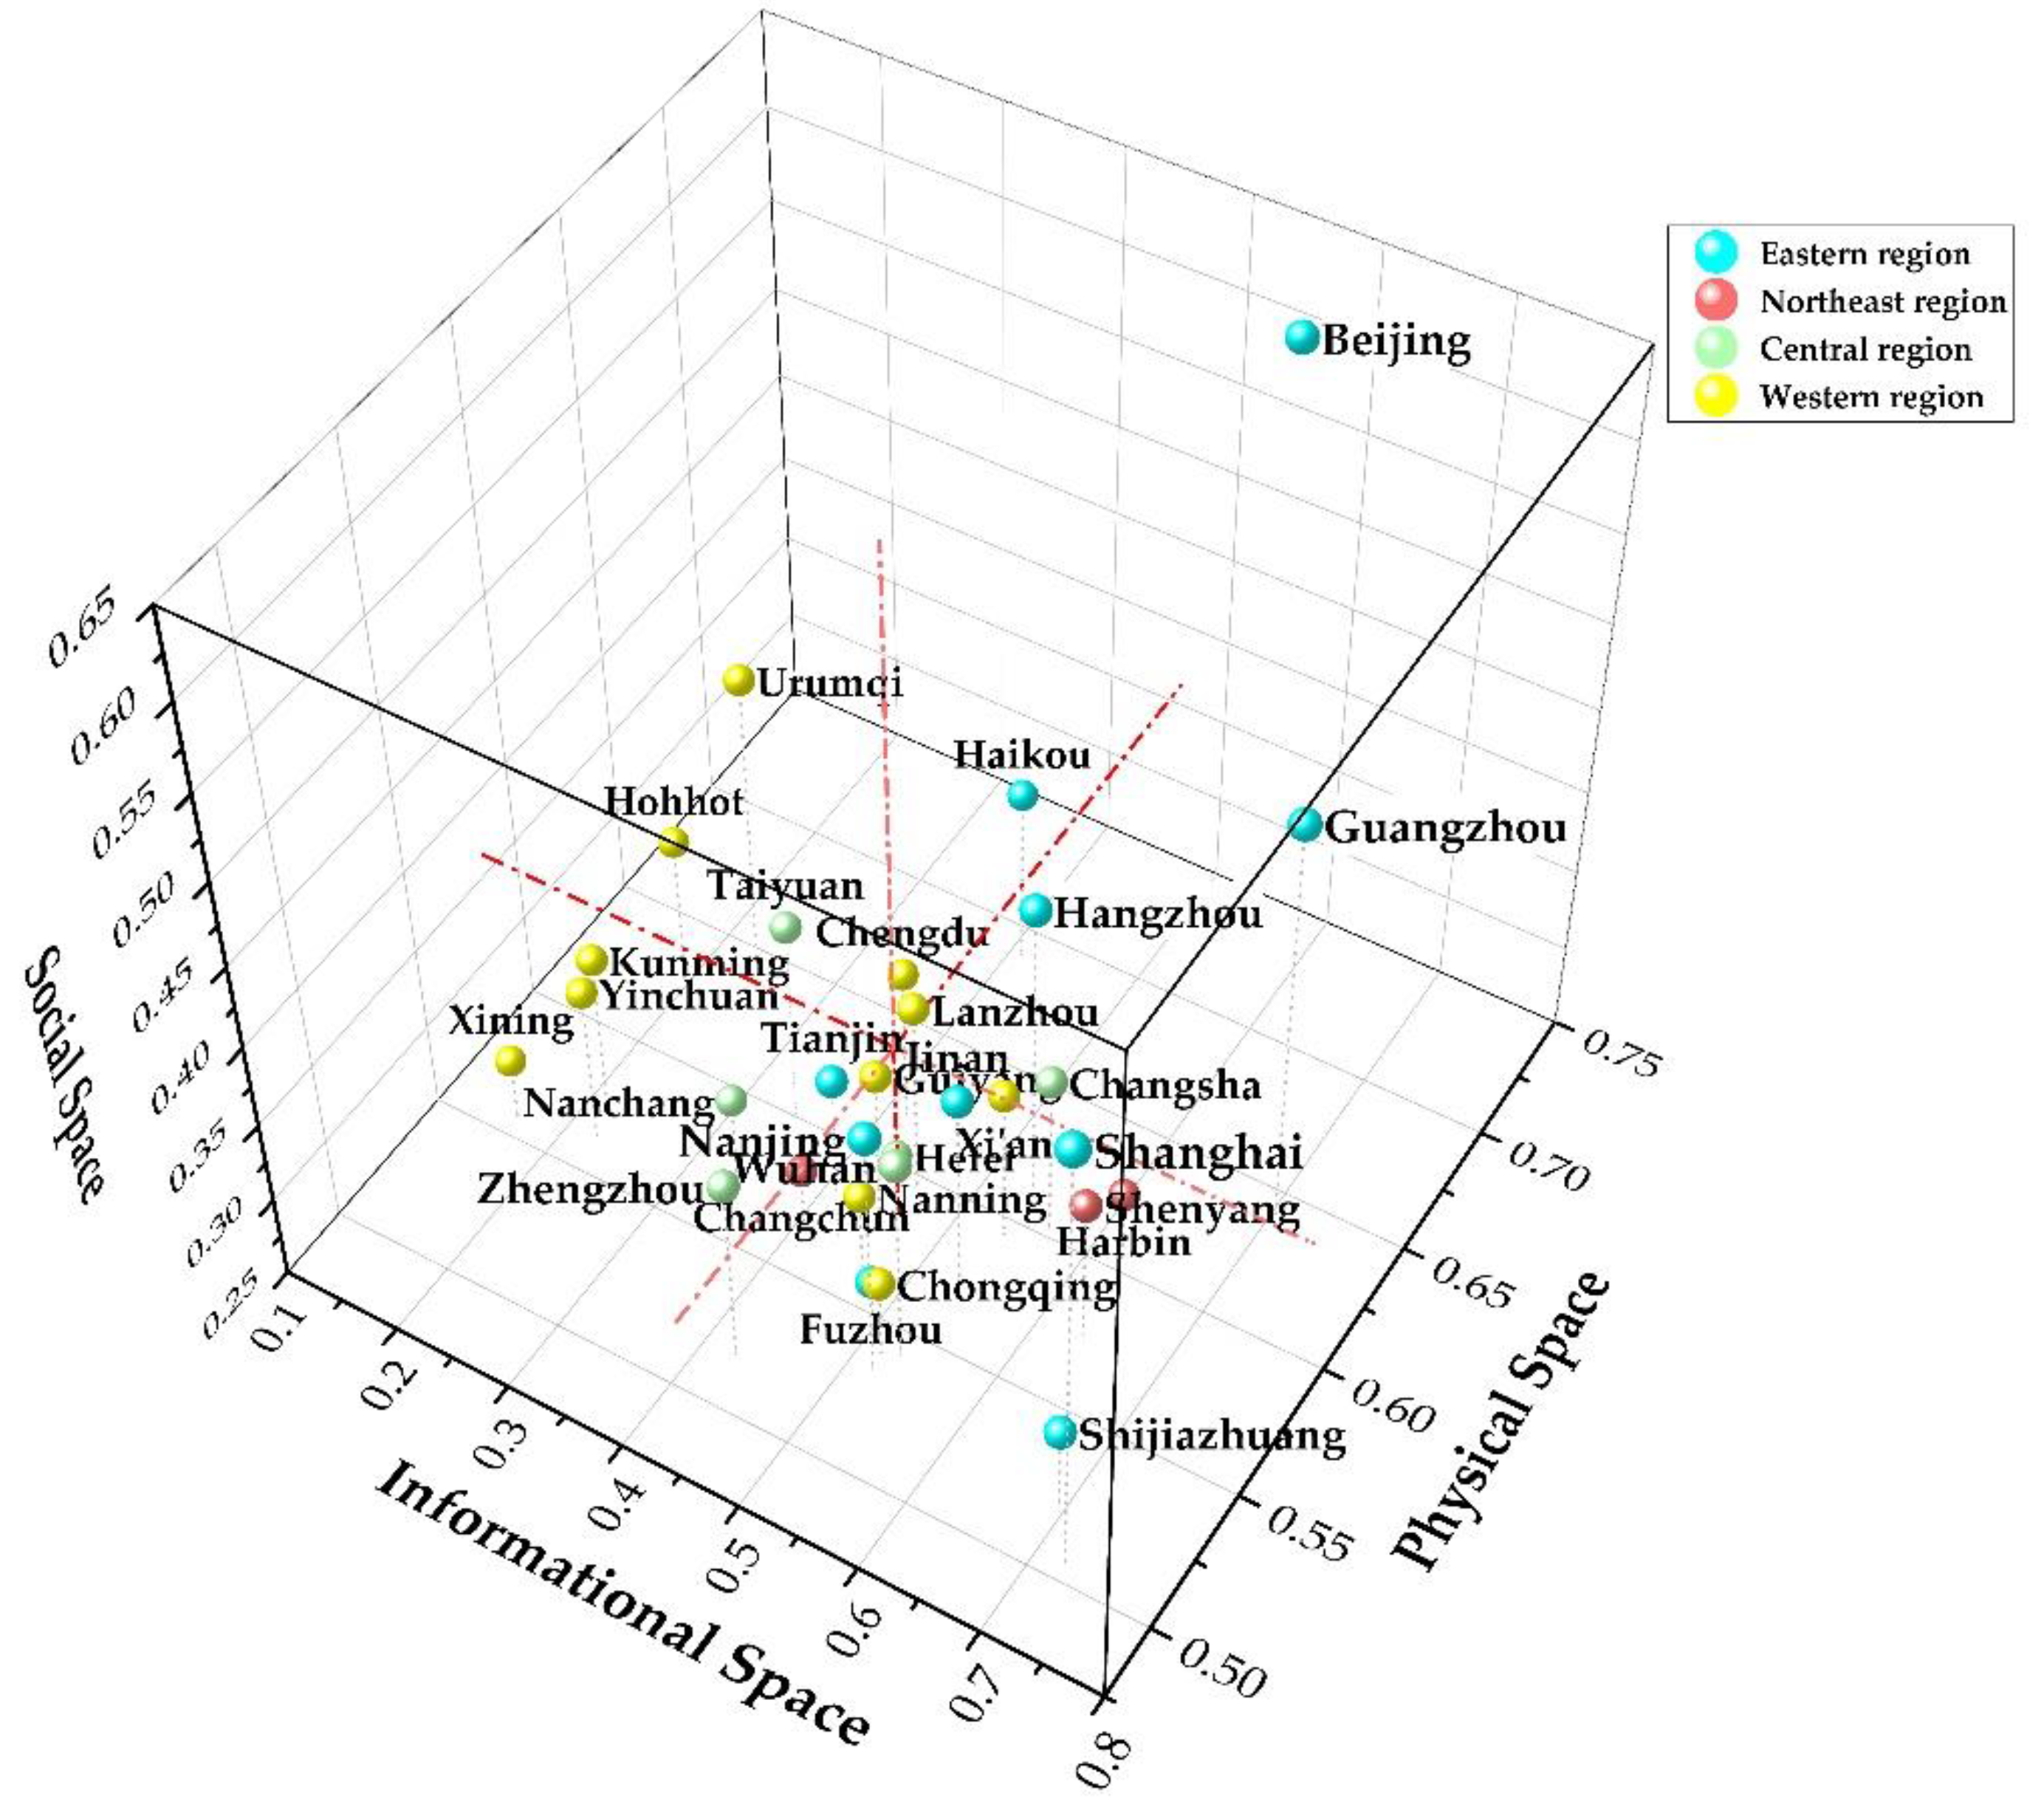
Furthermore, by taking the information space of the smart city spatial system as the x-axis, the physical space as the y-axis, and the social space as the z-axis, with each axis intersecting at the mean value, the provincial capitals and municipalities directly under the central government can be divided into eight different quadrants (Figure 5).
The average level of smart city spatial development from 2011 to 2019 reveals distinctive patterns across different regions. The first quadrant, representing the top tier, includes leading cities like Beijing, Hangzhou, and Guangzhou, forming a 'triumvirate' of development. These cities, situated in the eastern regions of China, are either traditional economic powerhouses or provincial capitals of economically robust provinces. They boast strong economic foundations, advanced social governance structures, and flourishing digital economy sectors.
The second, fourth, and fifth quadrants belong to the second tier, characterized by a 'two-strong-one-weak' pattern of development, primarily concentrated in the eastern and northeastern regions. These cities serve as vital hubs in the northeastern, central, and western regions of China, demonstrating significant innovative competitiveness and well-established foundations in emerging information industries. While they possess rich historical legacies, abundant resources, and favorable ecological environments, they exhibit relatively weaker economic development and less diversified social governance structures.
The third, sixth, and eighth quadrants belong to the third tier, displaying a 'two-weak-one-strong' pattern of development, with cities mostly located in the central and western regions. These cities are often adjacent to more developed areas and benefit from the spillover effects of emerging industries. Although they have solid foundations in the development of emerging information industries due to favorable technological policies, their economic development lags behind, and they face challenges in resource allocation and social governance, leading to less pronounced advantages in physical and social spatial development.
The seventh quadrant represents the fourth tier, encompassing cities like Changchun, Nanchang, Guiyang, Kunming, Xining, and Yinchuan, characterized by a 'three-weak' pattern of development. These cities, often provincial capitals of provinces with relatively lower economic development, lack distinct geographical advantages, have lower per capita resource ownership rates, possess relatively underdeveloped economic foundations, and face challenges in establishing sound social governance systems and upgrading industrial structures."

4.2. Descriptive Analysis of Smart City Spatial Coupling Coordination

4.2.1. Overall Characteristics

Using the revised coupling coordination model, the spatial coupling coordination of smart cities from 2011 to 2019 is calculated as shown in Table 5. Overall, the spatial coupling coordination of the 30 smart cities in China shows a steady upward trend. The national ranking of spatial coupling coordination development is at a moderate level, indicating a relatively balanced development of spatial coupling coordination among Chinese smart cities. In terms of ranking changes, compared to 2011, 13 cities had higher rankings in spatial coupling coordination in 2019. Among them, Zhengzhou, Changsha, Guiyang, and Lanzhou rose by 8, 7, 7, and 5 places respectively, indicating relatively rapid progress in spatial coupling coordination development in these four cities compared to others. Four cities maintained their rankings. Thirteen cities experienced a decrease in rankings, with Shijiazhuang, Shenyang, Chongqing, and Chengdu dropping by 14, 9, 7, and 7 places, respectively, indicating a significant slowdown in the development of spatial coupling coordination in these four cities compared to others.
From 2011 to 2019, the spatial coupling coordination of smart cities witnessed an overall upward trend, with most cities experiencing an increase of one level in coordination. Specifically, in 2011, the spatial coupling coordination of smart cities mainly exhibited four stages: slight imbalance and decline, imminent imbalance and decline, barely coordinated integration, and primary coordinated development. Cities in the stages of imminent imbalance and decline and barely coordinated integration were relatively more common, distributed across eastern, central, western, and northeastern China. However, cities in the stages of slight imbalance and decline and primary coordinated development were relatively fewer, with the former mainly located in western regions and the latter mainly in eastern regions.
By 2019, the spatial coupling coordination of smart cities mainly manifested five stages: imminent imbalance and decline, barely coordinated integration, primary coordinated development, intermediate coordinated development, and good coordinated development. Cities in the stages of barely coordinated integration and primary coordinated development were relatively more common, with the former, except for Hefei, located in central regions, and the latter mainly distributed in central, western, and northeastern China. Additionally, Xining was the only city in the stage of imminent imbalance and decline, while Guangzhou, Nanjing, Hangzhou, and Shanghai were in the stage of intermediate coordinated development, all situated in eastern China. Only Beijing reached the stage of good coordinated development, indicating its significant advantage in spatial coupling coordination development.

4.2.3. Regional Disparities

The Regional Disparities and Contribution Rate of Spatial Coupling Coordination in Smart Cities are illustrated in Table 6. The overall Dagum Gini coefficient of spatial coupling coordination in smart cities shows a downward trend, decreasing from 0.08 in 2011 to 0.06 in 2019. This indicates a gradual reduction in the development disparity of spatial coupling coordination among smart cities in China. Simultaneously, the within-group Gini coefficient, between-group Gini coefficient, and hyper-variation density also exhibit a decreasing trend, suggesting that the development disparities in spatial coupling coordination among and within regions are narrowing. By examining the contribution rates of each component of the Dagum Gini coefficient, it can be observed that the contribution rate of between-group Gini coefficient is relatively high and continuously increasing during the study period, maintaining a level of over 60%. In contrast, the contribution rates of within-group Gini coefficient and hyper-variation density are relatively low. This indicates that the uneven development of spatial coupling coordination in smart cities in China mainly stems from the between-group differences among regions, while the disparities caused by within-region variations and overlaps between regions contribute relatively less.
Furthermore, from the results of Dagum Gini coefficient decomposition (Table 7), except for a slight increase in the within-group Gini coefficient in the eastern region, the differences in spatial coupling and coordination of smart cities within the other three major regions have all decreased. In terms of the average within-group Gini coefficient across the four major regions, the western region has the highest Gini coefficient, indicating the greatest disparity in spatial coupling and coordination among smart cities within this region. The eastern region ranks second in terms of the Gini coefficient, followed by the central region, which has a slightly higher Gini coefficient than the northeastern region. The northeastern region has the smallest Gini coefficient, indicating the least disparity in spatial coupling and coordination among smart cities within this region. In terms of the average between-group Gini coefficient across the four major regions, the eastern and western regions both have a mean between-group Gini coefficient of 0.097, significantly higher than that of other interregional comparisons. This suggests a relatively large disparity in spatial coupling and coordination of smart cities between the eastern and western regions. The mean between-group Gini coefficient for the northeastern region and the central region is 0.044, lower than that of other interregional comparisons, indicating a relatively small disparity in spatial coupling and coordination of smart cities between the northeastern and central regions.

4.2.4. Dynamic Evolution

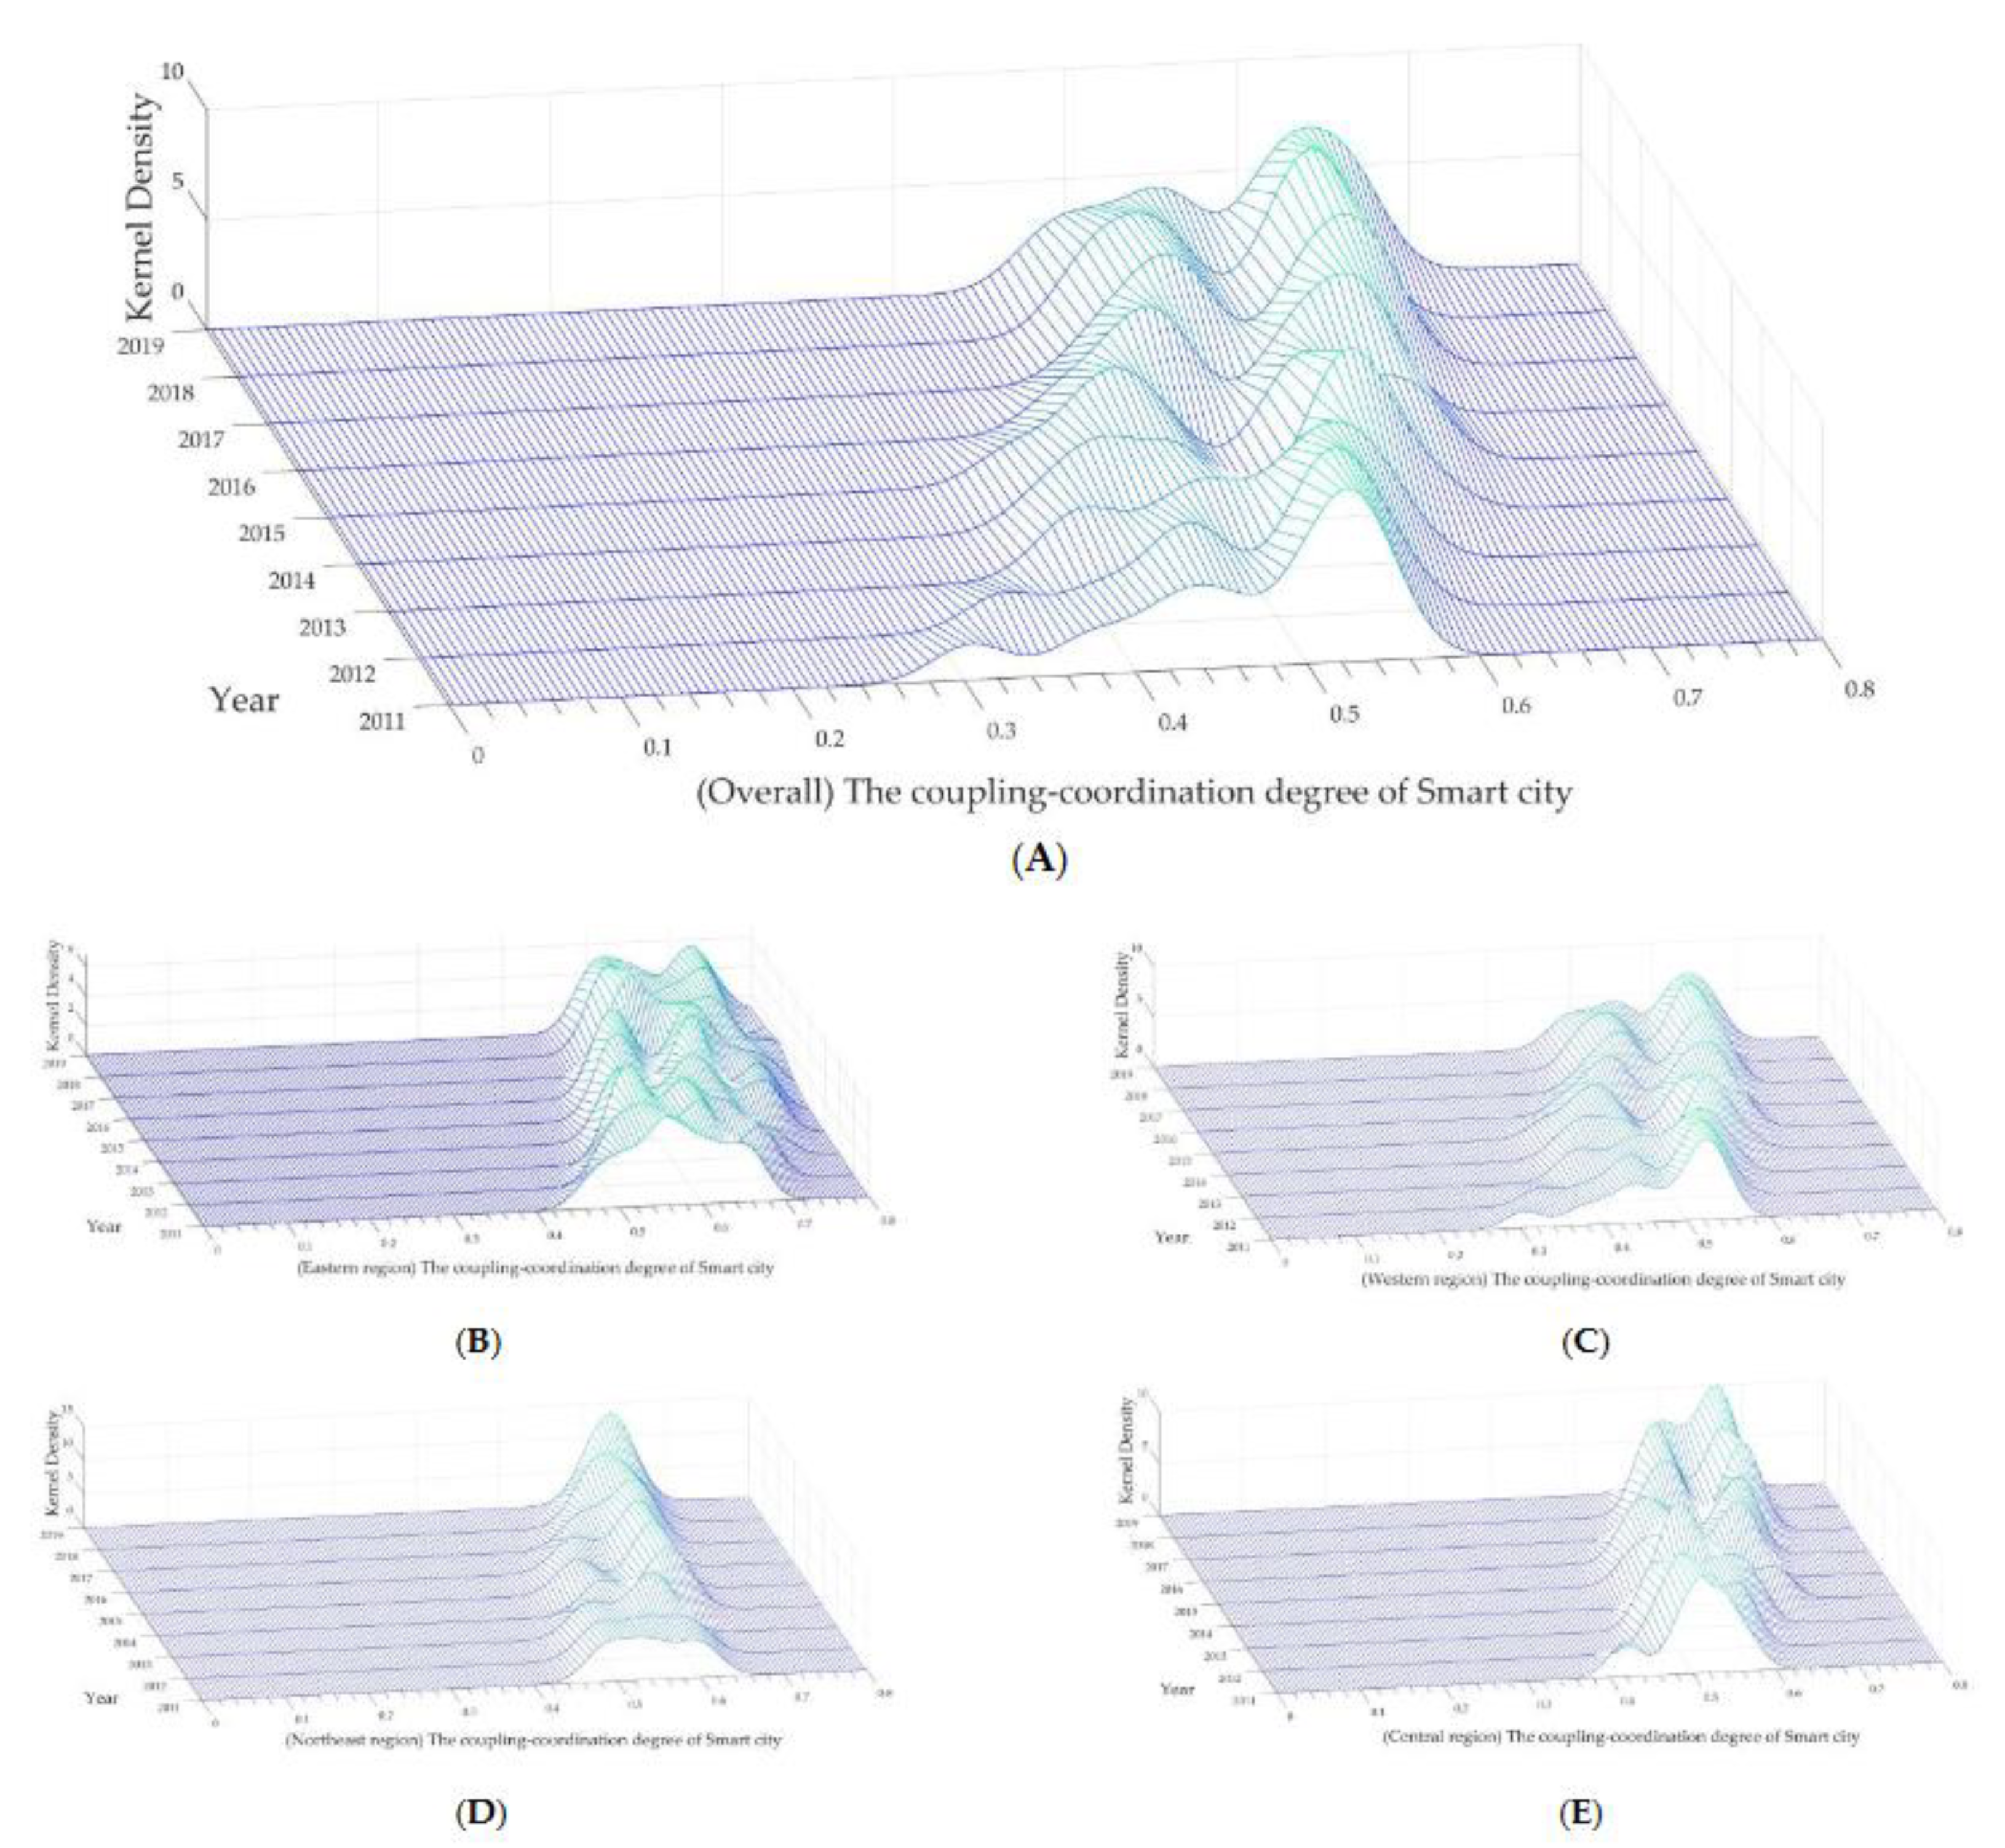
The kernel density curve depicted in Figure 6 (A) illustrates a discernible trend in the overall spatial coupling coordination of smart cities across China. Firstly, the curve exhibits a noticeable rightward shift, indicating a consistent upward trajectory in the spatial coupling coordination of smart cities throughout the research period. Secondly, it showcases a bimodal distribution, with the primary peak height steadily increasing year by year while the secondary peak's variability diminishes. This suggests a growing polarization in the spatial coupling coordination of smart cities across China. Lastly, the curve's narrowing opening width and thickening left tail signify a progressive reduction in the absolute differences of spatial coupling coordination among Chinese cities over the years. In summary, despite a continuous improvement in China's spatial coupling coordination of smart cities during the study period, nationwide polarization remains significant, while disparities among cities are gradually decreasing.
As depicted in Figure 6 (B), the Eastern region witnesses an increase in the number of peaks, with peak heights peaking in 2017 before gradually declining. The narrowing of the curve's opening width from 2011 to 2015, followed by an annual expansion post-2015, coupled with a distinct right tail, suggests a diminishing regional disparity in the spatial coupling coordination of smart cities in the East, transitioning towards a more multipolar direction.
Figure 6 (C) indicates a progressive rightward shift in the kernel density curve for the Northeast region, with peak heights experiencing annual growth. The narrowing opening width annually, transition from bimodal to unimodal peaks, and shortening left tail signify an overall increase in the spatial coupling coordination of smart cities in the Northeast, with development becoming more concentrated.
In Figure 6 (D) the Central region's kernel density curve remains relatively steady from 2011 to 2017 before steepening annually thereafter. Peak heights decrease annually post-2013, rebounding after 2017, with a narrowing opening width and evident left tail. This suggests a significant trend towards multipolar development in the spatial coupling coordination of smart cities in the Central region, accompanied by a gradual rise in regional disparities.
Figure 6 (E) illustrates a peak for the Western region in 2013, followed by a gradual annual decline. The expanding opening width of the kernel density curve post-2013 and thickening left tail indicate a growing absolute difference in the spatial coupling coordination of smart cities in the Western region, with minimal variation in the polarization phenomenon.

4.3. Inferential Analysis of Smart City Spatial Coupling Coordination

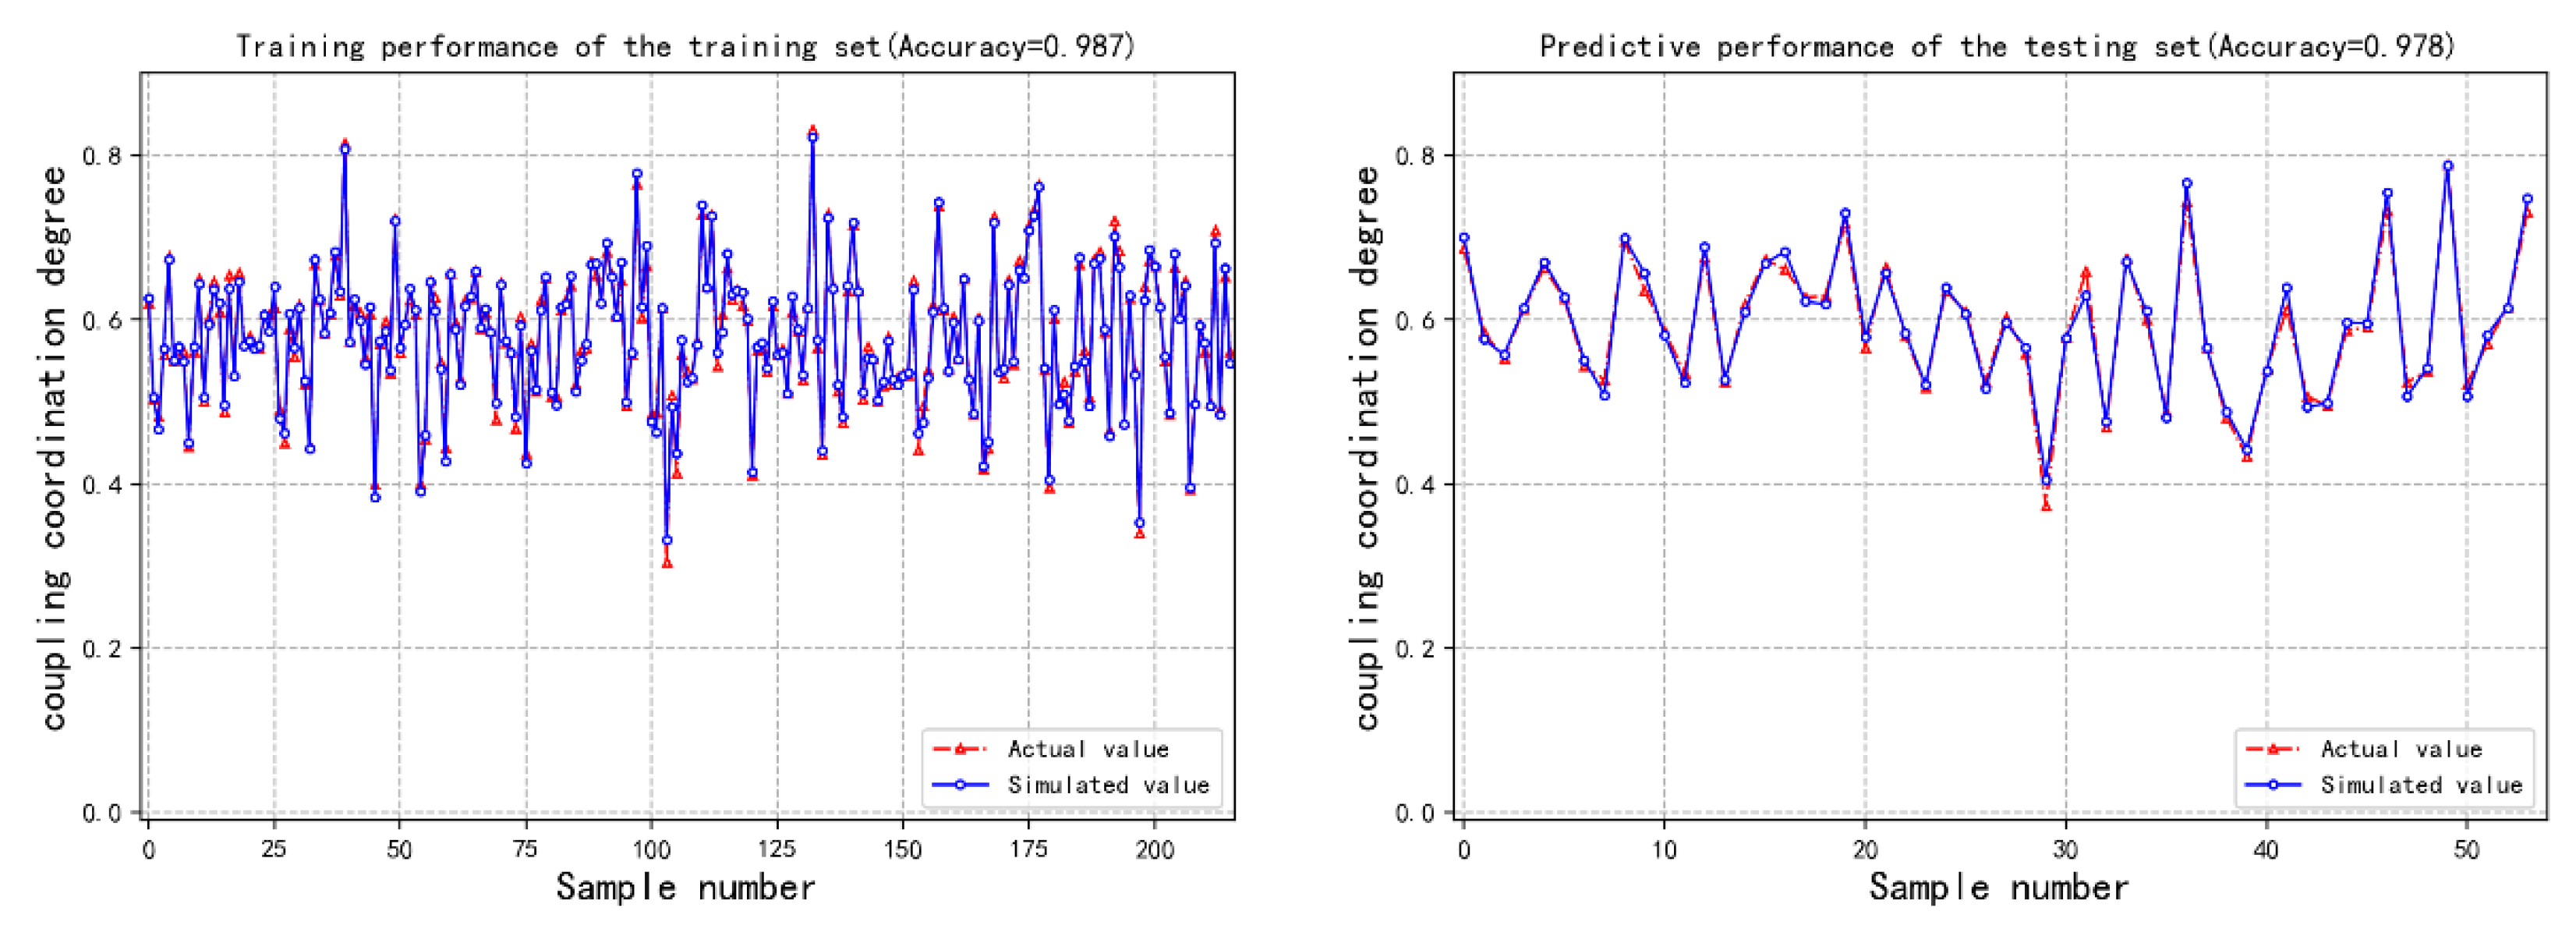
This study utilized the BP neural network to analyze the contribution differences of 31 indicators in the spatial system of smart cities to coupling coordination and identified key factors. The BP neural network algorithm was implemented using Python statistical software. Thirty-one indicators from Table 1, Table 2 and Table 3 of the spatial system of smart cities were selected as input nodes, with coupling coordination as the output node. After normalization, this study constructed 270 samples for 30 smart cities from 2011 to 2019. Among these, 216 samples were used for training and 54 for testing the neural network. After multiple simulations, satisfactory results were obtained, with the simulated values closely matching the actual values. The fitting effect for both training and testing samples was good, with accuracy rates of 98.7% and 97.8%, respectively (Figure 7). This indicates the feasibility of the model. Next, the weights from the input layer to the hidden layer and from the hidden layer to the output layer were obtained, and the contribution rates of each indicator to the coupling coordination of the spatial system of smart cities were calculated.
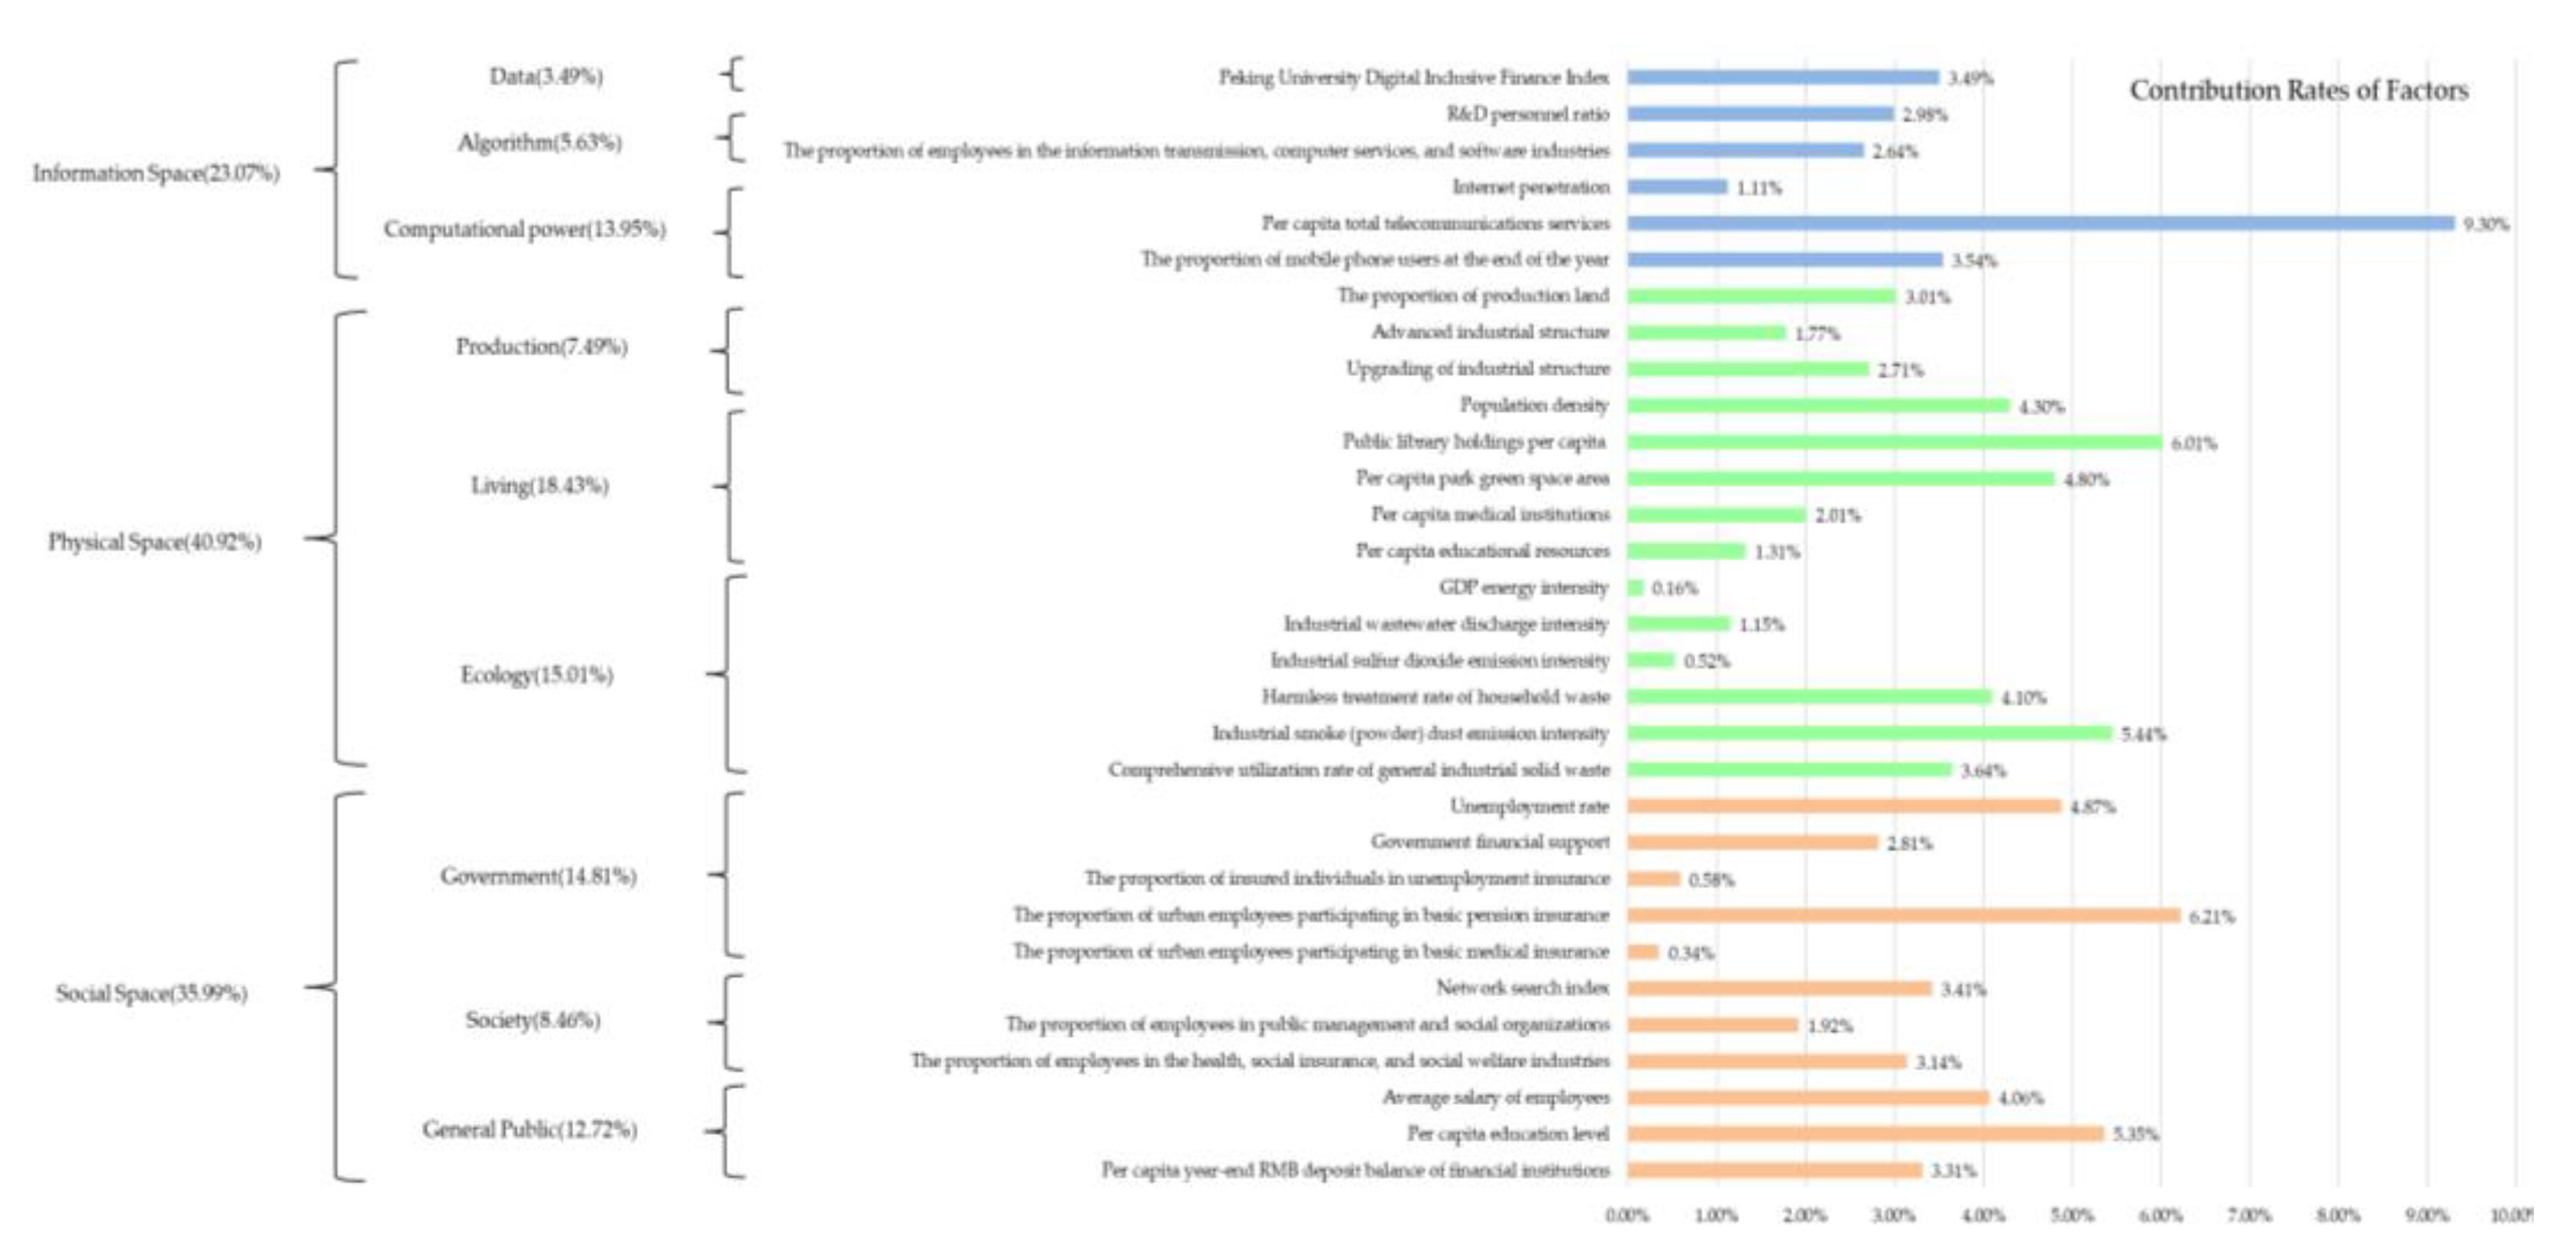
According to Figure 8, the contribution rates of information space, physical space, and social space to the coupling coordination are 23.07%, 40.92%, and 35.99%, respectively. From a data perspective, the physical space of smart cities plays the most significant role in coupling coordination. However, due to the significant differences in the number of third-level indicators divided by the spatial systems of smart cities, this study approximates the influence level by using the average indicator contribution rate of each unidimensional subsystem. The average indicator contribution rates of information space, physical space, and social space to coupling coordination are 3.845%, 2.923%, and 3.272%, respectively. Thus, it can be seen that the information space of smart cities plays the most significant role in coupling coordination, followed by social space, while physical space plays the least role. In the modern society of rapid development of emerging digital technologies, the empowering role of information space for smart cities is becoming increasingly apparent. Moreover, under the trend of diversified social governance, the effective coordination and cooperation among various governance entities can also promote the deep integration and value realization of various resource elements in smart cities. Furthermore, physical space, as the focus of development and planning in traditional development models of smart cities, has become relatively mature in the development of smart cities, and its marginal benefits are relatively low.

5. Discussion

5.1. Pathways of Development

Since the inception of smart city pilot projects in China in 2012, more than a decade has passed. However, as a metaphor for urban modernity, smart city construction remains vibrant and is still highly regarded by academia as a "new, hopeful, but contentious research field" [37], reshaping the discourse system of urban governance. It must be acknowledged that there is still a considerable distance between the practical achievements of smart city construction and the high-perception, high-intelligence systems defined by theoretical constructs. Combining the research conclusions, the following three policy recommendations are proposed for the development of smart cities in China.
Firstly, attention should be paid to the coordination of smart city spatial development to optimize spatial development patterns. There are objective differences in the resource endowments of smart city construction in different regions of China, leading to path-dependent differences in development. However, the realization of the value of smart city development requires the coupling coordination of ternary space. This necessitates strengthening the interaction and complementarity of different spatial elements in smart city planning and design. For example, in the social space, it is necessary to enhance the digital literacy and capabilities of the public compared to the government and enterprises.
Secondly, it is important to strengthen the synergy between regions and learn from innovations to promote cross-regional cooperation and complementarity. As mentioned earlier, different smart cities have different development advantages. If excellent cases, practical experiences, and common problems of smart city construction in different regions, levels, and scales can be promptly discovered, and if model replication and experience sharing between cities can be promoted, it may achieve the effect of "overtaking on a bend." For example, by establishing cross-regional digital economic cooperation platforms, mutual benefits can be achieved to jointly enhance the overall level of smart city construction in China. In addition, emphasis should be placed on encouraging cooperation and competition between cities to promote innovation and change.
Thirdly, efforts should be made to provide multidimensional support for the development of smart city spatial spaces. Local governments should tilt policies towards factors that contribute significantly, such as increasing investment in information technology infrastructure construction, promoting the cultivation and development of high-tech industries, actively introducing and cultivating professional talents, and providing intellectual support for smart city construction. At the same time, smart city construction should adhere to a people-oriented planning orientation, and in the process of development, it is necessary to implement the concept of social civilization, and promote the coordinated development of material civilization and spiritual civilization. Additionally, it is essential to properly address the increasingly serious aging issue, focus on the elderly population's pension security policies, expand social welfare coverage, and enhance public satisfaction.

5.2. Innovations and Limitations

This study has two main innovative contributions.
For one thing, we deconstruct the spatial structure of smart cities from the perspective of ternary space and constructs an evaluation index system of ternary space integration (SPI) to systematically evaluate the development level of 30 smart cities in China, providing evidence-based support for understanding the achievements and structural imbalances of China's smart city development over the past decade.
For another, through the analysis of the coupling coordination of ternary space, it deconstructs the important driving forces behind the development of smart cities in different regions, providing reference for understanding the strategic choices of smart city development in China's digital era. Additionally, this study considers the interaction among the overall system, two-dimensional subsystems, and one-dimensional subsystems but does not consider the interaction effects among different indicators within one-dimensional subsystems, which still needs further analysis.

Author Contributions

C.W. , C.Z. and M.D contributed to the study conception and design. Material preparation and data processing was performed by C.Z. and M.D. The first draft of manuscript was written by C.W. C.Z. revised and improved manuscript. All authors have read and agreed to the published version of the manuscript.

Funding

This research was funded by The Ministry of Education of Humanities and Social Science Project (Grant number: 23YJC630173); & Social Science Fund of Jiangsu Province, China (Grant number: 23YJC630173); & National Social Science Fund (Grant number: 23ZDA117); and National Social Science Fund (Grant number:22AZD086).

Data Availability Statement

The original contributions presented in the study are included in the article, further inquiries can be directed to the corresponding author.

Conflicts of Interest

The authors declare no conflicts of interest.

References

  1. Shelton T, Zook M, Wiig A. The ‘actually existing smart city’. Cambridge journal of regions, economy and society 2015, 8, 13–25. [Google Scholar] [CrossRef]
  2. Khatibi, H.; Wilkinson, S.; Sweya, L.N.; Baghersad, M.; Dianat, H. Navigating Climate Change Challenges through Smart Resilient Cities: A Comprehensive Assessment Framework. Land 2024, 13, 266. [Google Scholar] [CrossRef]
  3. Qiu Z. Establishment and Countermeasures of Smart City Security Risk Assessment Model. Advances in Computer and Communication 2023, 3. [Google Scholar]
  4. Laufs J, Borrion H, Bradford B. Security and the smart city: A systematic review. Sustainable cities and society 2020, 55, 102023. [Google Scholar] [CrossRef]
  5. Shuhai N,Kexin Z,Juan Z, et al. How Does Industrial Upgrading Affect Urban Ecological Efficiency? New Evidence from China. Emerging Markets Finance and Trade. 2024, 60, 899–920. [Google Scholar] [CrossRef]
  6. Zheng Lei. Content, Path and Direction of Urban Digital Transformation. Exploration and Free Views 2021, 4, 147–152. [Google Scholar]
  7. Al Sharif R, Pokharel S. Smart city dimensions and associated risks: Review of literature. Sustainable Cities and Society 2022, 77, 103542. [Google Scholar] [CrossRef]
  8. Patrão C, Moura P, Almeida A T. Review of smart city assessment tools. Smart Cities 2020, 3, 1117–1132. [Google Scholar] [CrossRef]
  9. Sharifi, A. A typology of smart city assessment tools and indicator sets. Sustainable cities and society 2020, 53, 101936. [Google Scholar] [CrossRef]
  10. Y D,K. F A,A. A M B.Developing a Comprehensive Smart City Rating System: Case of Riyadh, Saudi Arabia. Journal of Urban Planning and Development 2024, 150, 04024012. [Google Scholar] [CrossRef]
  11. 11. Joyce A ,Javidroozi V .Smart city development: Data sharing vs. data protection legislations. Cities.
  12. 12. Sorri K ,Yrjönkoski K ,Seppänen M .Smart cities, smarter values: Unpacking the ecosystem of urban innovation. Technology in Society.
  13. José R,Rodrigues H. A Review on Key Innovation Challenges for Smart City Initiatives. Smart Cities 2024, 7, 141–162. [Google Scholar] [CrossRef]
  14. Kavitha M M,Golden E J. Smarter and resilient smart contracts applications for smart cities environment using blockchain technology. Automatika 2024, 65, 572–583. [Google Scholar] [CrossRef]
  15. Skyworks Showcases Technologies for Smart Cities, Automotive and More at CES. Telecomworldwire 2024.
  16. Deveci M, Pekaslan D, Canıtez F. The assessment of smart city projects using zSlice type-2 fuzzy sets based Interval Agreement Method. Sustainable cities and society 2020, 53, 101889. [Google Scholar] [CrossRef]
  17. Xiang Yuqiong, Xie Xinshui. Digital twin city governance: changes, dilemmas and countermeasures. E-Government 2021, 10, 69–80. [Google Scholar]
  18. Mei Jie. Technology adapts to the city: Subject oppression and ethical dilemmas in digital transformation. Theory and Reform 2021, 3, 90–101. [Google Scholar]
  19. Mao Zijun, Huang Yingxu, Xu Xiaolin. Information Security Risk Analysis and Countermeasures of Smart City from the Perspective of Information Ecology. Chinese Public Administration 2019, 9, 123–129. [Google Scholar]
  20. Zou Weizhong,Zhang Liyun. From Compartmentalization to Integration:The Compartmentalization Dilemma of Smart Cities and Strategies for Reconfiguring the Socio-Technical Imagination. Journal of Tianjin Administration Institute 2023, 25, 53–64. [Google Scholar]
  21. Bhattacharya T R, Bhattacharya A, Mclellan B, et al. Sustainable smart city development framework for develo** countries. Urban Research & Practice 2020, 13, 180–212. [Google Scholar]
  22. Richey B, F. Risk Management Framework 2.0[D]. Iowa State University.
  23. Hiller J S, Russell R S. Privacy in crises: The NIST privacy framework. Journal of Contingencies and Crisis Management 2017, 25, 31–38. [Google Scholar] [CrossRef]
  24. AbdullahH A,Nizam HT,KutubT. The Evolution of Information Security Strategies: A Comprehensive Investigation of INFOSEC Risk Assessment in the Contemporary Information Era. Computer and Information Science 2023, 16, 1. [Google Scholar] [CrossRef]
  25. Sun Xiangqian, Liu Na. The Governance of Urban Community Public Space from the Perspective of Space Theory. Shanghai Urban Management 2022, 31, 61–67. [Google Scholar]
  26. Yang Liu, Gan Quanxin, Ma Deshui. Public environmental concern and corporate environmental investment—from the perspective of the moderating effect of green image. Finance and Accounting Monthly 2020, 8, 33–40. [Google Scholar]
  27. Shan Zhiguang, Xu Qingyuan, Ma Chaojiang, et al. Digital economy development evaluation system and prospects based on ternary space theory. Macroeconomic Management 2020, 2, 42–49. [Google Scholar]
  28. LIU Xizhao, LI Xiaoshun, HE Weikang, et al. The Coupling Coordination Degree of Human-Land and the Spatial Allocation of “Production-Living-Ecological”: A Case Study of Jiangsu Province. Modern Urban Research 2022, 10, 66–72. [Google Scholar]
  29. Zhang Juntao, Zhai Jingtong. Measurement of coupling coordination degree in China’s “Three Living Spaces”. Urban Problems 2019, 11, 38–44. [Google Scholar]
  30. Xie Guogen, Jiang Shiquan, Zhao Chunyan. Analysis of the coupling coordination level of regional economy, urbanization and social governance. Statistics & Decision 2020, 36, 127–130. [Google Scholar]
  31. Zou Xiuqing, Xie Meihui, Xiao Zegan, et al. EVALUATION OF RURAL DEVELOPMENT AND DIAGNOSIS OF OBSTACLE FACTORS BASED ON ENTROPY WEIGHT TOPSIS METHOD. Chinese Journal of Agricultural Resources and Regional Planning 2021, 42, 197–206. [Google Scholar]
  32. LI Ruzi, HUANG Xiaoling, LIU Yaobin. Spatio-temporal differentiation and influencing factors of China's urbanization from 2010 to 2020. Acta Geographica Sinica 2023, 78, 777–791. [Google Scholar]
  33. WANG Shu-jia, KONG Wei, REN Liang, et al. Research on misuses and modification of coupling coordination degree model in China. Journal of Natural Resources 2021, 36, 793–810. [Google Scholar] [CrossRef]
  34. WU Chuangqing, ZHOU Xiyimin, HuangCheng. Study on the coupling and coordination relationship between the optimization of industrial structure and the construction of ecological civilization of ecological civilization in the Yangtze River Economic Belt. Journal of Central China Normal University(Natural Sciences) 2020, 54, 555–566. [Google Scholar]
  35. GE Shi-shuai, ZENG Gang, YANG Yang, et al. The coupling relationship and spatial characteristics analysis between ecological civilization construction and urbanization in the Yellow River Economic Belt. Journal of Natural Resources 2021, 36, 87–102. [Google Scholar] [CrossRef]
  36. SHEN Hua-yu, WANG Zhao-xia, GAO Cheng-yao, et al. Determining the number of BP neural network hidden layer units. Journal of Tianjin University of Technology 2008, 5, 13–15. [Google Scholar]
  37. MengFankun,WuXiangling. Revisiting “Smart City” : Three Basic Research Questions———Based on a Systematic Review of English Literature. Public Administration and Policy Review.
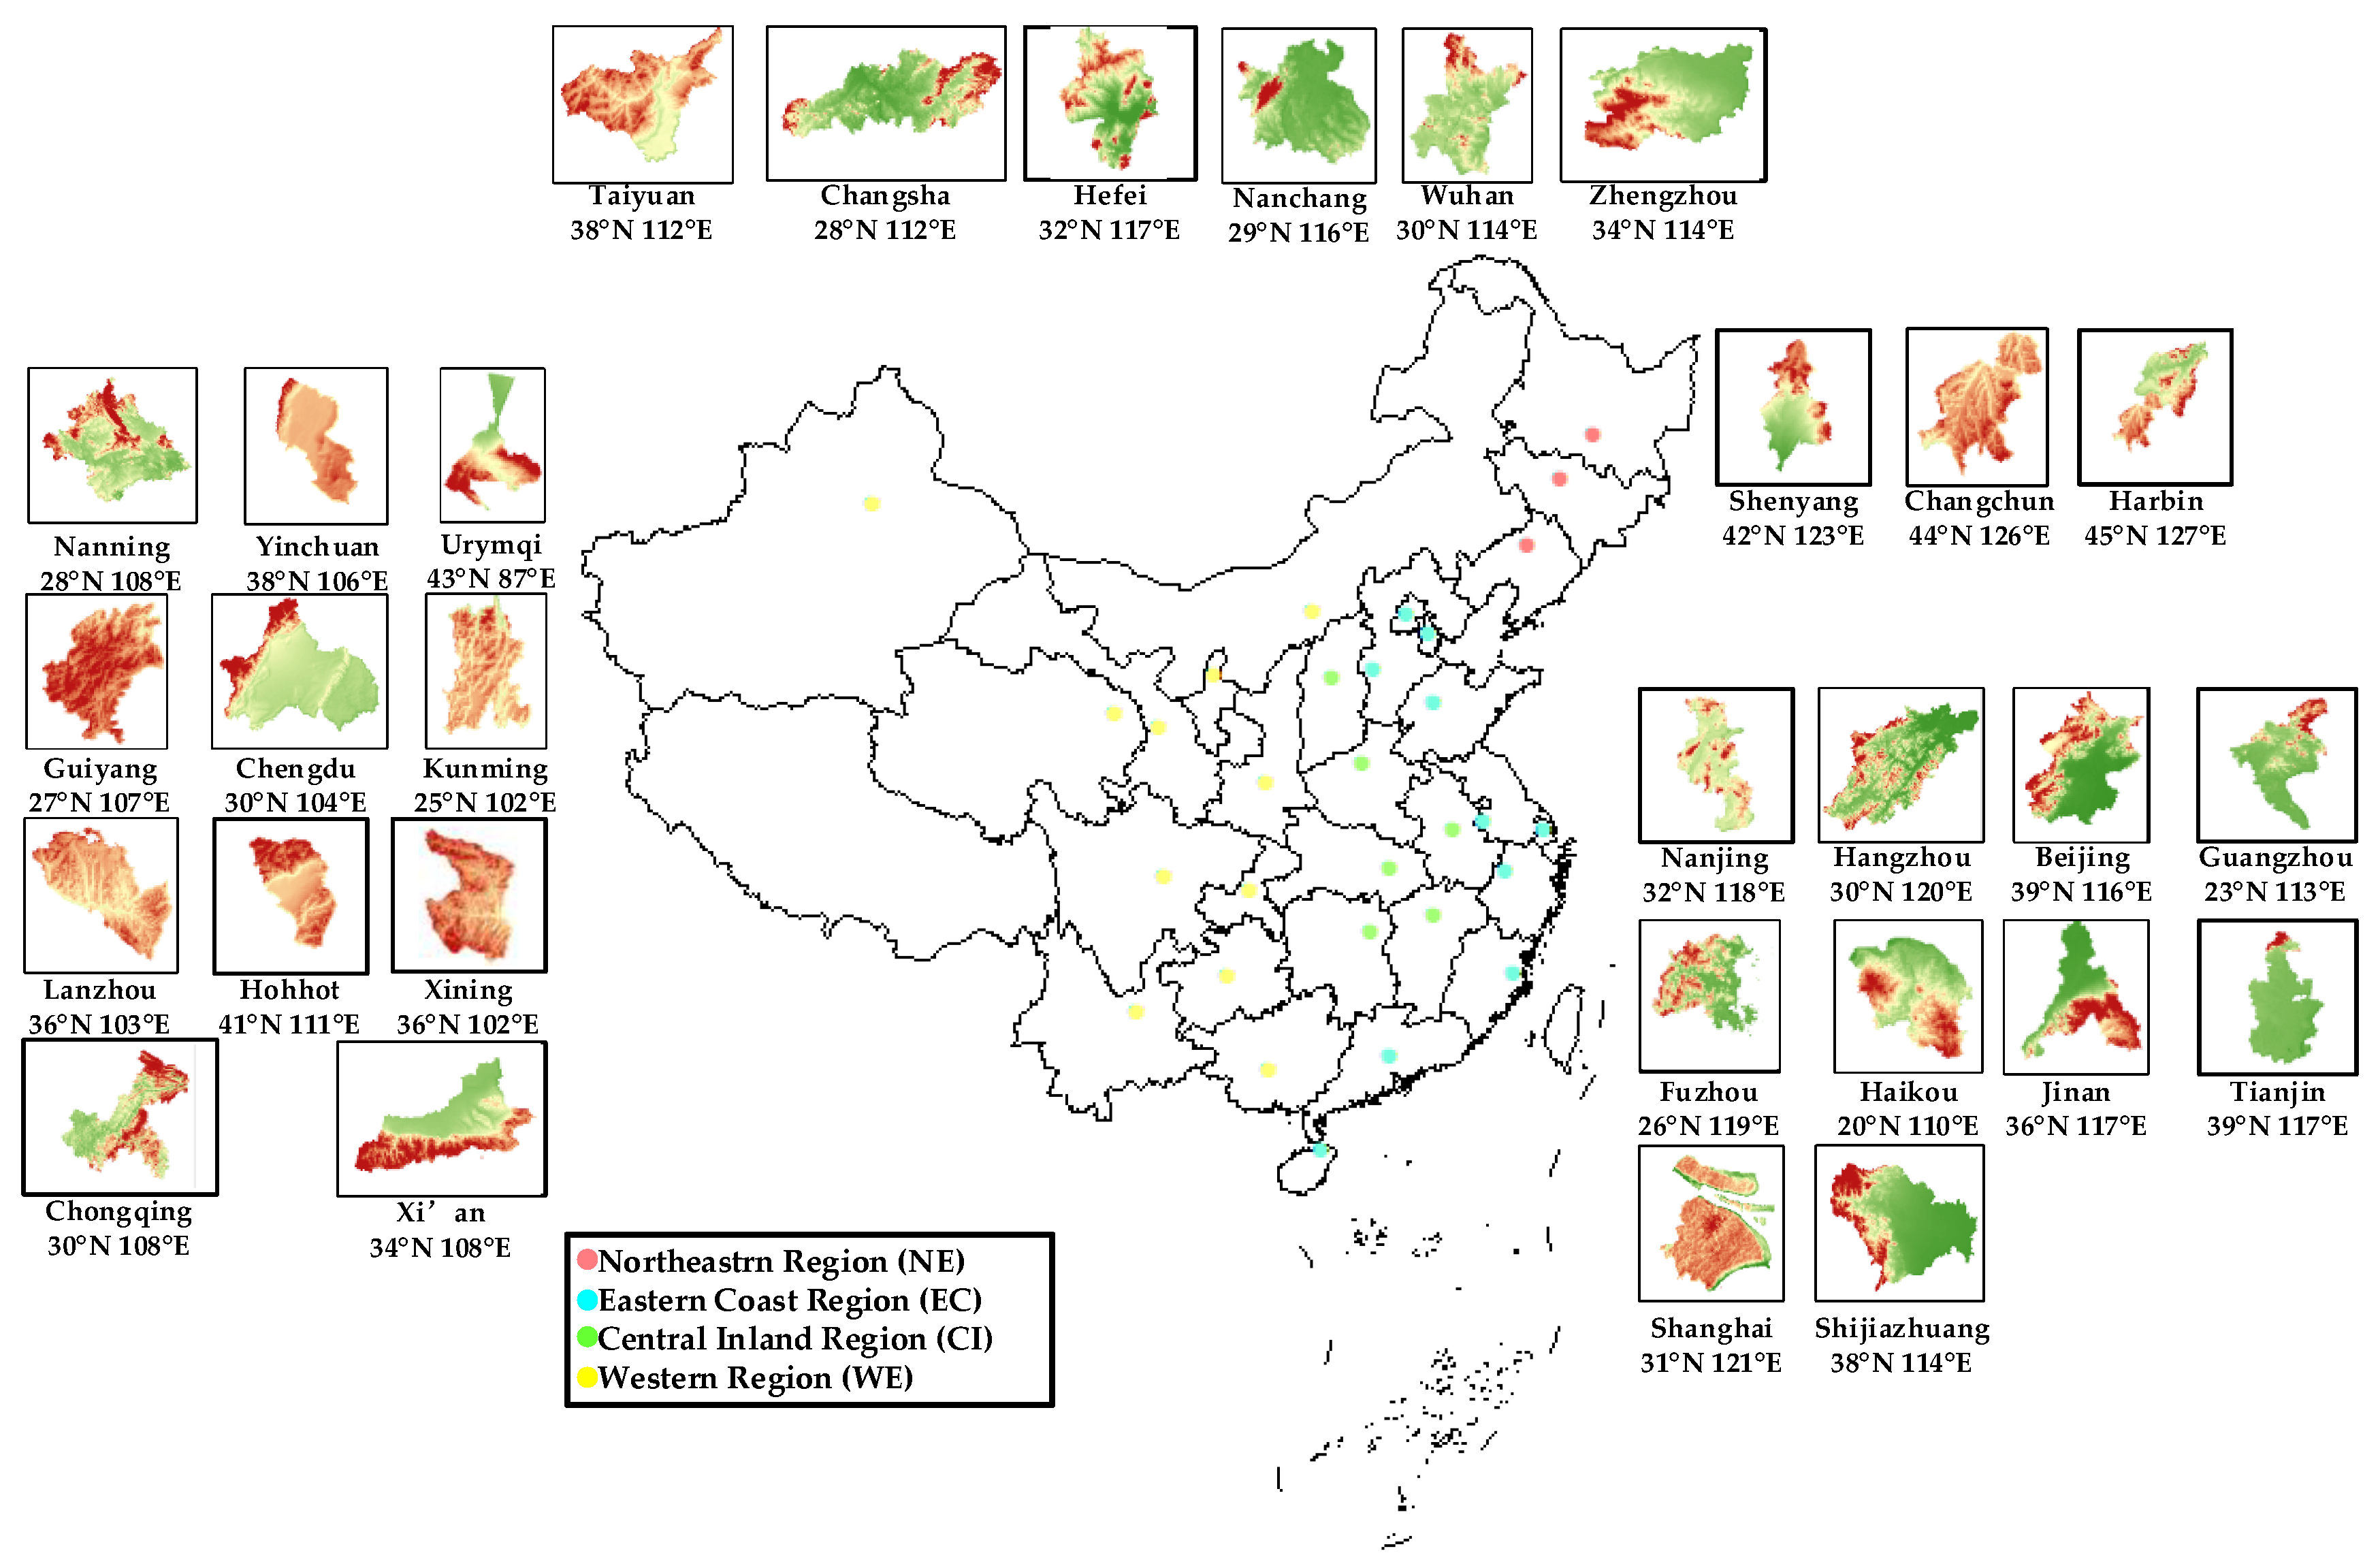
Figure 1. Study Area of 30 national or provincial capitals.
Preprints 104135 g001
Figure 3. Comprehensive assessment of smart city spatial development.
Preprints 104135 g003
Figure 4. The smart city spatial development assessment index of subsystems of in 2011 and 2019.
Preprints 104135 g004
Figure 5. The average level of smart city spatial development from 2011 to 2019.
Preprints 104135 g005
Figure 6. The Kernel Density of Spatial Coupling Coordination of Smart Cities from 2011 to 2019.
Preprints 104135 g006
Figure 7. The Kernel Density of Spatial Coupling Coordination of Smart Cities from 2011 to 2019.
Preprints 104135 g007
Figure 8. Contribution Rates of Factors in the Coupling Coordination of Smart City Spatial Systems Analyzed Based on BP Neural Network.
Preprints 104135 g008
Table 1. List of SPI-based indices for smart city evaluation of Informational Space.
Target Level Standardized Layer Index Layer Index Properties Weight
Informational Space subsystem indices Data Peking University Digital Inclusive Finance Index + 0.167
Algorithm R&D personnel ratio(%) + 0.168
The proportion of employees in the information transmission, computer services, and software industries(%) + 0.163
Computational
power
Internet penetration(%) + 0.170
Per capita total telecommunications services(yuan) + 0.169
The proportion of mobile phone users at the end of the year(%) + 0.164
Table 2. List of SPI-based indices for smart city evaluation of Physical Space.
Target Level Standardized Layer Index Layer Index Properties Weight
Physical
Space subsystem indices
Production The proportion of production land(%) + 0.067
Advanced industrial structure(%) + 0.071
Upgrading of industrial structure(%) + 0.068
Living Population density(%) 0.073
Public library holdings per capita (volumes) + 0.072
Per capita park green space area(square meters) + 0.073
Per capita medical institutions + 0.067
Per capita educational resources(persons) + 0.067
Ecology GDP energy intensity(yuan/billion kilowatt hours) 0.074
Industrial wastewater discharge intensity(%) 0.074
Industrial sulfur dioxide emission intensity(%) 0.074
Harmless treatment rate of household waste(%) + 0.074
Industrial smoke (powder) dust emission intensity(%) 0.074
Comprehensive utilization rate of general industrial solid waste(%) + 0.073
Table 3. List of SPI-based indices for smart city evaluation of Social Space.
Target Level Standardized Layer Index Layer Index Properties Weight
Social
Space subsystem indices
Government Unemployment rate(%) 0.096
Government financial support(%) + 0.091
The proportion of insured individuals in unemployment insurance(%) + 0.087
The proportion of urban employees participating in basic pension insurance(%) + 0.089
The proportion of urban employees participating in basic medical insurance(%) + 0.089
Society Network search index + 0.093
The proportion of employees in public management and social organizations(%) + 0.093
The proportion of employees in the health, social insurance, and social welfare industries(%) + 0.091
General Public Average salary of employees(yuan) + 0.091
Per capita education level(year) + 0.092
Per capita year-end RMB deposit balance of financial institutions(yuan) + 0.090
Table 4. Criteria for classifying SPI-based coupling coordination levels indices.
Coordination Phase Degree of Coupling Coordination Coordination Index
Disordered type Extremely disordered (0,0.1]
Severely disordered (0.1,0.2]
Mildly disordered (0.2,0.3]
Endangered coordination (0.3,0.4]
Transition type Fragile coordination (0.4,0.5]
Barely coordination (0.5,0.6]
Basic coordination (0.6,0.7]
Coordinated development Intermediate coordination (0.7,0.8]
Well-coordinated (0.8,0.9]
High-quality coordination (0.9,1]
Table 5. Spatial coupling coordination of smart cities from 2011 to 2019.
City (Ranked) 2011 2012 2013 2014 2015 2016 2017 2018 2019
Beijing 0.655 0.687 0.717 0.733 0.744 0.765 0.790 0.815 0.832
Guangzhou 0.655 0.685 0.668 0.724 0.728 0.730 0.738 0.734 0.765
Shanghai 0.602 0.614 0.659 0.647 0.663 0.696 0.709 0.721 0.725
Hangzhou 0.561 0.617 0.618 0.683 0.664 0.673 0.717 0.729 0.731
Nanjing 0.610 0.615 0.609 0.648 0.650 0.671 0.668 0.683 0.715
Jinan 0.562 0.563 0.606 0.629 0.652 0.660 0.673 0.675 0.672
Wuhan 0.562 0.580 0.608 0.652 0.642 0.649 0.663 0.662 0.666
Changsha 0.530 0.566 0.588 0.601 0.626 0.651 0.678 0.675 0.678
Shenyang 0.597 0.604 0.590 0.624 0.612 0.618 0.634 0.647 0.645
Xi'an 0.540 0.565 0.586 0.621 0.635 0.626 0.647 0.627 0.666
Lanzhou 0.521 0.528 0.570 0.585 0.627 0.625 0.641 0.641 0.664
Zhengzhou 0.523 0.527 0.561 0.567 0.606 0.619 0.657 0.647 0.673
Tianjin 0.520 0.561 0.557 0.604 0.596 0.606 0.624 0.635 0.656
Harbin 0.539 0.551 0.566 0.606 0.613 0.609 0.620 0.610 0.636
Guiyang 0.511 0.554 0.553 0.579 0.598 0.597 0.640 0.650 0.657
Average 0.515 0.534 0.551 0.574 0.580 0.596 0.621 0.625 0.640
Chongqing 0.539 0.513 0.527 0.584 0.565 0.618 0.618 0.623 0.626
Shijiazhuang 0.554 0.538 0.543 0.556 0.558 0.571 0.610 0.603 0.613
Nanning 0.495 0.531 0.553 0.559 0.571 0.585 0.603 0.608 0.624
Chengdu 0.524 0.531 0.524 0.572 0.558 0.572 0.605 0.615 0.624
Haikou 0.498 0.502 0.533 0.540 0.560 0.580 0.606 0.614 0.630
Fuzhou 0.468 0.518 0.546 0.561 0.571 0.574 0.627 0.599 0.600
Taiyuan 0.503 0.503 0.539 0.538 0.558 0.565 0.586 0.586 0.635
Changchun 0.488 0.495 0.501 0.535 0.523 0.536 0.564 0.591 0.613
Hefei 0.485 0.507 0.492 0.534 0.539 0.513 0.549 0.566 0.590
Nanchang 0.419 0.475 0.488 0.522 0.501 0.534 0.575 0.579 0.603
Urumqi 0.455 0.443 0.485 0.481 0.485 0.506 0.544 0.537 0.561
Yinchuan 0.437 0.466 0.475 0.434 0.445 0.508 0.524 0.525 0.536
Kunming 0.373 0.396 0.450 0.479 0.469 0.475 0.528 0.548 0.564
Hohhot 0.413 0.442 0.412 0.436 0.447 0.490 0.482 0.500 0.507
Xining 0.304 0.341 0.394 0.401 0.400 0.444 0.506 0.495 0.487
Table 6. Regional Disparities of Spatial Coupling Coordination of Smart Cities.
Year The overall
Gini coefficient
The intra-group
Gini coefficient
The inter-group
Gini coefficient
The contribution of
hyperdensity
2011 0.080 0.020 0.047 0.013
2012 0.076 0.019 0.047 0.011
2013 0.071 0.017 0.043 0.011
2014 0.076 0.019 0.045 0.012
2015 0.077 0.019 0.044 0.014
2016 0.070 0.017 0.039 0.014
2017 0.062 0.015 0.037 0.010
2018 0.062 0.015 0.037 0.010
2019 0.060 0.015 0.036 0.009
Table 7. Decomposition of Dagum Gini Coefficient..
Decomposition 2011 2012 2013 2014 2015 2016 2017 2018 2019
The intra-group
Gini coefficient
EC 0.059 0.058 0.054 0.058 0.055 0.056 0.048 0.054 0.056
NE 0.045 0.044 0.036 0.034 0.035 0.031 0.026 0.021 0.011
CI 0.048 0.039 0.046 0.043 0.049 0.051 0.044 0.038 0.029
WE 0.085 0.077 0.069 0.077 0.083 0.065 0.056 0.054 0.058
The inter-group
Gini coefficient
EC-WE 0.109 0.106 0.099 0.106 0.105 0.094 0.085 0.087 0.087
EC-CI 0.075 0.069 0.066 0.069 0.067 0.065 0.060 0.058 0.056
EC-NE 0.059 0.060 0.061 0.058 0.064 0.070 0.061 0.062 0.056
NE-WE 0.088 0.081 0.066 0.077 0.077 0.058 0.049 0.048 0.047
NE-CI 0.056 0.048 0.043 0.045 0.046 0.046 0.042 0.034 0.027
CI-WE 0.073 0.068 0.067 0.074 0.078 0.066 0.060 0.057 0.055
Disclaimer/Publisher’s Note: The statements, opinions and data contained in all publications are solely those of the individual author(s) and contributor(s) and not of MDPI and/or the editor(s). MDPI and/or the editor(s) disclaim responsibility for any injury to people or property resulting from any ideas, methods, instructions or products referred to in the content.
Copyright: This open access article is published under a Creative Commons CC BY 4.0 license, which permit the free download, distribution, and reuse, provided that the author and preprint are cited in any reuse.
Prerpints.org logo

Preprints.org is a free preprint server supported by MDPI in Basel, Switzerland.

Subscribe

© 2024 MDPI (Basel, Switzerland) unless otherwise stated