1. Introduction
The p53 protein coded by
TP53 is best-known for inhibition of the cell cycle and activation of apoptosis [
1]. However, p53 protein acts not only as the tumor suppressor, but also shows antiviral activity, e.g. by stimulating the expression of innate and adaptive immunity genes. For this reason, p53 is a frequent target of inactivation by proteins coded by viruses [
2]. Notably, p53 was discovered as a protein bound and inactivated by large T antigen of the SV40 virus [
3]. Furthermore, p53 is a transcription regulator, which directly activates at least several hundred of genes [
4]. There is also a large group of genes repressed by p53, however, this repression is executed indirectly, by activating the gene for p21 protein, which inhibits cyclin-dependent kinases, what in turn promotes the formation of repressive complexes on genes coding for cell cycle genes [
5]. Interestingly, p53 activates the expression of many genes, which are also stimulated by interferons [
6].
Interferons are cytokines, which regulate both innate and adaptive immunity and play a major role in the defense against viruses and bacteria. Interferons are strong activators of gene expression. Their activity is mediated by transcription factors from the STAT family. There are three types of interferons, each signals through different receptors. The best-studied are interferons α (IFNα) and β (IFNβ) (type I) and interferon γ (IFNγ, type II). IFNα can be secreted by all cells, whereas IFNγ is secreted only by T cells and natural killer cells. The activity of interferons-α and interferon-γ critically depends on STAT1 transcription factor. Binding of type I interferons to their cognate receptor induces its dimerization, which in turn activates two kinases JAK1 and TYK2. Activated kinases phosphorylate interferon receptor on target tyrosine residues, what creates a docking site for STAT1 and STAT2 transcription regulators, which become phosphorylated on a critical tyrosine residues – Tyr701 on STAT1 and Tyr690 on STAT2. Phosphorylated STAT1 and STAT2 bind to the IRF9 protein and as a trimer known as interferon-stimulated gene factor 3 (ISGF3) bind to the DNA sequence known as interferon-stimulated response element (ISRE) and activate a set of interferon-stimulated genes (ISGs). IFNγ binds to its own receptor and induces the activating phosphorylation of STAT1 on Tyr701. Phosphorylated STAT1 forms a homodimer known as γ-activated factor (GAF) and activates its own set of genes. The general term interferon-stimulated genes is slightly misleading because type I and type II interferons activate different but overlapping sets of genes [
7].
The signaling pathways activated by interferon-α or interferon-γ have negative regulators. One of them is the SOCS1 protein, which prevents STAT1 phosphorylation. The
SOCS1 gene is activated by interferon-γ and it is an important element of the negative feedback loop in this signaling pathway [
8,
9]. Previously, we found that the
SOCS1 gene is positively regulated by p53. We tested the regulation of SOCS1 by p53 because we noticed that strong activation of p53 was associated with the reduced phosphorylation of STAT1 on Tyr701 initiated by IFNα. The logical explanation of this observation was that p53 activates the negative regulator of phosphorylation of STAT1 on Tyr701. We found that in p53-deficient cells the activation of
SOCS1 is attenuated, what indicates that p53 at least indirectly activates the expression of
SOCS1 [
10]. Thus, based on this observation, we hypothesized that strong activation of p53 can attenuate the expression of genes regulated by phosphorylated STAT1, e.g., the genes activated by either interferon α or γ. We started this study by testing this hypothesis.
3. Discussion
The interactions between signaling pathways governed by interferons and by p53 were presented in our recent review [
18] and in reviews prepared by others [
2,
19]. However, it must be stressed that the name interferons comprises distinct protein families, which are synthesized by various cells in reaction to diverse stimuli and elicit differing effects in target cells. Thus, speaking about interferon one must be explicit about the type of the cytokine. In this work we selected interferons belonging to two types – type I interferon-α1 and type II interferon-γ. Previously, we demonstrated that important negative regulator of cytokine signaling (including type I and type II interferons) – the
SOCS1 gene, is activated in p53-dependent fashion in A549 lung cancer cell line [
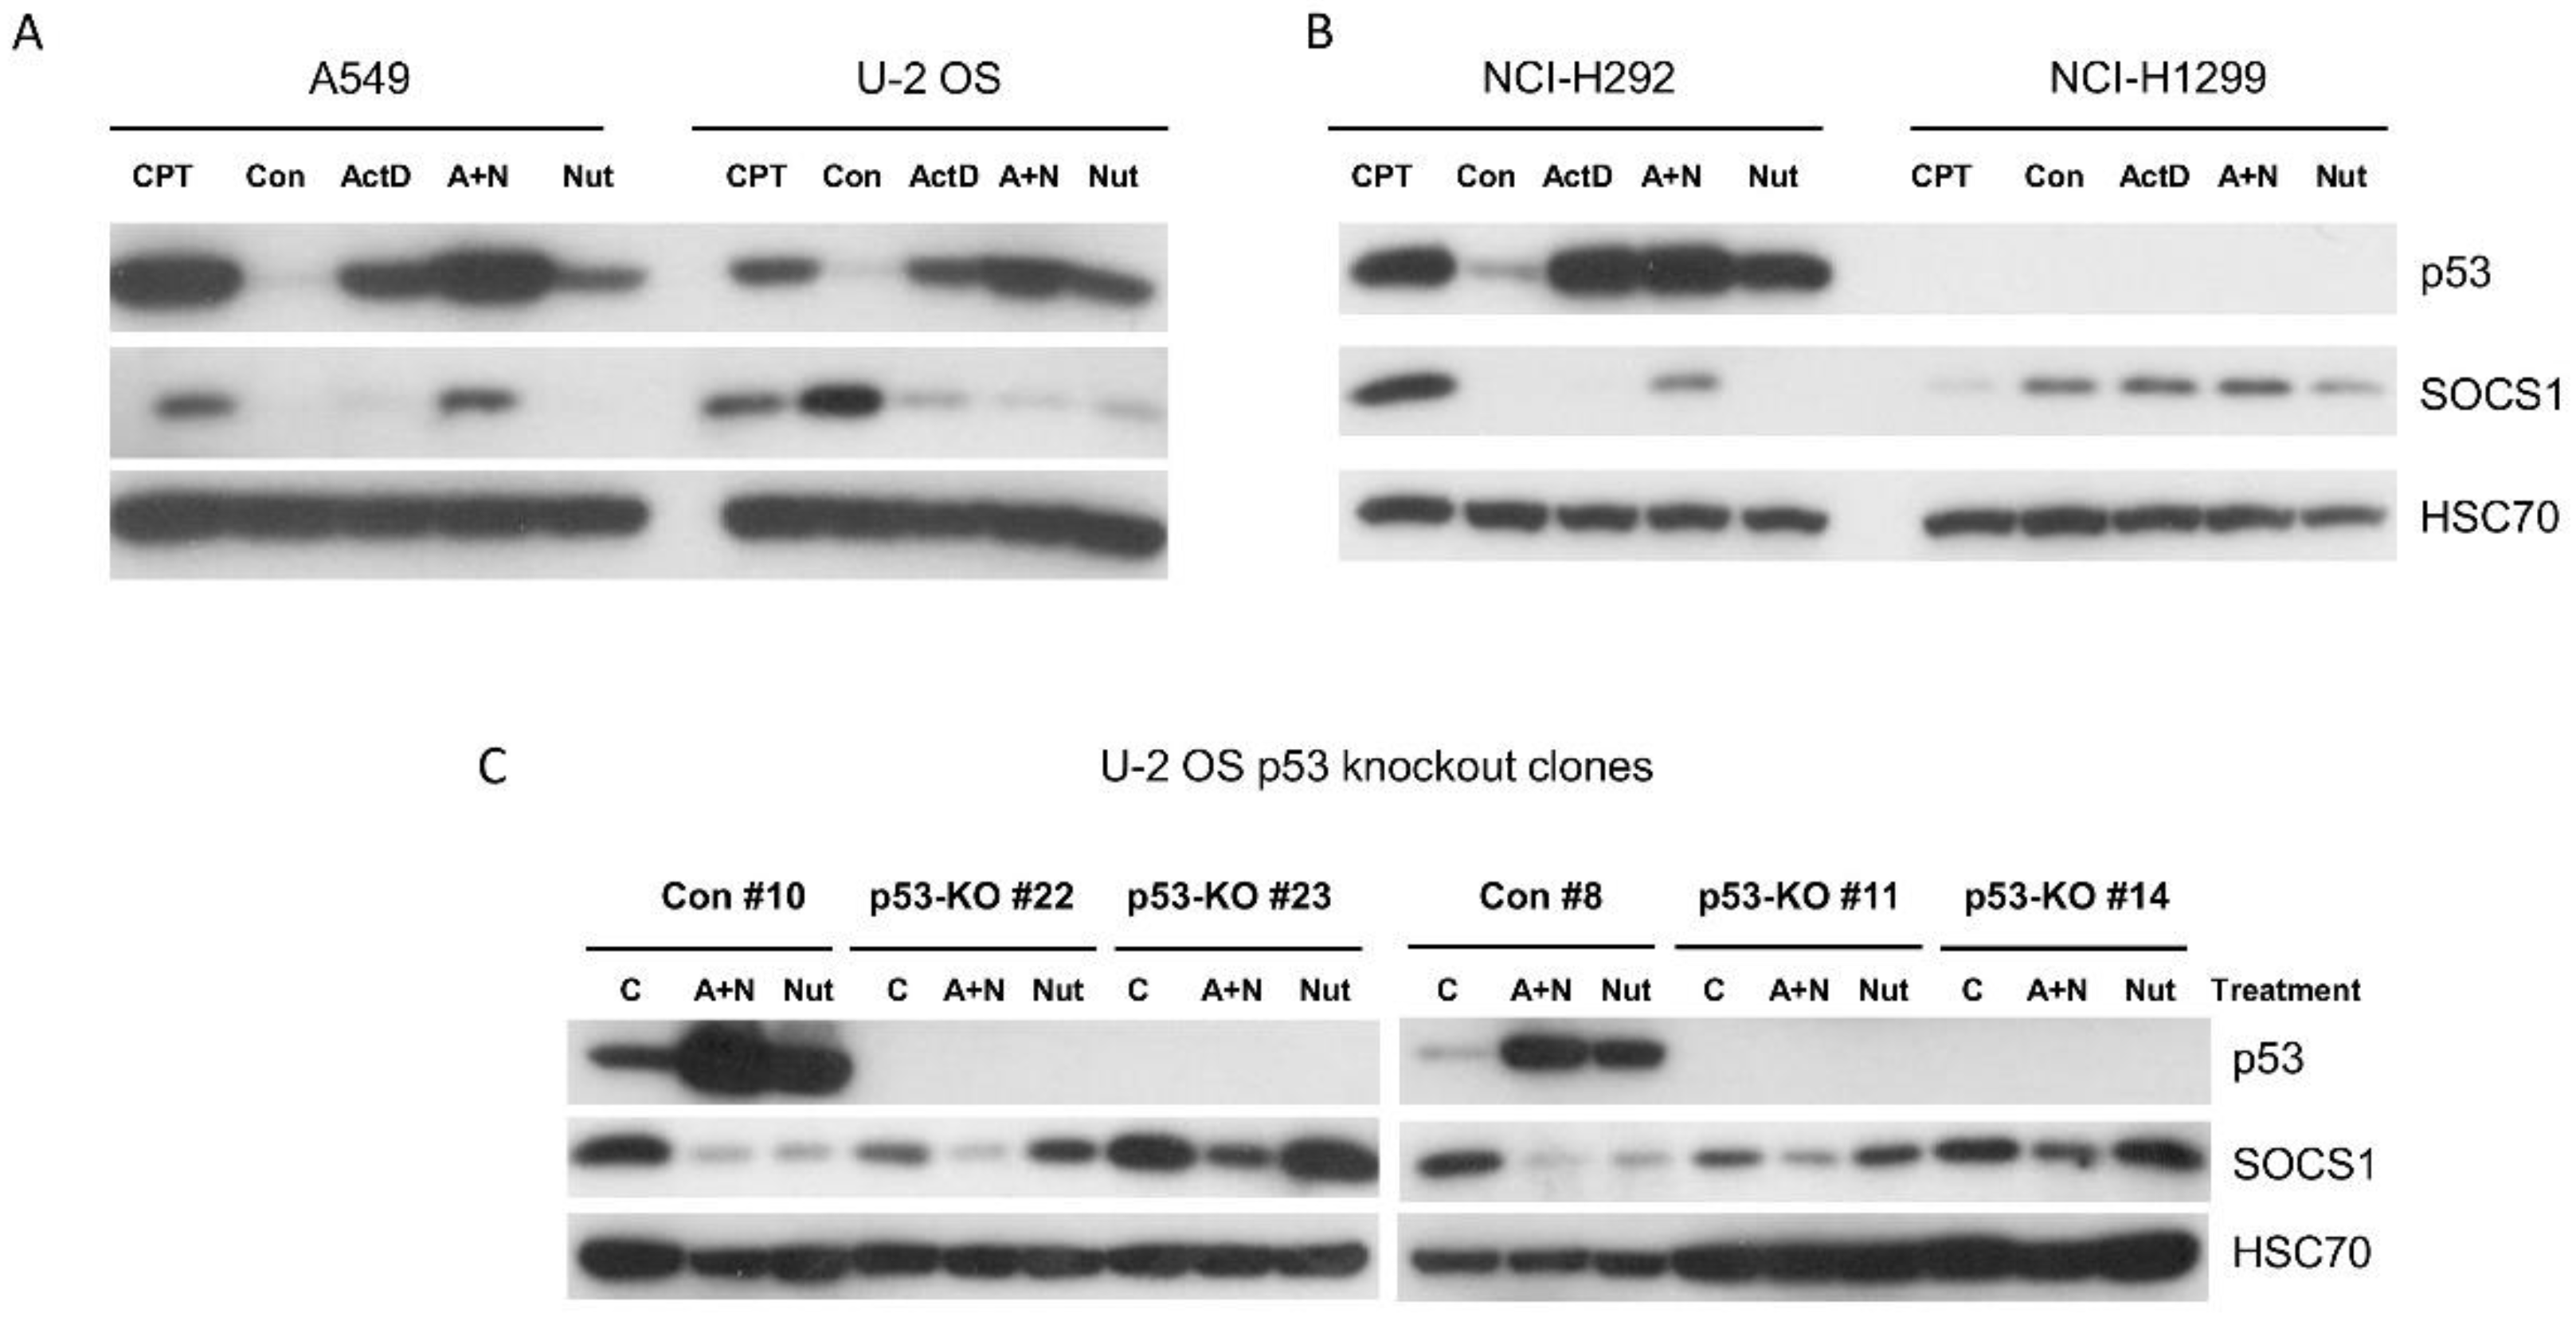
10]. We started the current study with testing whether SOCS1 is induced by various p53 activators in other cancer cell lines. We found that this protein is upregulated by strong p53 activators in A549 and NCI-H292 cells (lung cancers), which express a low level of SOCS1 during normal growth conditions. Expectedly, in p53-null lung cell line NCI-H1299, neither p53 activator stimulated expression of SOCS1. Surprisingly, in U-2 OS cell line (osteosarcoma), which expresses high amount of SOCS1 in normal growth conditions, the expression of this protein was repressed by actinomycin D, nutlin-3a and both substances acting together (A+N). However, in p53 knockout clones, nutlin-3a but not A+N, was not able to repress SOCS1. Thus, in this cell line, the expression of SOCS1 is repressed by p53 activated by nutlin-3a but not by p53 activated by A+N. In our opinion, this is a very interesting observation, which should be extended in further studies. Why is p53 able to suppress SOCS1 when activated by nutlin-3a and is not able to do so when activated by A+N? This is another observation, which supports the idea that p53 activated by various stress factors has different biological properties. Moreover, our observation suggests that the direction of the change of a gene expression by p53 protein may depend on the steady state expression level of the gene. In cells with low level, the activated p53 may stimulate expression, whereas in cells with high level, the activated p53 may repress it. Our observations are consistent with the published transcriptomic data, which demonstrated the upregulation of
SOCS1 by p53 in 12 reports and its downregulation by p53 in 9 reports [
4]. Our data also suggest, that cancer cells differ in the steady-state level of SOCS1 what is consistent with data published by others [
20]. Interestingly, depending on the context,
SOCS1 can behave either as an oncogene or as a tumor suppressor [
21]. It may be hypothesized that cancer cells with high expression of SOCS1 are more resistant to the anticancer properties of interferon-y. Thus, the level of this cytokine in tumor microenvironment might determine the selection pressure for expression of SOCS1.
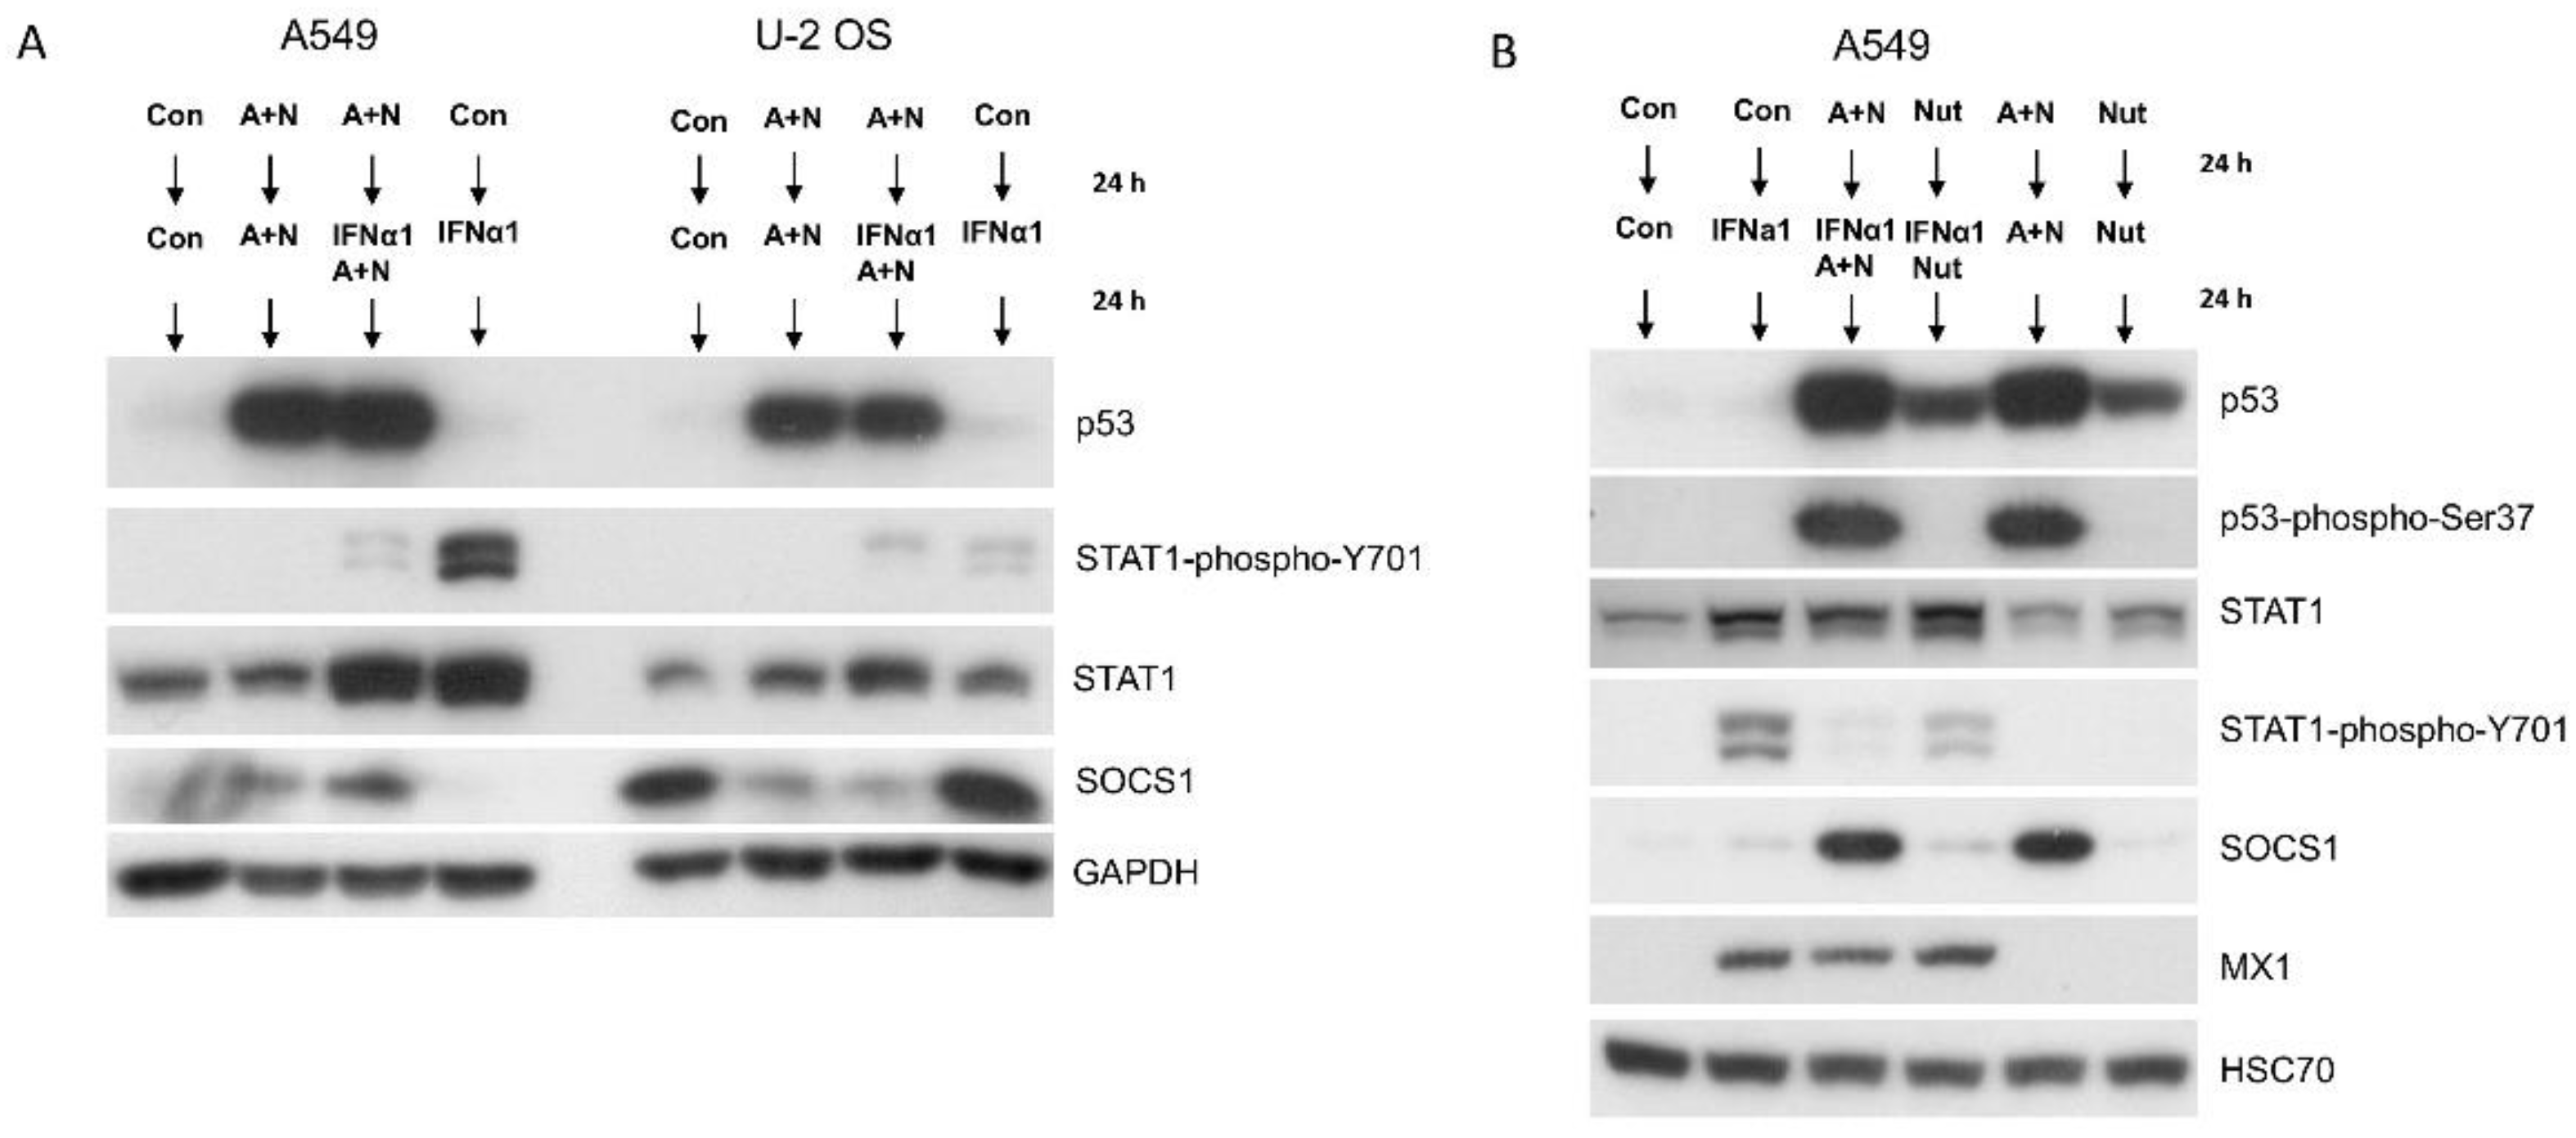
Next we found that p53 activated by A+N attenuates the phosphorylation of STAT1 on Tyr701 induced by interferon-α1. Thus, p53 definitely has the potential to attenuate the expression of genes activated by this cytokine. However, surprisingly, attenuated phosphorylation of STAT1 did not translate into attenuated expression of two genes stimulated by IFNα1 –
MX1 and
IRF7. To study the expression of more interferon-stimulated genes, we performed RT-PCR analysis. We selected 9 genes activated by IFNα. We observed very variable pattern of gene regulation. Activation of three genes (
IFI6,
IFI44,
IFITM3) by IFNα1 was attenuated by p53. In case of other genes, A+N and IFNα1 collaborated in their activation. In case of IFI27 the synergy between A+N and IFN α1 was very strong, however it was not influenced by p53 status. IFI27 protein may be involved in regulation of cell sensitivity to pro-apoptotic stimuli [
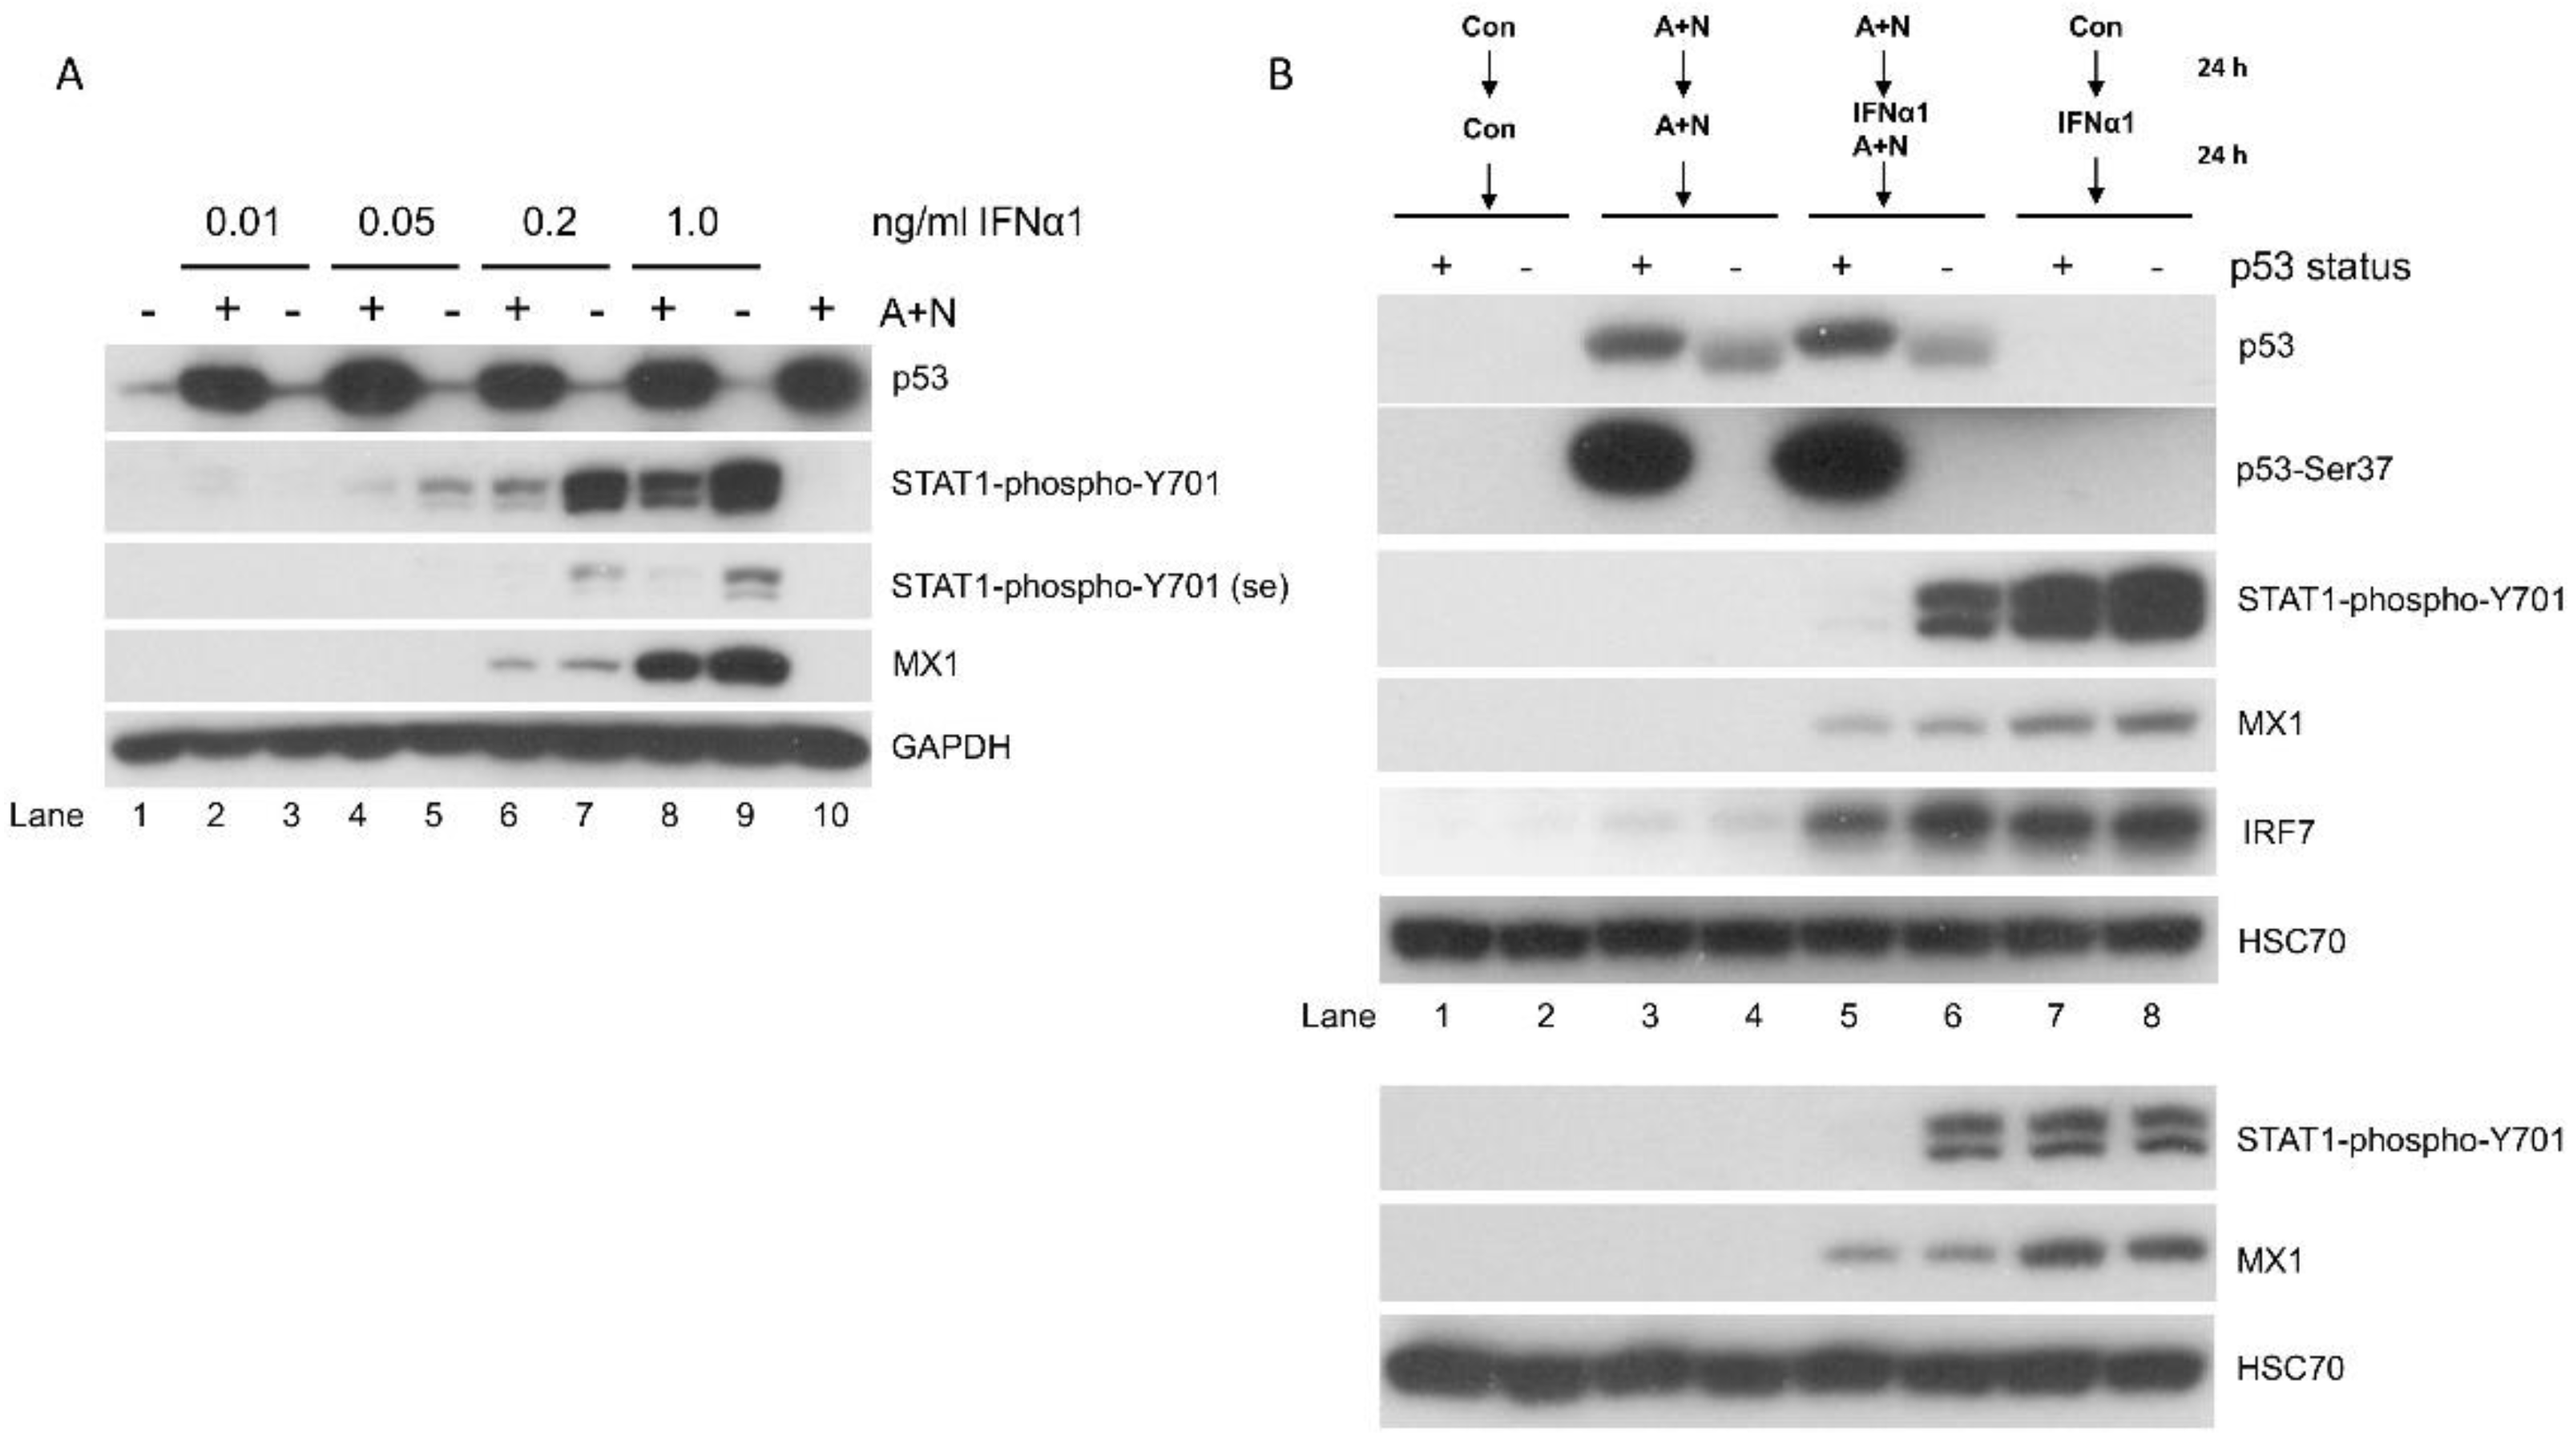
22]. This experiment leads to two conclusions. First, p53 is able to attenuate the expression of only a subset of genes activated by IFNα1, what is consistent with the ability of p53 to attenuate phosphorylation of STAT1. Second, A+N treatment can collaborate with this cytokine in upregulation of a subset of genes, but p53 does not participate in it. This points toward the existence of a p53-independent mechanism able to activate innate immunity genes, which is triggered by actinomycin D and nutlin-3a. The biggest riddle of the experiments with IFNα1 is why there is no universal correlation between the phosphorylation of STAT1 and the expression level of most tested genes activated by this cytokine. With dose-response treatment there is clear correlation – both phosphorylation of STAT1 and expression of MX1 increase with the increasing concentration of interferon-α1. However, despite clearly different phosphorylation status of STAT1 between p53-proficient and deficient cells, the expression level of MX1 is virtually identical. The obvious explanation is that the relationship between phosphorylation status of STAT1 and the activity of transcription complex, which it forms together with STAT2 and IRF9 is more complicated than expected.
The ability of p53 to attenuate the expression of a subset of genes stimulated by IFNα was observed by Wang et al. [
15]. They noticed this in case of genes for interferon-induced transmembrane proteins – IFITM1, IFITM2 and IFITM3. We also observed that IFITM3 is repressed by p53 (
Figure 4). Wang et al. [
15] observed that activation of p53 leading to repression of interferon-induced transmembrane proteins facilitates the infectivity if influenza A virus. On the other hand Muñoz-Fontela et al. [
23] observed that infected mouse and human cells with functional p53 displayed markedly decreased viral replication early after infection. This inhibition of viral replication was mediated by a p53-dependent enhancement of IFN signaling, specifically the induction of some interferon-stimulated genes. These apparent discrepancies pose a serious biological question. Why does p53, which stimulates the expression of
STING1 gene [
10], which is the stimulator of interferon genes (hence the name), attenuate the expression of some genes induced by interferon-α? We believe that this system is very complicated because it is the result of long-lasting arms race between viruses and cells, and a measure “devised” by one system (e.g. a virus) is offset by a countermeasure “devised” by the other system (e.g. a cell). What we observe is an evolutionary snapshot of the current state of the battle. It is also possible that inhibition of STAT1 phosphorylation by p53 is an element of the negative-feedback loop of this signaling system. Our experiment (
Figure 4) also shows that p53 and interferon-α activate common genes, e.g., IFIT3 and OAS1. We conclude it from the observation that expression of both genes is attenuated in p53-deficient cells exposed to A+N. Thus, p53 can attenuate the expression of some genes activated by IFN-a1 (e.g. IFITM3), it can activate some IFN-α-target genes in the absence of this cytokine (OAS1), however p53 does not participate in regulation of some genes, which are activated by concerted action of IFN-a1 and A+N (e.g. IFI27). This clearly points to conclusion that each interferon-stimulated gene in addition to being stimulated by these cytokines, has its own program of regulation when interferon is combined with other stress factors.
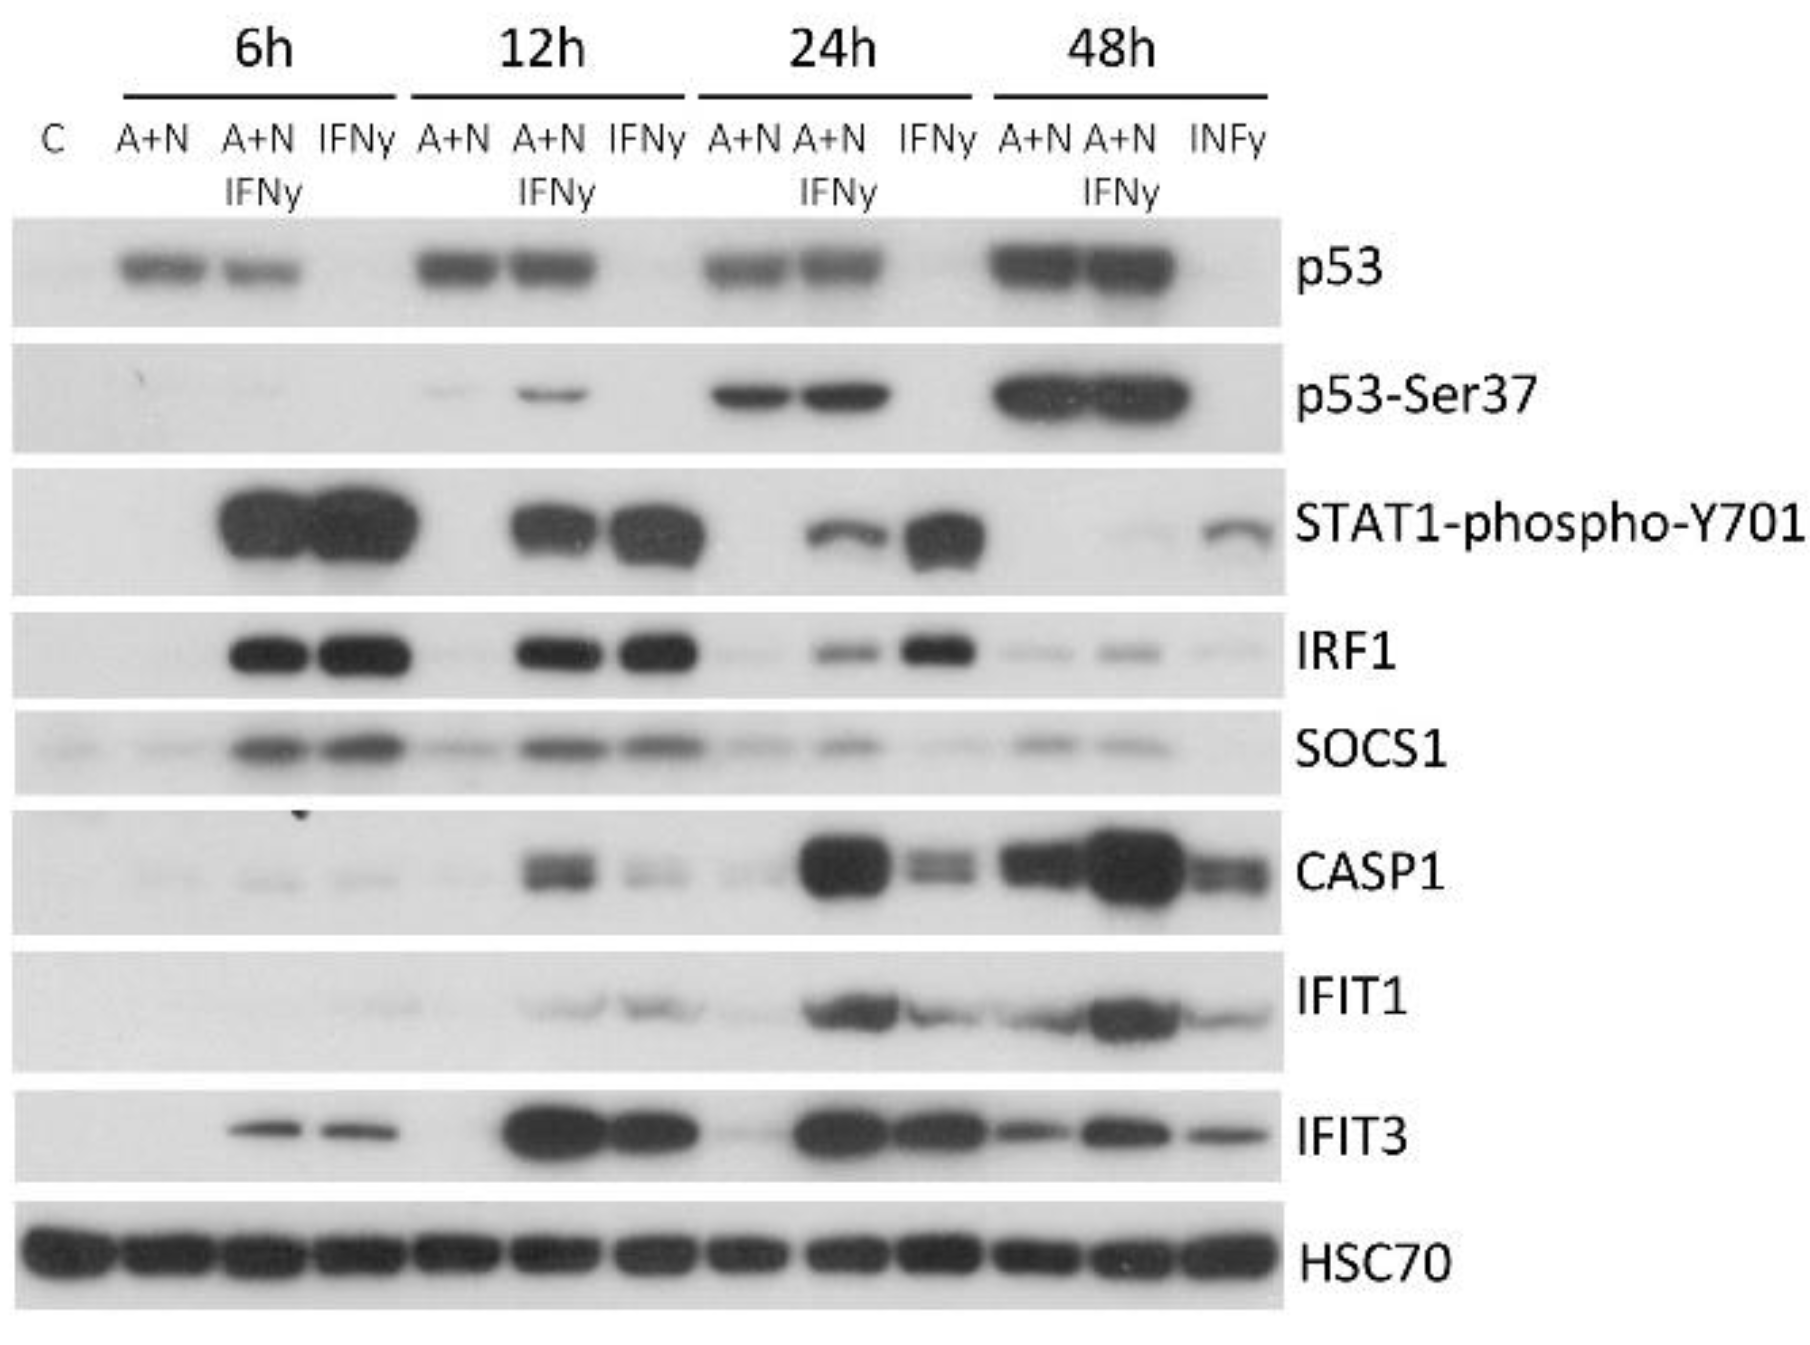
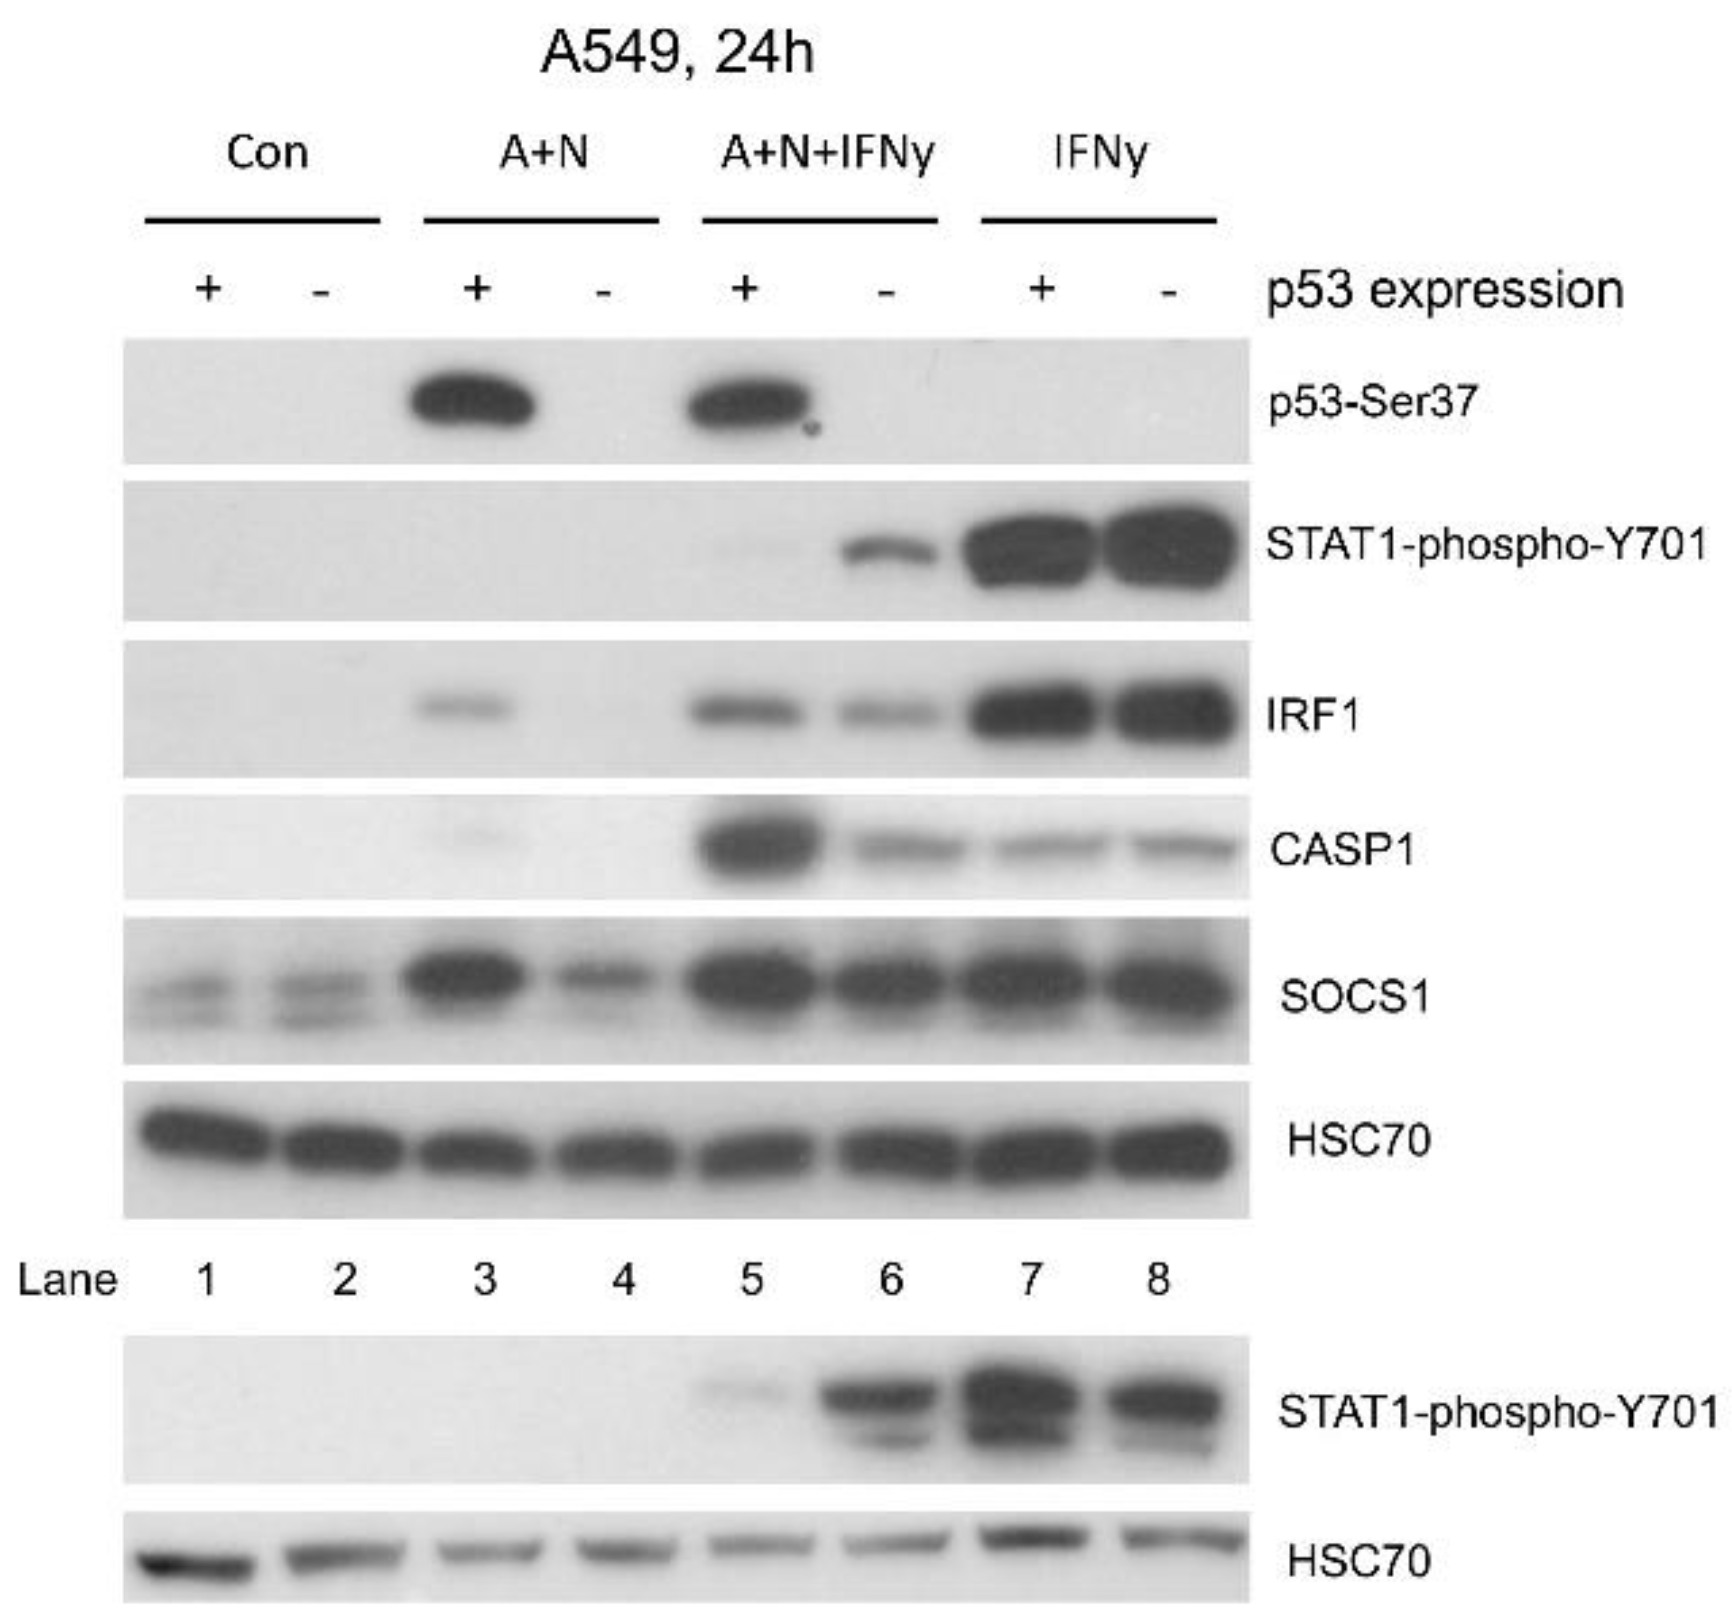
Having examined how p53 impacts on the activation of genes regulated by IFNα1, we studied how p53 regulates the expression of genes activated by IFNγ. The time course experiment involving co-treatment of cells with A+N and IFNy revealed that after 24 h of incubation, activation of p53 was associated with attenuated phosphorylation of STAT1 (
Figure 5). Moreover, we found that p53 contributes to the repression of STAT1 phosphorylation in cells exposed to IFNγ (Fig.6). Reduced phosphorylation of STAT1 was reflected in reduced expression of IRF1, which is a gene activated by IFNy early during exposure (reviewed by Castro et al., [
24]). Interestingly, this correlation was not visible in case of other early gene – SOCS1 (
Figure 6). Thus, in case of IFNγ, we have close correlation between phosphorylation status of STAT1 and the expression of at least one major IFNγ-target gene (IRF1). However, when the expression of other interferon targets was examined, the picture became more complicated. Some genes are activated by IFNγ early during exposure and some genes are activated late (
Figure 5). This was observed by others [
25]. According to our data,
IRF1 and
SOCS1 belong to early genes and
CASP1,
IFIT1 and
IFIT3 belong to the late genes (
Figure 5). Others demonstrated that IFNγ induces expression of
IRF1, which in turn activates
CASP1 gene [
26]. We noticed that co-treatment with IFNγ and A+N synergistically induces the expression of three late genes
CASP1, IFIT1 and
IFIT3 (
Figure 5, 7 and 9). This synergy is lost in p53-deficient cells. The strongest synergy was observed in case of activation of
CASP1 gene. This is original and very important observation because it indicates that these two signaling systems strongly promote cellular functions executed by this caspase. The best studied function of
CASP1 is the induction of pyroptosis – regulated form of death, which releases pro-inflammatory factors [
27]. What is the molecular mechanism of synergy between IFNγ and p53 in activation of CASP1 remains a puzzle. The late genes activated by IFNγ are not induced by the dimer of phosphorylated STAT1, but by the product of the early gene -
IRF1, which is a transcription factor [
24]. Interestingly
IRF1 is also activated by p53, at least in A549 cells (
Figure 7, 9 and [
13]). Thus, at least in principle,
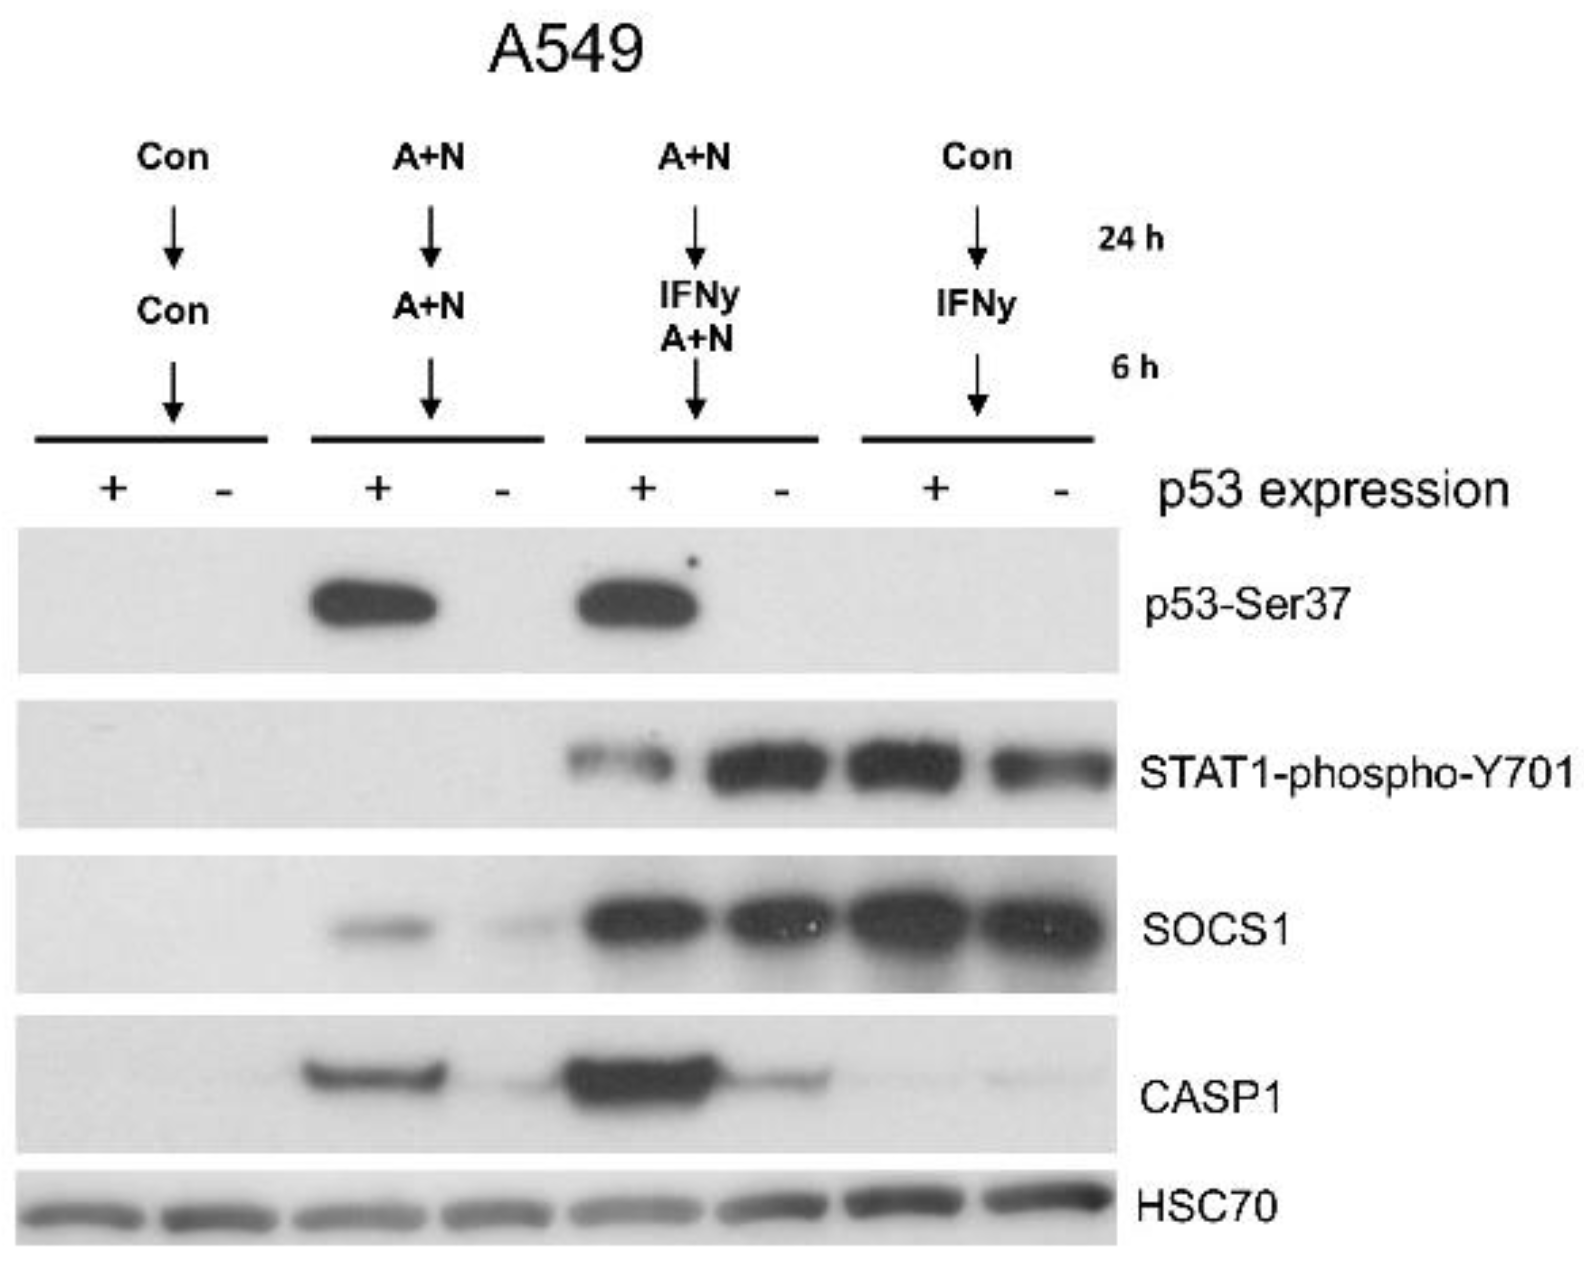
IRF1 upregulated by IFNγ and by p53 may converge on CASP1 promoter and stimulate its activity. But it is very likely that other factors also play a role. Definitely p53 and IFNγ can act in concert to additively or synergistically stimulate the expression of some genes despite p53-dependent attenuation of STAT1 phosphorylation. It was best visible, when we employed a different treatment strategy – first treatment with A+N for 24 h (to upregulate the p53 target genes) and then exposure to IFNγ for 6 h. Following this treatment pattern we observed by RT-PCR strong cooperation of p53 and IFNγ in upregulation of
CASP1,
IFIT1 and
IFIT3 and probably of
ICAM1 – another target of IFN-y (
Figure 9). In case of
IFI16 gene, positively regulated by both p53 [
16] and IFNγ [
28], these two proteins act additively in its activation. Thus, different genes regulated by both IFNγ and p53 show variable response to simultaneous activation of both signaling systems. Our experiment also support the notion that interferon-γ and p53 have many common target genes. Moreover, they activate genes coding for proteins participating in the same biological process. This results in common biological outcomes of p53 activation and exposure to IFNγ, e.g., improvement of antigen presentation [
29,
30], sensitization of cells to apoptosis induced by FAS ligand [
31,
32] and inhibition of the cell cycle [
5,
33]. Our observations suggest that IFNγ and p53 may sensitize at least some cancer cells or normal human fibroblasts to
CASP1-dependent pyroptosis. In addition to CASP1, the aforementioned IFI16 is another component of pyroptotic infalmmasome [
34] activated by both p53 and IFNγ.
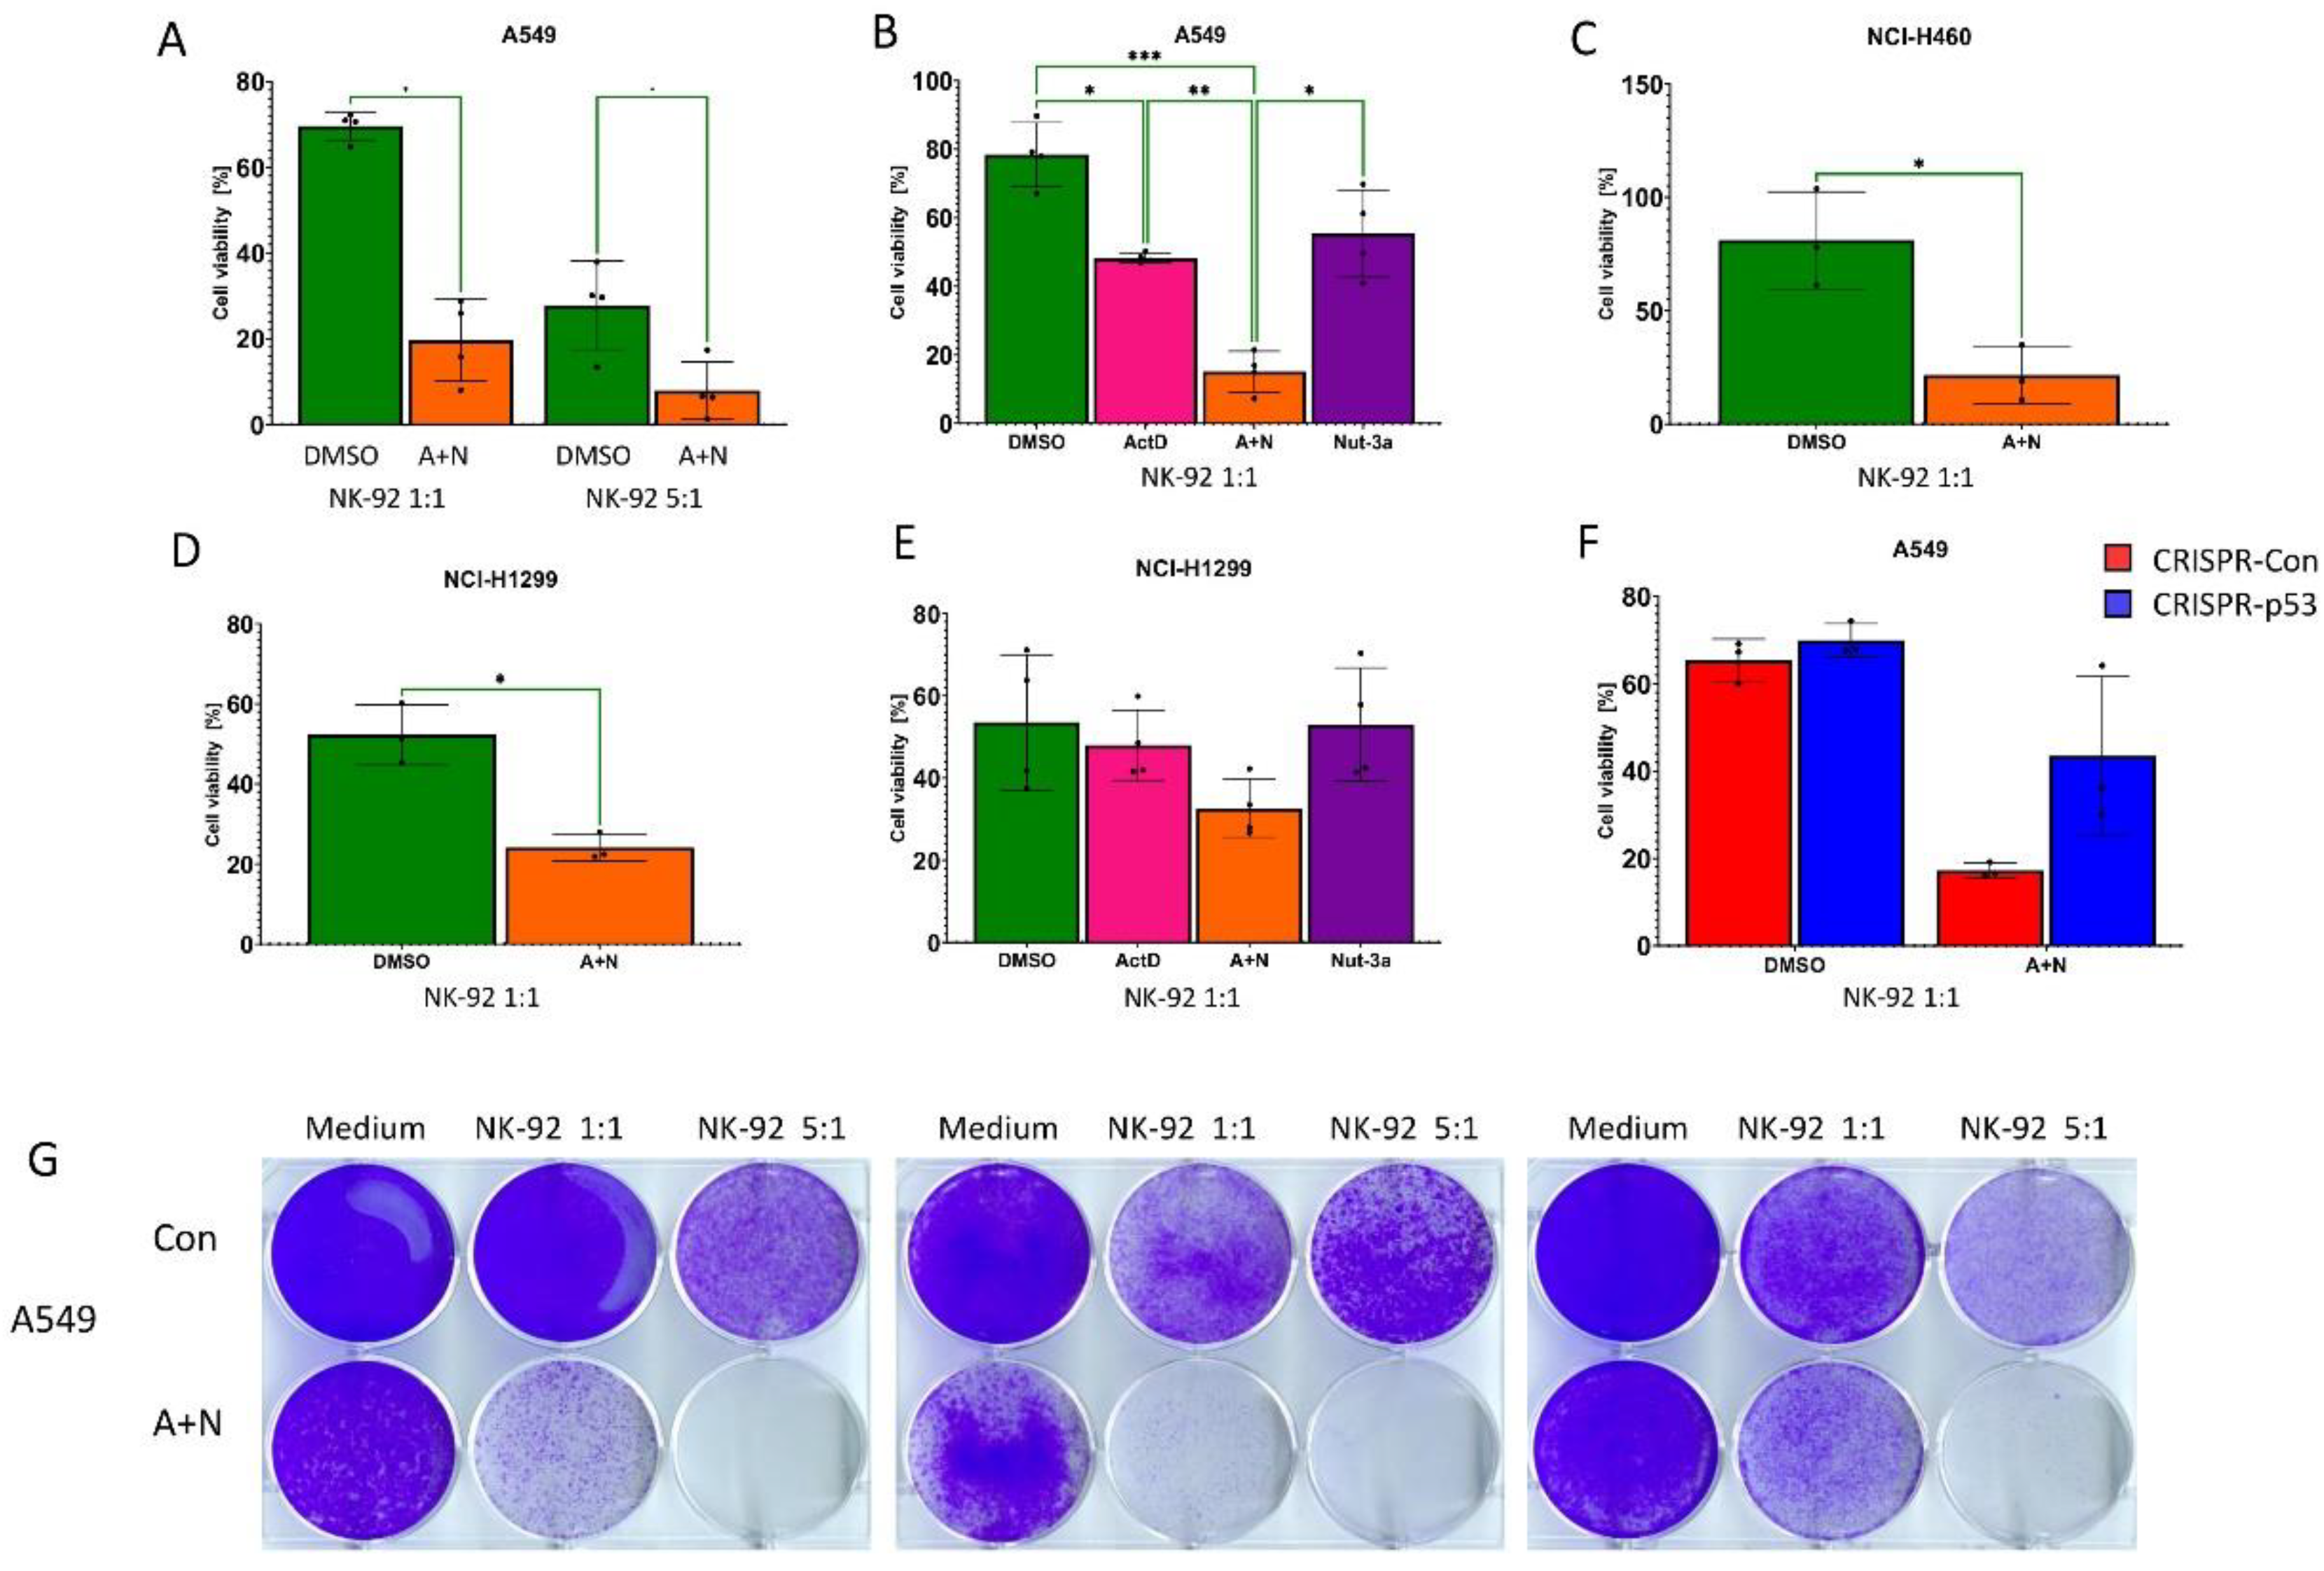
We also made another important observation. Nutlin-3a designed to specifically activate p53 by antagonizing its negative regulator – MDM2 protein, can exert p53 independent effect on cells when combined with actinomycin D or even acting alone. It can attenuate phosphorylation of STAT1 in p53-null NCI-H1299 cells and it synergizes with actinomycin D in activation of some interferon-stimulated genes in NCI-H1299 cells, most notably IFIT3. It would be interesting to find out by transcriptomic methods what other genes are activated in p53-null cells by common action of actinomycin D and nutlin-3a. The co-treatment with these two compounds also sensitizes NCH-H1299 cells to the killing effect of natural killer cells NK-92 (
Figure 12). The mechanism of this biological effect is not known, however we can speculate that A+N strongly activates some of the innate immunity genes, which make cancer cells better targets for natural killer cells. However, p53 can also contribute to the killing of cancer cells by natural killer cells (
Figure 12). The sensitizing mechanism has been partially unveiled by published observations. In cancer cells p53 activates the expression of genes, which encode the surface proteins acting as activators of natural killer cells. These proteins are ULBP1 and ULBP2 [
35,
36]. Interestingly, our recently published transcriptomic data are consistent with these observations demonstrating that co-treatment with A+N strongly upregulates the expression of
ULBP2 gene in A549 and in NCI-H460 cells [
6]. Thus, actinomycin D and nutlin-3a can sensitize cancer cells to the killing effect of natural killer cells and this effect is governed by both p53-dependent and p53-independent mechanisms and while we start to understand the former, the latter are completely unknown. The drug-induced sensitization of cancer cells to the killing by natural killer cells was already observed by others and generally involves modulation of protein expression on the surface of cancer cells [
37]. However, our drug combination (A+N) was not previously tested and the mechanism of sensitization is only starting to be deciphered. The intriguing finding is that A+N can promote the innate immunity in p53-independent fashion.
4. Materials and Methods
4.1. Cell Culture and Treatment
A549, U-2 OS and NCI-H292 cell lines from ATCC (Manassas, VA, USA) were cultured in low-glucose DMEM supplemented with 10% fetal bovine serum (FBS, Invitrogen, Carlsbad, CA, USA). NCI-H460 (ATCC) were cultured in RPMI-1640 with 4.5 g/l glucose, supplemented with 2 mM glutamine and 1 mM sodium pyruvate. NCI-H1299 cells were cultured in RPMI-1640 with 1g/l glucose supplemented with 10% FBS. NK-92 cells (from ATCC) were cultured on RPMI-1640 medium supplemented with 2 mM glutamine, 1 mM sodium pyruvate, 20 ng/ml interleukin-2 (Miltenyi Biotech, Bergisch Gladbach, Germany), 12.5% FBS, 12.5% horse serum (Biowest, Nuaillé, France). GM07492 normal human fibroblasts (Coriell Cell Repositories, Camden, NJ) were cultured in low glucose DMEM supplemented with 15% FBS. All media were supplemented with penicillin/streptomycin solution. Cells were incubated at 37oC, 5% CO2 with saturating humidity.
Stock solutions of chemicals were prepared in DMSO (Dimethyl Sulfoxide): actinomycin D (10 µM; Sigma-Aldrich, St. Louis, MO, USA), camptothecin (10 mM; Calbiochem-Merck, Darmstadt, Germany), and nutlin-3a (10 mM; Selleck Chemicals LLC, Houston, TX, USA). The stock solutions were diluted in culture medium to the following concentrations: 5 nM actinomycin D, 5 µM nutlin-3a, and 5 µM camptothecin. Control cells were mock-treated with a medium containing DMSO. Interferons α1 and γ were purchased from Cell Signalling Technology (Danvers, MA, USA). The stock solutions were prepared in sterile water at 75 μg/ml (IFNα1) or 100 μg/ml (IFNγ). The final concentrations are given in Results.
4.2. Generation of p53-Deficient Cells
The generation of p53-deficient A549 and U-2 OS cells using CRISPR/Cas9 technology was described in [
13]. The same method was employed to prepare p53-deficient NCI-H460 cells. The selection of p53 knockout clones of U-2 OS cells was also described in [
13].
4.3. Western Blotting
The preparation of the whole-cell lysates using IP buffer, supplemented with protease and phosphatase inhibitors were described previously [
10]. Aliquots of lysates (35–50 µg) were separated by SDS-PAGE on 8% or 13% gels and electro-transferred onto PVDF membranes. Before incubation with primary antibody, the membranes were incubated for 1 h at room temperature in blocking solution (5% skim milk in PBS with 0.1% Tween-20). The anti-phospho-Ser37-p53, anti-phospho-Tyr701-STAT1 (D4A7), anti-STAT1, anti-MX1, anti-IRF1 and anti-IFIT1 (D2X9Z) antibodies were from Cell Signaling Technology (Danvers, MA, USA). Anti-p53 (DO-1), and loading control anti-HSC70 (B-6) antibodies were obtained from Santa Cruz Biotechnology (Dallas, TX, USA). Anti-SOCS1 antibody was (clone 4H1) was from EMD Millipore (Temecula, CA, USA). Anti-CASP1 (ab179515) and anti-IFIT3 (ab95989) antibodies were from Abcam (Cambridge, UK). Anti-GAPDH loading control antibody was from Merck (Sigma) (Darmstadt, Germany). Anti-IRF7 antibody was from Proteintech (Rosemont, IL). All incubations with primary antibodies were performed overnight at 4
oC in blocking solution. HRP-conjugated secondary antibodies (anti-mouse, anti-rabbit) were detected by chemiluminescence (SuperSignalWest Pico or SuperSignal West Femto Chemiluminescent substrate (Thermo Fisher Scientific, Waltham, MA, USA).
4.4. Gene Expression Analysis by Semi-Quantitative Real-Time PCR
After the treatment, cells were harvested by trypsinization, washed with PBS, frozen on dry ice and stored at -80
oC. Total RNA samples were isolated using the RNeasy mini kit (Qiagen, Hilden, Germany). The cDNA was synthesised with MuLV reverse transcriptase and random hexamers (Applied Biosystems, Foster City, CA, USA). Gene expression was measured using Real-Time 2x PCR Master Mix SYBR (A&A Biotechnology, Gdynia, Poland). The sequence of primers used for RT-PCR are given in supplementary
Table S1. Amplification was performed on a CFX96 Real-Time System (Bio-Rad, Hercules, CA, USA). In each RT-PCR run, cDNA samples were amplified in triplicate. A relative quantitation of mRNA was carried out using the ΔΔCT method with
ACTB or
GAPDH as a reference. Mean and standard deviation were calculated from three biological replicates.
4.5. Killing of Cancer Cells by NK-92 Cells
Cancer cells growing in respective culture media on 6-cm culture plates were either mock-treated or exposed for 48 h to the drugs or their combinations at concentrations given above. Subsequently, the cells were trypsynized, washed with PBS, centrifuged and the cell pellets were suspended in the medium for NK-92 cells. Subsequently, cancer cell (control or treated) were seeded into the wells of 96-well plates together with NK-92 cells at rations given in the results. We seeded 3 600 cancer cells in one well in 100 µl of medium for NK-92 cells. For the control, cancer cells were seeded without addition of NK-92 cells. For each experimental condition we seeded cells on 3 wells. The co-incubation lasted for 24 h. After this time, we removed the medium and replaced it with the relevant medium for cancer cells. The surviving cells were allowed to recover for 72 h. After this time, the metabolic activity of cells was measured using MTS assay (CellTiter 96® AQueous One Solution Cell Proliferation Assay, cat no. G3582, Promega, Madison, WI). The metabolic activity of cells, which were not incubated with NK-92 cells was set as 100%. To macroscopically visualize adherent A549 cells surviving the co-treatment with NK-92 cells (growing in suspension) we employed the following protocol. A549 cells were treated with A+N or mock-treated for 48 h in DMEM. Subsequently, the cells were trypsynized, counted and 100 000 cells were seeded onto wells of 6-well plate. The NK-92 cells were counted and they were seeded onto the wells of 6-well plate for co-incubation with A549 cells. We used two NK-92:A549 ratios – 1:1 and 5:1. In control wells, A549 were incubated only with RPMI medium. The cells were incubated with 2 ml culture medium (RPMI) for NK-92 cells per well. After 24-h co-incubation, the RPMI medium was removed and the attached cells were allowed to recover and grow in fresh DMEM for 5-7 days. Subsequently, the medium was removed, the cells were rinsed with PBS and fixed by incubation with -20oC methanol for 10 min. Fixed and dried cells were stained with 0.01% crystal violet for 2 min. Finally, the cells were washed in distilled water, dried, and the plates were scanned.
Figure 1.
Expression of SOCS1 in response to the treatment with actinomycin D and nutlin-3a is regulated in cell-specific manner. A. B. Levels of p53, SOCS1 and loading control (HSC70) in indicated cell lines exposed to actinomycin D (ActD), nutlin-3a (Nut), both compounds acting together (A+N) or camptothecin (CPT) for 48 h. Control cells (Con) were mock-treated. C. Levels of p53, SOCS1 and loading control in p53-proficient (Con) and knockout clones (p53-KO) of U-2 OS cell line exposed to A+N, nutlin-3a (Nut) or mock-treated (C) for 48 h. # indicates the clone number.
Figure 2.
Exposure of cells to actinomycin D and nutlin-3a (A+N) reduces phosphorylation of STAT1 on Tyr(Y)-701 in cells exposed to interferon-α1 (IFNα1). A. B. The expression of indicated proteins in cell lines pre-exposed to A+N, nutlin-3a (Nut) or mock-treated (Con) for 24 h and subsequently mock-treated (Con), exposed to A+N, Nut, A+N with 1ng/ml IFNα1, Nut with 1ng/ml IFNα1 or alone with 1ng/ml IFNα1 for the next 24 h. In A GAPDH was loading control.
Figure 3.
The modulation of STAT1 phosphorylation by A+N does not translate into modulated expression of genes activated by IFNα1.
A. A549 cells were exposed using the procedure presented in
Figure 2A, various concentrations of IFNα1 were used. Subsequently the expression of indicated proteins was determined by Western blotting. The expression of phospho-STAT1 was visualized by long and sort (se) exposures.
B. A549 cells (p53 proficient and p53-deficient) were exposed as indicated and the expression of relevant proteins or their modified forms was determined by Western blotting. IFNα1 was used at 1ng/ml concentration. The lower panel shows the results of the independent experiment with IFNα1 0.5 ng/ml concentration.
Figure 4.
p53 modulates the expression of only a subset of genes activated by IFNα1. The p53-proficient (red bars) and p53-deficient (blue bars) A549 cells were exposed to A+N, A+N with IFNα1 and to IFNα1 using the two-step procedure presented on
Figure 2A. IFNα1 concentration was 0.5 ng/ml. Subsequently, the expression of indicated genes was determined by RT-PCR. Three biological replicates were performed.
ACTB gene was used as a reference gene. The influence of p53 status was calculated using unpaired t test with Welch’s correction taking into account the False Discovery Rate (FDR=10%). Additionally, the statistical significance was calculated for p53-proficient cells treated with A+N vs. A+N+IFNα and A+N+IFNα vs. IFNα. For this purpose calculations were made using the unpaired t test with Welch’s correction for each group separately (*
p <
0,05, ** p<0,01, *** p<0,001). All tests were performed using GraphPad Prism version 10.2.2 for Windows, GraphPad Software, Boston, Massachusetts USA,
www.graphpad.com.
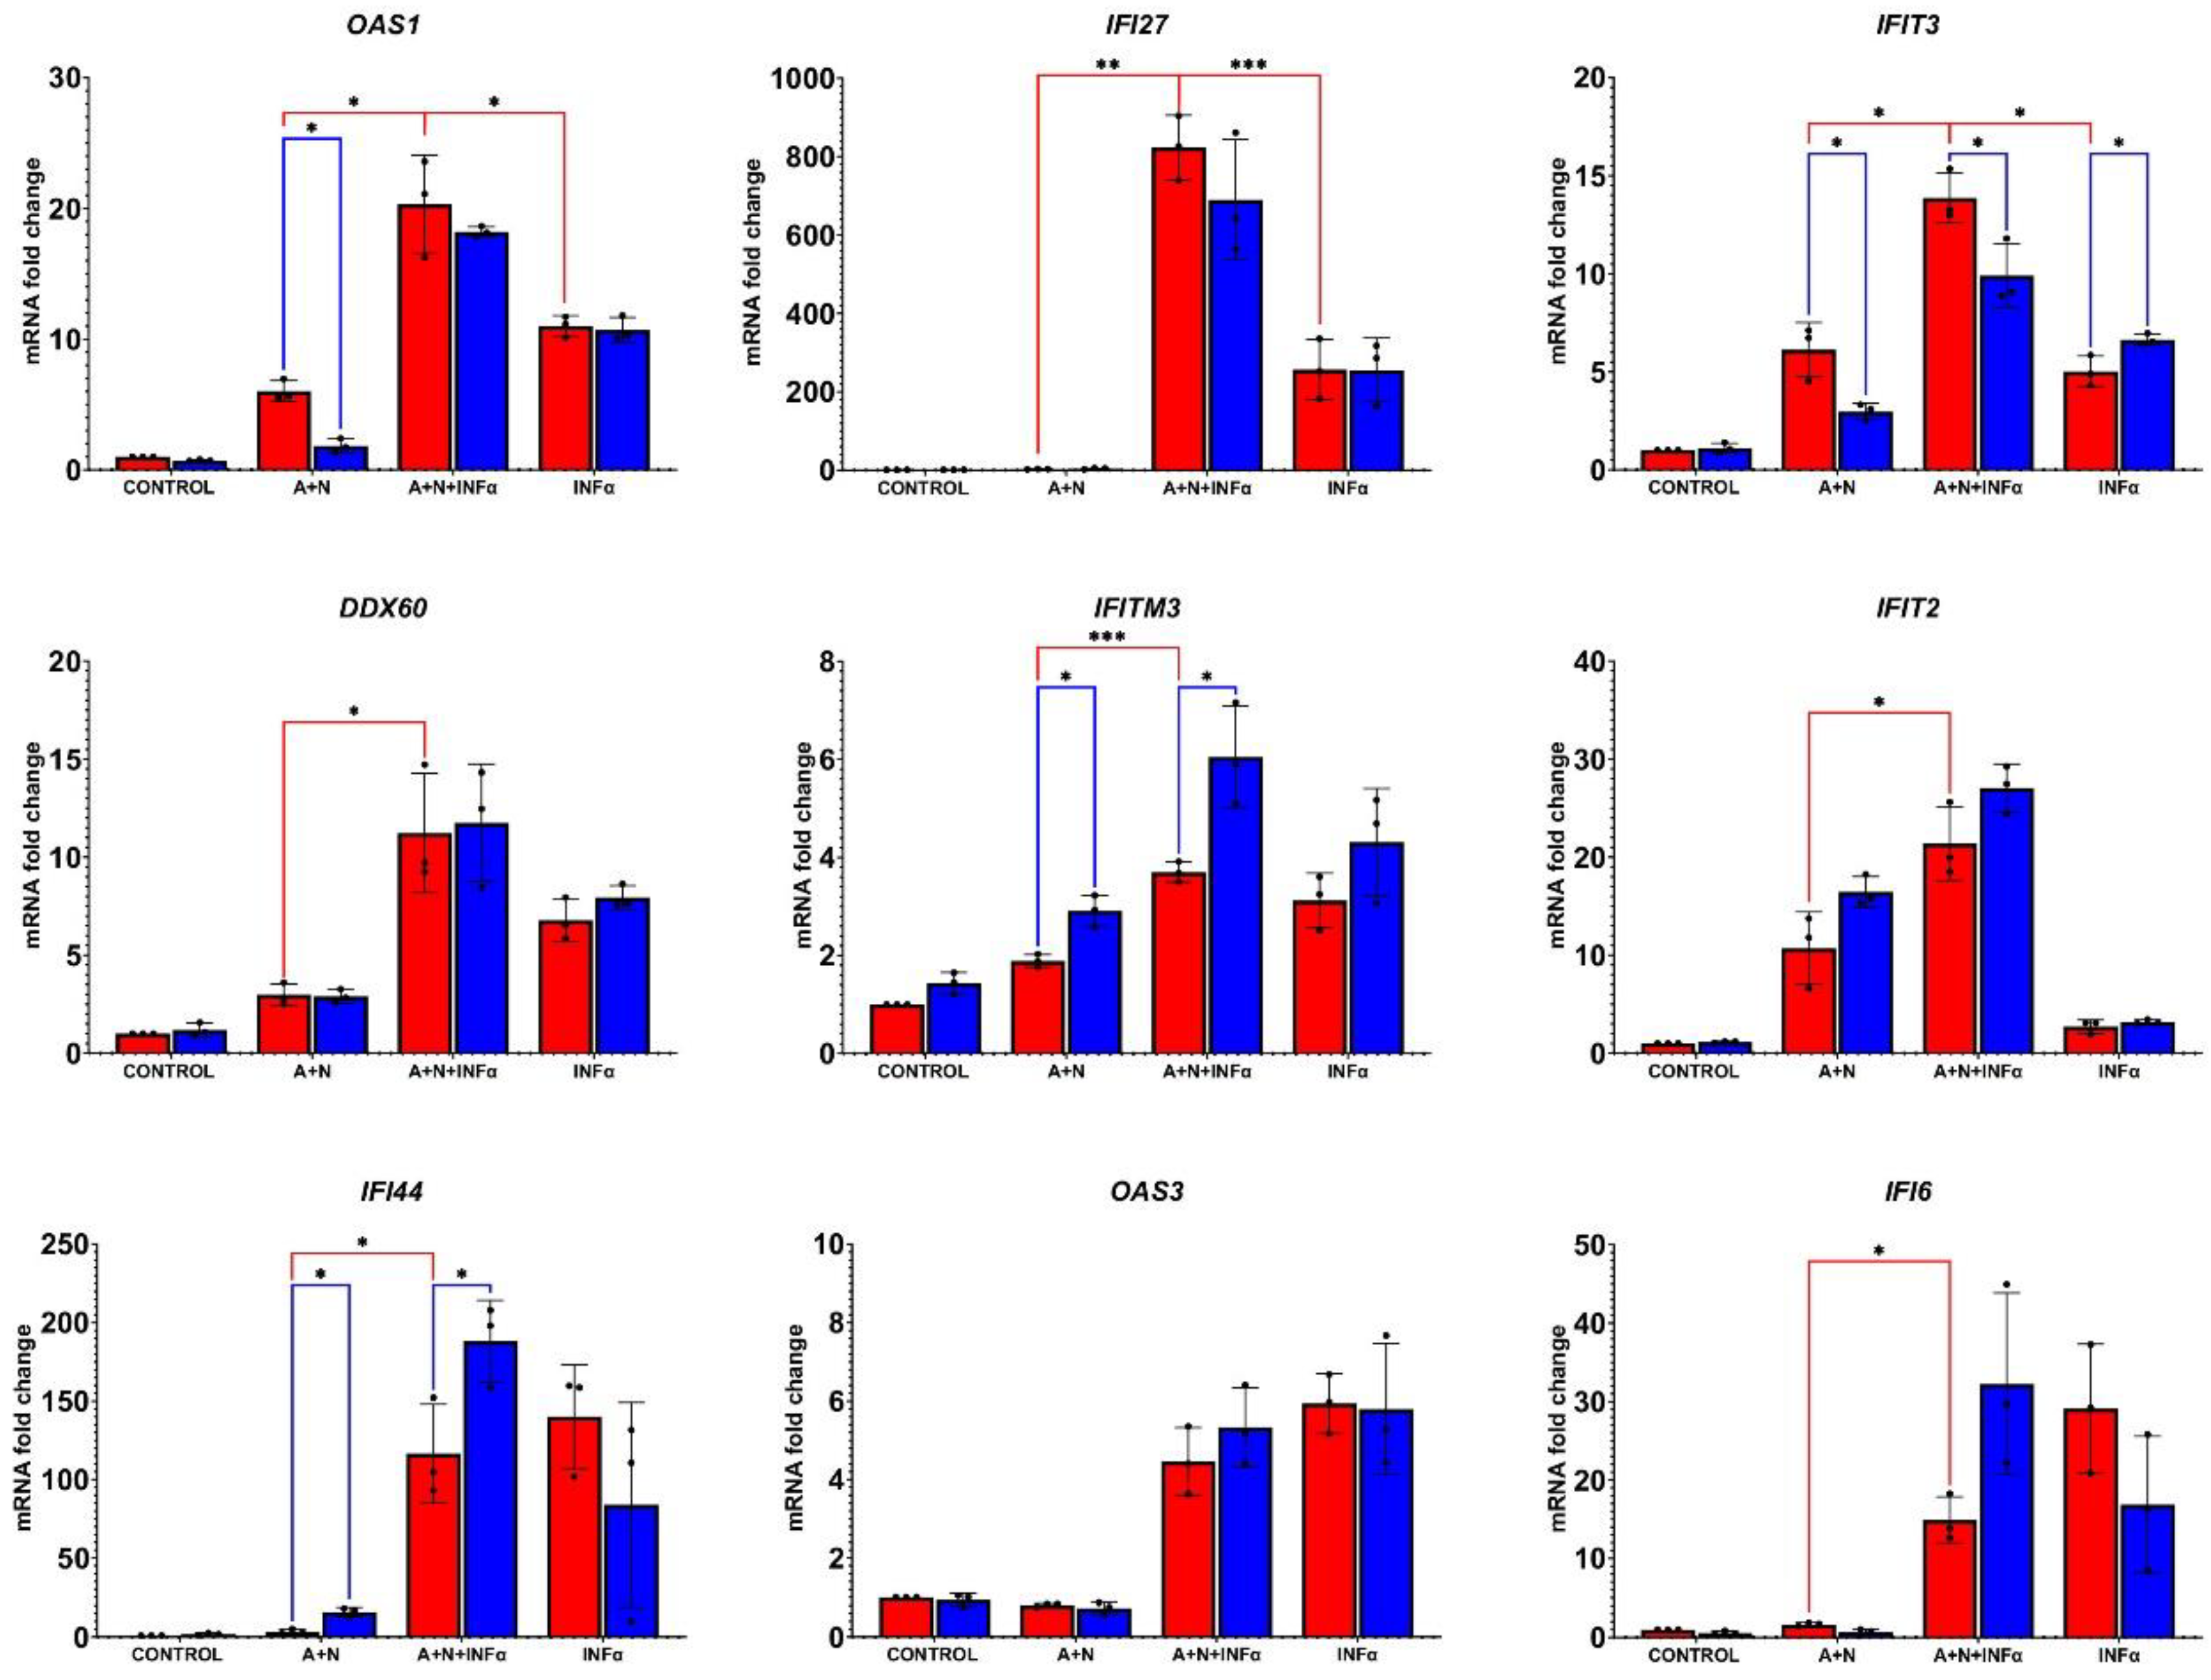
Figure 5.
A+N and interferon-γ (IFNγ) synergize in activation of a subset of innate immunity genes. A549 cells were exposed to A+N, A+N with IFNγ or to IFNγ alone for increasing number of hours. IFNγ was used at 1 ng/ml. Subsequently, the expression of selected proteins was determined using Western blotting.
Figure 6.
p53 has some effect on reducing phosphorylation of STAT1 induced by IFNγ. P53-proficient and p53-deficient A549 cells were exposed as indicated for 24 h. IFNγ was used at 1ng/ml concentration. The expression of indicated proteins was determined by Western blotting. The lower panel shows the results of an independent experiment.
Figure 7.
Activated p53 and IFNγ synergize in stimulation of
CASP1 gene coding for pro-pyroptotic caspase-1. The p53-proficient (red bars) and p53-deficient (blue bars) A549 cells were exposed to A+N, A+N with IFNγ and to IFNγ alone for 24 h. Control cells were mock-treated. IFNγ concentration was 1 ng/ml. Subsequently, the expression of indicated genes was determined by RT-PCR. Three biological replicates were performed.
ACTB was used as a reference gene. The influence of p53 status was calculated using unpaired t test with Welch’s correction taking into account the False Discovery Rate (FDR=10%). Additionally, statistical significance was calculated for p53 proficient cells treated with A+N vs. A+N+IFNγ and A+N+IFNγ vs. IFNγ. For this purpose calculations were made using the unpaired t test with Welch’s correction or Mann Whitney test for each group separately (*
p <
0,05, ** p<0,01, *** p<0,001). All tests were performed using GraphPad Prism version 10.2.2 for Windows, GraphPad Software, Boston, Massachusetts USA,
www.graphpad.com.
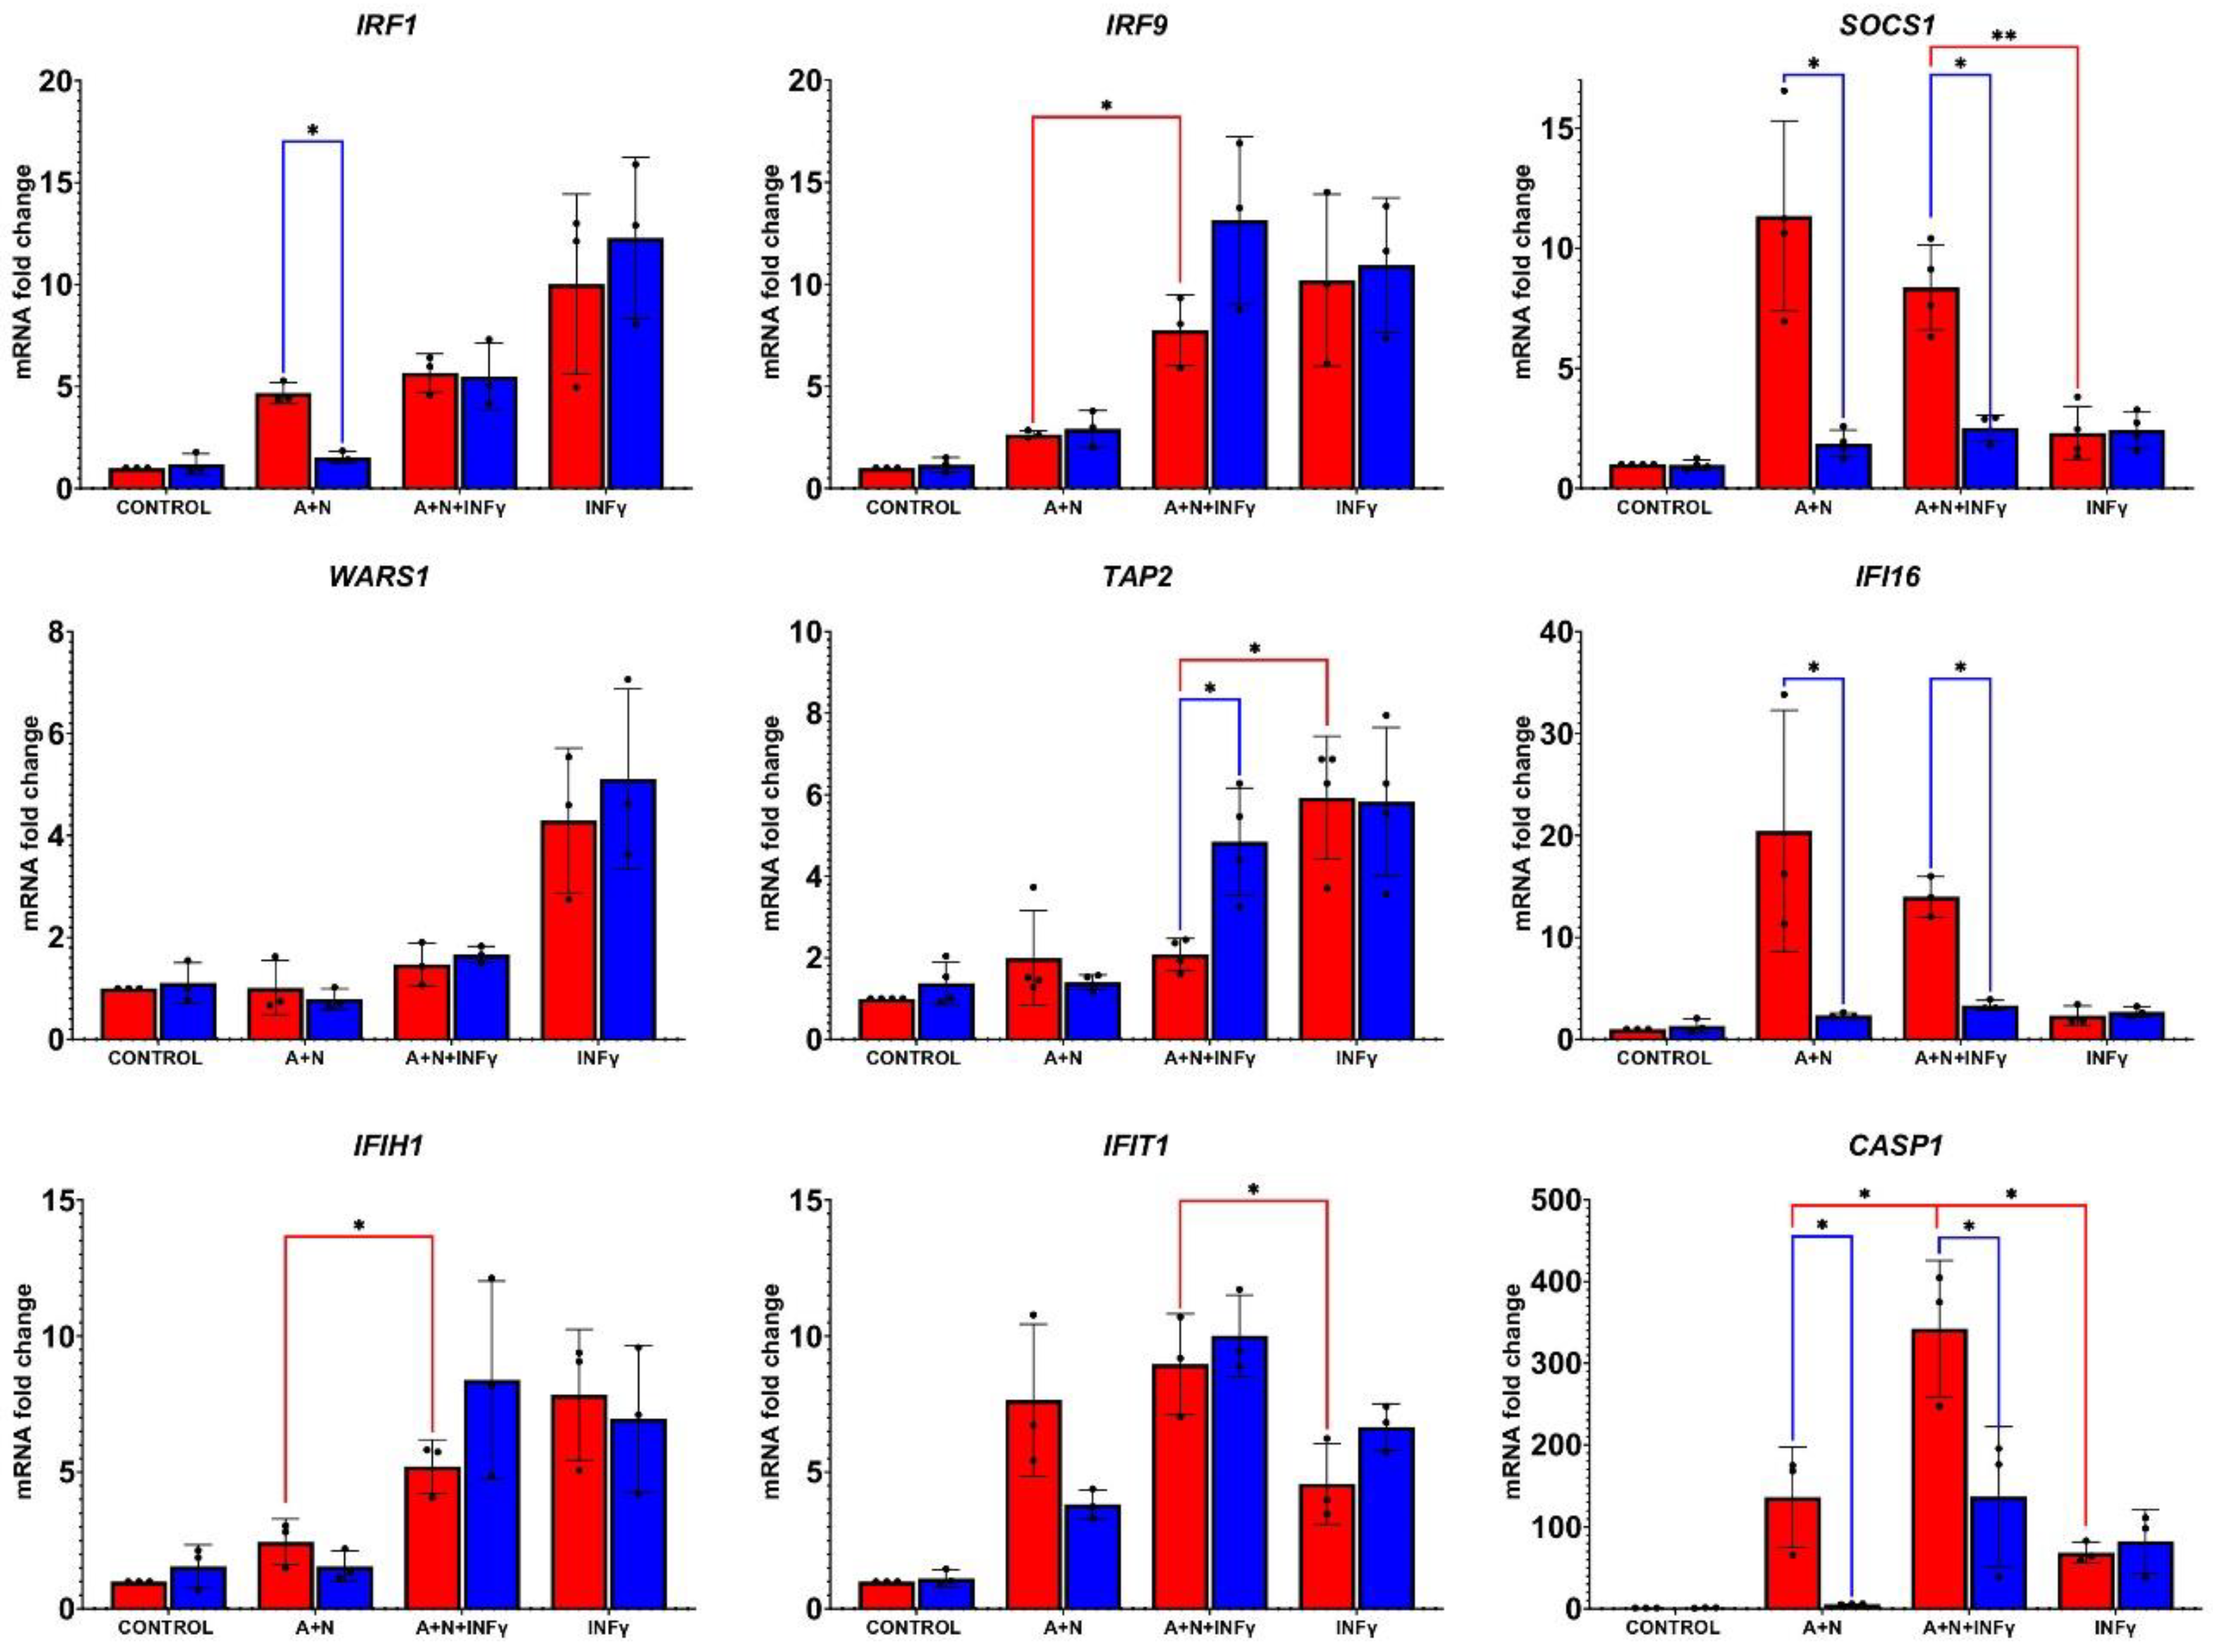
Figure 8.
The synergy between activated p53 and IFNγ results in strong upregulation of caspase-1 (CASP1) protein. The expression of indicated proteins in A549 cell line (p53-proficient and p53-deficient) pre-exposed to A+N, or mock-treated (Con) for 24 h and subsequently mock-treated (Con), exposed to A+N, A+N with 1 ng/ml IFNγ, or alone with 1ng/ml IFNγ for the next 6 h.
Figure 9.
The activated p53 and IFNγ synergize in stimulation of a subset of innate immunity genes. The p53-proficient (red bars) and p53-deficient (blue bars) A549 cells were exposed to A+N, A+N with IFNγ and to IFNγ alone as described in
Figure 8 (treatment mode 24 h + 6 h). Control cells were mock-treated. IFNγ concentration was 1 ng/ml. Subsequently, the expression of indicated genes was determined by RT-PCR. Three biological replicates were performed.
GAPDH was used as a reference gene. The influence of p53 status was calculated using unpaired t test with Welch’s correction taking into account the False Discovery Rate (FDR=10%). Additionally, statistical significance was calculated for p53-proficient cells treated with A+N vs. A+N+IFNγ and A+N+IFNγ vs. IFNγ. For this purpose calculations were made using the unpaired t test with Welch’s for each group separately (*
p <
0,05, ** p<0,01, *** p<0,001). All tests were performed using GraphPad Prism version 10.2.2 for Windows, GraphPad Software, Boston, Massachusetts USA,
www.graphpad.com.
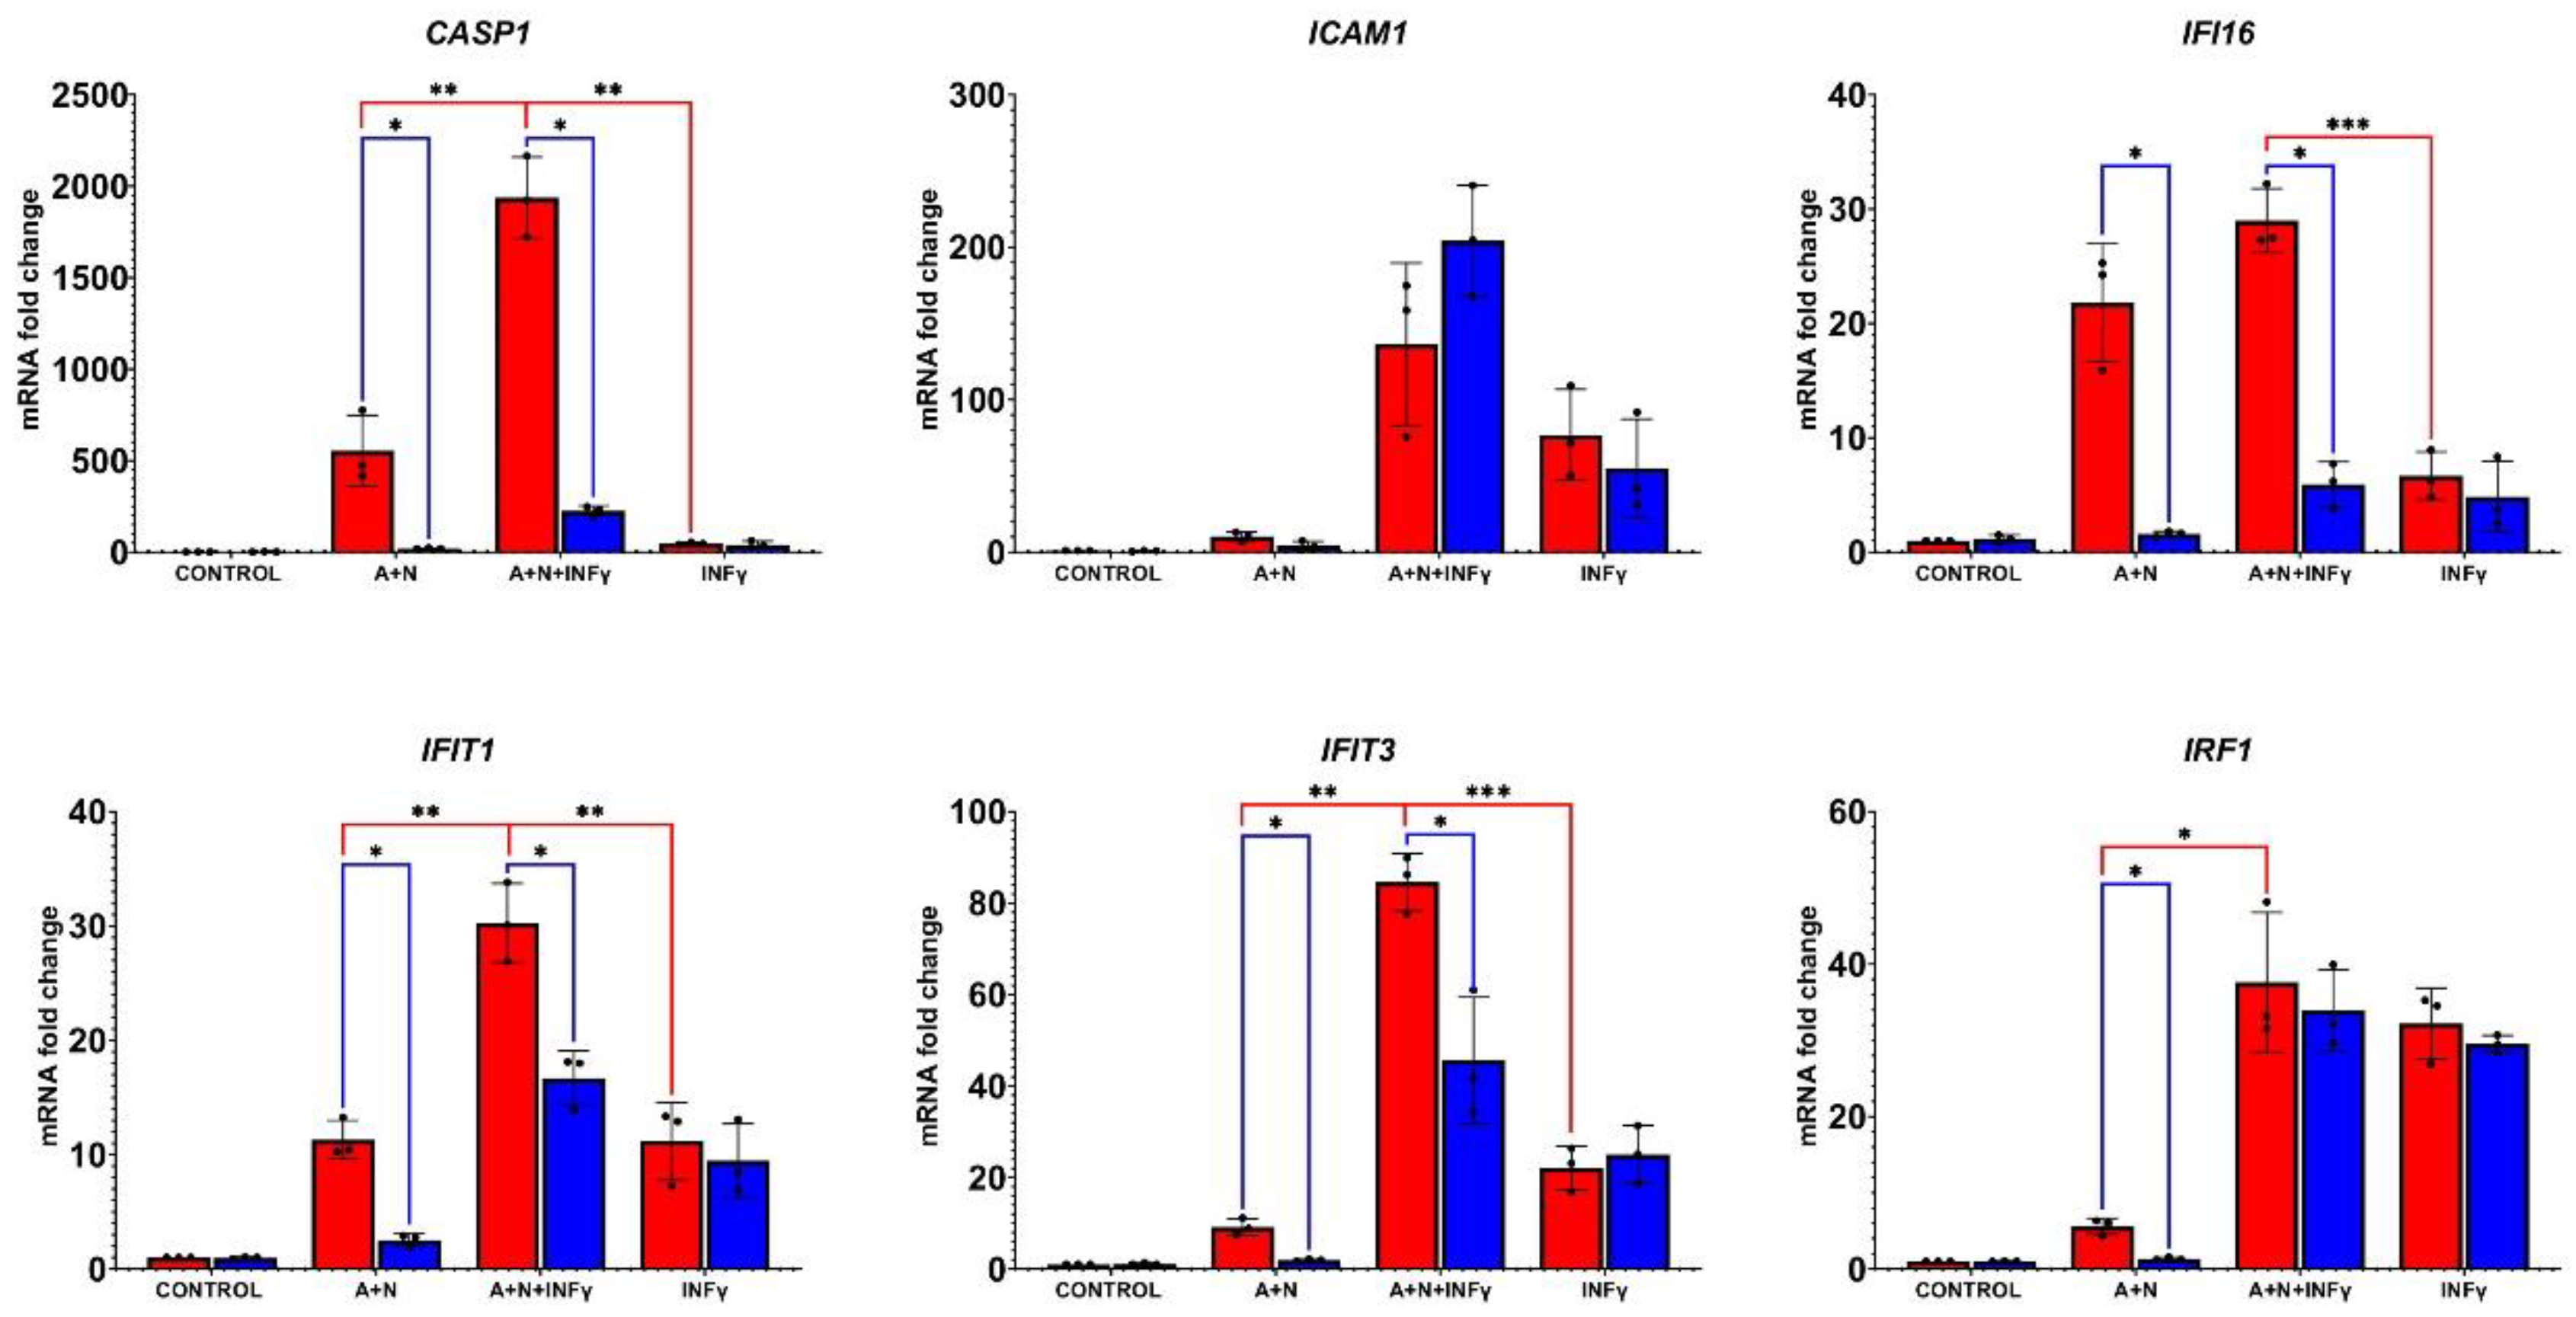
Figure 10.
The collaboration between p53 and IFNγ in activation of CASP1 is cell-specific. A. The Western blot of lysates from NCI-H292 lung cancer cell line exposed to A+N, IFNα1 (1 ng/ml), IFNγ (1 ng/ml) or the indicated combinations for 24 h. B. The Western blot of lysates from GM07492 normal human fibroblasts exposed to A+N, IFNγ (1 ng/ml) or the their combination for 24 h. C. The p53-proficient and p53-deficient NCI-H460 cells were exposed to A+N, IFNγ (1 ng/ml) or their combination for 24 h. Simultaneously, A549 cells were exposed in similar fashion as a positive control. The expression of indicated proteins was examined by Western blotting.
Figure 11.
Actinomycin D and nutlin-3a collaborate in regulation of innate immunity in p53-independent fashion. A. B. The indicated cell lines were exposed as shown for 24 h to actinomycin D (ActD), nutlin-3a (Nut), both compounds (A+N) with or without IFNγ (1 ng/ml). The protein expression was detected by Western blotting. C. Protein expression in p53-null NCI-H1299 cells exposed for 48 h to indicated compounds and their combination. CPT – camptothecin at 5 µM concentration.
Figure 12.
Actinomycin D and nutlin-3a co-treatment sensitizes cancer cells to the killing by NK-92 natural killer cells.
A. The results of MTS assay of A549 cells, which were either mock-treated (DMSO) or exposed to A+N for 48 h. After the treatment, the cells were trypsinized, counted and incubated either with empty medium or with NK-92 cells at two ratios (NK-92:A549 – 1:1 or 5:1) for 24 h. After change of culture medium the A549 cells were allowed to recover for 72 h before their viability was measured by MTS assay. To visualize only the effect of NK-92 cells, the viability of A549 cells, which were incubated without NK-92 cells was set to 100%. Four biological replicates were performed. The influence of A+N was calculated using unpaired t test with Welch’s correction taking into account the False Discovery Rate (FDR=5%).
B. The results of MTS assay of A549 cells performed as in A. Four biological replicates were performed. Before the co-incubation with NK-92 cells, A549 cells were exposed for 48 h with actinomycin D (ActD), nutlin-3a (Nut) or to both compounds (A+N). Also here, the viability of cells exposed to drugs and not co-incubated with NK-92 cells was set to 100%. The impact of substances were calculated using Brown-Forsythe and Welch ANOVA test. The statistical significance shown in the graph calculated by Dunnett’s T3 multiple comparisons test (*
p <
0,05, ** p<0,01, *** p<0,001). C. D. The results of MTS assay on indicated cell lines pre-exposed to A+N or mock-treated (DMSO) for 48 h and co-incubated with NK-92 cell line (1:1 ratio) for 24 h. Other conditions were as described in A.
E. The results of MTS assay performed on NCI-H1299 cells as described in B. The influence of A+N w calculated using unpaired t test with Welch’s correction taking into account the False Discovery Rate (FDR=5%).
F. The results of MTS assay performed on p53-proficient (CRISPR-Con) and p53-deficient (CRISPR-p53) A549 cells. The setup of experiment was as described above – 48 h exposure to A+N or mock-treatment (DMSO) with subsequent 24 h incubation either with medium or with NK-92 cells (1:1 ratio) with subsequent 72 h recovery. Three biological replicates were performed. The influence of A+N w calculated using unpaired t test with Welch’s correction taking into account the False Discovery Rate (FDR=5%).
G. A549 cells were treated with A+N (48 h) or mock-treated as controls (Con), seeded onto 6-well plate in medium or with NK-92 cells at ratio 1:1 or 5:1 (NK-92:A549). After 24-h co-incubation the medium was removed and the attached A549 cells were allowed to recover for 5-7 days. Subsequently the cells were fixed and stained with crystal violet. Three biological replicates are shown. All statistical tests were performed using GraphPad Prism version 10.2.2 for Windows, GraphPad Software, Boston, Massachusetts USA,
www.graphpad.com.
