1. Introduction
Salmonella is one of the most common intestinal pathogens in animals and humans. In poultry,
Salmonella enteritidis (
S. Enteritidis) and
Salmonella Typhimurium (
S. Typhimurium) infections are insidious and usually asymptomatic or cause intestinal inflammation. Moreover,
Salmonella spp. can compete with the normal microbiota in various ways, disrupting its balance and causing a decline in the immunity of livestock and poultry, which, in severe cases, can cause high mortality [
1,
2]. The impact and economic loss to the poultry industry are significant by reducing meat and egg production, breeder fertility, and embryo hatchability [
3].
Gut microbial communities play an important role in avian health. For example, the ability of
Campylobacter to infect chickens is influenced by gut flora [
4]. Host immune responses are strongly correlated with changes in the abundance of intestinal bacteria; for example, the expression of the pro-inflammatory cytokine interleukin 6 (IL-6) is positively correlated with
Shigella,
Parasuttterella, and
Vampirovibrio and negatively correlated with
Fecalbacterium [
5]. Therefore, it is essential to have a comprehensive understanding of the effects of
Salmonella infection on the intestinal flora of poultry, which can help control the disease's occurrence and development. Wenchang chickens are the most economically valuable indigenous livestock species in Hainan Province [
6]. However, little is known about the changes in their intestinal flora after
Salmonella infection.
The ability of
S. Typhimurium to use the respiratory electron acceptor tetrathionate, which is produced during inflammation, provides it with a growth advantage over other flora in the inflamed gut environment [
2]. Thus, controlling the development of intestinal inflammation might help enhance resistance to intestinal colonization by
Salmonella [
2]. Inflammation is regulated by inflammatory mediators, and the arachidonic acid (ARA) metabolic pathway in the polyunsaturated fatty acid metabolic network has been reported to be the major route by which inflammatory mediators are produced [
7,
8]. ARA and its metabolic derivatives (ARA-like) are involved in pathophysiological processes related to cell injury, inflammation, and apoptosis. For example, they are involved in physiological processes such as blood leukocyte chemotaxis, platelet aggregation, and the promotion of intestinal inflammation by mediating Th17 and Th1 cells [
7,
9]. It has been reported that infection of human intestinal epithelial cell lines (Caco2 and HT29) with both enteroinvasive
Escherichia coli and
Salmonella significantly increased cyclooxygenase two expression and prostaglandin E2 (PGE
2) production [
10]. Increased prostaglandin F2α (PGF
2α) release was also observed in intestinal epithelial cells following
Salmonella infection [
11]. PGE
2, 5-HETE, 8-HETE, 12-HETE, and 15-HETE syntheses were increased in Caco2 cells after lipopolysaccharide (10 g/mL) treatment [
12]. However, the question of whether ARA metabolites mediate the development of avian
Salmonella enteritis has not been reported. Therefore, given the critical role of ARA and its metabolites in mediating the inflammatory response, it is essential to elucidate the metabolic changes of ARA in intestinal tissues following
Salmonella infection. The metabolic changes of ARA in the intestinal tissues of Wenchang chickens after
S. Typhimurium infection were detected by ultra-high performance liquid chromatography-tandem mass spectrometry (UHPLC-MS/MS). This study further explored the potential link between ARA metabolic pathways and avian
Salmonella enteritis, which might contribute to the prevention and treatment of the disease.
2. Materials and Methods
2.1. Ethics Statement
The sampling method and all subsequent methods were approved by the Ethics Committee of Hainan University (Haikou, China, Permit No. HNUAUCC-2023-00080). This experiment did not involve endangered or protected species.
2.2. Animal Experiments
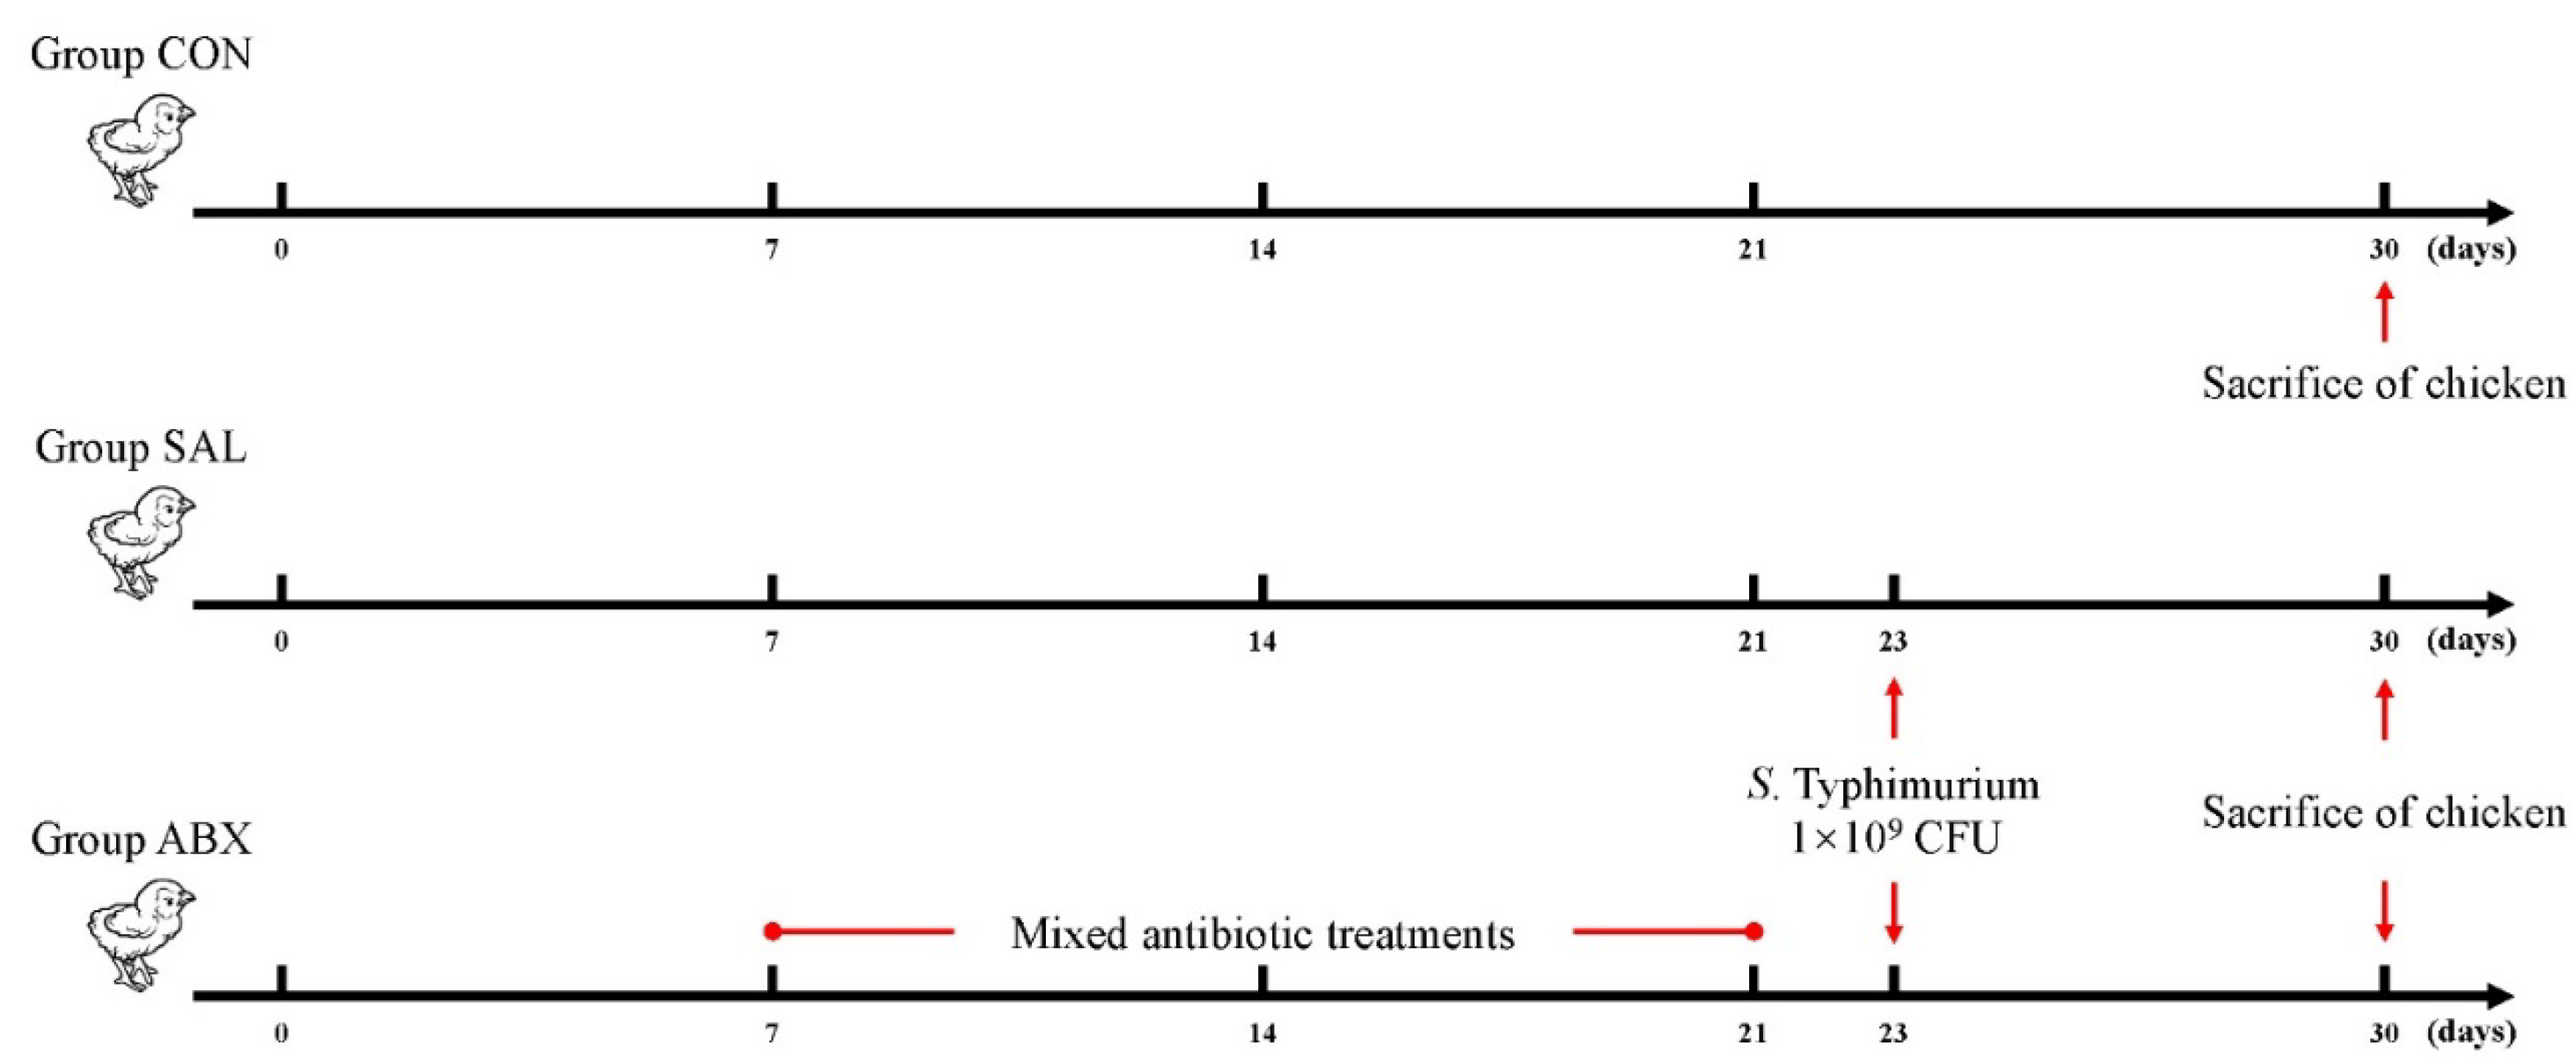
A total of eighteen fourteen-day-old Wenchang chickens (purchased from Hainan Taniu Wenchang Chicken Co.) were randomly divided into three groups (n=6). The CON group was the healthy control group. The SAL group was infected with
Salmonella Typhimurium (
S Typhimurium) on day 23. The ABX group was administered a cocktail of antibiotics containing ampicillin (1 g/L), neomycin sulfate (1 g/L), metronidazole (1 g/L), and vancomycin (0.5 g/L) via drinking water from days 7 to 21; on day 22, this group was given regular drinking water and infected with
S. Typhimurium on day 23 (
Figure 1). All the chickens were fed the same diet and had free access to food and water. The beginning of the experiment was counted as day 0, and the entire experiment lasted 30 days. Infection was by gavage and the infection measure was 1 × 10
9 CFU of
S. Typhimurium per chicken. The strain was
Salmonella enterica serovar Typhimurium (strain no. ATCC14028). The three groups of chickens were kept in three separate rooms with the same temperature, humidity, and other conditions to avoid cross-infection. At 3-4 weeks of age, the temperature was 28-30 °C, the relative humidity was 55%-60%, and the illumination time was 16 hours; at 5-6 weeks of age, the temperature was 24-26 °C, the relative humidity was 50%-55%, and the light time was 12 hours. Chickens were fed in cages with dimensions of 120 cm × 60 cm × 45 cm. All chickens were euthanized by cervical dislocation on day 30, and cecum contents and cecal intestinal tissue were collected aseptically on ice for subsequent analysis.
2.3. 16s rDNA Sequencing and Data Analysis
The DNA was extracted using the CTAB (hexadecyl trimethyl ammonium bromide) method according to the manufacturer's instructions. PCR amplification was used to construct libraries for sequencing. Briefly, amplification was performed using the specific primers listed in
Table 1, and the PCR products were confirmed using 2% agarose gel electrophoresis, purified with AMPure XT beads (Beckman Coulter Genomics, Danvers, MA, USA), and quantified with Qubit (Invitrogen, USA) to obtain libraries for sequencing. The size and number of libraries were evaluated using Agilent 2100 Bioanalyzer (Agilent, USA) and Illumina (Kapa Biosciences, Woburn, MA, USA) library quantification kits, respectively. The libraries were sequenced on the NovaSeq PE250 platform. Quality raw reads were filtered under specific filtering conditions to obtain high-quality clean tags according to fqtrim (v0.94). Chimeric sequences were filtered using Vsearch software (v2.3.4) [
13]. After dereplication using DADA2 [
14], we obtained the feature table and sequence. Alpha and beta diversities were randomly calculated by normalizing to identical sequences. Then, according to the SILVA (Release 138) classifier [
15], feature abundance was normalized using the relative abundance of each sample. QIIME2 was used to calculate beta diversity and alpha diversity (Chao1, observed species, Good’s coverage index, Shannon, and Simpson) [
16], and the R package was used to prepare the graphs. BLAST was used for sequence alignment, and the feature sequences were annotated using the SILVA database for each representative sequence. Other diagrams were drawn using the R package (v3.5.2,
https://cran.r-hub.io/bin/windows/base/). This study’s raw data were uploaded to the NCBI database under the number PRJNA1027078. Sequencing and data analysis were entrusted to Shanghai Biotree Biotech Co.
LDA effect size (LEfSe) analysis was used to find species that differed significantly in abundance between groups. First, the Kruskal-Wallis rank sum test was utilized to detect all characterized species, and significantly different species were identified by detecting differences in species abundance between different groups. Then, the Wilcoxon rank sum test was utilized to test whether all subspecies of the significantly different species obtained in the previous step converged to the same taxonomic level. Finally, linear discriminant analysis (LDA) was used to estimate the magnitude of the effect of species abundance on the differential effect to obtain the final differential species. The screening conditions for LDA were LDA > 4 and P < 0.05.
2.4. Metabolite Extraction and Standard Solution Preparation
Briefly, the intestinal tissues were treated with extract (80% methanol/H2O (V/V), precooled at -40 °C, containing isotopically labeled internal standard mixture), purified via solid-phase extraction, dried through nitrogen blowing, re-solubilized with 30% acetonitrile, and then centrifuged at 4 °C and 12,000 rpm for 15 min to obtain the supernatant, which was subjected to UHPLC-MS/MS analysis.
Stock solutions were prepared by dissolving or diluting each standard substance to a final concentration of 1 μg/mL. An aliquot of each stock solution was transferred to an Eppendorf tube to obtain a mixed working standard solution. A series of traditional calibration solutions were then prepared through stepwise dilution of this mixed standard solution (containing the isotopically labeled internal standard mixture at identical concentrations to the samples).
Table S2 lists the standards used in this assay.
2.5. UHPLC-MRM-MS Analysis
UHPLC separation was performed using an EXIONLC System (Sciex) equipped with a Waters ACQUITY UPLC BEH C18 column (150 × 2.1 mm, 1.7 μm, Waters). A SCIEX 6500 QTRAP+ triple quadrupole mass spectrometer (Sciex) equipped with an IonDrive Turbo V electrospray ionization interface was used for assay development. The MRM parameters for each target analyte were optimized using flow injection analysis by injecting standard solutions of individual analytes into the API source of the mass spectrometer. Several of the most sensitive transitions were used in MRM scan mode to optimize the collision energy for each Q1/Q3 pair (
Table S3). Among the optimized MRM transitions per analyte, the Q1/Q3 pairs with the highest sensitivity and selectivity were selected as “quantifiers” for quantitative monitoring. The additional transitions acted as qualifiers to verify the identity of the target analyte. The SCIEX Analyst WorkStation Software (Version 1.6.3) and the Multiquant 3.03 software were used for MRM data acquisition and processing. Metabolite assays and data analysis were entrusted to Shanghai Biotree Biotech Co.
2.6. Metabolite Assay Results and Quality Control
The calibration solutions were sequentially diluted 2-fold and analyzed using UHPLC-MRM-MS. The lower limits of detection (LLODs) and quantification (LLOQs) of the methods were calculated using their signal-to-noise ratios. According to the United States Food and Drug Administration guidelines for bioanalytical method validation, the LLODs of a method are defined as the concentration of a compound with a signal-to-noise ratio of 3, and the LLOQs of a method are defined as the concentration of a compound with a signal-to-noise ratio of 10.
Table S4 lists the resulting LLODs and LLOQs. The LLODs for the targeted metabolites ranged from 0.0195 to 1.2500 ng/mL, and the LLOQs ranged from 0.0390 to 2.5000 ng/mL. The correlation coefficients (R2) of regression fitting were above 0.9959 for the analytes, indicating a good quantitative relationship between the MS responses and analyte concentrations, satisfying the target metabolomics analysis.
Table S5 lists the analytical recoveries and relative standard deviations of the QC samples with five technical replicates. The recoveries were 85.07–111.47% for all analytes, with all RSDs below 14.09% (n = 5). The analysis metrics indicated that the method allowed for the accurate quantitation of the targeted metabolites in the biological samples in the above concentration range.
The quantification results are presented in
Table S6. The final concentration (cF, ng/mL) was equal to the calculated concentration (cC, ng/mL) multiplied by the dilution factor (Dil). For solid samples, the metabolite concentration (cM, ng/g) was equal to the final concentration (cF, ng/mL) multiplied by the final volume (VF, μL) and equal to the sample experiment concentration factor (CF) divided by the mass (m, mg) of the sample. N/A indicates that the targeted metabolites were not detectable in the corresponding samples.
2.7. Cell Experiments
2.7.1. Establishment of HD11 Cell Model Infected by S. Typhimurium
First, the lowest concentration of cyclooxygenase inhibitor (aspirin) that inhibited the growth of S. Typhimurium in vitro was determined. S. Typhimurium was cultured in an LB sterile liquid medium containing different aspirin concentrations for 6-8 hours, and the bacteria growth in each group was counted by the plate count method.
Varied concentrations of aspirin (0, 31.25, 62.5, 125, 200, 500, and 1000 μg/mL) were then applied to HD11 cells for different times (0, 12, and 24 hours). Cell viability was measured by MTT to determine the maximal aspirin concentration and treatment time.
Finally, HD11 cells were infected with S. Typhimurium at selected MOIs (1, 5, 10, 20, and 50). The relative expression levels of iNOS, IL-1β, IL-6, and IL-10 mRNA in the cells were measured to determine the appropriate MOIs and time of infection.
2.7.2. Chicken Grouping and Cell Experiments
HD11 cells were infected with S. Typhimurium for 2 hours (MOI = 20) after being pretreated with a medium with aspirin concentrations of 30, 60, and 120 μg/mL for 12 hours.
2.8. Quantitative Real-Time Polymerase Chain Reaction (qRT-PCR) Analysis and ELISA ASSAY
Changes in specific cytokine mRNAs and ARA metabolites in cecum in vivo and HD11 cells in vitro following
S. Typhimurium infection were assessed by qRT-PCR and ELISA. The cecum tissue was homogenized using an automated sample rapid grinder (Tissuelyser-24L, Shanghai Jingxin Industrial Development Co., Ltd., Shanghai, China), and total RNA was extracted from the cecum tissue using the TRIzol method. Total RNA was extracted from HD11 cells by the TRIzol method. cDNA was prepared by the TIANGEN cDNA synthesis kit. The qRT-PCR analysis was performed using SYBR Green Master Mix, and glyceraldehyde-3-phosphate dehydrogenase (GAPDH) was used as a housekeeping gene. The mRNA concentration of all samples was adjusted to 1000 ng/mL during reverse transcription. The primers used are listed in the
Supplementary Materials (
Table S1). The relative gene expression was calculated using the 2
−ΔΔCt method. GraphPad Prism (version 8.0c) and SPSS 17.0 were used for statistical analysis. Data were analyzed using the 2
−ΔΔCt method and expressed as mean ± standard error (SEM). The statistical significance of the data was assessed using a one-way analysis of variance (ANOVA) followed by Duncan's and Tukey's tests.
The ELISA kits were used to detect COX-2, PGF2α, PLA2, and ARA in the samples according to the instructions.
2.9. Statistical Analysis of Data
Metabolites from each group were normalized using the Z-score normalization method, which is indicated by the value of (x-μ)/σ. "μ" denotes the mean of the overall data, "σ" denotes the standard deviation of the overall data, and "x" denotes the individual observation. The Z-score values were calculated using MedCalc 22 (
https://www.medcalc.org/) software. R (3.4.4,
https://cran.r-hub.io/bin/windows/base/old/3.4.4/) was used to create a plot of the Z-scores.
Spearman's correlation analysis was used to assess the correlation between three data types: oxidized fats, inflammatory factors, and intestinal flora. The Spearman correlation analysis was carried out using the Stats package (2.5.4,
https://search.r-project.org/R/refmans/stats/html/00Index.html) for R (3.4.4).
Multivariate statistical analysis was used to calculate the variable importance in the projection (VIP) values and orthogonal projections to latent structure discriminant analysis (OPLS-DA). The Mann–Whitney U test was used to compare differences between two groups of samples with biological replicates; the Kruskal–Wallis test was used to compare differences between multiple groups of samples with biological replicates. Adonis and ANOSIM were used to test whether the differences between groups were significantly greater than those within groups and to determine whether the subgroups were significant. The Vegan package (2.5.4,
https://cran.r-project.org/web/packages/vegan/index.html) for R (3.4.4) was used for the above data analysis.
The datasets were evaluated for normal distribution using the D'Agostino–Pearson test and presented as mean ± standard error of the mean (SEM). Statistical significance was determined with either a two-tailed unpaired Student's t-test (for two groups) or one-way ANOVA (for grouped comparisons). In datasets analyzed using ANOVA, the Bonferroni post hoc test was adopted. A p-value less than 0.05 was considered statistically significant. All statistical analysis was performed with Prism version 8.0 (GraphPad, La Jolla, CA, USA) and SPSS 17.0.
4. Discussion
Intestinal inflammation caused by avian salmonellosis is necessary for
Salmonella colonization and survival [
2]. Arachidonic acid (ARA) metabolites are an important and widely acting class of inflammatory mediators [
20]. Therefore, the relationship between arachidonic acid metabolites and
Salmonella enteritis would be beneficial for the prevention and treatment of the disease.
PLA2 and COX-2 are key enzymes for ARA production and metabolism [
21,
22], respectively.
Salmonella Typhimurium (
S. Typhimurium) infection caused increased levels of PLA2 and COX-2 in the intestinal tissues of Wenchang chickens, which may be the direct cause of the increased levels of arachidonic acid and its metabolites in the cecum tissues. A number of studies have shown that ARA metabolites (e.g., prostaglandins, leukotrienes, and lipoxins) mediate inflammatory responses in the intestine via different types of G-protein-coupled receptors [
23,
24,
25,
26]. For example, PGE
2 signals through prostaglandin E receptor 2 (EP2) on neutrophils and tumor-associated fibroblasts, which promotes inflammation through multiple steps to form the tumor microenvironment in colorectal cancer [
27] and induces mast cell activation through the EP3 receptor signaling pathway, which enhances vascular permeability and promotes acute inflammation [
28]. PGF2α levels are significantly increased in patients with ulcerative enteritis, which is alleviated by the use of PLA2 inhibitors [
29]. 5-OxoETE (precursor of 5(S)-HETE) promotes the basophil migratory response [
30], and is involved in neuroinflammatory activities [
31]. LXA4 facilitates the reduction in chronic inflammation, inhibits the production of PGE
2 and LTs, and suppresses the production of pro-inflammatory factors IL-6 and TNF-α [
32]. 15-OxoETE can activate anti-inflammatory Nrf2 signaling and inhibit the NF-κB-mediated pro-inflammatory pathway [
33]. EETs (e.g., 8,9-EET, 11,12-EET) prevent leukocyte adherence to the vascular wall through inhibition of the transcription factors NF-κB and IκB kinase and play an important non-vasodilatory role in vascular inflammation [
34]. EETs can also inhibit the activation of NOD-like receptor thermal protein domain associated protein three inflammatory vesicles by suppressing calcium overload and reactive oxygen species production in macrophages, thereby facilitating the treatment of acute lung injury [
35]. It is thus evident that arachidonic acid metabolites have both anti-inflammatory and pro-inflammatory effects. We speculate that arachidonic acid metabolites are key substances mediating avian
Salmonella enteritis.
Prostaglandins such as PGE2 and PGF2α are metabolized by ARA by the COX-2 pathway [
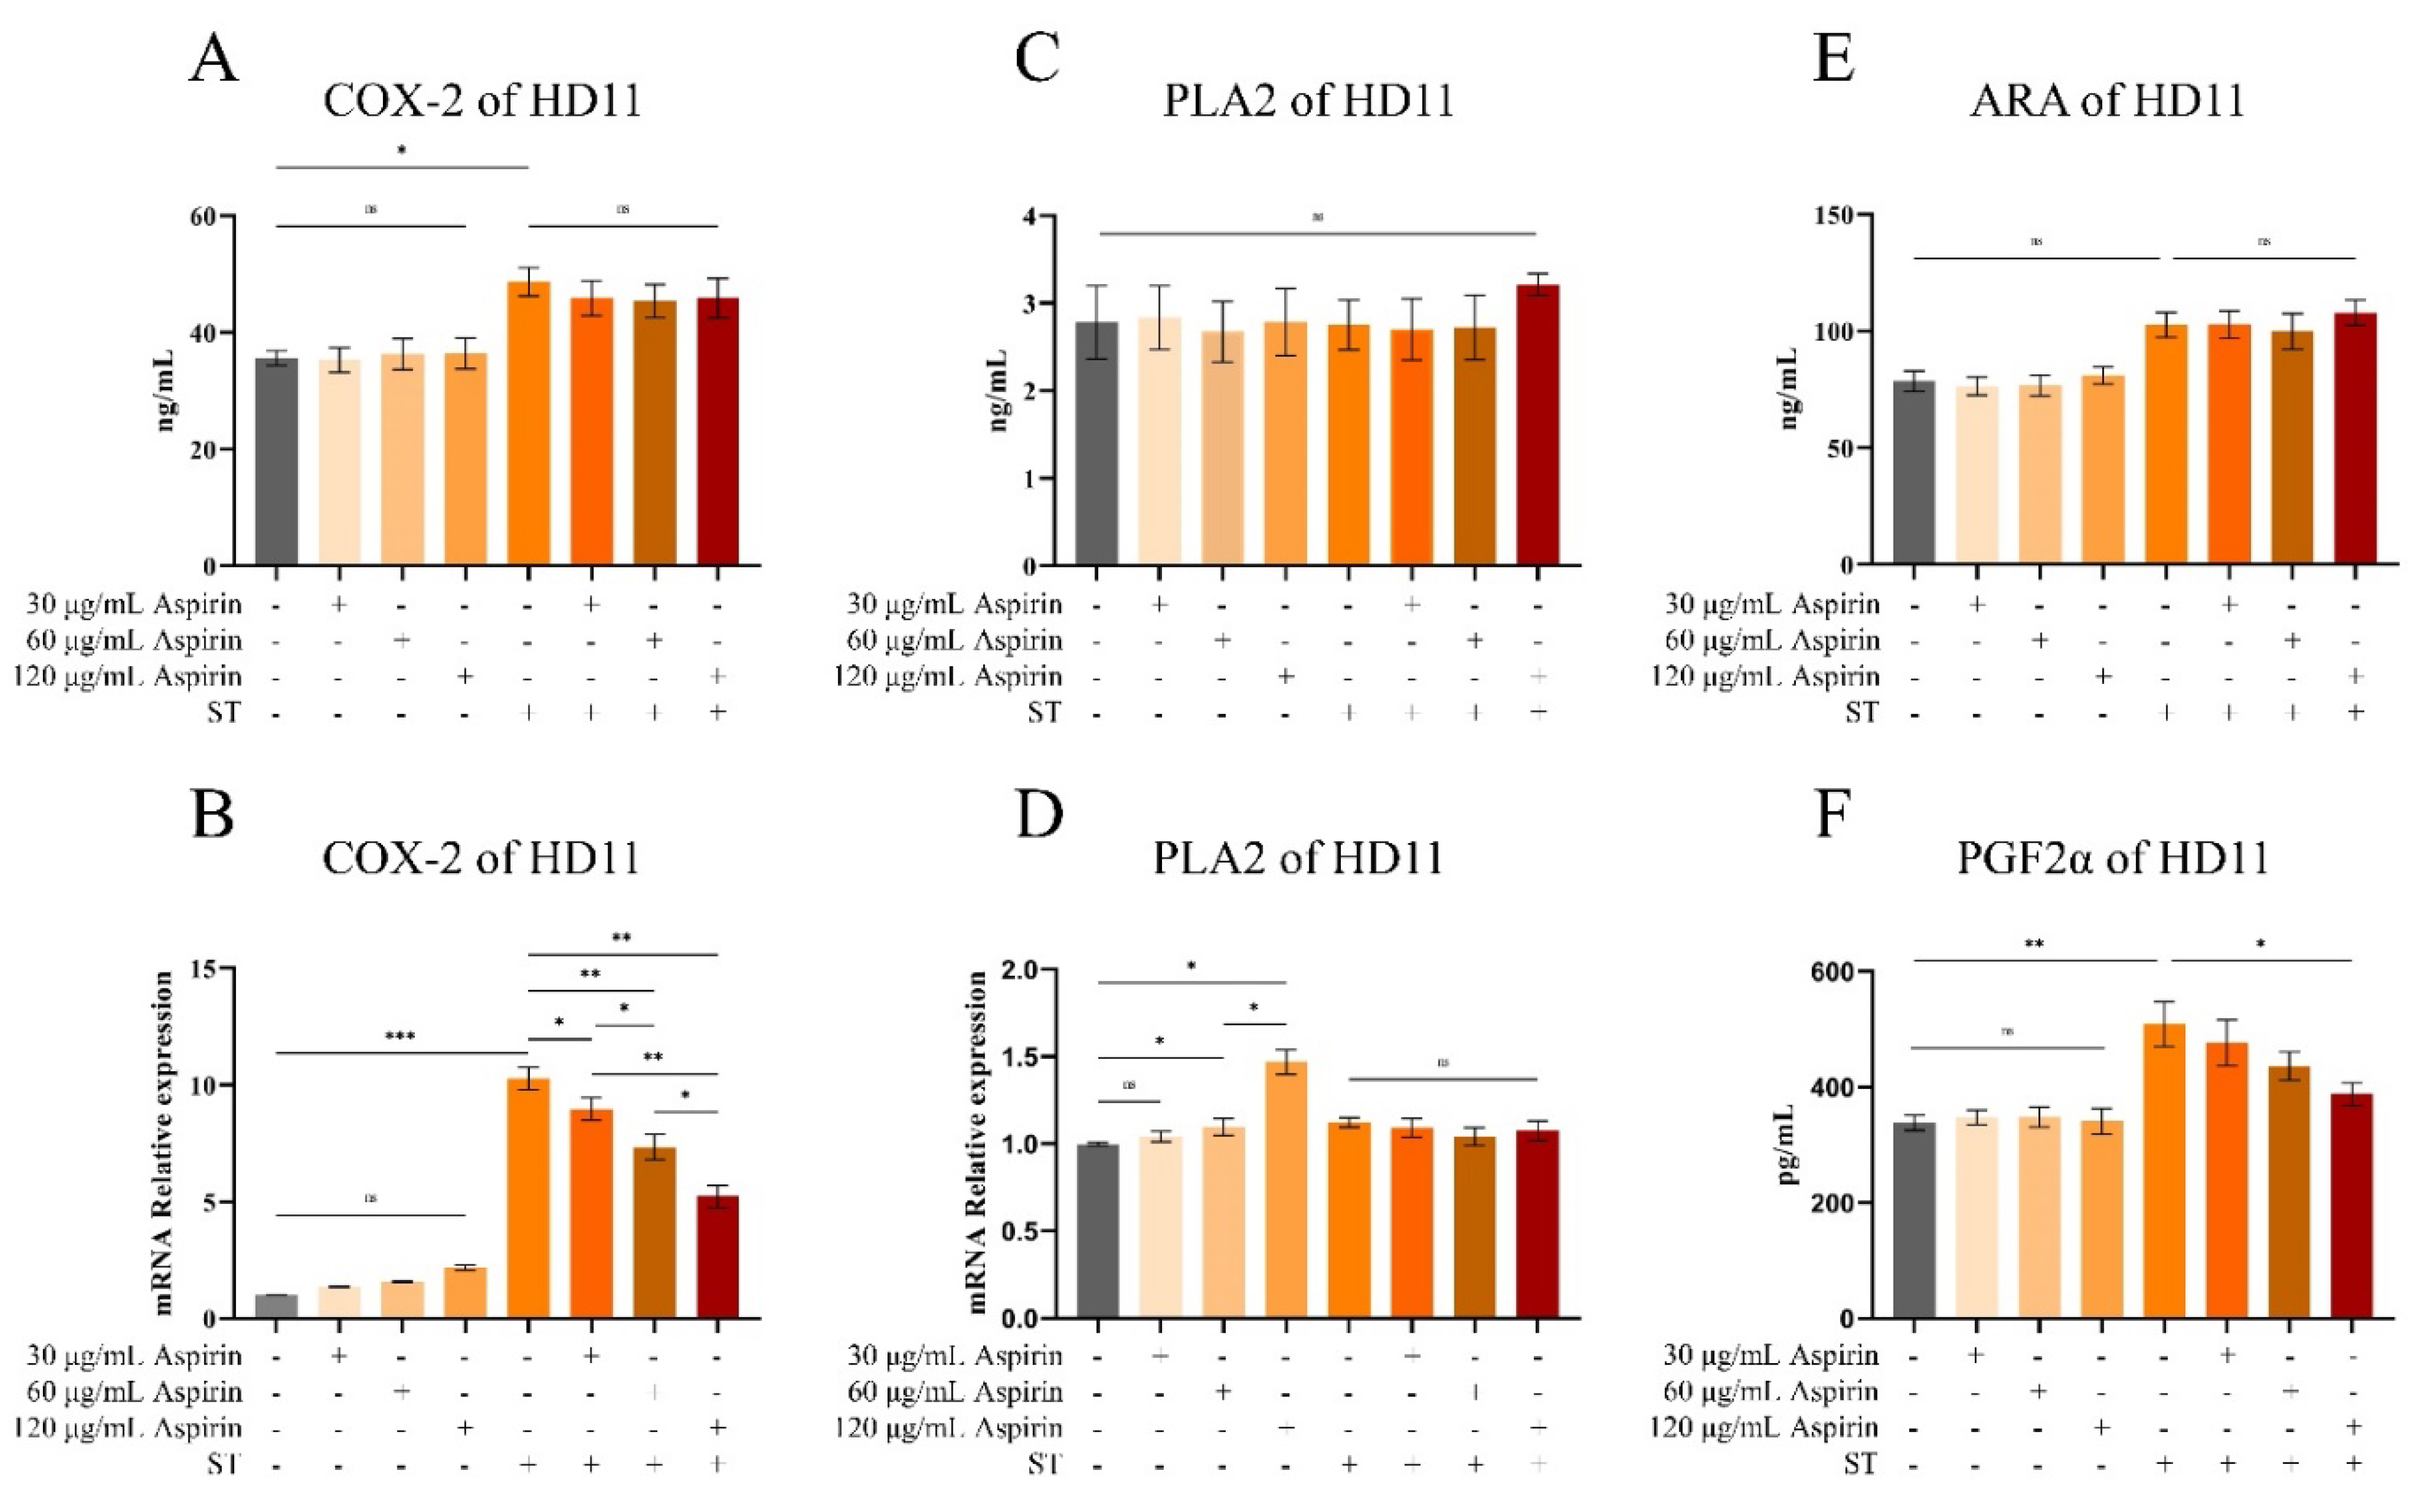
36]. We found that
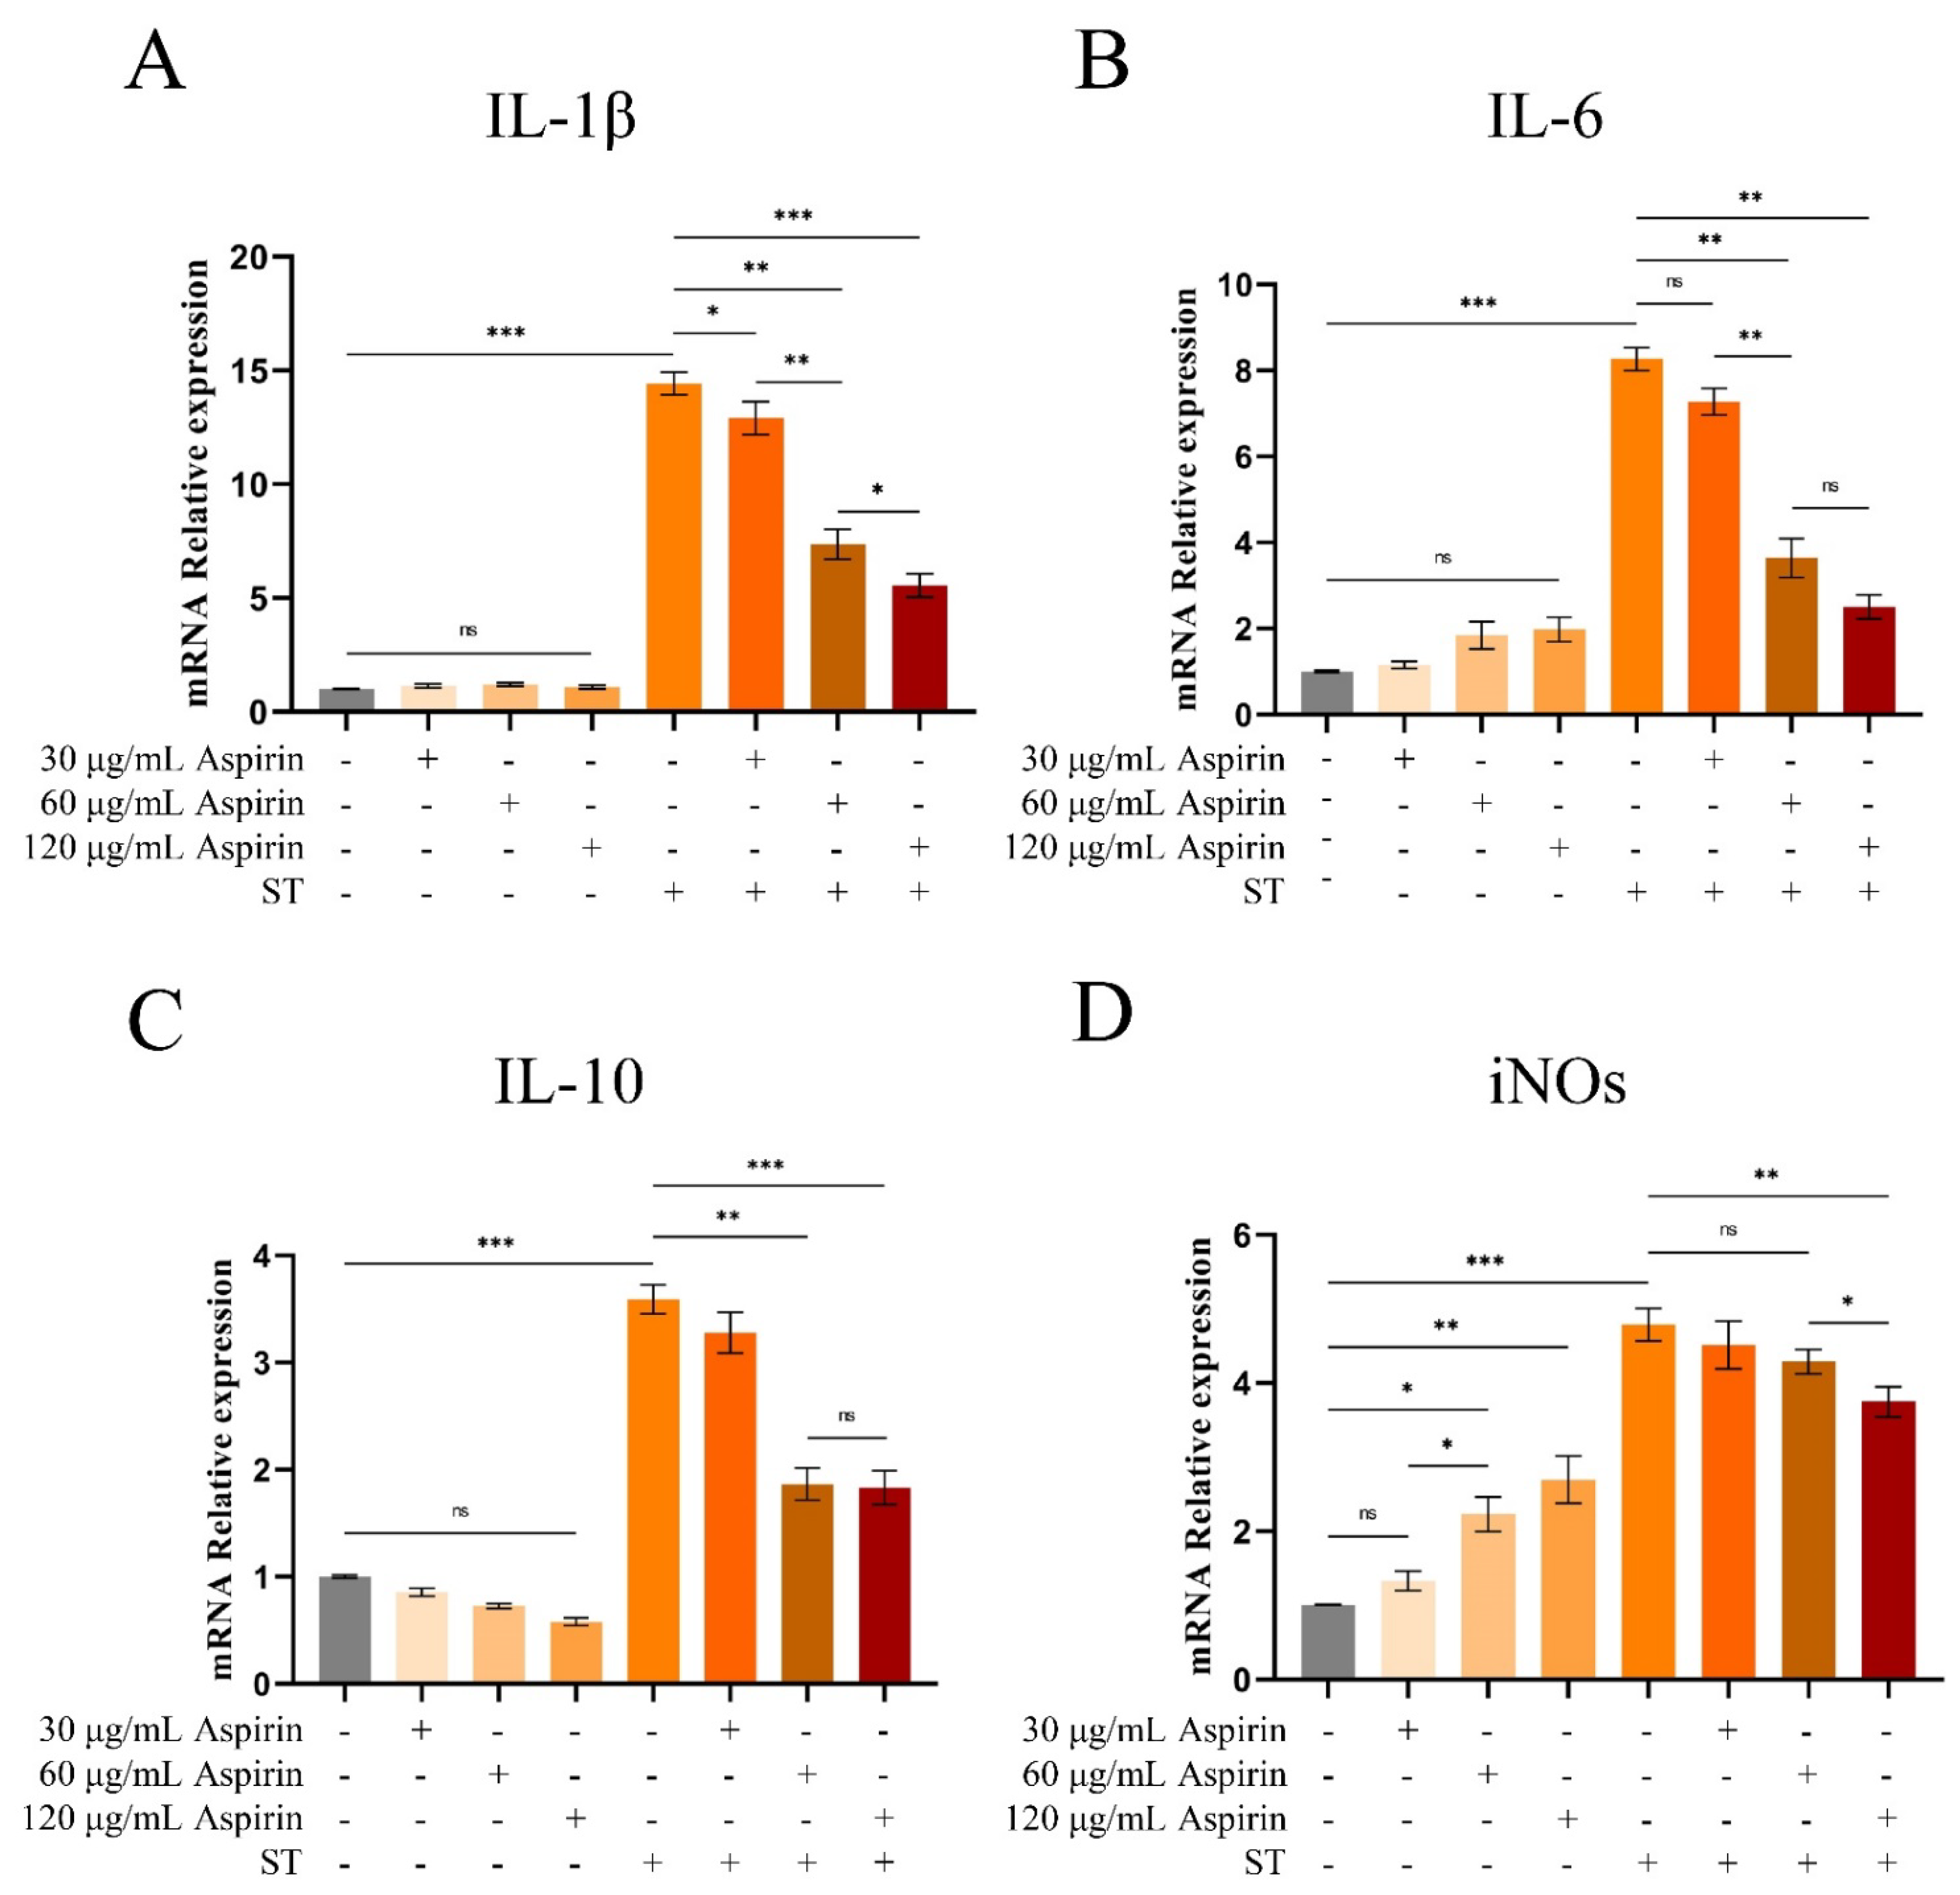
S. Typhimurium infection significantly increased the levels of COX-2 and PGF2α in HD11 cells and promoted the mRNA expression of inflammatory factors (IL-1β, IL-6, and iNOs). Furthermore, a cyclooxygenase inhibitor (aspirin) significantly inhibited the inflammatory response induced by
S. Typhimurium infection. This validates our conjecture, suggesting that the ARA cyclooxygenase metabolic pathway mediates the inflammatory response upon
S. Typhimurium infection. Unfortunately, this study did not examine how ARA metabolites mediate the development and progression of avian
Salmonella enteritis. This is because many of the metabolites have not been studied in vivo or in vitro in poultry, and some of the metabolites (e.g., EETs and PGE
2) are rapidly degraded to low effectors in the organism, making it difficult to control the experimental variables [
37]. Therefore, it is necessary to explore the research conditions further, find suitable experimental methods for validation, and gradually explore the mechanism of action of the ARA metabolites in
Salmonella-induced intestinal inflammation in the future.
Gut microbiota composition is one of the most important factors affecting animal intestinal immunity and serves as a barrier against invasion by pathogenic microorganisms. Infection with
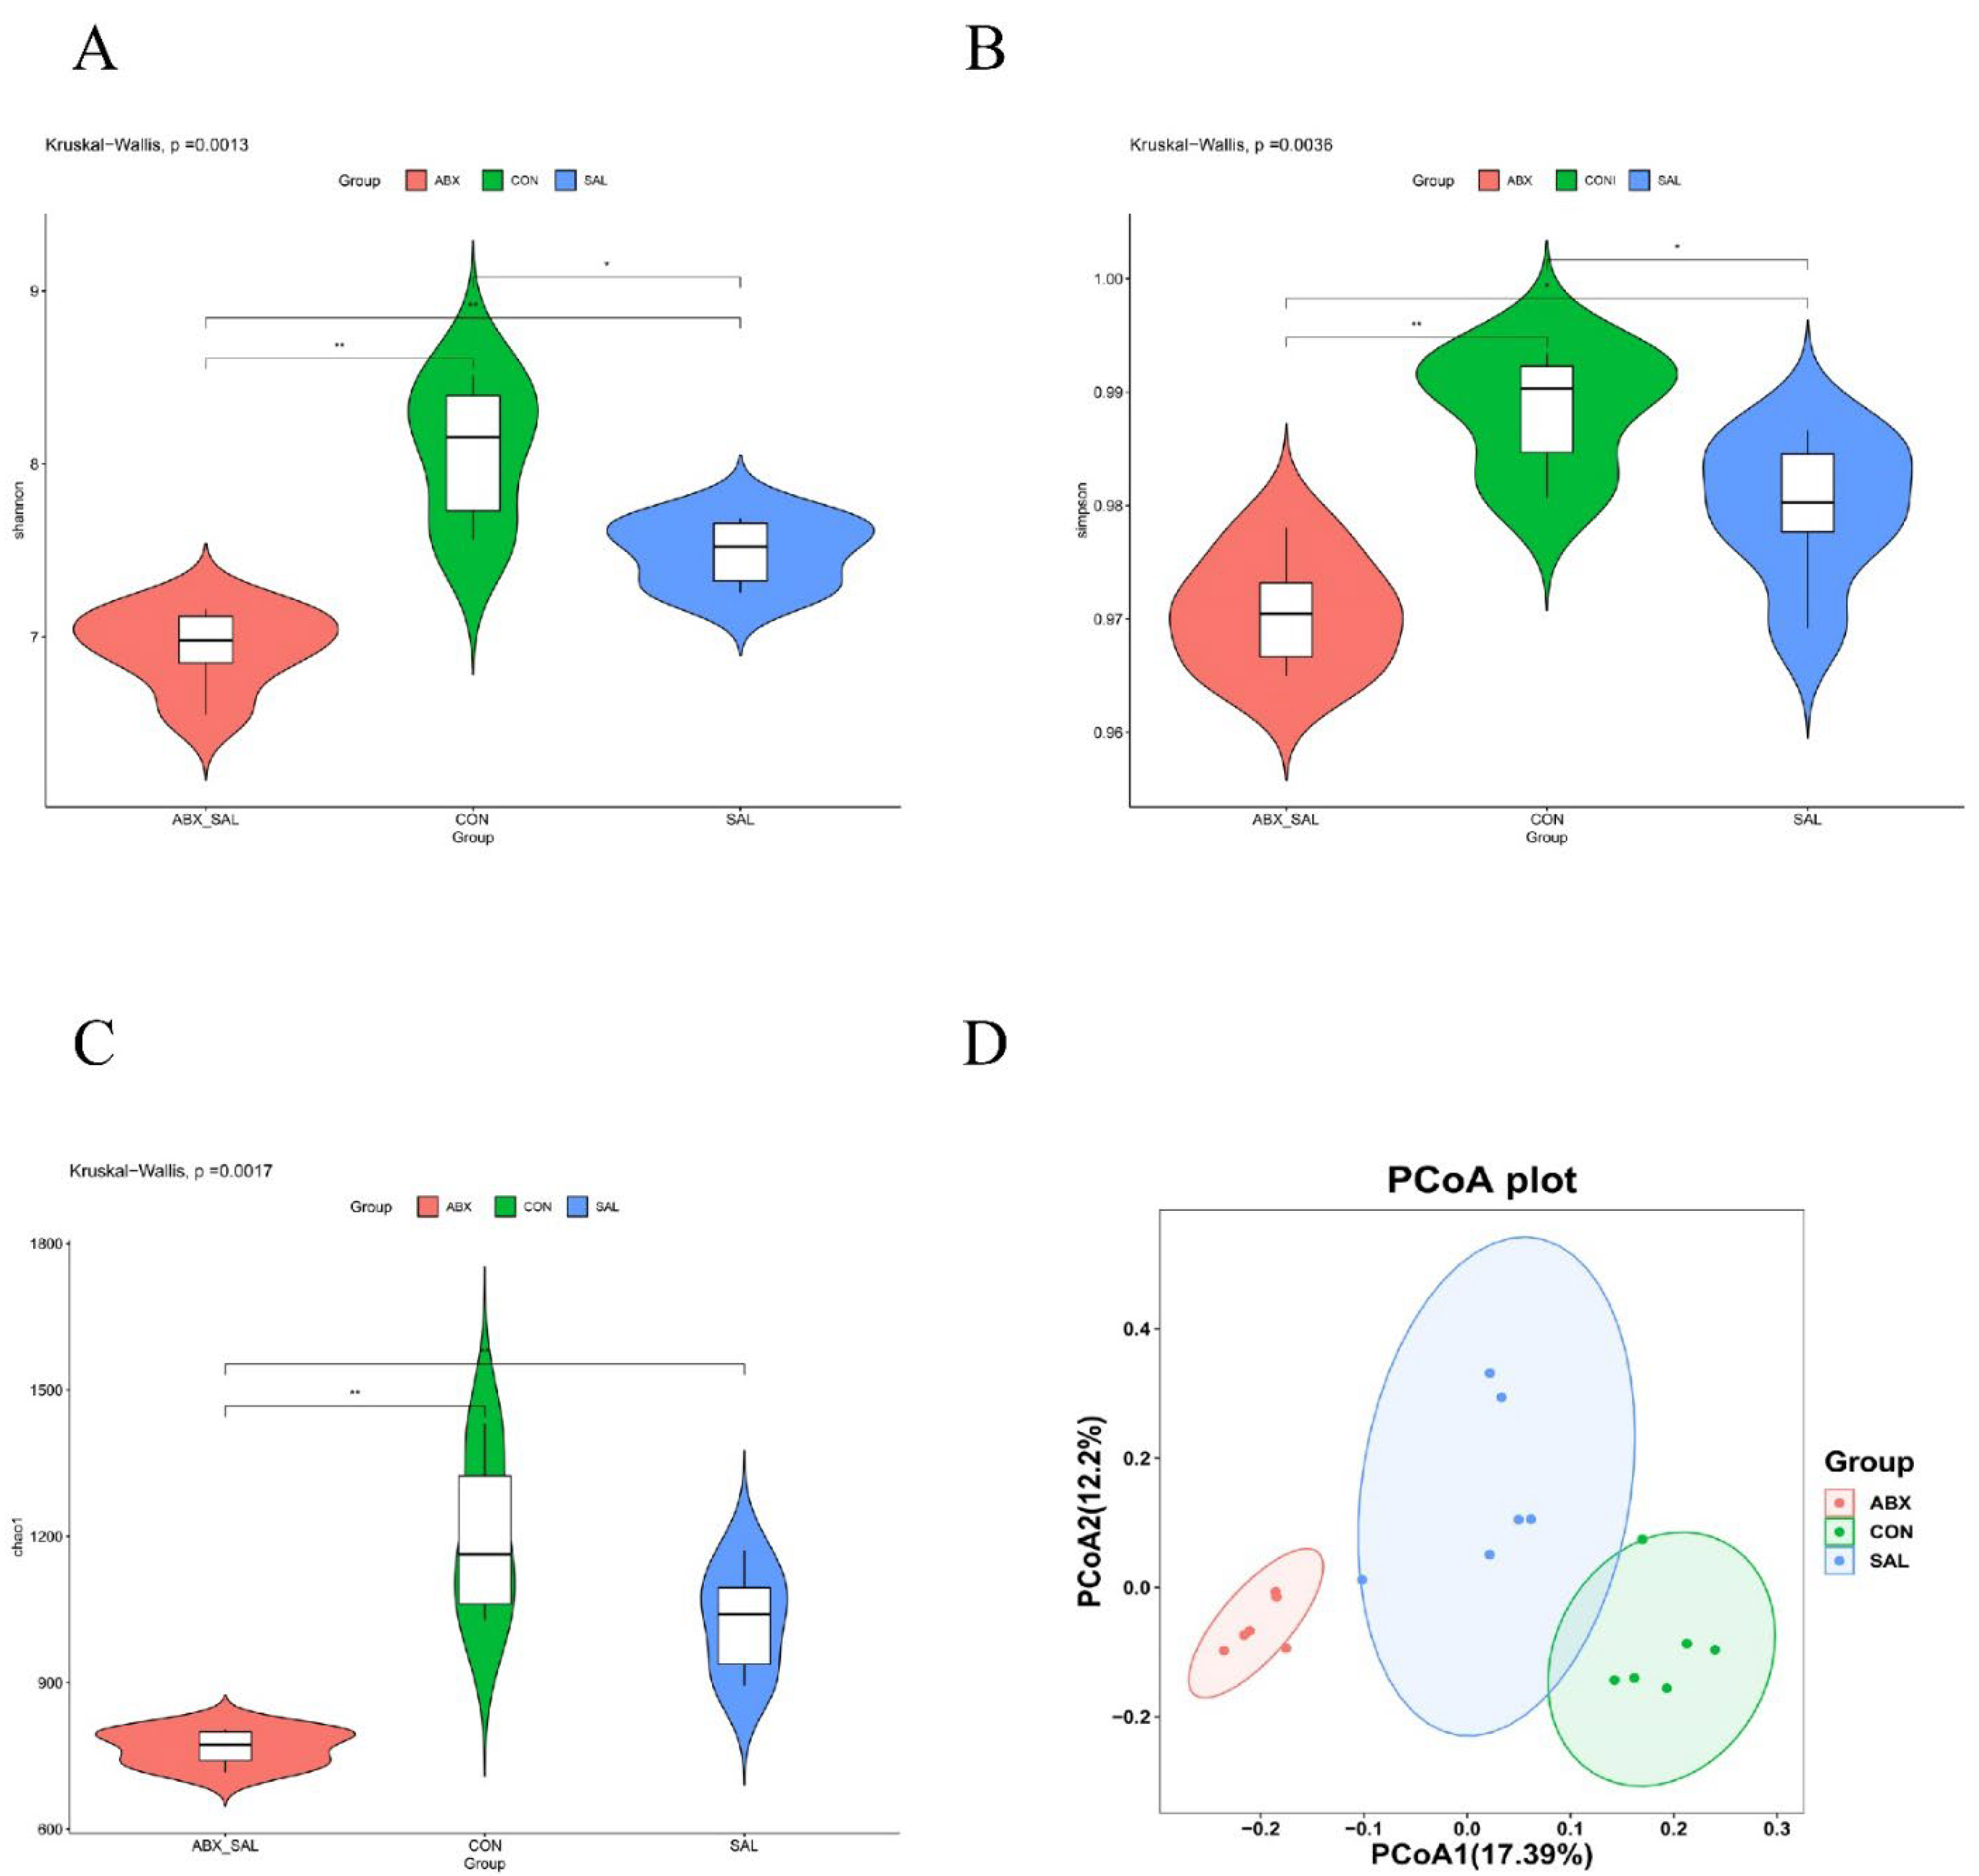
S. Typhimurium significantly reduced the number of microorganisms, the flora abundance, and the species diversity in the cecum of Wenchang chickens. This is similar to the changes in the intestinal flora of laying hens after
Salmonella infection [
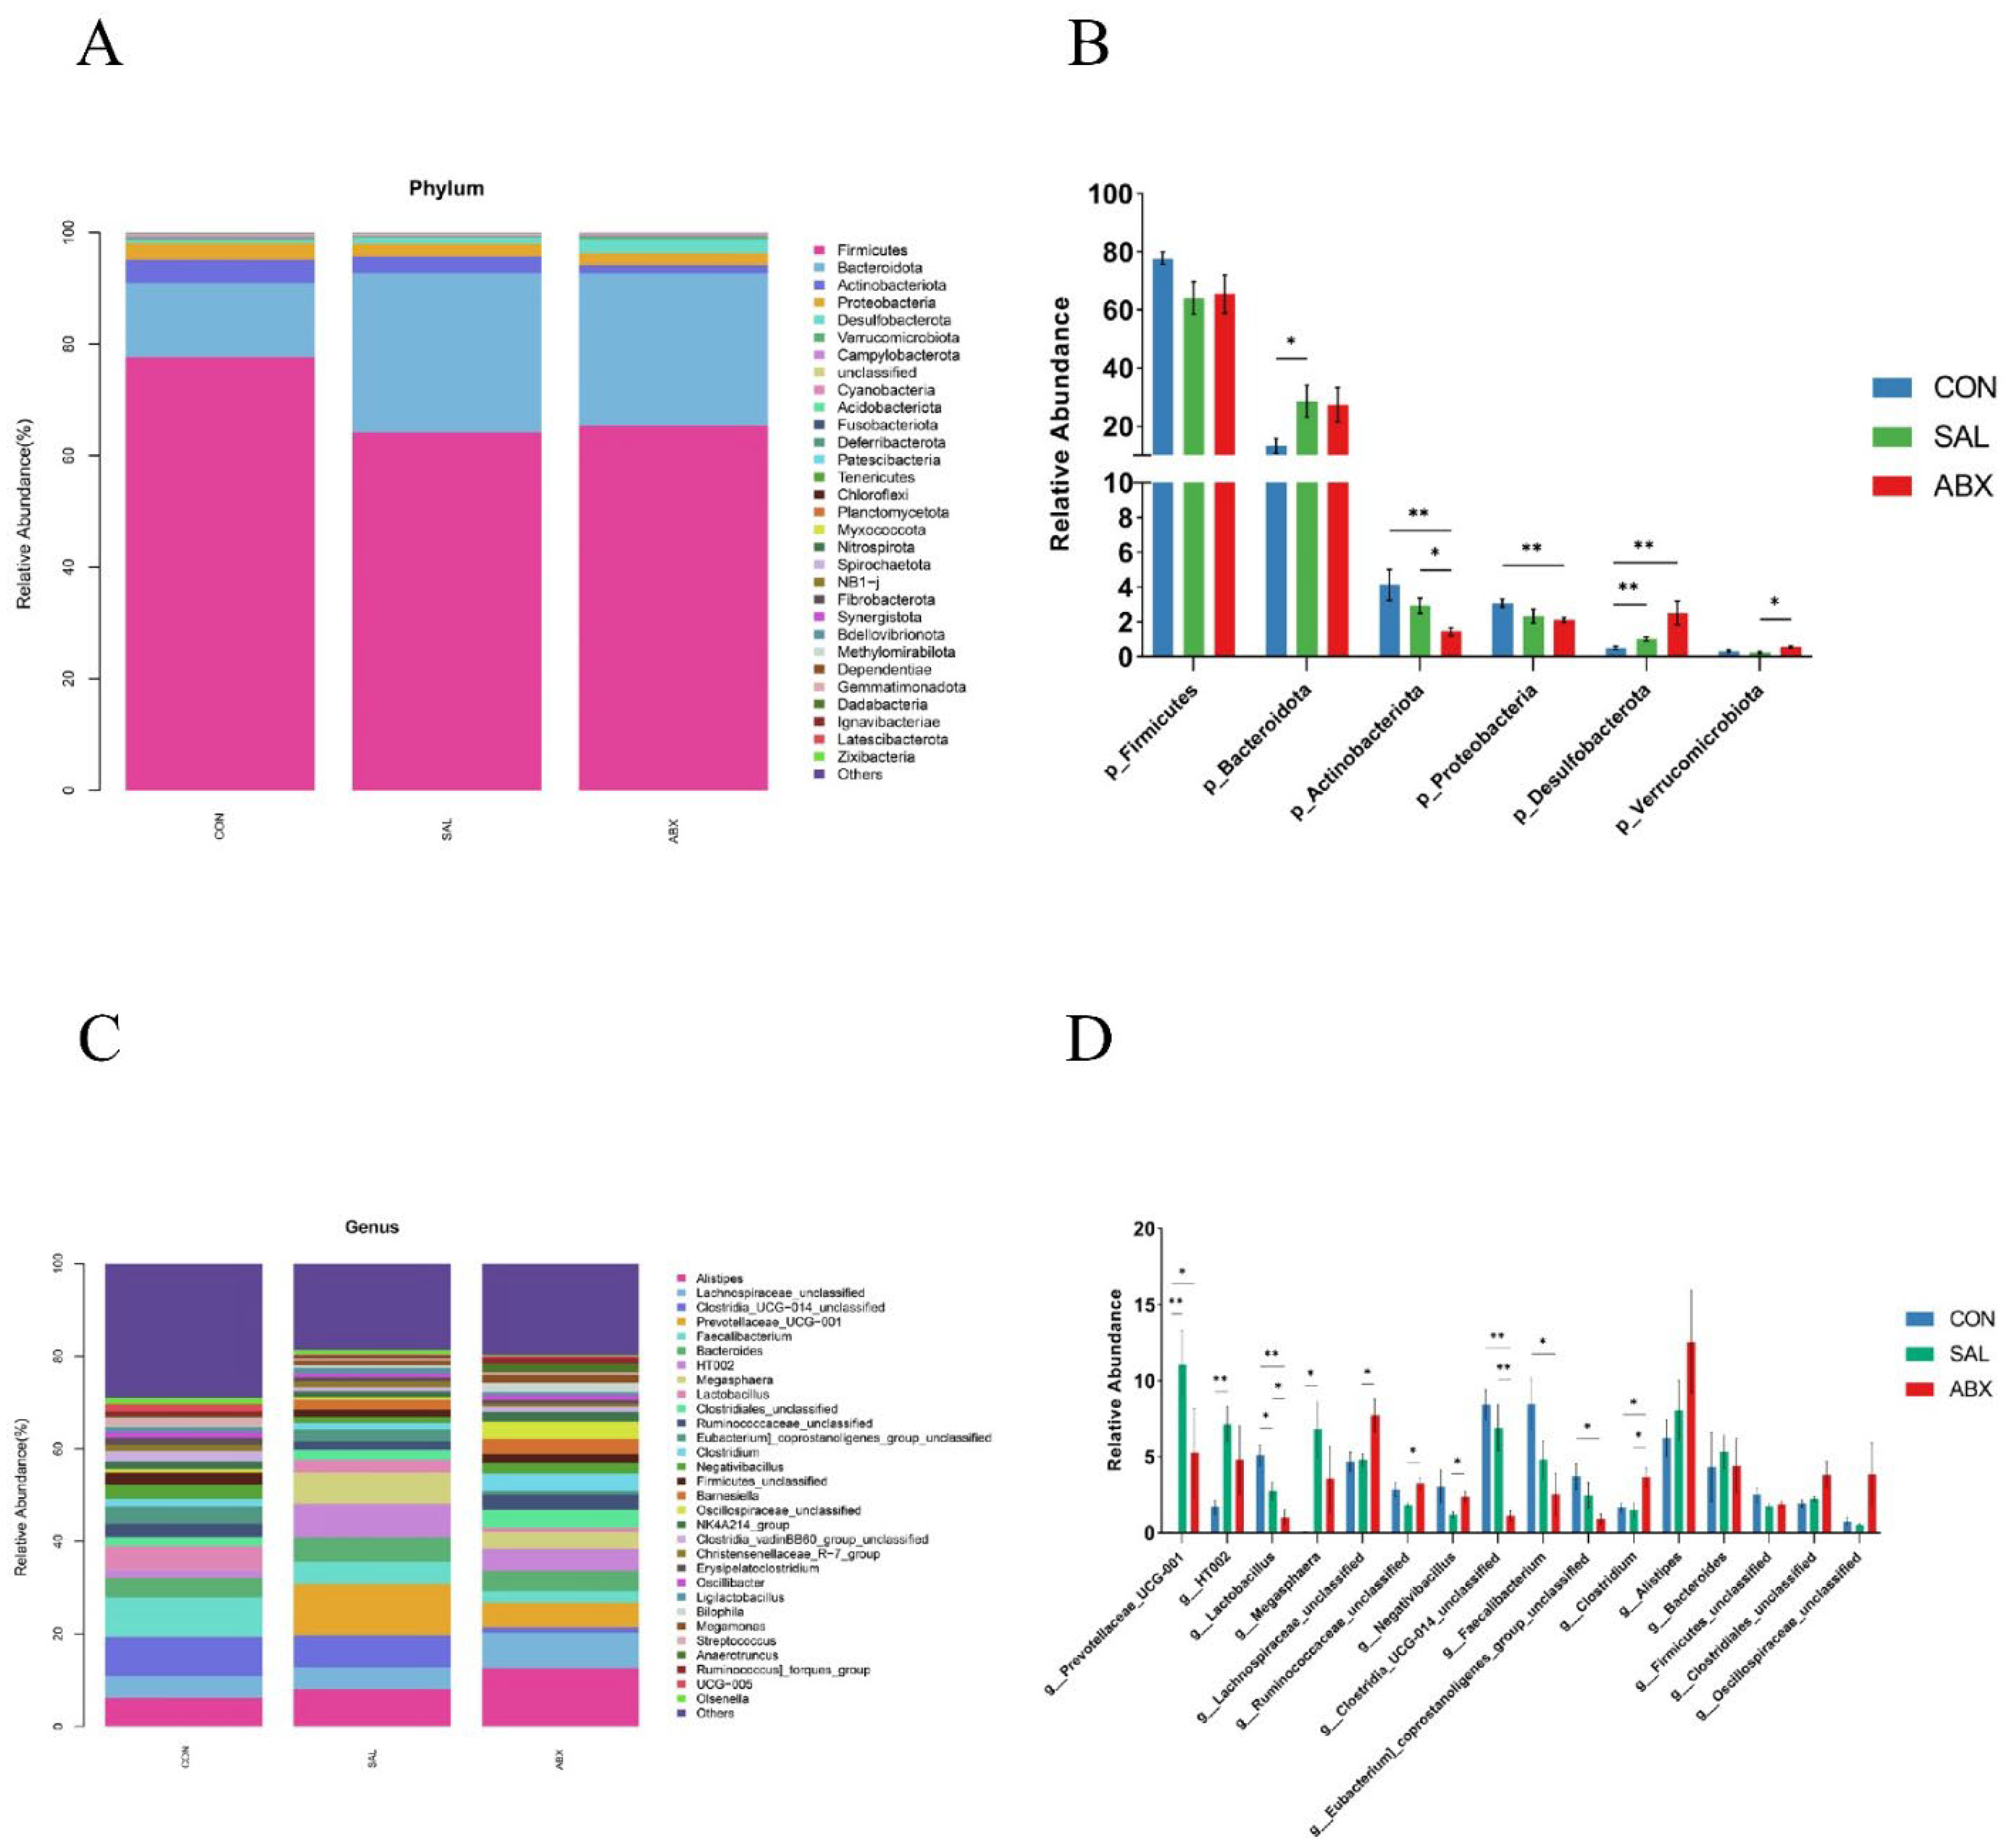
38]. Notably, the abundance of many beneficial bacteria (
Bifidobacterium,
Lactobacillus, and
Odoribacter) was significantly reduced in the SAL and ABX groups. Many studies have confirmed the beneficial effects of Bifidobacterium in animals. It prevents diarrhea [
39], alleviates the symptoms of irritable bowel syndrome [
40], prevents colorectal cancer [
41], alleviates clinical signs in patients with ulcerative colitis [
42], and regulates and maintains the structure of the intestinal flora [
43]. Lactobacillus is a group of beneficial intestinal bacteria that can prevent Clostridium difficile-infection-associated diarrhea [
44], facilitate intestinal inflammation [
45], and regulate immune-related molecules to enhance intestinal barrier function [
46,
47].
The Spearman analysis showed a significant positive correlation between the relative abundance of
Bifidobacterium and
Lactobacillus and the relative mRNA expression of IL-2 in intestinal tissues (
P < 0.05). IL-2 is a cytokine essential for the growth and survival of regulatory T cells (Tregs) in peripheral lymphoid tissues. Tregs are essential for the maintenance of peripheral tolerance and for the control of persistent inflammation and autoimmunity [
48]. However, the relative mRNA content of IL-2 in the intestinal tissues of Wenchang chickens tended to decrease after S. Typhimurium infection. This suggests that avian gut microbiota, especially beneficial bacteria, potentially regulate intestinal immunity. However,
Salmonella infection reduces the abundance of beneficial flora, which in turn reduces the immune function of the intestine, leading to the overgrowth of certain inflammation-associated genera in the avian intestinal tract, further aggravating intestinal inflammation. This suggests that probiotics or other beneficial substances can be appropriately added to feed to regulate the flora structure and improve resistance to harmful microorganisms [
49,
50,
51]. For example,
Odoribacter has shown promise as a next-generation probiotic that improves glucose tolerance and obesity-associated inflammation [
52].
Lactofructose attenuated colitis symptoms by upregulating
Muribaculum abundance [
53]. An inevitable problem in this study was that it was not possible to experimentally verify these results. This is because the gut microbial system is too complex to control these variables.
In summary, this study found that infection with S. Typhimurium resulted in disturbed intestinal flora and a significant activation of ARA metabolism in Wenchang chickens. It also reported some ARA metabolites to be involved in the induction of inflammation. Given that the inflammatory intestinal environment is conducive to colonization and invasion by Salmonella, it is suggested that modulating ARA metabolism in intestinal tissues may be a potential approach to control avian Salmonella enteritis.
Figure 1.
Schematic diagram of chicken grouping and experimental procedure.
Figure 1.
Schematic diagram of chicken grouping and experimental procedure.
Figure 2.
Results of difference analysis of cecum microbial communities between groups. (A) Shannon index. (B) Simpson's index (C) Chao 1 index. (D) PCoA analysis results. Different colors represent different groups. The closer the samples are, the more similar the microbial composition is between the samples.
Figure 3.
Taxonomic distribution of the CON, SAL, and ABX groups. (A) At the phylum level (top 30). (B) Differences in the partially dominant bacterial flora at the phylum level among the groups. (C) At the genus level (top 30). (D) Differences in the partially dominant bacterial flora at the genus level among the groups. “*” indicates a significant difference in statistics (*P < 0.05, **P < 0.01, and ***P < 0.001).
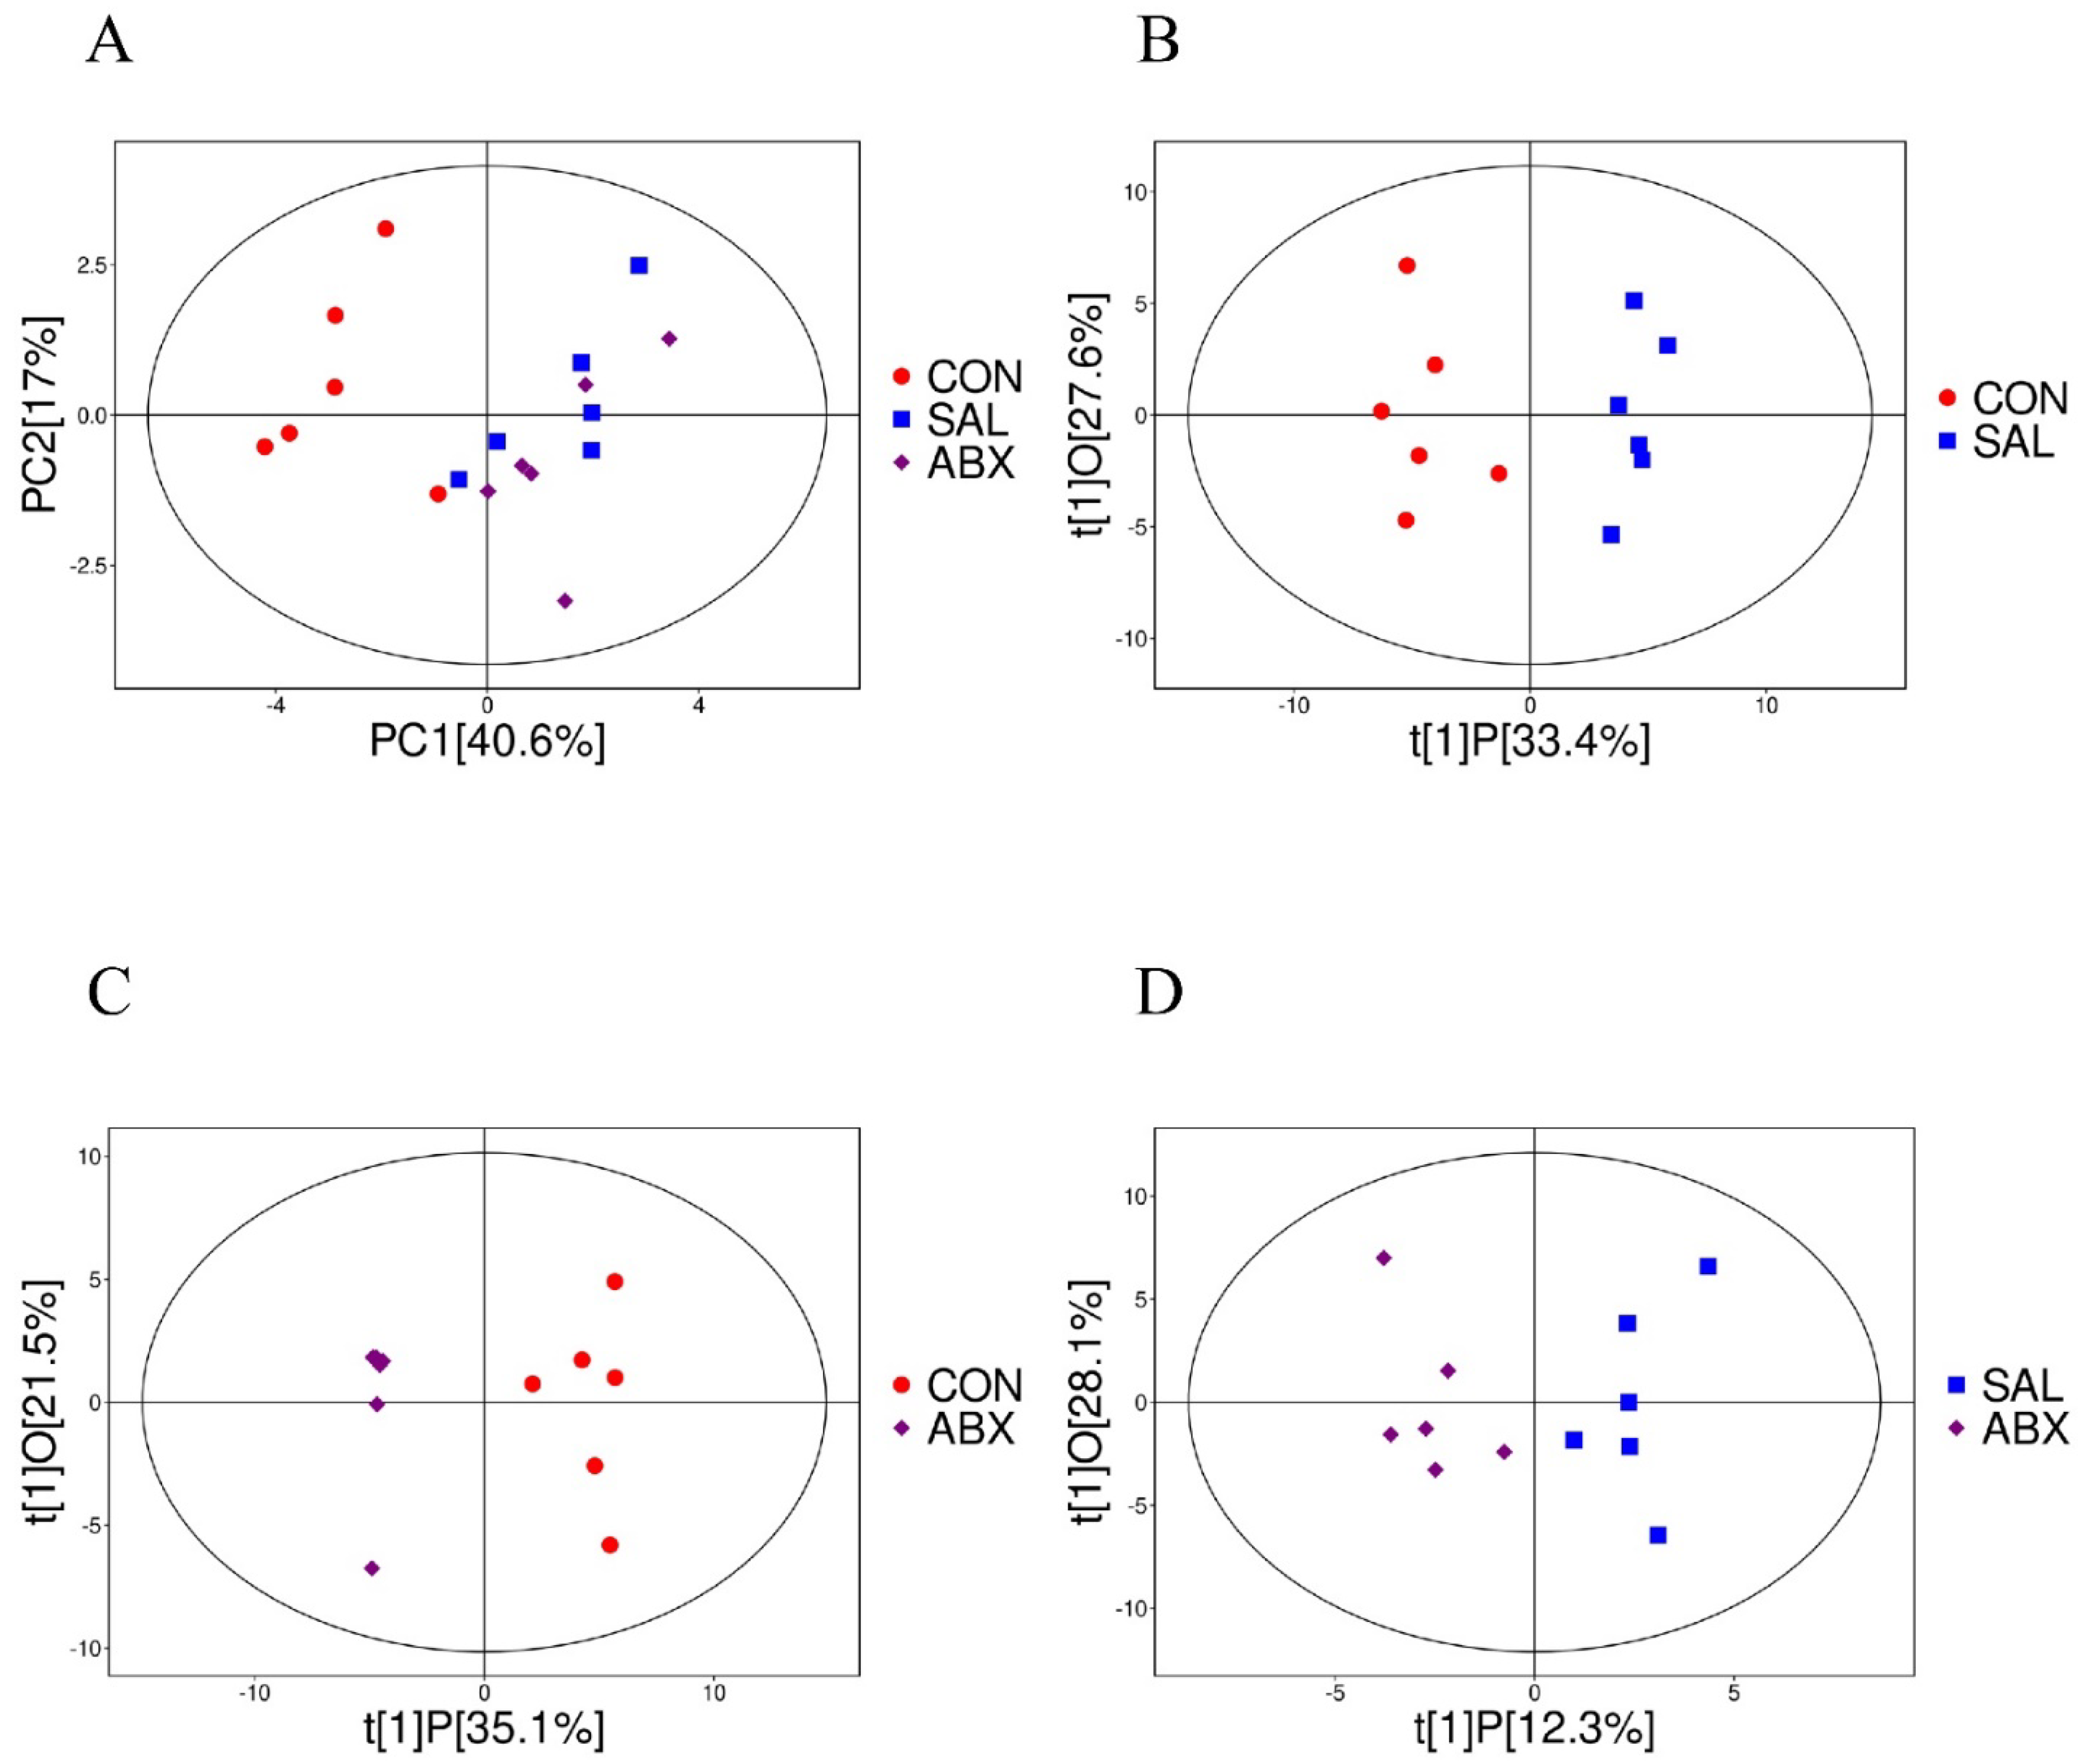
Figure 4.
Analysis of PCoA and OPLS-DA between the CON, SAL, and ABX groups. (A) Scatterplot of principal component analysis (PCA) scores for the full sample in each group. (B, C, D) Scatterplot of OPLS-DA model scores between groups. The horizontal coordinate represents the predicted principal component scores of the first principal component, demonstrating the differences between sample groups, whereas the vertical coordinate represents the orthogonal principal component scores, demonstrating the differences within the sample groups, where each scatter represents one sample and the scatter shapes and colors indicate the different experimental groups.
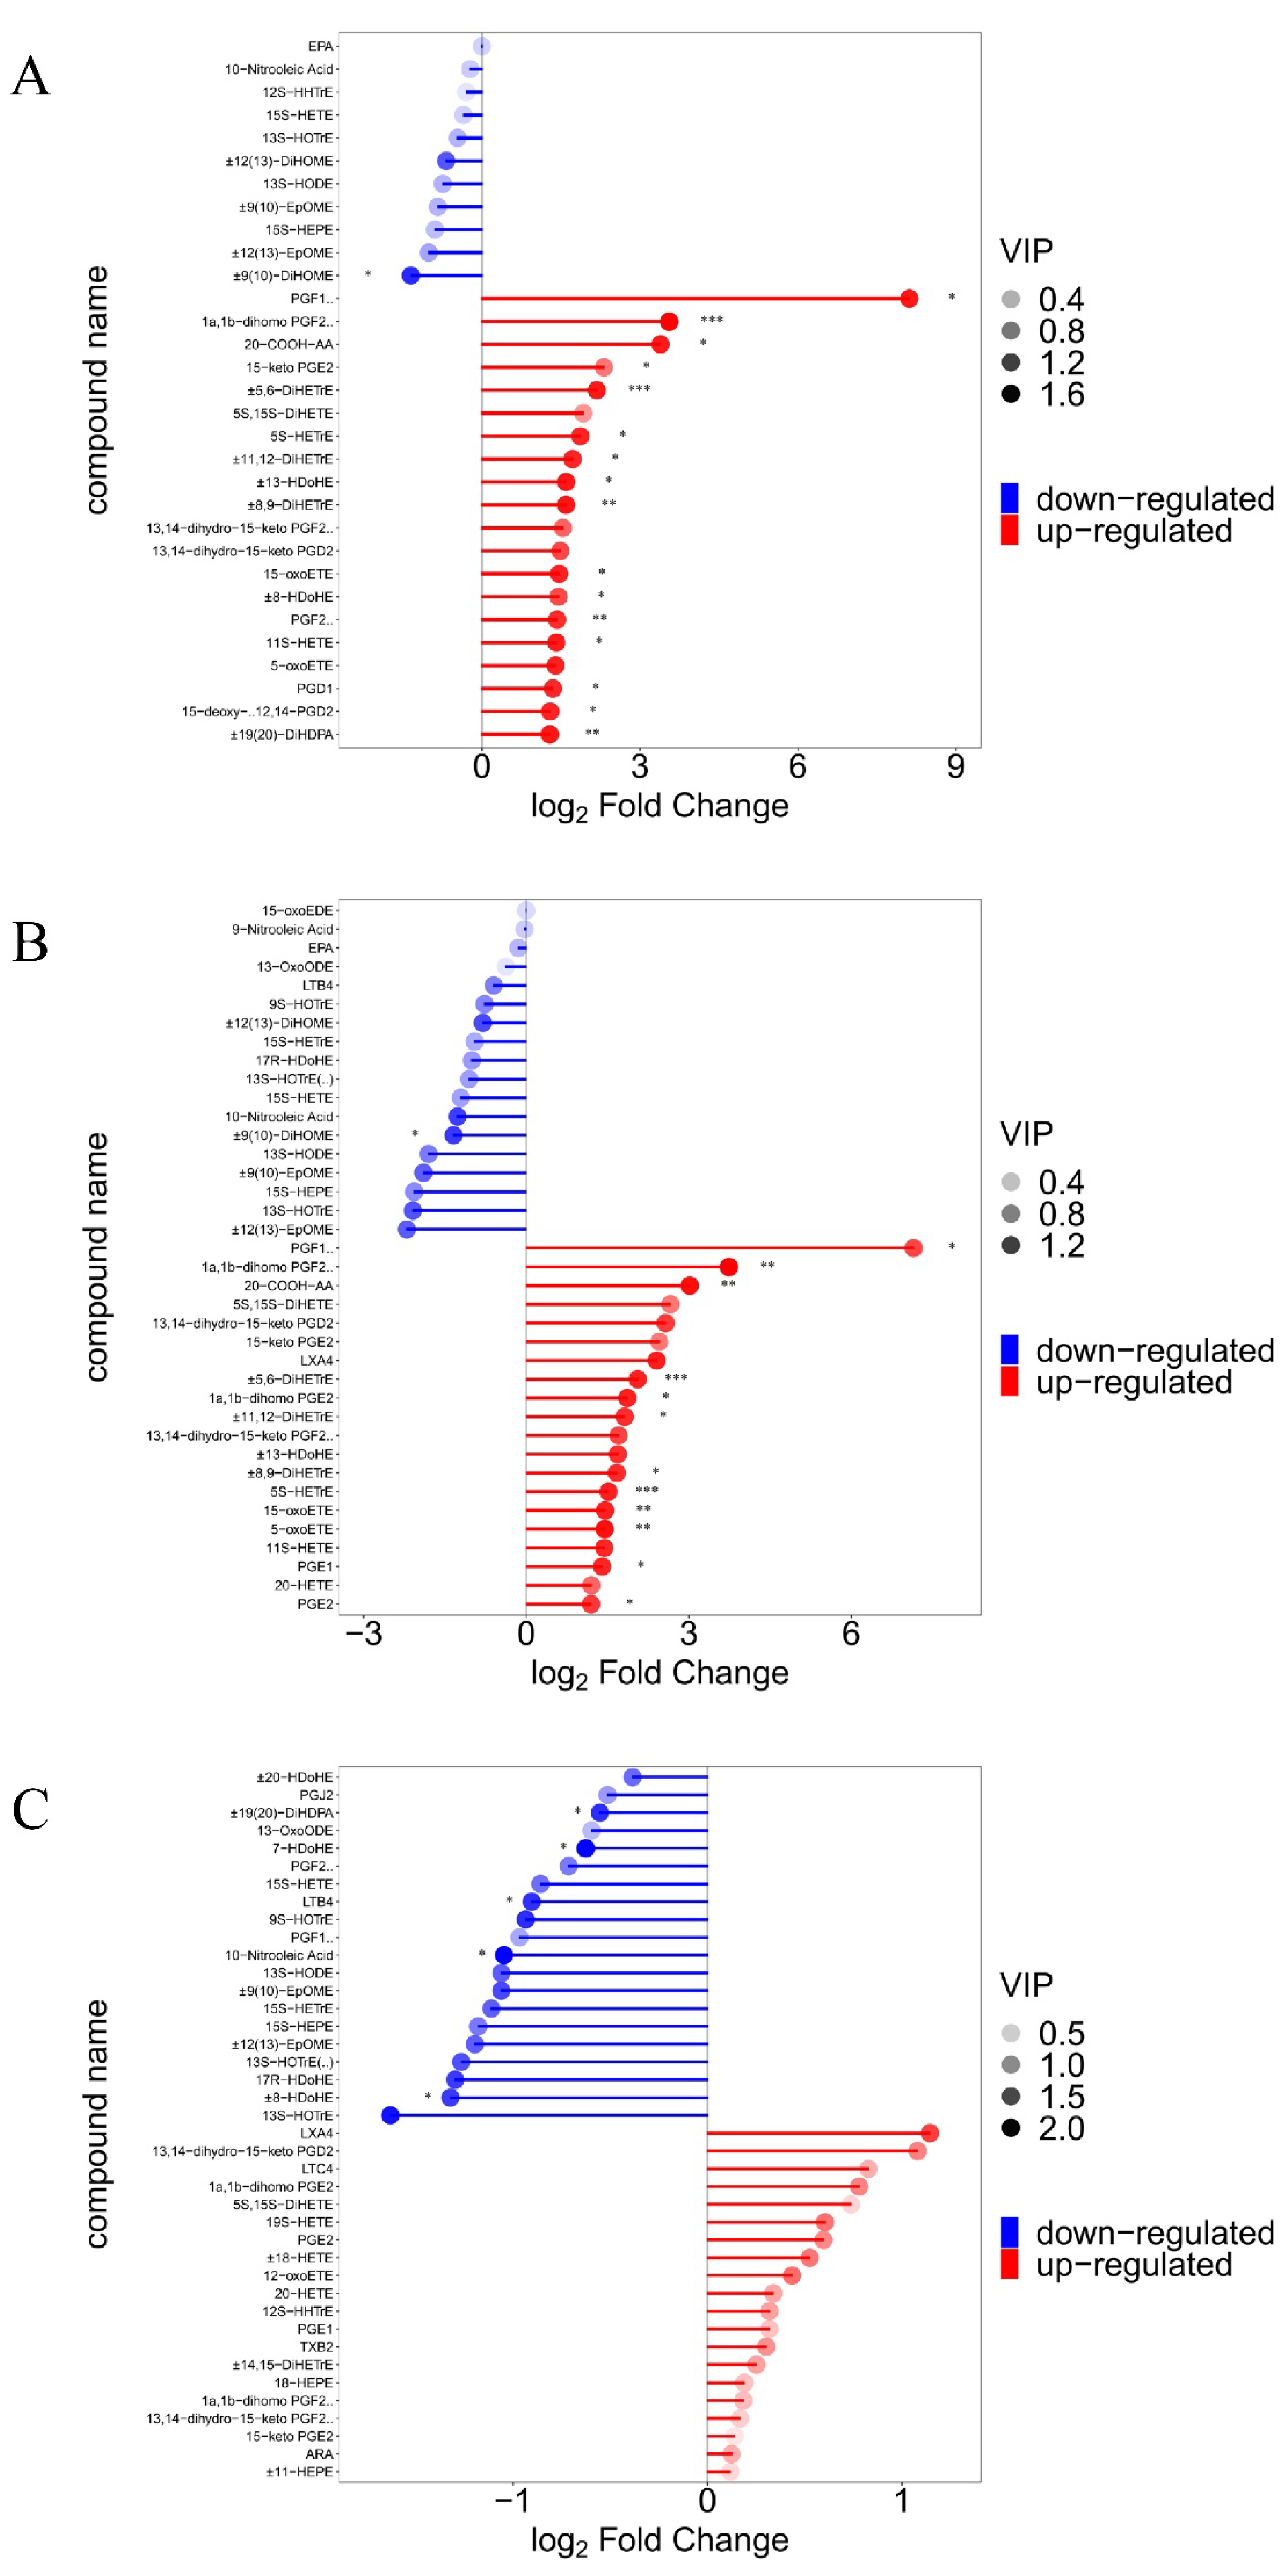
Figure 5.
Demonstration of differences in oxygenated lipid metabolites between groups. (A, B, C) Matchstick analysis for three comparison groups (SAL vs. CON, ABX vs. CON, and ABX vs. SAL). Horizontal coordinates show logarithmically converted multiples of change, with point color shades representing the size of the variable importance in the projection (VIP) value. “*” indicates a significant difference in statistics (*P < 0.05, **P < 0.01, and ***P < 0.001).
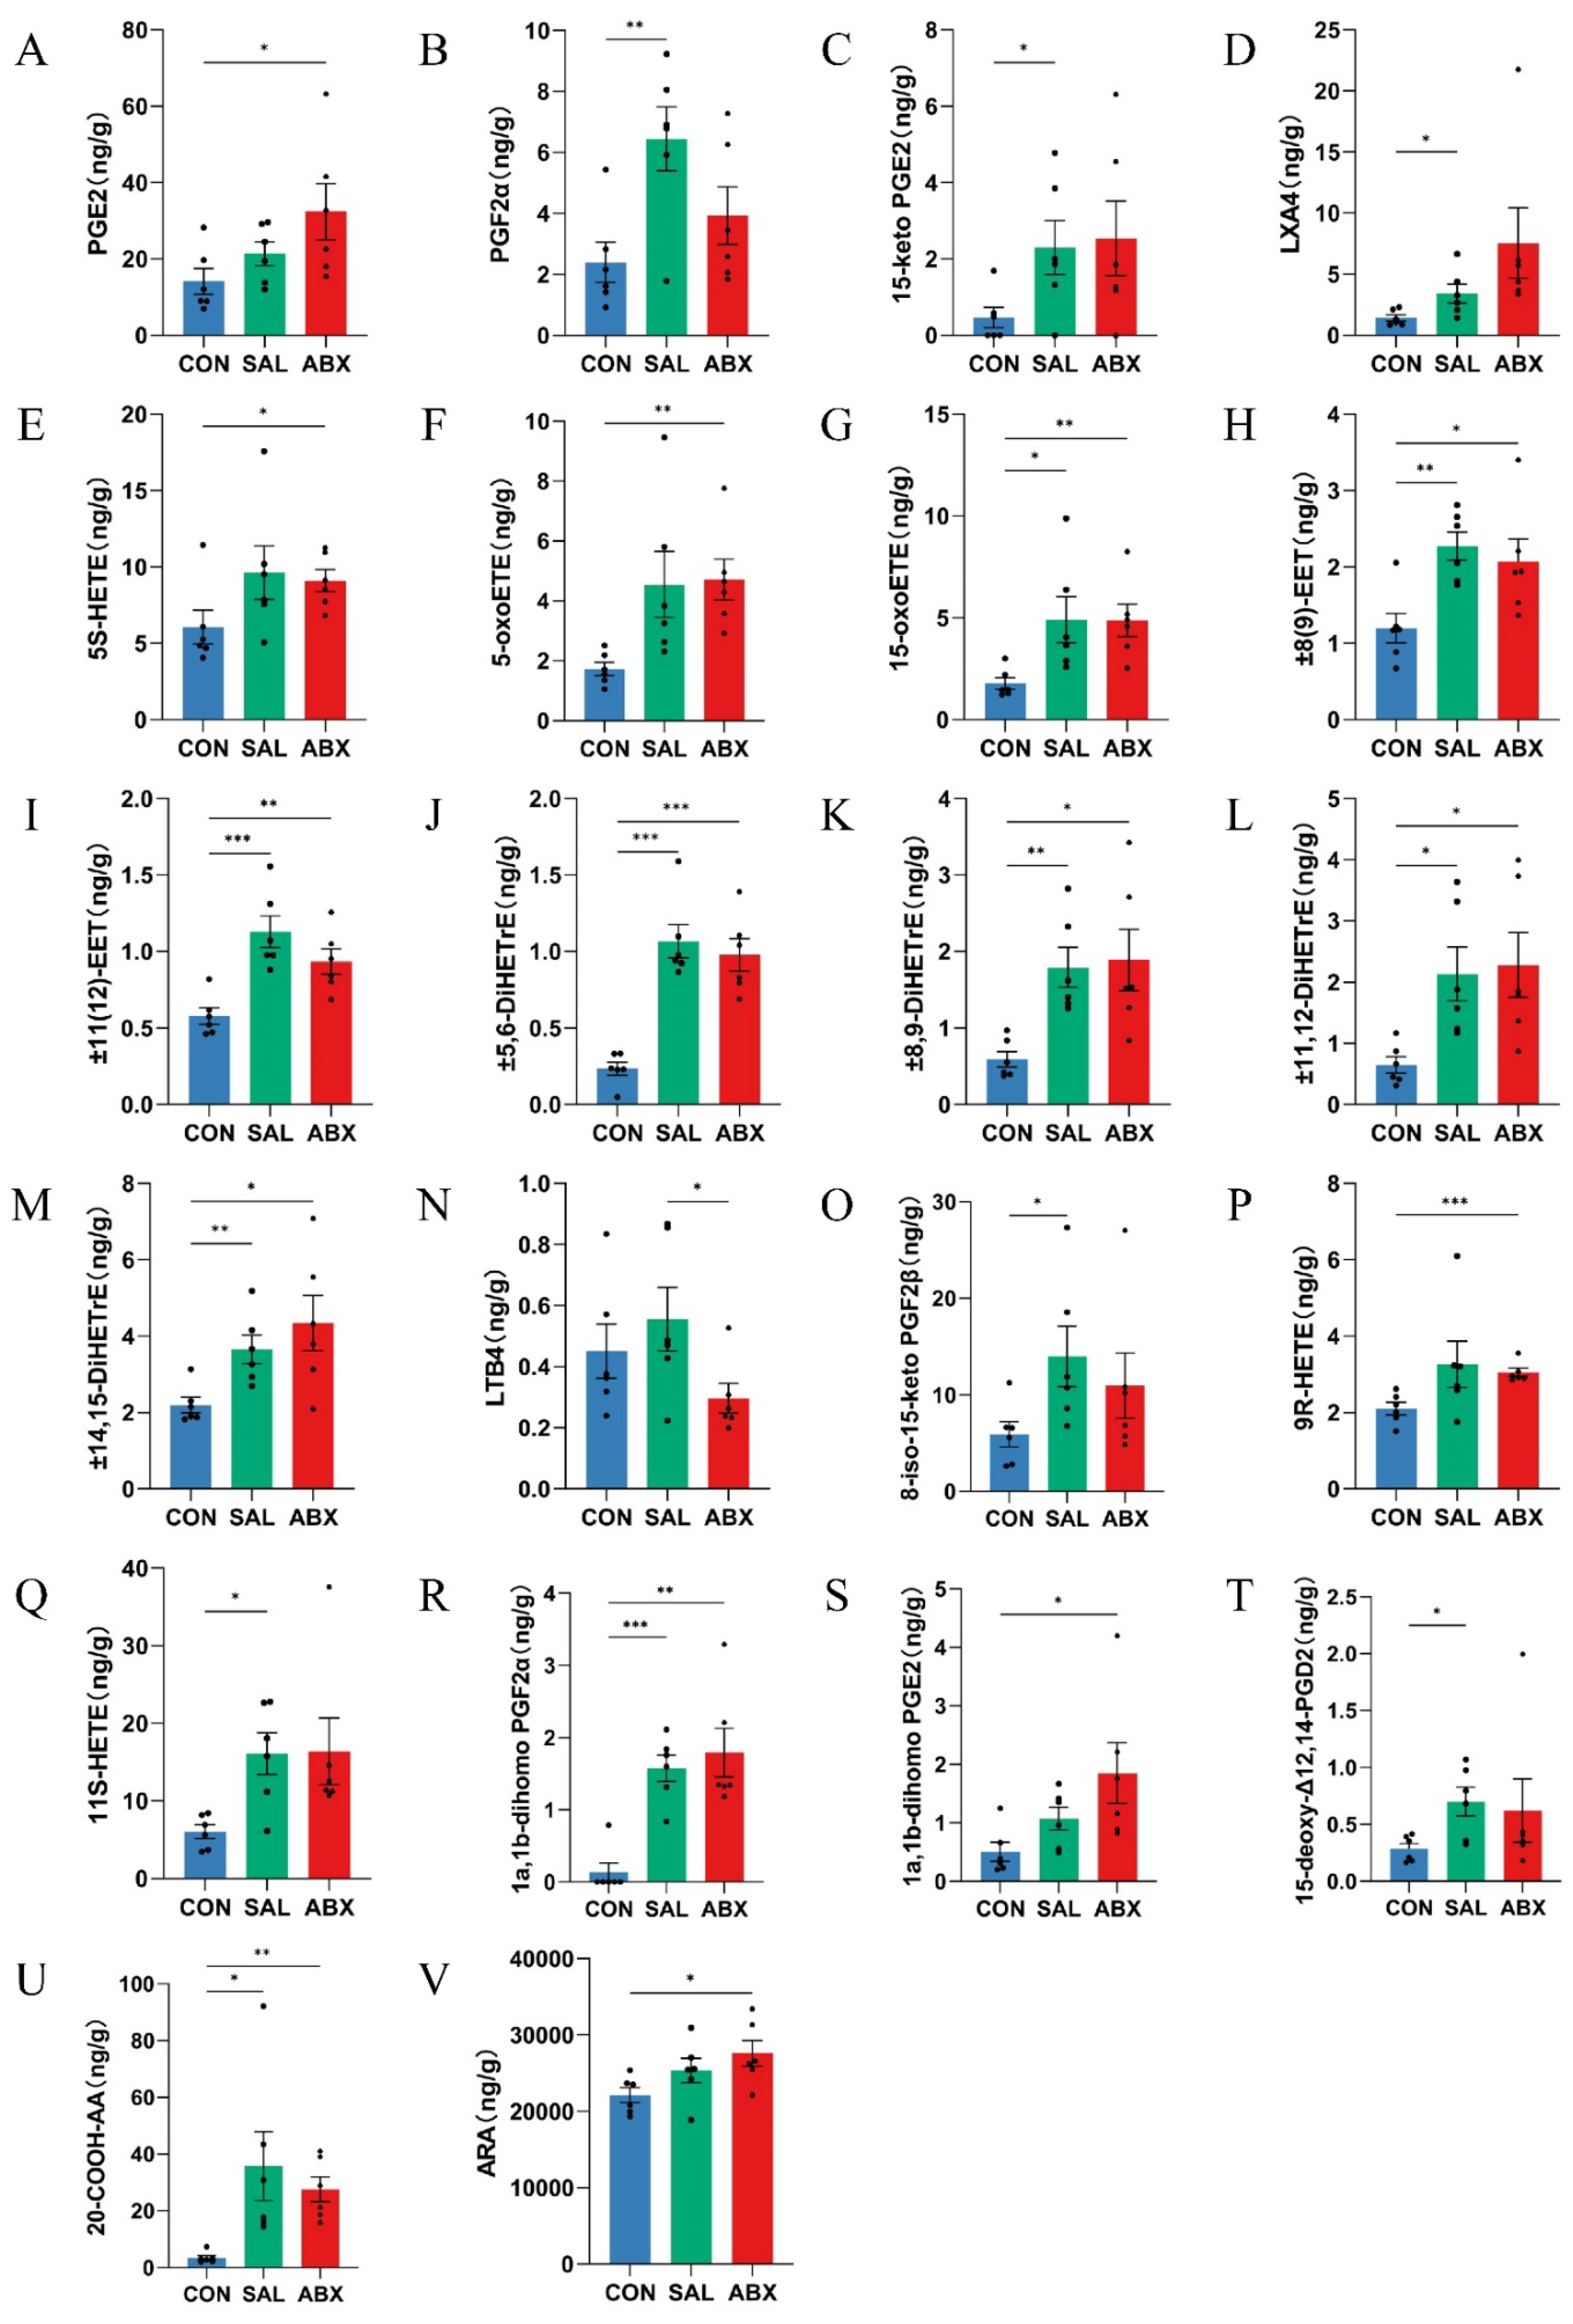
Figure 6.
Analysis of between-group differences in ARA metabolites. “*” indicates a significant difference in statistics (*P < 0.05, **P < 0.01, and ***P < 0.001).
Figure 6.
Analysis of between-group differences in ARA metabolites. “*” indicates a significant difference in statistics (*P < 0.05, **P < 0.01, and ***P < 0.001).
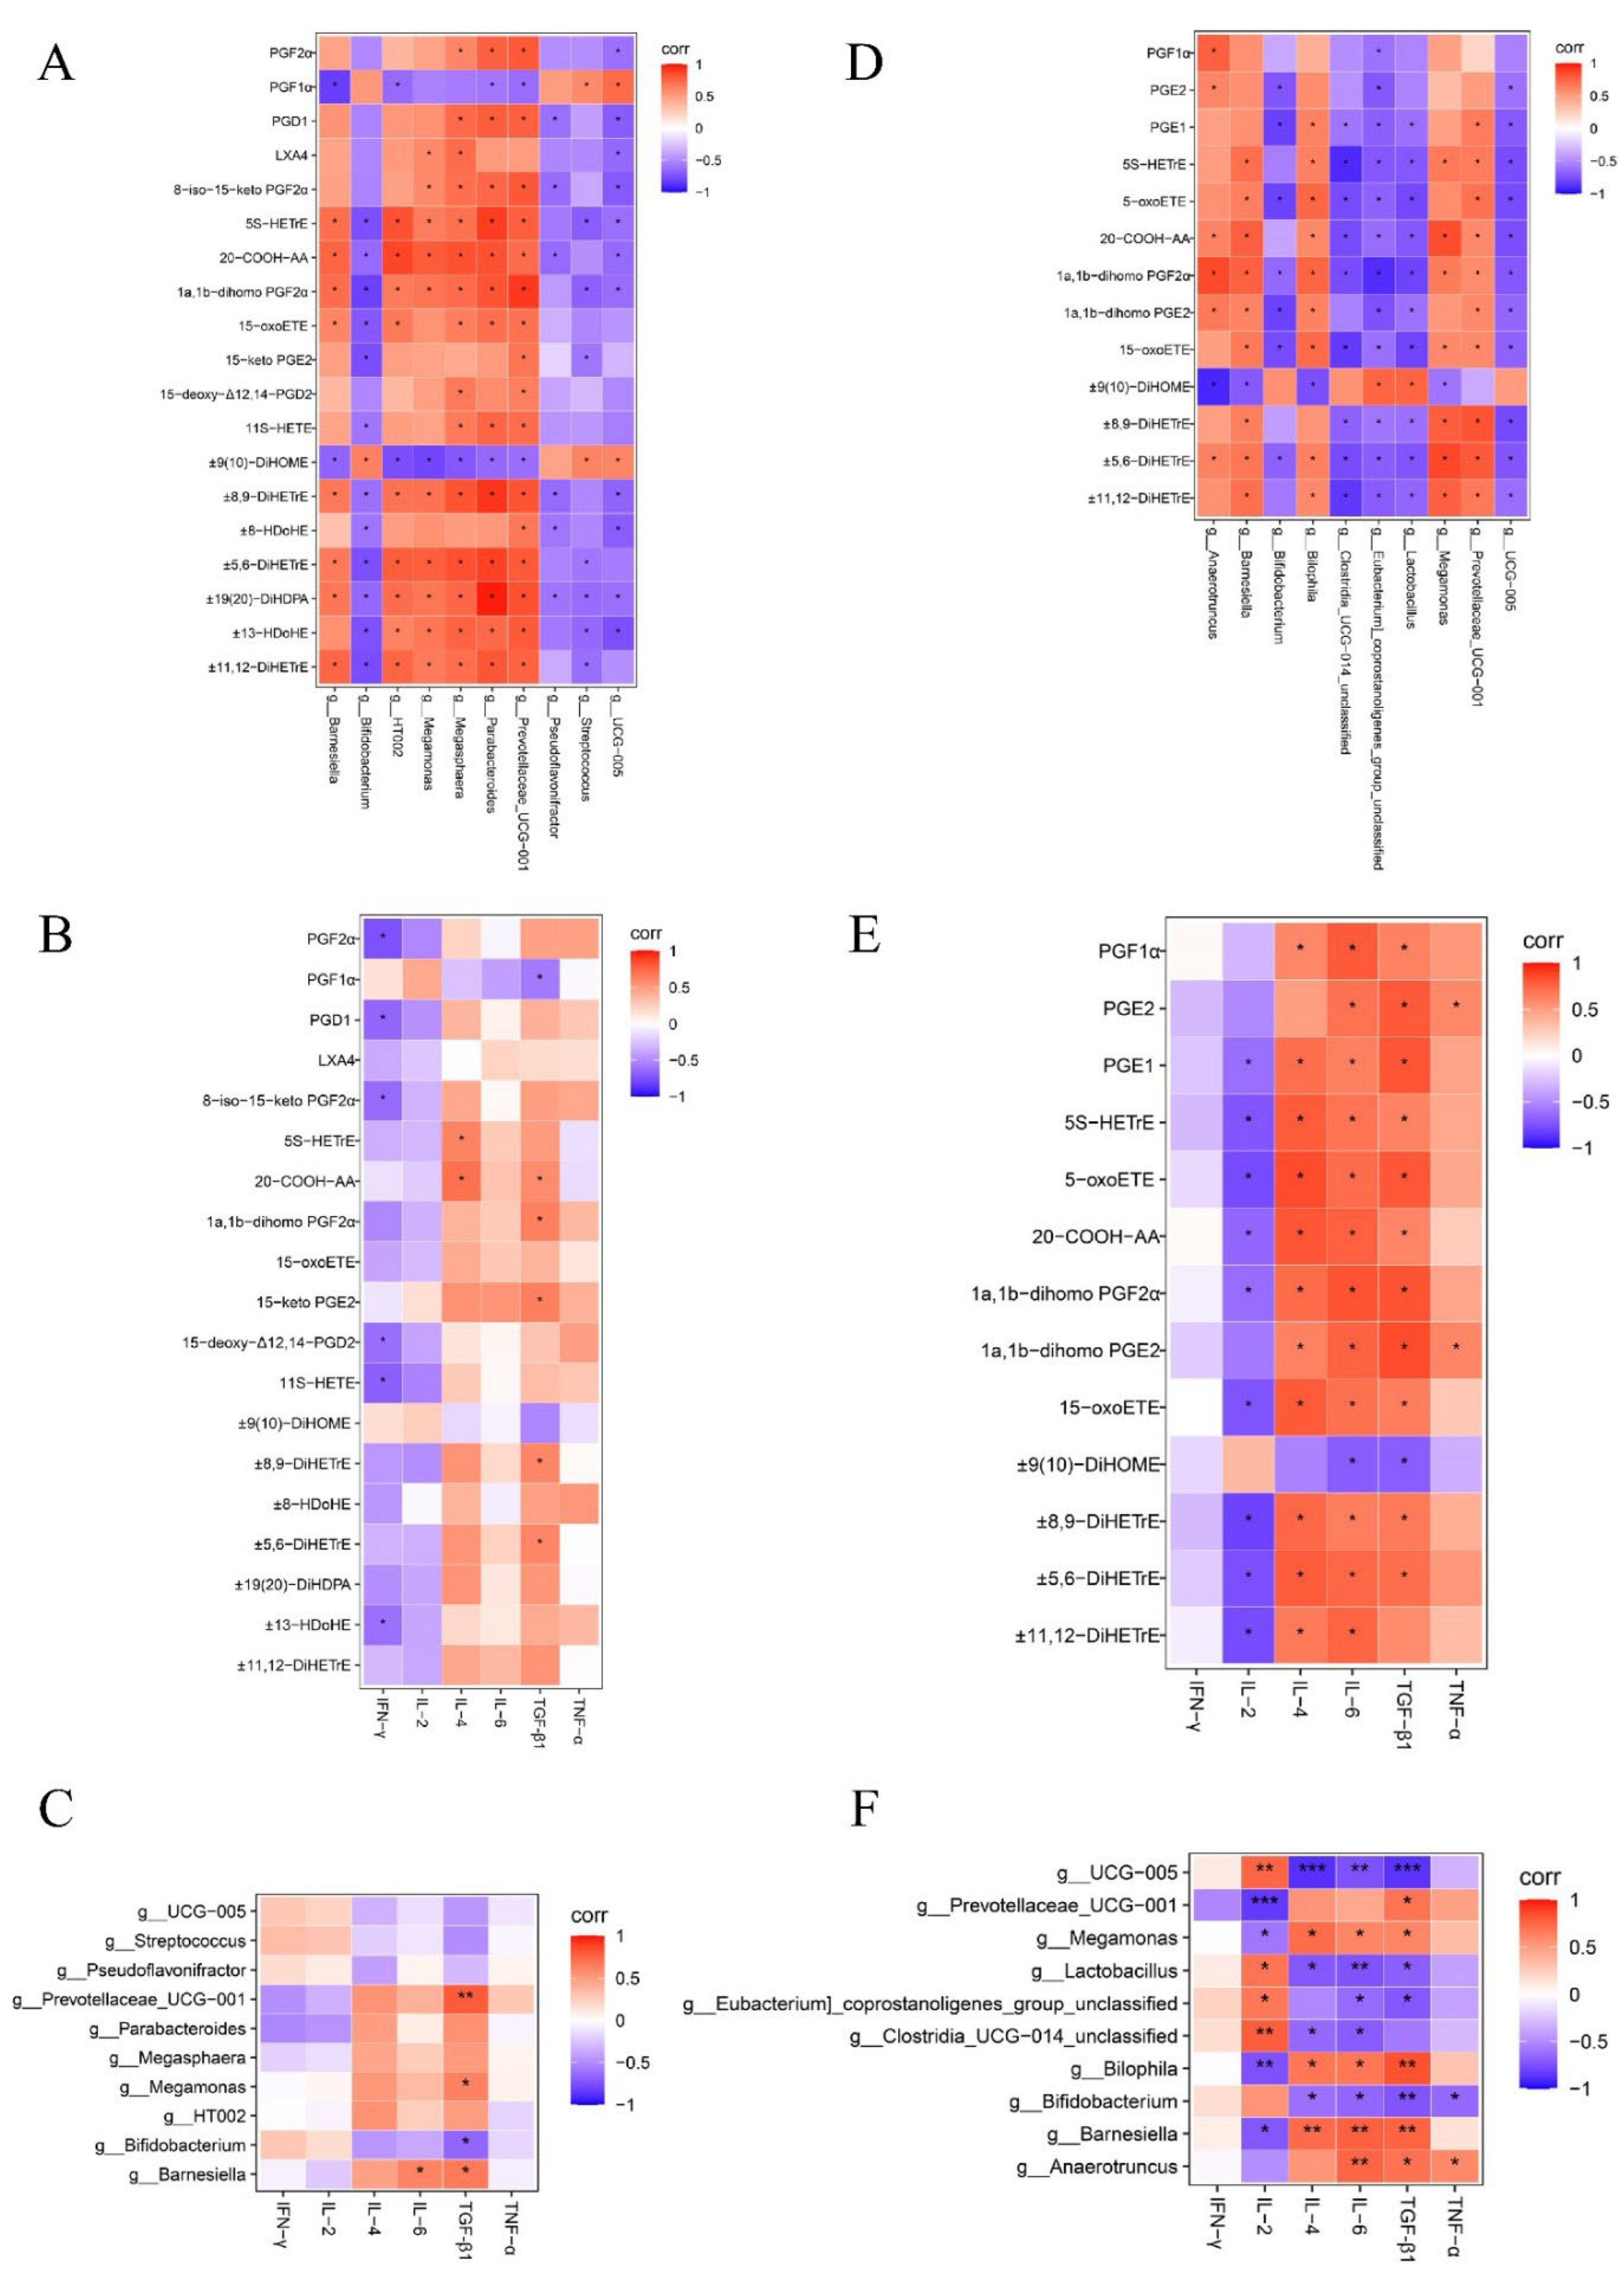
Figure 7.
Heatmap of correlation coefficient matrix for the SAL and ABX groups. (A, B, C) Analysis of Spearman’s correlation between oxidized lipid metabolites, gut microbes, and inflammatory factors in the SAL group. (D, E, F) Analysis of Spearman’s correlation between oxidized lipid metabolites, gut microbes, and inflammatory factors in the ABX group. Red indicates a positive correlation, and purple indicates a negative correlation. “*” indicates a significant difference in statistics (*P < 0.05, **P < 0.01, and ***P < 0.001).
Figure 8.
Changes in IL-1β, IL-6, IL-10 and iNOs in HD11 cells. “*” indicates a significant difference in statistics (*P < 0.05, **P < 0.01, and ***P < 0.001).
Figure 8.
Changes in IL-1β, IL-6, IL-10 and iNOs in HD11 cells. “*” indicates a significant difference in statistics (*P < 0.05, **P < 0.01, and ***P < 0.001).
Figure 9.
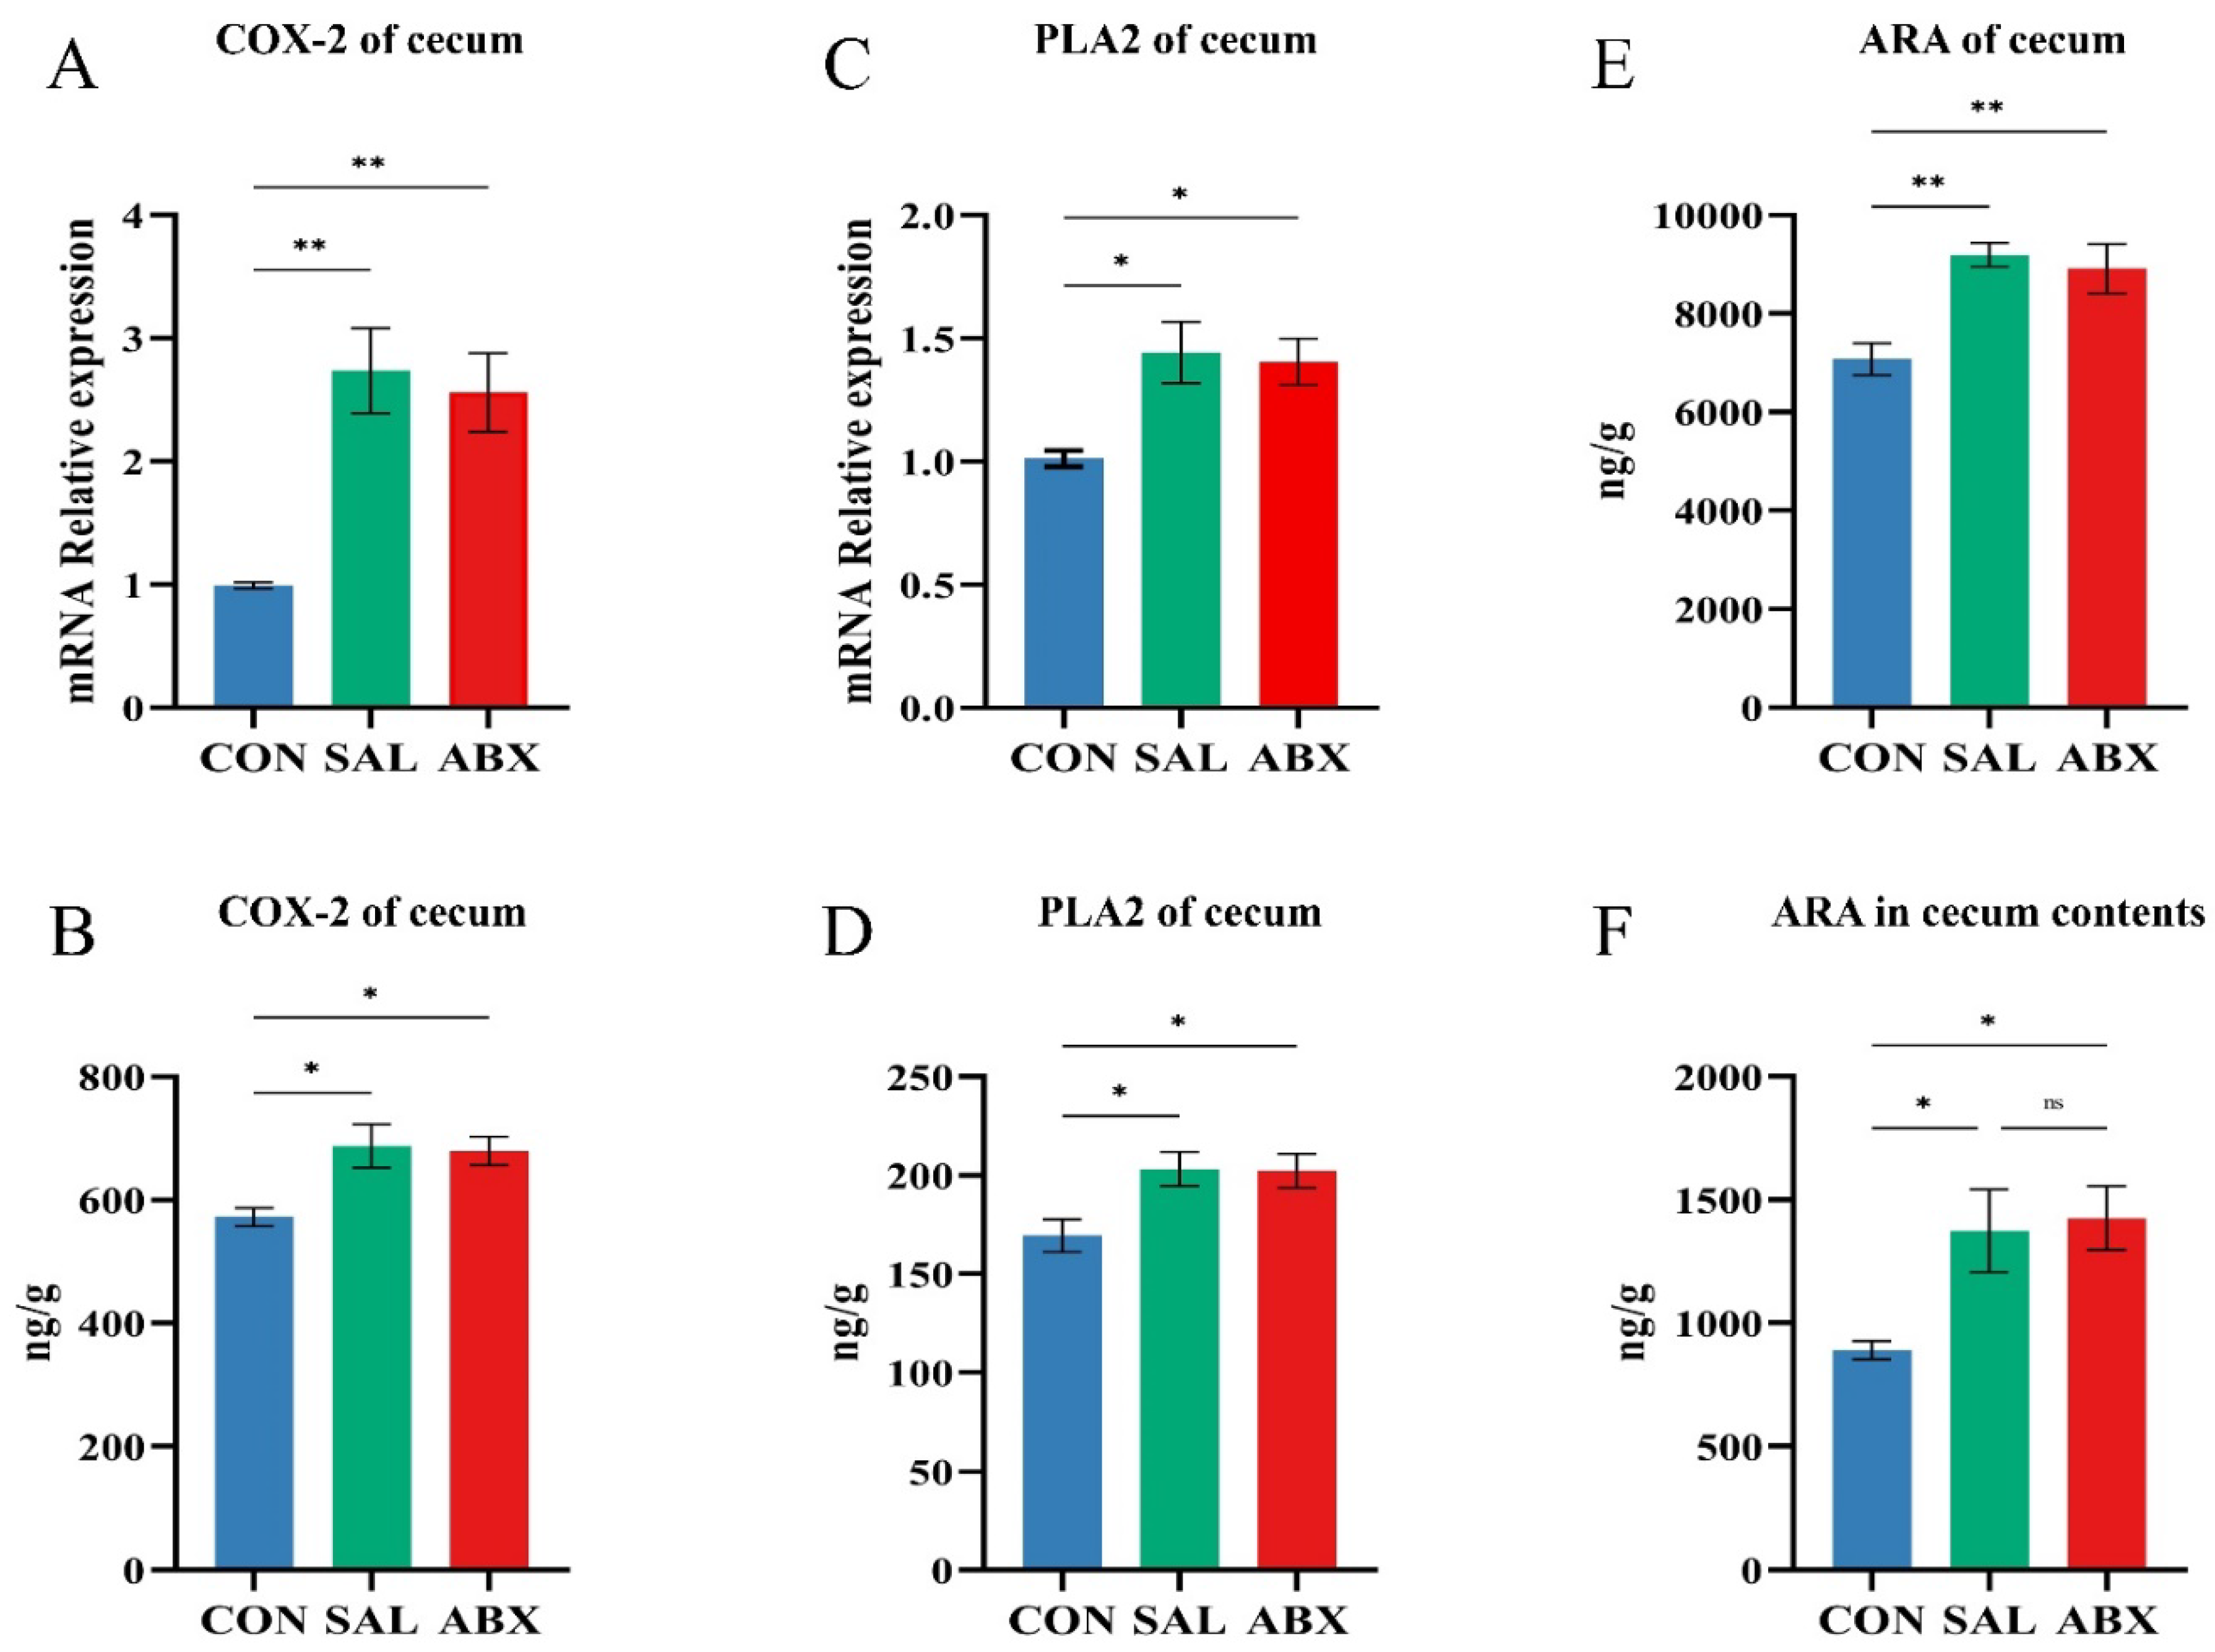
Changes of arachidonic acid and its key enzymes of metabolic pathway in the cecum. (A-D) COX-2 and PLA2 content and relative mRNA expression levels in cecum tissues. (E, F) ARA content in cecum tissues and cecum contents. “*” indicates a significant difference in statistics (*P < 0.05, **P < 0.01, and ***P < 0.001).
Figure 10.
Changes of arachidonic acid and its key enzymes of metabolic pathway in HD11 cells. “*” indicates a significant difference in statistics (*P < 0.05, **P < 0.01, and ***P < 0.001).
Figure 10.
Changes of arachidonic acid and its key enzymes of metabolic pathway in HD11 cells. “*” indicates a significant difference in statistics (*P < 0.05, **P < 0.01, and ***P < 0.001).
Table 1.
PCR-specific amplification primer sequences.
Table 1.
PCR-specific amplification primer sequences.
| Amplified fragments |
Primer Sequences |
| V3-V4 [17] |
F (5'-CCTACGGGNGGCWGCAG-3') |
| R (5'-GACTACHVGGGTATCTAATCC-3') |
| V4 [18] |
F (5'-GTGYCAGCMGCCGCGGTAA-3') |
| R (5'- GGACTACHVGGGTWTCTAAT-3') |
| V4-V5 |
F (5’-GTGCCAGCMGCCGCGG-3’) |
| R (5’-CCGTCAATTCMTTTRAGTTT-3’) |
| Archae [19] |
F (5’-GYGCASCAGKCGMGAAW-3’) |
| R (5’-GGACTACHVGGGTWTCTAAT-3’) |
Table 2.
The alpha diversity index of each sample.
Table 2.
The alpha diversity index of each sample.
| Sample |
Shannon |
Simpson |
Chao1 |
| ABX1 |
7.16 |
0.97 |
804.74 |
| ABX2 |
6.82 |
0.97 |
797.58 |
| ABX3 |
7.00 |
0.97 |
715.65 |
| ABX4 |
6.55 |
0.97 |
732.29 |
| ABX5 |
7.16 |
0.98 |
790.71 |
| ABX6 |
6.96 |
0.97 |
754.43 |
| CON1 |
7.60 |
0.98 |
1026.35 |
| CON2 |
7.56 |
0.98 |
1029.39 |
| CON3 |
8.16 |
0.99 |
1179.45 |
| CON4 |
8.13 |
0.99 |
1148.30 |
| CON5 |
8.52 |
0.99 |
1430.61 |
| CON6 |
8.47 |
0.99 |
1373.35 |
| SAL1 |
7.69 |
0.99 |
1105.00 |
| SAL2 |
7.47 |
0.98 |
1018.76 |
| SAL3 |
7.26 |
0.98 |
887.71 |
| SAL4 |
7.68 |
0.98 |
1171.02 |
| SAL5 |
7.27 |
0.97 |
1064.23 |
| SAL6 |
7.58 |
0.99 |
916.28 |
