Preprint
Article

The Innovation Dilemma and Operating Efficiency of Manufacturing Enterprises: Evidence from China

Altmetrics

Downloads

87

Views

38

Comments

0

A peer-reviewed article of this preprint also exists.

This version is not peer-reviewed

Submitted:

17 April 2024

Posted:

18 April 2024

You are already at the latest version

Alerts
Abstract
Under the background that the international technological innovation environment VUCA has been intensifying and the innovation situation of Chinese manufacturing enterprises has been impacted, the innovation dilemma faced by enterprises has attracted increasing attention, while the innovation dilemma is also one of the important factors affecting the operation efficiency of enterprises. Based on the micro-data of China’s A-share manufacturing listed enterprises, this paper empirically analyzes the impact of innovation dilemmas faced by enterprises on operational efficiency (innovation dilemmas are measured by the difference when actual innovation performance is lower than expected innovation performance). The results show that the innovation dilemma of manufacturing enterprises significantly inhibits the operational efficiency of manufacturing enterprises by reducing their risk tolerance, development ability expectation and profitability. After using a series of tests, such as instrumental variable method, propensity score matching method, DID (Differences-in-Differences) and changing variable measure method, the conclusion is still robust. In addition, the inhibitory effect of innovation dilemma on enterprise operation efficiency is more obvious for private enterprises, small and medium-sized enterprises, enterprises in the ascend or decline phase, high-tech enterprises and enterprises in the eastern region. Therefore, the government should strengthen the policy support for the manufacturing enterprises in the innovation dilemma, help the enterprises to overcome the innovation bottleneck. Manufacturing enterprises themselves should enhance their innovation capabilities and strive to get rid of the innovation dilemma in order to maintain a stable footing in the fierce market competition and improve the high-quality development of China’s manufacturing industry.
Keywords: 
Subject: Business, Economics and Management  -   Business and Management

1. Introduction

With the profound adjustment of economic globalization, the main driving forces of globalization are diverging and changing. In order to cope with the risk of power transfer [1], traditional developed countries rely on hegemony to push their interests to the extreme of protectionism [2], and advanced science and technology are the key engines for economic growth of various countries. It has become an important area for some developed countries to try to restrain the development of emerging countries, making science and technology shift from human shared globalism to technological nationalism [3]. Indeed, the global flow of technological elements has narrowed the gap between China and the world's advanced scientific and technological level, which has helped the rapid development of China's economy, but it has also made some manufacturing enterprises in China fall into the dilemma of technological innovation when technological nationalism is rampant [4]. The existing researches have widely discussed the factors that affect the innovation performance of enterprises from the production factors at the micro level to the external environment at the macro level. At the micro level, the main focus is on exploring internal factors within the enterprise, including the characteristics and environment of the firm, the education level of the workers [5], the financial capital, technology information of the firm [6], and the executive characteristics of the firm [7], etc. In addition, some scholars have found that there is a difference in the impact of female-owned companies and male-owned companies on corporate innovation from a gender perspective [8]. The factors on macro level involves legal environment, government effectiveness [9], the diversity of supplier and customer, regional innovation environment [10], and business environment of the society [11], etc. At present, the research on the influencing factors of enterprise innovation performance has been relatively detailed, but there is still no further discussion on the innovation situation faced by enterprises and how the innovation dilemma will affect the operation efficiency of enterprises.
The report of the 19th National Congress of the Communist Party of China first proposed ”high-quality development” in 2017, China’s economy from the high-speed growth stage to the stage of high-quality development, the development of China’s manufacturing industry needs to change the previous extensive and intensive production mode, and then to improve the technical level and product quality as the development goal. As a pillar industry of a country’s real economy, the high-quality development and upgrading of manufacturing industry is an important driving force for national economic growth. In addition, manufacturing enterprises are also an important subject of technological innovation and a link in the transformation of results. Therefore, the operational efficiency of manufacturing enterprises has always been the focus of scholars around the world. In terms of operation efficiency, a large number of scholars have conducted evaluation and research on the operation efficiency of various manufacturing industries, including listed companies in the transportation industry [12], the LED lighting industry [13] and high-end equipment manufacturing industry [14], etc. Some scholars also discussed the factors affecting the operation efficiency of enterprises, including the Environmental, Social and Governance (ESG) performance [15], strategic flexibility [16], internal audit function (IAF) quality [17], and cash flow [18], etc. However, the discussion on the enterprise operation efficiency has formed a system, but the innovation situation of the enterprise has not been taken into account.
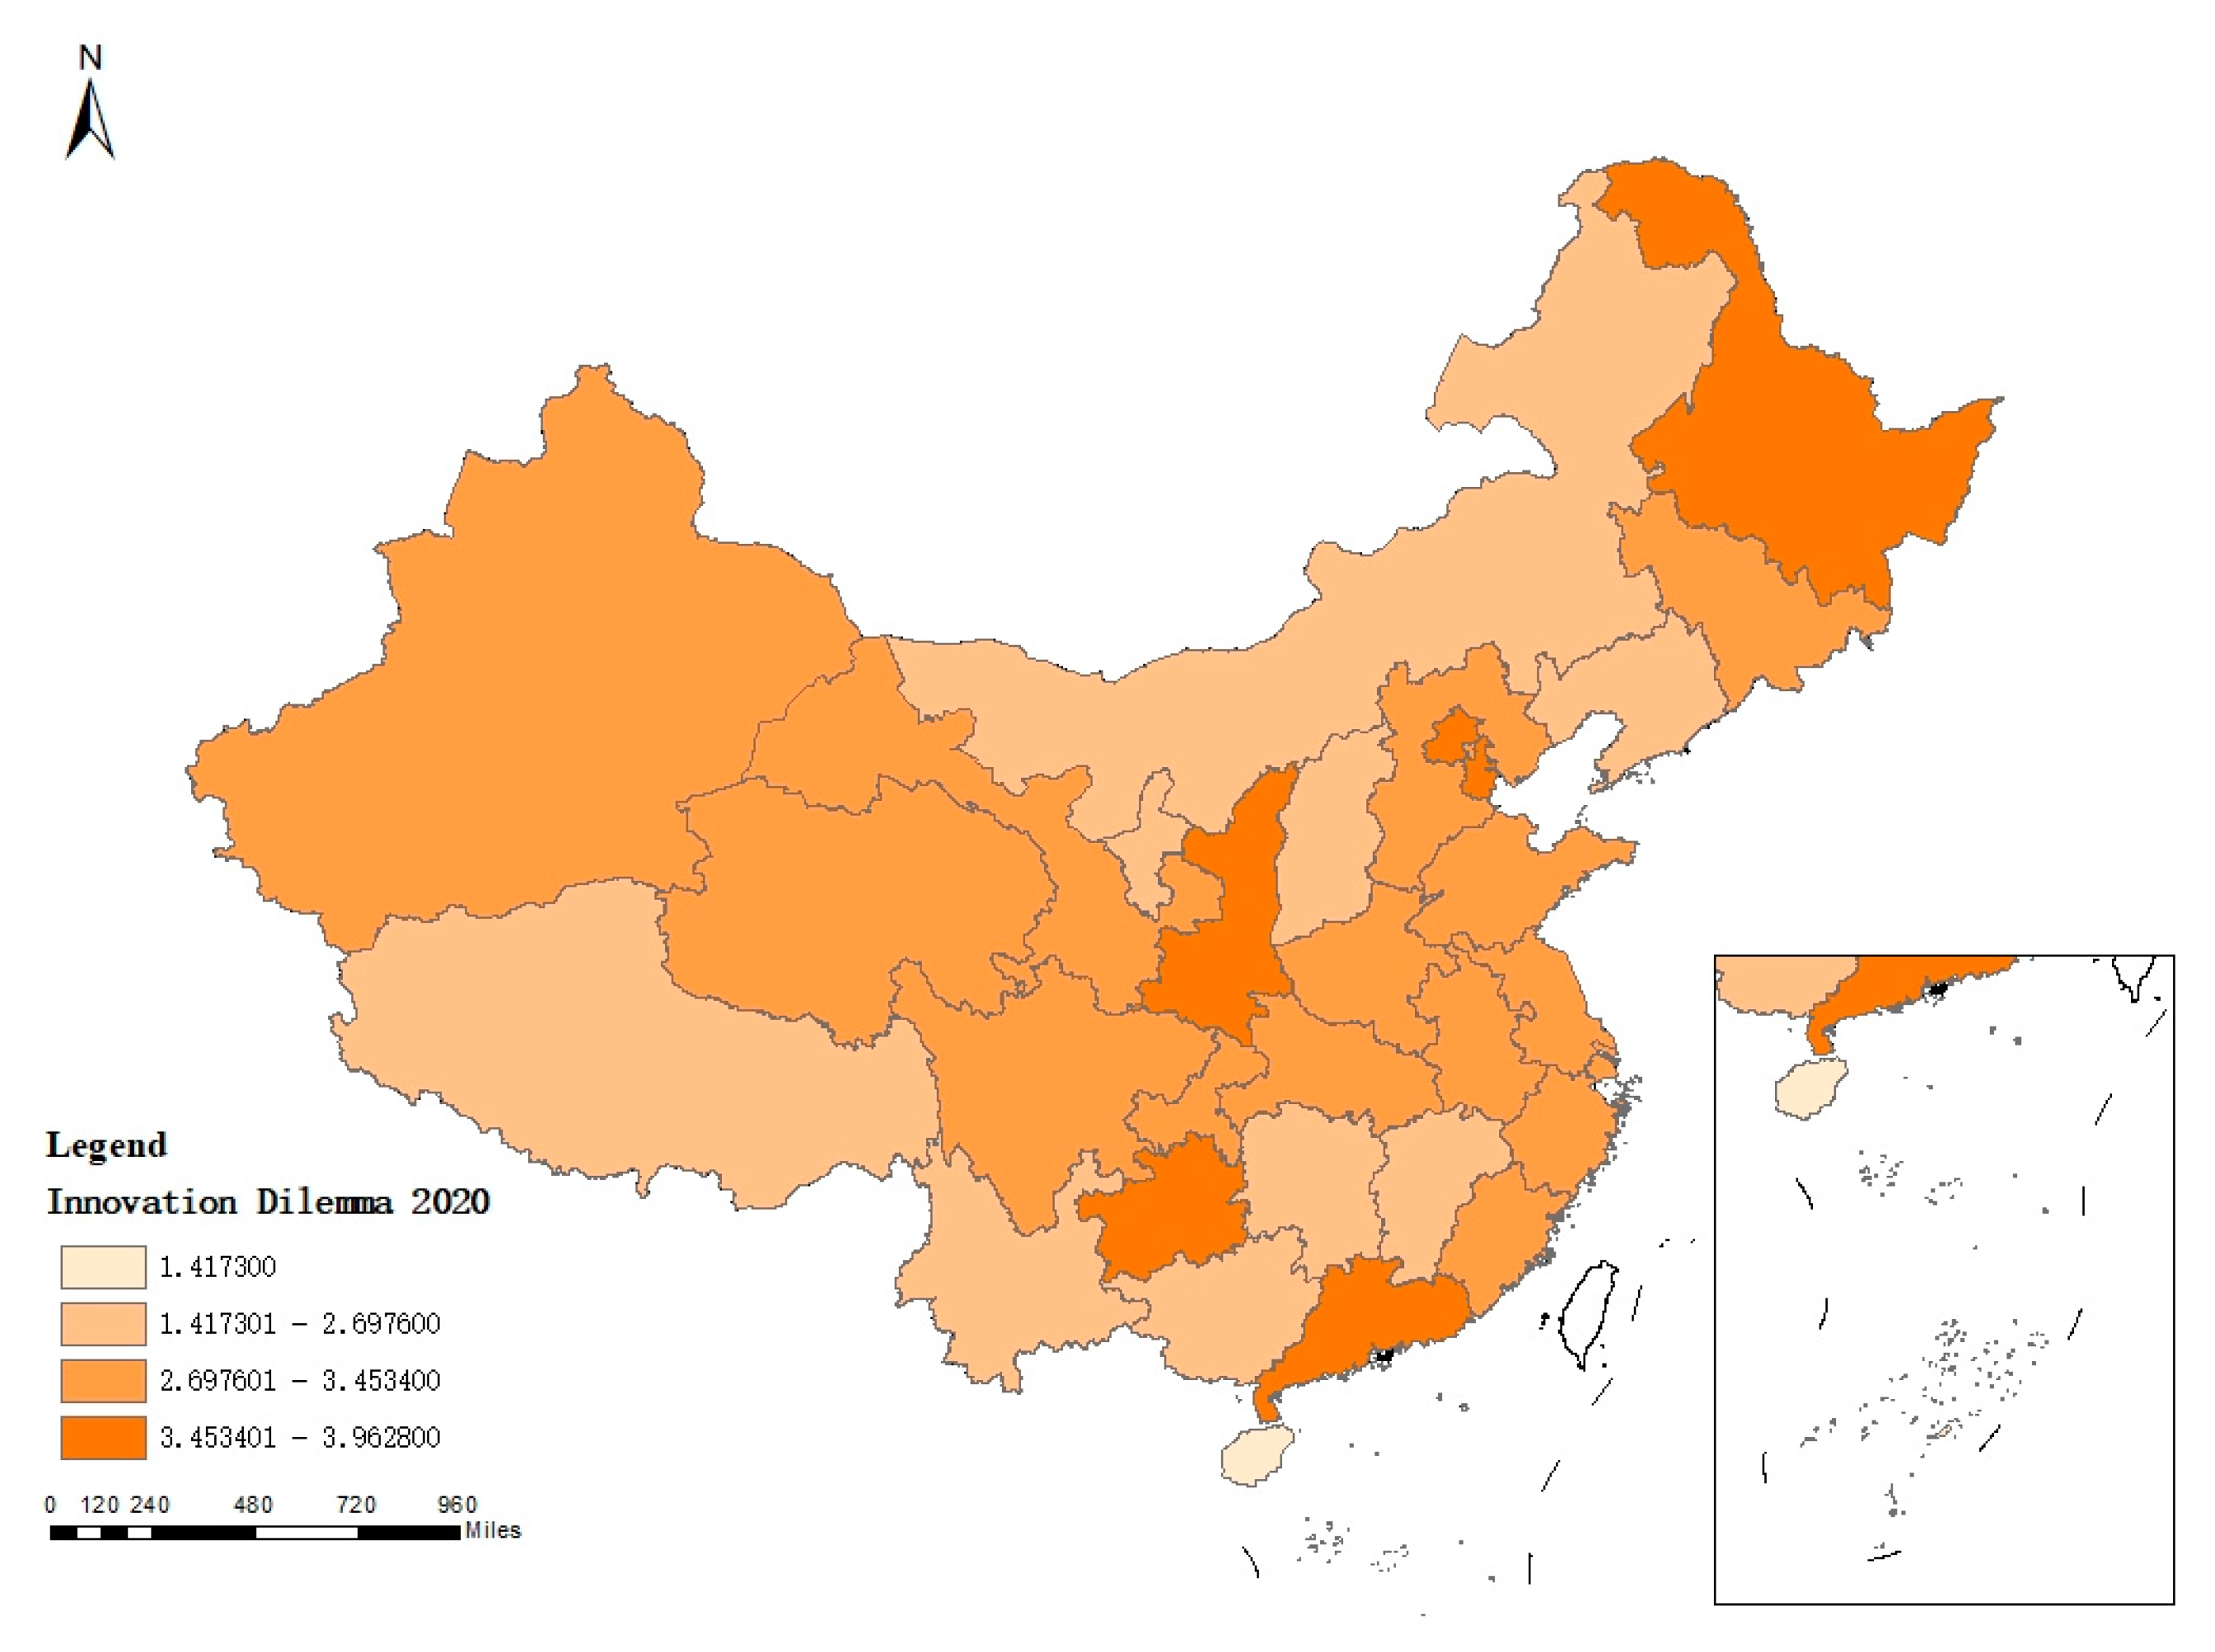
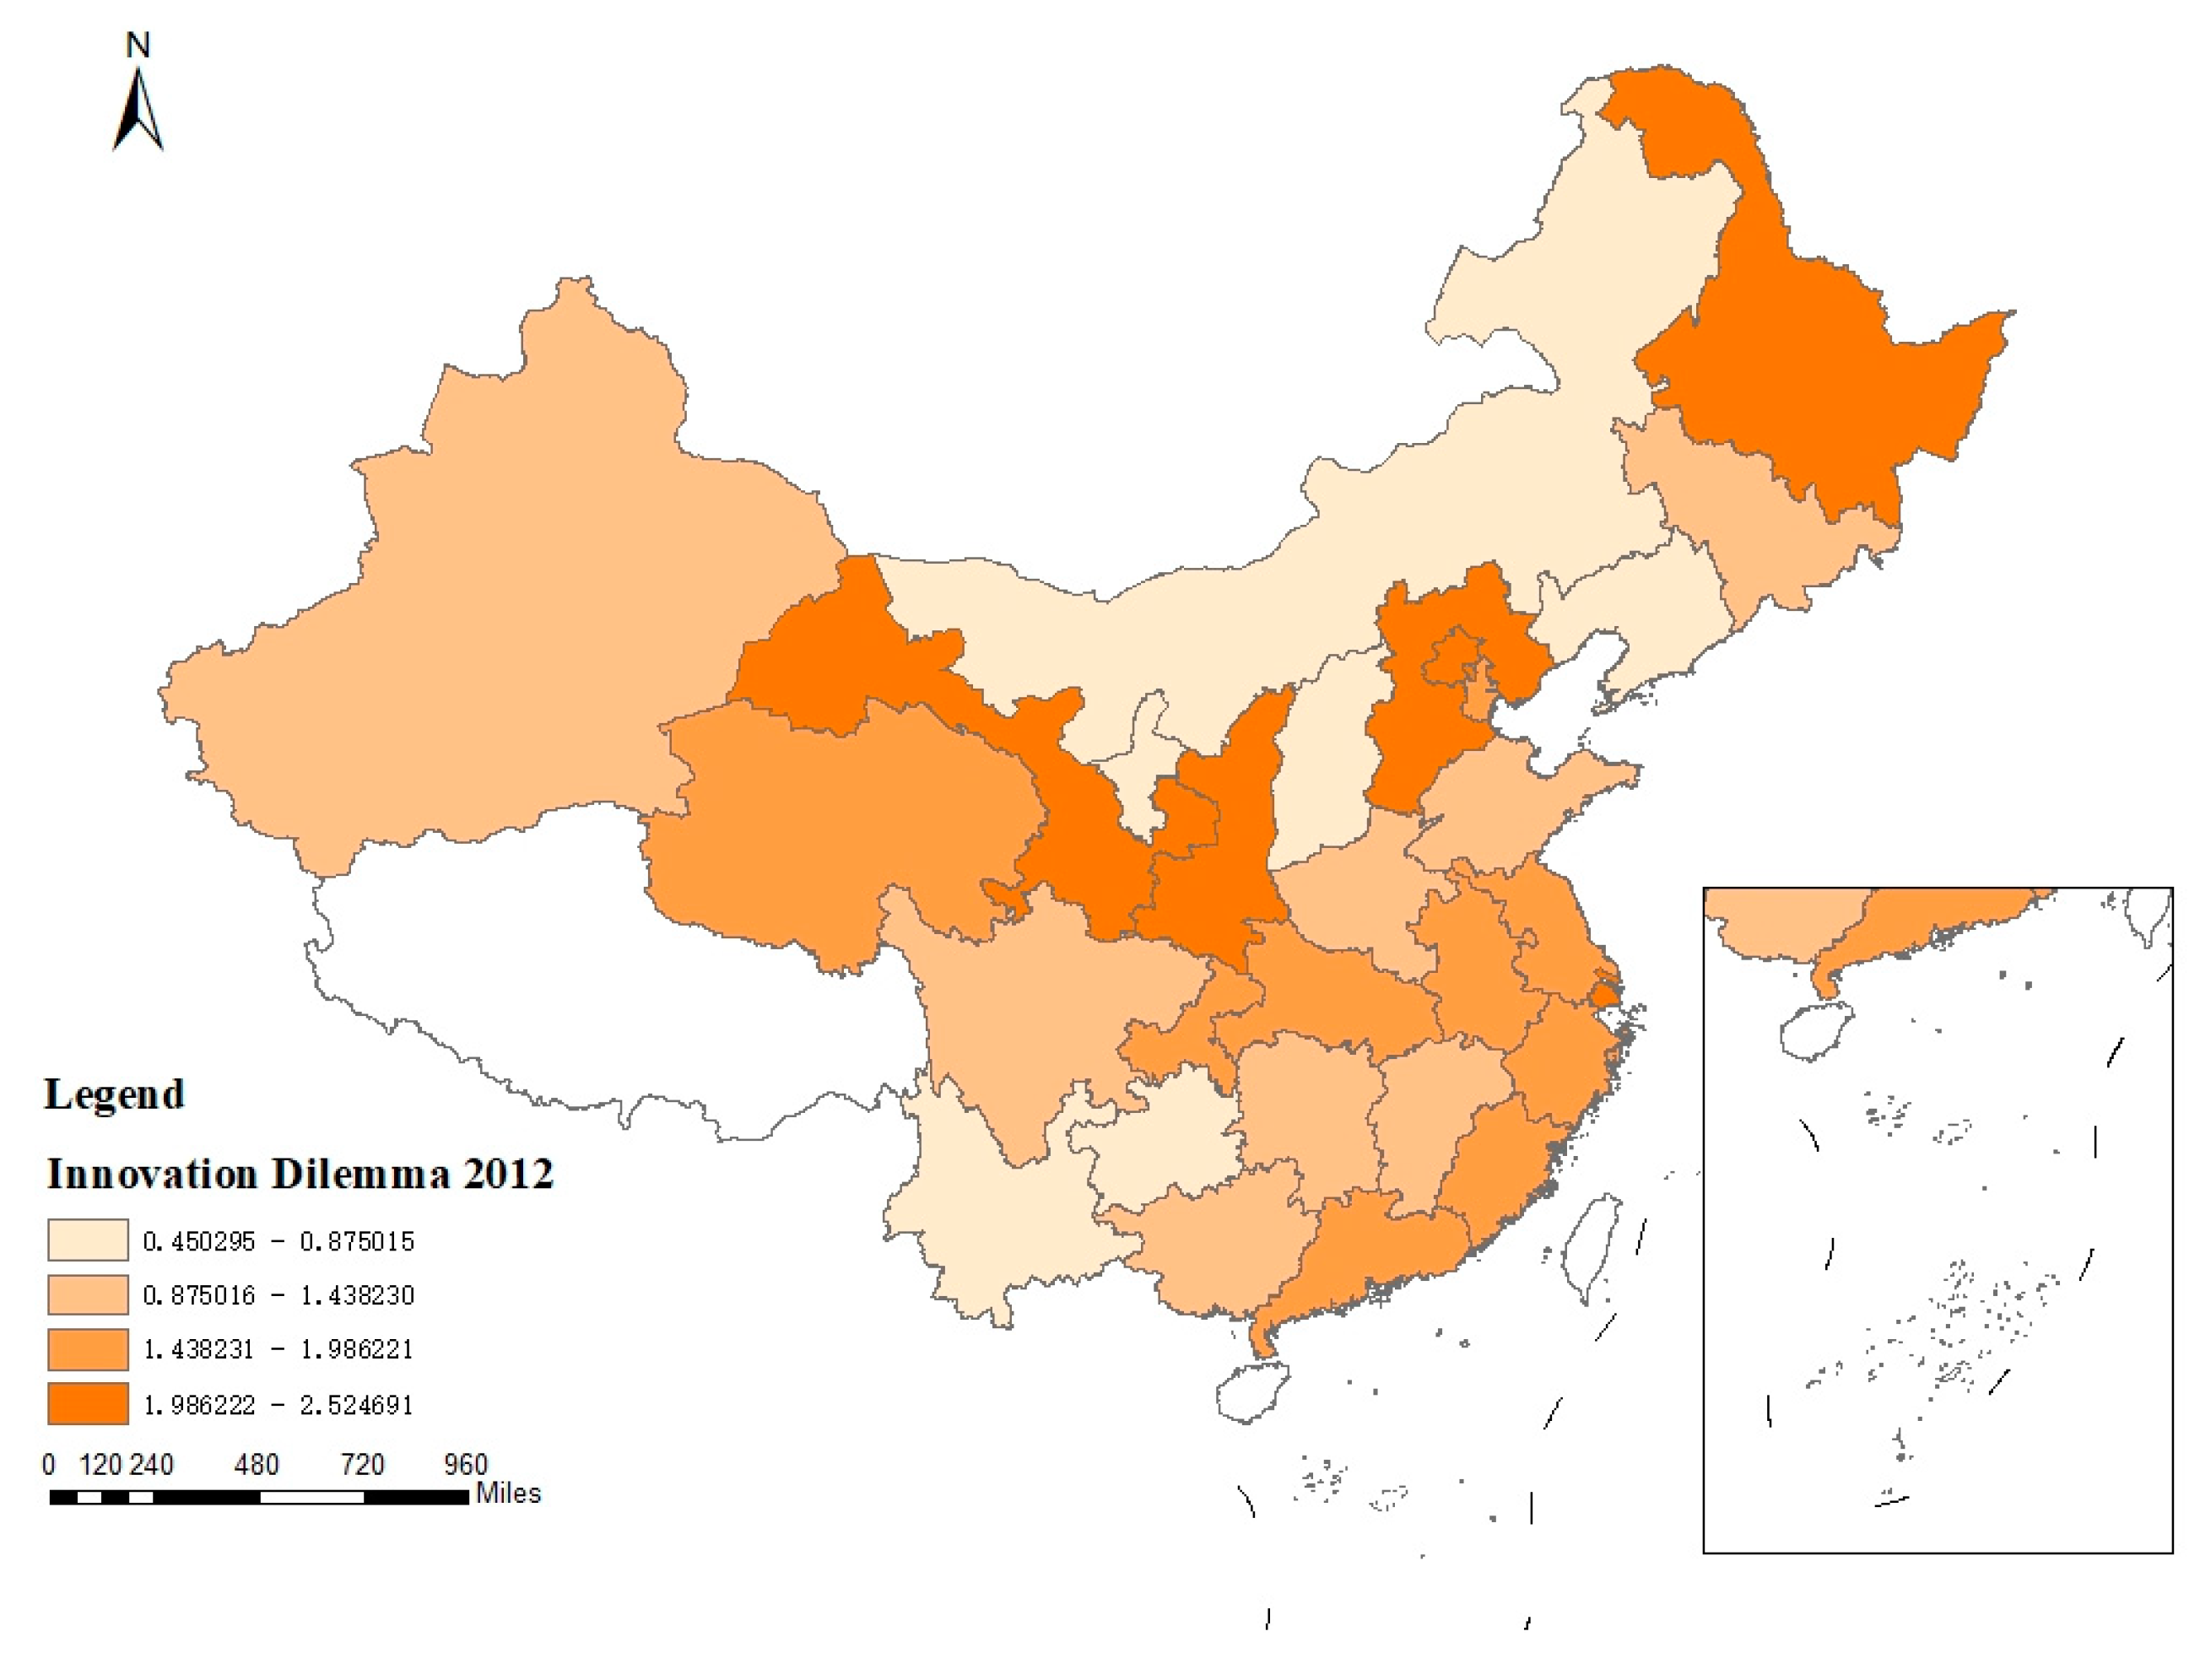
Before exploring how the innovation dilemma affects the operation efficiency, this paper briefly expounds and analyzes the current distribution status of the enterprise innovation dilemma in China. By classifying the sample data according to the provincial administrative region to which the enterprises belong, the distribution of innovation dilemmas of listed Chinese A-share manufacturing enterprises in each provincial administrative region can be obtained. This paper selects the data of innovation dilemmas of manufacturing enterprises in 2012 and 2020 after considering regional data integrity, and draws the regional distribution maps of innovation dilemmas faced by manufacturing enterprises. The changes of the distribution of innovation dilemma of manufacturing enterprises in different regions from 2012 to 2020 are compared and analyzed. As a note, the measurement of innovation dilemma level is referred to Lian, Y.L. et al [19], which will be explained in detail in the third section.
According to Figure 1 and Figure 2, in general, there are differences in the distribution of enterprise innovation dilemma between 2012 and 2020, and the group distance of the horizontal group of innovation dilemma between regions in 2020 becomes wider, indicating that the regional difference of enterprise innovation dilemma in 2020 is more obvious than that in 2012. In addition, the value range of the difference between the actual innovation performance and the expected innovation performance of enterprises in 2020 expands, indicating that the overall level of innovation dilemma of enterprises in 2020 is higher than that in 2012. By analyzing the reasons for the rising level of innovation dilemma, it can be seen that under the background of the increasing instability of the international technological innovation environment, independent research and development has gradually become the main way of technological innovation for Chinese manufacturing enterprises in order to break the technological monopoly. However, with the continuous progress of technological level, the demand for advanced and sophisticated technological breakthroughs has increased, and the difficulty of technological innovation has been increasing day by day. The diminishing marginal innovation of manufacturing enterprises has become the only way before making major technological breakthroughs. Admittedly, the deterioration of innovation situation at this time cannot be equated with the decline of technological innovation level.
Specifically, the provincial administrative regions with the highest level of innovation distress in 2012 and 2020 mainly involve the regions with leading economic development and the regions where old industrial cities are located. In 2012, the provincial-level administrative regions with the highest level of innovation distress included Beijing and Shanghai, as well as Gansu, Shaanxi and Heilongjiang provinces. The provincial-level administrative regions with the highest level of innovation dilemma in 2020 involve Beijing, Tianjin, Guangdong Province, and Shaanxi and Heilongjiang provinces. It is true that enterprises in old industrial areas have long faced innovation difficulties due to the great pressure of industrial structure transformation and technological upgrading. Then, how to understand the distribution map of innovation dilemma shows that enterprises in regions with higher economic development level are faced with more serious innovation dilemma? Explore the general reasons behind this law from a macro perspective: According to the theory of new economic geography, in the development of high-tech industry, the flow of various input factors will promote the geographical agglomeration of economic activities of enterprises and related organizations in the industry. The correlation effect between different enterprises in the industrial chain will also promote the preference of enterprises to choose to carry out their production activities in regions with larger market size [20], the actual situation is consistent with the theory that the spatial distribution of China's high-tech industry is concentrated in the eastern coastal areas with high economic development level, such as the Bohai Rim area with Beijing as the center, the Yangtze River Delta area with Shanghai as the head and the Pearl River Delta area with Shenzhen and Guangzhou as the center [21]. The high-tech industry has relatively high technical difficulty and innovation requirements, which makes it easier to face innovation bottlenecks. Therefore, economically developed areas with concentrated high-tech industries inevitably face more severe innovation problems. In addition, compared to underdeveloped regions, regions with higher levels of economic development have more manufacturing enterprises, greater competitive pressure, and higher levels of technological innovation. Therefore, before achieving major technological breakthroughs, more developed regions may have a situation of diminishing marginal innovation. Based on the above reasons, the regional distribution of innovation difficulties in manufacturing enterprises presents a situation where more developed regions are facing more serious innovation difficulties.
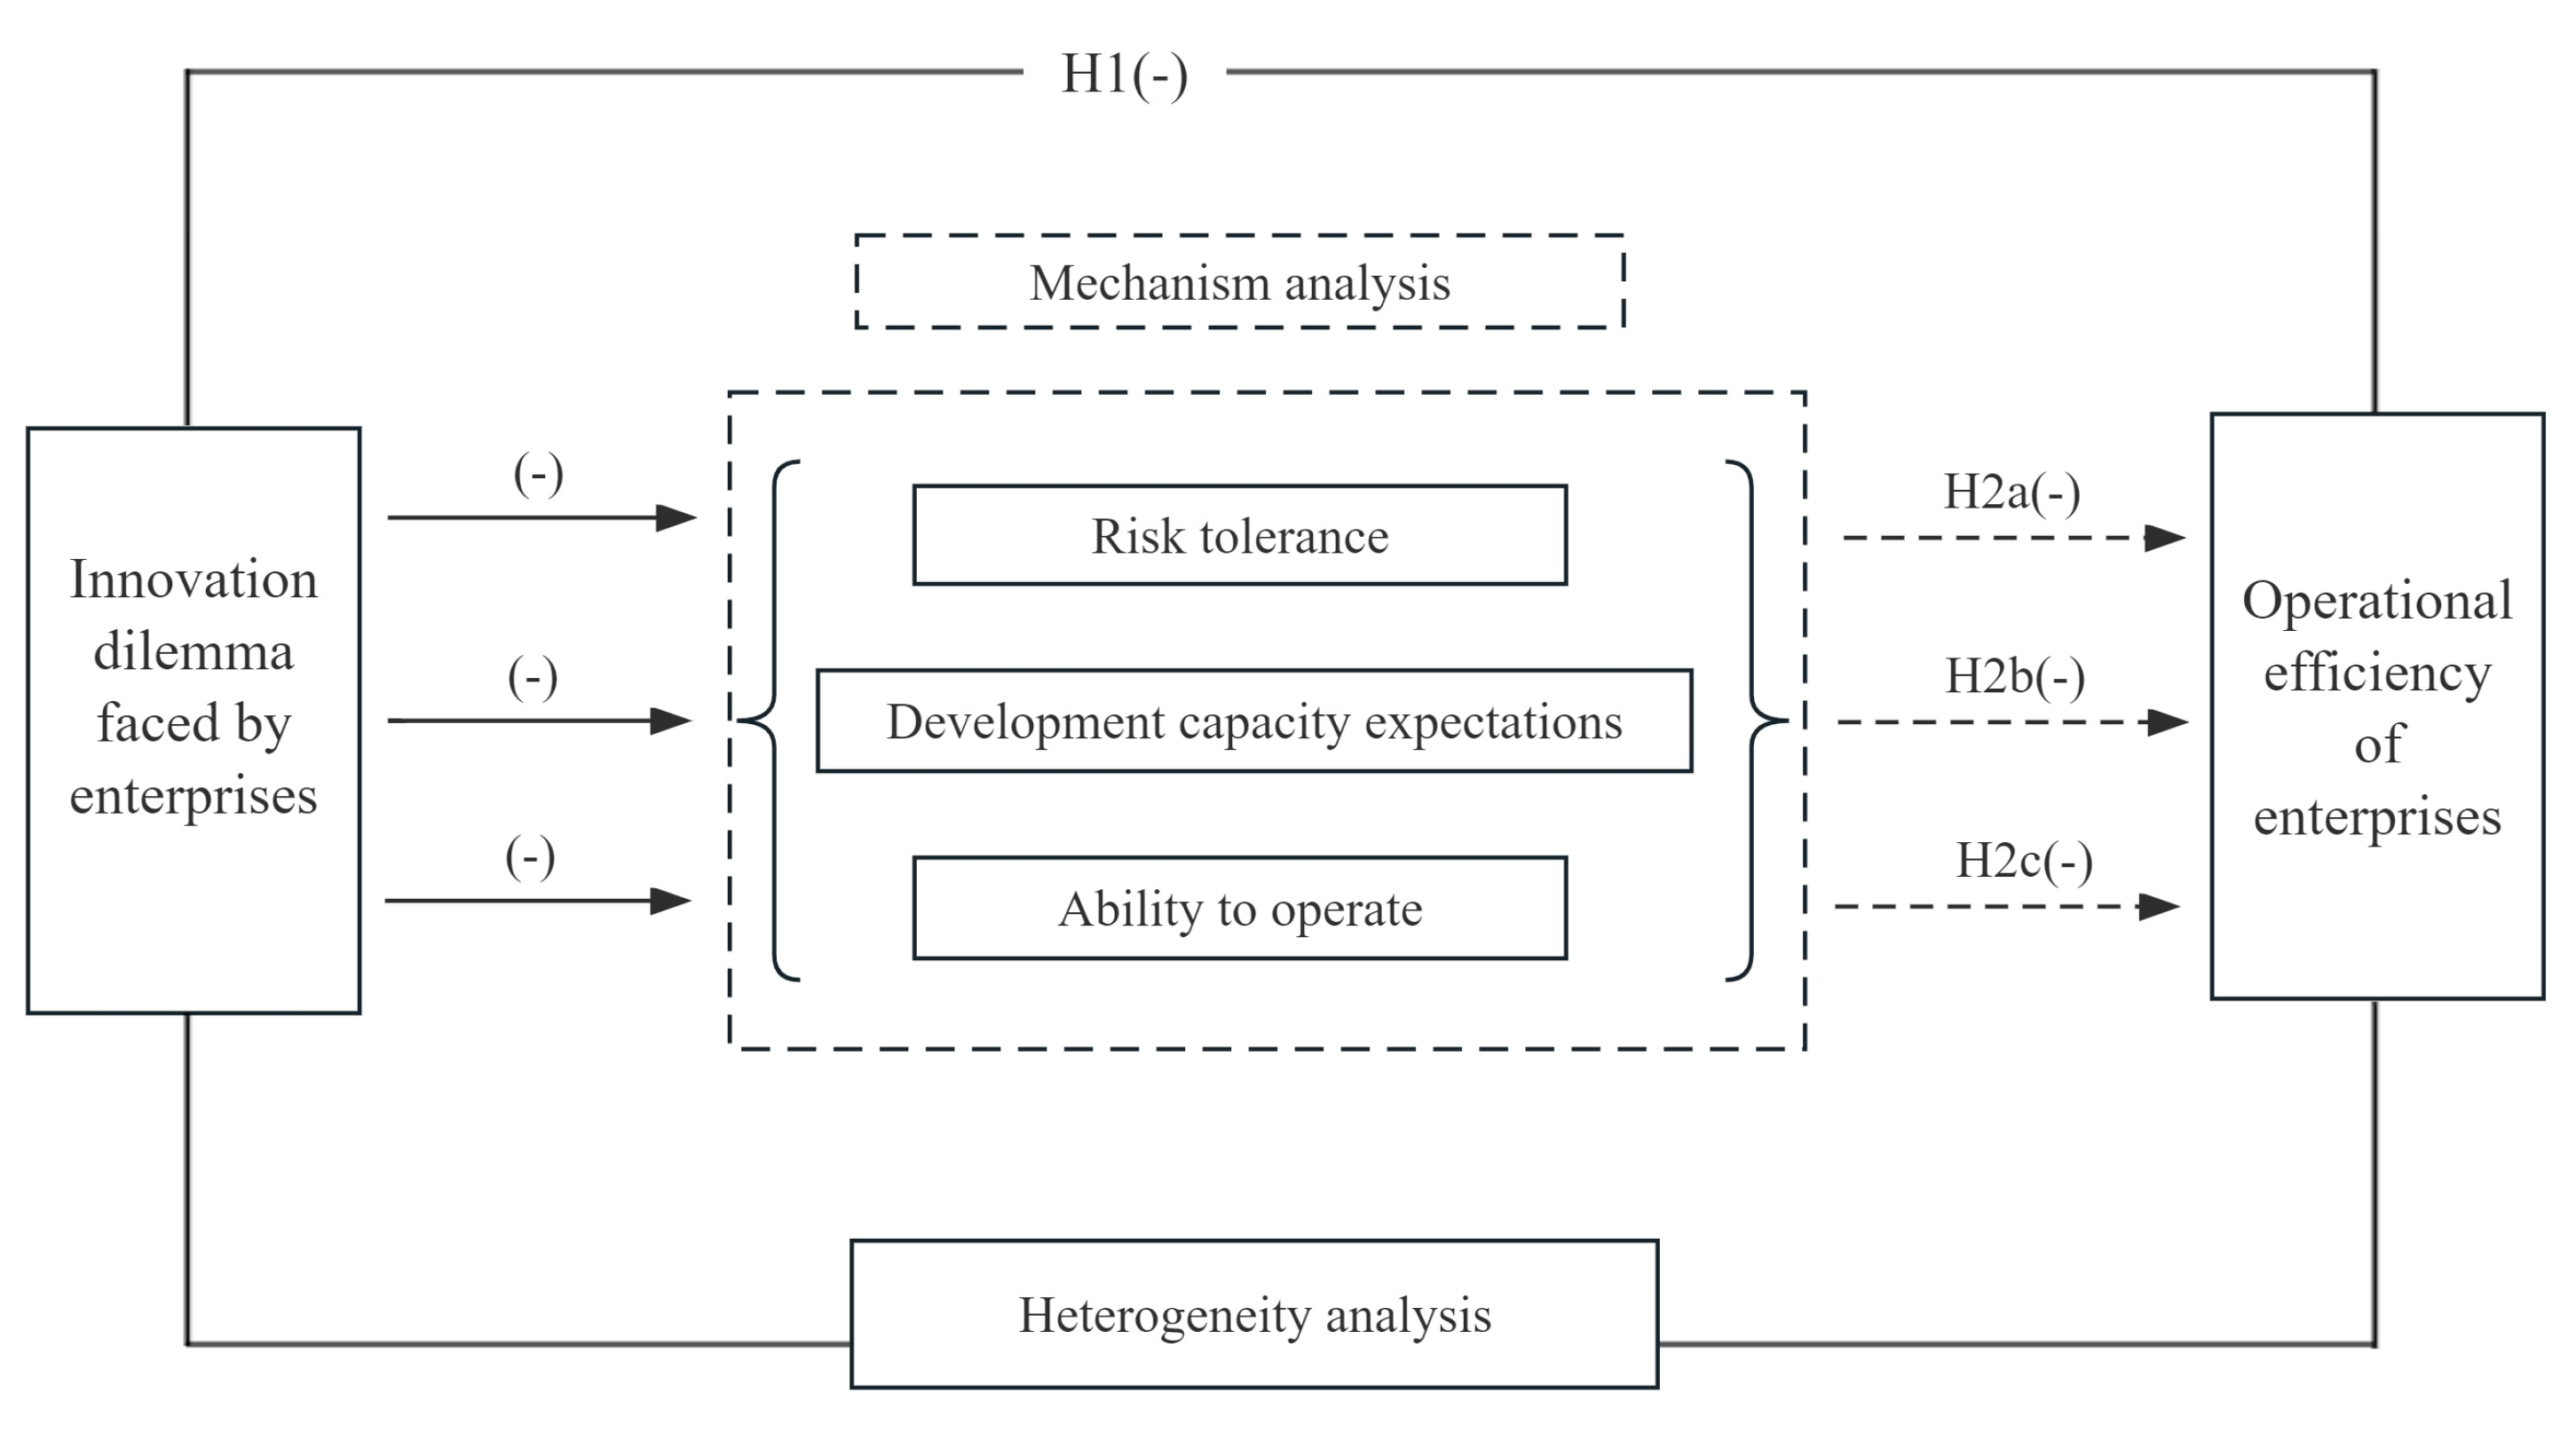
This paper takes unbalanced panel data of China’s A-share manufacturing listed companies from 2011 to 2020 as research samples to empirically test the impact of innovation dilemma on operational efficiency. It is found that the innovation dilemma has a significant inhibitory effect on the operation efficiency of enterprises. After that, this paper conducts a series of robustness tests. In order to solve the endogenous problems caused by sample selection and measurement errors, the instrumental variable method, propensity score matching method and DID model are used. The robustness of the conclusion is enhanced by replacing the dependent variable and changing the parameters of the dependent variable for calculation. As shown in Figure 3, mechanism analysis shows that the innovation dilemma faced by enterprises will inhibit the operational efficiency of enterprises by reducing their risk tolerance, development ability expectation and profitability. Moreover, the impact of innovation dilemma on operational efficiency is heterogeneous and variable. From the perspective of the company, the innovation dilemma faced by enterprises more significantly affects the operating efficiency of private enterprises, small and medium-sized enterprises, enterprises in the stage of development and decline. From the perspective of industry and region, the innovation dilemma has a more obvious inhibitory effect on the operating efficiency of high-tech enterprises and enterprises in the eastern region.
Compared with the previous research, the marginal contribution of this paper is mainly reflected in the following three aspects. First, against the background of the uncertainty of technological innovation brought about by technological nationalism in the international environment, this paper expounds the current situation of the innovation dilemma of domestic manufacturing enterprises, empirically analyzes the impact of innovation dilemma on the operating efficiency of manufacturing enterprises, and enriches the research on the factors affecting the operating efficiency of manufacturing enterprises. The causal effect can be inferred more accurately by the quasi-natural experiment proposed by “high-quality development” , combined with the causal identification techniques such as randomized controlled trial and matching method. Secondly, in terms of the quality of the paper, this paper helps to understand the variables that affect the operational efficiency of manufacturing enterprises. From the existing research, scholars’ research on factors affecting the operating efficiency of manufacturing enterprises has established a system. At the micro level, they mainly focus on various production factors, but pay less attention to the innovation situation of enterprises, especially the impact of innovation dilemmas on the operating efficiency of enterprises. This paper makes up for this gap. Third, the study has practical implications for both manufacturing companies and policymakers. The research on innovation dilemmas faced by manufacturing enterprises can improve the enterprises’ attention to their own innovation situation, and pay attention to the impact of innovation dilemmas on the business efficiency of enterprises, so as to encourage enterprises to improve their innovation ability and avoid falling into the vicious circle of innovation dilemmas inhibiting business efficiency. In addition, the research results provide support and insights for policy makers to promote the high-quality development of manufacturing enterprises, help policy makers understand the innovation situation of manufacturing enterprises, use fiscal and monetary policies to reduce the burden of technological innovation of enterprises, promote manufacturing enterprises to improve product quality and technological innovation level, and accelerate the transformation and upgrading of manufacturing industry. We will promote the high-quality development of China’s manufacturing industry.
The basic structure of this paper is as follows. The second part is theoretical analysis and research hypothesis. The third part introduces the data source, model setting, related variables and their measurement. The fourth part shows the empirical results of innovation dilemma and operation efficiency of manufacturing enterprises and a series of robustness tests, and further carries out mechanism analysis and heterogeneity analysis. The fifth part emphasizes the conclusion of empirical analysis and provides further discussion.
Figure 3. Diagram of Mechanism Analysis.
Preprints 104151 g003

2. Theoretical Analysis and Research Hypotheses

2.1. The Impact of Innovation Dilemma on the Operating Efficiency

Continuous technological innovation is an important means for manufacturing enterprises to improve their core competitiveness. The popularization of production technology has continuously improved social production efficiency, leading to more intense competition among manufacturing enterprises [22]. In order to win a place in the industry, the enterprises must continue to carry out technological innovation. In addition, peoples living standards are improving day by day, and consumers put forward higher and higher requirements for product differentiation and functional innovation, which also forces manufacturing enterprises to carry out continuous technological innovation in product design and production links, so as to gain consumers favor and bring profits [23]. However, because China’s manufacturing industry learns foreign advanced technology in the initial stage of technological innovation and has a certain dependence on it, the harsh environment of international technological innovation now makes some domestic manufacturing enterprises fall into an innovation dilemma [24]. The innovation dilemma reduces the profit margins of enterprises, which is not conducive to their sustainable development and puts them at a disadvantage in fierce market competition. What’s more, as an important indicator for enterprises to measure the operation status of enterprises, operating efficiency can reflect the ability of enterprises to use resources and their market competitiveness to a certain extent. Therefore, the impact of an event or decision on the survival and development of enterprises can be judged by operating efficiency. The enterprise operation system requires sufficient cash flow to support and maintain its operation [18], and innovation dilemma can lead to a decrease in the profitability and sustainable development ability of the enterprise, which may affect the operational efficiency of the enterprise.
Based on the above analysis, hypothesis 1 was proposed:
H1. 
For manufacturing enterprises, innovation dilemma has a negative impact on operating efficiency.

2.2. Mechanisms of Action

Based on the enterprise capability evaluation system, this paper analyzes the ways that innovation dilemma inhibits operation efficiency. The ability of an enterprise can be comprehensively evaluated from multiple perspectives and multiple indicators, which usually involve the solvency [25], development ability, management ability and profitability of the enterprise, and are often regarded as important decision-making basis and reference by investors or enterprise managers [26]. The risk bearing ability, development ability and profitability of the enterprise not only reflect the results of the enterprise’s past operation, but also can be used as the basis for judging the future development of the enterprise. These three enterprise capabilities are not isolated, but systematic and synergistic. In the fierce market competition, enterprises need to improve the efficiency of production, sales, logistics and other aspects through the design and optimization of their own business processes, so as to improve the competitiveness and market share of enterprises, so that investors have higher expectations for the development ability of enterprises. It is beneficial for enterprises to attract more adequate sources of capital, and thus improve risk bearing ability. In addition, through the monitoring and management of the business process of the enterprise, the enterprise can find and solve the problems in the operation and management in time, avoid the expansion and deepening of the problems, so as to reduce the risk of the enterprise and further improve its ability to take risks and operate [27].

2.2.1. Innovation Dilemma Suppresses Operational Efficiency through Anti-Risk Capability

The ability of enterprises to bear financial risks is an important link to maintain operating efficiency [22]. When an enterprise faces the innovation dilemma and its innovation output is lower than expected, the production factors invested for innovation output cannot recover the benefits at an ideal proportion. If an enterprise continues to invest in technological innovation in order to recover losses or achieve results, the capital chain of the enterprise is relatively fragile and internal resources are relatively tight when the rate of return is low due to the high cost of R&D investment [28]. Running a business has become more difficult. If an enterprise chooses to stop technological innovation due to the innovation dilemma, it may also face the decline in market competitiveness, which will affect the operating income and profit of the enterprise for a long time, and the operating efficiency will be inhibited.
Based on the above analysis, hypothesis H2a was proposed:
H2a. 
The innovation dilemma inhibits the operational efficiency of firms by reducing their anti-risk ability.

2.2.2. Innovation Dilemma Suppresses Operational Efficiency by Development Capacity Expectation

The development ability of an enterprise is an important aspect for investors and the economy and society to evaluate the value of an enterprise, which not only reflects the current development results of an enterprise, but also affects the outside world's expectations of the future development of an enterprise, and thus affects the operating efficiency of an enterprise in the current or even future business period [29]. The evaluation indicators of enterprise development ability usually include the rate of capital preservation and appreciation, the rate of capital accumulation, the growth rate of total assets [30], etc. These indicators mainly evaluate the value of enterprises from the perspective of owners' equity and assets. When the technological innovation of the enterprise encounters the bottleneck, the technological impetus of the development of the enterprise is insufficient, it is more difficult to launch new products, and the market competitiveness is decreased, which affects the revenue and profit [39]. Then the expectations from various sectors of society for the development ability of enterprises has decreased, which further affects the operation efficiency.
Based on the above analysis, hypothesis H2b was proposed:
H2b. 
The innovation dilemma affects the operational efficiency of the firm by reducing the expectations to the firm's development capability.

2.2.3. Innovation Dilemma Suppresses Operational Efficiency through the Profitability of Firms

Profitability is the factor that can directly affect the operational efficiency of enterprises, especially while the enterprises encounter innovation difficulties. When enterprises face innovation difficulties due to various reasons such as lack of research and development ability and lack of funds, the product update speed will be reduced, unable to meet the market demand [30], and the lack of revenue growth power of enterprises will affect the operation and maintenance of the business system in the long run, and further directly inhibit the operation efficiency of enterprises [40].
Based on the above analysis, hypothesis H2c was proposed:
H2c. 
The innovation dilemma negatively influences the operational efficiency of firms by reducing their profitability.

2.3. The Heterogeneous Impact of Innovation Dilemma on Operating Efficiency of Manufacturing Enterprises

The differences of the impact of innovation dilemma on the operational efficiency of enterprises from various aspects, such as the level of enterprises, industries and regions, are analyzed in this paper. Different enterprises may have different scales, property rights and development stages, and the industrial attributes and regions of the enterprises will also be different. Therefore, the impact of the innovation dilemma on the operation efficiency of the enterprises is also different.
At the firm level, three factors can be used to assess the heterogeneity of innovation dilemma affecting operational efficiency: the nature of property rights, the size of the firm, and the life cycle of the firm. In terms of the nature of property rights, private enterprises and state-owned enterprises are the two main economic subjects in the background of Chinese system, and the difference of ownership leads to different social roles and social obligations. While pursuing economic benefits, state-owned enterprises need to bear more social responsibilities, but they also have more resource endowments, easier access to external market resources and stronger innovation capabilities [31], while private enterprises are more vulnerable in the fierce market competition due to relatively insufficient resource endowments and access to resources. Therefore, the private enterprises are more likely to lack resources and capabilities to cope with innovation difficulties. The operational efficiency of private enterprises may be more affected by the innovation dilemma. For enterprise scale, small enterprises have insufficient advantages in market competition, relatively small living space, and high sensitivity to innovation dilemma. In comparison, large enterprises have stronger ability to withstand and cope with innovation difficulties. Therefore, the impact of innovation dilemma on the operating efficiency of small enterprises is more significant. As far as the company life cycle is concerned, it can be divided into initial stage, ascend stage, mature stage and decline stage [32]. In order to improve their market competitiveness and expand their scale, enterprises in the development stage have strong motivation and demand to expand their market share and improve their operating efficiency. At this time, corresponding to the significant promotion effect of technological innovation on the development of enterprises, the impact of innovation dilemma on the operating efficiency of enterprises in the development stage is also significant. In contrast, enterprises in the recession period have relatively poor financial status and profitability, lack of motivation for technological innovation, and a higher degree of innovation dilemma. However, the relatively fragile financial status reduces the ability of enterprises to withstand innovation dilemma. Therefore, the innovation dilemma of enterprises in the recession period will have a more obvious inhibitory effect on business efficiency. In comparison, on the one hand, start-up enterprises rely on initial endowments to operate, and compared with the situation of technological innovation, the establishment of business mode and business model is the main factor affecting the operation efficiency of enterprises at this time. On the other hand, start-up enterprises either rely on existing innovation achievements to establish enterprises, or technological innovation is in the initial stage. The innovation situation has little influence on the operation efficiency of enterprises in the initial stage. On the one hand, mature enterprises may have established a relatively stable business model, and their operating efficiency is less sensitive to innovation difficulties. On the other hand, their economic benefits and financial status are relatively stable, and they have the experience and ability to cope with innovation difficulties. Therefore, the operation efficiency of the start-up and mature enterprises is less affected by the innovation dilemma.
Based on the above analysis, hypothesis H3a was proposed:
H3a. 
For private enterprises, small and medium-sized enterprises, enterprises in ascend and decline phase, the innovation dilemma has a more significant negative effect on operating efficiency.
From the perspective of whether an enterprise belongs to high-tech industry, the heterogeneity at the industry level is investigated. In the manufacturing industry, the technological progress of high-tech industry is faster and the replacement frequency is higher. The fierce competition in the technology market makes enterprises face stronger pressure of technological change and need to maintain a high and stable level of innovation input and output [33]. Therefore, the operation efficiency of enterprises is highly dependent on the completion of innovation performance and is more sensitive.
Based on the above analysis, hypothesis H3b was proposed:
H3b. 
The innovation dilemma inhibits the operation efficiency of enterprises, which is more obvious for enterprises belonging to high-tech industries.
China has a vast territory, and different regions have different development conditions. Among them, the central and western regions and the eastern regions have significant differences in economic development, social development and population flow, and are often used as the research object of regional economic development. Therefore, this paper analyzes and validates the heterogeneity of core conclusions in the central and western regions and the eastern regions. Combined with hypothesis H3b and the previous discussion on the distribution of innovation dilemmas, if the innovation dilemmas faced by high-tech enterprises have a stronger inhibitory effect on business efficiency, then in the eastern region with a relatively high proportion of high-tech enterprises [34,35], the business efficiency of enterprises will be more significantly affected by innovation dilemmas.
Based on the above analysis, hypothesis H3c was proposed:
H3c. 
The innovation dilemma of enterprises located in the eastern region has a significant inhibitory effect on operation efficiency.

3. Research Methodology

3.1. Data Sources

In view of the specific regulations on annual report preparation, disclosure and audit issued by China Securities Regulatory Commission in 2010, and the basic data of multiple variables in this paper come from the annual reports of listed enterprises, the period for building the basic database is 2011—2020. Specifically, the enterprise-level data in this paper comes from China Stock Market & Accounting Research Database (CSMAR), the regional macro-level basic data is obtained from the China Statistical Yearbook, and the basic data of innovation dilemma comes from the patent information disclosed by the China Research Data Service Platform (CNRDS). After removing the observed values of ST, *ST and PT enterprises in the sample period and the samples with missing main research variables from the original data, this paper finally obtained 12,781 unbalanced panel data from 2,347 listed enterprises in China’s A-share manufacturing industry.

3.2. Model Construction

In order to test the relationship between innovation dilemma and operational efficiency of the manufacturing enterprises, this paper sets the following two-way fixed effects model:
R O A i , t = α 0 + α 1 I D L M i , t - 1 + α 2 C o n t r o l i , t + μ i + υ t + ε i , t
In the equation, R O A i , t represents the operating efficiency of listed company i in year t. The   I D L M i , t - 1   represents the degree of innovation dilemma of the listed company i in year t-1. α 0 represents the intercept term. C o n t r o l i , t represents the set of control variables. μ i represents individual fixed effects, and υ t   represents time-fixed effects. ε i t represents the random disturbance term. α 1 represents the average causal effect of the enterprises’ innovation dilemma on their operating efficiency. If α 1 is greater than 0, it indicates that the innovation dilemma has an incentive effect on the operation efficiency of the firm. Conversely, if α 1 is less than 0, it suggests that the innovation dilemma faced by enterprises inhibits their operating efficiency.
Based on the above theoretical analysis, this paper holds that innovation dilemma affects the operational efficiency of manufacturing enterprises through risk bearing capacity, development ability expectation and profitability. In order to further test the three paths, models are set as follow based on Model (1):
M i , t = β 0 + β 1 I D L M i , t - 1 + β 2 C o n t r o l i , t + μ i + υ t + ε i , t
R O A i , t = γ 0 + γ 1 I D L M i , t 1 + γ 2 M i , t + γ 3 C o n t r o l i , t + μ i + υ t + ε i , t
In Model (2) and Model (3), M i , t   include risk bearing capacity (SOL), development capability expectation (DCE) and profitability (PR). Control variables are consistent with Model (1). The main focus here is on the coefficients β 1 ,  γ 1 and γ 2   . If the coefficients β 1 of Model (2) and γ 1 and γ 2 of Model (3) are significant, they indicate that technological innovation affects the operational efficiency of enterprises through three paths: risk bearing capacity, development ability expectation and profitability.

3.3. Variables

3.3.1. Explained Variable

The explained variable of this paper is the operating efficiency (ROA) of the firm, and the return on total assets is selected as its measurement index. The rate of return on total assets is the ratio between the total compensation and the average total assets of an enterprise in a certain period, which is an important index to evaluate the operating efficiency of assets of an enterprise.

3.3.2. Explanatory Variable

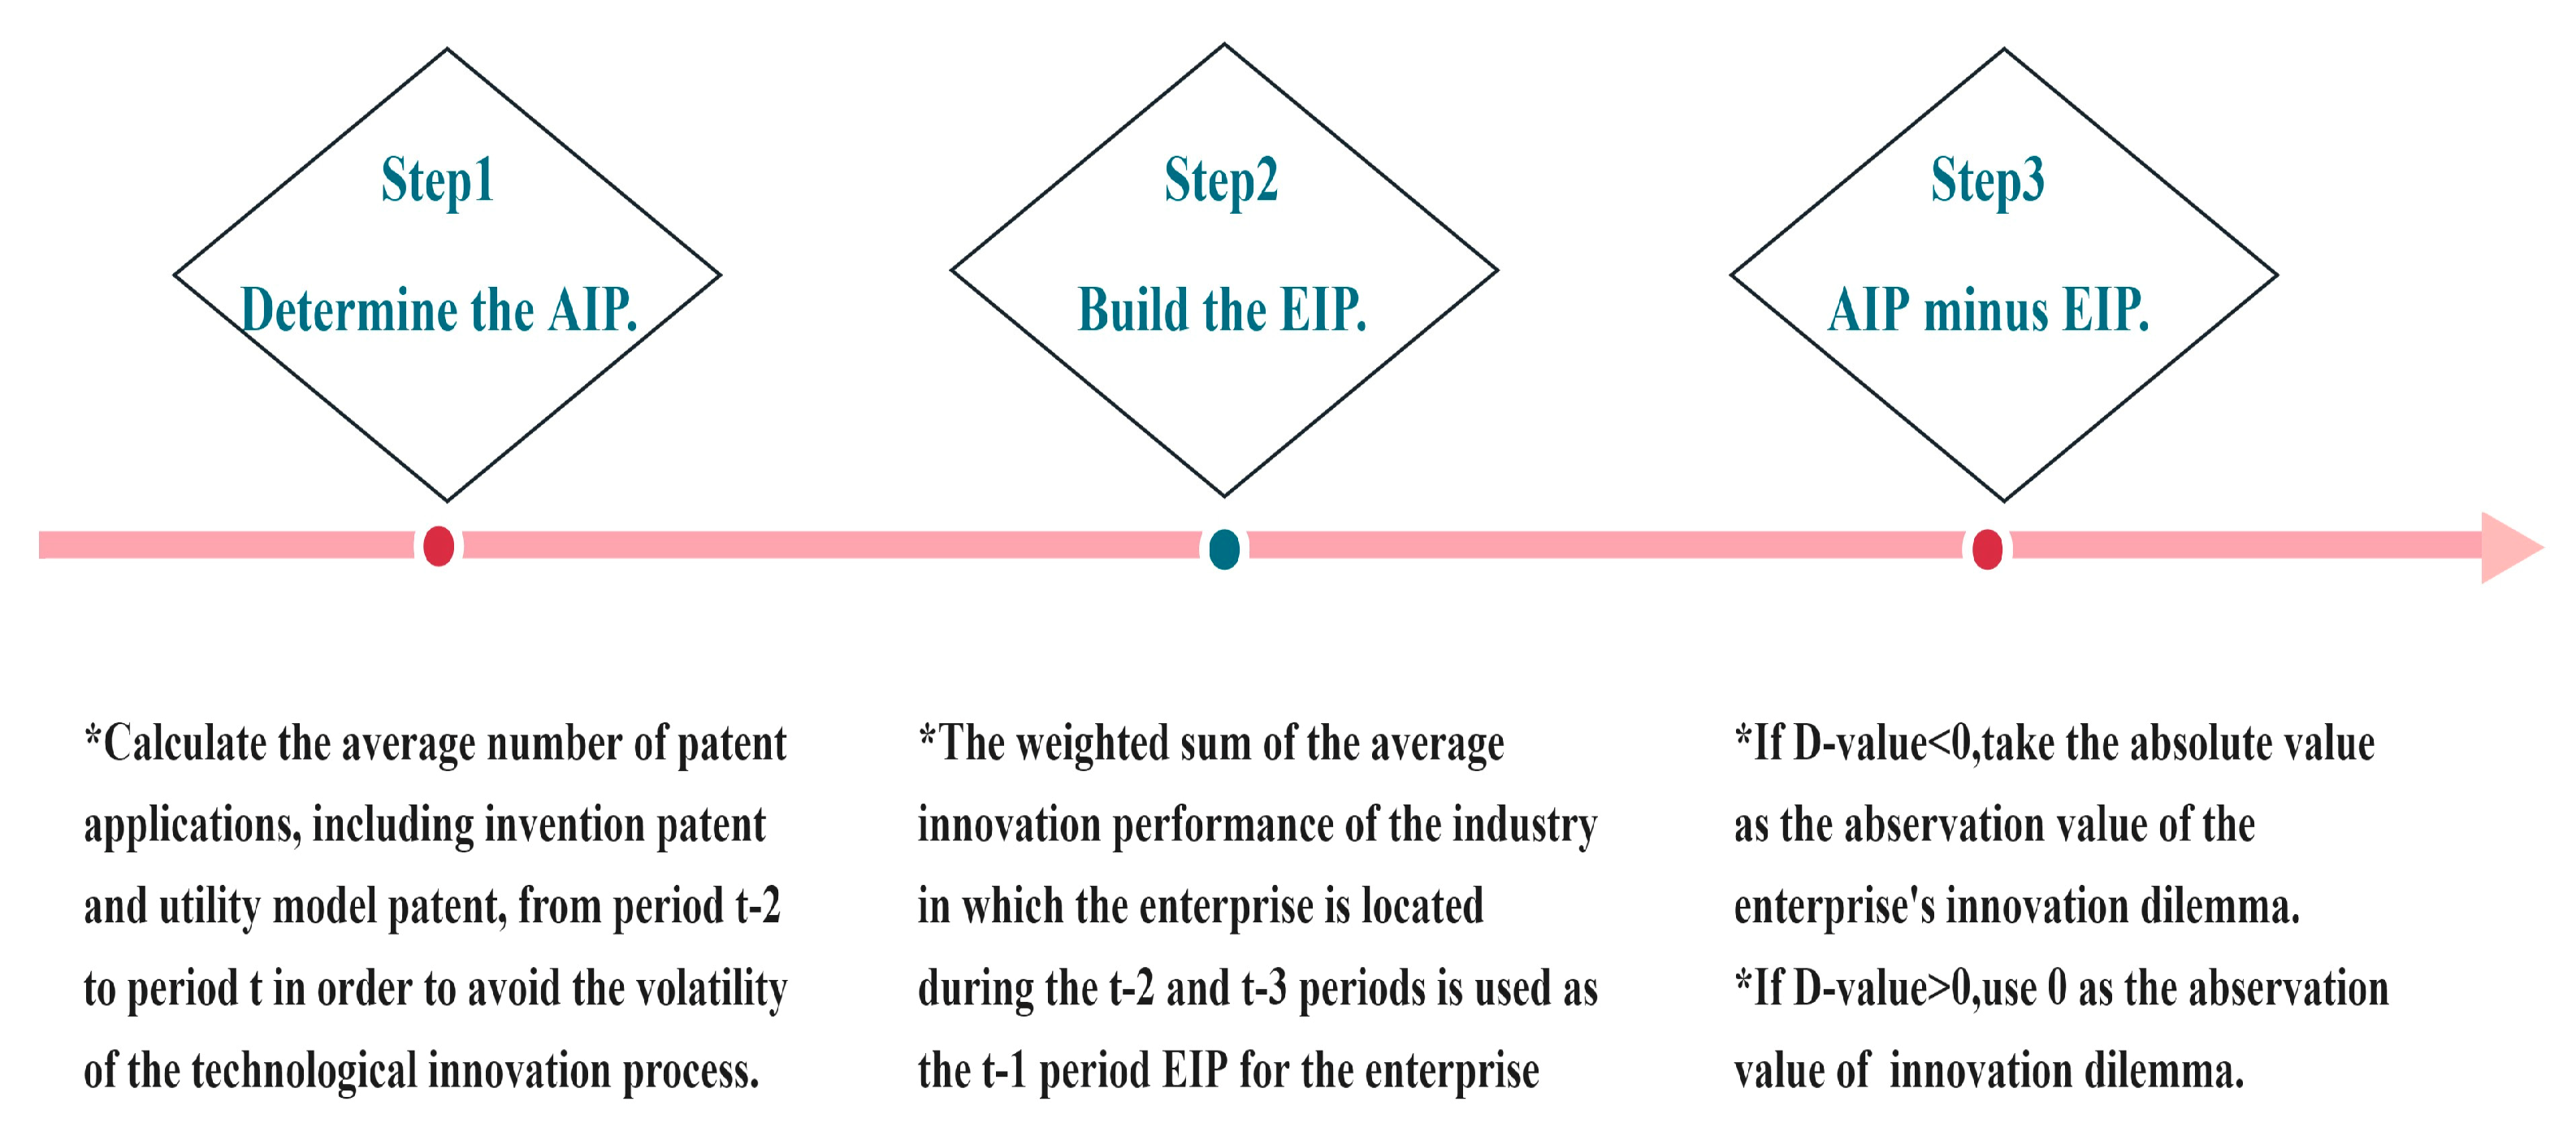
The core explanatory variable of this paper is firms’ innovation dilemma (IDLM). The specific calculation steps are shown in the Figure 4. When measuring the innovation dilemma of enterprises, this article refers to the three-step calculation method of “determining performance indicators—constructing performance expectations—finding the performance expectation gap” [19], and takes the difference between the actual innovation performance of enterprises (AIP) and innovation performance expectation (EIP) as the indicator to measure the extent to which an enterprise is in innovation distress.

3.3.3. Control Variables

The control variables selected in this paper are as follows. Enterprise size (SIZE) : natural logarithm of enterprise operating income; enterprise age (AGE) : the natural logarithm of the difference between the year observed and the year of establishment of the enterprise; asset-liability ratio (LEV) : the ratio of corporate liabilities to assets; asset turnover ratio (ATR) : the ratio of operating income to average total assets; ownership concentration (CON) : the Herfindahl index of shares held by the top five shareholders of a company; ratio of independent directors (ID) : the ratio of independent directors to the total number of directors; degree of industry competition (HHI) : the Herfindahl index of the ratio of a company's operating revenue to its industry.

3.3.4. Instrumental Variable

This article adopts the entropy weight method (EWM) to calculate the score of enterprise innovation capability as an instrumental variable (IV), referring to the innovation capability evaluation index system conducted by Jiang, C.Y. [36]. The specific index composition of the tool variable is shown in the Table 1. Considering the quality and availability of data, two secondary indicators are selected from each of the four primary indicators of the evaluation system as the basic indicators to measure the innovation capability of enterprises. Then, the entropy weight method is used to calculate the weights of each indicator. Finally, the total weight of the obtained first-level indicators and the basic data at the firm level were used to calculate the innovation capability scores of the sample firms in each year in the sample time interval, which was used as an instrumental variable for endogeneity test.

3.3.5. The Explanatory Variables in Mechanism Analysis

The explanatory variables selected in the mechanism analysis of this paper include: anti-risk capacity (SOL), development ability expectation (DCE) and profitability (PR). Among them, the measurement index of risk bearing ability (SOL) is the ratio of profit before interest, tax, depreciation and amortization to the average balance of liabilities, which reflects the long-term solvency of enterprises and is also an important indicator to examine the risk tolerance of enterprises. The higher the value of this index, the stronger the enterprise's risk bearing ability. The expectation of development ability (DCE) is measured by the rate of capital preservation and appreciation, which is the ratio of the total value of owners’ equity at the end of the current period to the initial value of the current period. This index reflects the preservation and growth of the capital invested by investors in the enterprise. The higher the index value, the better the capital preservation status of the enterprise and the faster the growth of owners' equity. The more secure the debt of creditors, the stronger the momentum of enterprise development. The measurement index of profitability (PR) is the profit margin before interest and tax, which is often used by financial management as an important indicator for analyzing a company’s profitability. The larger the value of the indicator, the more ideal profitability is. In summary, it is speculated that the deteriorating innovation situation of manufacturing enterprises will have a negative effect on operational efficiency by suppressing their anti-risk ability, development ability expectation and profitability.
Table 2. Main variable definitions.
Variable Symbol Calculation Method
Explained variable Enterprises’ operational efficiency ROA The ratio of total profit and financial expenses to total assets
Explanatory variable Enterprises’ Innovation dilemma IDLM Please refer toFigure 4in the text for details
Control variables Enterprises’ age AGE The natural logarithm of the difference between the year of observation and the yearof establishment of the enterprise
Enterprises’ size SIZE The natural logarithm of a company's operating income
Asset liability ratio LEV The ratio of total liabilities to total assets
Asset turnover ATR The ratio of total revenue to total assets
Ownership concentration CON The Herfindahl Index of the shareholding proportion of the top five shareholders of the enterprise
Proportion of independent directors ID The ratio of independent directors to the total number of directors on the board of directors
The level of competition among enterprises in the industry HHI The Herfindahl Index of the ratio of a company's operating revenue to its industry
Regional macro variables Regional GDP GDP The natural logarithm of regional GDP
The proportion of the secondary industry SIR The ratio of output value of the regional secondary industry to regional GDP

4. Results

4.1. Descriptive Statistics

The descriptive statistics of main variables in this paper are shown in the Table 3. The average operating efficiency (ROA) of the sample firms is 0.037 and the standard deviation is 0.064. The large gap between the maximum value and the minimum value of the operating efficiency reflects the significant difference between the operating efficiency of different companies, and the minimum value is negative, indicating that the operation of some enterprises is not optimistic. The standard deviation of enterprise innovation dilemma (IDLM) is 3.026, indicating that the degree of innovation dilemma varies greatly among different listed companies.Among the control variables, the standard deviation of enterprise size (SIZE) is 1.264, indicating a significant difference in the size of different listed companies in the sample. In addition, descriptive statistical analysis of other control variables also showed significant differences between different firms, and these control variables effectively captured substantial differences between firms, confirming the appropriateness of the selection of control variables.

4.2. Regression Results and Analysis

Table 4 shows the results of baseline regression for Model (1). In this paper, a stepwise regression method is adopted, and year fixed effect and province fixed effect are gradually added column by column. According to column (1)—(3) of Table 4, the regression coefficients of innovation dilemma on enterprise operating efficiency are all negative, and all pass the significance test at 1% level. Specially, after adding the control variables, the coefficients of the control variables also passed the significance test at the 1% level. The results show that Model (1) has a good fitting effect. After considering the influence of time and region, the regression coefficient of innovation dilemma on operational efficiency is negative at the significance level of 1%. The above results show that the innovation dilemma has a significant negative effect on the operating efficiency of manufacturing enterprises. Hypothesis H1 is verified and considered to be valid.

4.3. Robustness Test

4.3.1. Instrumental Variable Method

In reality, many potential factors affecting the operation efficiency of enterprises, so there are problems that may cause endogeneity. Therefore, this paper further uses the instrumental variable method to re-estimate. In terms of the selection of instrumental variables, referring to the innovation capability evaluation index system [36], the entropy weight method (EWM) is used to calculate the innovation capability scores of sample enterprises in each year within the sample time interval, and it is taken as the instrumental variable for the endogeneity test in this paper. Column (1) of the Table 5 shows that the innovation capability (IV) of enterprises is correlated with the innovation dilemma at the significance level of 1%, and the Cragg-Donald Wald F statistic is greater than 16.38, indicating that the innovation capability(IV) passes the weak instrumental variable test, which means the innovation capability (IV) can be used as instrumental variable to improve endogeneity issues in Model (1). After considering the endogenous problems caused by the omission of research variables or measurement errors, column (2) of the Table 5 shows that the regression coefficient of the impact of enterprise innovation dilemma on operational efficiency is still negative at the significance level of 1%. Therefore, the core conclusion of this paper is still valid.

4.3.2. PSM-DID

The report of the 19th National Congress of the Communist Party of China put forward “high-quality development” for the first time in 2017, marking the transition of China’s economy from a stage of high-speed growth to a stage of high-quality development. The proposal of high-quality development also indicates that the development of China’s manufacturing industry needs to gradually reverse the traditional concept of overly focusing on the expansion of production and sales scale, and then shift the future development goal to improve product quality and technical level. This paper believes that the high quality development can improve the status of technological innovation in manufacturing industry and strengthen the negative impact of innovation dilemma on operational efficiency. Therefore, it considers the “high quality development” as an impact event and uses the difference-in-difference method (DID) to test it. At the same time, by dividing the samples into a control group formed by data before the high-quality development proposal and an experimental group formed by data after the high-quality development proposal. Then, matching individuals with similar characteristics in the two groups, the aim is to simulate the “counterfactual” scenario. Specifically, following the method of Giannetti et al [37], with other control variables as the benchmark, propensity scores were calculated through regression analysis, and then matching was performed according to these propensity scores. Combined with propensity score matching and differential estimation, the results of repeated regression analysis on matched samples were shown in column (3) of Table 5. The results show that after sample selection bias is controlled by PSM-DID model above, the innovation dilemma still has a significant inhibitory effect on operating efficiency.

4.3.3. Add Regional Macro Variables

The operational efficiency of enterprises is not only affected by the enterprise level, but also by the macro-factors, such as economic development and industrial structure adjustment at the regional level. Therefore, this paper further controls the level of economic growth (GDP) and industrial structure (SIR) at the regional level to reduce the endogenous problems caused by missing variables. The results in column (4) of Table 5 show that the regression coefficient of innovation dilemma on economic efficiency is still negative at the significance level of 1% after adding the control variables at the regional macro level. This shows that the core conclusion of this paper is still sound.

4.3.4. Replace the Parameters of the Core Explanatory Variable for Measurement

This paper further tests the robustness of the model by changing the value of parameter used in the measurement of innovation performance expectation (EIP) [19]. In In the original data of the innovation dilemma, the value of parameter β is 0.5. For further robustness test, the value of the parameter is changed to 0.4 and 0.6, respectively. The results are shown in columns (1) and (2) of Table 6, and the regression coefficients of innovation dilemma are both significantly negative. After changing the value of β parameter, the inhibitory effect of innovation dilemma on operating efficiency is still significant, and the core conclusion of this paper is robust.

4.3.5. Replace the Dependent Variable

In addition to the return on total assets (ROA), the turnover of current assets is also one of the indicators reflecting the operating efficiency of enterprises. For robustness test, the explanatory variable is replaced by the turnover of current assets (CAT) for a new regression. The results are shown in column (3) of Table 6, and the regression coefficient of innovation dilemma is -0.024, passing the significance test at the 1% level. The results show that after replacing the explained variables, the negative effect of innovation dilemma on operational efficiency is still significant.

4.3.6. Replace the Time Interval of Sample

The original time interval of sample is 2011—2020, and the paper further revised the interval of sample time to 2011—2018. The robustness results are shown in column (4) of Table 6, and the regression coefficient of innovation dilemma is also negative at the significance level of 1%. The results show that the core conclusion of this paper is still valid.

4.3.7. Lag the Core Explanatory Variable

In this robustness test, the core explanatory variable innovation dilemma (IDLM) is re-estimated with a one-stage lag, and the estimated results are shown in column (5) of Table 6. It can be seen from the results that the regression coefficient of innovation dilemma lag one stage (L.IDLM) is negative at the significance level of 1%. The core conclusions of this paper remain sound.

4.4. Mechanism Analysis

4.4.1. Risk Bearing Capacity

Based on the above analysis, innovation dilemma mainly reduces the enterprise's risk bearing capacity (SOL), and then inhibits the enterprise's operating efficiency. In particular, the measurement index of risk bearing capacity is the ratio of EBITDA (earnings before interest, taxed, depreciation and amortization) to the average balance of liabilities, which can reflect the long-term solvency of enterprises and is also an important indicator to examine the risk bearing capacity of enterprises. The higher the value of this index, the stronger the enterprise's risk bearing ability is. Columns (1)—(3) of Table 7 show the results of the mechanism test for risk bearing capacity. The results show that the regression coefficient of innovation dilemma (IDLM) in column (1) is significantly negative at the level of 1%, indicating that innovation dilemma has a significant negative impact on the risk bearing capacity of enterprises. In column (2), the regression coefficient of risk bearing capacity is significantly positive at the level of 1%, indicating that risk bearing capacity has a significant positive effect on enterprise operating efficiency. Column (3) shows the regression results of Model (3) to test whether enterprise risk bearing capacity can be used as a path. The results show that after adding risk bearing capacity, the significance of innovation dilemma on the regression coefficient of enterprise operational efficiency (ROA) decreases significantly, and the absolute value of the coefficient decreases, which is smaller than the coefficient in baseline regression. The regression coefficient of risk bearing ability on business efficiency is still significantly positive, indicating that the addition of risk bearing ability weakens the impact of innovation dilemma on operating efficiency. In addition, the risk bearing capacity mechanism passed the Sobel test and the Bootstrap test. Specifically, the Z-value obtained by Sobel test is significant, while the confidence interval of indirect effect obtained by Bootstrap test does not contain 0 value. The above test results indicate that risk bearing capacity passes the mechanism test, that is, innovation dilemma acts on the operating efficiency of manufacturing enterprises through risk bearing capacity. In conclusion, the hypothesis H2a in this paper is verified.

4.4.2. Development Capacity Expectation

In the theoretical analysis, it is mentioned that the innovation dilemma can also inhibit the operational efficiency of enterprises through the impact on the development capability expectation (DCE) of enterprises. Specially, the expected index of development ability is the rate of capital preservation and appreciation. This index is the ratio of the total owners' equity at the end of the current period to the beginning of the current period, reflecting the preservation and growth of the capital invested by investors. The value is proportional to the capital preservation status of the enterprise, and a higher value indicates that the capital preservation status of the enterprise is better. Columns (4)—(6) of Table 7 show the results of the mechanism test for developmental capability expectation. The results show that the regression coefficient of innovation dilemma (IDLM) on development capability expectation in column (4) is significantly negative at the level of 5%. In column (5), the regression coefficient of development capability expectation on business efficiency (ROA) is significantly positive at the level of 1%. In addition, the development capability expectation also passed the Sobel test and the Bootstrap test. In conclusion, the hypothesis H2b in this paper is verified.

4.4.3. Profitability

From the theoretical analysis in the section 2 of this paper, the innovation dilemma faced by enterprises will also have a negative effect on the operating efficiency by inhibiting the enterprise’s profitability (PR). The measurement index of profitability is the profit margin before interest and tax, which can reflect the situation of earnings of the enterprise. The larger the index value, the better the profitability is. Columns (1)—(3) of Table 8 show the results of the mechanism test for profitability. The results show that the regression coefficient of innovation dilemma (IDLM) on profitability in column (1) is significantly negative at the level of 5%. The regression coefficient of profitability on business efficiency (ROA) in column (2) is significantly positive at 1% level. Column (3) shows that the absolute value of the regression coefficient of innovation dilemma on business efficiency decreases after the addition of profitability, which is smaller than the coefficient in baseline regression, indicating that the addition of profitability weakens the impact of innovation dilemma on business efficiency. In addition, the profitability has also passed the Sobel test and Bootstrap test. The test results in Table 8 show that innovation dilemma can inhibit the operation efficiency by affecting the profitability of enterprises. In conclusion, the hypothesis H2c in this paper is verified.

4.5. The Heterogeneity Analysis

4.5.1. Firm-Level Heterogeneity Analysis

As for the different ownership structure of enterprises, the innovation dilemma has different level of negative impact on the operating efficiency of enterprises. In Table 9, there is a significant difference between the regression coefficients of state-owned enterprises and private enterprises, and the regression coefficient of private enterprises is negative at the significance level of 1%, while the regression coefficient of state-owned enterprises is not significant. Based on theoretical analysis, due to the relatively insufficient resource endowment and resource access, it’s more difficult for private enterprises to cope with the innovation dilemma, and the operation efficiency of private enterprises will be more affected. In conclusion, the regression results from column (1)—(2) of the Table 9 verified the hypothesis H3a about the heterogeneity of the ownership structure of enterprise.
At the enterprise level, the heterogeneity of firm size is also analyzed. The enterprises in the sample are divided into small and medium-sized enterprises and large enterprises by using the natural logarithm of operating income. The regression coefficients of the two types of enterprises’ operating efficiency (ROA) affected by innovation dilemma (IDLM) are shown in columns (3)—(4) of Table 9. In general, the innovation dilemma has a negative effect on the operating efficiency of the two types of enterprises. The specific comparison shows that the regression coefficient of large enterprises is not significant and greatly different from that of small and medium-sized enterprises, while the regression coefficient of small and medium-sized enterprises is negative at the significance level of 1%, and the absolute value of the coefficient is large.
In addition to the ownership structure and scale of enterprises, the different life cycle of enterprises may also change the impact of innovation dilemma (IDLM) on operational efficiency (ROA). Based on the experience of Dickinson [38], this paper divides the life cycle of an enterprise into start-up stage, growth stage, maturity stage and decline stage according to the positive and negative cash flow data classified by different economic activities. As shown in columns (5)—(8) in Table 9, the innovation dilemma faced by enterprises in the growth period or the development period has the most significant negative effect on the operating efficiency, which passes the significance test of 1%. The second is the enterprises in the recession period, whose regression coefficient is negative at the significance level of 10%. However, for enterprises in the initial and mature stages, the negative effect of innovation dilemma on operating efficiency is not significant. The heterogeneity regression results from Table 9 further verified hypothesis H3a.
Table 9. Firm-level Heterogeneity.
Variable Ownership Structure Firm Size Life Cycle
(1) (2) (3) (4) (5) (6) (7) (8)
State-Owned Non-State-Owned Large Scale Small & Medium Size Start-up Period Growth Period Mature Period Recession Period
IDLM -0.0001 -0.0011*** -0.0002 -0.0011*** -0.0008 -0.0008*** -0.0007 -0.0022*
(-0.45) (-5.40) (-1.11) (-4.13) (0.0005) (0.0002) (0.0006) (0.0013)
SIZE 0.0168*** 0.0204*** 0.0160*** 0.0178*** 0.0179*** 0.0141*** 0.0169*** 0.0140***
(19.70) (30.75) (18.79) (13.51) (0.0016) (0.0007) (0.0018) (0.0041)
AGE -0.0089*** -0.0179*** -0.0107*** -0.0214*** -0.0193*** -0.0186*** -0.0086*** -0.0040
(-4.52) (-16.79) (-9.30) (-16.94) (0.0027) (0.0011) (0.0032) (0.0073)
LEV -0.1770*** -0.1610*** -0.1855*** -0.1531*** -0.1416*** -0.1300*** -0.1774*** -0.1277***
(-36.83) (-45.20) (-48.84) (-36.21) (0.0093) (0.0041) (0.0095) (0.0195)
ATR 0.0068*** 0.0112*** 0.0035** 0.0381*** 0.0094** 0.0092*** 0.0078* 0.0196**
(2.89) (6.90) (2.56) (12.06) (0.0037) (0.0020) (0.0044) (0.0091)
CON 0.0034 0.0478*** 0.0299*** 0.0285*** 0.0027 0.0141** 0.0855*** 0.0657
(0.42) (7.75) (5.22) (3.40) (0.0172) (0.0061) (0.0178) (0.0436)
ID -0.0571*** -0.0208* -0.0358*** -0.0238* -0.0321 -0.0067 -0.0766** -0.0776
(-3.75) (-1.95) (-3.18) (-1.80) (0.0289) (0.0109) (0.0303) (0.0672)
HHI -0.0045 -0.0486*** -0.0221** -0.0327*** 0.0091 -0.0387*** -0.0453* -0.0586
(-0.35) (-5.02) (-2.28) (-2.68) (0.0242) (0.0094) (0.0267) (0.0677)
Constant -0.2181*** -0.2933*** -0.1938*** -0.2456*** -0.2530*** -0.1655*** -0.2204*** -0.2043**
(-12.69) (-21.66) (-11.00) (-9.19) (0.0330) (0.0138) (0.0375) (0.0828)
Year FE YES YES YES YES YES YES YES YES
Province FE YES YES YES YES YES YES YES YES
N 3,699 9,082 6,390 6,391 1,442 4,457 1,283 315
R2 0.3392 0.3060 0.3384 0.3170 0.2780 0.3389 0.3296 0.3420
Notes: t statistics in parentheses; ***, **, and * indicate significance at the 1%, 5%, and 10% statistical levels, respectively.

4.5.2. Industry-Level Heterogeneity

According to the type of manufacturing industry, enterprises can be divided into high-tech enterprises and non-high-tech enterprises. Columns (1)—(2) of Table 10 show that the innovation dilemma (IDLM) of high-tech enterprises and non-high-tech enterprises has a large difference in the regression results of business efficiency (ROA). Specifically, the regression coefficient of high-tech enterprises is significantly negative at the significance level of 1%, while the regression coefficient of non-high-tech enterprises is not significantly positive. Combined with the theoretical analysis, the high-tech industry faces more serious pressure of technological change, and technological innovation is the main competitiveness of enterprises in this field. Therefore, compared with non-high-tech enterprises, technological innovation has a more significant impact on the operating efficiency of high-tech enterprises. The regression results in Table 10 confirm the hypothesis H3b.

4.5.3. Regional Heterogeneity

According to the different regions of the enterprises, the enterprises in the sample are divided into enterprises in the central & western regions and enterprises in the eastern region. Columns (3)—(4) of Table 10 show that the innovation dilemma of enterprises (IDLM) in different regions has a significantly negative impact on business efficiency (ROA). In detail, the enterprises located in the eastern region passed the significance test at the 1% level, while the central and western regions passed the significance test at the 5% level. In contrast, enterprises located in the eastern region face innovation difficulties, which have a more significant impact on operating efficiency. The heterogeneity regression results in Table 10 confirm the hypothesis H3c.

5. Discussion and Conclusion

5.1. Discussion

In recent years, in the context of the continuous fierce competition in technological innovation, the complexity of the global technological innovation environment has been increasing and impacting on China’s manufacturing industry, and the innovation situation faced by Chinese manufacturing enterprises has gradually become the focus of attention. The innovation dilemma is a situation that manufacturing enterprises are unwilling to face, as it is an important factor that is not conducive to risk-taking, sustainable development, and sustainable operation. In this context, the efficiency of enterprise operation, as an important indicator to measure the operational status of enterprises, has attracted the attention of scholars and practitioners in its relationship with innovation dilemma.
This article puts the innovation status of enterprises in the context of the resurgence of international technology protectionism. This article uses data from Chinese A-share listed manufacturing companies from 2011 to 2020, and based on theoretical analysis, empirically verifies the relationship between innovation difficulties and operational efficiency of manufacturing companies.
The conclusions are as follows. Firstly, the innovation dilemma can have negative effects on the operational efficiency of enterprises. This article solves endogeneity problems through instrumental variable method and propensity score matching method. Robustness testing includes methods such as adding macro level control variables, changing the parameters of the measured dependent variable, and replacing sample time intervals. Secondly, the impact of innovation dilemma on business efficiency can be achieved through three paths, include reducing a company’s risk-taking ability, development ability expectations, and profitability. In addition, the inhibitory effect of innovation dilemma on operational efficiency of enterprises is more pronounced in private enterprises, small and medium-sized enterprises, ascend or decline period enterprises, high-tech enterprises and enterprises in the eastern region.
However, there are several limitations that need to be improved in this article. Firstly, due to data limitations, indicators for measuring the operational efficiency of manufacturing enterprises may need improvement. Currently, a large number of researchers use the DEA method and Tobit model to calculate and evaluate operational efficiency. Future research can improve operational efficiency indicators and use them to study the impact of technological innovation on manufacturing enterprises. There is also room for improvement in the indicators of innovation dilemma, and future research can be calculated from basic data other than innovation output. Secondly, based on this article’s analysis of provincial-level administrative regions in China in this article, the future innovation difficulties are still some topics worth paying close attention to. For example, the factors and paths that lead to enterprises falling into innovation difficulties, and the impact of innovation difficulties on other aspects of the enterprise. Thirdly, the differences in innovation dilemmas among enterprises in different regions are currently quite evident. Future research can conduct specific analysis based on regional differences, which can help regions to address innovation dilemmas in a targeted manner, narrow the gap in technological innovation development across regions, and provide theoretical and data support for the high-quality development of China’s manufacturing industry. Finally, future research can delve deeper into the unresolved issues mentioned above. We can gain a more comprehensive understanding of the relationship between technological innovation and enterprises, which can contribute to the improvement of technological innovation level and the high-quality development of manufacturing industry. Against the backdrop of the continuous improvement of global technological level, the importance of technological innovation for the development of enterprises is self-evident. The innovation status of enterprises still needs further research in the future, and the changes in the innovation situation and technological breakthroughs of manufacturing enterprises, regions, and even countries require long-term planning and sustained efforts.

5.2. Conclusion

Based on the research findings of this article, governments and businesses can refer to the following policy recommendations.
The innovation situation of manufacturing enterprises has a negative impact on their survival and development. In order to strengthen the high-quality development of the manufacturing industry, it is necessary to pay attention to the innovation situation of manufacturing enterprises. There is a significant gap in the level of innovation dilemma among different regions in China, and there is still room for improvement in the level of technological innovation in some regions. The government should relax the policy of talent introduction and provide good and fair employment opportunities for skilled and capable talents. In addition, providing monetary and fiscal policy support for enterprise technological innovation, especially for private enterprises and small and medium-sized enterprises, helps these enterprises break through innovation bottlenecks, reduce innovation difficulties, and reduce the negative impact on the survival and development of enterprises by developing their risk tolerance, development ability, and profitability, thereby improving the survival rate of private enterprises and small and medium-sized enterprises.
Based on heterogeneity analysis, targeted support plans should be developed and implemented for enterprises with different property rights, scales, and life-cycles, with a focus on high-tech enterprises and strengthening talent and funding investment in high-precision and cutting-edge fields. Accelerate the establishment of Innovation Industrial Cluster in the central and western regions, narrow the gap in technological innovation levels, and promote balanced and high-quality development of China's manufacturing industry.
Author Contributions

Conceptualization, Y.S. and Y.Y.; methodology, Y.S.; software, Y.Y.; validation, Y.S.; formal analysis, Y.S. and Y.Y.; investigation, Y.Y.; resources, Y.S.; data curation, Y.S. and Y.Y.; writing---original draft preparation, Y.Y.; writing---review and editing, Y.S.; visualization, Y.S. and Y.Y.; supervision, Y.S.; project administration, Y.S.; funding acquisition, Y.S. All authors have read and agreed to the published version of the manuscript.

Funding

This research was funded by the National Social Science Fund of China (Grant No. 19BJL048). The authors declare that they have no relevant or material financial interests that relate to the research described in this paper.

Data Availability Statement

Not applicable.

Conflicts of Interest

The authors declare no conflict of interest.

References

  1. Maclsaac, S.; Duclos, B.C. Trade and conflict: Trends in economic nationalism, unilateralism and protectionism. Canadian Foreign Pol. 2020, 26, 1-7. [CrossRef]
  2. O’Rourke, K.H. Economic history and contemporary challenges to globalization. J. Econ. Hist. 2019, 79, 356-382. [CrossRef]
  3. Tolkachev, S.; Teplyakov, A. Technological and regulatory cycles in world economic development: Historical and economic retrospective. Terra Econ. 2022, 20, 72-86. [CrossRef]
  4. Wang, Y.Z. New regionalism reshaping the future of globalization. China Quart. Int. Strateg. Stud. 2020, 6, 249-265. [CrossRef]
  5. Lv, K.J.; Ndiaya, C.; Zheng, X.S. Key factors influencing manufacturing firm’s innovation in a developing country: Senegal as sample. Transform. Bus. Econ. 2018, 17, 366-378.
  6. Xie, X.M.; Zeng, S.X.; Peng, Y.F.; Tam, C.M. What affects the innovation performance of small and medium-sized enterprises in China? Innov. Organ. Manage. 2013, 15, 271-286. [CrossRef]
  7. Zhao, M.S.; Yuan, F.Y. The top management team and enterprise innovation: An empirical study from growth enterprise market listed companies in China. Manag. Decis. Econ. 2022, 43, 2066-2082. [CrossRef]
  8. Avenyo, E.K.; Kracmcr-Mbula, E. Innovation and the performance of informal enterprises in developing countries: A gender perspective. Int. J. Gend. Entrep. 2021, 13, 277-301. [CrossRef]
  9. Jiao, H.; Koo, C.K.; Cui,Y. Legal environment, government effectiveness and firms’ innovation in China: Examining the moderating influence of government ownership. Technol. Forecast. Soc. 2015, 96, 15-24. [CrossRef]
  10. Gu, Y.Z.; Hu, L.Y.; Hou, C.X. Leveraging diverse ecosystem partners for innovation: The roles of regional innovation environment and partnership heterogeneity. Econ. Res. Ekon. Istraz. 2023, 36, 1167-1186. [CrossRef]
  11. Han, Y.; Pan, C.; Jin, F.J. Does the improvement of the business environment improve the innovation efficiency of enterprises? Evidence from the Listed Companies in China. Sustainability 2023, 15, 11424. [CrossRef]
  12. Ju, S.M.; Xie, J.; Tang, H.L. The impact of competition on operational efficiency of ports: Empirical evidence from Chinese coastal port-listed companies. Res. Transp. Bus. Manag. 2023, 46, 100939. [CrossRef]
  13. Yu, Y.B.; Du, Y.C.; Gao, Y. Evaluation of the operational efficiency of listed LED lighting industry of China based on DEA model. Light Eng. 2016, 24, 161-165.
  14. Zheng, Y.; Luo, M. Enhancing operating efficiency in China’s high-end equipment manufacturing industry: Insights from listed enterprises. Sustainability 2023, 15, 8694. [CrossRef]
  15. Aroul, R.R.; Sabherwal, S.; Villupuram, S.V. ESG, operational efficiency and operational performance: Evidence from real estate investment trusts. Manag. Financ. 2022, 48, 1206-1220. [CrossRef]
  16. Kortmann, S.; Gelhard, C.; Zimmermann, C.; Piller, F.T. Linking strategic flexibility and operational efficiency: The mediating role of ambidextrous operational capabilities. J. Oper. Manag. 2014, 32, 475-490. [CrossRef]
  17. Chen, Y.; Lin, B.; Lu, L.Z.; Zhou, G.G. Can internal audit functions improve firm operational efficiency? Evidence from China. Manag. Audit. J. 2020, 35, 1167-1188. [CrossRef]
  18. Huong, L.L.T.; Do, V.; Thu, H.T.T. Impact of cash flow on firm’s operational efficiency in Vietnam: Mediation role of state ownership. J. Organ. Behav. Res. 2022, 7, 30-47. [CrossRef]
  19. Lian, Y.L.; Zheng, W.W.; Gao, H. Strategic response of manufacturing enterprises under innovation dilemma: A study based on the expected gap of innovation performance and responsive search behavior. China Ind. Econ. 2023, 08, 174-192.
  20. Anselin, L. Local indicators of spatial association-LISA. Geogr. Anal. 1995, 27, 93-115. [CrossRef]
  21. Zhang, P.; Wang, J. Factors influencing the spatial distribution of high-tech industry development and regional differences: A spatial econometric analysis based on 21 prefecture level cities in Guangdong Province. J. S. China Univ. Technol. 2015, 17(03), 27-36.
  22. Zhang, H.; Aumeboonsuke, V. Technological innovation, risk-taking and firm performance-Empirical evidence from Chinese listed companies. Sustainability 2022, 14, 14688. [CrossRef]
  23. Woo, W.T. China’s soft budget constraint on the demand-side undermines its supply-side structural reforms. China Econ. Rev. 2019, 57, 101111. [CrossRef]
  24. Tian, W.; Xu, Z.X.; Yu, M.J.; Zhu, H.H. China’s free trade ports: Effective action against the threat of de-globalization. China World Econ. 2018, 24, 62-81. [CrossRef]
  25. Ajupov, A.A.; Kurilova, A.A.; Evstigneeva, O.A. Tactics of forming a system of financial indicators of the enterprises in the operational aspects. Mediterr. J. Soc. Sci. 2015, 6, 55-60. [CrossRef]
  26. Chen, Z.Y. Research on accounting intelligence system modeling of financial performance evaluation. Secur. Commun. Netw. 2021, 2021, 5550382. [CrossRef]
  27. Tsai, H.F.; Luan, C.J. What makes firms embrace risks? A Risk-taking Capability Perspective. Bus. Res. Q. 2016, 19, 219-231. [CrossRef]
  28. Zhang, X.Y.; Chen, M.Y.; Zhang, Y.Y.; Yang, J.Z.; Chen, Y.C. Research on the impact of market competition on science and technology innovation investment of forestry listed enterprises: Heterogeneity analysis based on financing constraint theory. Resour. Dev. Mark. 2023, 39 (12), 1653-1659.
  29. Liu, Z. Research on the influencing factors and evaluation of the development capacity of high-tech enterprises in Heilongjiang Province. Harbin Eng. Univ. 2018.
  30. Sun, Y.L. Application analysis of financial indicators in enterprise performance evaluation and management. Bus. News 2023, 20, 50-53.
  31. Li, X.; Xu, Q.; Guo, F.; Wang, H.C. State-owned equity participation and private sector enterprises’ strategic risk taking: Evidence from China. Manag. Des. Econ. 2023, 44, 1107-1124. [CrossRef]
  32. Dickinson, V. Cash flow patterns as a proxy for firm life cycle. Account. Rev. 2011, 86, 1969-1994. [CrossRef]
  33. Huo, Z.Y. The impact of entry barriers on industrial performance: An empirical analysis based on China’s high tech Industries. North. Econ. Trade J. 2023, 11, 43-46.
  34. Luo, Y.; Cao, L.L. Empirical study on the trend of agglomeration degree in China’s manufacturing industry. Econ. Res. 2005, 08, 106-115+127.
  35. He, W.D.; Lin, Z.F.; Hao, R. Analysis of regional competitiveness in the high-tech industry. Curr. Sci. 2018, 114, 854-860. [CrossRef]
  36. Jiang, C.Y. Research on the construction of innovation capability evaluation index system. Times Financ. 2016, 02, 171.
  37. Giannetti, M.; Liao, G.; Yu,X. The brain gain of corporate boards: Evidence from China. J. Financ. 2015, 70, 1629-1682. [CrossRef]
  38. Dickinson, V. Cash Flow Patterns as a Proxy for Firm Life Cycle. Account. Rev. 2011, 86, 1969-1994. [CrossRef]
  39. Chen, Z.Q. Research on Sustainable Development Capability of Enterprises from a Financial Perspective. Ind. Technol. Forum 2023, 22 (18), 17-18.
  40. Liu, Q. Where is the way to allocate financial resources for enterprises? Chin. Bus. 2024, 01, 243-245.
Figure 1. The Regional Distribution of Innovation Dilemmas of Chinese A-share Manufacturing Listed Companies in 2012.
Preprints 104151 g001
Figure 2. The Regional Distribution of Innovation Dilemmas of Chinese A-share Manufacturing Listed Companies in 2020.
Preprints 104151 g002
Figure 4. The steps of calculating the innovation dilemma (IDLM).
Preprints 104151 g004
Table 1. Evaluation index system for innovation capability of firms (IV).
Primary Indicators Secondary Indicators
Innovation Investment Capacity X1 The proportion of technical personnel to the total number of employees X11
Research and development expense ratio X12
Innovation Management Capacity X2 The proportion of administrative staff to the total number of employees X21
Management expense rate X22
Innovation Marketing Capacity X3 The proportion of sales staff to the total number of employees X31
Sales expense rate X32
Innovation Output Capacity X4 Per capita number of invention patent applications authorized X41
The growth rate of revenue X42
Table 3. Descriptive statistics.
Variable N Mean Min Median Max Sd
ROA 12,781 0.037 -1.220 0.037 0.206 0.064
IDLM 12,781 3.029 0 2.289 12.889 3.026
SIZE 12,781 21.442 19.007 21.325 24.320 1.264
AGE 12,781 2.241 0.693 2.303 3.466 0.697
LEV 12,781 0.407 0.053 0.396 1.270 0.195
ATR 12,780 0.631 0.001 0.554 7.609 0.406
CON 12,781 0.151 0.014 0.125 0.563 0.103
ID 12,781 0.376 0.182 0.333 0.800 0.055
HHI 12,781 0.079 0.015 0.065 1 0.062
Table 4. Impact of innovation dilemma on operating efficiency.
Variable (1) (2) (3)
ROA ROA ROA
IDLM -0.0009*** -0.0008*** -0.0008***
(0.0002) (0.0002) (0.0002)
SIZE 0.0190*** 0.0192*** 0.0191***
(0.0005) (0.0005) (0.0005)
AGE -0.0173*** -0.0174*** -0.0169***
(0.0008) (0.0008) (0.0008)
LEV -0.1680*** -0.1691*** -0.1680***
(0.0028) (0.0028) (0.0029)
ATR 0.0103*** 0.0098*** 0.0095***
(0.0013) (0.0013) (0.0013)
CON 0.0266*** 0.0264*** 0.0272***
(0.0048) (0.0048) (0.0049)
ID -0.0346*** -0.0325*** -0.0320***
(0.0087) (0.0087) (0.0087)
HHI -0.0333*** -0.0319*** -0.0316***
(0.0077) (0.0077) (0.0078)
Constant -0.2560*** -0.2595*** -0.2589***
(0.0103) (0.0103) (0.0104)
Year FE NO YES YES
Province FE NO NO YES
N 12,780 12,780 12,780
R2 0.3026 0.3063 0.3113
Notes: Standard errors in parentheses. The symbols*, **and ***represent for the levels of significance at the 10%, 5%and 1%levels, respectively. This note applies to the following tables.
Table 5. Robustness test regression results 1.
Variable (1) (2) (3) (4)
IDLM ROA ROA ROA
IV -6.2854***
(0.8902)
IDLM -0.0096*** -0.0007** -0.0008***
(0.0030) (0.0004) (0.0002)
SIZE 0.0323 0.0193*** 0.0682*** 0.0191***
(0.0274) (0.0006) (0.0027) (0.0005)
AGE 1.0735*** -0.0075** -0.0078 -0.0169***
(0.0433) (0.0033) (0.0057) (0.0008)
LEV 0.6058*** -0.1613*** -0.2599*** -0.1682***
(0.1503) (0.0039) (0.0098) (0.0029)
ATR -0.6556*** 0.0051** -0.0171*** 0.0095***
(0.0699) (0.0024) (0.0054) (0.0013)
CON -1.1449*** 0.0169*** 0.1121*** 0.0273***
(0.2545) (0.0064) (0.0267) (0.0049)
ID 0.7924* -0.0246** -0.0144 -0.0319***
(0.4556) (0.0099) (0.0223) (0.0087)
HHI -1.6801*** -0.0432*** 0.0262 -0.0316***
(0.4101) (0.0094) (0.0301) (0.0078)
GDP 0.0158**
(0.0068)
SIR 0.0001
(0.0002)
Constant 0.3148 -1.2932*** -0.4327***
(0.5521) (0.0561) (0.0728)
Year FE YES YES YES YES
Province FE YES YES YES YES
Cragg-Donald Wald F statistic 49.857
Observations 12,781 12,781 7,290 12,770
R2 0.1648 0.1386 0.2262 0.3118
Table 6. Robustness test regression results 2.
Variable (1) (2) (3) (4) (5)
ROA ROA CAT ROA ROA
IDLM -0.0235*** -0.0011***
(0.0015) (0.0002)
IDLM_4 -0.0008***
(0.0002)
IDLM_6 -0.0008***
(0.0002)
L.IDLM -0.0008***
(0.0002)
SIZE 0.0191*** 0.0191*** 0.0538*** 0.0183*** 0.0197***
(0.0005) (0.0005) (0.0048) (0.0006) (0.0006)
AGE -0.0169*** -0.0170*** 0.1045*** -0.0160*** -0.0173***
(0.0009) (0.0008) (0.0077) (0.0009) (0.0011)
LEV -0.1681*** -0.1680*** 0.1640*** -0.1607*** -0.1720***
(0.0029) (0.0029) (0.0260) (0.0032) (0.0034)
ATR 0.0095*** 0.0095*** 1.5671*** 0.0077*** 0.0100***
(0.0013) (0.0013) (0.0123) (0.0014) (0.0016)
CON 0.0273*** 0.0274*** 0.0174 0.0182*** 0.0311***
(0.0049) (0.0049) (0.0445) (0.0055) (0.0058)
ID -0.0320*** -0.0321*** 0.3036*** -0.0379*** -0.0319***
(0.0087) (0.0087) (0.0795) (0.0099) (0.0102)
HHI -0.0319*** -0.0318*** -0.1722** -0.0295*** -0.0392***
(0.0078) (0.0078) (0.0709) (0.0086) (0.0093)
Constant -0.2588*** -0.2585*** -1.2780*** -0.2410*** -0.2708***
(0.0104) (0.0104) (0.0951) (0.0118) (0.0123)
Year FE YES YES YES YES YES
Province FE YES YES YES YES YES
N 12,780 12,780 12,780 9,190 9,775
R2 0.3112 0.3111 0.6772 0.3265 0.2946
Table 7. Analysis of the mechanism of action 1.
Variable Risk Bearing Capacity Development Capacity Expectation
(1) (2) (3) (4) (5) (6)
SOL ROA ROA DCE ROA ROA
IDLM -0.0083*** -0.0002 -0.0062** -0.0008***
(0.0011) (0.0001) (0.0030) (0.0002)
SOL 0.0789*** 0.0788***
(0.0011) (0.0011)
DCE 0.0064*** 0.0063***
(0.0005) (0.0005)
SIZE 0.0567*** 0.0144*** 0.0144*** 0.0830*** 0.0184*** 0.0185***
(0.0034) (0.0005) (0.0005) (0.0093) (0.0005) (0.0005)
AGE -0.0766*** -0.0110*** -0.0109*** -0.1611*** -0.0168*** -0.0159***
(0.0056) (0.0007) (0.0007) (0.0151) (0.0008) (0.0008)
LEV -1.2640*** -0.0682*** -0.0682*** -0.4533*** -0.1655*** -0.1649***
(0.0188) (0.0028) (0.0028) (0.0510) (0.0029) (0.0029)
ATR 0.0214** 0.0089*** 0.0088*** -0.1284*** 0.0112*** 0.0107***
(0.0088) (0.0011) (0.0011) (0.0239) (0.0013) (0.0013)
CON 0.1611*** 0.0148*** 0.0146*** -0.3472*** 0.0302*** 0.0293***
(0.0321) (0.0042) (0.0042) (0.0865) (0.0048) (0.0048)
ID -0.1339** -0.0217*** -0.0215*** -0.0828 -0.0322*** -0.0315***
(0.0575) (0.0074) (0.0075) (0.1549) (0.0087) (0.0087)
HHI -0.3171*** -0.0069 -0.0071 -0.2119 -0.0294*** -0.0304***
(0.0513) (0.0066) (0.0066) (0.1380) (0.0077) (0.0077)
Constant -0.1475** -0.2442*** -0.2443*** 0.1607 -0.2583*** -0.2586***
(0.0687) (0.0089) (0.0089) (0.1856) (0.0104) (0.0104)
Sobel Z -8.695*** -3.524***
Bootstrap [95% confi.interval] (ind_eff) [-0.0009, -0.0006] [-0.0001, -0.0000]
Year FE YES YES YES YES YES YES
Province FE YES YES YES YES YES YES
N 12,781 12,781 12,781 12,772 12,772 12,772
R2 0.3409 0.4980 0.4981 0.0397 0.3179 0.3191
Table 8. Analysis of the mechanism of action 2.
Variable Profitability
(1) (2) (3)
PR ROA ROA
IDLM -0.0025** -0.0007***
(0.0013) (0.0002)
PR 0.0539*** 0.0538***
(0.0011) (0.0011)
SIZE 0.0589*** 0.0157*** 0.0157***
(0.0039) (0.0005) (0.0005)
AGE -0.0439*** -0.0153*** -0.0145***
(0.0063) (0.0008) (0.0008)
LEV -0.4137*** -0.1461*** -0.1456***
(0.0211) (0.0027) (0.0027)
ATR -0.0497*** 0.0136*** 0.0132***
(0.0099) (0.0012) (0.0012)
CON 0.0049 0.0278*** 0.0270***
(0.0361) (0.0045) (0.0045)
ID -0.1660** -0.0237*** -0.0232***
(0.0646) (0.0080) (0.0080)
HHI -0.1675*** -0.0222*** -0.0231***
(0.0576) (0.0071) (0.0071)
Constant -0.8012*** -0.2125*** -0.2128***
(0.0772) (0.0096) (0.0096)
Sobel Z -3.557***
Bootstrap [95% confi.interval] (ind_eff) [-0.0004, -0.0000]
Year FE YES YES YES
Province FE YES YES YES
N 12,781 12,781 12,781
R2 0.0494 0.4204 0.4213
Table 10. Industrial and Regional Heterogeneity.
Industry-Level Region-Level
(1) (2) (3) (4)
High-tech Enterprises Non-High-tech
Enterprises
Midwest East
IDLM -0.0012*** 0.0004 -0.0009** -0.0008***
(-5.97) (0.99) (-2.49) (-4.29)
SIZE 0.0181*** 0.0189*** 0.0183*** 0.0192***
(27.79) (21.06) (18.78) (31.04)
AGE -0.0174*** -0.0149*** -0.0137*** -0.0182***
(-16.67) (-10.13) (-7.98) (-18.58)
LEV -0.1693*** -0.1636*** -0.1749*** -0.1643***
(-48.41) (-33.00) (-32.80) (-48.40)
ATR 0.0279*** 0.0021 0.0079*** 0.0113***
(12.83) (1.24) (2.94) (7.33)
CON 0.0279*** 0.0233*** 0.0233** 0.0290***
(4.66) (2.75) (2.46) (5.12)
ID -0.0359*** -0.0135 -0.0250 -0.0352***
(-3.38) (-0.88) (-1.44) (-3.49)
HHI -0.0361*** 0.0048 -0.0193 -0.0378***
(-3.27) (0.38) (-1.27) (-4.19)
Constant -0.2434*** -0.2718*** -0.2495*** -0.2606***
(-18.90) (-14.89) (-12.74) (-21.13)
Observations 8,813 3,968 3,622 9,159
R-squared 0.3291 0.3219 0.3220 0.3054
Year FE YES YES YES YES
Province FE YES YES YES YES
Disclaimer/Publisher’s Note: The statements, opinions and data contained in all publications are solely those of the individual author(s) and contributor(s) and not of MDPI and/or the editor(s). MDPI and/or the editor(s) disclaim responsibility for any injury to people or property resulting from any ideas, methods, instructions or products referred to in the content.
Copyright: This open access article is published under a Creative Commons CC BY 4.0 license, which permit the free download, distribution, and reuse, provided that the author and preprint are cited in any reuse.
Prerpints.org logo

Preprints.org is a free preprint server supported by MDPI in Basel, Switzerland.

Subscribe

© 2024 MDPI (Basel, Switzerland) unless otherwise stated