1. Introduction
The remarkable economic progress and population growth in megacities are a foothold for one critical challenge: an increasing number of cars and no parking space. The severe imbalance between the parking supply and demand cascade into numerous constraints of urban mobility. Traffic congestion is one of the persisting problems of contemporary metropolises where vehicles have to spend excessive time to find a parking site. According to the study conducted by INRIX and cited in the article in USA Today, the drivers may waste 17-107 hours a year in search for parking sites [
1]. It is calculated that a US driver spends approximately
$345-2,243 on fuel, emissions and time loss in search for parking. In sum up, the estimated price for the USA is annually
$73 billion [
2]. It manifests in vehicles’ gridlock, lost man-days due to inefficiency, and decrease of the general quality of life.
This study proposes the implementation of a Smart Parking Management System (SPMS) as a technology-driven solution to address these critical challenges. The SPMS would leverage cutting-edge object detection AI models to ensure efficient parking detection and functionality. This research endeavor will analyze the system’s performance with respect to efficiency, accuracy, and its ability to function effectively in real-world conditions, including variations in ambient lighting.
Overall, this study will compare the proposed system’s performance in the above mentioned axes. The multifaceted solution will help to ensure the ease of traffic management by reducing the search time and increasing the capacity of the used parking space. Moreover, the money obtained from parking services may be an additional source of revenue for the city authorities to invest in new parking spaces.
2. Literature Review
This section reviews recent advancements in smart parking management systems, focusing on automated parking time violation tracking and vehicle detection algorithms.
Several studies propose innovative solutions to address parking challenges. One approach utilizes YOLOv8 [
3] for accurate vehicle detection, coupled with DeepSORT [
4] [
5] or OC-SORT [
6] for robust multi-object tracking. DeepSORT exhibits exceptional accuracy across diverse datasets, while OC-SORT excels in scenarios with minimal variations. These findings provide valuable insights for selecting algorithms based on specific parking lot requirements. Future research directions include customizing training data to enhance detection accuracy and exploring synchronization of algorithms across multiple cameras for comprehensive monitoring of large parking areas [
7]. Additionally, advancements in detection architectures, such as the improved YOLOv5 [
8], demonstrate promising performance with high mean Average Precision (mAP), facilitating real-time deployments [
9]. Further research is recommended to optimize detection for smaller vehicles and compare the efficiency of YOLOv5 with YOLOv8 for optimal selection.
Implementing smart parking systems offers numerous benefits, as it may potentially decrease the ecological problems in parking and areas adjacent to them, since it helps decrease vehicle ‘ search time. In addition, it deals with a load of vehicle emission. However, the development of future studies is relevant and may focus on their customization and diversified data as well as across-multiple cameras notification [
10].
This review highlights the significant progress in smart parking management systems, particularly in utilizing advanced detection and tracking algorithms. These advancements pave the way for cost-effective, scalable solutions with the potential to generate substantial economic and environmental benefits. Future research should focus on customization, multi-camera integration, and robust training data to further optimize these systems for real-world applications [
11].
3. Limitations of Existing Research
One of the most important and urgent problems in modern research activities and product design is the lack of research focused on the relationship between model complexity, pre-processing techniques, and their influence on the performance of the designed system, especially in devices with scant resources for deployment. While smart parking systems based on YOLO [
12] object detection is a significant achievement, there is a current research gap regarding the trade-off between model complexity; the use of some pre-processing techniques, like luminosity balancing; and the performance of the system. The existing sources cover on limited exploration of the influence of YOLOv8 variants on smart parking systems; the problem of the influence of pre-processing methods on license plate recognition ; and a limited scope of lighting variations in the research.
3.1. Research Gaps
3.1.1. Limited Exploration of YOLOv8 Variant Trade-offs
While the problem of the use of YOLOv8 variants in smart parking has been every time studied from the perspective of its accuracy in terms of vehicle detection, other variants of YOLOv8, like nano, have been not researched. A complete evaluation of all YOLOv8 variants in terms of their application in resource-limited smart parking systems is needed to define the optimal model in terms of a trade-off between accuracy and inference speed.
3.1.2. Uncertain Impact of Pre-processing on License Plate Detection
While some researchers state that there was a stated need for the use of pre-processing techniques, like luminosity balancing, applied to YOLOv8 in terms of plate recognition, there is a limited exploration of what is the influence of its use on License Plate Detection performance. An investigation into these relationships is critically needed for the purpose of optimizing the pre-processing pipeline.
3.1.3. Limited Scope of Lighting Variation
The conduction of the experiments below has the limitation of the absence of the study of YOLOv8 variants application across a broad range of lighting variations. No mobile hardware specifically designed for a certain smart parking model was used.
3.2. Bridging Gaps
3.2.1. Evaluating All YOLOv8 Variants:
Multiple Criteria Decision Making techniques will be used to evaluate all YOLOv8 variants, like nano, small, medium, large, less available than small or typically-used nano, and vise versa, in terms of their application for vehicle detection and LPR. The result of the research will allow the identification of the optimal model and its variant that can be used in resource-limited smart parking.
3.2.2. Applying Pre-processing techniques for OCR enhancement
The impact of pre-processing techniques, such as luminosity balancing [
13] and DPI enhancement [
13], on improving the accuracy of OCR will be assessed.
3.2.3. Analyzing Performance under Varying Lighting Conditions
The most optimal YOLOv8 combinations, identified through Multi-Criteria Decision Making (MCDM) techniques, will be further evaluated under various lighting intensities (lux). This will ensure the system’s efficacy and robustness across diverse real-world parking environments.
By addressing these research gaps, this study will contribute to the development of more efficient and adaptable smart parking systems that are optimized for resource-constrained devices and perform effectively under a wider range of lighting conditions, ultimately leading to a more robust and practical implementation of smart parking solutions.
4. Methodology
As shown in
Figure 1, the execution of the proposed approach requires a robust methodology in order to facilitate the required functioning.
The task of this research is to conduct a profound analysis of different configurations of the YOLOv8 models to optimize vehicle and license plate recognition in the smart parking system. Herein, to ensure maximum feasibility of the project, several vital stages of work have been followed, with each stage being organized in accordance with the core principles of cogent research.
4.1. Datasets Acquisition
4.1.1. Vehicle Dataset [14]:
The car detection model undergoes training using an extensive dataset comprising 15,322 images annotated in the YOLOv8 format. This format provides essential bounding boxes and class labels for each object within the images, enabling the model to effectively discern the unique visual attributes of cars. To ensure consistent image representation and optimize training efficiency, we implement a pre-processing pipeline.
This pre-processing pipeline consists of several critical steps:
EXIF Data Removal and Auto-Orientation: Initially, the image pixel data undergoes automatic orientation correction based on embedded EXIF information. Subsequently,the EXIF data itself is removed to ensure that the model focuses solely on the image content, minimizing the potential inconsistencies.
Uniform Resizing (Stretch): All images are uniformly resized to a standardized dimension of 640x640 pixels using a stretching approach. This standardization ensures compatibility with the YOLOv8 model architecture and facilitates efficient processing during the training phase.
-
Data Augmentation for Enhanced Generalizability: In this project, following data augmentation techniques were utilized on each source image, resulting in the creation of three additional augmented variations:
- -
Random Cropping (0-15%): This technique simulates potential variations in object positioning within the frame by randomly cropping a small portion (0-15%) of the image from various locations.
- -
Random Brightness Adjustment (+/- 9%): Controlled variations in lighting conditions are introduced through brightness adjustments of +/- 9%, enhancing the model’s performance in real-world scenarios with diverse lighting environments.
- -
Random Gaussian Blur (0-2.5 Kernel Size): To simulate slight out-of-focus effects encountered during real-world car detection tasks, a random Gaussian blur with a kernel size varying between 0 and 2.5 pixels is applied.
Following the comprehensive pre-processing pipeline, the dataset undergoes division into training (88%), testing (8%), and validation (4%) sets.
4.1.2. License Plate Dataset [15]:
This project relies on a specialized dataset comprising 12,884 images for training and testing purposes. These images encompass feature annotated license plates in the YOLOv8 format. Such annotation facilitates the YOLOv8 models in discerning the distinct visual attributes of license plates from the background.
The pre-processing pipeline for this dataset comprises the following steps:
EXIF-based Auto-Orientation and Removal: Automatic orientation correction of image pixel data is performed based on embedded EXIF metadata. This guarantees consistent image presentation and eliminates potential discrepancies arising from varied camera orientations.
Uniform Resizing (Stretch): All images are uniformly resized to a standardized dimension of 640x640 pixels using a stretching method. This standardization ensures compliance with the input requisites of the YOLOv8 model architecture and enhances processing efficiency during training.
-
Data Augmentation for Enhanced Generalizability: Data augmentation techniques are employed to expand the dataset artificially and bolster the robustness of the YOLOv8 models. This involves generating additional variations of each source image to increase training data diversity. Three specific random augmentation techniques are applied to create three additional augmented versions for each image:
- -
Random Cropping (0-30%): A random portion (0-30% of the total image area) is cropped from various locations within the image, encouraging the model to focus on central objects and relevant image regions.
- -
Random Brightness Adjustment (±21%): Image brightness is randomly adjusted by altering pixel intensity values within a range of -21% to +21% relative to the original image, broadening the model’s adaptability to diverse lighting environments.
- -
Random Gaussian Blur (0-2.5 pixels): A Gaussian blur filter with a randomly chosen kernel size between 0 and 2.5 pixels is applied to the image, enhancing the model’s ability to handle variations in image quality during real-world deployments.
Following pre-processing and augmentation, the dataset is divided into training, testing, and validation sets. An 82% serves as the training set, while the remaining 18% is split into a 16% test set and a 2% validation set.
4.2. YOLOv8 Model Selection and Training Regimen
The next part of our study covers the selection, as well as the training, of four types of YOLOv8, which are nano, small, medium, and large. All four variants receive individual training using a relevant dataset. In particular, the vehicle dataset is used to provide training for the vehicle detection model, and the license plate model is trained with the help of a license plate dataset.
4.3. System Design and Pre-processing Techniques
At the core of our approach is development of a sophisticated system architecture, which involve a two-stage object detection system: The former encompasses an extracted Region of Interest on which a vehicle is detected. Subsequently, the extracted ROI then pass through a license plate recognition model. The detected license plate is then subject to several preprocessing steps, to further improve the accuracy of the Tesseract OCR Engine [
16]. It is worth noting that OpenCV [
17] library facilitates the luminosity balancing, which allows for consistent lighting condition. Additionally, the resolution of license plates images is improve, through the resizing of images in a DPI setting, which is facilitated the Pillow [
18] library.
4.4. Model Evaluation and TOPSIS-driven Selection
From the perspective of the adopted research paradigm, it could be observed that a crucial focus is placed on conducting a reliable evaluation of every YOLOv8 combination. In this context, there are 16 potential configurations with regard to such combinations, meaning that each model that is derived from the addition of the four vehicle detection models to the four license plate detection models must be analyzed. To carry out the evaluation, a broad range of diverse evaluation metrics is used, and it includes metrics such as Precision, mAP50-95, Recall and inference speed. Interestingly, the Technique for Order Preference by Similarity to Ideal Solution, or TOPSIS, is utilized in order to determine the best YOLOv8 combination. It is an established method within the field of Multi-Criteria Decision Making, and it helps to achieve a final result while taking into consideration various possible options. Overall, through the application of such an approach, it is possible to establish an effective evaluation process that is well-balanced in terms of such critical properties as accuracy and inference speed due to the use of predefined weightings.
4.5. Performance Analysis under Varying Lighting Conditions
After conducting a TOPSIS analysis of the robustness of the top YOLOv8 combinations, it was decided that those combinations would be put to the test in an environment with controlled lighting while varying the levels of ambient light intensity. With images of both vehicles and license plates taken in the described conditions and precise lux meter readings, it is hoped to understand how sensitive the results are to the lighting levels and changes. The data from the lux meter will be combined with the information extracted from the class confidence scores of the performance in vehicle detection and license plate detection to examine the robustness of the best combination.
4.6. Model Training:
Leveraging the computational power of a P100 GPU on the Kaggle platform, YOLOv8 models were trained with a focus on achieving an optimal balance between training efficiency and model performance. This involved the selection of key hyperparameters:
Epochs (50): A total of 50 epochs were chosen to ensure comprehensive exposure of the models to the training data. Validation performance was rigorously monitored throughout training to prevent overfitting and determine the most suitable number of epochs.
Image Size (640x640): A standardized image size of 640x640 pixels was selected for all input images. This choice balances the ability to capture essential image information with maintaining computational efficiency during training.
Training Batch Size (16): The training batch size was set to 16 images per iteration, considering both GPU memory utilization and the benefits of gradient updates.
Nominal Batch Size (64): Specific to the YOLOv8 architecture, a nominal batch size of 64 was employed to leverage gradient accumulation across multiple training batches, enhancing training stability and convergence.
the rigrous hyperparameter tuning process underscores the commitment to achieving efficient traing that fostes superior model performance on target tasks within our smart parking application, while also promoting model generalizability for real-world scenarios
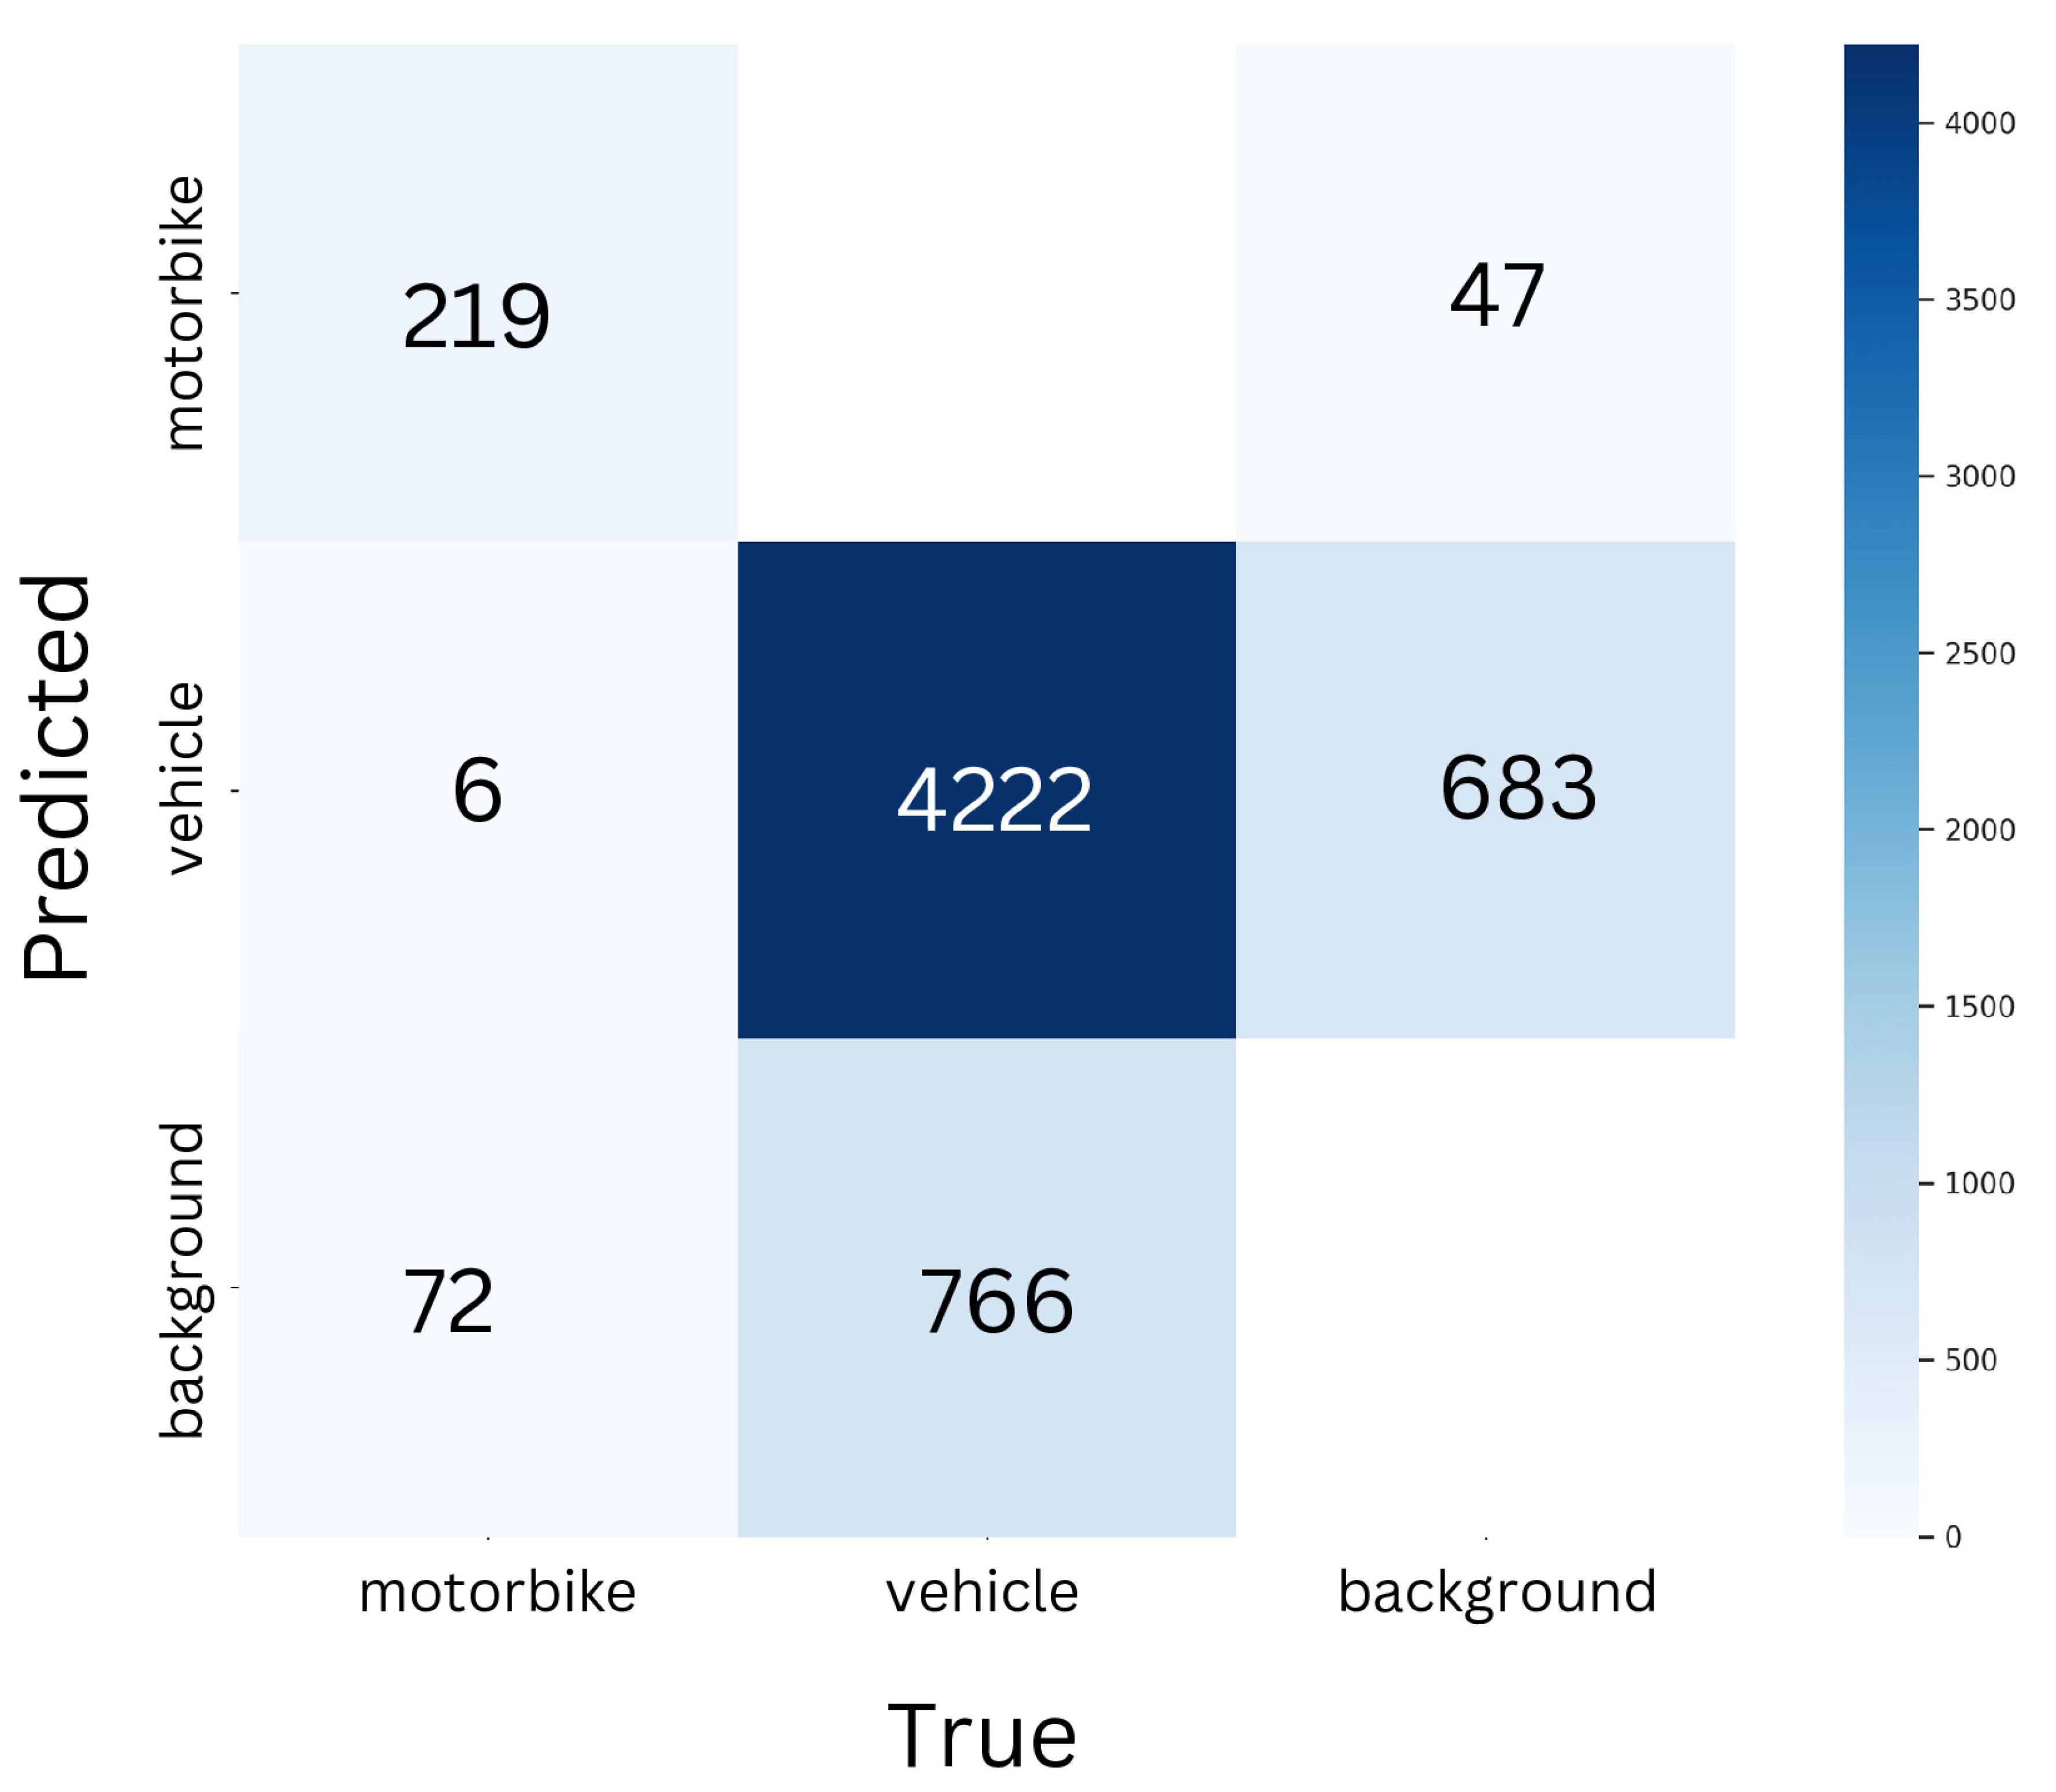
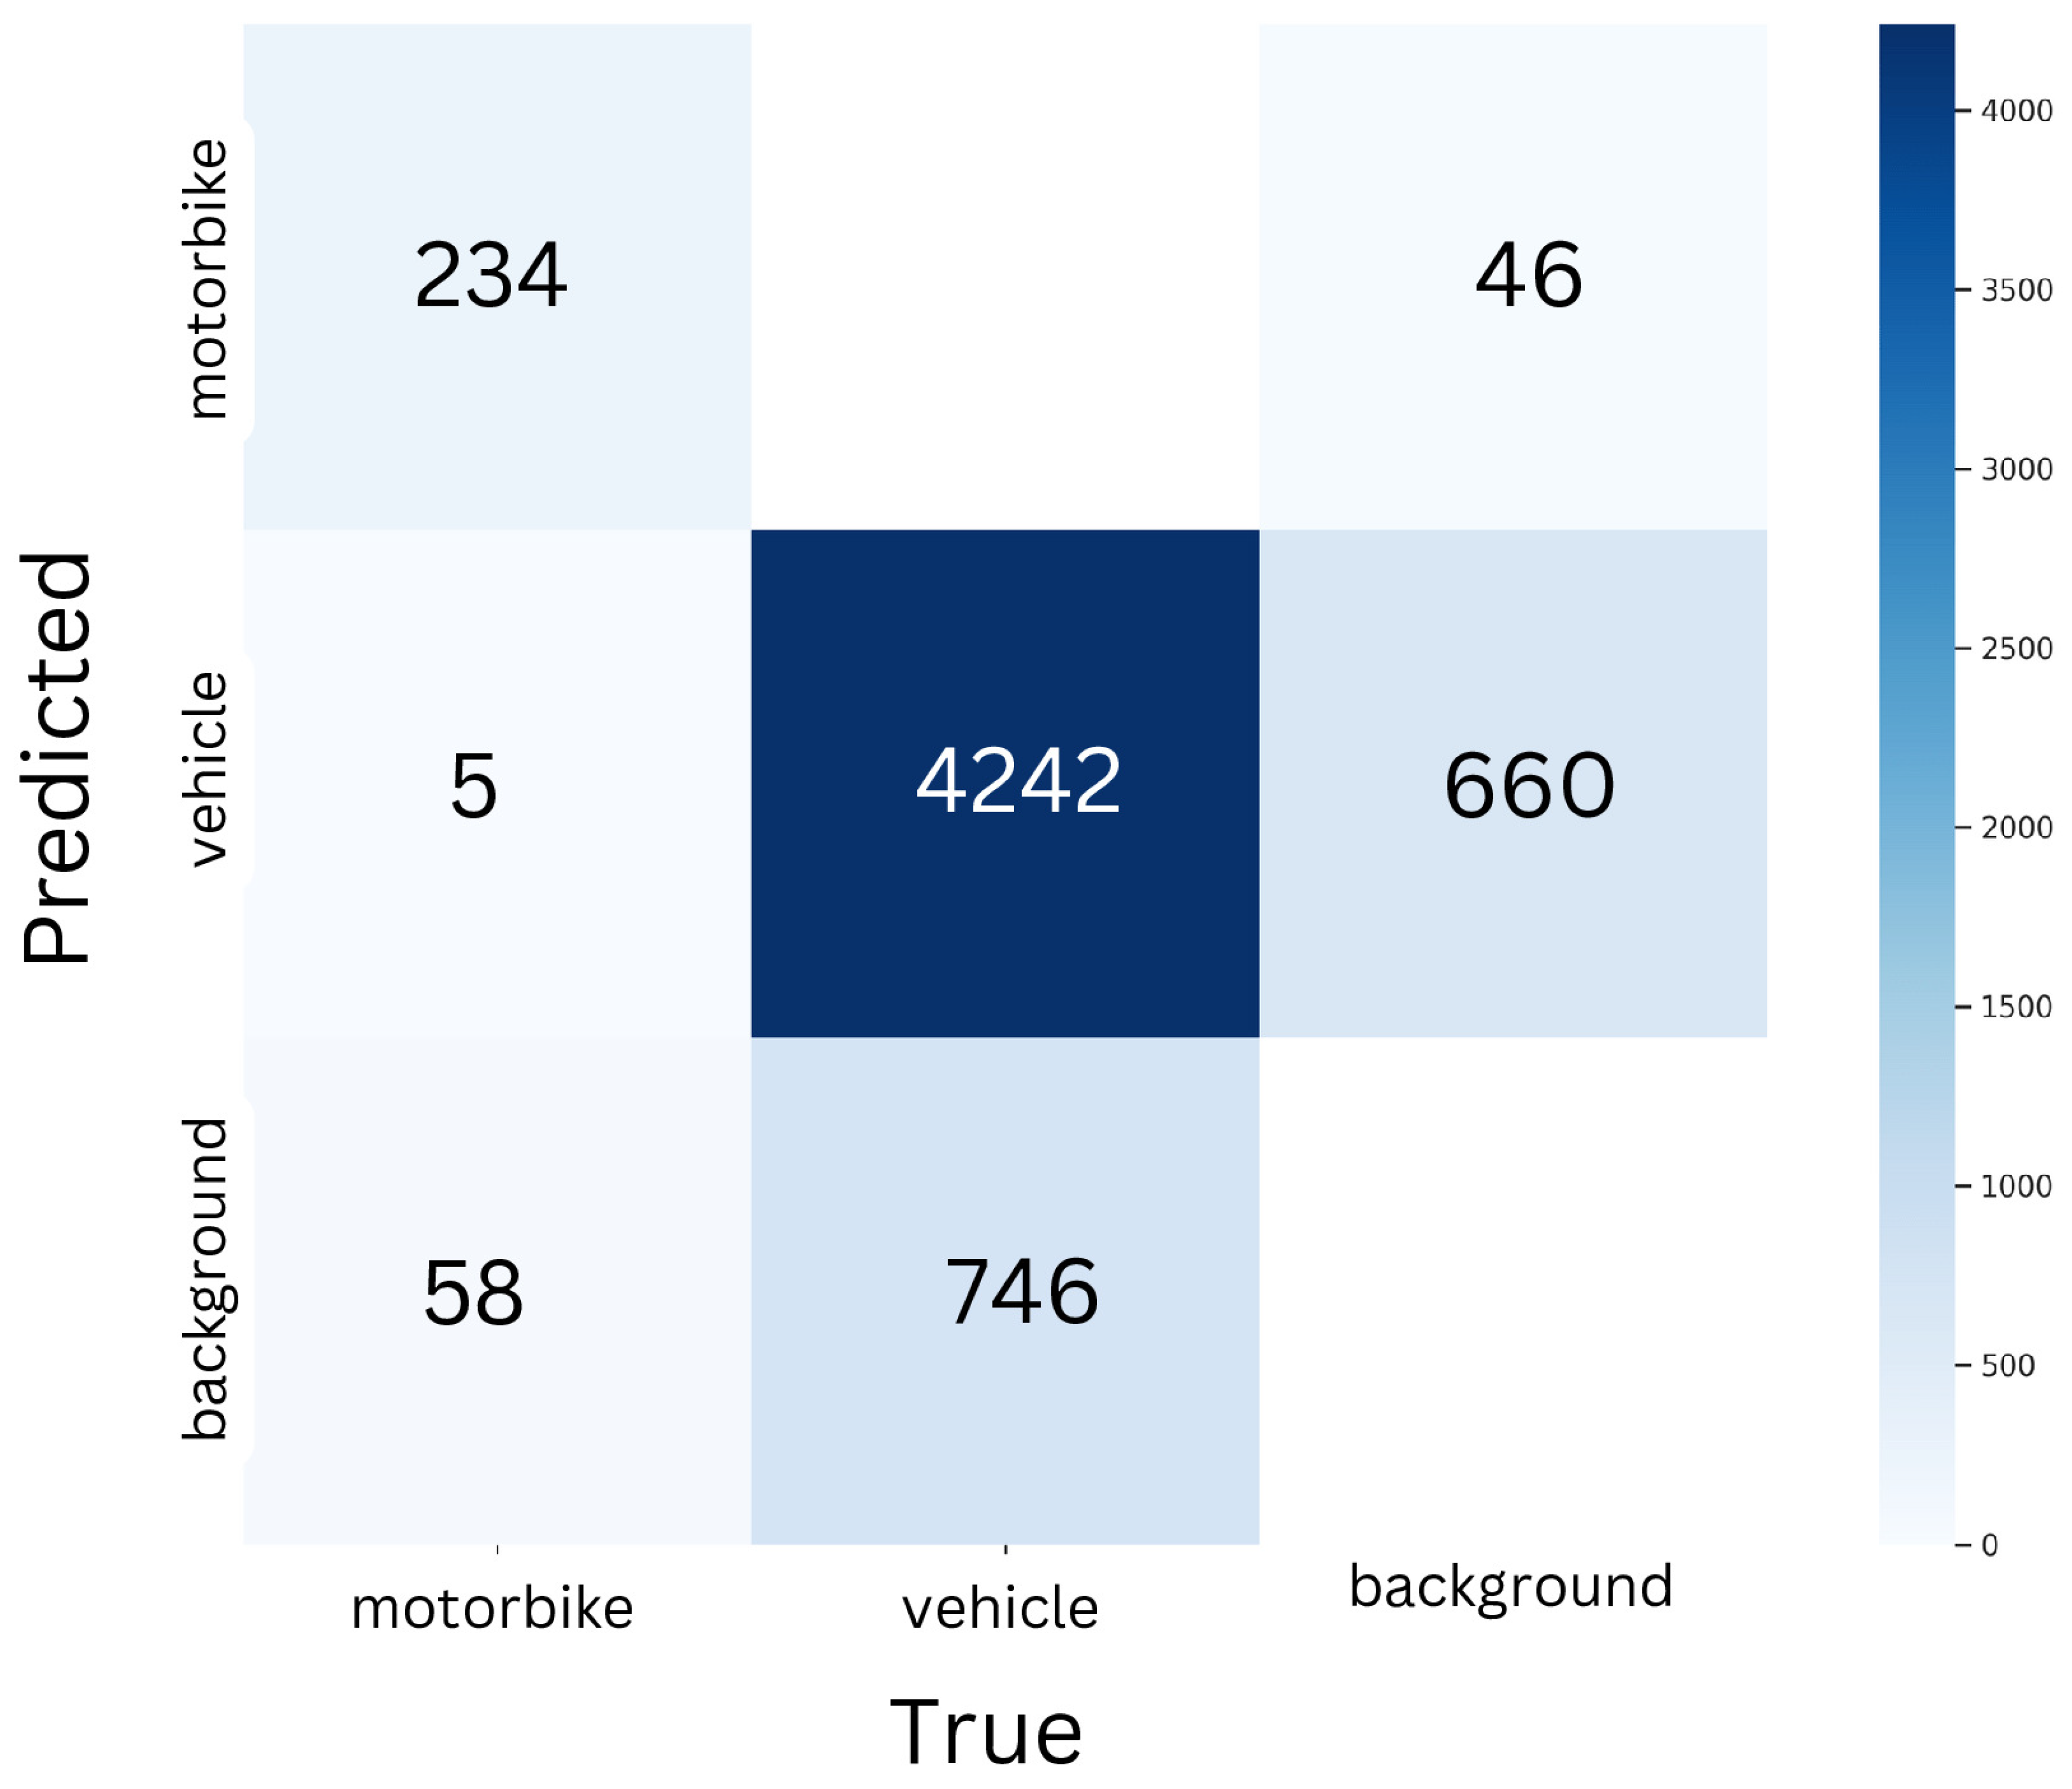
Figure 3.
Confusion Matrix for YOLOv8s for Vehicle Detection.
Figure 3.
Confusion Matrix for YOLOv8s for Vehicle Detection.
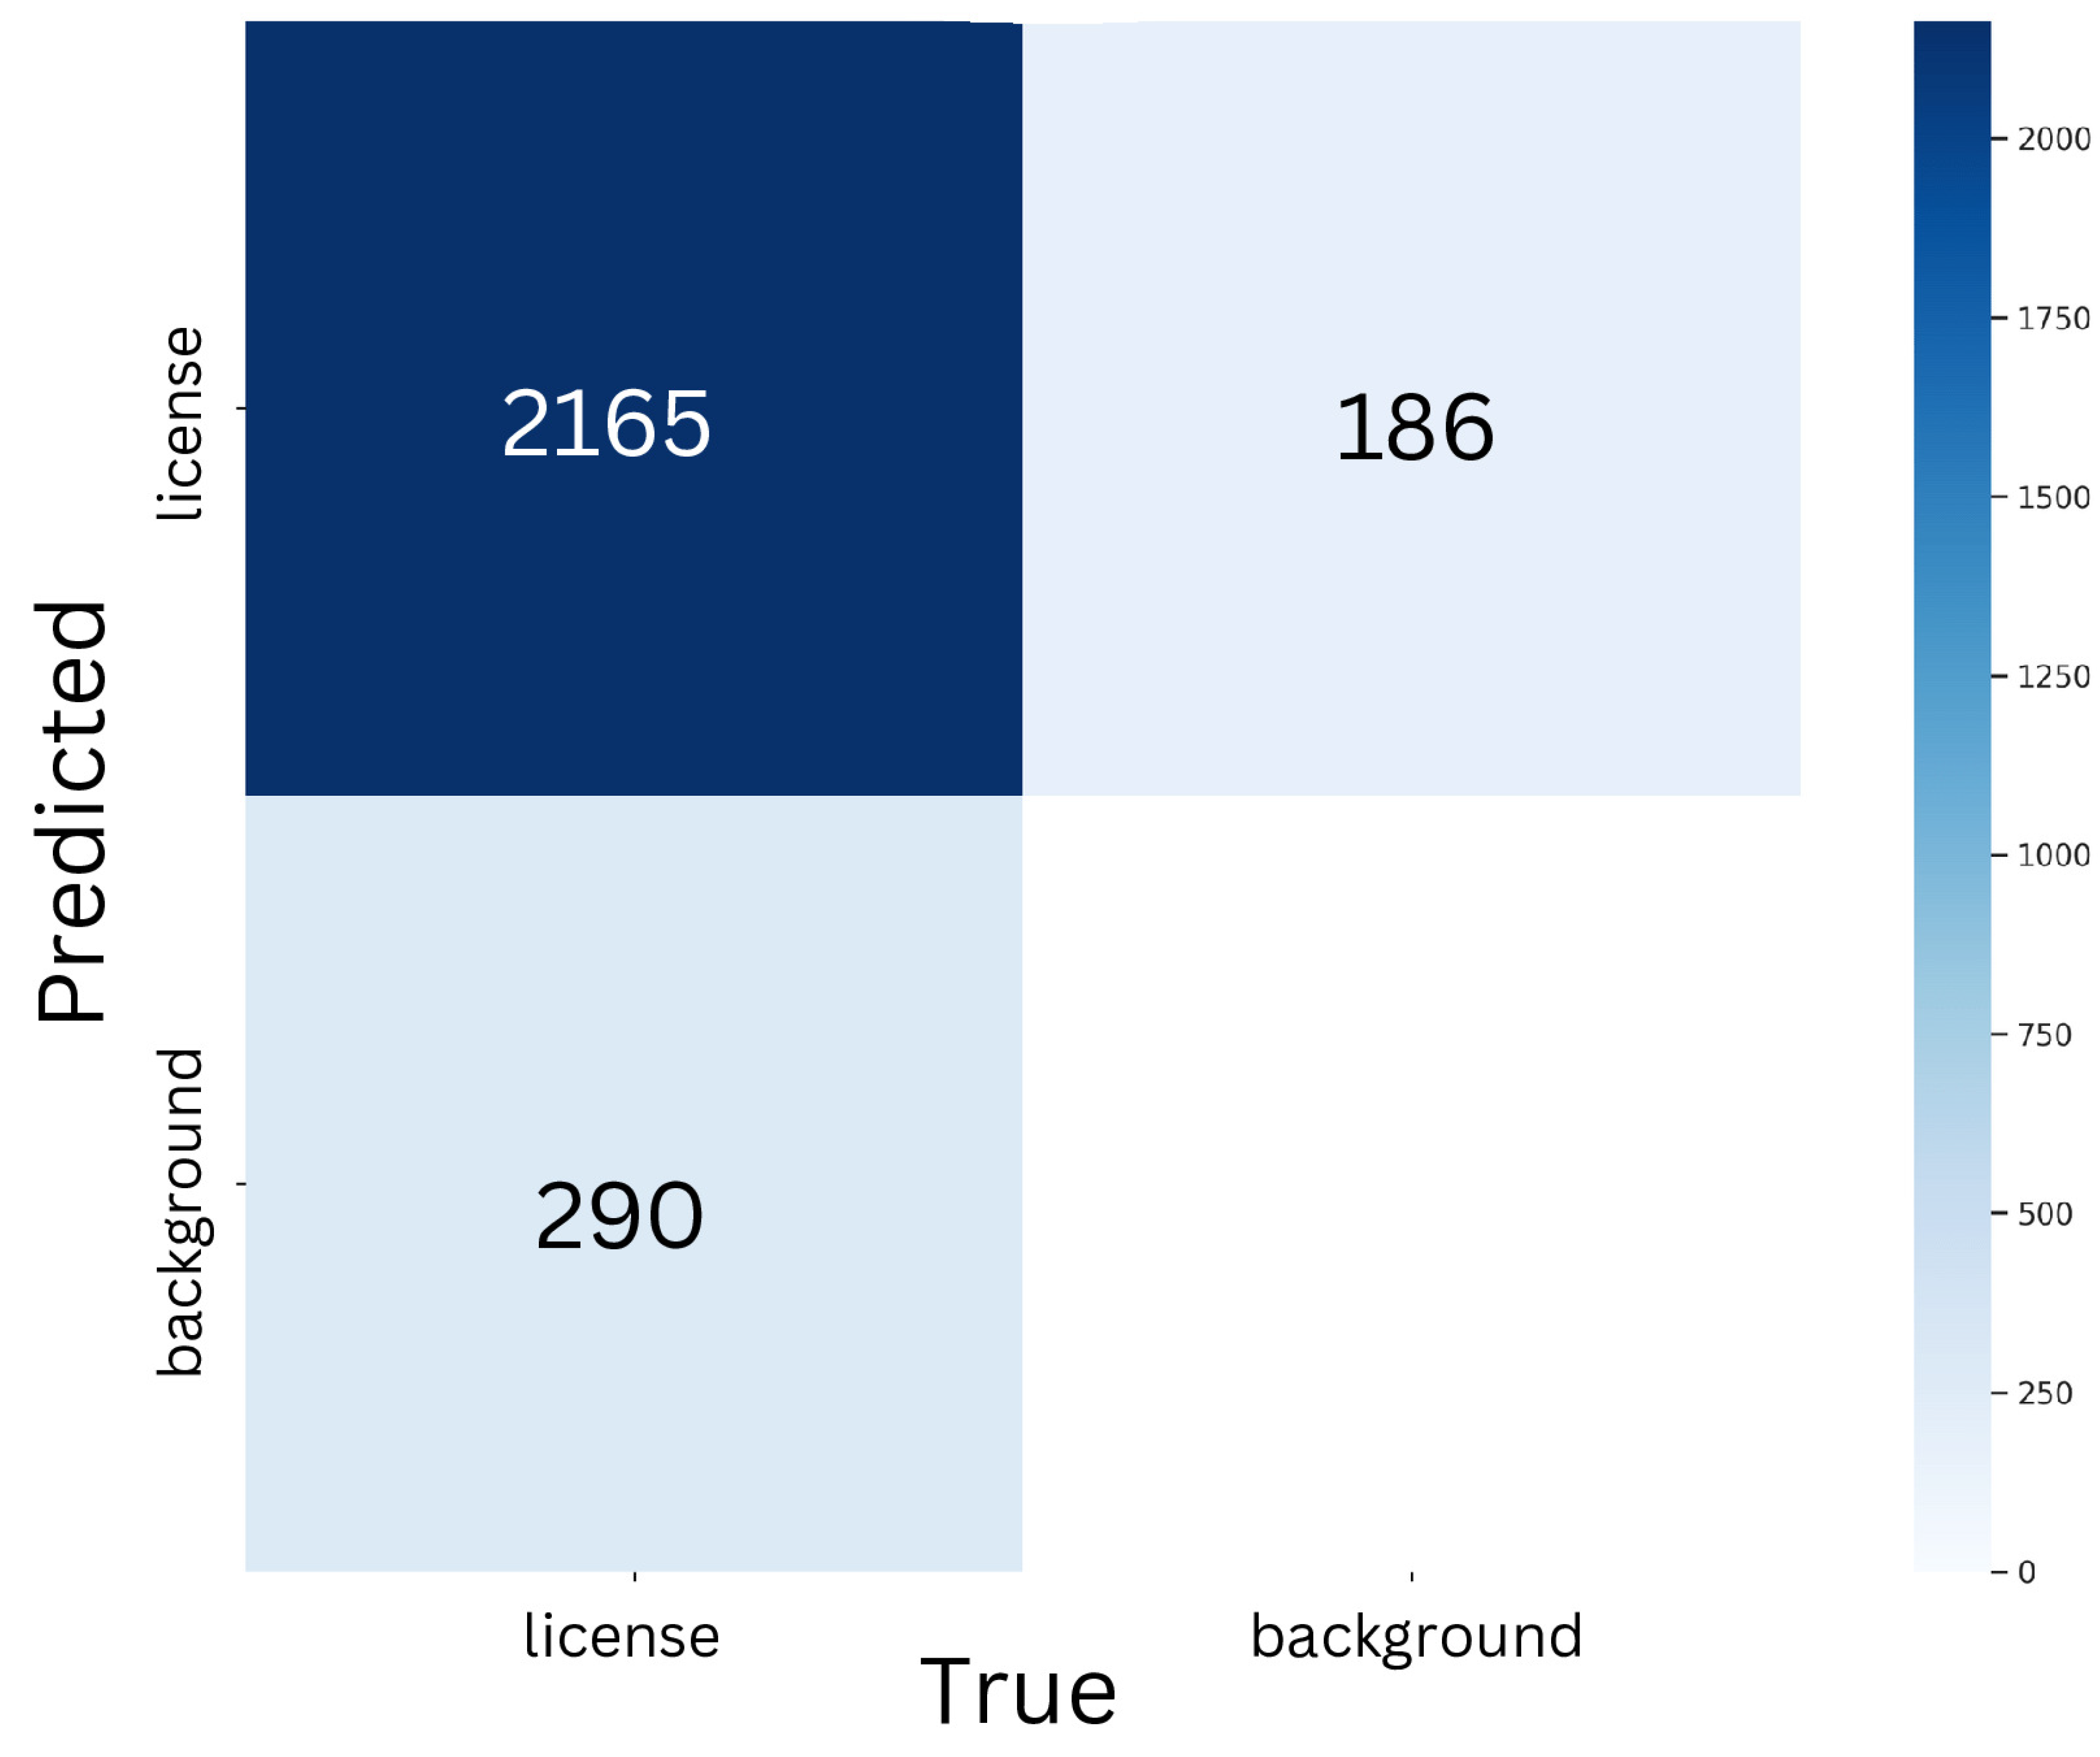
Figure 4.
Confusion Matrix for YOLOv8m for License Plate Detection.
Figure 4.
Confusion Matrix for YOLOv8m for License Plate Detection.
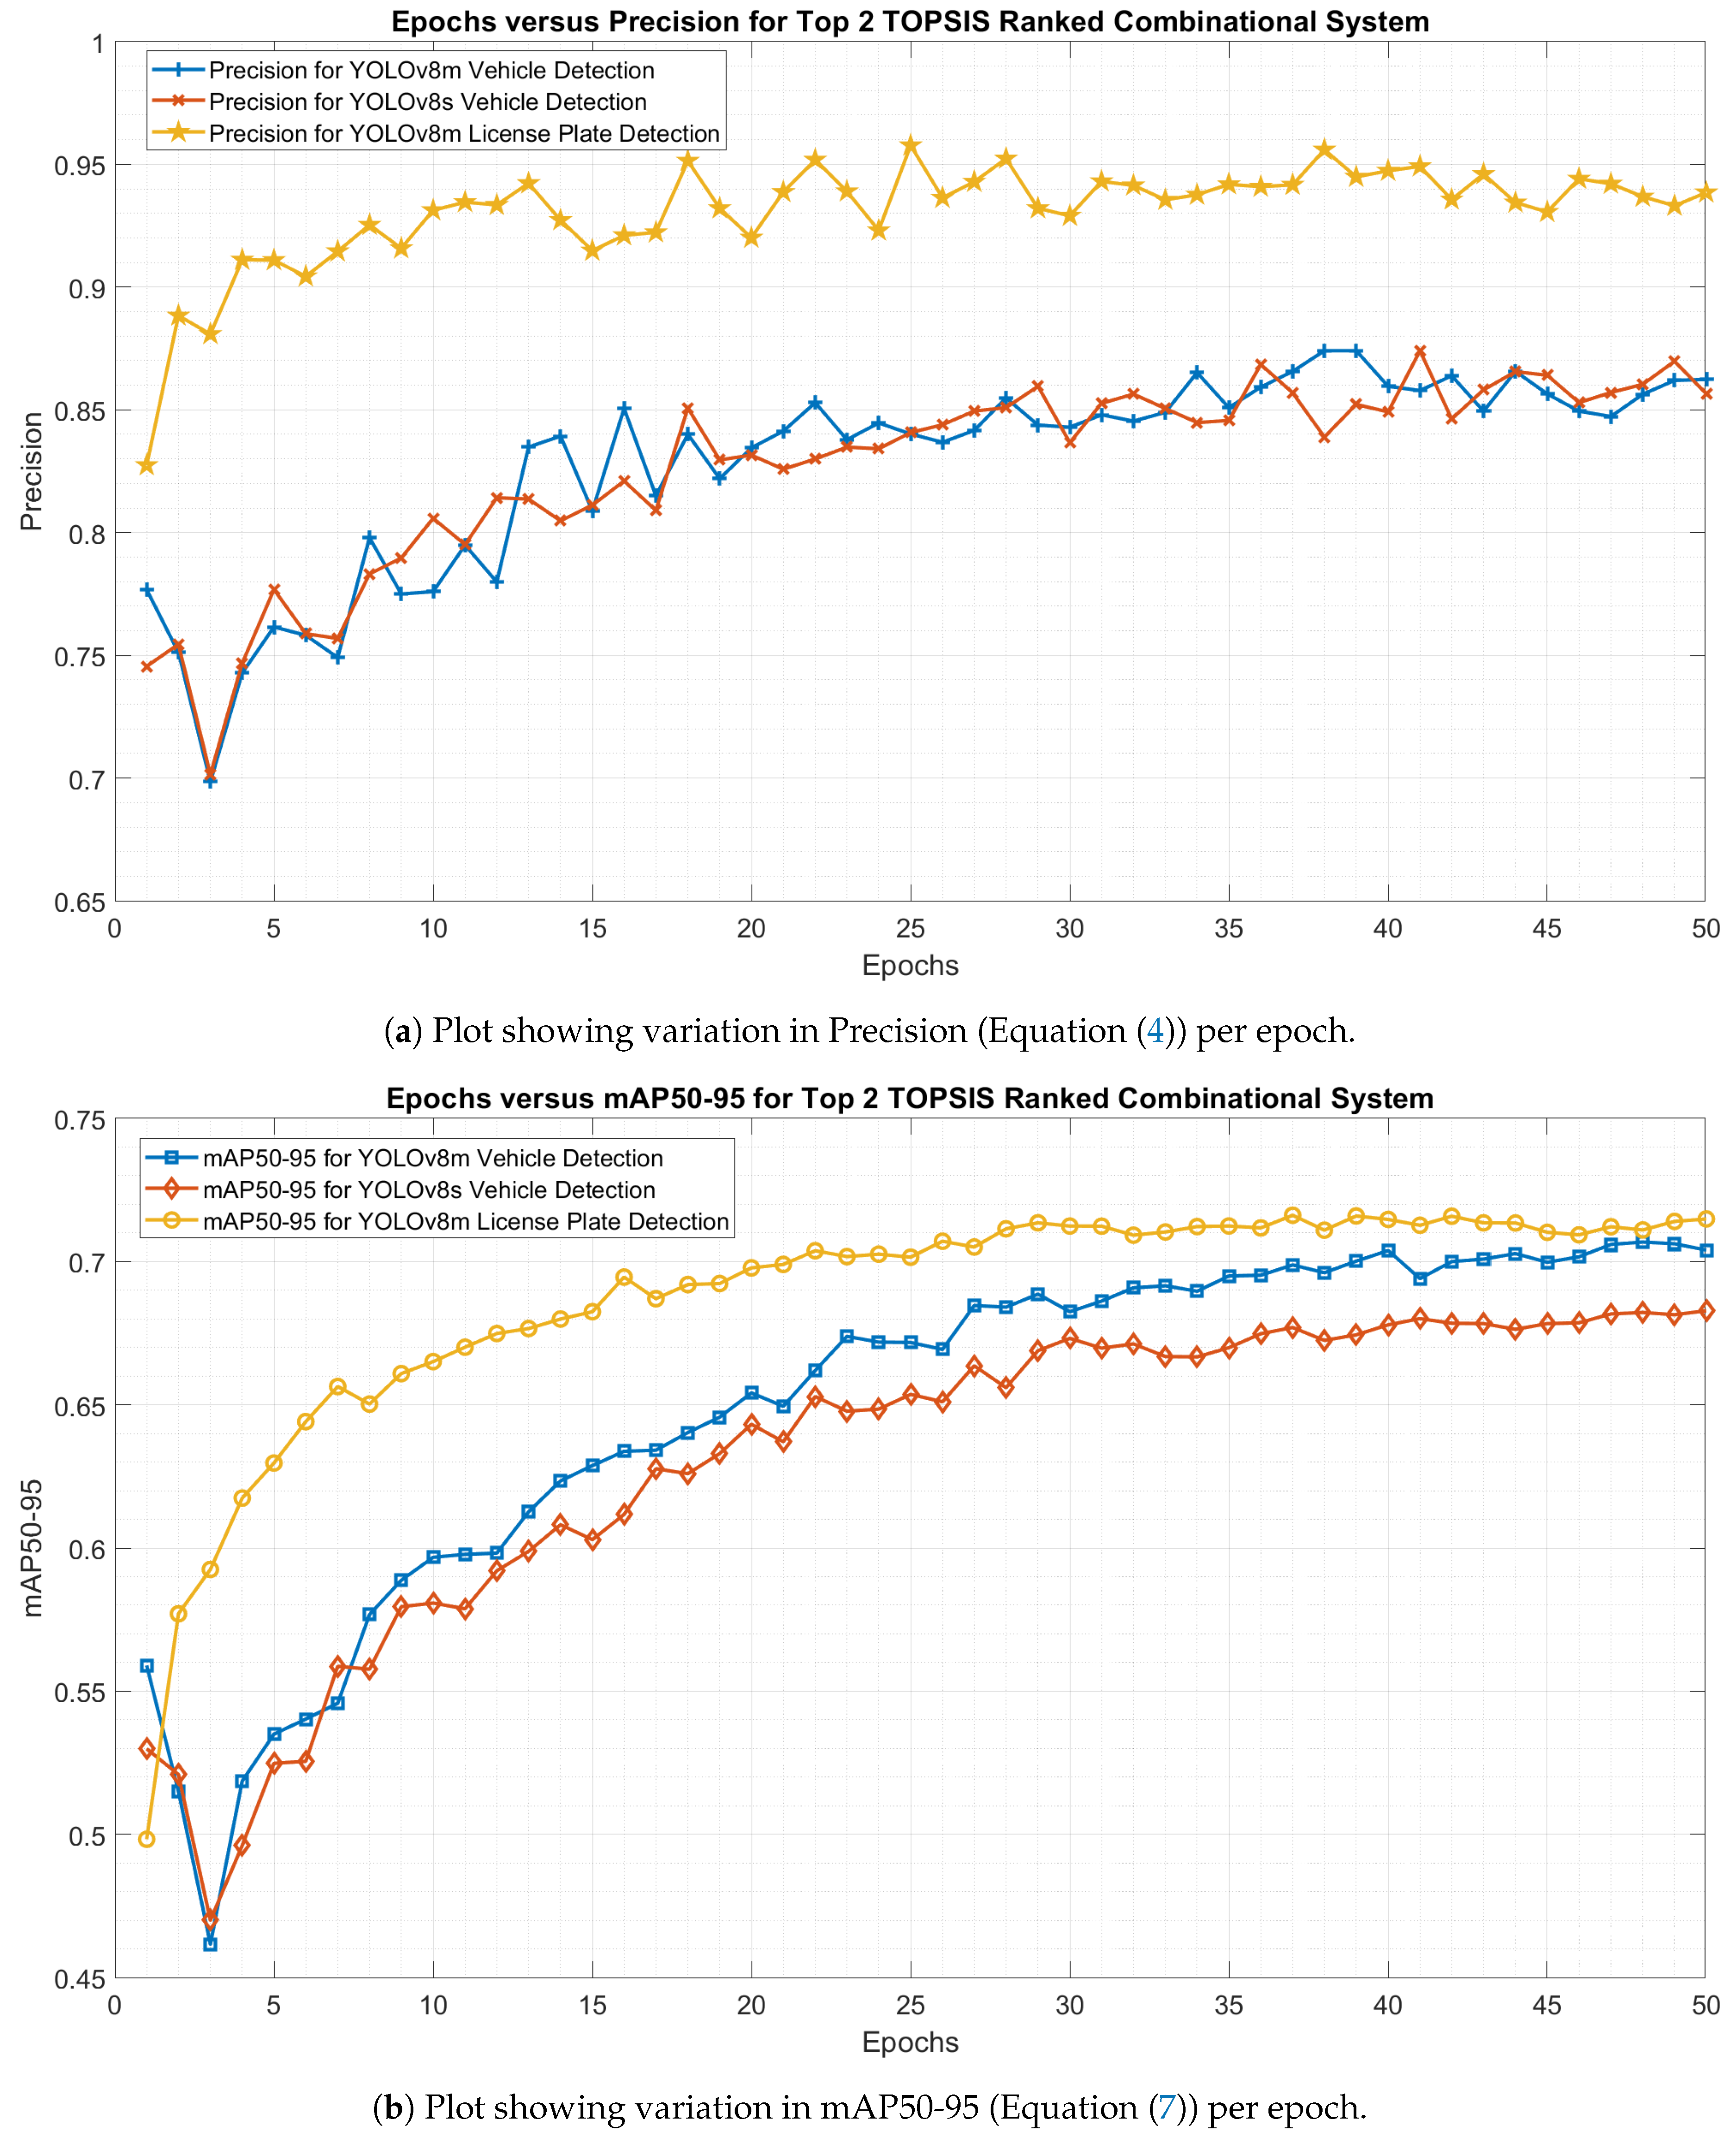
Figure 5.
Training Insights of Precision (Equation (
4)) and mAP50-95 (Equation (
7)) for Top 2 combinations according to TOPSIS analysis (
Table 2).
Figure 5.
Training Insights of Precision (Equation (
4)) and mAP50-95 (Equation (
7)) for Top 2 combinations according to TOPSIS analysis (
Table 2).
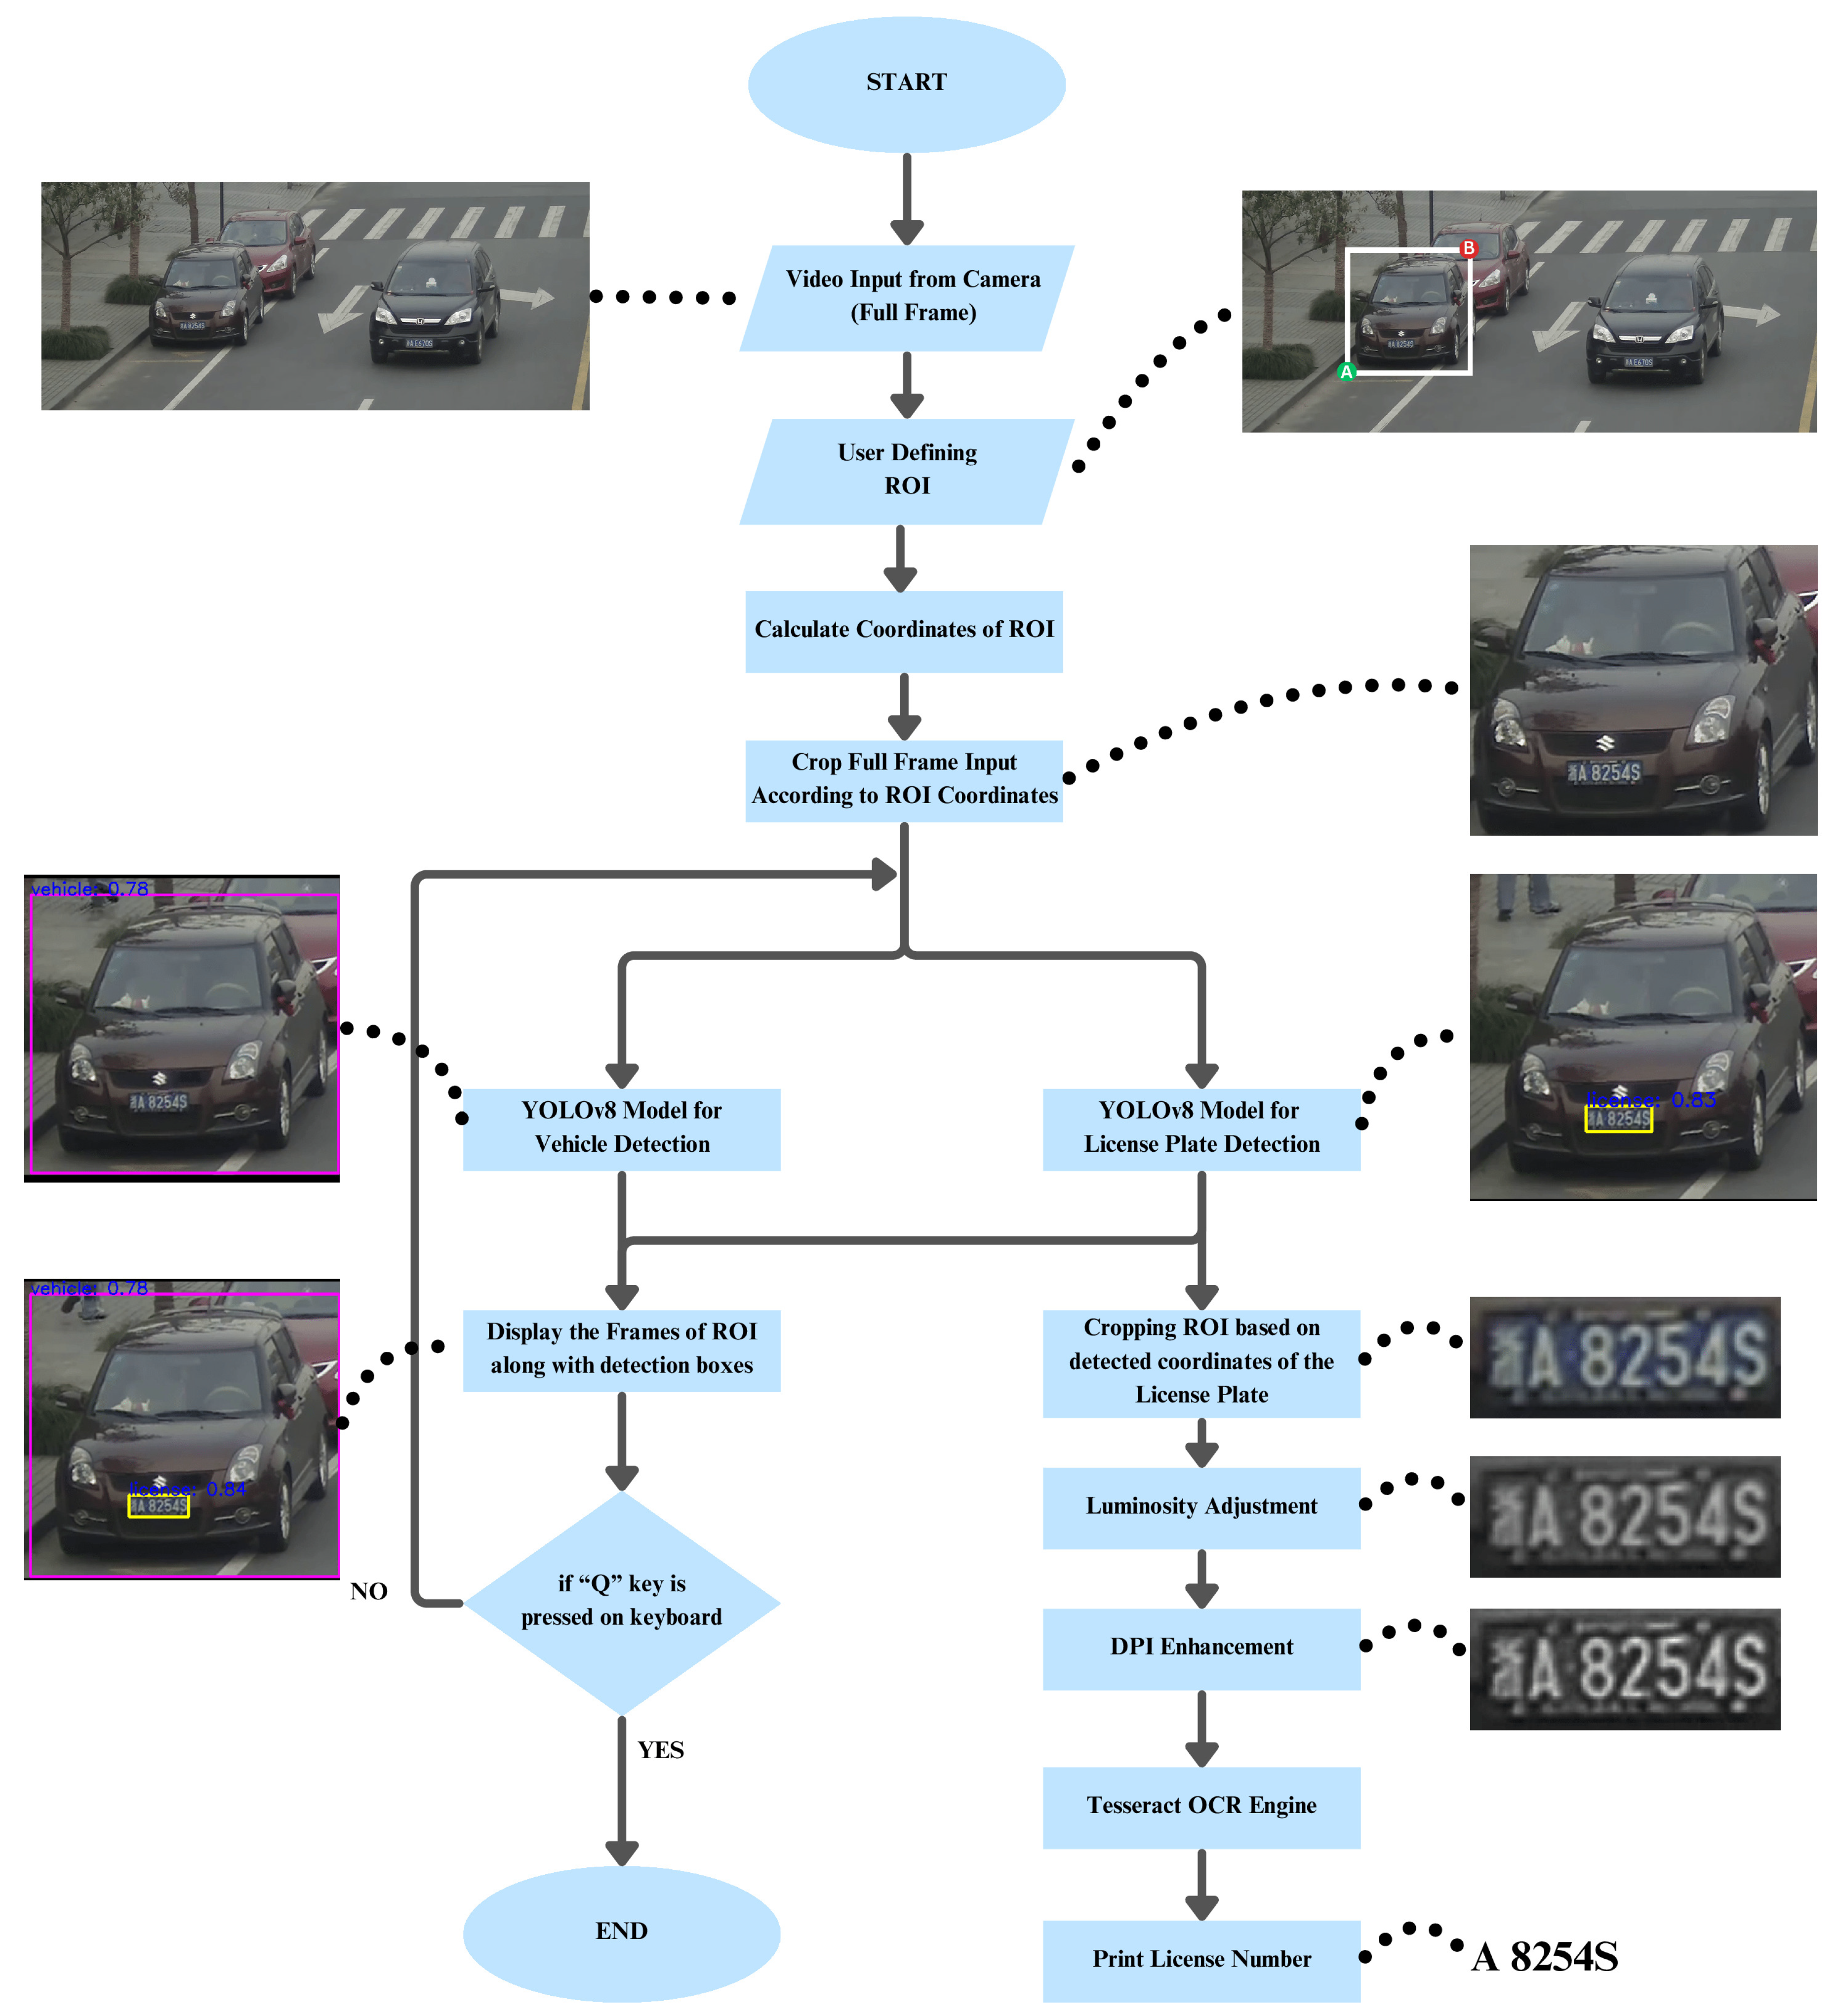
Figure 6.
System flow of the proposed design.
Figure 6.
System flow of the proposed design.
5. Details of Approach
5.1. Extraction of Region of Interest:
A simple functionality of the OpenCV [
17] library was created to define and export regions of interest from the full frames. The module allows the user to select an area of interest on the video by using the mouse. After the left mouse button is clicked, the module captures the coordinates of the mouse for the top-left corner of the selected area. When the left mouse button is released, the coordinates for the bottom-right corner are captured. Then, the module draws a rectangle for the defined region on the video. User can save the selected region by pressing any key function. This rudimentary functionality allows the user to capture desired portions of the video for further analysis.
Figure 7.
Algorithm 1 enables users to define a region of interest (ROI) by dragging the cursor from point A to point B (or vice versa).
Figure 7.
Algorithm 1 enables users to define a region of interest (ROI) by dragging the cursor from point A to point B (or vice versa).
|
Algorithm 1 ROI Extraction using OpenCV |
- 1:
Step1: Import necessary libraries - 2:
- OpenCV - 3:
Step 2: Define global variables: - 4:
- frame: current video frame - 5:
- roi_start: starting coordinates of the ROI - 6:
- roi_end: ending coordinates of the ROI - 7:
Step 3: Initialize the video capture object to read frames from the video source. - 8:
Step 4: Define a function to handle mouse events: - 9:
functiononMouse(event, x, y, flags, param) - 10:
if event is left mouse button down then - 11:
Capture starting coordinates of ROI (x, y) - 12:
end if - 13:
if event is left mouse button up then - 14:
Capture ending coordinates of ROI (x, y) - 15:
Draw rectangle on the frame to visualize the ROI - 16:
Display the frame with ROI - 17:
end if - 18:
end function - 19:
Step 5: Create a named window for displaying the video frame. - 20:
Step 6: Register the mouse callback function to the named window created in step 5. - 21:
Step 7: Loop over frames: - 22:
while video is not ended do - 23:
Read the next frame from the video capture object. - 24:
Display the frame in the named window. - 25:
end while - 26:
Step 8: Check for key press events: - 27:
if key is pressed then - 28:
if key is designated key for saving ROI then - 29:
Save the defined ROI as an image file. - 30:
end if - 31:
end if - 32:
Step 9: Release the video capture object and close all OpenCV windows. |
5.2. YOLO Algorithm
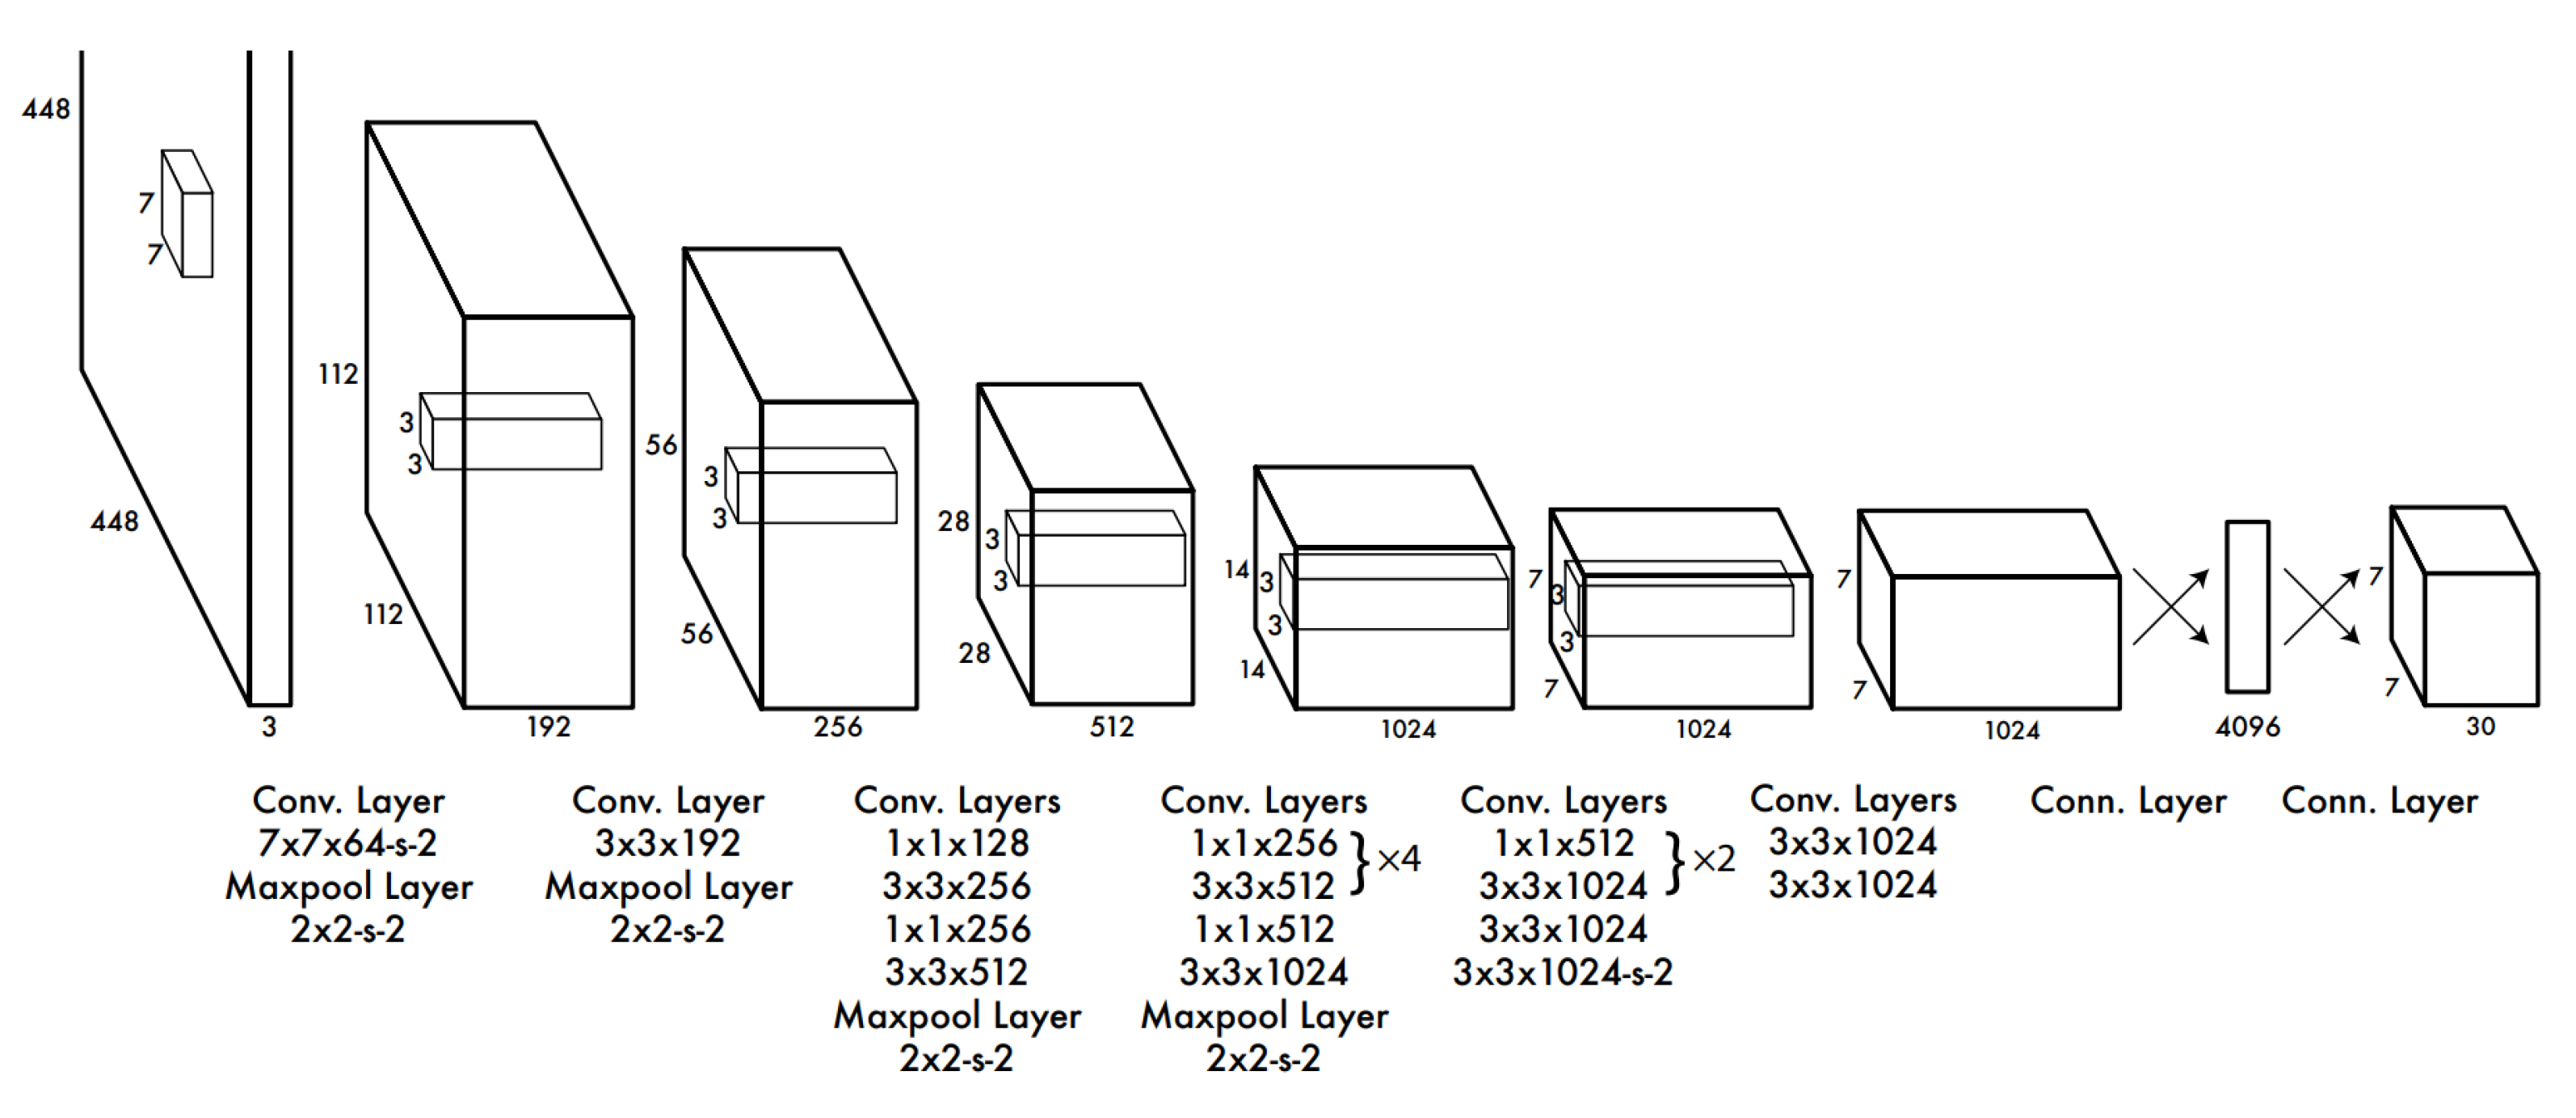
The You Only Look Once algorithm [
12] is one of the key technologies in the field of computer vision, as it is a single-stage method for object detection. While multi-stage algorithms require iterative calculations, YOLO reduces them thanks to a deep convolutional neural network(
Figure 8) predicting bounding boxes and class probabilities for objects in an image. These relatively streamlined calculations significantly increase the processing speed, which can be invaluable in real-time applications. The calculation results are based on a grid system in which each cell outputs bounding boxes and the probability that this cell has an object. Several proposed bounding boxes and related probability values are calculated. Non-Maximum Suppression removes all boxes except the one with the best probability.
The next step in the algorithm is the configuration of the model for the purposes of detecting. Ren et al. showed that performance improvement is possible if extra convolutional and connected layers are added [
19]. The extra two layers in the previous example are not sufficient, so the given researchers added four more convolutional layers and two more fully connected layers to the model, initializing their weights randomly. The input resolution of the network is important to increase the amount of visual data received by the program being detected. To calculate its resolution, the size of the original image is 224×224 pixels, in this case, the resolution is 448×448 pixels. The final layer of the model in question has to predict both class probabilities and the coordinates of the bounding box. To normalize all models, the width and height of the bounding box are also within the image, so they are between 0 and 1. In addition, the x and y coordinates of the bounding box are the coefficient’s offsets relative to the center of a certain cell of the grid, ranging from 0 to 1. The last layer uses a linear activation function, all other layers use a leaky rectified linear activation [
12]:
During training, it is desired for each object to be responsible for predicting only one bounding box. For this purpose, one predictor will be assigned to be responsible for predicting the object based on which prediction has the highest. Separation of responsibilities contributes to further training of predictive bounding boxes in various parameters such as the size or aspect of an object it becomes expert in predicting. In the given case, the score for the given algorithm is reduced to facilitate training. The formula for calculating the loss of the multi-part function [
12] being optimized during the training is given as:
where
denotes if object appears in cell
i and
denotes that the
jth bounding box predictor in cell
i is "responsible" for the corresponding prediction.
The You Only Look Once algorithm has certain advantages such as the very fast processing of real-time images and the rather simple architecture (
Figure 8) compared to the multistage detection algorithms. At the same time, it has a series of disadvantages such as potential trade-offs in accuracy and certain difficulties in parsing smaller or a large number of objects. These challenges have led to the modification of the YOLO algorithm, which have resulted in the subsequent development of the YOLOv2, YOLOv3, YOLOv4, YOLOv5, YOLOv6, YOLOv7, YOLOv8 and recently released YOLOv9 models.
5.3. Tesseract OCR
In this study focusing on evaluating YOLOv8 variants in smart parking applications, the incorporation of Tesseract [
16] is key within the OCR domain. Tesseract’s approach to OCR processing follows a systematic pipeline that incorporates connected component analysis at its initial stages, which comes in handy in managing scenarios with inverse text. The subsequent steps in the pipeline incorporate outline grouping, text line organization, character spacing analysis, and a two-pass recognition process, which culminate in fuzzy space resolution and x-height hypothesis check. Tesseract’s journey from a research manuscript to being one of the leading OCR engine is in line with the existing computer vision spirit of cooperation.
In this study, we use PyTesseract [
20], which is the Python wrapper for the Tesseract OCR engine, to unify Python and Tesseract. The incorporation of Tesseract in our pipeline is critical in ensuring it is easily integrated into Python, thus linking developers with a variety of functionalities. The functionalities demonstrated among others include the loading and pre-processing of an image containing texts, the recognition of the loaded image using Tesseract, the extraction of the recognized text, and customization of the Tesseract’s parameters, specifically the language feature in assessing texts from different languages. This utilization of the PyTesseract indicates the high level of satisfaction concerning the YOLOv8 variants for vehicle detection and license plate recognition in smart parking applications under different lighting conditions. Additional alterations have also been executed to the identified enhancement, including the
Luminosity Modulation and
DPI enhancement.
5.4. Luminosity Modulation
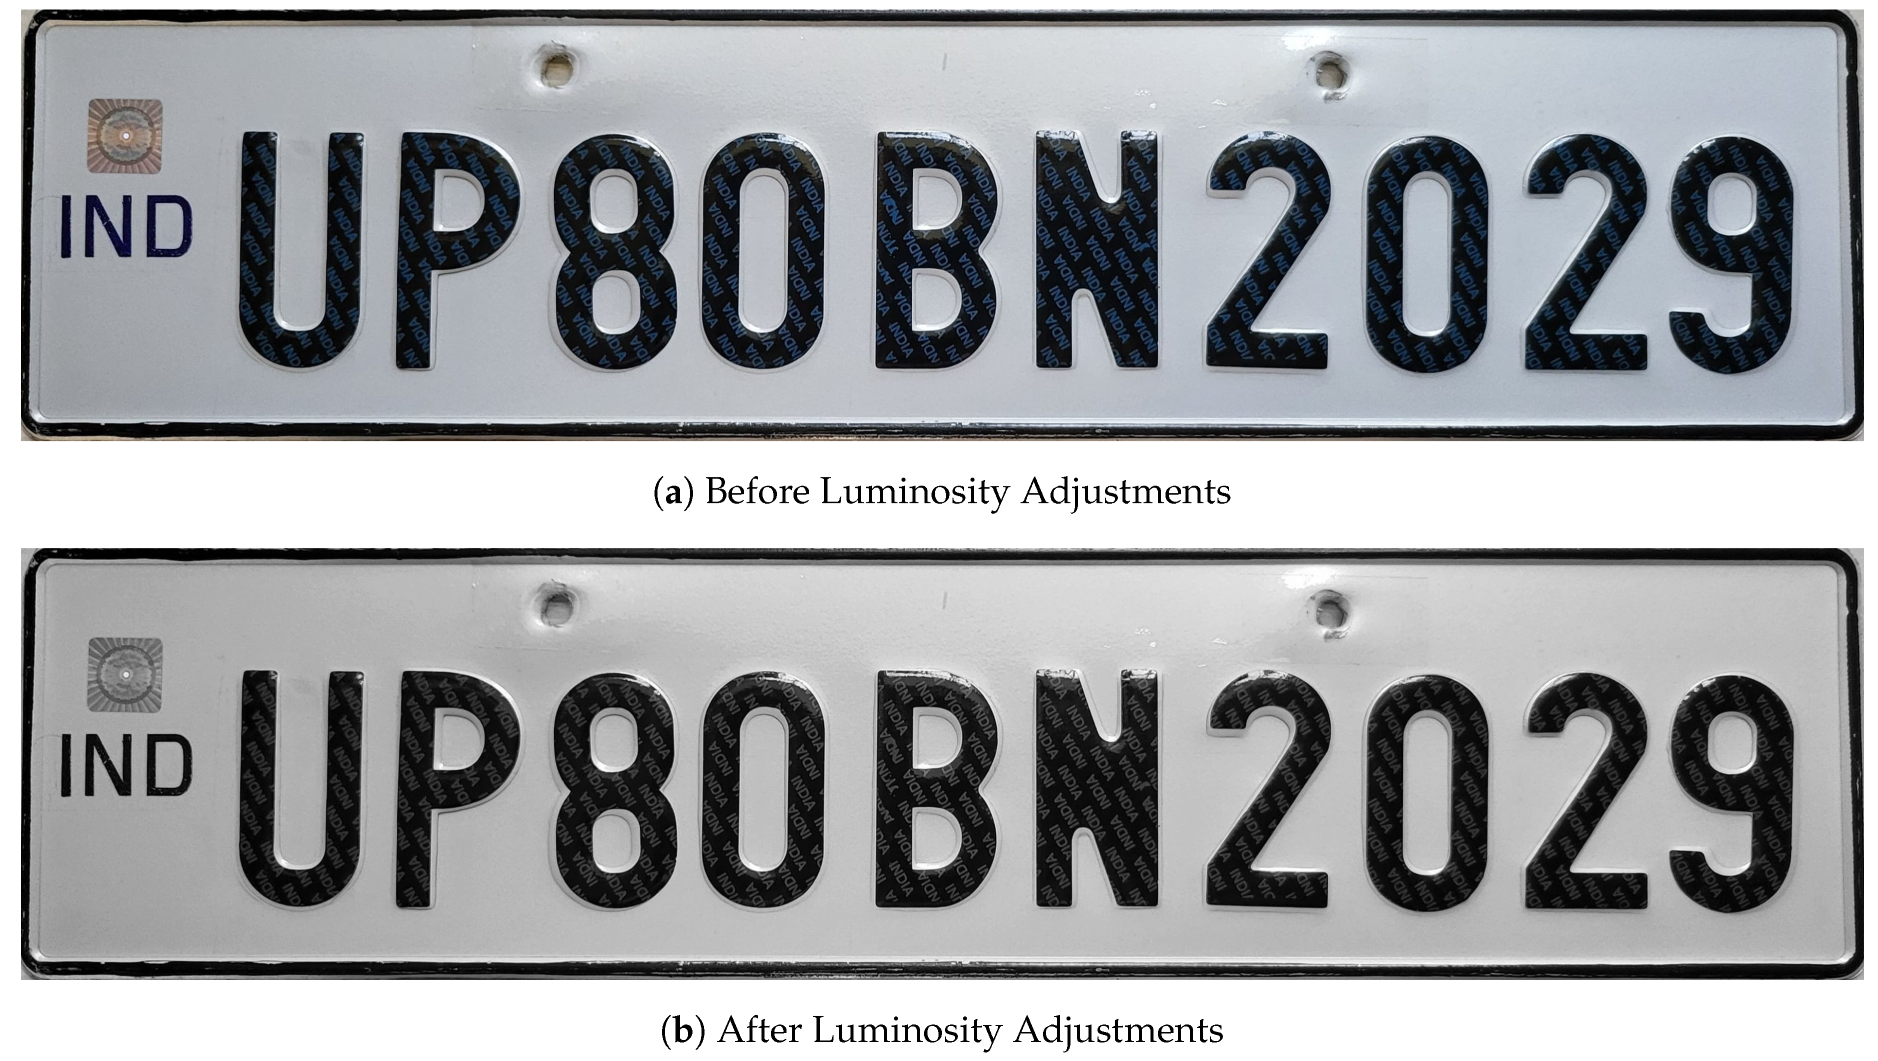
Luminosity modulation is highly beneficial in Optical Character Recognition (OCR), and specifically, for license plate recognition. It allows the adjustment of brightness and contrast, thus making the images clearer and the taught characters more distinguishable from the background. Consequently, the use of luminosity modulation because allows improving the detection process as a whole. On a similar note, the capacity to adjust luminosity is particularly suitable for nighttime and in undertones. Notably, it enhances the applicability of OCR in poor lighting conditions, making the features of the examined objects, in this case, license plates, more discernible. Moreover, it should be noted that luminosity modulation has a positive effect in reducing signal noise . The latter effect is essential since it creates premises for using the OCR feature in the plates’ detection. The role played by luminosity modulation features in the moistening the glare in the photos also helps enhance the descriptiveness of the photo. Particularly, substantial benefits can be experienced during the process of photodetector interference calibration. As a result, luminosity modulation can be deemed an enhancement that improves the sustainability and effectiveness of the OCR in any environment. Most importantly, it also raises the accuracy of the OCR, therefore, improving a range of applications, such as automatic toll monitoring, car tracking, and so forth.
Luminosity modulation (
Figure 9) is implemented with the help of OpenCV [
17] library according to the following equation [
13]:
5.5. DPI Enhancements
The increase in image resolution, measured in dots per inch, improves the performance of Optical Character Recognition for license plate applications in a demonstrable way. This happens because higher resolution images have more detailed and clearer purposes providing more data for analysis. As a result, the OCR algorithms have an easier time distinguishing different characters. The application of this fact in practice resulted in a meaningful reduction of recognition errors and a subsequent increase in the accuracy of license plate detection and extraction. Another significant benefit of heightened DPI is that it improves performance in scenarios that are problematic even for human analysts. Low-light conditions, as well as an image that is partially obscured, damaged, or distorted in some other way, contain more data that is useful for the OCR algorithms. This allows one to improve the overall performance of the system. We increased the DPI using the Pillow [
18] library, bringing the DPI to the constant level of 600.
6. Results
In this section, the evaluation metrics utilized to comprehensively evaluate the performance of the YOLOv8 models for the car detection and license plate recognition within our smart parking application are thoroughly examined. These metrics shed light on the accuracy, completeness, and overall effectiveness of the models in fulfilling their designated tasks.
6.1. Precision:
Precision gauges the accuracy with which the model identifies objects such as cars or license plates. It represents the proportion of correctly identified objects among all detections reported by the model. A high precision value indicates a strong correlation between the model’s positive detections and the actual objects present in the scene. Mathematically, it is defined as:
where True Positive (TP) represents the number of accurately detected objects by the model, and False Positive (FP) denotes the instances of incorrectly identified objects (e.g., non-car objects misclassified as cars).
6.2. Recall:
Recall complements precision by measuring the comprehensiveness of the model’s detections. It reflects the proportion of actual objects (cars or license plates) successfully identified by the model. The recall value is calculated as:
Here, False Negative (FN) represents the number of actual objects that the model fails to detect. A high recall value indicates that the model effectively identifies a significant portion of the existing objects within the image.
6.3. Intersection Over Union (IoU):
IoU (
Figure 10) quantifies the area of overlap between the predicted and ground truth bounding boxes relative to their total area. It is computed as:
It plays a fundamental role in evaluating the accuracy of object localization.
6.4. Mean Average Precision (mAP):
mAP provides a comprehensive evaluation by averaging the precision values obtained at various Intersection over Union (IoU) thresholds. IoU measures the overlap between the predicted bounding box and the ground truth bounding box (actual object location). In this study, mAP50 as well as mAP50-95 is reported, that is calculation of mAP with an IoU threshold of 0.5 and 0.95 respectively, indicating at least 50% (for mAP50) or 95% (for mAP50-95) overlap is necessary between Ground Truth and Prediction, for a detection to be considered accurate. The formula for Mean Average Precision (mAP) is given by:
where,
is the Mean Average Precision,
N is the number of classes, and
is the Average Precision for class
i.
6.5. F1-Score:
The F1-Score offers a balanced evaluation by calculating the harmonic mean of precision (Equation (
4)) and recall (Equation (
5)). This metric provides a robust assessment of model performance, less susceptible to outliers compared to individual precision and recall values. It is expressed as:
Valuable insights into the strengths and weakness of the YOLOv8 models for the vehicle and license plate detection tasks within our smart parking system are gained through and in-depth analysis of these evaluation metrics. This analysis facilitates informed decision-making regarding the most suitable YOLOv8 variant for real-world application deployment.
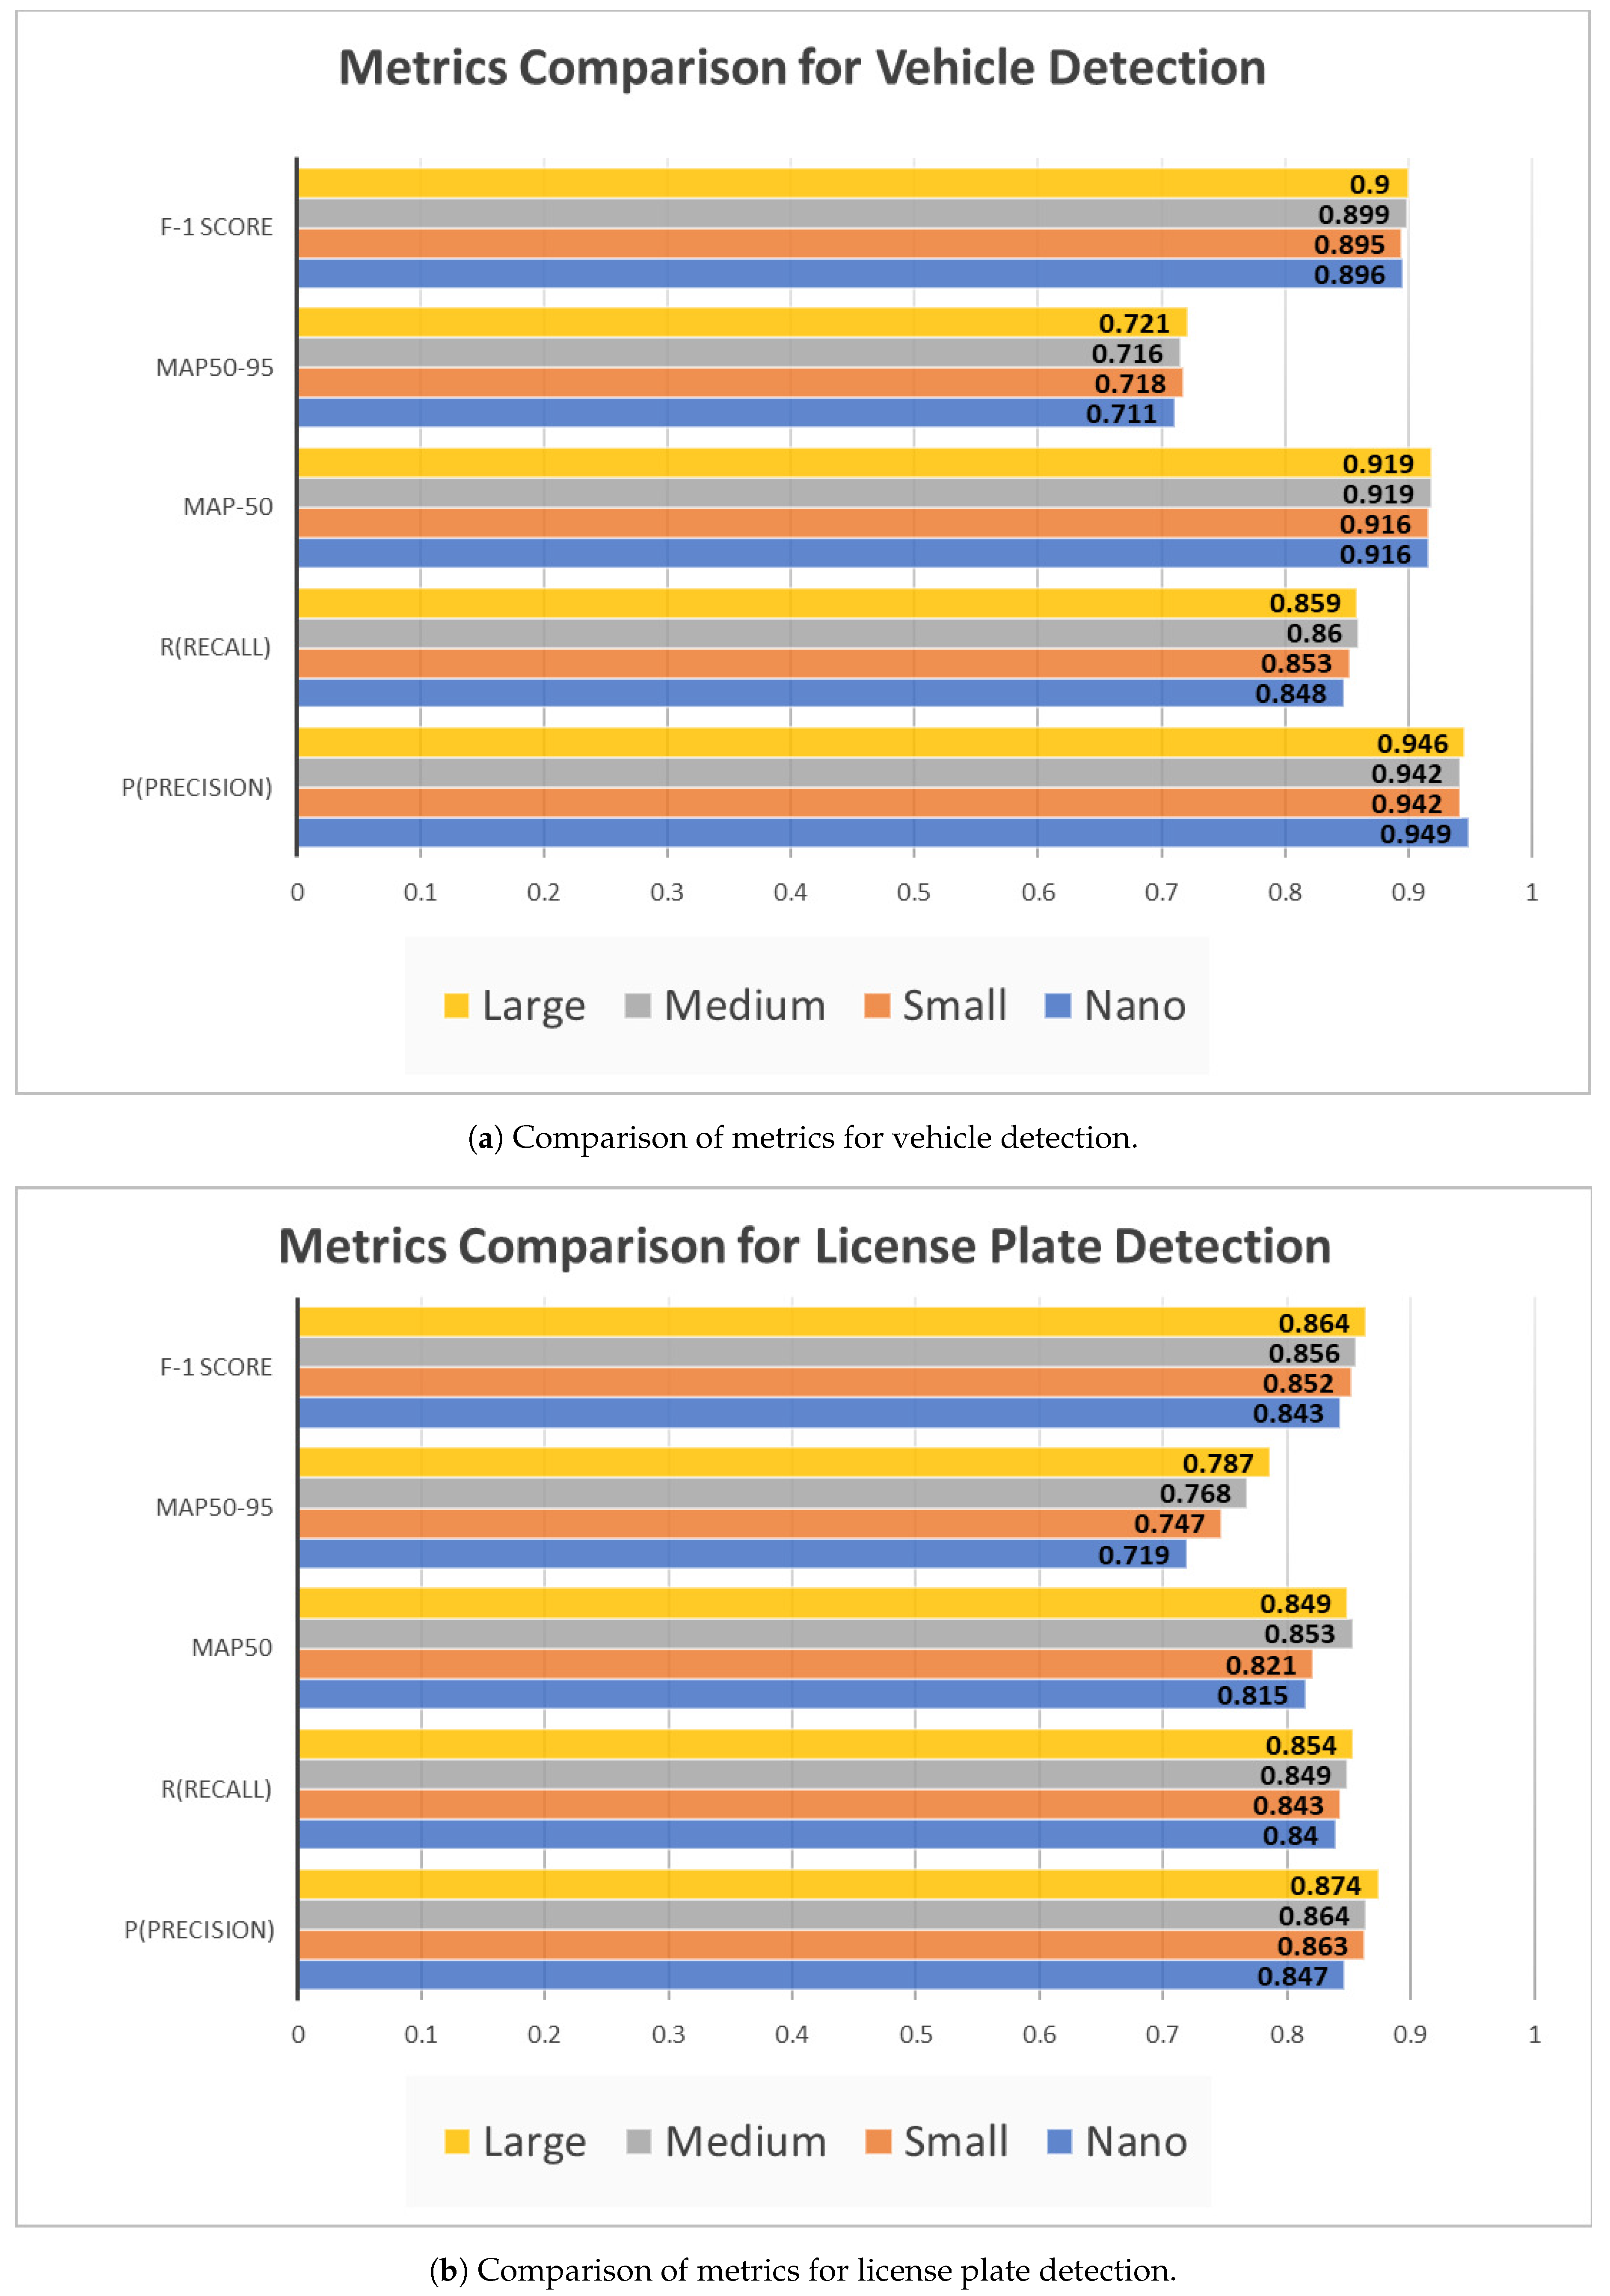
In
Table 1, a comprehensive comparison of a performance metrics for various YOLOv8 variants for vehicle detection and license plate detection respectively, is presented. The evaluation encompasses precision (Equation (
4)), recall (Equation (
5)), mean Average Precision (mAP) (Equation (
7)) at 50% and 95% IoU (Equation (
6)) thresholds, and F1 scores (Equation (
8)).
Table 1.
Comparison of metrics for Vehicle and License Plate Identification of different YOLO Models
Table 1.
Comparison of metrics for Vehicle and License Plate Identification of different YOLO Models
| |
Vehicle Detection |
License Plate Detection |
| Model |
Precision |
Recall |
mAP50 |
mAP50-95 |
F1 Score |
Precision |
Recall |
mAP50 |
mAP50-95 |
F1 Score |
| Nano |
0.847 |
0.840 |
0.815 |
0.719 |
0.843 |
0.949 |
0.848 |
0.916 |
0.711 |
0.896 |
| Small |
0.863 |
0.843 |
0.821 |
0.747 |
0.852 |
0.942 |
0.853 |
0.916 |
0.718 |
0.895 |
| Medium |
0.864 |
0.849 |
0.853 |
0.768 |
0.856 |
0.942 |
0.86 |
0.919 |
0.716 |
0.899 |
| Large |
0.874 |
0.854 |
0.849 |
0.787 |
0.864 |
0.946 |
0.859 |
0.919 |
0.721 |
0.900 |
7. Analysis
7.1. TOPSIS Analysis:
The Technique for Order of Preference by Similarity to Ideal Solution (TOPSIS) [
22,
23] is a method for Multiple Criteria Decision Making (MCDM), initially conceived by Ching-Lai Hwang and Yoon in 1981, with subsequent refinements by Yoon in 1987 and Hwang, Lai, and Liu in 1993. TOPSIS operates on the principle that the preferred alternative should be closest to the positive ideal solution (PIS) and farthest from the negative ideal solution (NIS) in geometric distance.
7.1.1. Procedure
The TOPSIS process is carried out as follows:
Step 1: Create an evaluation matrix consisting of m alternatives and n criteria, with the intersection of each alternative and criteria given as . Therefore, we have a matrix .
Step 2: The matrix
is then normalized to form the matrix
using the normalization method
Step 3: Calculate the weighted normalized decision matrix
where
so that
, and
is the original weight given to the indicator
Step 4: Determine the worst alternative
and the best alternative
:
where,
associated with the criteria having a positive impact, and
associated with the criteria having a negative impact.
Step 5: Calculate the
-distance between the target alternative
i and the worst condition
and the distance between the alternative
i and the best condition
where
and
are
-norm distances from the target alternative
i to the worst and best conditions, respectively.
-
Step 6: Calculate the similarity to the worst condition:
if and only if the alternative solution has the best condition; and if and only if the alternative solution has the worst condition.
Step 7: Rank the alternatives according to .
An open-source Python program [
24] has been utilized for the TOPSIS analysis. Our input matrix consists of 7 parameters, namely Precision(Equation (
4)), Recall(Equation (
5)) and mAP50-95(Equation (
7)) for each of the two models (Vehicle and License plate Detector) along with Total Inference Time in milliseconds.
7.1.2. Criteria Weighting
Now the assignment of weights, must be done on the basis of priority given to each metric for our specific application. Here’s how the optimization of the combination of 16 different types of system design must be carried out:
Precision (Equation (4)): It becomes paramount for both car and license plate detection. False positives, which can include detecting multiple cars, non-car objects, or non-plate objects, are highly detrimental as they hinder accurate identification.
mAP50-95 (Equation (7)): As IoU remains crucial for both car and license plate detection, mAP at 95% IoU threshold has been considered as the one of the criteria in TOPSIS. Also, accurate bounding box localization is essential for reliable downstream tasks like Optical Character Recognition (OCR) applied to license plates.
Recall (Equation (5)): Recall can be slightly relaxed for car detection compared to a multi-car scenario. Missing a single car may be less frequent. However, a decent recall rate is still desirable. Recall becomes less critical for license plate detection compared to car detection.
The weights for both the models’ metrics are as follows:
Precision: 20
mAP50-95: 15
Recall: 10
Weight , of 1 has been assigned to Total Inference Time, in order to balance the trade-off between speed and accuracy.
7.1.3. Results
In
Table 2, according to TOPSIS analysis, top 2 model combinations(highlighted in bold) are:
TOPSIS Rank 1: YOLOv8s (Small) for Vehicle detection + YOLOv8m (Medium) for License Plate detection
TOPSIS Rank 2: YOLOv8m (Medium) for Vehicle detection + YOLOv8m (Medium) for License Plate Detection.
Next, light intensity analysis will be performed for the top-ranked models according to TOPSIS analysis.s
Table 2.
Performance Comparison of Car Detector and License Plate Detector
Table 2.
Performance Comparison of Car Detector and License Plate Detector
| S.NO. |
VEHICLE DETECTION |
LICENSE PLATE DETECTION |
TOTAL INFERENCE TIME |
FPS |
TOPSIS |
| |
Model |
Precision |
Recall |
mAP50-95 |
Model |
Precision |
Recall |
mAP50-95 |
PER FRAME (Milliseconds) |
|
Rank |
| 1 |
NANO |
0.847 |
0.84 |
0.815 |
NANO |
0.949 |
0.848 |
0.719 |
3.8 |
263.15 |
15 |
| 2 |
|
|
|
|
SMALL |
0.942 |
0.853 |
0.747 |
6.3 |
158.73 |
7 |
| 3 |
|
|
|
|
MEDIUM |
0.942 |
0.86 |
0.768 |
12.2 |
81.96 |
5 |
| 4 |
|
|
|
|
LARGE |
0.946 |
0.859 |
0.787 |
19.2 |
52.08 |
8 |
| 5 |
SMALL |
0.863 |
0.843 |
0.821 |
NANO |
0.949 |
0.848 |
0.719 |
6.3 |
158.73 |
11 |
| 6 |
|
|
|
|
SMALL |
0.942 |
0.853 |
0.747 |
8.8 |
113.63 |
3 |
| 7 |
|
|
|
|
MEDIUM |
0.942 |
0.86 |
0.768 |
14.7 |
68.02 |
1 |
| 8 |
|
|
|
|
LARGE |
0.946 |
0.859 |
0.787 |
21.7 |
46.08 |
6 |
| 9 |
MEDIUM |
0.864 |
0.849 |
0.853 |
NANO |
0.949 |
0.848 |
0.719 |
12.2 |
81.96 |
14 |
| 10 |
|
|
|
|
SMALL |
0.942 |
0.853 |
0.747 |
14.7 |
68.02 |
4 |
| 11 |
|
|
|
|
MEDIUM |
0.942 |
0.86 |
0.768 |
20.6 |
48.54 |
2 |
| 12 |
|
|
|
|
LARGE |
0.946 |
0.859 |
0.787 |
27.6 |
36.23 |
9 |
| 13 |
LARGE |
0.874 |
0.854 |
0.849 |
NANO |
0.949 |
0.848 |
0.719 |
19.2 |
52.08 |
16 |
| 14 |
|
|
|
|
SMALL |
0.942 |
0.853 |
0.747 |
21.7 |
46.08 |
12 |
| 15 |
|
|
|
|
MEDIUM |
0.942 |
0.86 |
0.768 |
27.6 |
36.23 |
10 |
| 16 |
|
|
|
|
LARGE |
0.946 |
0.859 |
0.787 |
34.6 |
28.9 |
13 |
7.2. Light Intensity Analysis:
For simulating the varying lighting conditions, a controllable light source along with an android application [
25] has been used to measure the light intensity at the region of interest. A smartphone camera, coupled with Camo Studio [
26], has been utilized to ensure high-quality footage and integration with OpenCV library. The camera specifications [
27] are as follows:
Main Camera: 12-megapixel (12MP)
Aperture: f/1.8
Lens Configuration: 5P (5-element lens)
Autofocus Technology: Phase Detection Autofocus (PDAF)
Video Output: 1080p at 30FPS with Electric image stabilization (EIS)
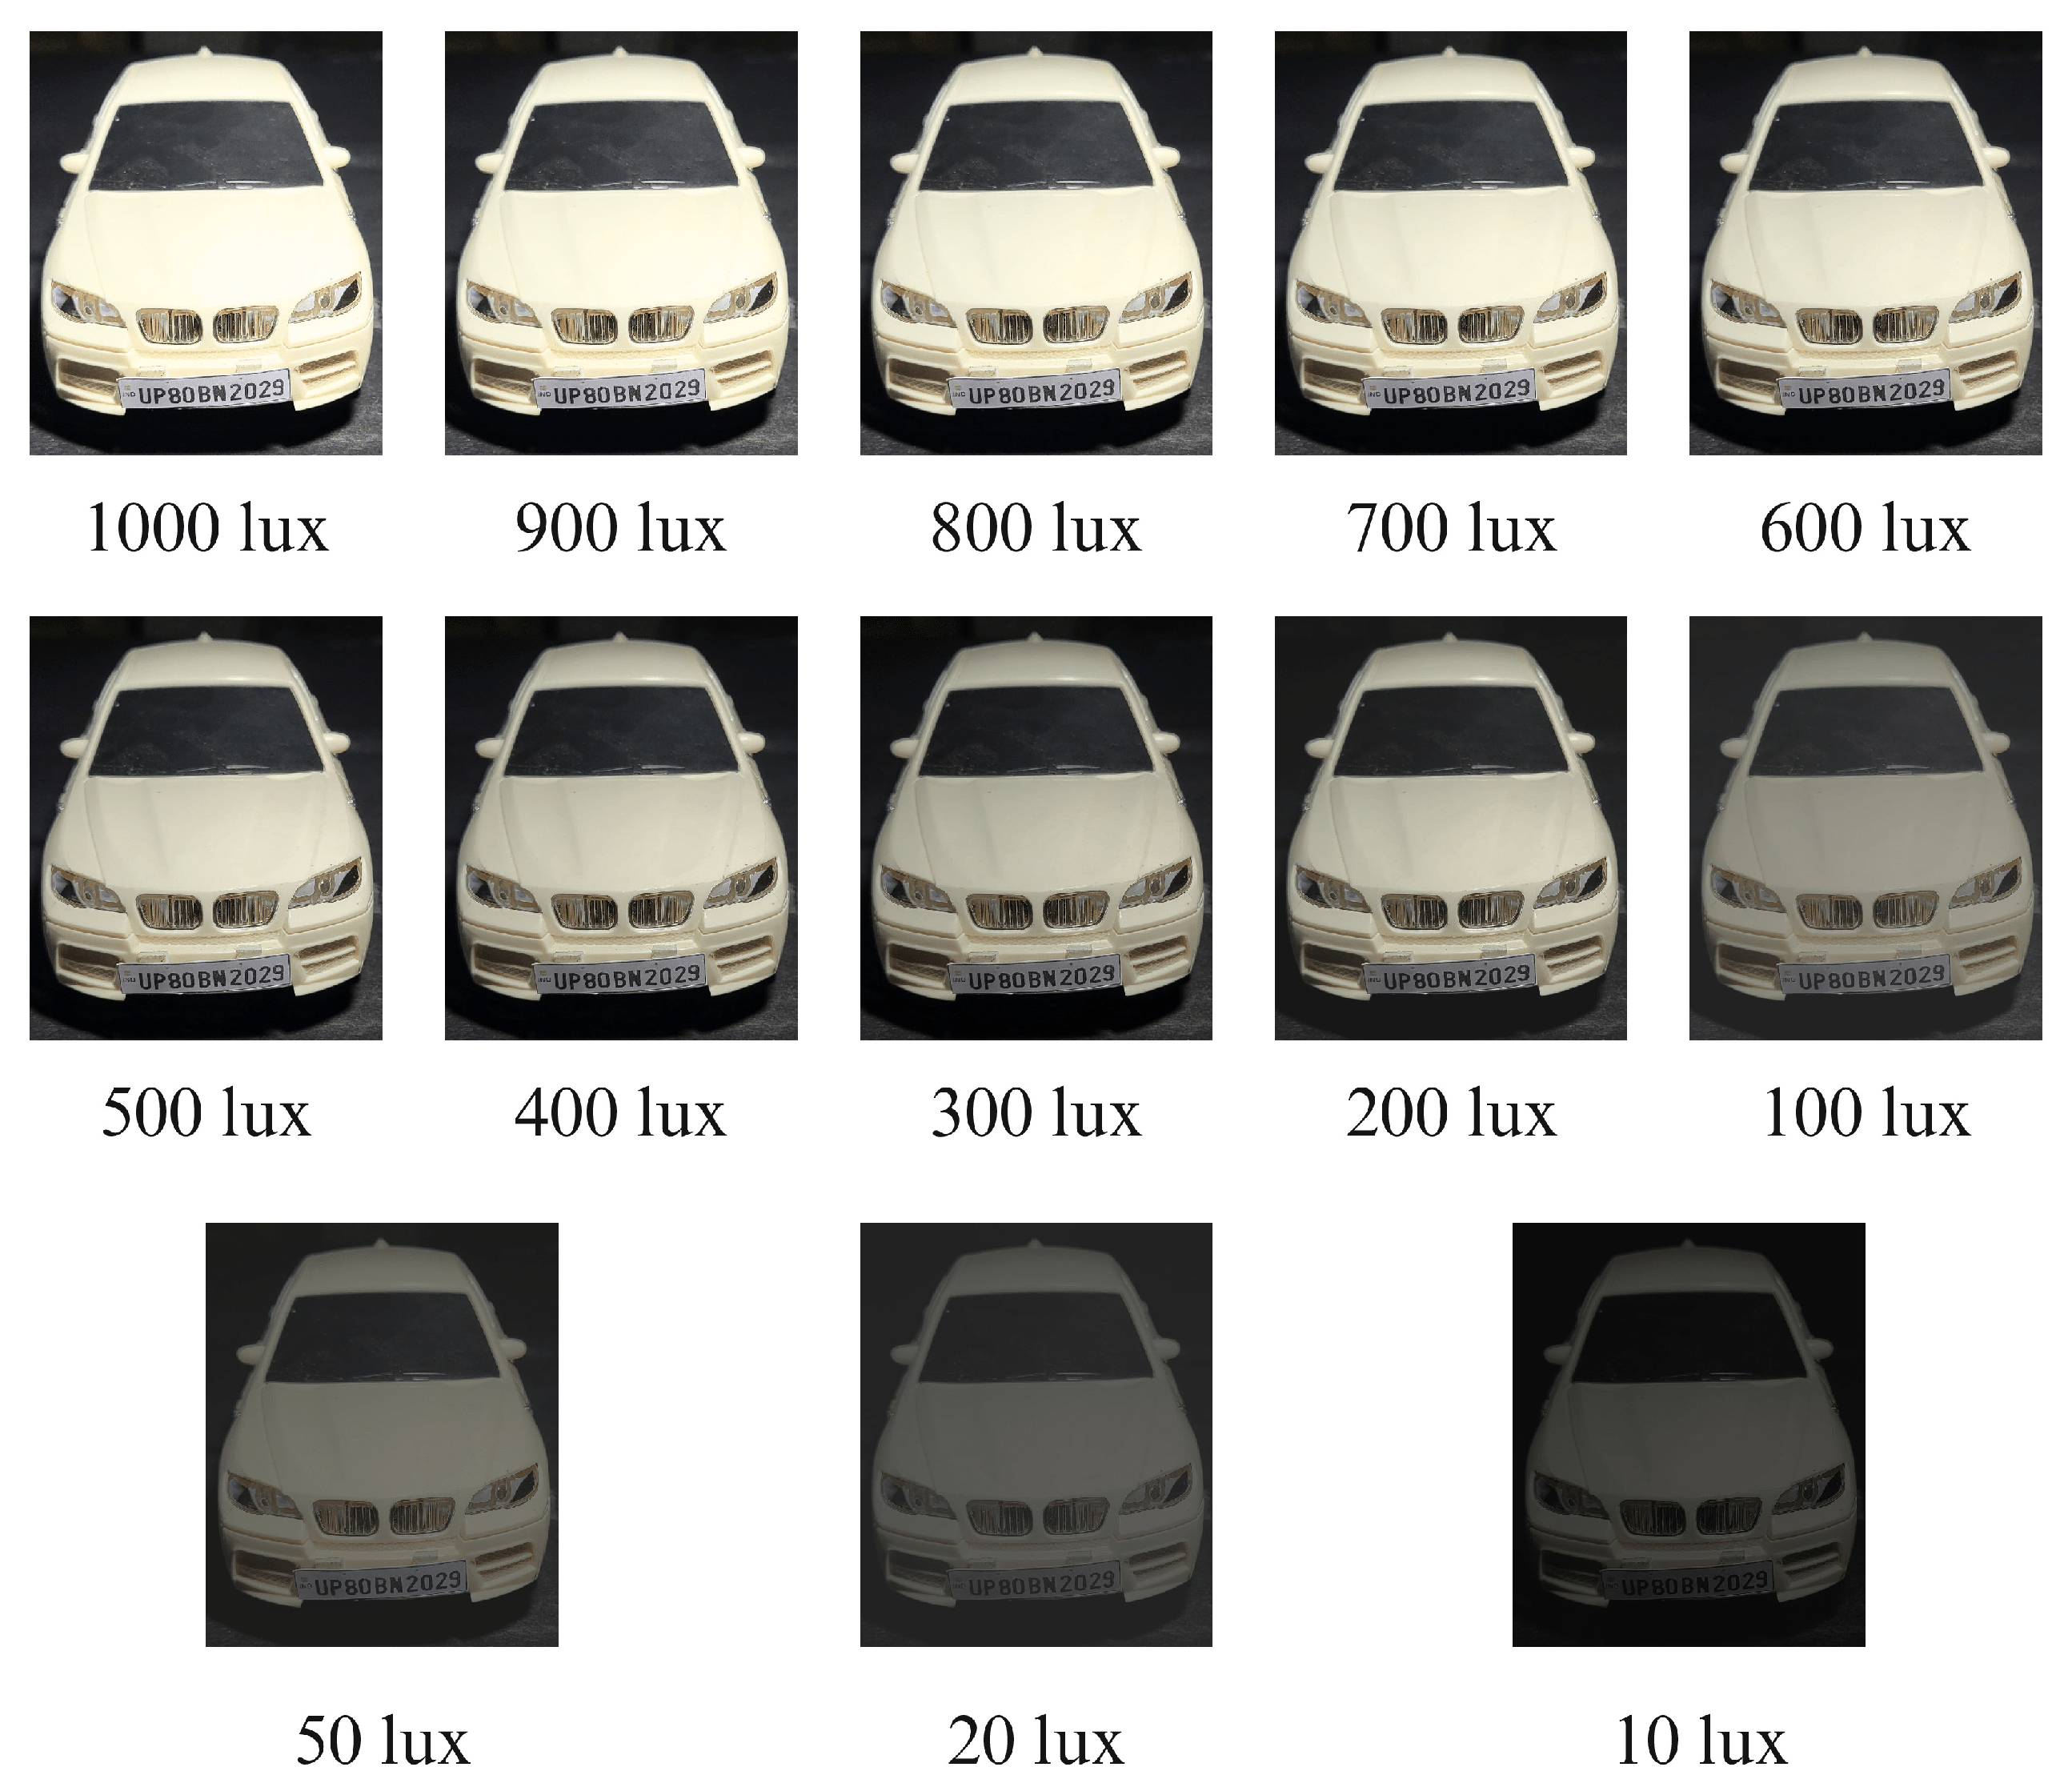
A model car and the Indian High Security Registration Plate (HSRP) of 1:18 scale have been utilized to ensure size continuity in the simulation environment.
Figure 12.
Variation of light intensity.
Figure 12.
Variation of light intensity.
According to Indian Standards [
28], minimum level of luminance on the roads must be 30 lux, in order to ensure safety of the commuters. Thats’s why the ambient lighting level has been reduced to 20 lux in the analysis shown in
Table 3. This proves an estimate of how well the system perform in low lighting conditions.
8. Discussion
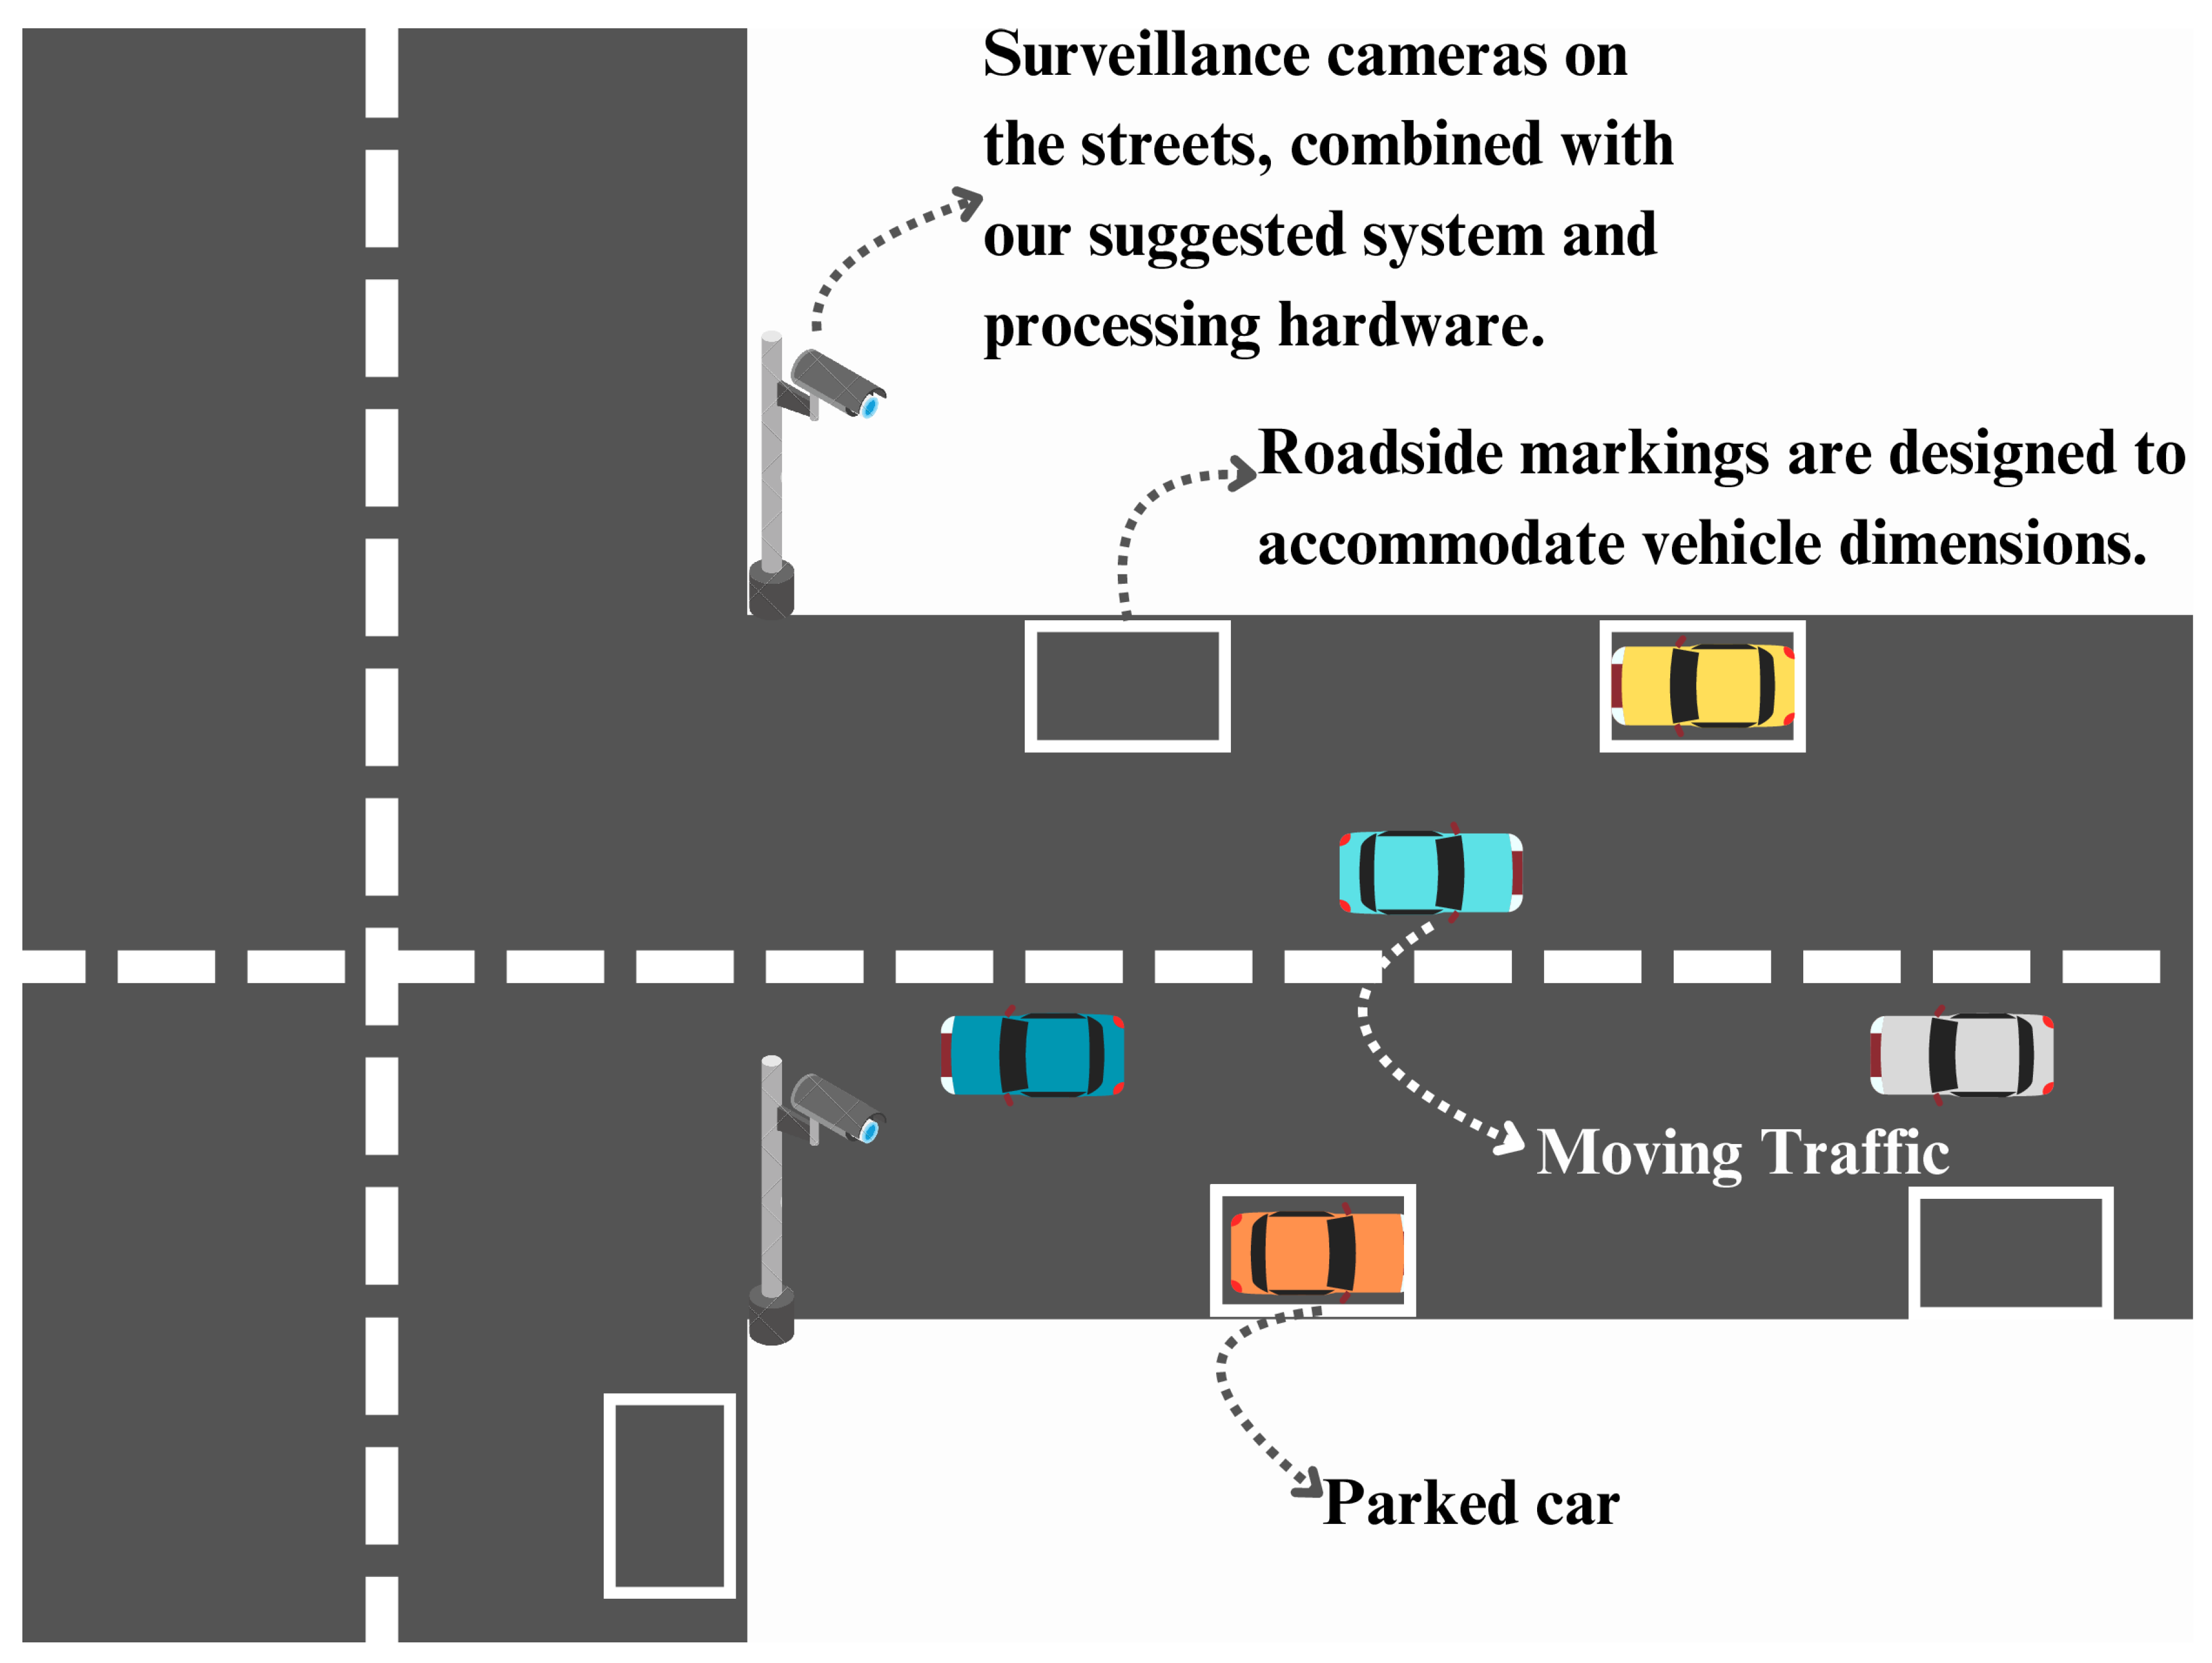
This research investigates a ensembled YOLOv8 approach for vehicle detection and License Plate Detection within smart parking applications. The approach aims to support distributed parking across the streets (
Figure 1) and organize the chaotic encroachment due to vehicles on the shoulders of roads.
8.1. Advantages
The proposed approach offers significant advancements over existing methods:
Enhanced Accuracy and Efficiency: The ensembled strategy focuses the computational resource on the regions of interest for License Plate Detection. Comparing with full-frame processing, the proposed strategy results in better accuracy and shorter inference time. The advantage of the present system is notable because most embedded systems have limited computational resources, making the proposed system more applicable to the smart parking application.
Elevated License Plate Detection Precision: The integration of pre-processing techniques specifically tailored for license plate images significantly improves License Plate Detection accuracy. These techniques address lighting variations and enhance image resolution before feeding data to the Tesseract OCR engine, ensuring robust character recognition.
Data-Driven Model Selection with TOPSIS: The present study employed the TOPSIS technique from MCDM for the optimal selection of the YOLOv8 combinations. The technique is flexible and can calculate the final score of ensembled YOLOv8 system after considering the mAP(Equation (
7)), Precision(Equation (
4)), Recall(Equation (
5)), and inference speed. Stakeholders can select the model that satisfies the specific priorities of their smart parking application.
Robustness Under Varying Lighting Conditions: The evaluation of the top YOLOv8 combinations from the previous study against different lighting intensities is practical information because stakeholders are interested in the robustness of the model in real life.
Investigation of the YOLOv8 combination trade-off: The current research is expected to provide useful information about the trade-off of having a model with various sizes along with performance related to its computational complexity, accuracy, and inference speed. To the best of the author’s knowledge, the optimal selection of the YOLOv8 model has not been the subject of investigation, but the information can help stakeholders to find out which YOLOv8 residue type they should put in their smart parking implementation.
8.2. Limitations
However, for successful real-world deployment, certain limitations require further consideration:
Computational Bottleneck: The ensembled approach inherently introduces additional processing overhead compared to single-stage object detection methods.
Pre-processing Sensitivity: The reliance on pre-processing methods for license plate readability adds complexity to the system. Investigating alternative pre-processing approaches that are more resilient to lighting variations or dynamically adjust parameters based on real-time image characteristics warrants further exploration.
Considerations for Model Selection with TOPSIS: The TOPSIS methodology relies on the assignment of subjective weights to performance metrics. Justifying these weights and assessing the sensitivity of TOPSIS to different configurations is essential for robust model selection. Expanding the evaluation to encompass a broader range of lighting conditions encountered in real-world parking scenarios would further enhance the system’s generalizability.
Scope of Lighting Variation Evaluation: The current evaluation of lighting conditions might not fully capture the entire spectrum of real-world scenarios. Including very low light or direct sunlight scenarios would provide a more comprehensive understanding of the system’s robustness across diverse lighting environments.
Data Availability of Low congestion streets: Nearly accurate data of least congested streets or least traffic prone areas should be available. In order to implement this approach of smart parking system.
Availability of Surveillance Device: Surveillance device should be available coupled with suitable hardware in order to ensure desired functioning of this system.
By acknowledging these limitations through alternative system designs, refined pre-processing techniques, and broader evaluation criteria, future iterations of this research can further strengthen the understanding of trade-offs inherent in designing efficient and reliable smart parking systems.
9. Conclusion and Future Scope
This research has laid the foundation for the next-generation of smart parking solutions which are more accurate, efficient, and robust than their predecessors. The ensembled YOLOv8 approach with targeted processing, the pre-processing techniques for OCR enhancement, and TOPSIS-driven model selection are considerable advancements to the state-of-the-art of this field. Also the approach of parking distributed across the streets and wastelands is expected to reduce traffic congestion and enhancement of the better utilization of limited spaces. It provides an opportunity to organize the unorganized parking and revenue collection for the administrative authorities of the cities. Specific limitations in the proposed design, such as the potential computational bottlenecks of the two-stage implementation, may be addressed through the use of more efficient models for detection, such as YOLOv9 [
29]. Moreover, regional fonts can be used to train specialized OCR engines, rather than enhance them prior to training. As an addition google maps can be integrated for identification of availability of parking space. These technologies can be integrated to mean other system designs as well, and additional research may be required to identify the possible best options. The system also needs to be generalized and tested in a wider variety of parking environments through refining pre-processing techniques and evaluations to ensure that these can be applied to any real-world parking scenario.
References
- McCoy K (2023) Drivers spend an average of 17 hours a year searching for parking spots. 2017.
- Cookson G, Pishue B (2017) Searching for parking costs americans $73 billion a year.
- Jocher G, Chaurasia A, Qiu J (2023) Ultralytics yolov8. https://github.
- Wojke N, Bewley A, Paulus D (2017) Simple online and realtime tracking with a deep association metric. In: 2017 IEEE International Conference on Image Processing (ICIP), IEEE, pp 3645–3649, 10.1109/ICIP.2017.8296962.
- Wojke N, Bewley A (2018) Deep cosine metric learning for person re-identification. In: 2018 IEEE Winter Conference on Applications of Computer Vision (WACV), IEEE, pp 748–756, 10.1109/WACV.2018.00087.
- Cao J, Pang J, Weng X, et al (2023) Observation-centric sort: Rethinking sort for robust multi-object tracking. In: Proceedings of the IEEE/CVF Conference on Computer Vision and Pattern Recognition, pp 9686–9696.
- Sharma N, Baral S, Paing MP, et al (2023) Parking time violation tracking using yolov8 and tracking algorithms. Sensors 23(13):5843.
- Ultralytics (2022) ultralytics/yolov5: v7.0 - YOLOv5 SOTA Realtime Instance Segmentation. https://github.com/ultralytics/yolov5.com, 10.5281/zenodo.7347926, https://doi.org/10.5281/zenodo.7347926, accessed: 7th May, 2023.
- Nguyen DL, Vo XT, Priadana A, et al (2023) Car detection for smart parking systems based on improved yolov5. Vietnam Journal of Computer Science 1:15.
- Hasan Yusuf F, A Mangoud M (2024) Real-time car parking detection with deep learning in different lighting scenarios. International Journal of Computing and Digital Systems 15(1):1–9.
- Das S (2019) A novel parking management system, for smart cities, to save fuel, time, and money. In: 2019 IEEE 9th annual computing and communication workshop and conference (CCWC), IEEE, pp 0950–0954.
- Redmon J, Divvala S, Girshick R, et al (2016) You only look once: Unified, real-time object detection. In: Proceedings of the IEEE conference on computer vision and pattern recognition, pp 779–788.
- Badla S (2014) Improving the efficiency of tesseract ocr engine.
- n (2023) cars dataset. https://universe.roboflow.com/n-b8dyr/cars-ydptb , https://universe.roboflow.com/n-b8dyr/cars-ydptb, visited on 2024-03-30.
- projects M (2024) license plates dataset. https://universe.roboflow.com/merge-projects/license-plates-igyvb , https://universe.roboflow.com/merge-projects/license-plates-igyvb, visited on 2024-03-30.
- Smith R (2007) An overview of the tesseract ocr engine. In: Ninth international conference on document analysis and recognition (ICDAR 2007), IEEE, pp 629–633.
- OpenCV (2015) Open source computer vision library.
- Clark A (2015) Pillow (pil fork) documentation. https://buildmedia.readthedocs.org/media/pdf/pillow/latest/pillow.pdf.
- Ren S, He K, Girshick R, et al (2016) Object detection networks on convolutional feature maps. IEEE transactions on pattern analysis and machine intelligence 39(7):1476–1481.
- Sawant M (2022) Pytesseract: Python-tesseract is an optical character recognition (ocr) tool for python. that is, it will recognize and "read" the text embedded in images. https://pypi.org/project/pytesseract/.
- Kim J, Cho J (2021) Rgdinet: Efficient onboard object detection with faster r-cnn for air-to-ground surveillance. Sensors 21(5):1677.
- Hwang CL, Yoon K (2012) Multiple attribute decision making: methods and applications a state-of-the-art survey, vol 186. Springer Science & Business Media.
- Zavadskas EK, Zakarevicius A, Antucheviciene J (2006) Evaluation of ranking accuracy in multi-criteria decisions. Informatica 17(4):601–618.
- Wikipedia (2024) TOPSIS — Wikipedia, the free encyclopedia. http://en.wikipedia.org/w/index.php?title=TOPSIS&oldid=1185091184, [Online; accessed 02-April-2024].
- Phuongpn (2023) Illuminance - lux light meter. https://phuongpndev.web.app/, [Accessed 02-04-2024].
- Ltd. R (2020) Camo studio. https://reincubate.com/camo/, [Accessed 02-04-2024].
- (2019) Realme 5 Smartphone. Realme Mobile Telecommunications (India) Private Limited.
- Institution IS (1981) Indian Standard CODE OF PRACTICE FOR LIGHTING OF PUBLIC THOROUGHFARES. Indian Standards Institution, New Delhi, iS 1944-5 (1981).
- Wang CY, Liao HYM (2024) YOLOv9: Learning what you want to learn using programmable gradient information.
|
Disclaimer/Publisher’s Note: The statements, opinions and data contained in all publications are solely those of the individual author(s) and contributor(s) and not of MDPI and/or the editor(s). MDPI and/or the editor(s) disclaim responsibility for any injury to people or property resulting from any ideas, methods, instructions or products referred to in the content. |
© 2024 by the authors. Licensee MDPI, Basel, Switzerland. This article is an open access article distributed under the terms and conditions of the Creative Commons Attribution (CC BY) license (http://creativecommons.org/licenses/by/4.0/).
