1. Introduction
Vegetation restoration was considered to be an efficient measurement to control soil erosion, windbreak and sand fixation and soil carbon sequestration for degraded land [
1,
2,
3], known as “Grain for Green”, and “Three North Shelterbelt Development”. However, in arid and semiarid area, unreasonable afforestation leads to the SWC deficits of deep soil layers [
4,
5,
6,
7], and then influences the sustainable development of artificial forests. Therefore, SWC is a key factor to be considered when vegetation is recovering in arid areas. In addition, SOC sequestration in terrestrial ecosystems has long been areas of great research effort, which was caused by their effects on climate change and the ecosystem[
8]. And it is reported that revegetation is considered to be an effective approach to enhance soil C sequestration [
9,
10]. Therefore, understanding the response of SWC and SOM to vegetation restoration as well as their coupling relationship is of great significance for the sustainable development of vegetation restoration in arid regions [
11].
At present, a lot of studies have been performed on the response of SWC and SOM as well as their coupling interactions to vegetation restoration in arid regions, mainly concentrating on different vegetation types, different restoration years and different succession stages [
12,
13,
14,
15]. For example, Yang et al. [
12] evaluated the spatiotemporal variation of soil carbon storage and soil water storage to
R. pseudoacacia forest, and found vegetation restoration increases carbon sequestration while depleting soil water, and stand density (SD) is a major contributor to the dynamics of SWS and SCS through its influence on vegetation, soil and litter characteristics. Chen (2022) [
13] compared the SWC and SOC response of different plant community of arid area, found topography is the main factor affecting SWC and SOM in 100-200 cm, and soil texture is the stable driving factor affecting SWC and SOM in full profile (0-200 cm). Zhang and Shangguan [
15] evaluated the response of SWC and SOC to a long-term vegetation succession (~150 a) and found the influence of soil physical factors on the interaction between SWC and SOC gradually weakened during vegetation succession. However, few studies have focused on the response of SWC and SOM to different vegetation types of the same age, which is of great significance for rational selection of tree species for vegetation restoration.
China’s Loess Plateau is a typical arid and semi-arid region with the short water source. The vegetation cover in the area has been significantly improved since the China government launched several projects [
1]. However, it is reported that there is significant soil water deficit after revegetation on the Loess Plateau [
4,
5]. Therefore, it is vital to investigate the response of SWC and SOC to vegetation recovery. In our study, the typical artificial forests of the similar recovery years are taken as the research object. The aims were (1) to investigate the vertical distributions of SOC and SWC as well as their coupling interaction of typical afforestation in China’s Loess Plateau; (2) to assess the extent of the tradeoff between SWC and SOC; and (3) to quantify the relative contributions of various environmental factors to SWC and SOC.
2. Materials and Methods
2.1. Study Area
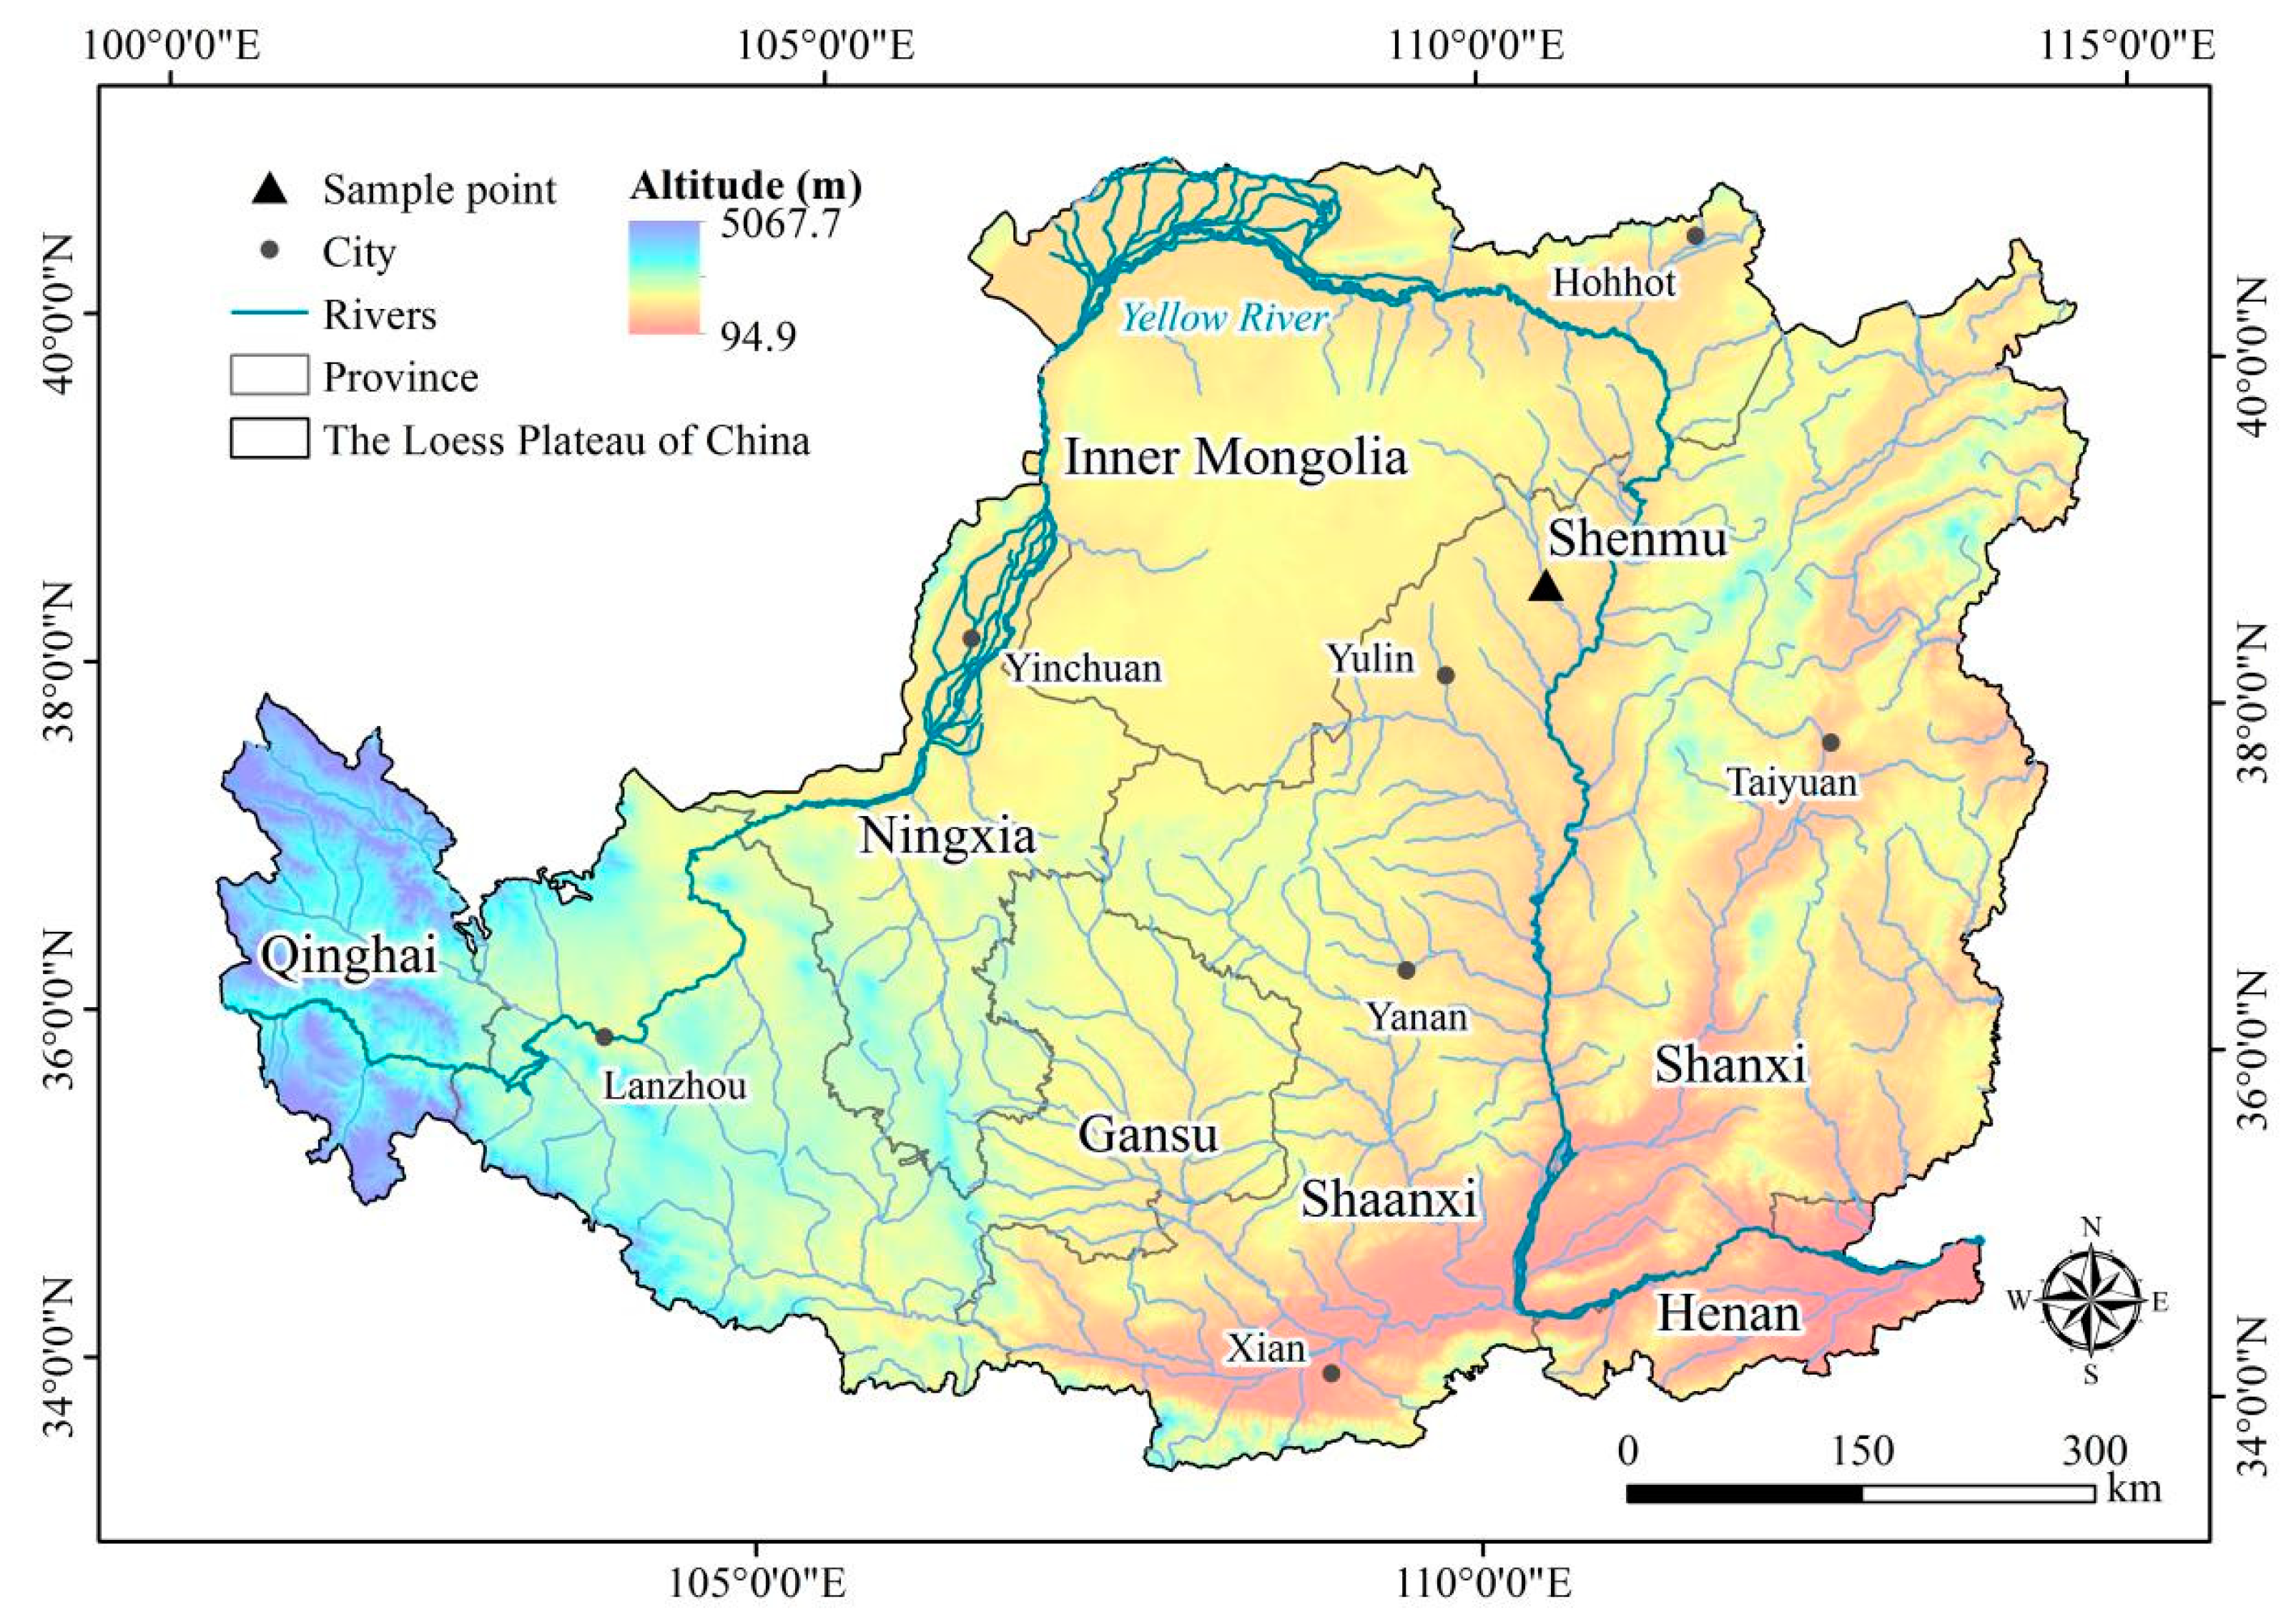
The study area was located in the Liudaogou Catchment of China’s Loess Plateau (N 38°46′~38°51′; E 110°21′~110°23′) (
Figure 1), and the area is 6.9 km
2. The area belongs to a moderate-temperate semiarid climate and the ecological environment is fragile. With the mean annual temperature being 8.4 °C, the mean annual precipitation is 437 mm. The precipitation varies on an annual and interannual scale and is mainly concentrated from June to September, occupying over 60% of the annual rainfall. The average annual potential evapotranspiration is 785 mm. The zonal soil types include eutric regosols, calcaric arenosols, calcaric regosols, and calcaric fluvisol. Vegetation cover has increased significantly since the use of the “Grain for Green” project in 1999.
The study area is located in the northern part of the Loess Plateau, which has suffered a lot of soil erosion. To select suitable tree species for soil and water conservation, three common plantation forests on the Loess Plateau were planted in the study area (
Pinus sylvestris,
Pinus tabuliformis and
Populus simonii) since 1980s (before the “Grain for Green” of the Loess Plateau). The response of SWC and SOM to vegetation restoration was evaluated by selecting three kinds of planted forests using grassland as the control. The planting time and site conditions of the three plantations were consistent. It is of noted that the planting density of different plantations is different, which is caused by the different size and morphology of the plants when planting. In addition, this is common in similar studies to evaluate the suitability of planted forests [
16,
17].
Table 1 showed the basic information of three plantations.
2.2. Field Sampling and Laboratory Analysis
A 15 km × 15 km plot of each plantations was selected to collect soil samples. Soil samples of SWC were collected from May to November of 2023. Soil anger (5 cm in diameter) was used to collect disturbed soil samples, and the sampling interval was 10 cm for 0-1 m, and 20 cm for 1-5 m. And three random holes were chosed to collect soil water samples for each sampling. Soil samples of SOC were collected in November in 2023. When soil samples of SWC were collected, a part of soil were stored in a plastic bag to measure SOC. And the sampling interval was the same as that of SWC.
To measure the SWC, a portion of each disturbed soil sample was oven-dried at 105 ℃ for 24 h. The rest soil samples were air-dried and sieved to 2 mm and were then adopted for analyzing the soil’s physical and chemical properties. The soil SOC was identified by the potassium dichromate volumetric method. With the use of a Mastersizer 2000 (Marlven Instruments, Malvern, England), the soil particle composition was explored by laser diffraction.
2.3. Evaluation Indices
The soil water content deficit (SWCD, %) refers to the soil water content deficit compare to the control, which could be evaluated [
18,
19]:
where SWC
i,j and SWC
0,j is the soil water content in the jth soil layer of the ith treatment and the control observations.
Soil organic carbon deficit (SOCD) is calculated followed by [
19]:
where SOCD
i,j and SOCD
0,j is the soil organic content in the jth soil layer of the ith treatment and the control observations.
2.4. Evaluation of Tradeoff
The root mean squared error (RMSE) was used to quantify the tradeoff of SWC and SOC, which was proved to be an effective index of balancing different ecosystem services (ES) [
20,
21] . It is noted it is necessary to standardize data of SWC and SOC to eliminate dimensional relationships between different variables. And the equation of ES standardization was followed:
Where ES
std represent the standardized value, ES
obs represent the observed value, ES
max represent the maximum value, ES
min represent the minimum value, respectively. In addition, the equation of RMSE was followed:
Where ES1
(i) is the normalized value of ES1, ES2
(i) was the normalized value of ES2, n is the number of observations. And more details on trade-off analysis have been published in Su et al. (2021) and Feng et al. (2020).
2.5. statistical Analyses
The normality of data was assessed using the Kolmogorov-Smirnov test, and the variance homogeneity was determined using the Levene test. A one-way analysis of variance (ANOVA) was conducted to examine the differences in the SWC and the SOC content of different plantations. The significance level was defined to 0.05. All statistical analyses were performed in SPSS 22.0. Redundancy analysis (RDA) using CANOCO 5.0. was performed to decide the relative contributions of soil properties to SWC and SOC.
3. Results
3.1. Vertical Distributions of SWC of Different Plantations and SWCD
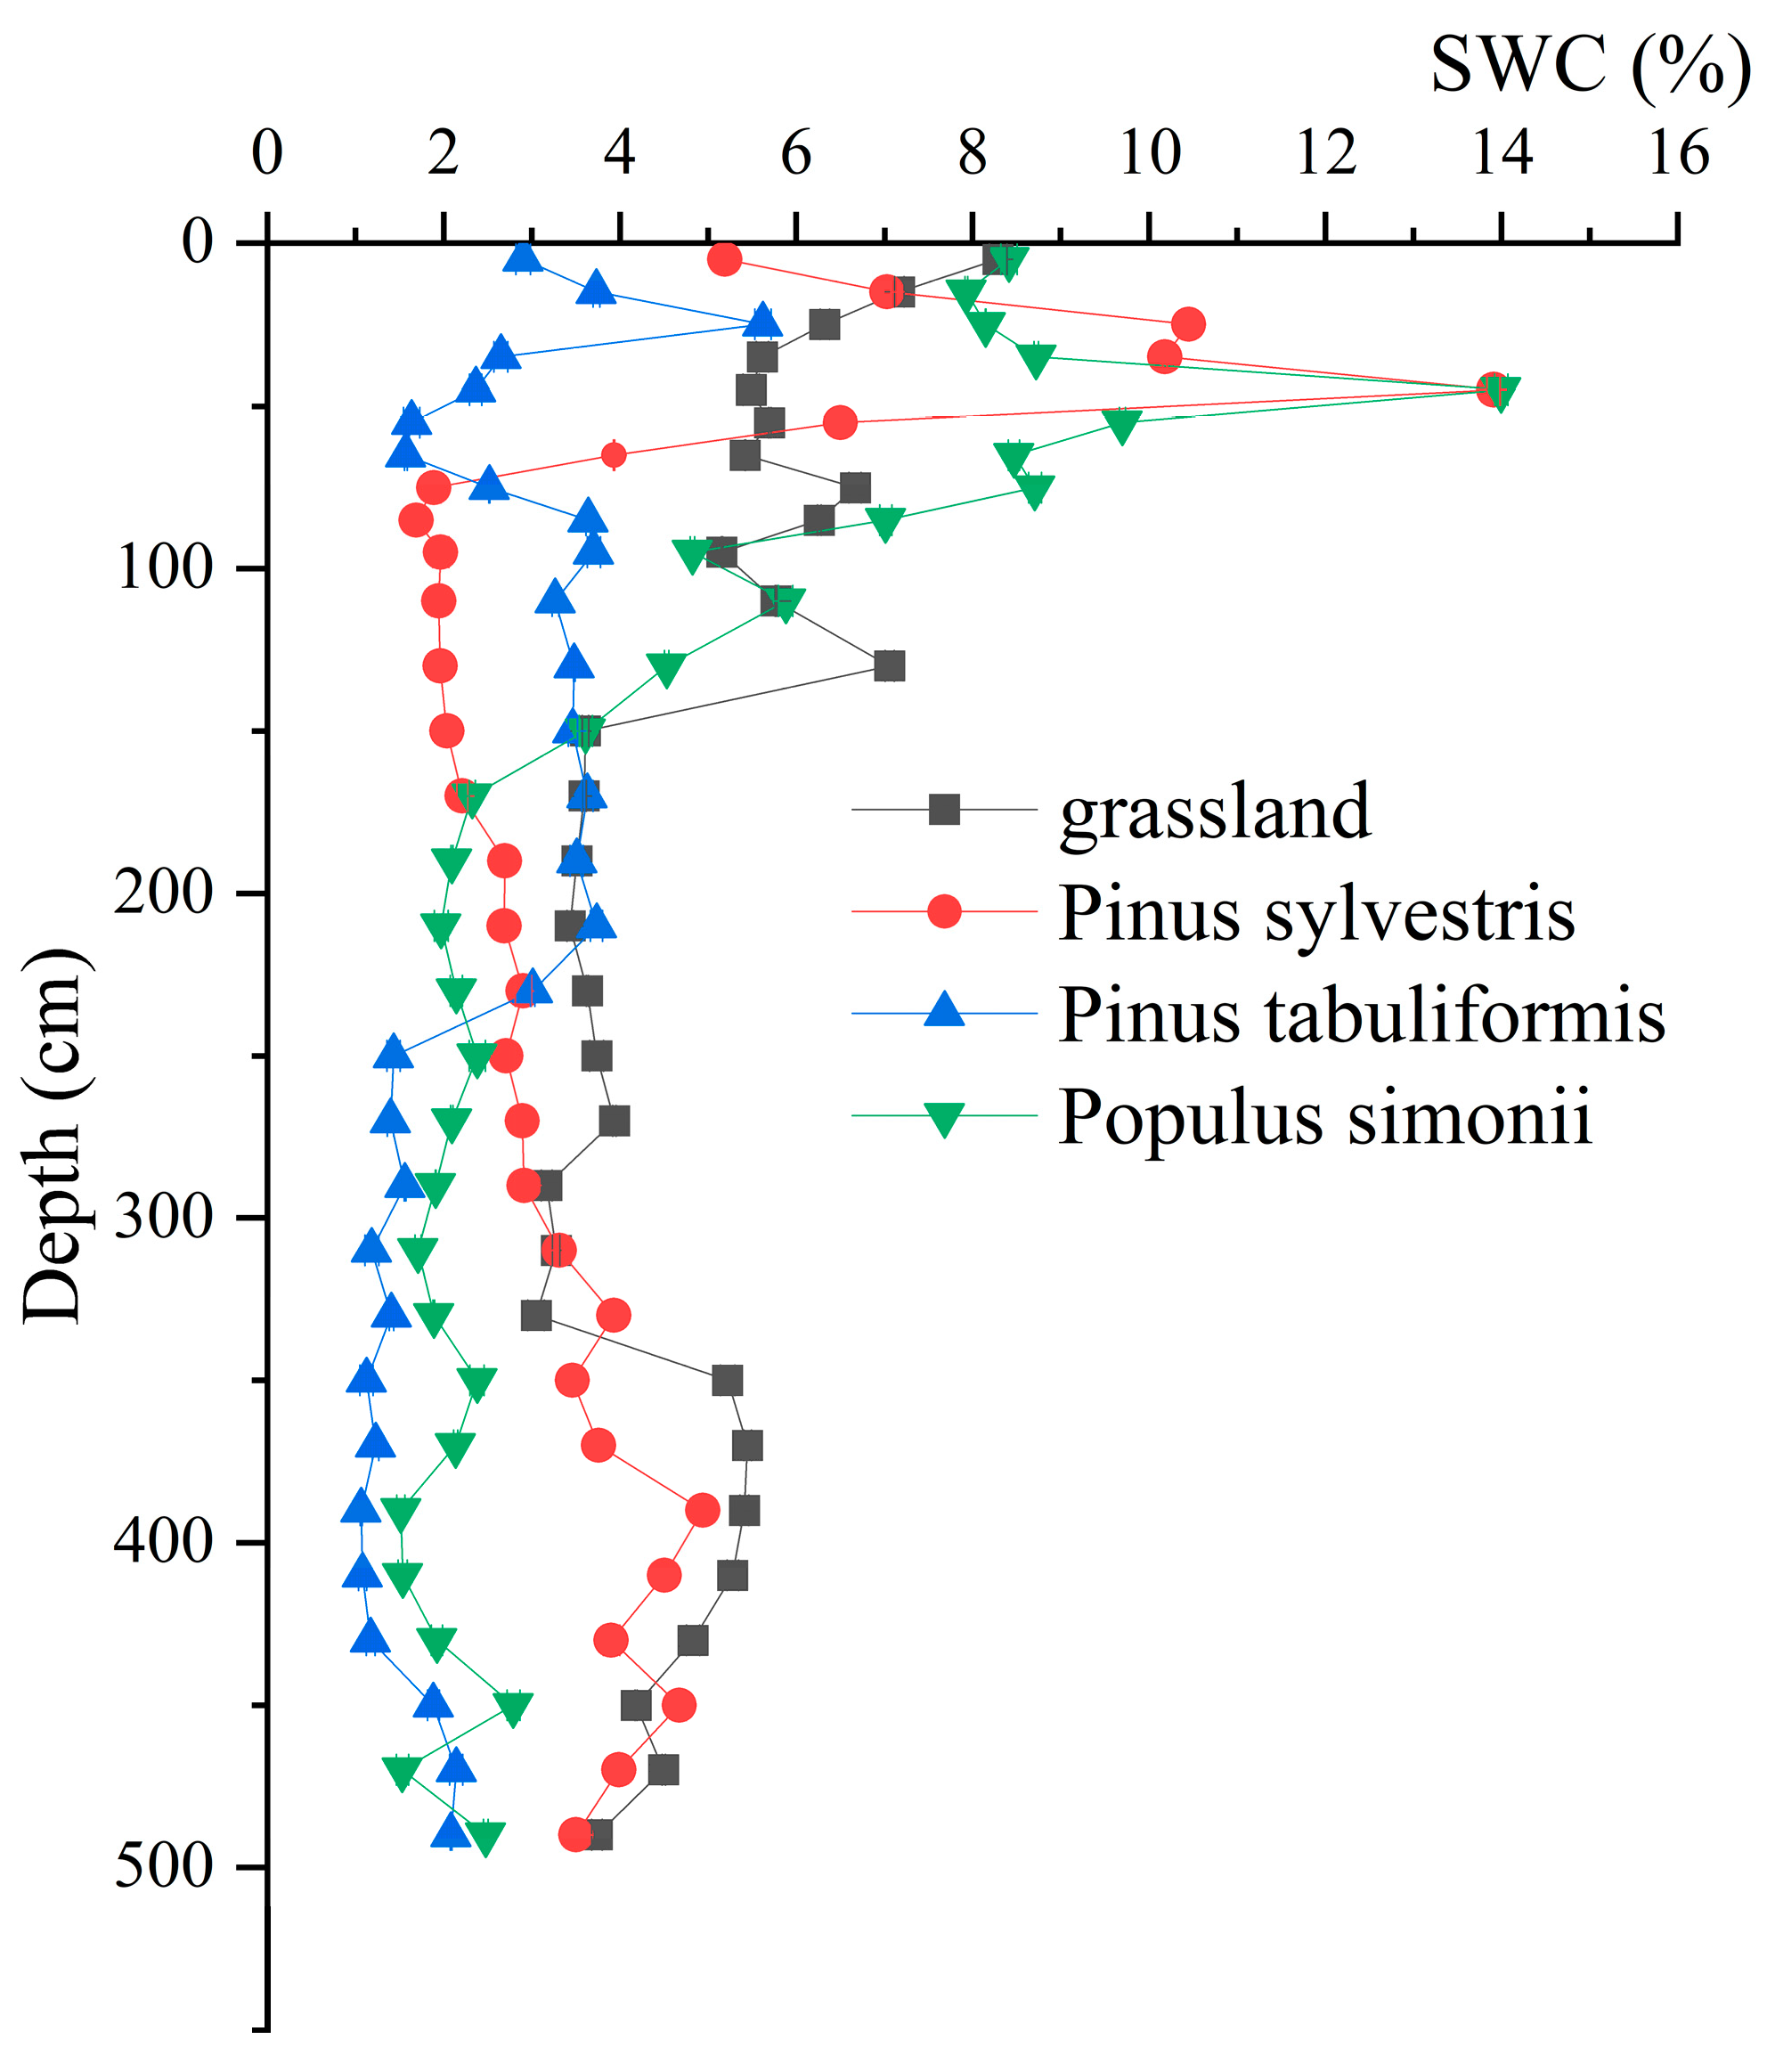
Figure 2 presents the vertical distributions (0-500 cm) of SWC of different plantations. It is noted vertical distributions of SWC were the mean value of different months. Obviously, SWC of different plantations had large variations for 0-1 m, explaining that SWC of 0-1 m was influenced by a lot of factors, including rainfall, solar radiation, litter and root, leading to big variations. Therefore, in this study, we mainly investigated the distribution trend of SWC between 1 and 5 m. From 1 to 5 m, Grassland and
Pinus tabuliformis generally presented showed a stable trend. It is noted that SWC of the grassland increased significantly after 3.5 m. This indicated that SWC of 1-3.5 m was significantly consumed.
Pinus sylvestris exhibited a gradual increasing trend.
Populus simonii tended to decrease from 1 m to 2 m, and remained stable from 2 m to 5 m. Mean SWC of different plantations showed the following order: grassland (4.95%) >
Populus simonii (4.49%) =
Pinus sylvestris (4.49%) >
Pinus tabuliformis (2.43%) (
Table 2). SWC of
Pinus tabuliformis was significantly lower than other plantations, and then consumed more SWC. The coefficient of variation (CV) values of different plantations were in the following order:
Populus simonii (74.22%) >
Pinus sylvestris (65.69%) >
Pinus tabuliformis (47.19%) > Grassland (27.59%) (
Table 2), which were consistent with other results [
22], reporting that CV of grassland was significantly lower that of forests.
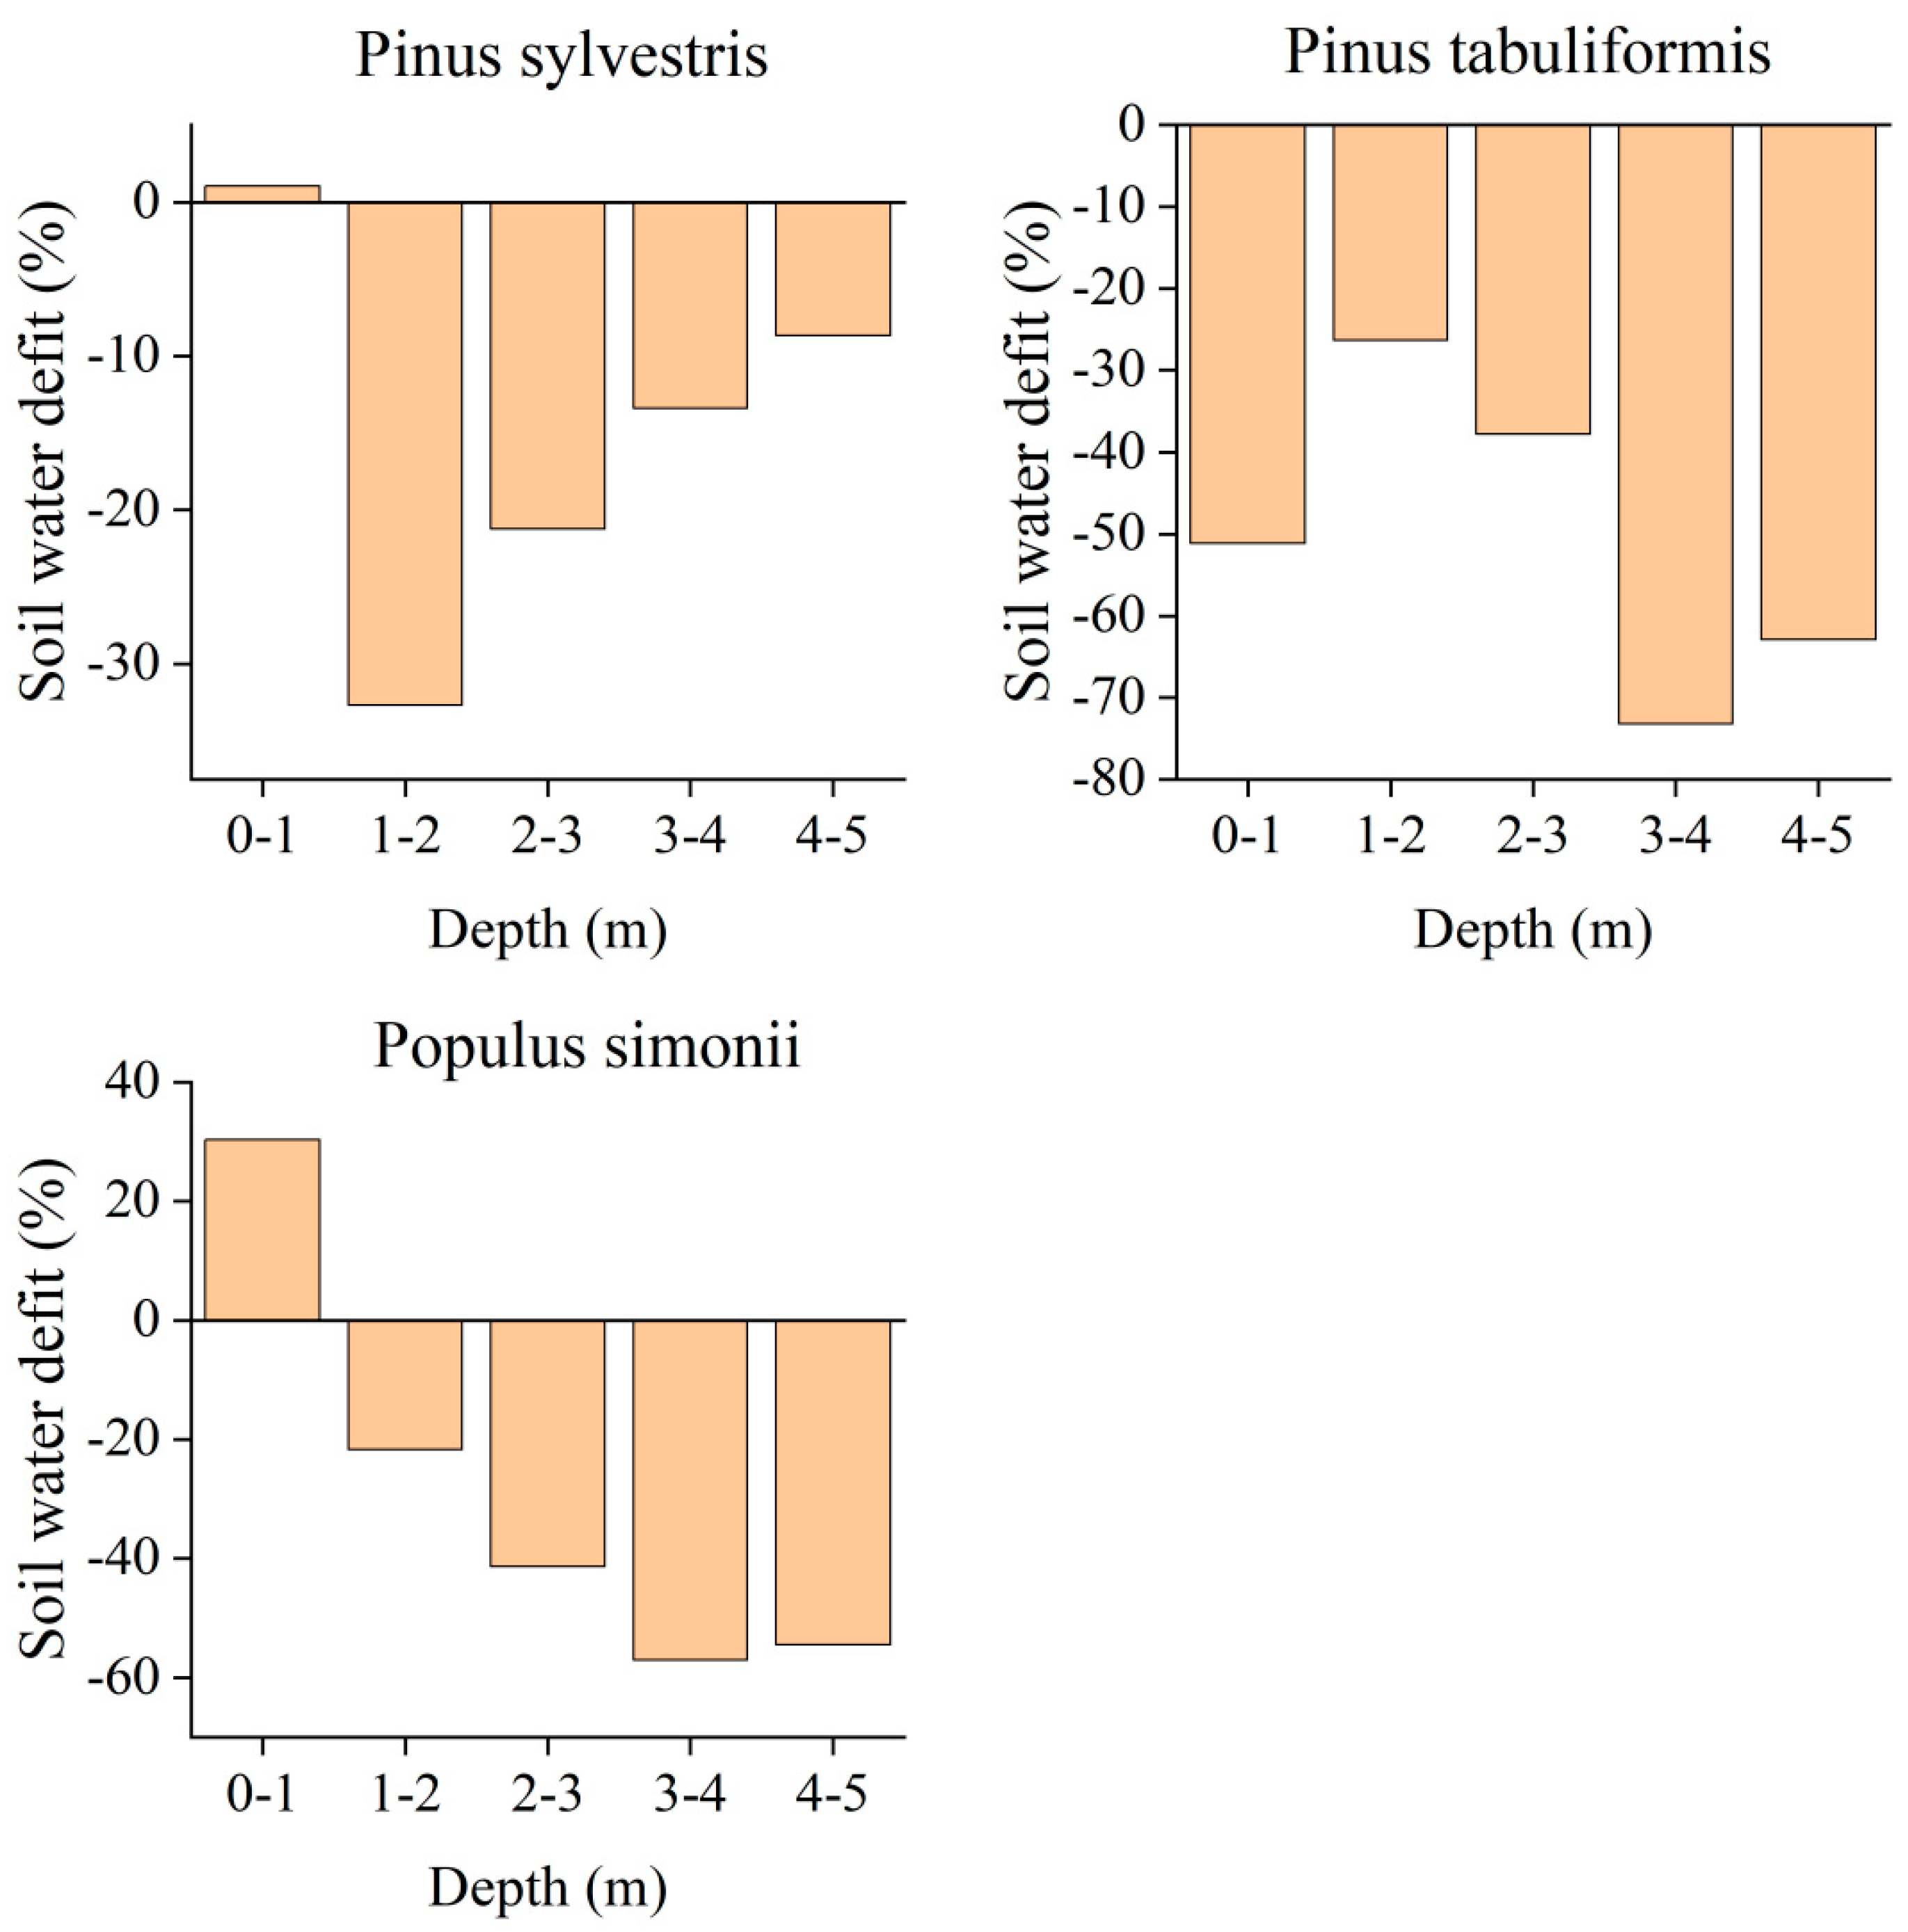
Compared to control (grassland), the total SWCD of different plantations was -14% (
Pinus sylvestris), -51% (
Pinus tabuliformis) and -13% (
Populus simonii), respectively (
Figure 3). The SWCD of
Pinus tabuliformis was the largest while the lowest for Populus simonii. To detailly understand the DSWS of different plantations, we performed the SWCD of different depths (
Figure 2). SWCD of
Pinus sylvestris showed a decreased trend, and SWCD was the highest for 100-200 cm (33%), indicating that SWC of 100-200 cm was widely used by
Pinus sylvestris. SWCD of
Populus simonii and
Pinus tabuliformis presented an increased trend, indicating that SWC of deep soil layer was used widely by
Populus simonii and Pinus
tabuliformis, and may exceed 500 cm.
3.2. Vertical Distributions of SOC Content and SOCD
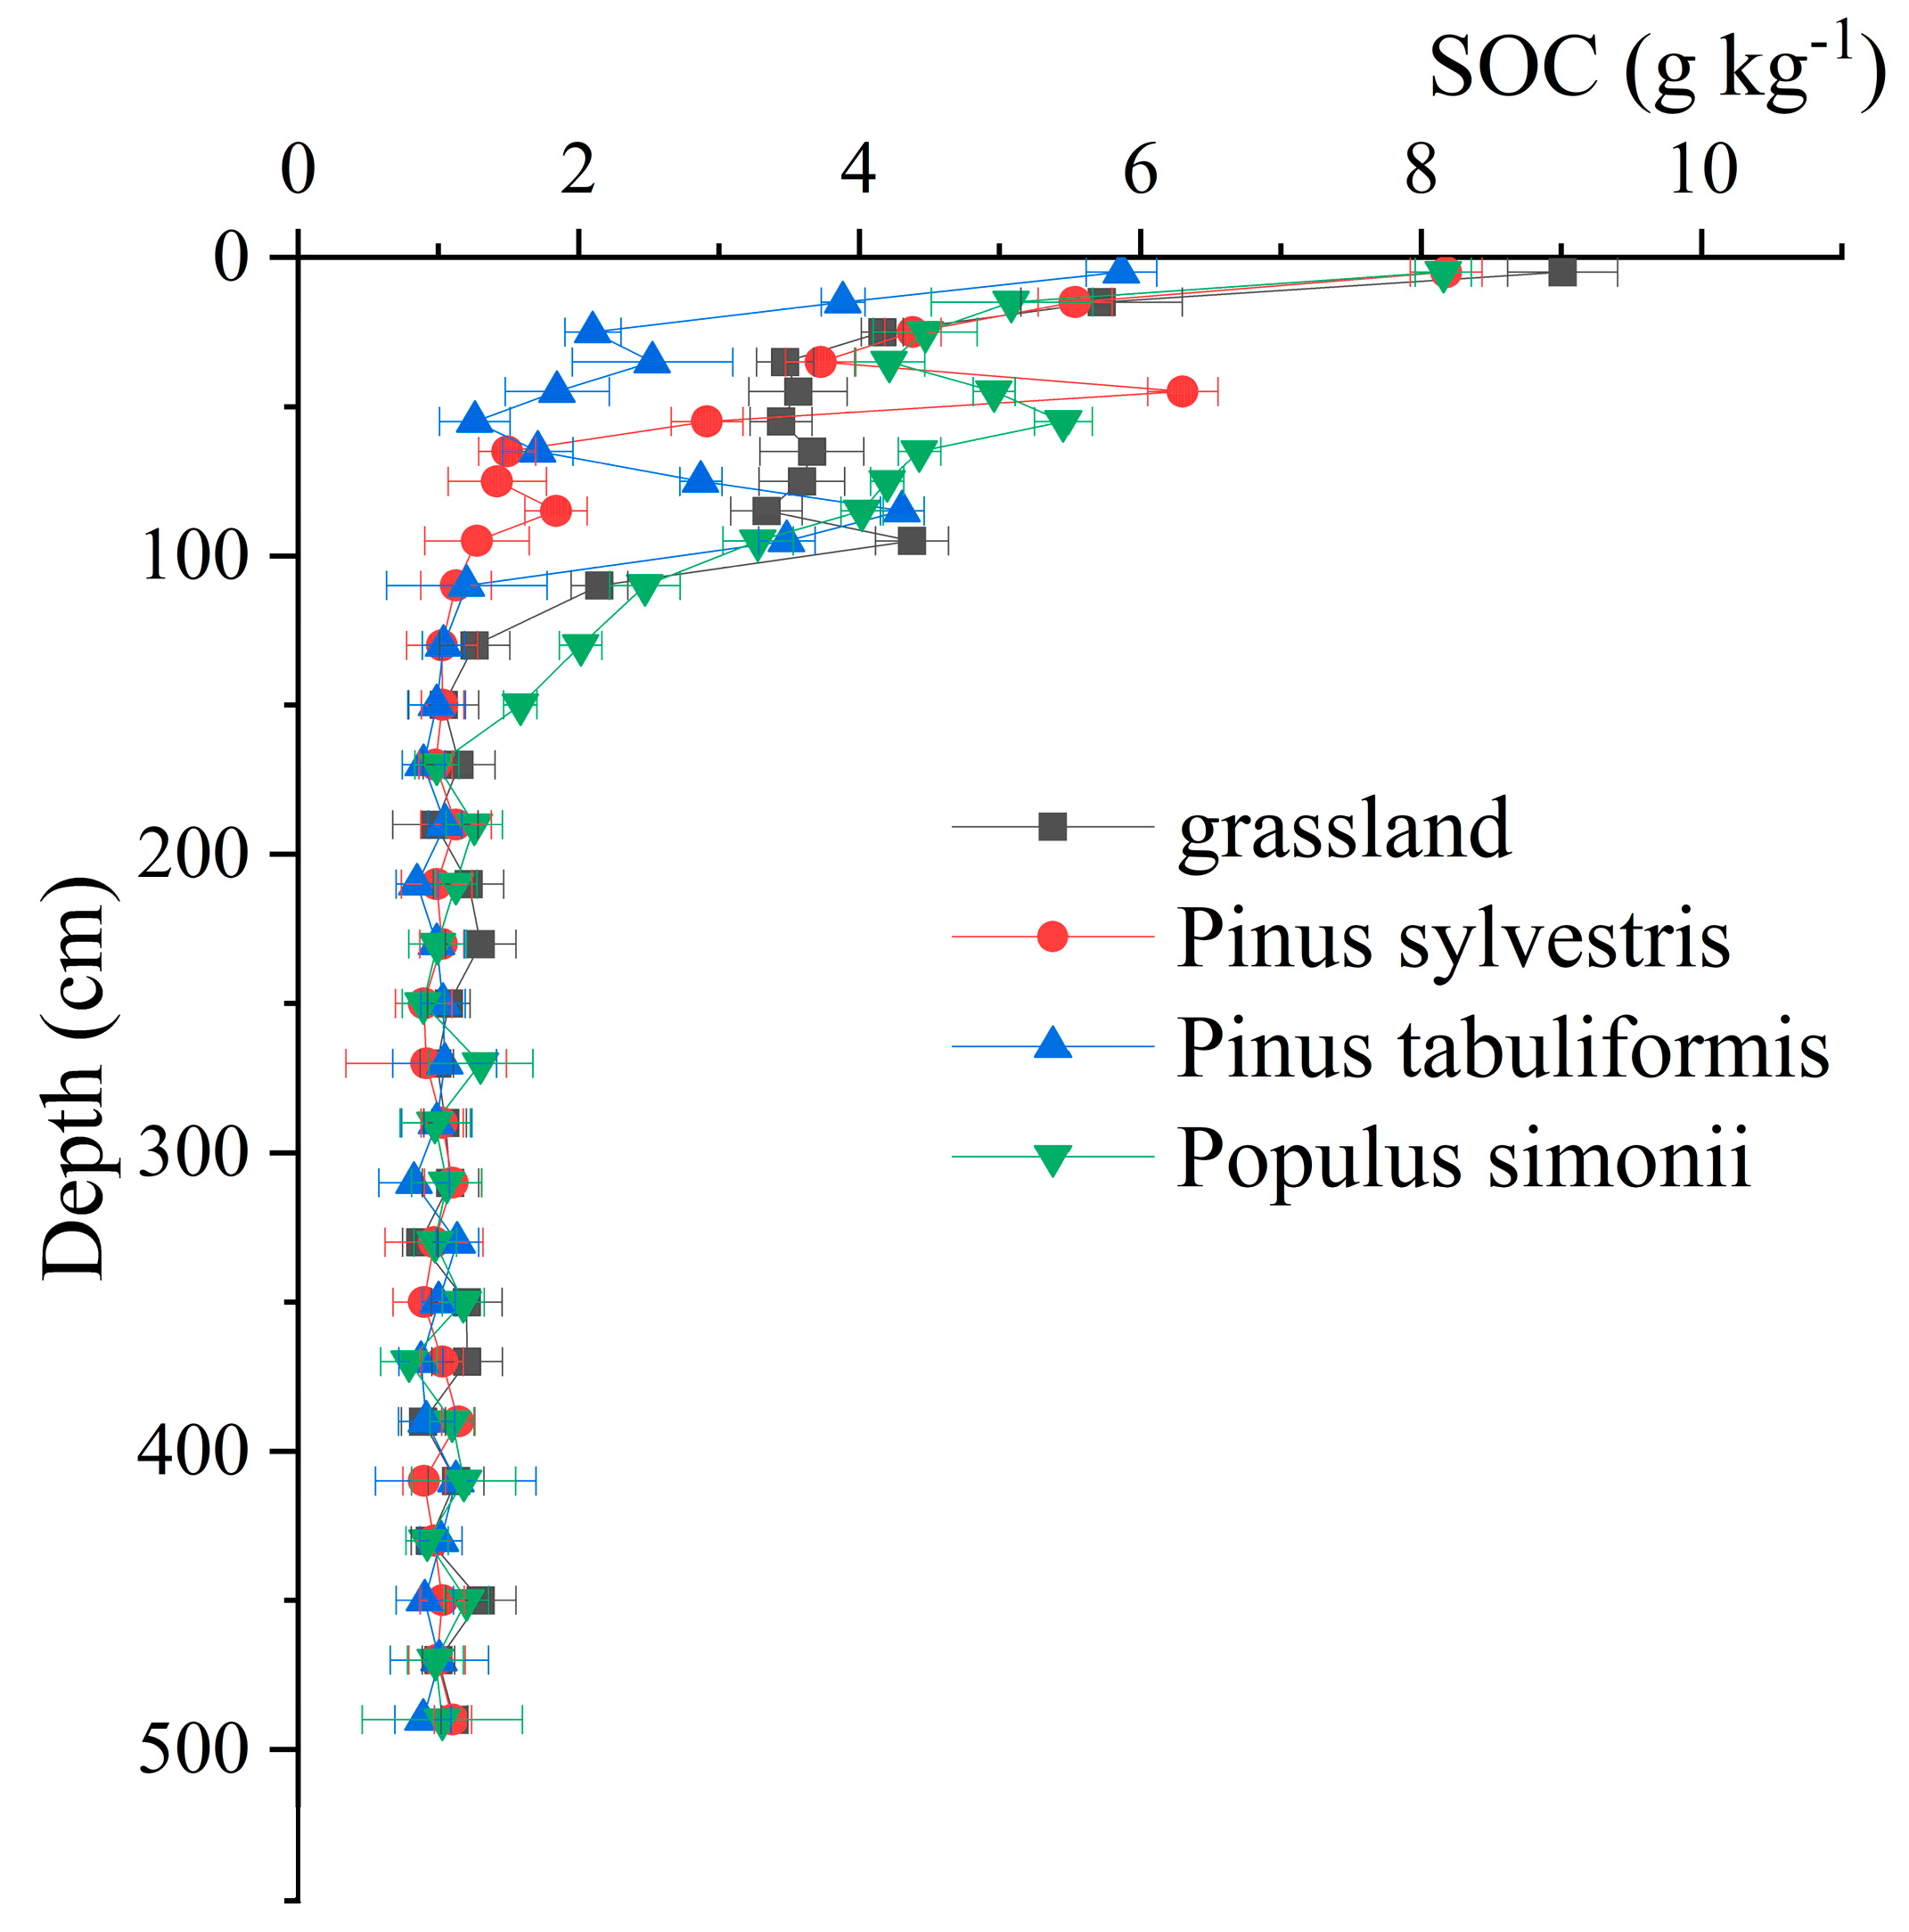
With the increase of depth, the SOC content of all plantations decreased first and then remained stable (
Figure 4). It is a consensus that the impact of afforestation on SOC mainly concentrates on the shallow soil layer, especially for 0-100 cm, while there is no obvious difference for the deep soil layer [
12,
13,
23]. Mean SOC of different plantations showed the following order:
Populus simonii (2.41 g kg
-1) > grassland (2.24 g kg
-1) >
Pinus sylvestris (1.91 g kg
-1) >
Pinus tabuliformis (1.65 g kg
-1), respectively. In addition, the coefficient of variation (CV) values of SOC of different plantations were in the following order:
Pinus sylvestris (96.81%) > Grassland (83.35%) >
Populus simonii > (79.53%) >
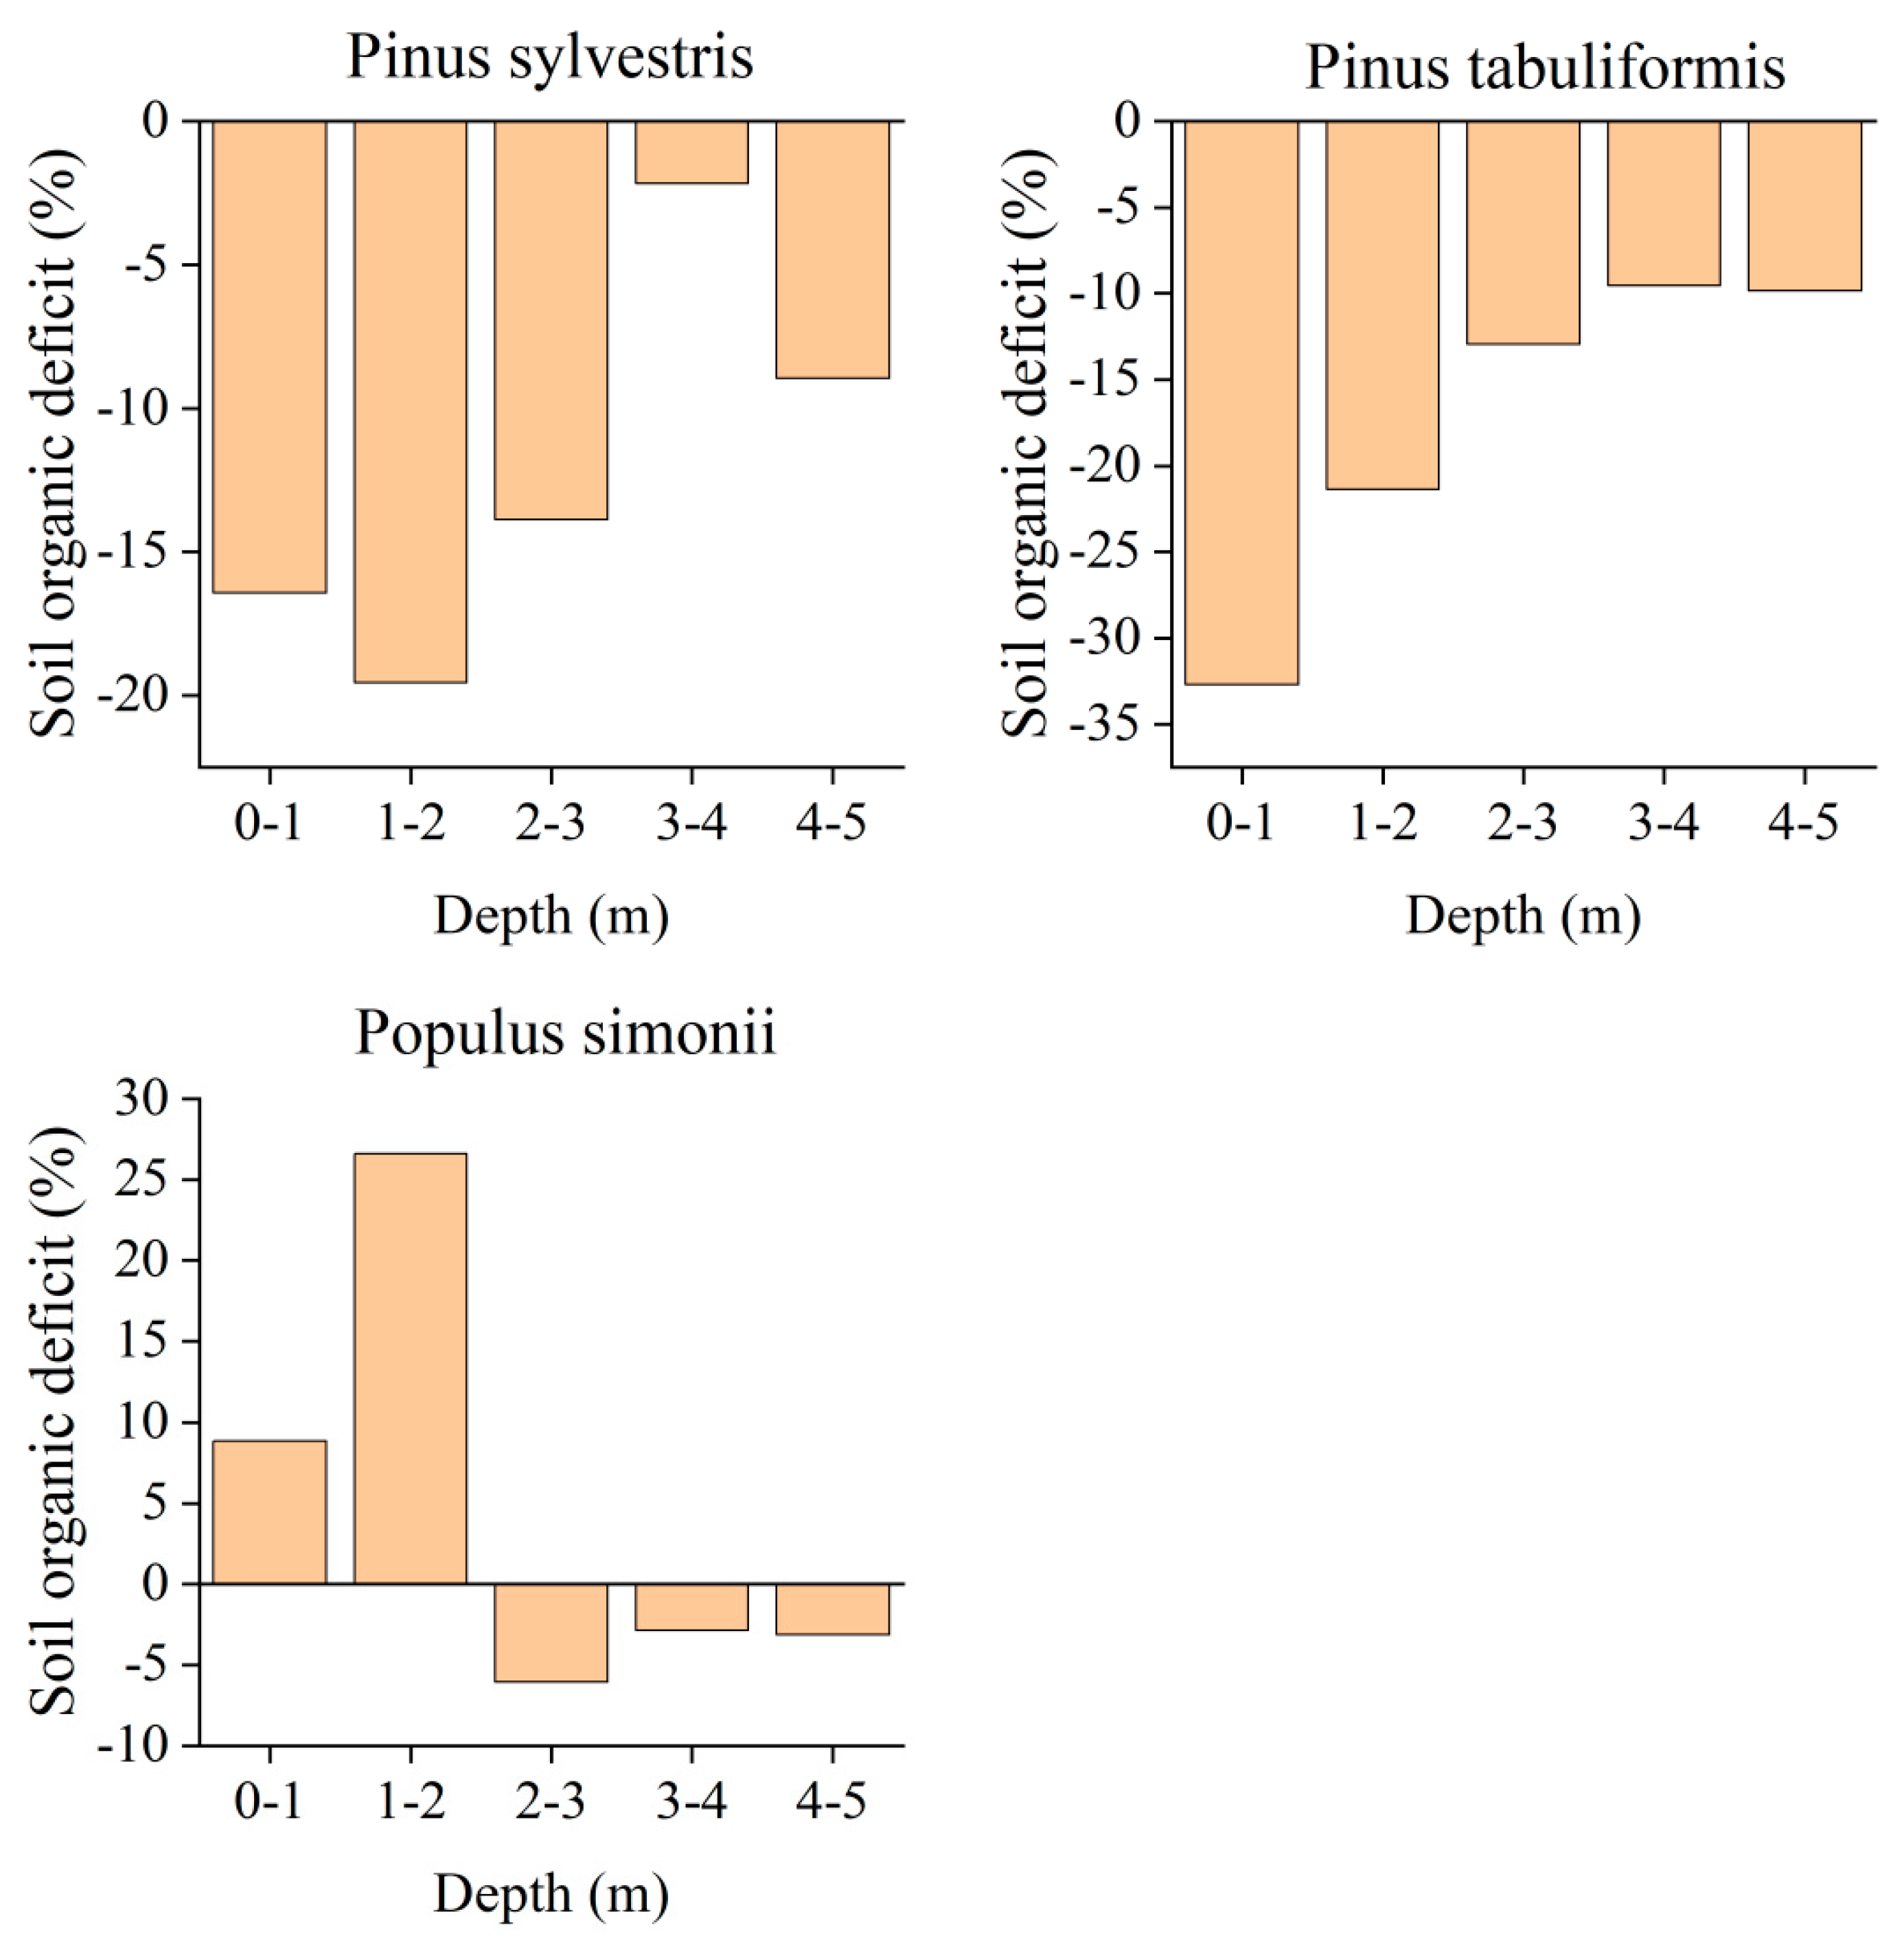
Pinus tabuliformis (75.16%). Compared to grassland, the SOCC of different plantations was -15% (Pinus sylvestris), -26% (
Pinus tabuliformis) and 8% (
Populus simonii) (
Figure 5), indicating that
Populus simonii stored SOC content, while
Pinus sylvestris and
Pinus tabuliformis consumed SOC content, and the depth of store or consumption was mainly 0-150 cm. With the increase of depth, SOCD of plantations all presented a decreased trend. Moreover, it was also explained that the difference of different plantations was mainly focused on the shallow layers (0-100 cm), while there existed no obvious difference for the deep layers, resulting in the decrease trend of SOCD.
3.3. Tradeoff between SWC and SOC
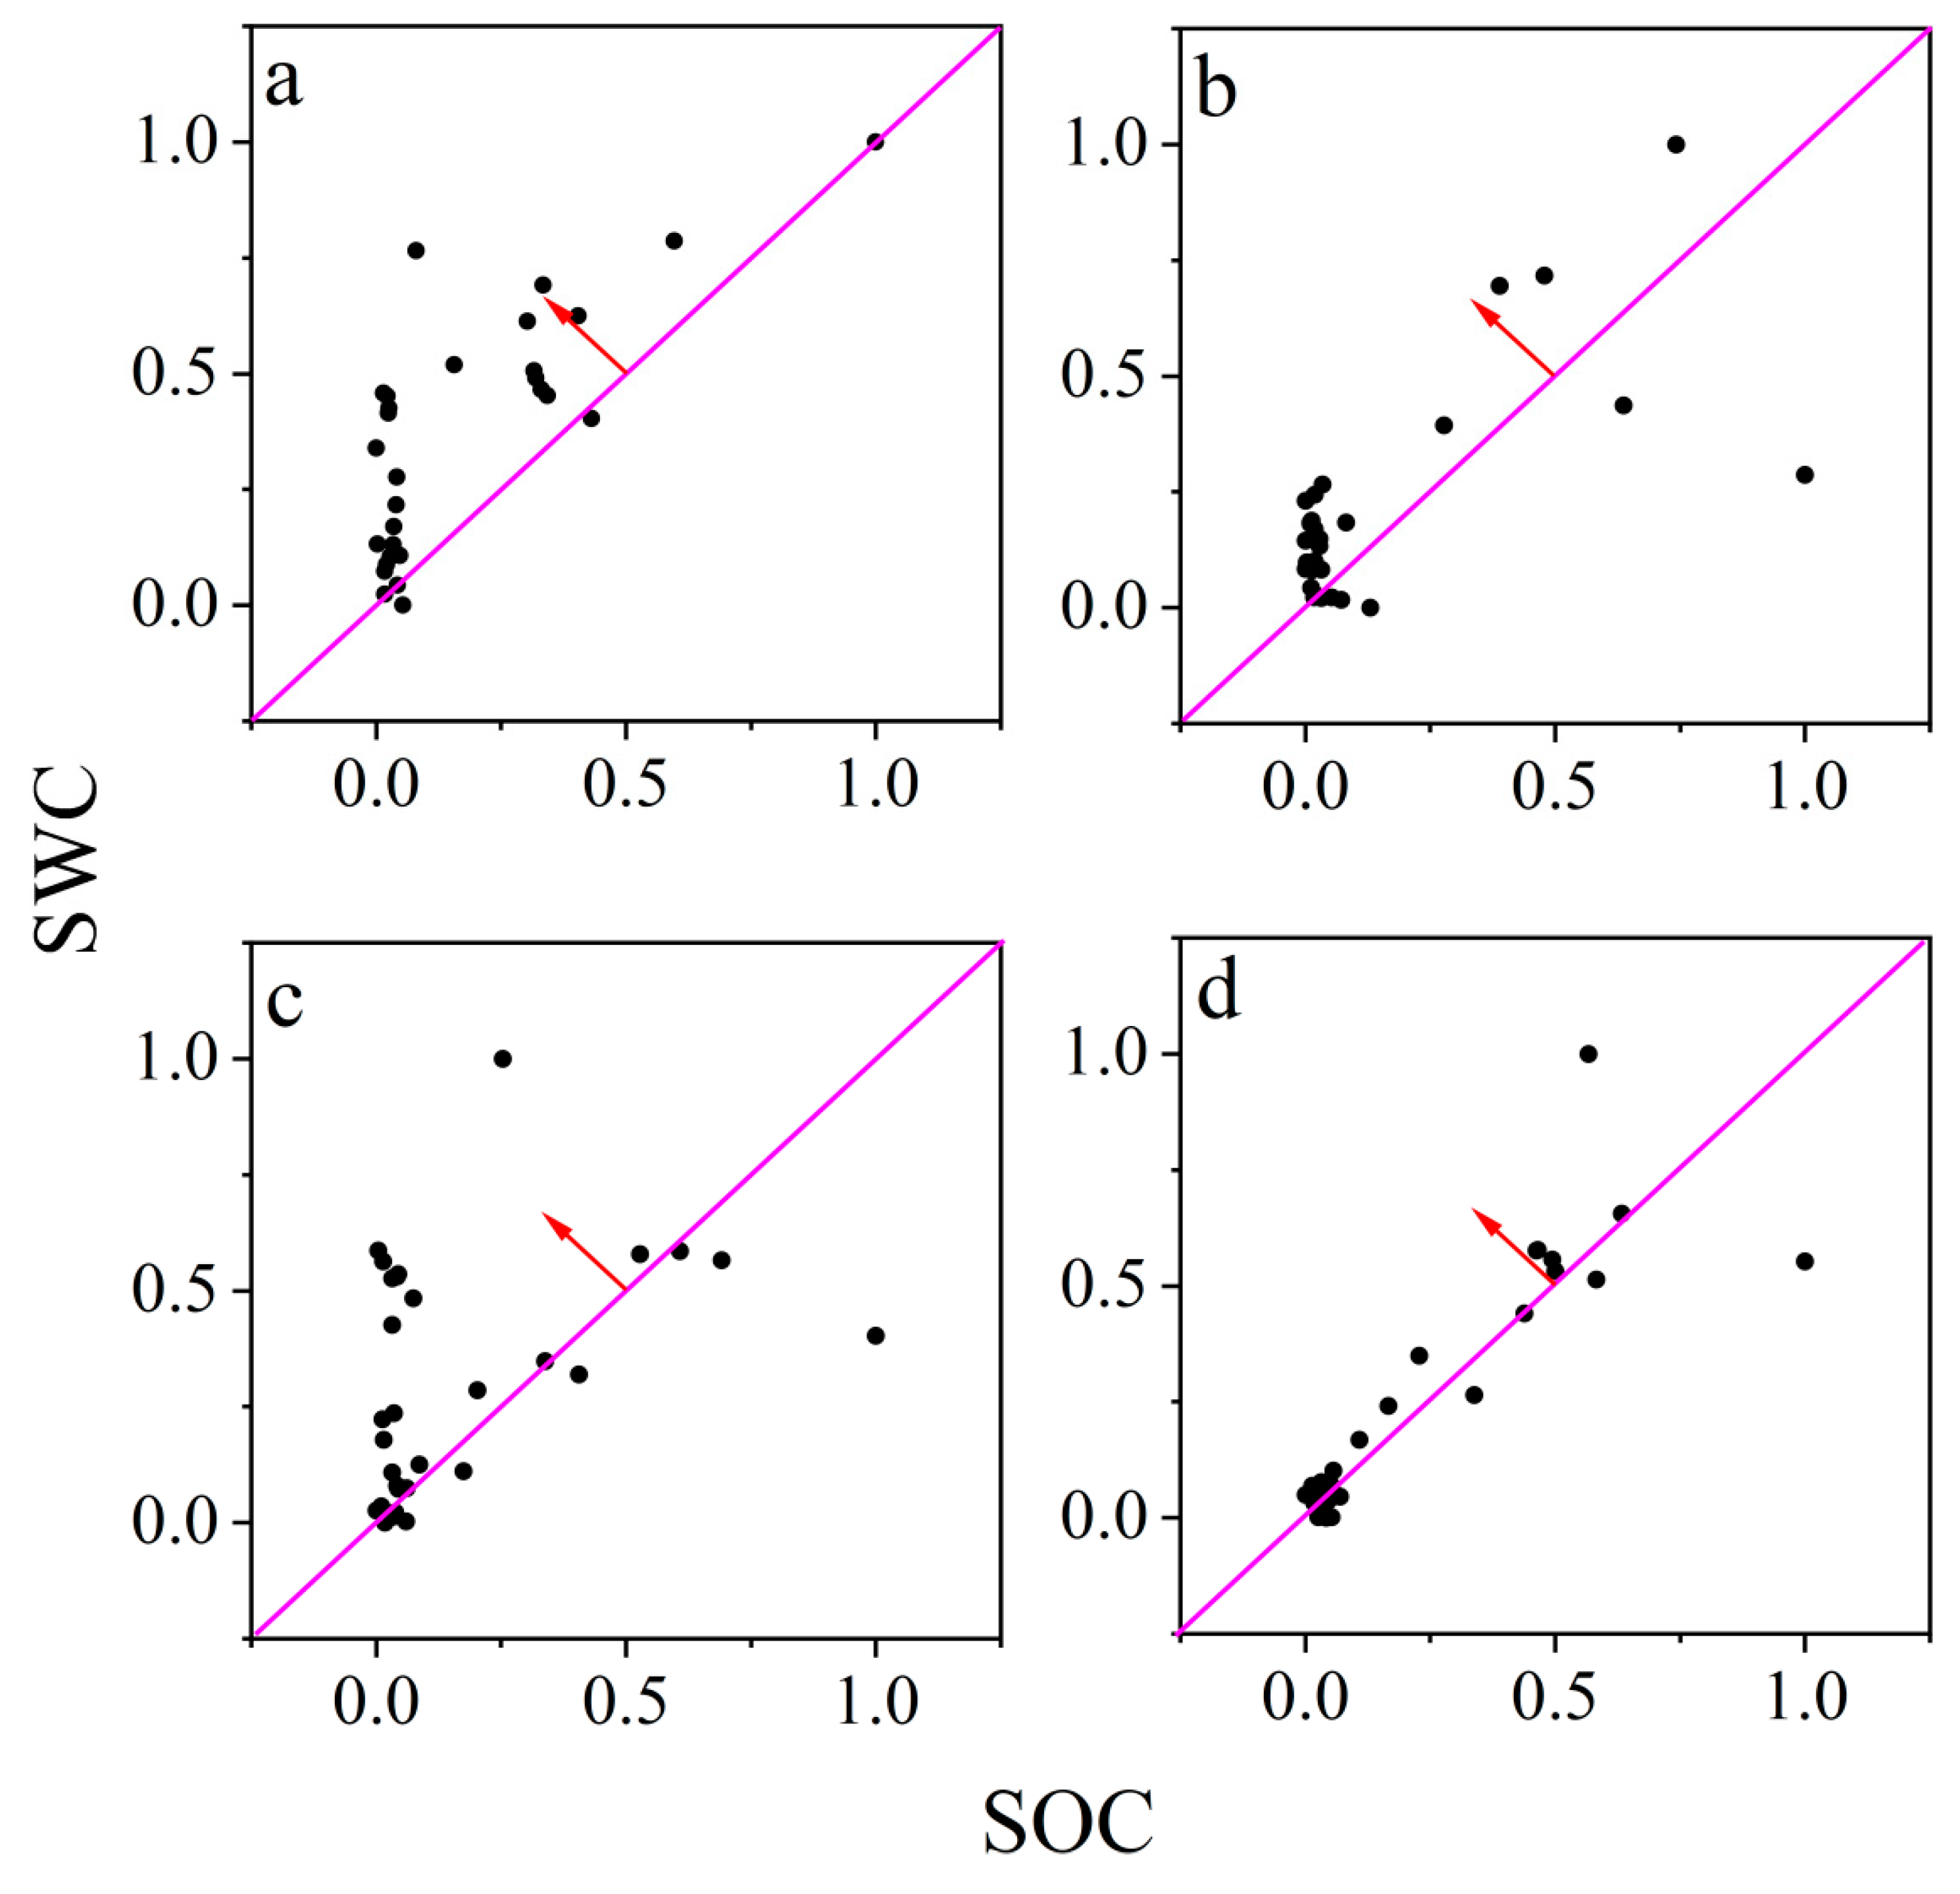
The benefits of SWC were all higher than that of SOC for all vegetation types (
Figure 6). In addition, the order of RMSE value were
Pinus tabuliformis (0.31) > grassland (0.26) >
Pinus sylvestris (0.20) >
Populus simonii (0.13), respectively, indicating
Populus simonii may be a good choice from the perspective of water-carbon tradeoff relationship.
3.4. Influences of Environmental Factors on SWC and SOC
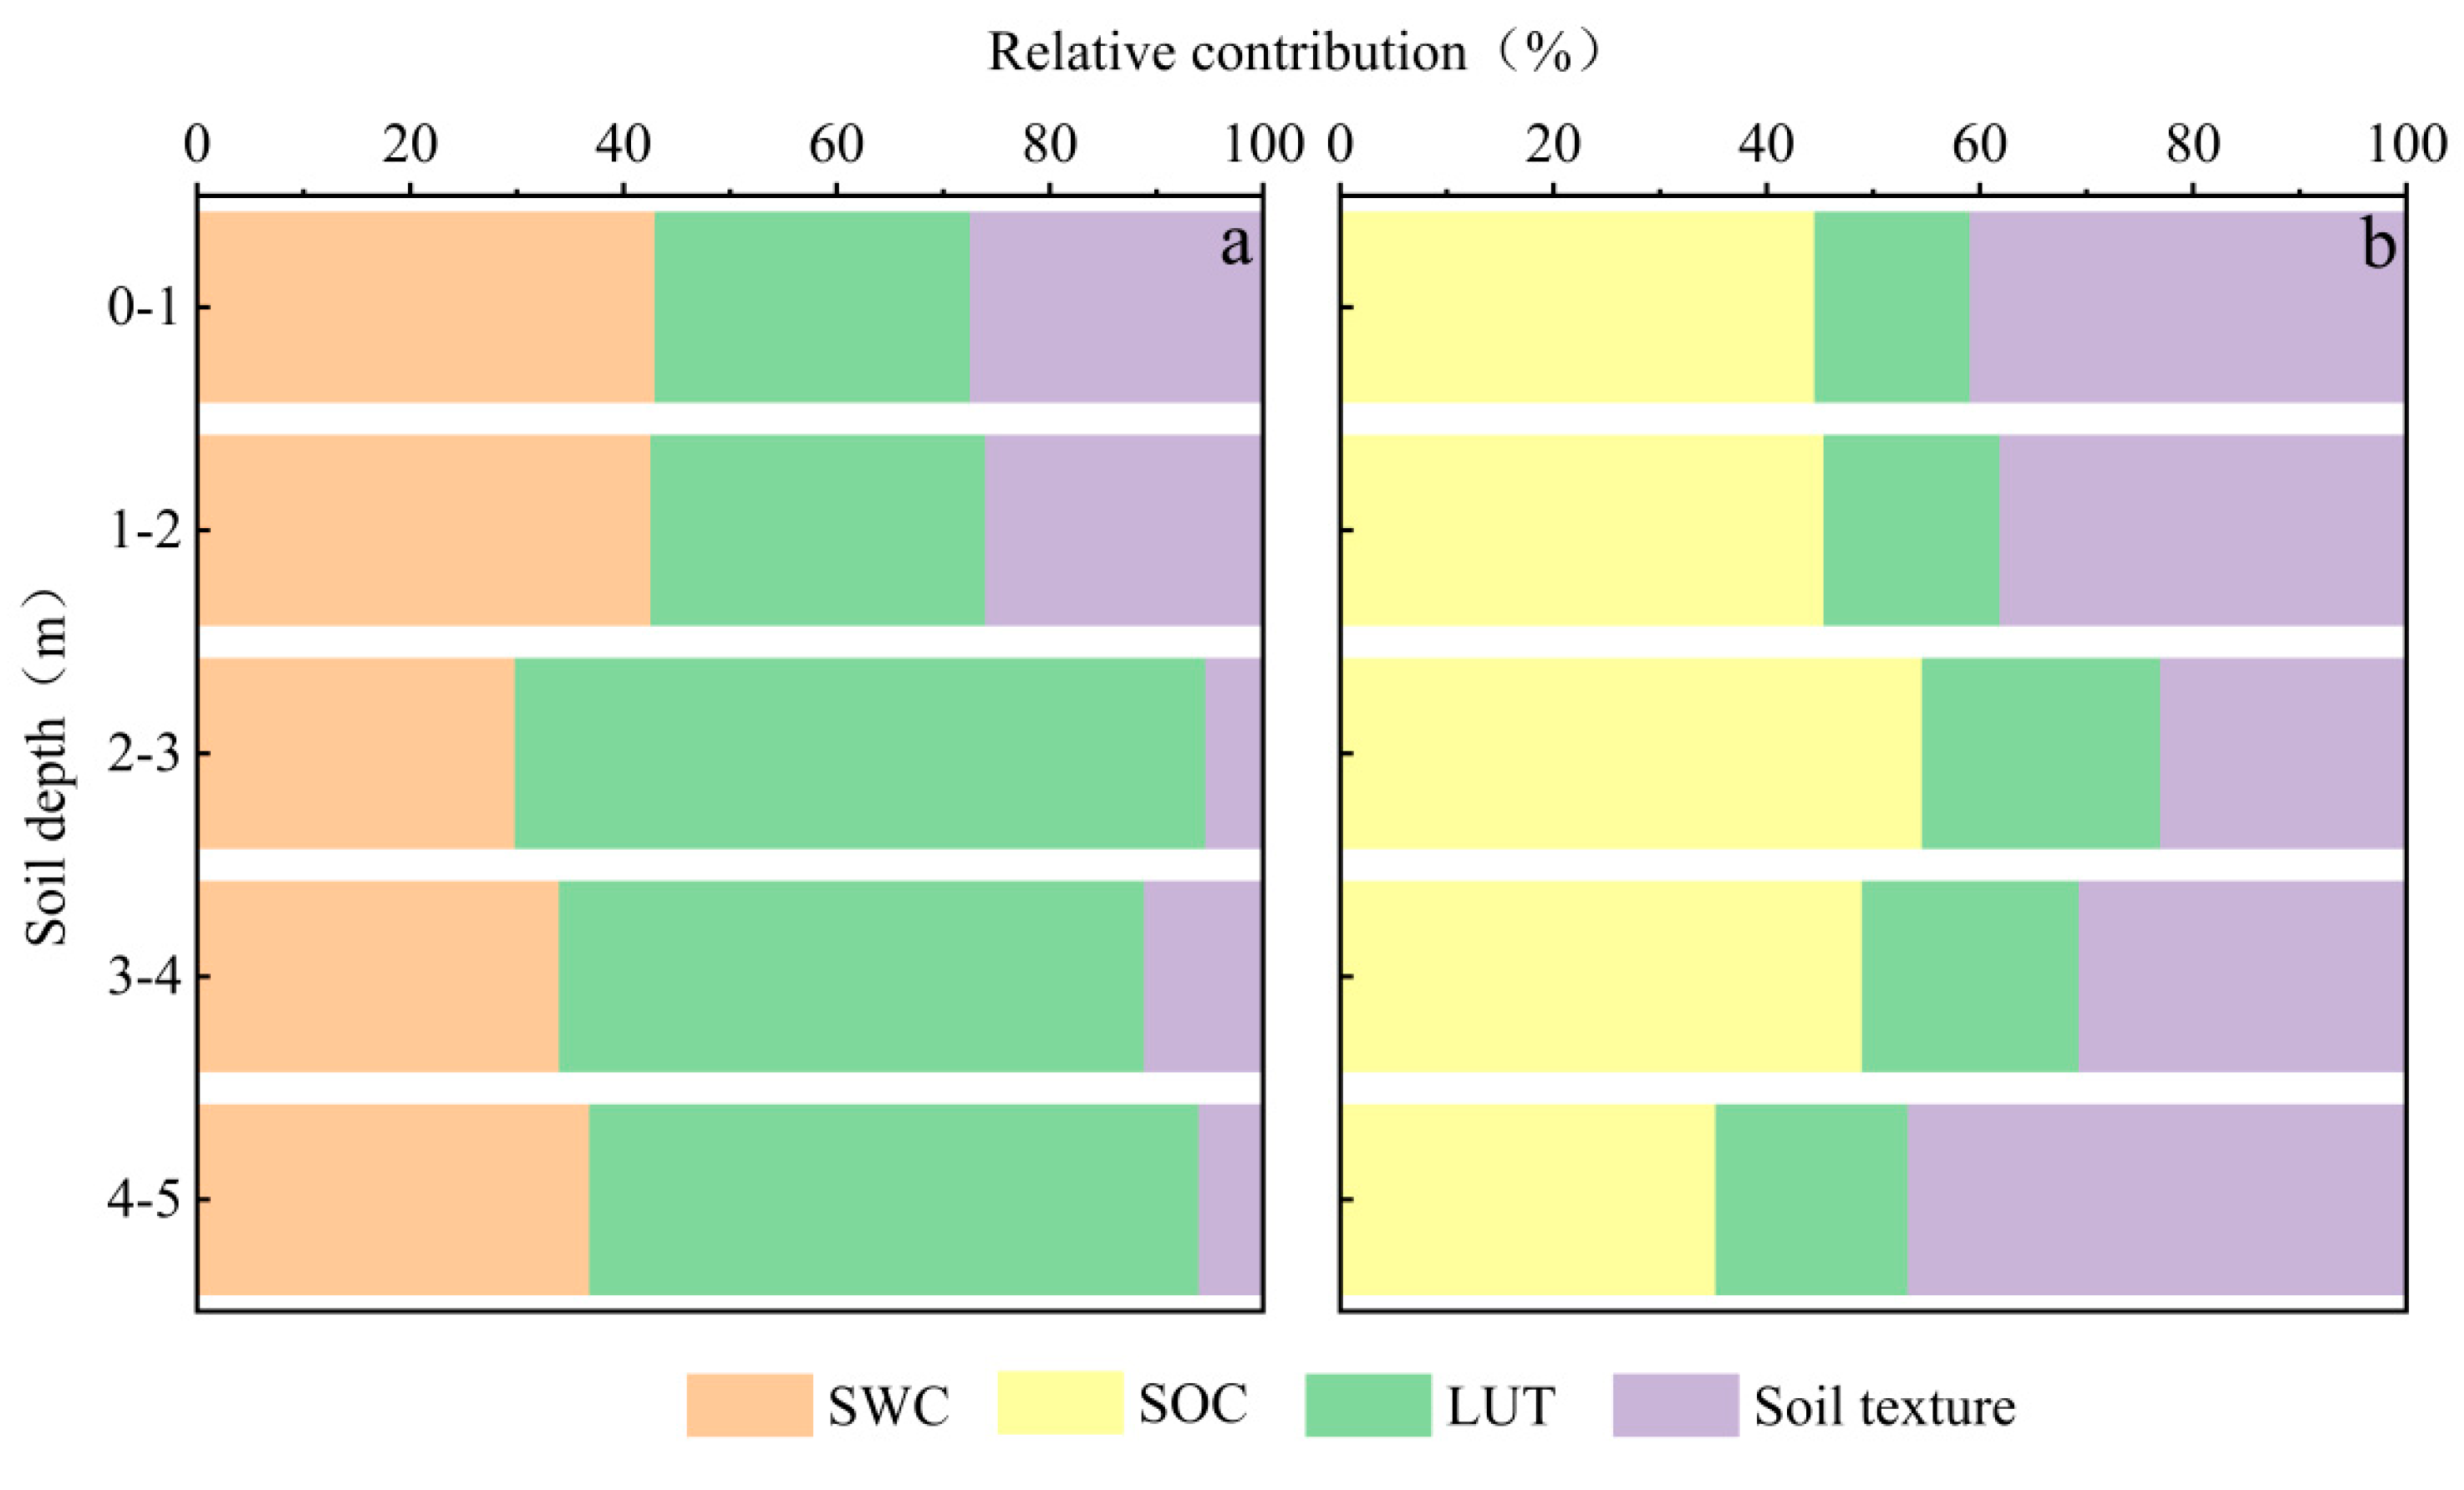
To further show the influencing factors of environmental factors (soil texture and land use type) on SWC and SOM, The redundancy analysis was conducted in this study (
Figure 7). In general, SOC, LUT and soil texture explained 45.75%, 19.38% and 34.87% of SWC variations, respectively. SOC and soil texture were the main influencing factors for SWC variation of 0-5 m. For SOC variations, SWC, LUT and soil texture accounted for 37.24%, 47.60% and 15.17% of SOC variation for 0-5 m, suggesting the importance of SWC and LUT to SWC variation. However, the main influencing factors of different depth were different for SOC variations, namely SWC for 0-2 m, while LUT for 2-5 m.
4. Discussion
4.1. The Effect of Vegetation Restoration on Deep Soil Moisture and Deep Soil Organic Content
Our study showed that artificial vegetation restoration leads to deep soil water depletion. The findings are a common sense, conforming to that of numerous studies [
5,
7] on the Loess Plateau. Forests had high evapotranspiration and the limited rainfall couldn’t satisfy the demand of forests, causing soil water depletion and the formation of a dry soil layer (DSL). For example, Wang et al. [
24] addressed the large-scale spatial variability of DSL on the Loess Plateau and found that the occurrence of DSLs showed strong spatial variation and there is a mean thickness of 160 cm below a mean soil depth of 270 cm for DSL. Jia et al. [
5] collected SMC data within the 5-m soil profile from 50 sites of the Loess Plateau, and found the depth-averaged SMC was much lower under forest than under cropland and artificial forests could therefore exert the function of “water pump” in the Loess Plateau.
Compared to the grassland,
Populus simonii fixed SOC, while
Pinus sylvestris and
Pinus tabuliformis consumed SOC. Different plantations had different impacts on the SOC sequestration. It is still a debate about the response of SOC to artificial forests. For instance, Yao et al. [
25] found SOC significantly increased in topsoils when converting the cropland to natural grassland, woodland and artificial grassland . Yang et al. [
12] also discovered that
Robinia pseudoacacia afforestation increased significantly carbon sequestration of topsoils on the Loess Plateau of China. However, other studies found that there existed no obvious differences for SOC when converting cropland to plantations [
26,
27]. There are some studies showing the revegetation of croplands leads to the decrease of SOC for the surface soil layer or subsoil [
28,
29]. In addition, it is also reported the response of SOC to revegetation was a changed process following afforestation. Han et al. [
30] discovered that the SOC stock change tended to increase in young forests, while it presented a reducing trend for middle-aged and old forests. These differences show the truth that the magnitude and direction of soil C dynamics are impacted by a few factors, such as tree species, terrain, sampling depth, initial soil physical and chemical properties, and management measures. Therefore, the response of soil organic carbon to artificial forests still needs to consider multiple factors for in-depth research in the future.
4.2. Effects of Environmental Factors on SOC and SWC
Our studies showed SOC and texture were important factors for SWC variations of 0-5 m. On the one hand, it is reported there is significantly correlation between SWC and SOC at the soil surface [
12,
15]. On the other hand, SOC is loose and porous, and can absorb a lot of water. Therefore, SOC were an important factor for SWC variation of 0-5 m. Soil texture is another important factors to SWC variations, which is consistent with other results [
13]. The finer the soil texture, the stronger the ability to retain water, which indirectly affects the spatial distribution of SWC [
31] . In addition, SWC were important factors to SOC variations of 0-2 m ,while LUT was important factors to SOC variations of 2-5 m. Similar to SWC, a significant correlation between SWC and SOC of upper soil layer led to the importance of SWC to SOC variations of 0-2 m. With the increase of depth, LUT played a more important role to SOC variations of 2-5 m. The effects of LUT on SOC mainly depend on plant productivity, decomposition of root exudates, and the number and chemical composition of leaves [
32,
33] . The plantations of our study have deep root systems, and then lead to the importance of LUT for deep SOC variations.
4.3. Implications for Future Vegetation Restoration and Its Limitations
Lots of plantations have been planted since the project of Grain for Green started. Although it is reported that naturally restored grassland was a suitable revegetation approach compared to forests [
34,
35], plantations of shrubs and trees could provide more ecosystem services, such as wood fiber products, greater biodiversity and better economic benefit in relative to natural grassland [
36]. It is a common sense that plantations of shrubs and trees all lead to the deficit of deep SWC. In the current situaction, how fully utilize the ecosystem service function of artificial forests is of great importance. In our study, SWCD of Pinus sylvestris and Populus simonii were low, but Populus simonii could fix more soil cabon. In addition, the RMSEA of tradeoff of Populus simonii were the smallest. Therefore,
Populus simonii may be a good choice in future vegetation restoration. Nevertheless, it is noted that the suitable revegetation method mainly depends on the evaluation indicators and different evaluation indicators had different results. Gao et al. [
19] found R. pseudoacacia was not a good choice for revegetation, which was caused by consuming more SWC although fix relatively high SOC. While Jian et al. [
37] believed that R. pseudoacacia was a good choice based on high ratios of actual evapotranspiration relative to pan evaporation. Therefore, a suitable revegetation method needs to be provided based on the main ecosysytem services of the plantations.
Our study provided a suitable revegetation technique based on the effects of typical artificial forests on SOC and SOC. However, there still are limitations. First, although Populus simonii fixed more SOC, it still consumed deep SWC. Appropriate measures are necessary to avoid the excessive consumption of SWC in the future. Second, there are complex terrains and we only studied the artificial forests located on flat ground, and artificial forests of other terrains (slope) should be studied. Third, there are existing lots of different plantations on the Loess Plateau, such as shrub, grassland, pure/mixed plantations of trees or shrubs or grasslands. Therefore, more plantations of different combinations should be studied in the future.
5. Conclusions
In our study, the changes in SWC and SOC as well as their interaction and influencing factors for three typical plantations on China’s Loess Plateau were investigated. Results showed that compared to the grassland, Pinus sylvestris consumes the SWC but increases the SOC, while the rest plantations not only decrease the SWC but also lower the SOC. The RMSE value of tradeoff of Pinus sylvestris were low. The significant correlation between SWC and SOC mainly concentrated on the shallow layer. Tredundancy analysis showed LUT had a important impact on the SOC variations of deep soil layers, while SOC and soil texture for deep SWC variations. Given the SWCD, SOCC and RMSEA, Pinus sylvestris should be considered in future vegetation restoration.
Author contribution
All authors contributed to the study conception, design, material preparation, data collection, and analysis.
Ethical approval
We all authors read and approved the final manuscript.
Consent to participate
Not applicable.
Consent for publication
Not applicable.
Acknowledgements
This study was supported by the Strategic Priority Research Program of the Chinese Academy of Sciences (XDB40020000), the National Natural Science Foundation of China (42022048), the Third Xinjiang Scientific Expedition of the Ministry of Science and Technology of the PRC (2022xjkk0904), and the Youth Innovation Promotion Association of the Chinese Academy of Sciences (Y2021023).
Competing interests
The authors declare no competing interests.
References
- Fu, B.J. , Wang, S., Liu, Y., Liu, J.B., Liang, W., Miao, C,Y. Hydrogeomorphic Ecosystem Responses to Natural and Anthropogenic Changes in the Loess Plateau of China. Annual Review of Earth and Planetary Sciences 2017, 45, 223–243. [Google Scholar] [CrossRef]
- Islam, K.R. , Weil, R.R. Land use effects on soil quality in a tropical forest ecosystem of Bangladesh. Agriculture, Ecosystems and Environment 2000, 79, 9–16. [Google Scholar] [CrossRef]
- Fu, B.J. , Liu, Y., Lü, Y.H., He, C.S., Zeng, Y., Wu, B.F. Assessing the soil erosion control service of ecosystems change in the Loess Plateau of China. Ecological Complexity 2011, 8, 284–293. [Google Scholar] [CrossRef]
- Chen, H.S. , Shao, M.A., Li, Y.Y. 2008. Soil desiccation in the Loess Plateau of China. Geoderma 2008, 143, 91–100. [Google Scholar] [CrossRef]
- Jia, X.X. , Shao, M.A., Zhu, Y.J., Lou, Y. Soil moisture decline due to afforestation across the Loess Plateau, China. Journal of Hydrology 2017, 546, 113–122. [Google Scholar] [CrossRef]
- Wang, Y.Q. , Shao, M.A., Shao, H.B. A preliminary investigation of the dynamic characteristics of dried soil layers on the Loess Plateau of China. Journal of Hydrology 2010, 81, 9–17. [Google Scholar] [CrossRef]
- Deng, L. , Yan, W.M., Zhang, Y.W., Shangguan, Z.P. Severe depletion of soil moisture following land-use changes for ecological restoration: Evidence from northern China. Forest Ecology and Management 2016, 366, 1–10. [Google Scholar] [CrossRef]
- Lal, R. 2004. Soil carbon sequestration impacts on global climate change and food security. Science 2004, 304, 1623–1627. [Google Scholar] [CrossRef]
- Deng, L. , Liu, G.B., Shangguan, Z.P. Land-use conversion and changing soil carbon stocks in China’s G‘rain-for-Green’ Program: a synthesis. Glob Chang Biol 2014, 20, 3544–3556. [Google Scholar] [CrossRef]
- LaganiÈRe, J., D. A. Angers, D.A., ParÉ, D. Carbon accumulation in agricultural soils after afforestation: a meta-analysis. Global Change Biology 2009, 16, 439–453. [Google Scholar] [CrossRef]
- Zhao, F.B. , Wu, Y.P., Qiu, L.J., Sivakumar, B., Zhang, F., Sun, Y.Z., Sun, L.Q., Li Q.L., Voinov, A. Spatiotemporal features of the hydro-biogeochemical cycles in a typical loess gully watershed. Ecological Indicators 2018, 91, 542–554. [Google Scholar] [CrossRef]
- Yang, X. , Li, T.C., Shao, M.A. Factors controlling deep-profile soil organic carbon and water storage following Robinia pseudoacacia afforestation of the Loess Plateau in China. Forest Ecosystems 2022, 9, 100079. [Google Scholar] [CrossRef]
- Chen, Y.X. , Wei, T.X., Ren, K., Sha, G.L., Guo, X., Fu, Y.C., Yu, H. The coupling interaction of soil organic carbon stock and water storage after vegetation restoration on the Loess Plateau, China. J Environ Manage 2022, 306, 114481. [Google Scholar] [CrossRef] [PubMed]
- Yang, K.Q. , Wang, K., Zhang, X.Y., Chang, X.F., Bai, G.S., Zheng, J.Z., Wu, G.L. 2021. Change in soil water deficit and soil organic matter consumption over time in rain-fed apricot orchards on the semi-arid Loess Plateau, China. Agriculture, Ecosystems & Environment 2011, 314, 107381. [Google Scholar]
- Zhang, Y.W. , Shangguan, Z.P. The coupling interaction of soil water and organic carbon storage in the long vegetation restoration on the Loess Plateau. Ecological Engineering 2016, 91, 574–581. [Google Scholar] [CrossRef]
- Wang, Z.Q. , Liu, B.Y., Liu, G., Zhang, Y.X. Soil water depletion depth by planted vegetation on the Loess Plateau. Science in China Series D: Earth Sciences 2009, 52, 835–842. [Google Scholar] [CrossRef]
- Yang, L. , Wei, W., Chen, L.D., Mo, B.R. Response of deep soil moisture to land use and afforestation in the semi-arid Loess Plateau, China. Journal of Hydrology 2012, 475, 111–122. [Google Scholar] [CrossRef]
- Feng, Q. , Yang, L., Wang, J., Shi, X.Y., Wang, Y.F. Response of soil moisture and soil organic carbon yo vegetation restoration in deep soil profiles in Loess Hilly Region. Acta Ecologica Sinica 2019, 39, 6598–6609. (in Chinese). [Google Scholar]
- Gao, X.D. , Li, H.C., Zhao, X.N., Ma, W., Wu, P.T. Identifying a suitable revegetation technique for soil restoration on water-limited and degraded land: Considering both deep soil moisture deficit and soil organic carbon sequestration. Geoderma 2018, 319, 61–69. [Google Scholar] [CrossRef]
- Feng, Q. , Zhao, W.W., Hu, X.P., Liu, Y., Daryanto, S., Cherubini, F. Trading-off ecosystem services for better ecological restoration: A case study in the Loess Plateau of China. Journal of Cleaner Production 2020, 257, 120469. [Google Scholar] [CrossRef]
- Su, B.Q. , Su, Z.X., Shangguan, Z.P. 2021. Trade-off analyses of plant biomass and soil moisture relations on the Loess Plateau. Catena 2021, 197, 104946. [Google Scholar] [CrossRef]
- Wang, Y. Q, Shao, M.A., Liu, Z.P. 2013. Vertical distribution and influencing factors of soil water content within 21-m profile on the Chinese Loess Plateau. Geoderma, 2013, 193–194, 300-310.
- Liu, C.G. , Jia, X.X., Ren, L.D., Zhao, C.L., Yao, Y.F., Zhang, Y.J., Shao, M.A. Cropland-to-shrubland conversion reduces soil water storage and contributes little to soil carbon sequestration in a dryland area. Agriculture, Ecosystems and Environment 2023, 354, 108572. [Google Scholar] [CrossRef]
- Wang, Y.Q. , Shao, M.A., Liu, Z.P. Large-scale spatial variability of dried soil layers and related factors across the entire Loess Plateau of China. Geoderma 2010, 159, 99–108. [Google Scholar] [CrossRef]
- Yao, Y.F. , Ge, N.N., Yu, S., Wei, X.R., Wang, X., Jin. J.W., Liu, X.T., Shao, M.A., Wei, Y.C., Kang, L. Response of aggregate associated organic carbon, nitrogen and phosphorous to re-vegetation in agro-pastoral ecotone of northern China. Geoderma 2019, 341, 172–180. [Google Scholar] [CrossRef]
- Hughes, R.F. , Archer, S.R., Asner, G.P., Wessman, C.A., McMurtry, C., Nelson, J.I.M., Ansley, R.J. Changes in aboveground primary production and carbon and nitrogen pools accompanying woody plant encroachment in a temperate savanna. Glob Chang. Biol 2006, 12, 1733–1747. [Google Scholar] [CrossRef]
- Li, H.J. , Si, B.C, Ma, X.J, Wu, P.T. Deep soil water extraction by apple sequesters organic carbon via root biomass rather than altering soil organic carbon content. Sci. Total Environ 2009, 670, 662–671. [Google Scholar] [CrossRef]
- Zhang, C. C, Wang, Y.Q., Jia, X.X., Shao, M.A., An, Z.S. Impacts of shrub introduction on soil properties and implications for dryland revegetation. Sci Total Environ 2020, 742, 140498. [Google Scholar] [CrossRef]
- Yang, Y. , Loecke, T., Knops, J.M.H. 2022. Surface soil organic carbon sequestration under post agricultural grasslands offset by net loss at depth. Biogeochemistry 2022, 159, 303–313. [Google Scholar] [CrossRef]
- Han, X.Y. , Gao, G.Y., Li, Z.S., Chang, R.Y., Jiao, L., Fu, B.J. Effects of plantation age and precipitation gradient on soil carbon and nitrogen changes following afforestation in the Chinese Loess Plateau. Land Degradation & Development 2019, 30, 2298–2310. [Google Scholar]
- Jia, X.X. , Yang, Y., Zhang, C.C., Saho, M.A., Huang, L.M. A state-space analysis of soil organic carbon in China’s loess plateau. Land Degrad. Dev. 2017, 28, 983–993. [Google Scholar] [CrossRef]
- Yu, H. Y, Zha, T.G., Zhang, X.X., Ma, L.M. 2019. Vertical distribution and influencing factors of soil organic carbon in the Loess Plateau, China. Sci Total Environ 2019, 693, 133632. [Google Scholar] [CrossRef] [PubMed]
- Wiesmeier, M. , Spörlein, P., Geuß, U., Hangen, E., Haug, S., Reischl, A., Schilling, B., Lützow, M.V., Kögel-Knabner, I. Soil organic carbon stocks in southeast Germany (Bavaria) as affected by land use, soil type and sampling depth. Global Change Biology 2012, 18, 2233–2245. [Google Scholar] [CrossRef]
- Wang, Y.Q. , Shao, M.A., Zhang, C.C., Han, X,W., Mao, T.X., Jia, X.X.. Choosing an optimal land-use pattern for restoring eco-environments in a semiarid region of the Chinese Loess Plateau. Ecological Engineering 2015, 74, 213–222. [Google Scholar] [CrossRef]
- Chen, M.Y. , Yang, X., Shao, M.A., Wei, X.R., Li, T.C. Changes in soil C-N-P stoichiometry after 20 years of typical artificial vegetation restoration in semiarid continental climate zones. Sci Total Environ 2022, 852, 158380. [Google Scholar] [CrossRef] [PubMed]
- Gao, Y. , Fan, J., Peng, X.P., Wang, L., Mi, M.X. Soil water depletion and infiltration under the typical vegetation in the water-wind erosion crisscross region. Acta Ecologica Sinica 2014, 34, 7038–7046. [Google Scholar]
- Jian, S.Q. , Zhao, C.Y., Fang, S.M., Yu, K. Effects of different vegetation restoration on soil water storage and water balance in the Chinese Loess Plateau. Agricultural and Forest Meteorology 2015, 205, 85–96. [Google Scholar] [CrossRef]
|
Disclaimer/Publisher’s Note: The statements, opinions and data contained in all publications are solely those of the individual author(s) and contributor(s) and not of MDPI and/or the editor(s). MDPI and/or the editor(s) disclaim responsibility for any injury to people or property resulting from any ideas, methods, instructions or products referred to in the content. |
© 2024 by the authors. Licensee MDPI, Basel, Switzerland. This article is an open access article distributed under the terms and conditions of the Creative Commons Attribution (CC BY) license (https://creativecommons.org/licenses/by/4.0/).
