Submitted:
18 April 2024
Posted:
18 April 2024
You are already at the latest version
Abstract
Keywords:
1. Introduction
2. Materials and Methods
2.1. Raw Materials
2.2. Mixture Proportions and Preparation Processes of Geopolymer Coatings
2.3. Characterization of the GPC
2.3.1. Morphology Analysis
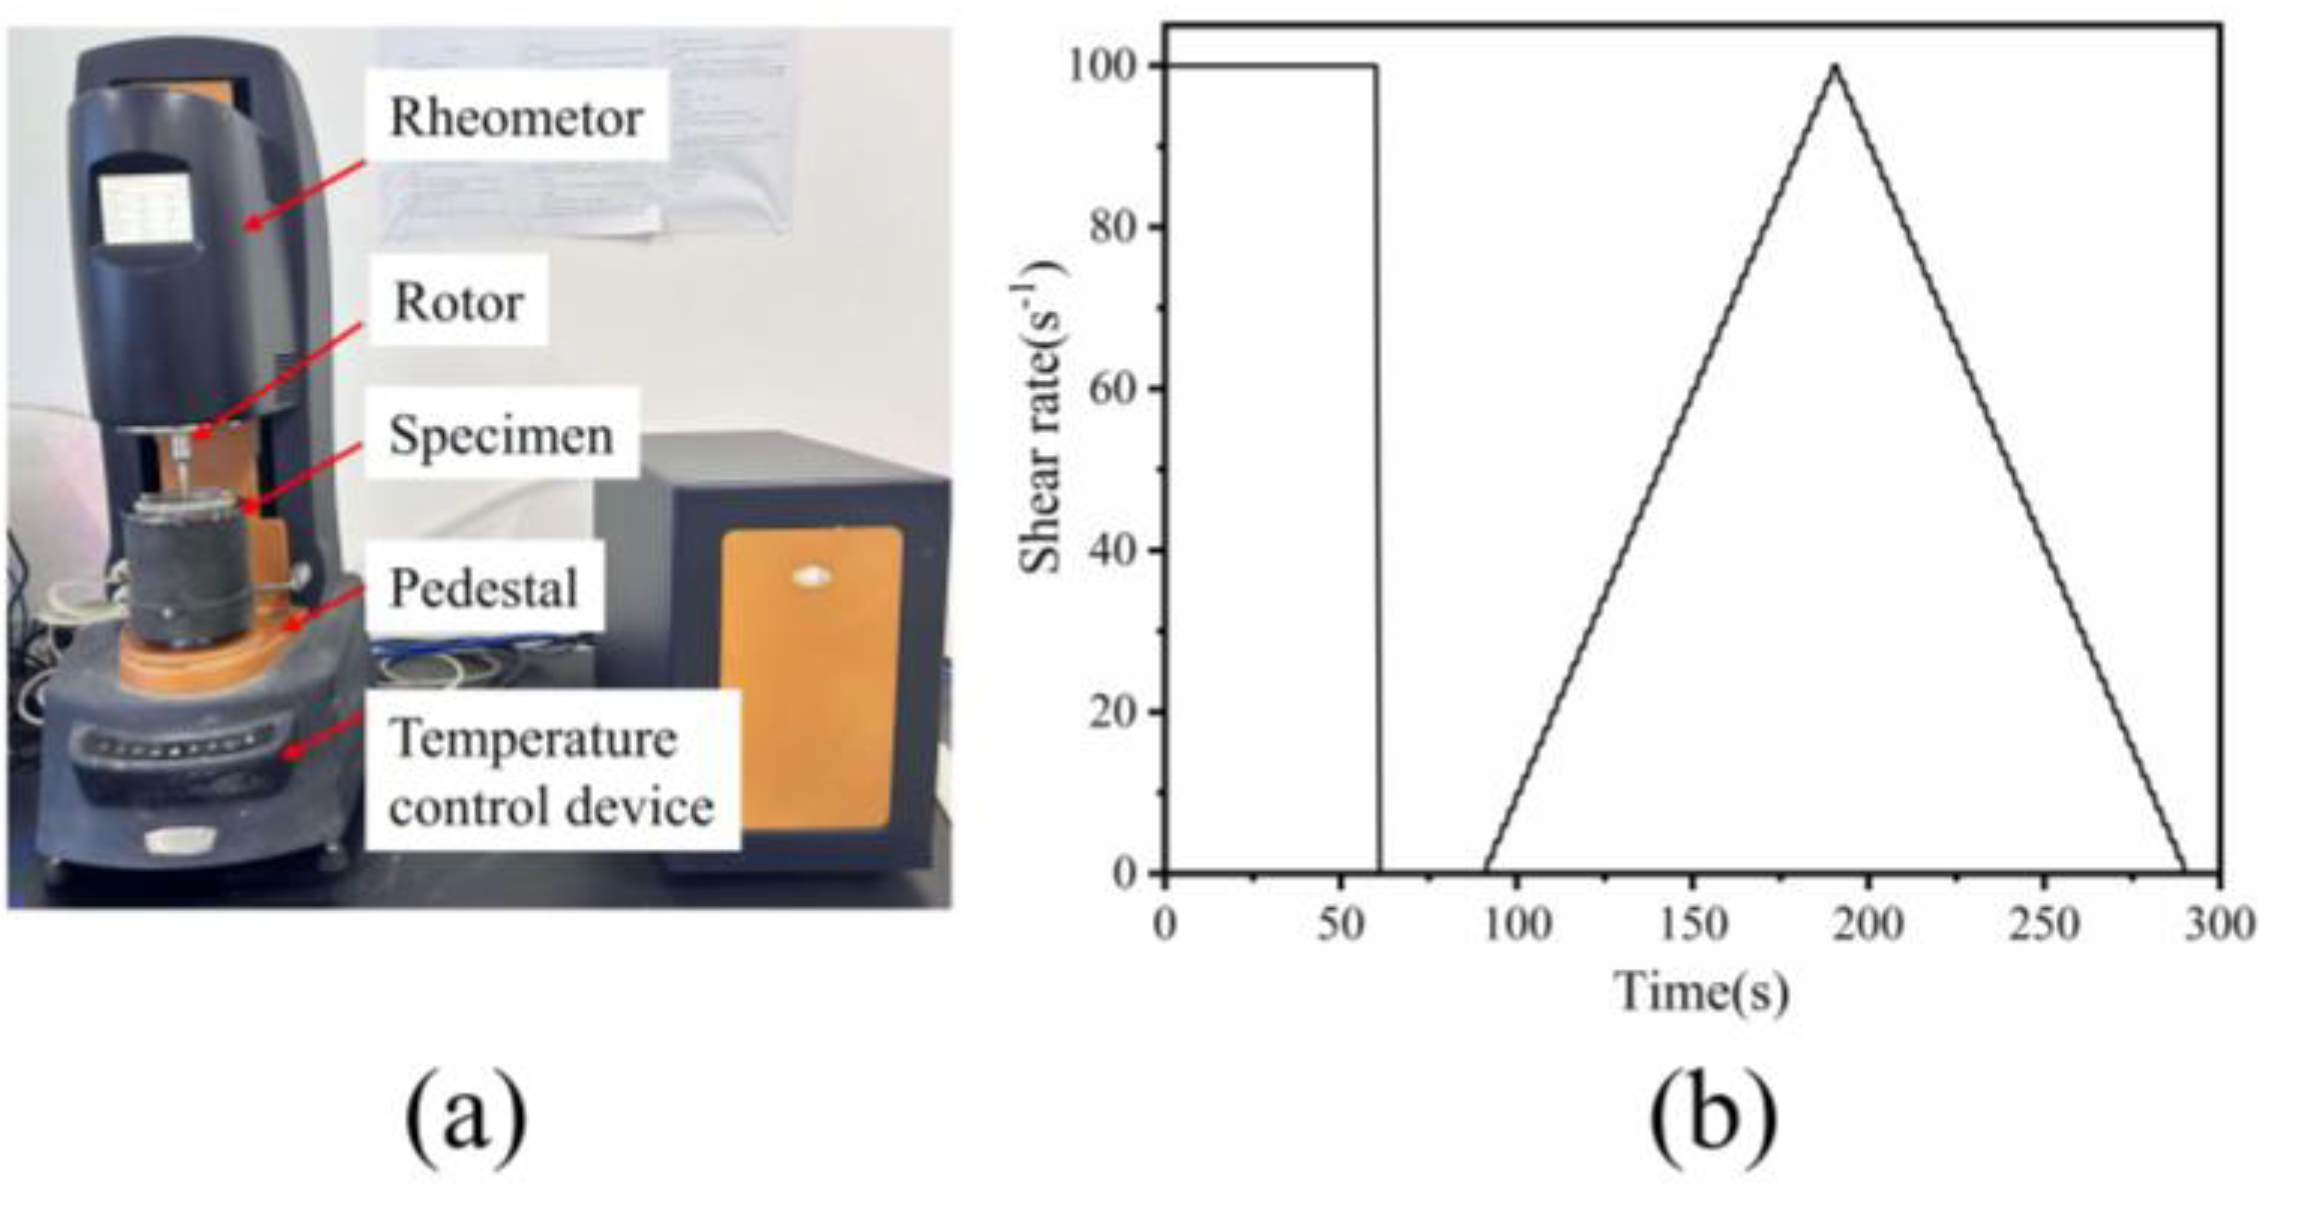
2.3.2. Rheological Test
2.3.3. Sagging Resistance Test
2.3.4. Isothermal Calorimetry Test
2.3.5. Mechanical Test
2.3.6. Thermogravimetric Analysis
2.3.7. Evaluation of Water Retention Capacity and Setting Time
3. Results and Discussion
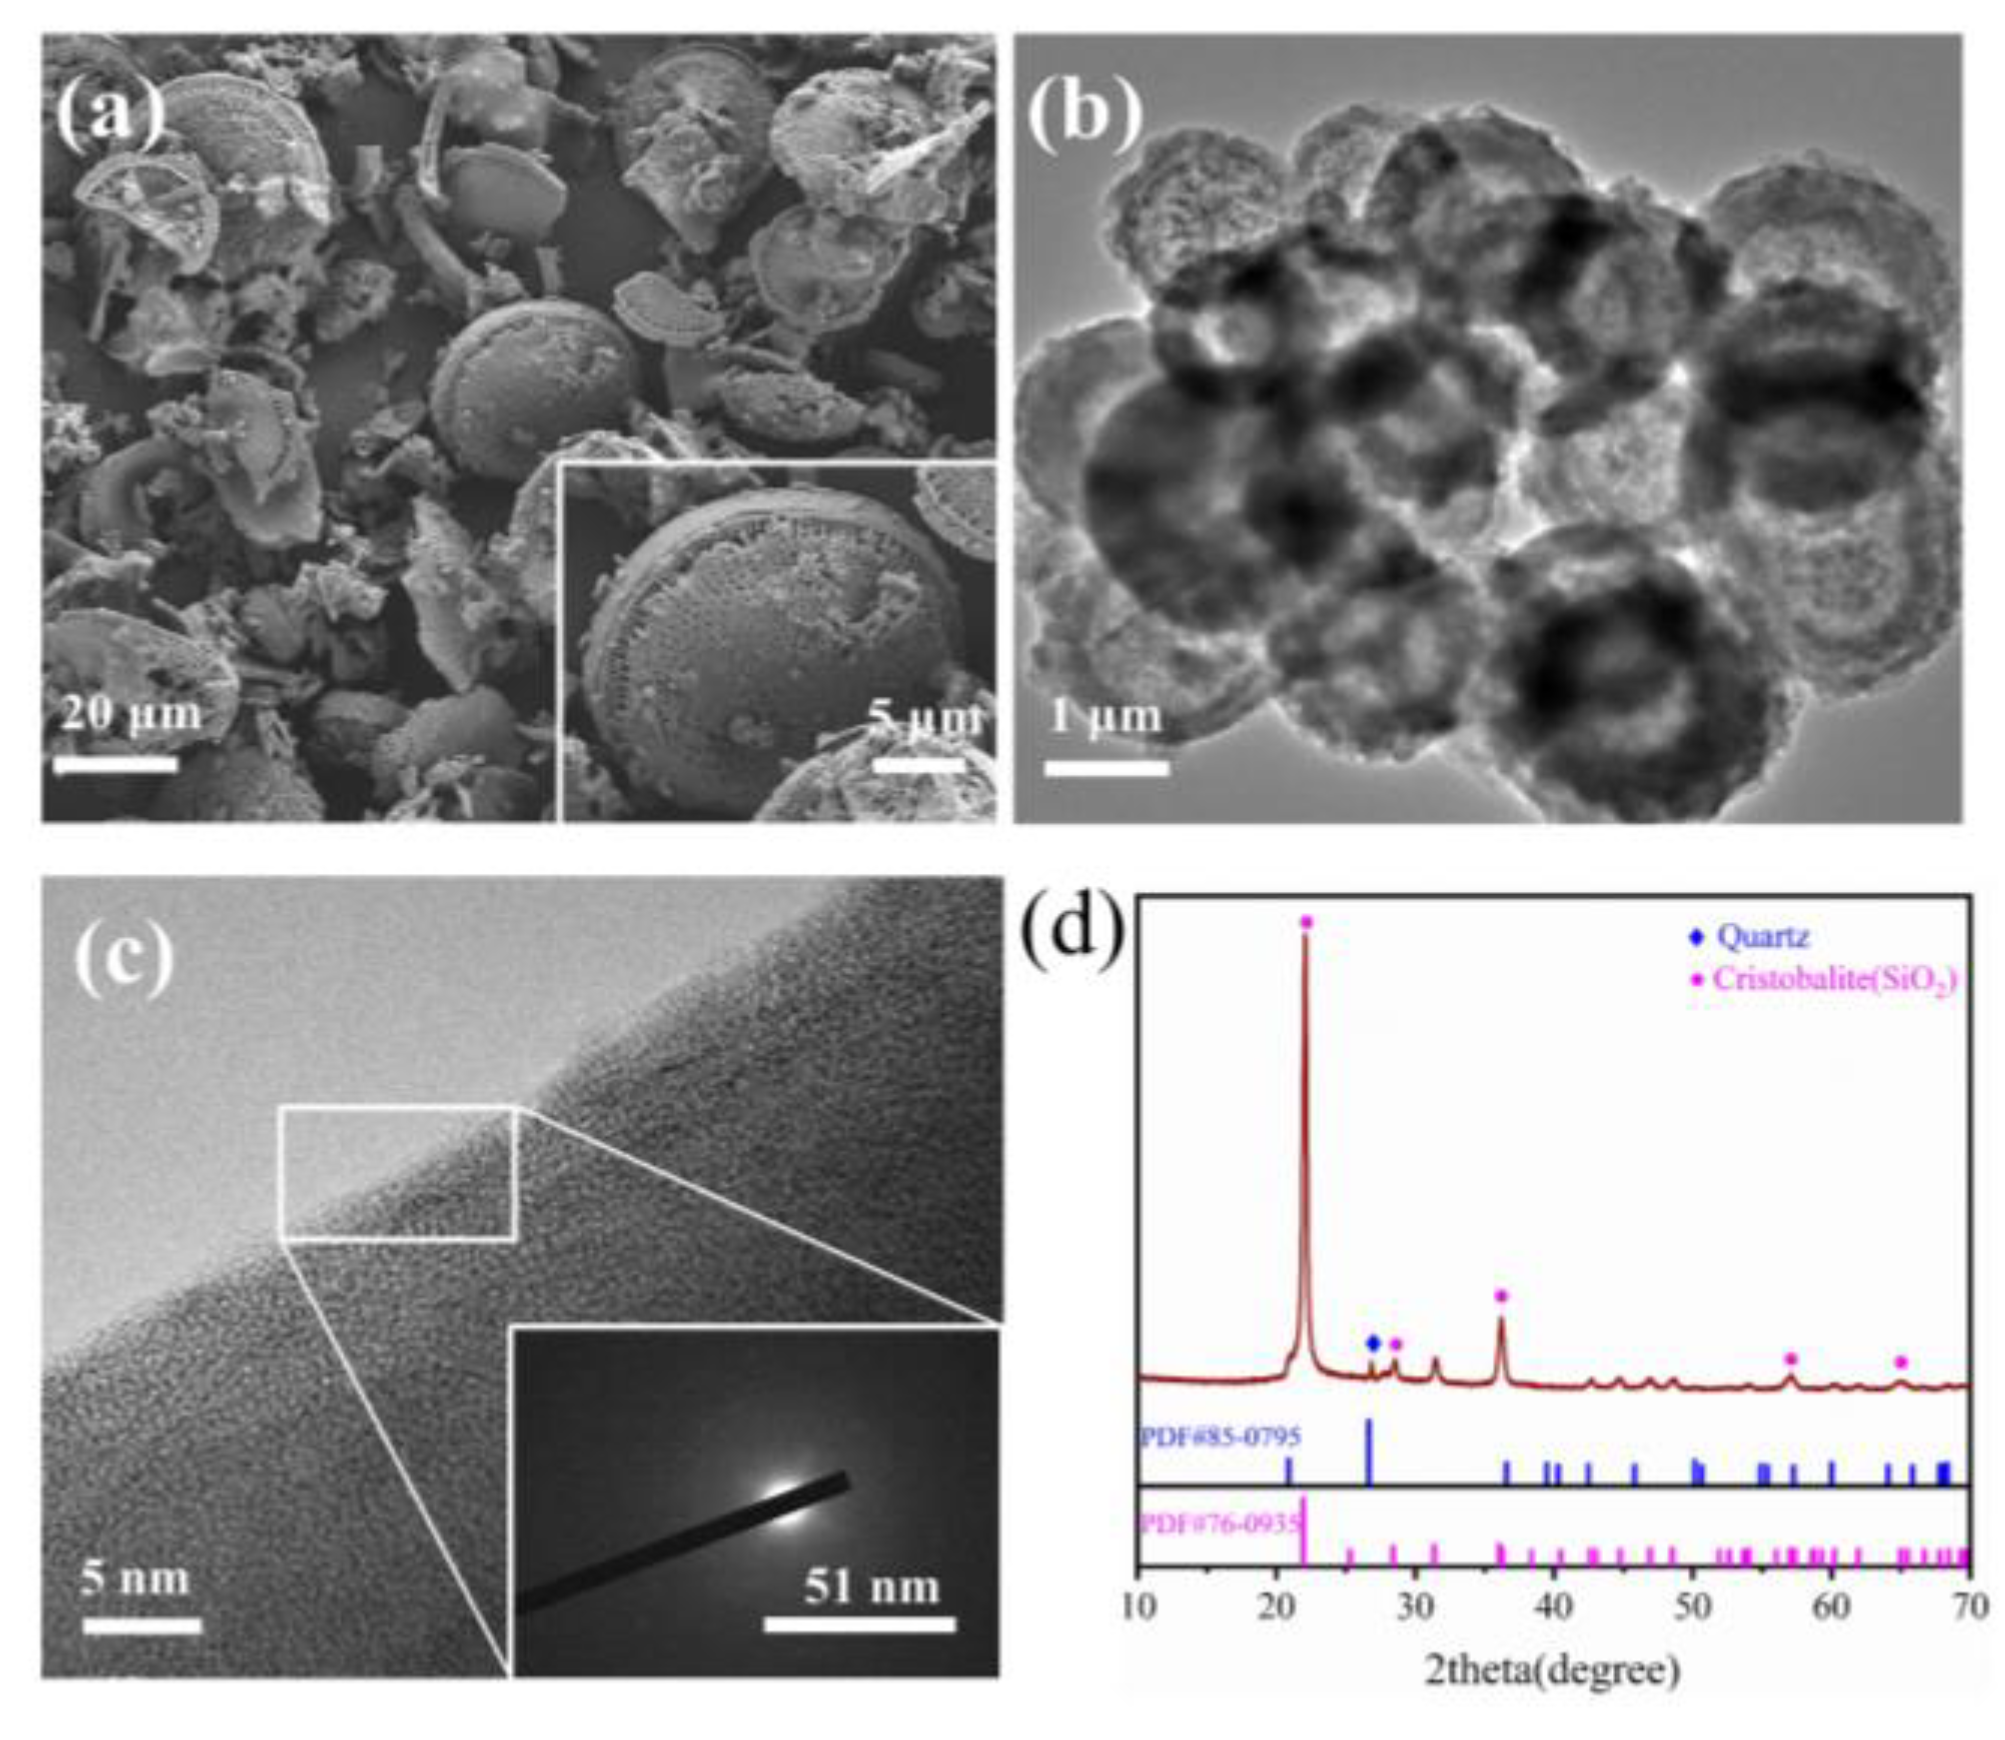
3.1. Morphology and Chemical Composition of the Diatomite
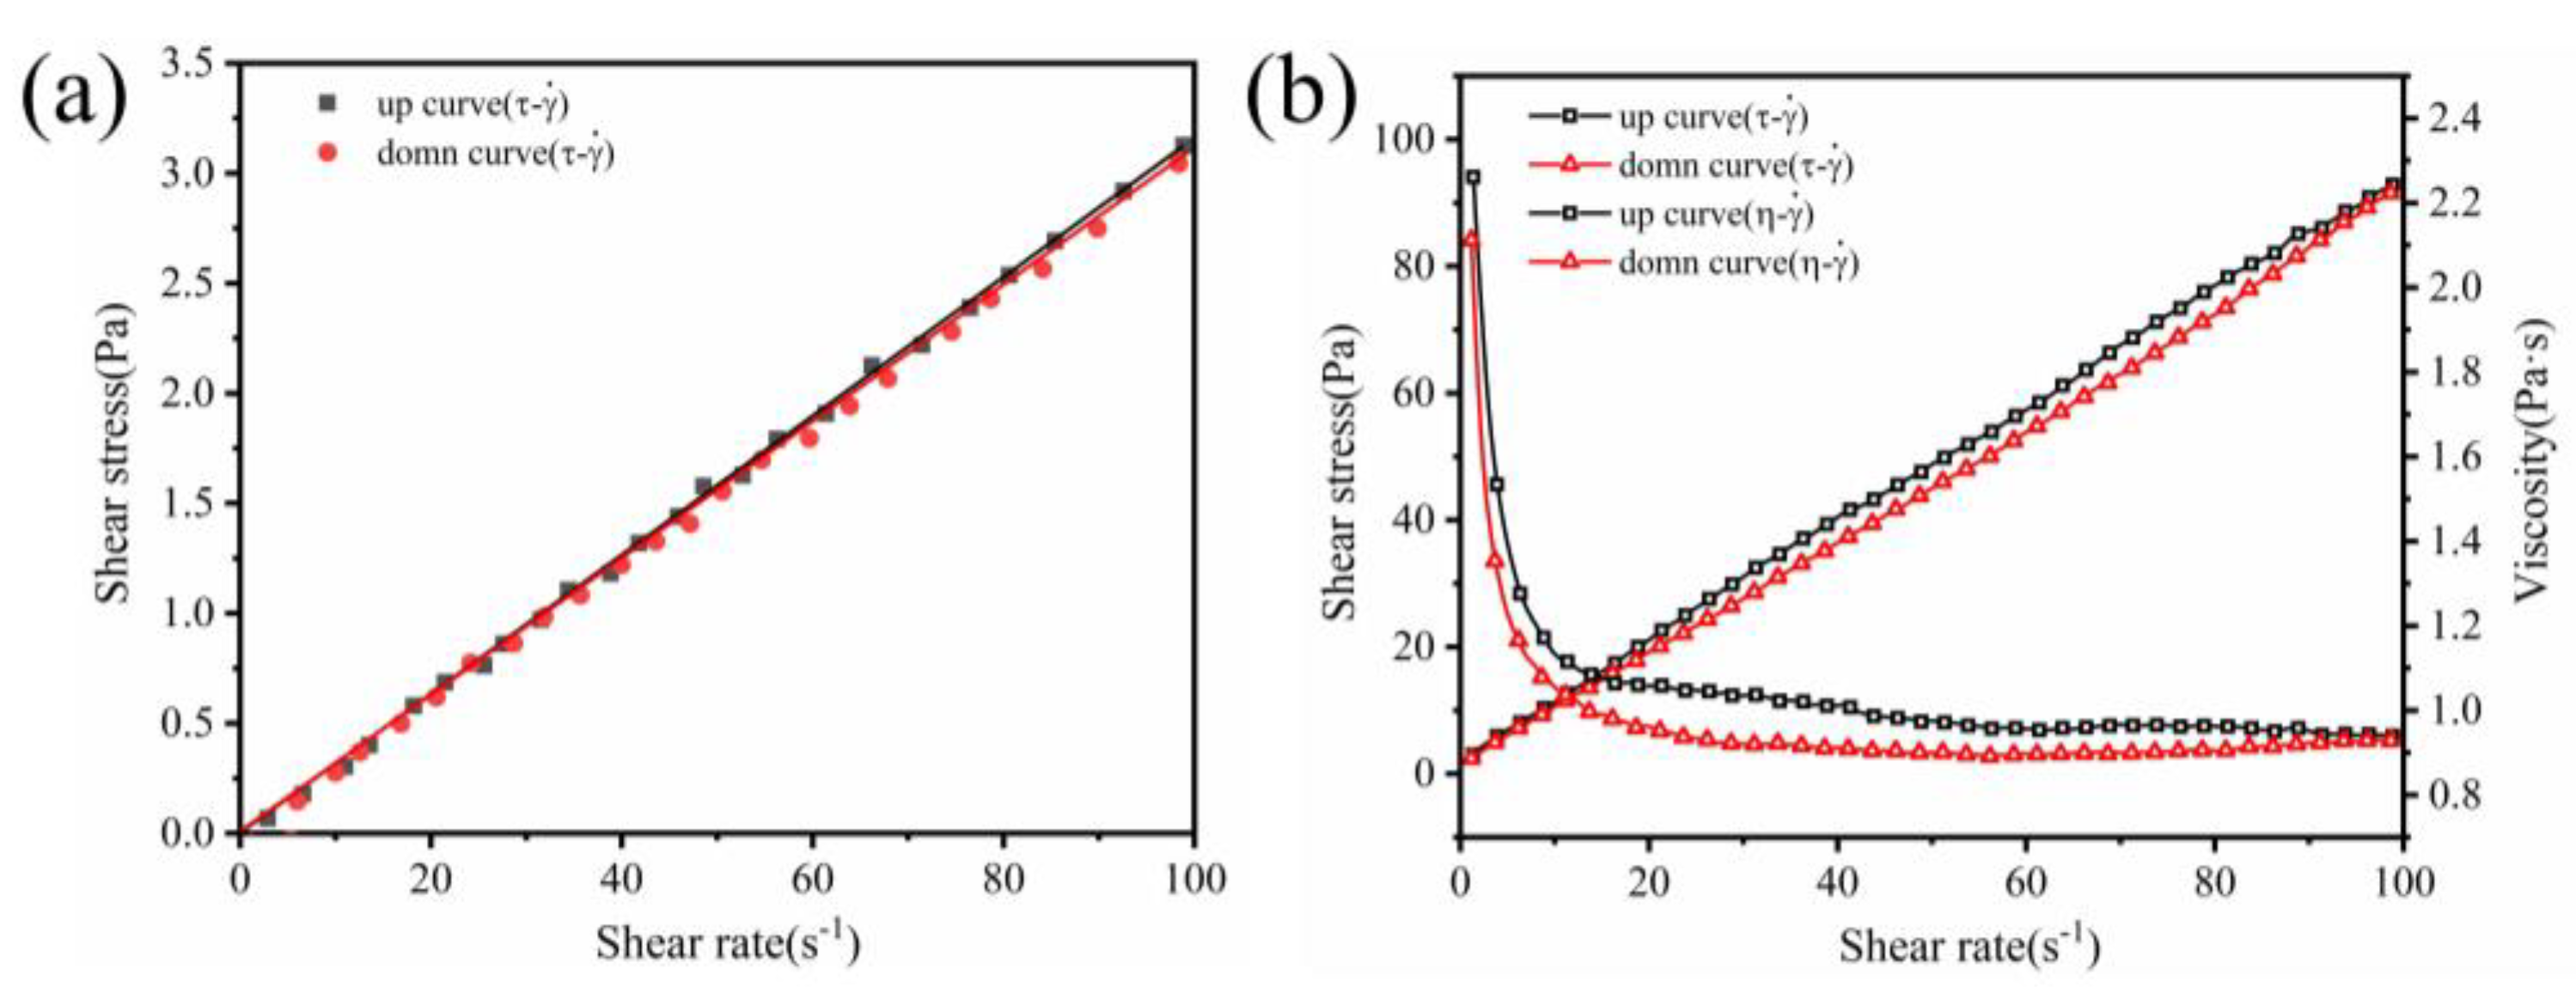
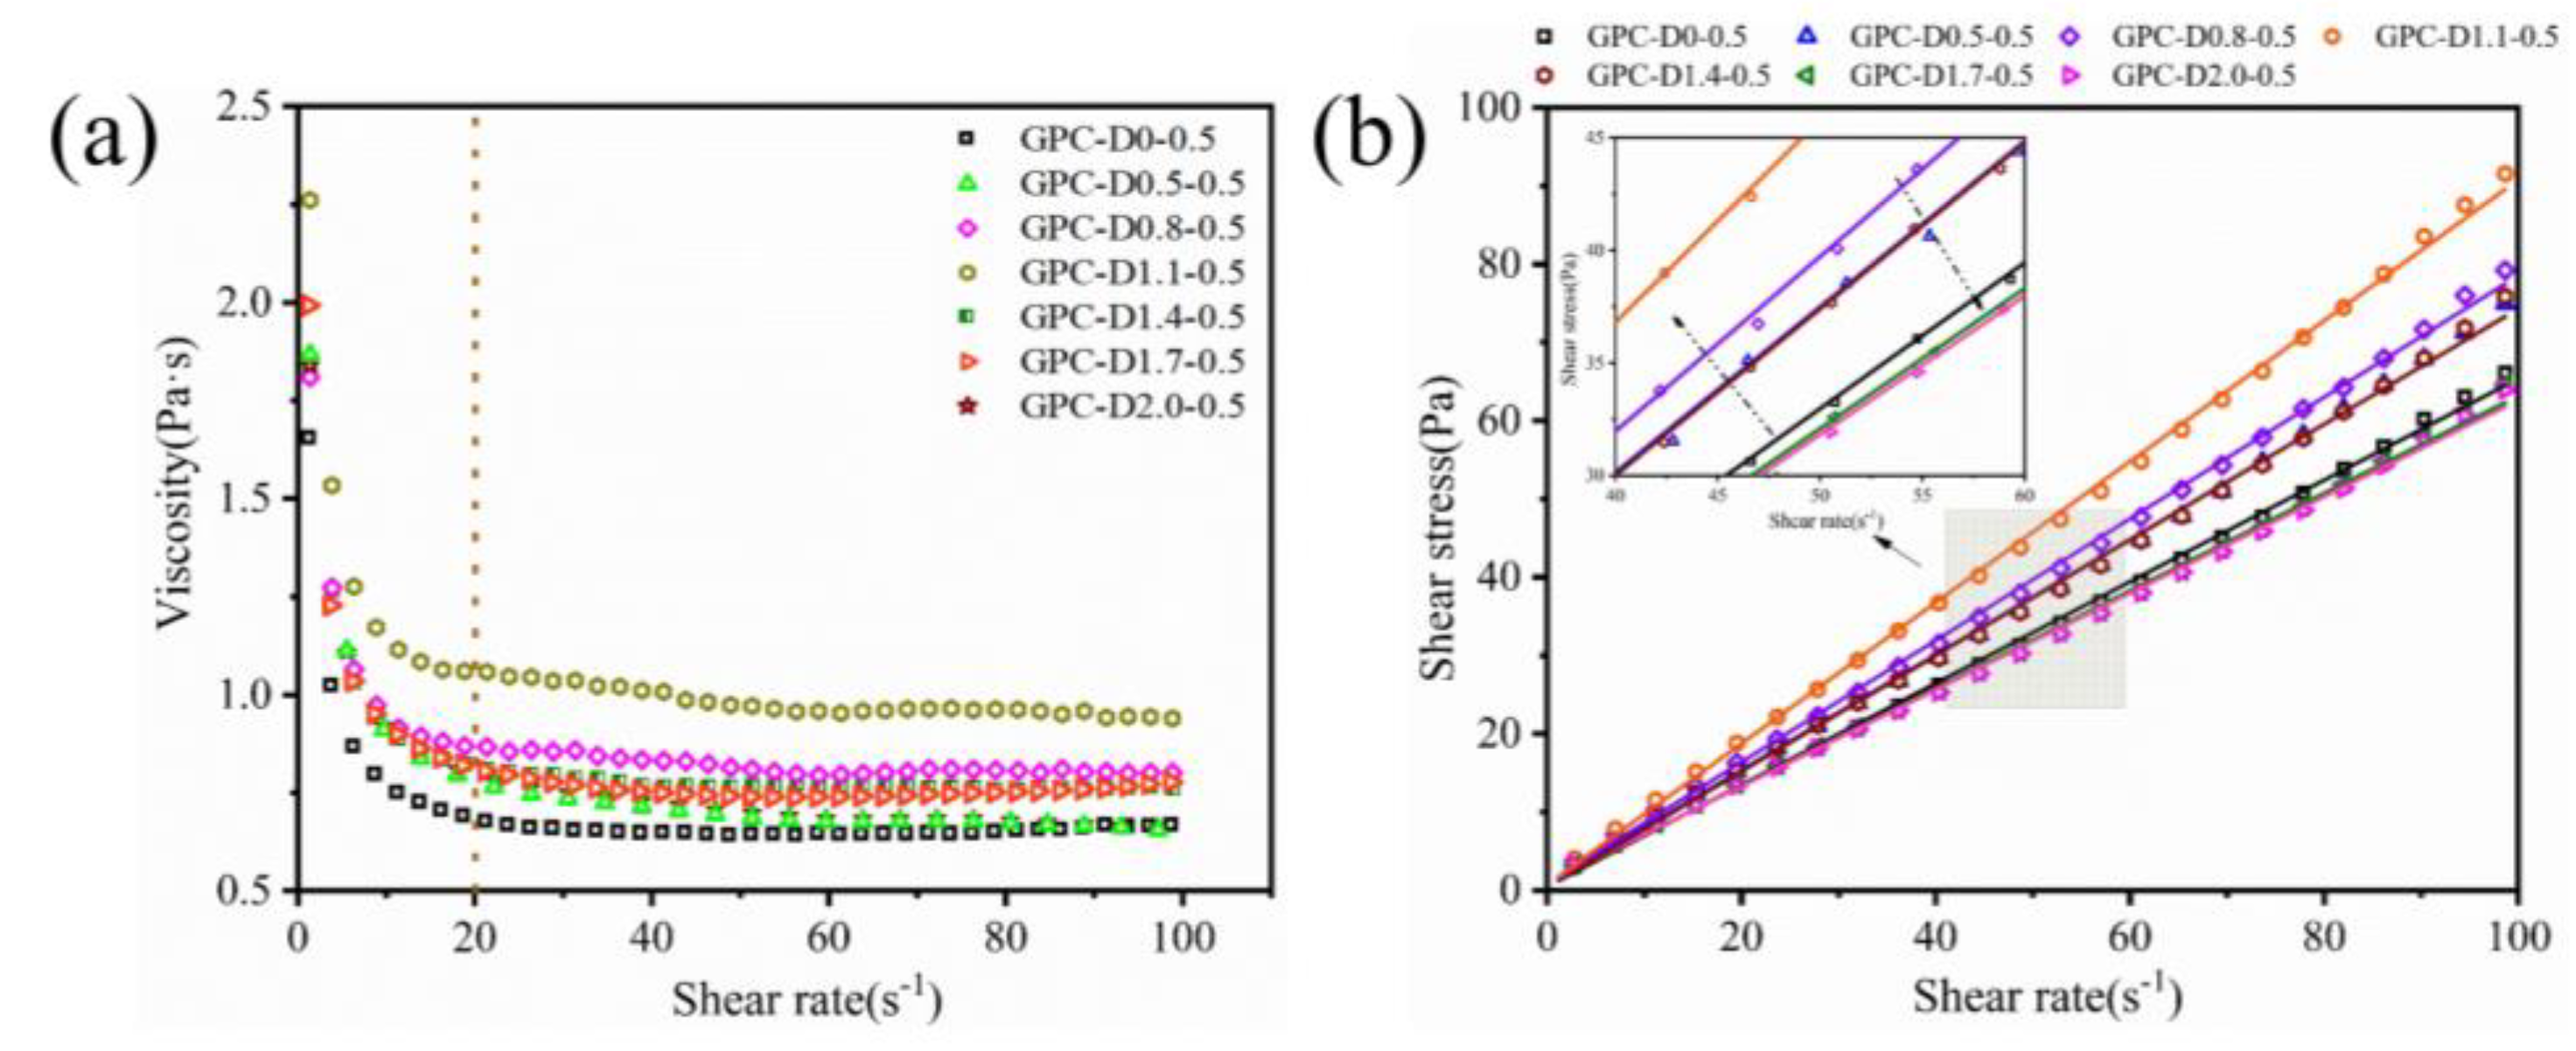
3.2. Rheology of Geopolymer Coatings
3.3. Water Retention Capacity and Setting Time Tests
3.4. Mechanical Properties of Geopolymer Coatings
3.5. The Enhancement Mechanism and Reaction Process of Diatomite
4. Conclusions
- (1)
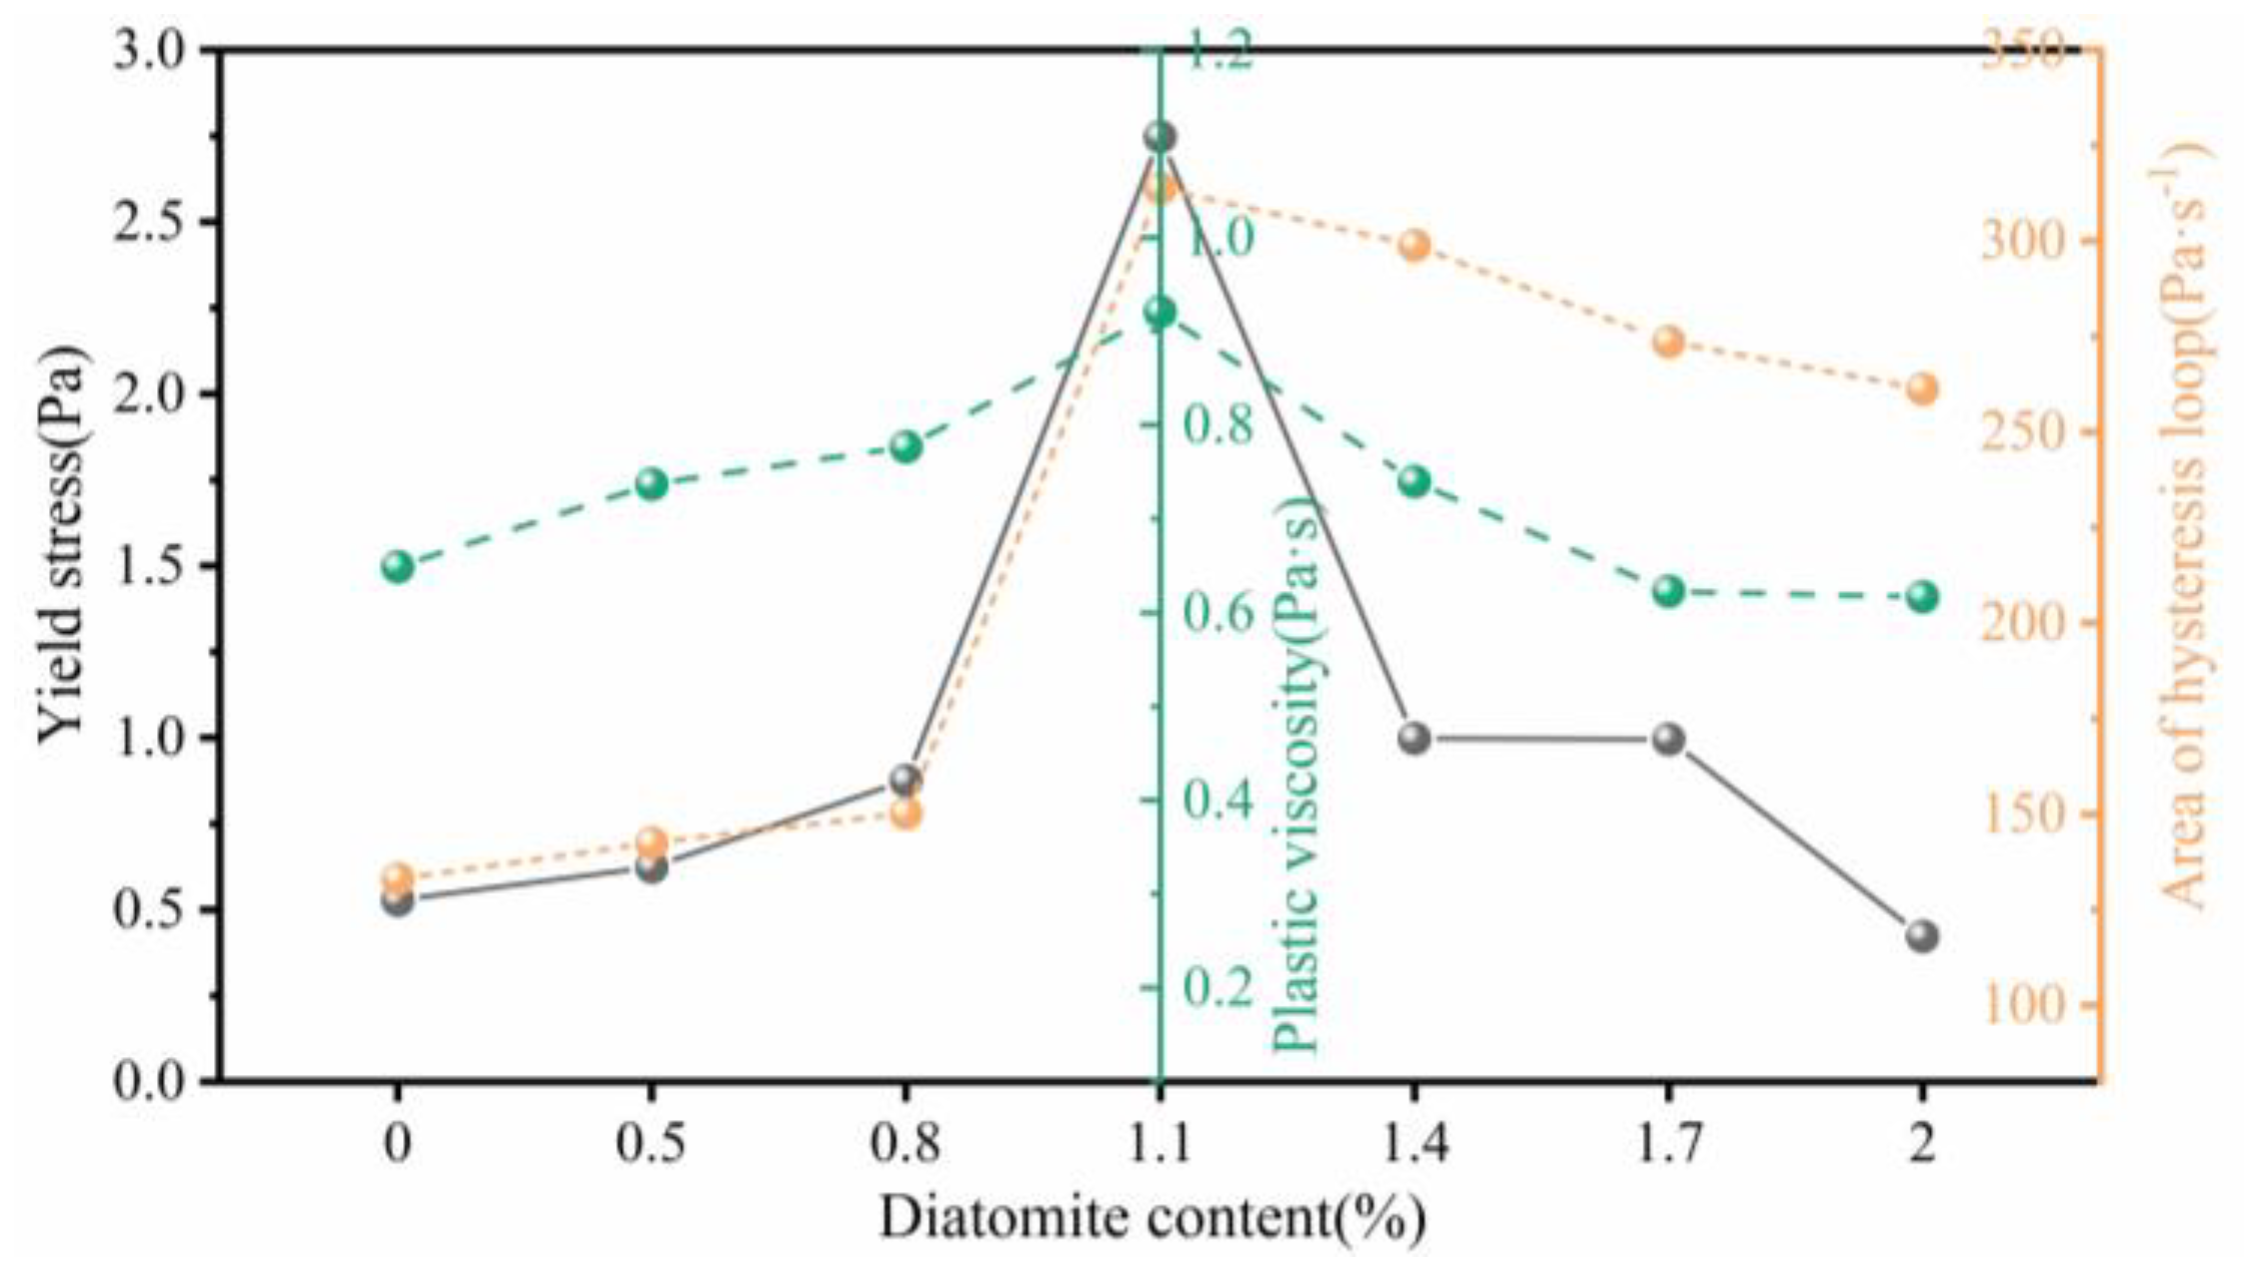
- The addition of diatomite affects the yield stress, plastic viscosity, and thixotropy of geopolymer coatings. The rheological properties increase followed by a decrease as the diatomite concentration increases. At a concentration of 1.1%, the geopolymer coating demonstrated optimal rheological parameters.
- (2)
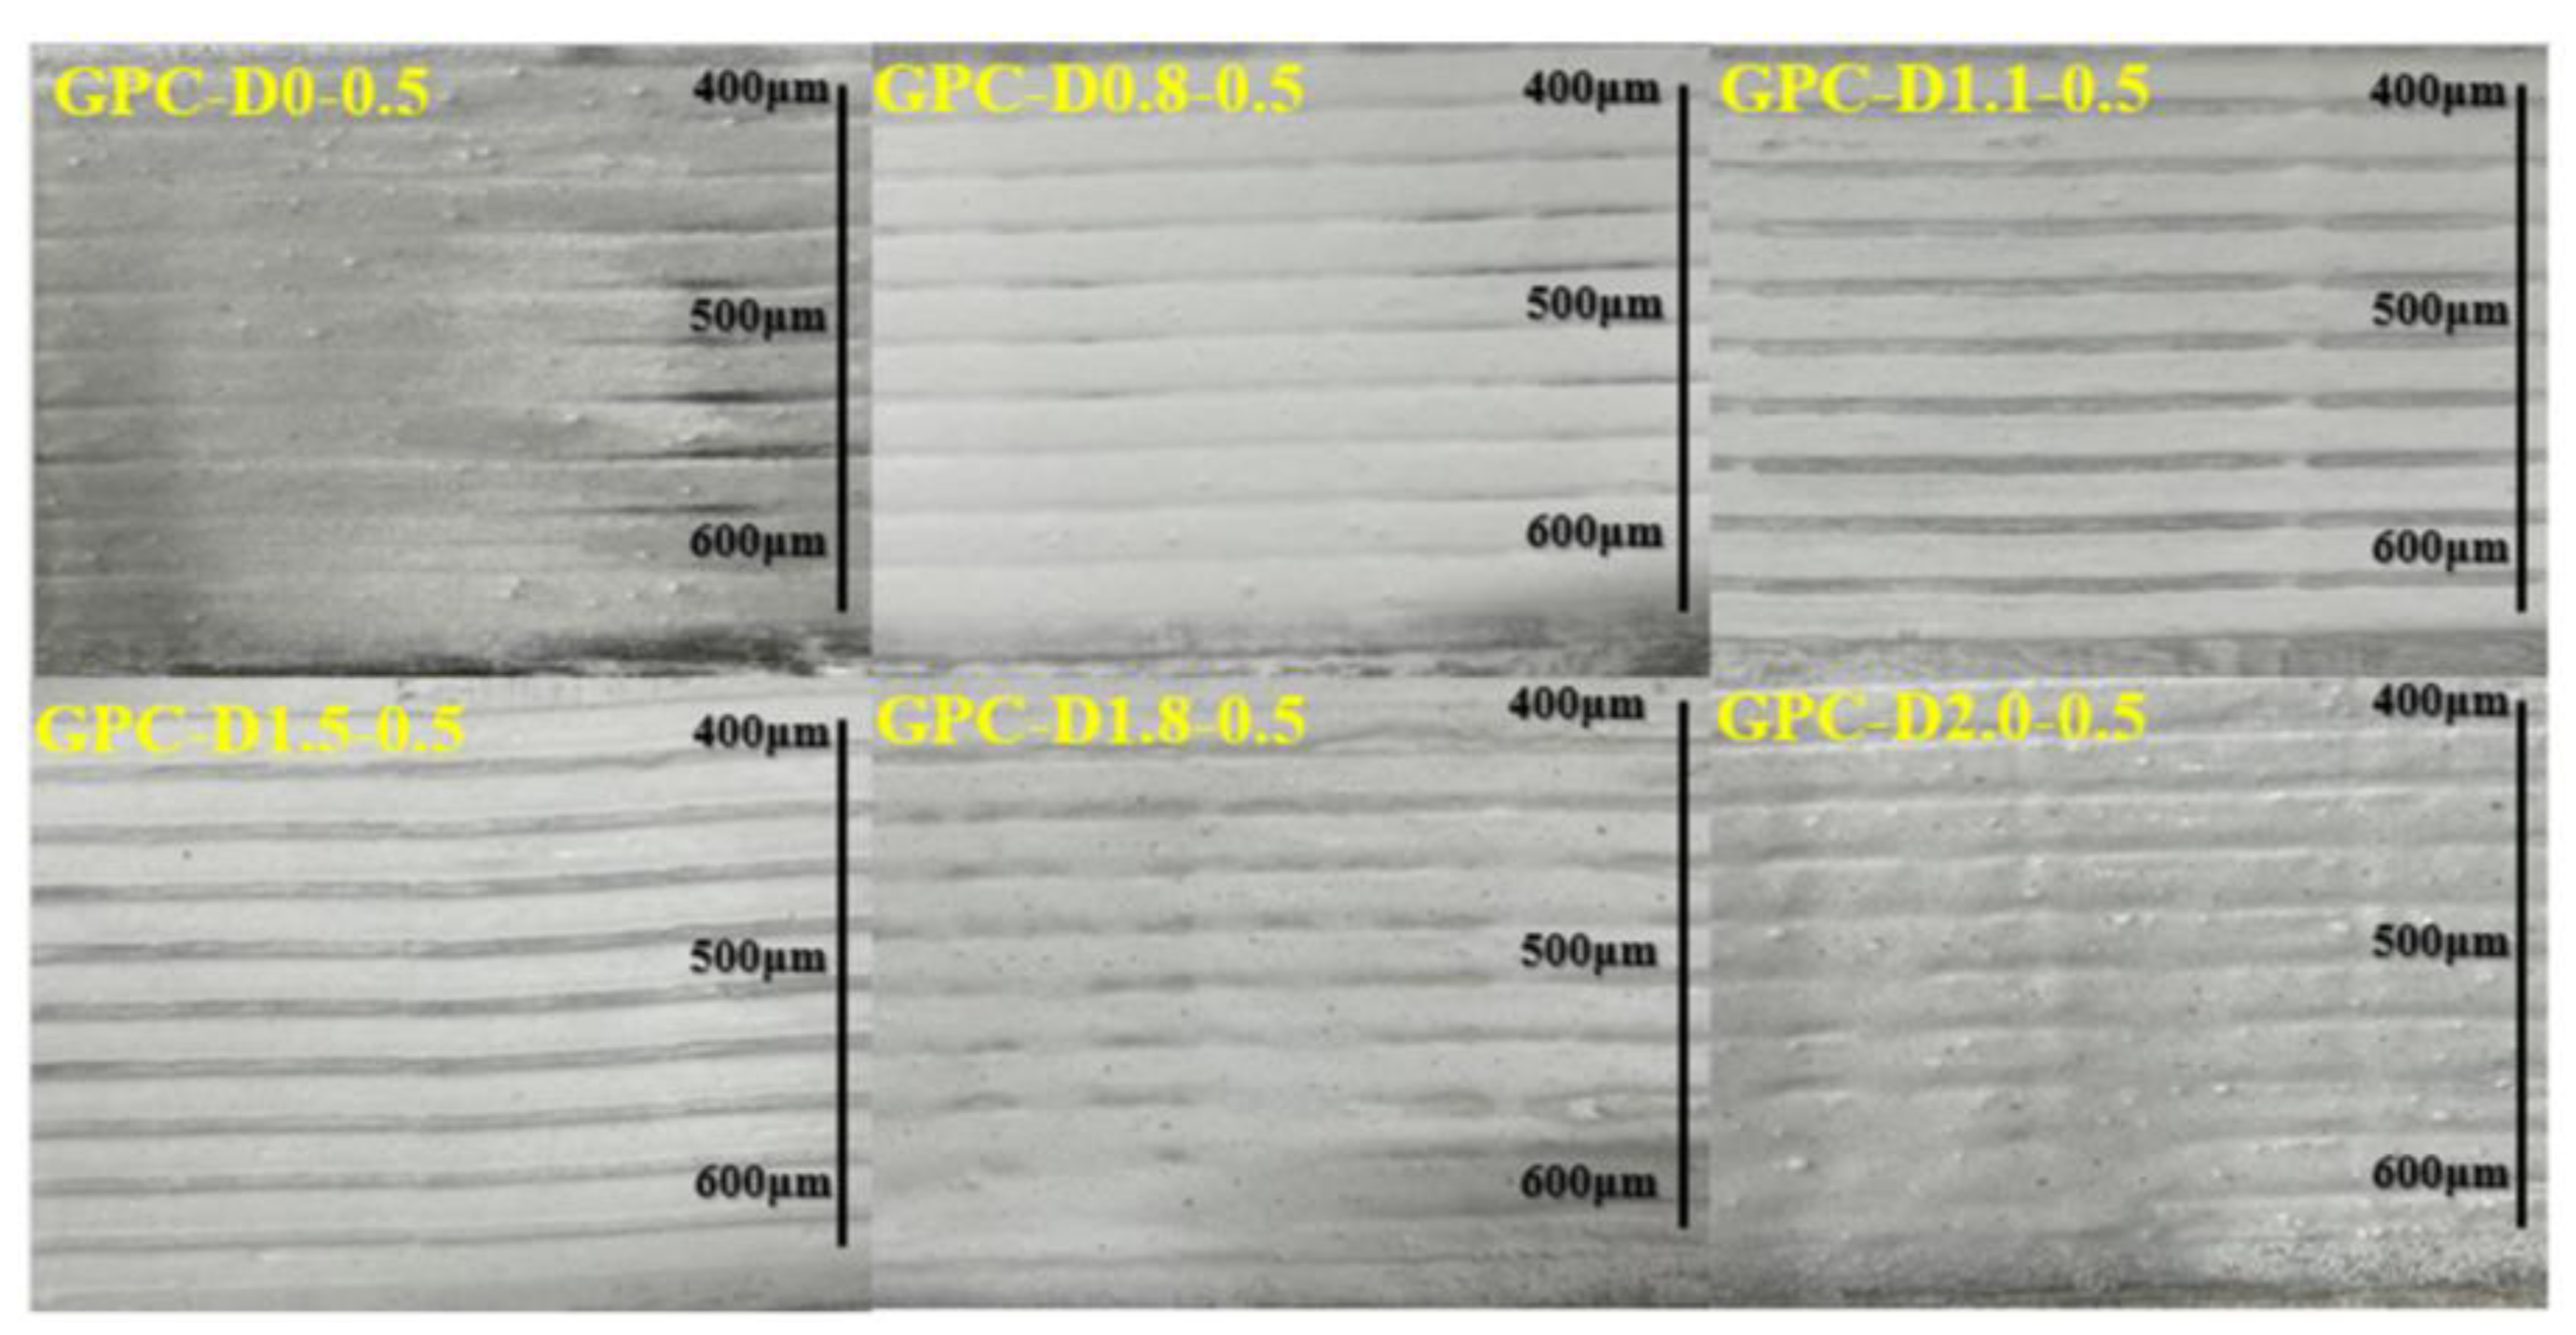
- The sag resistance of the geopolymer coatings initially improved then decreased with increasing diatomite concentration. Comparative tests showed coatings with 1.1% diatomite exhibited reduced sagging tendency on vertical surfaces, while maintaining stability and homogeneity at 600 μm thickness.
- (3)
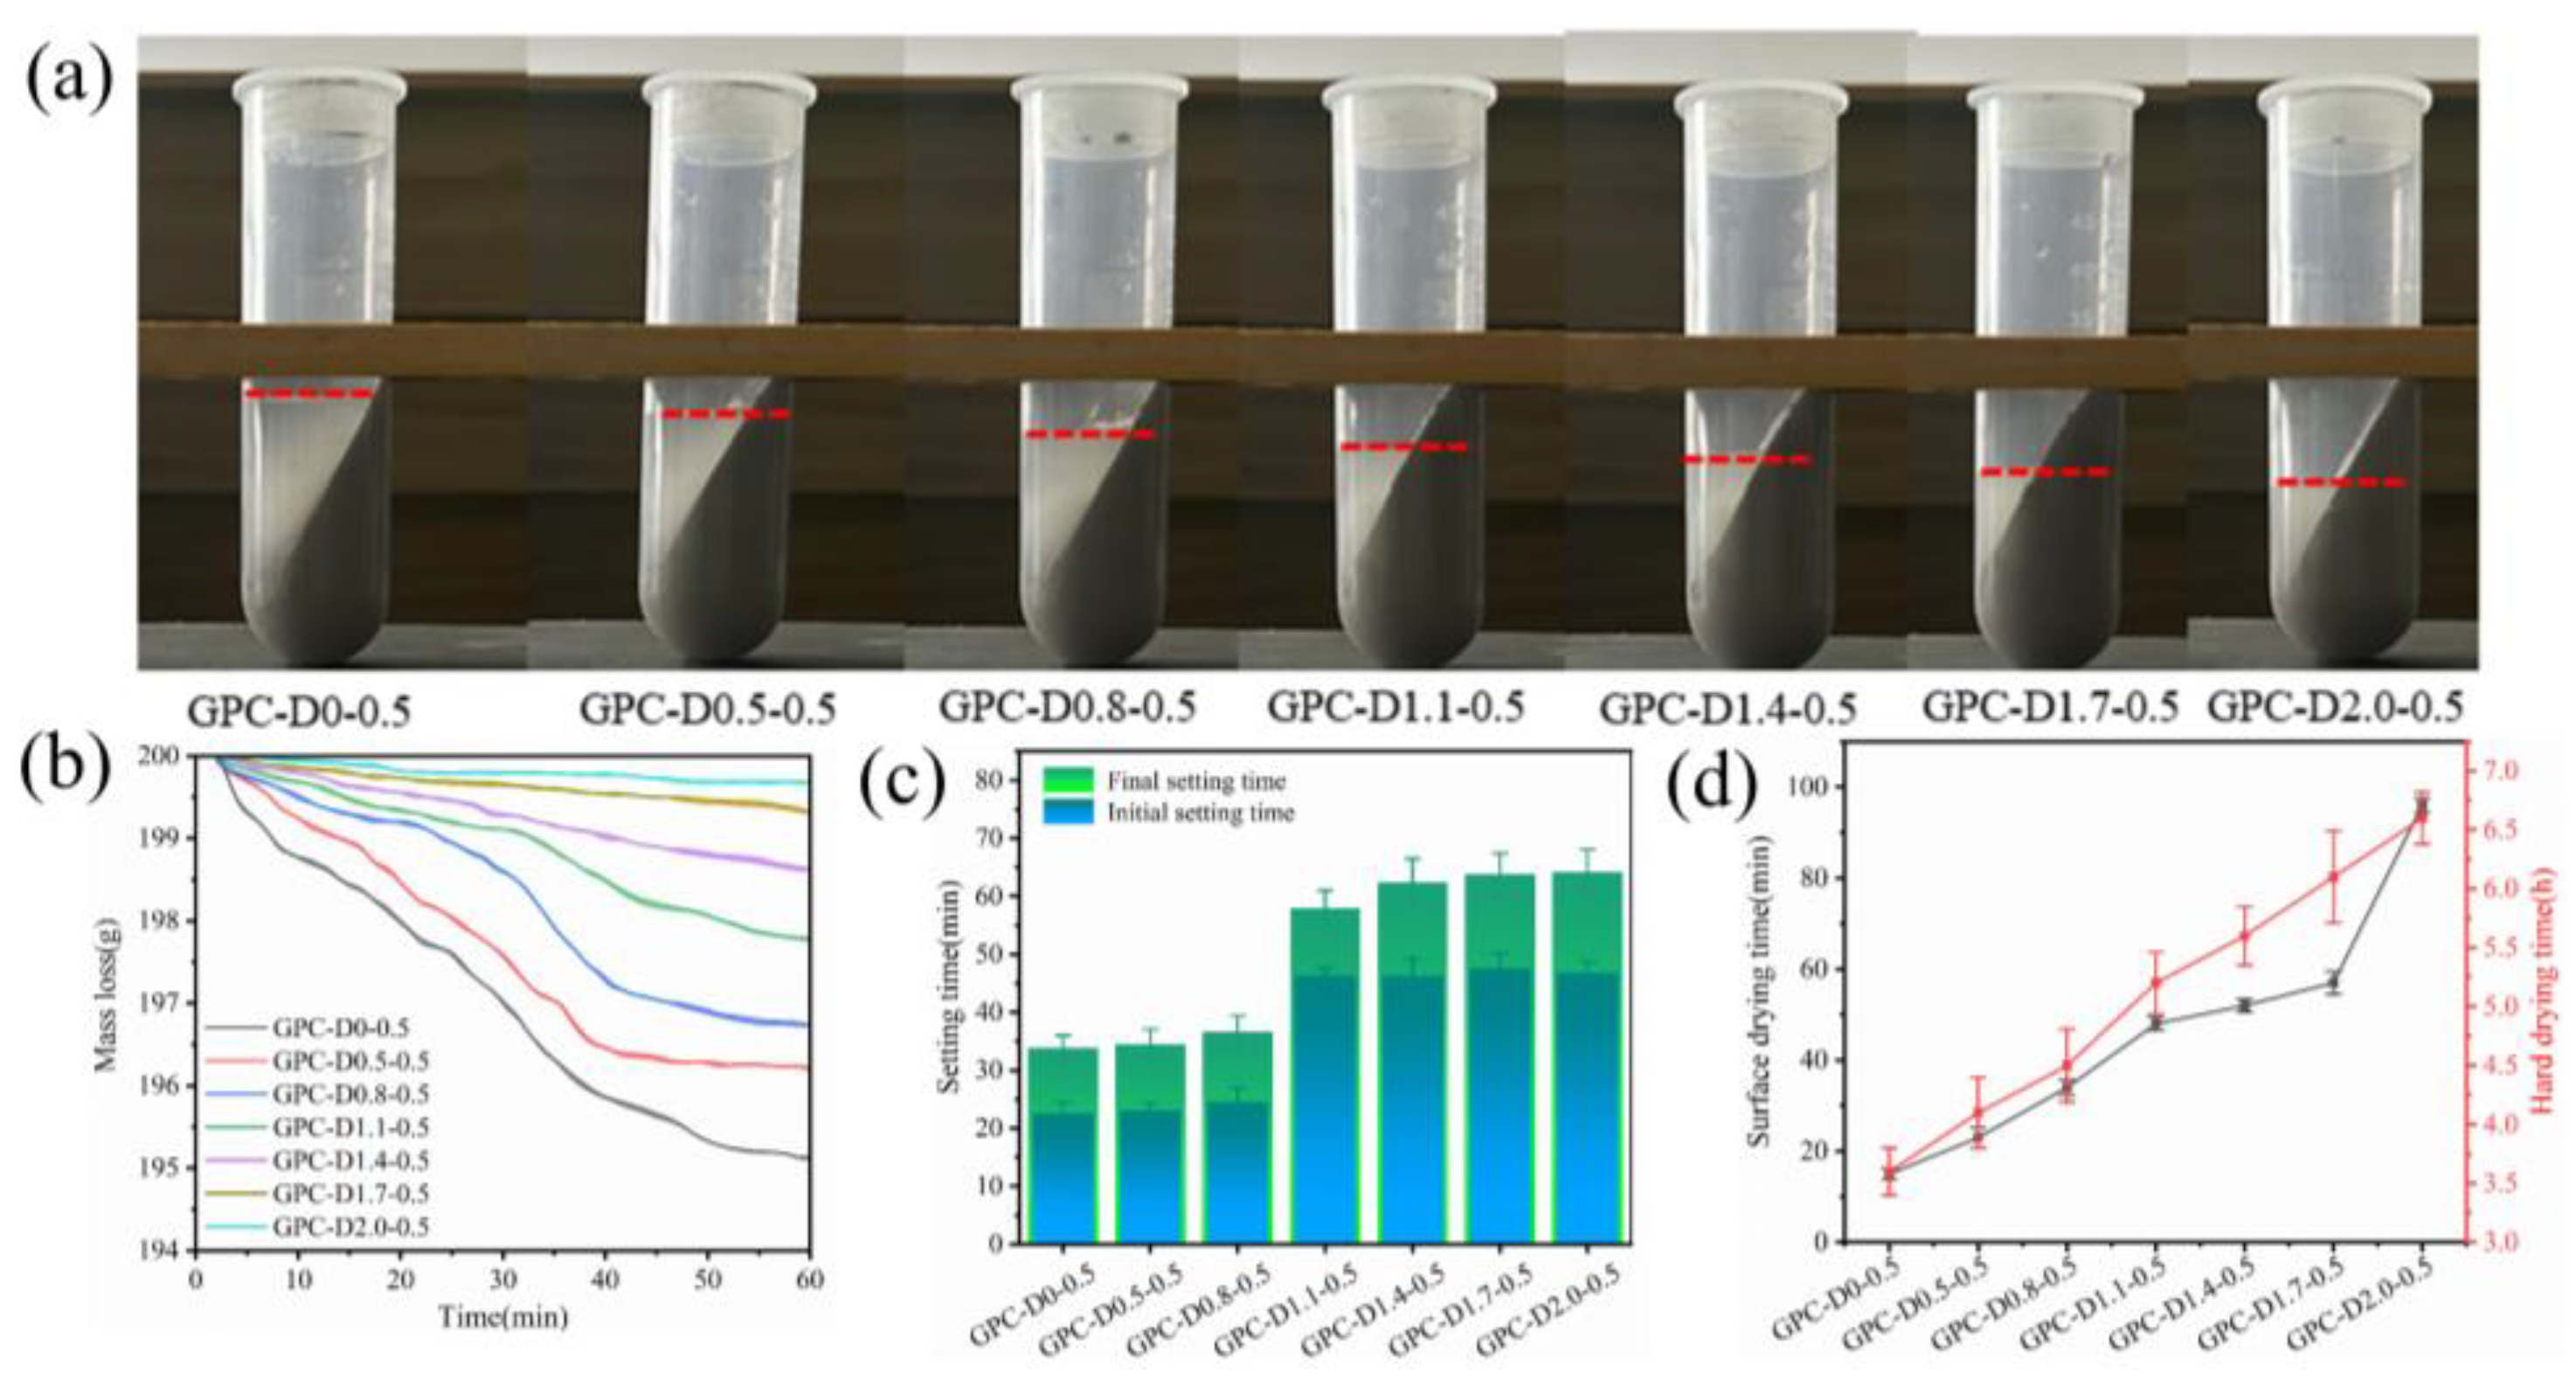
- Diatomite enhances water retention and extends the setting and drying times of geopolymer slurries. The porous structure and hydrophilic nature of diatomite reduce free water content in the system, minimizing early-stage water loss during coating hydration. Additionally, the setting and drying cycles increase with higher diatomite concentrations. Adding 1.1% and 2.0% diatomite extended the initial and final setting times by 109.09% and 93.33%, respectively, indicating improved construction performance.
- (4)
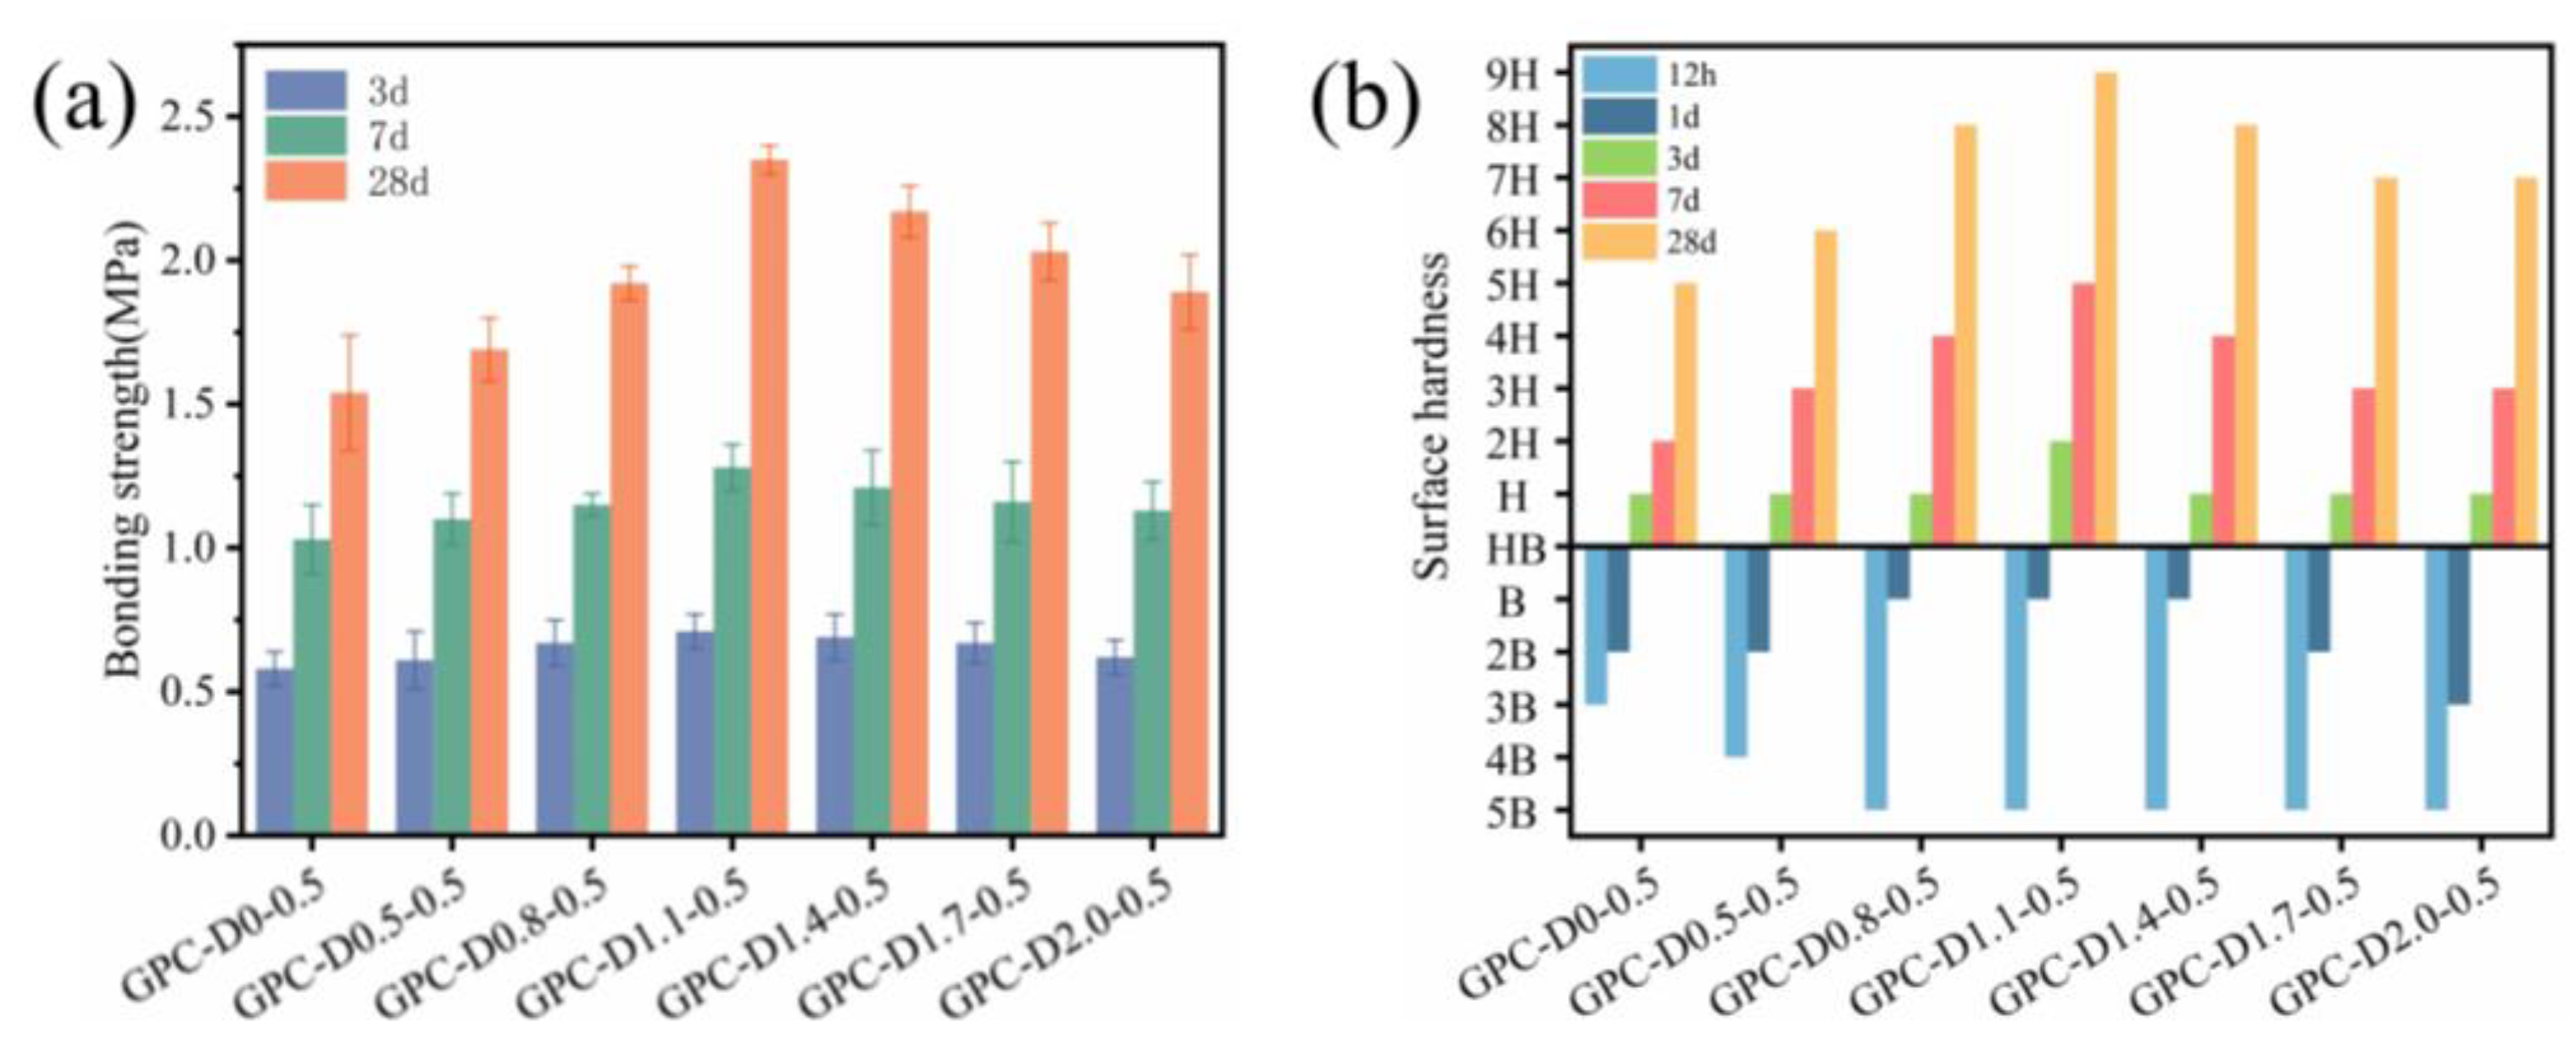
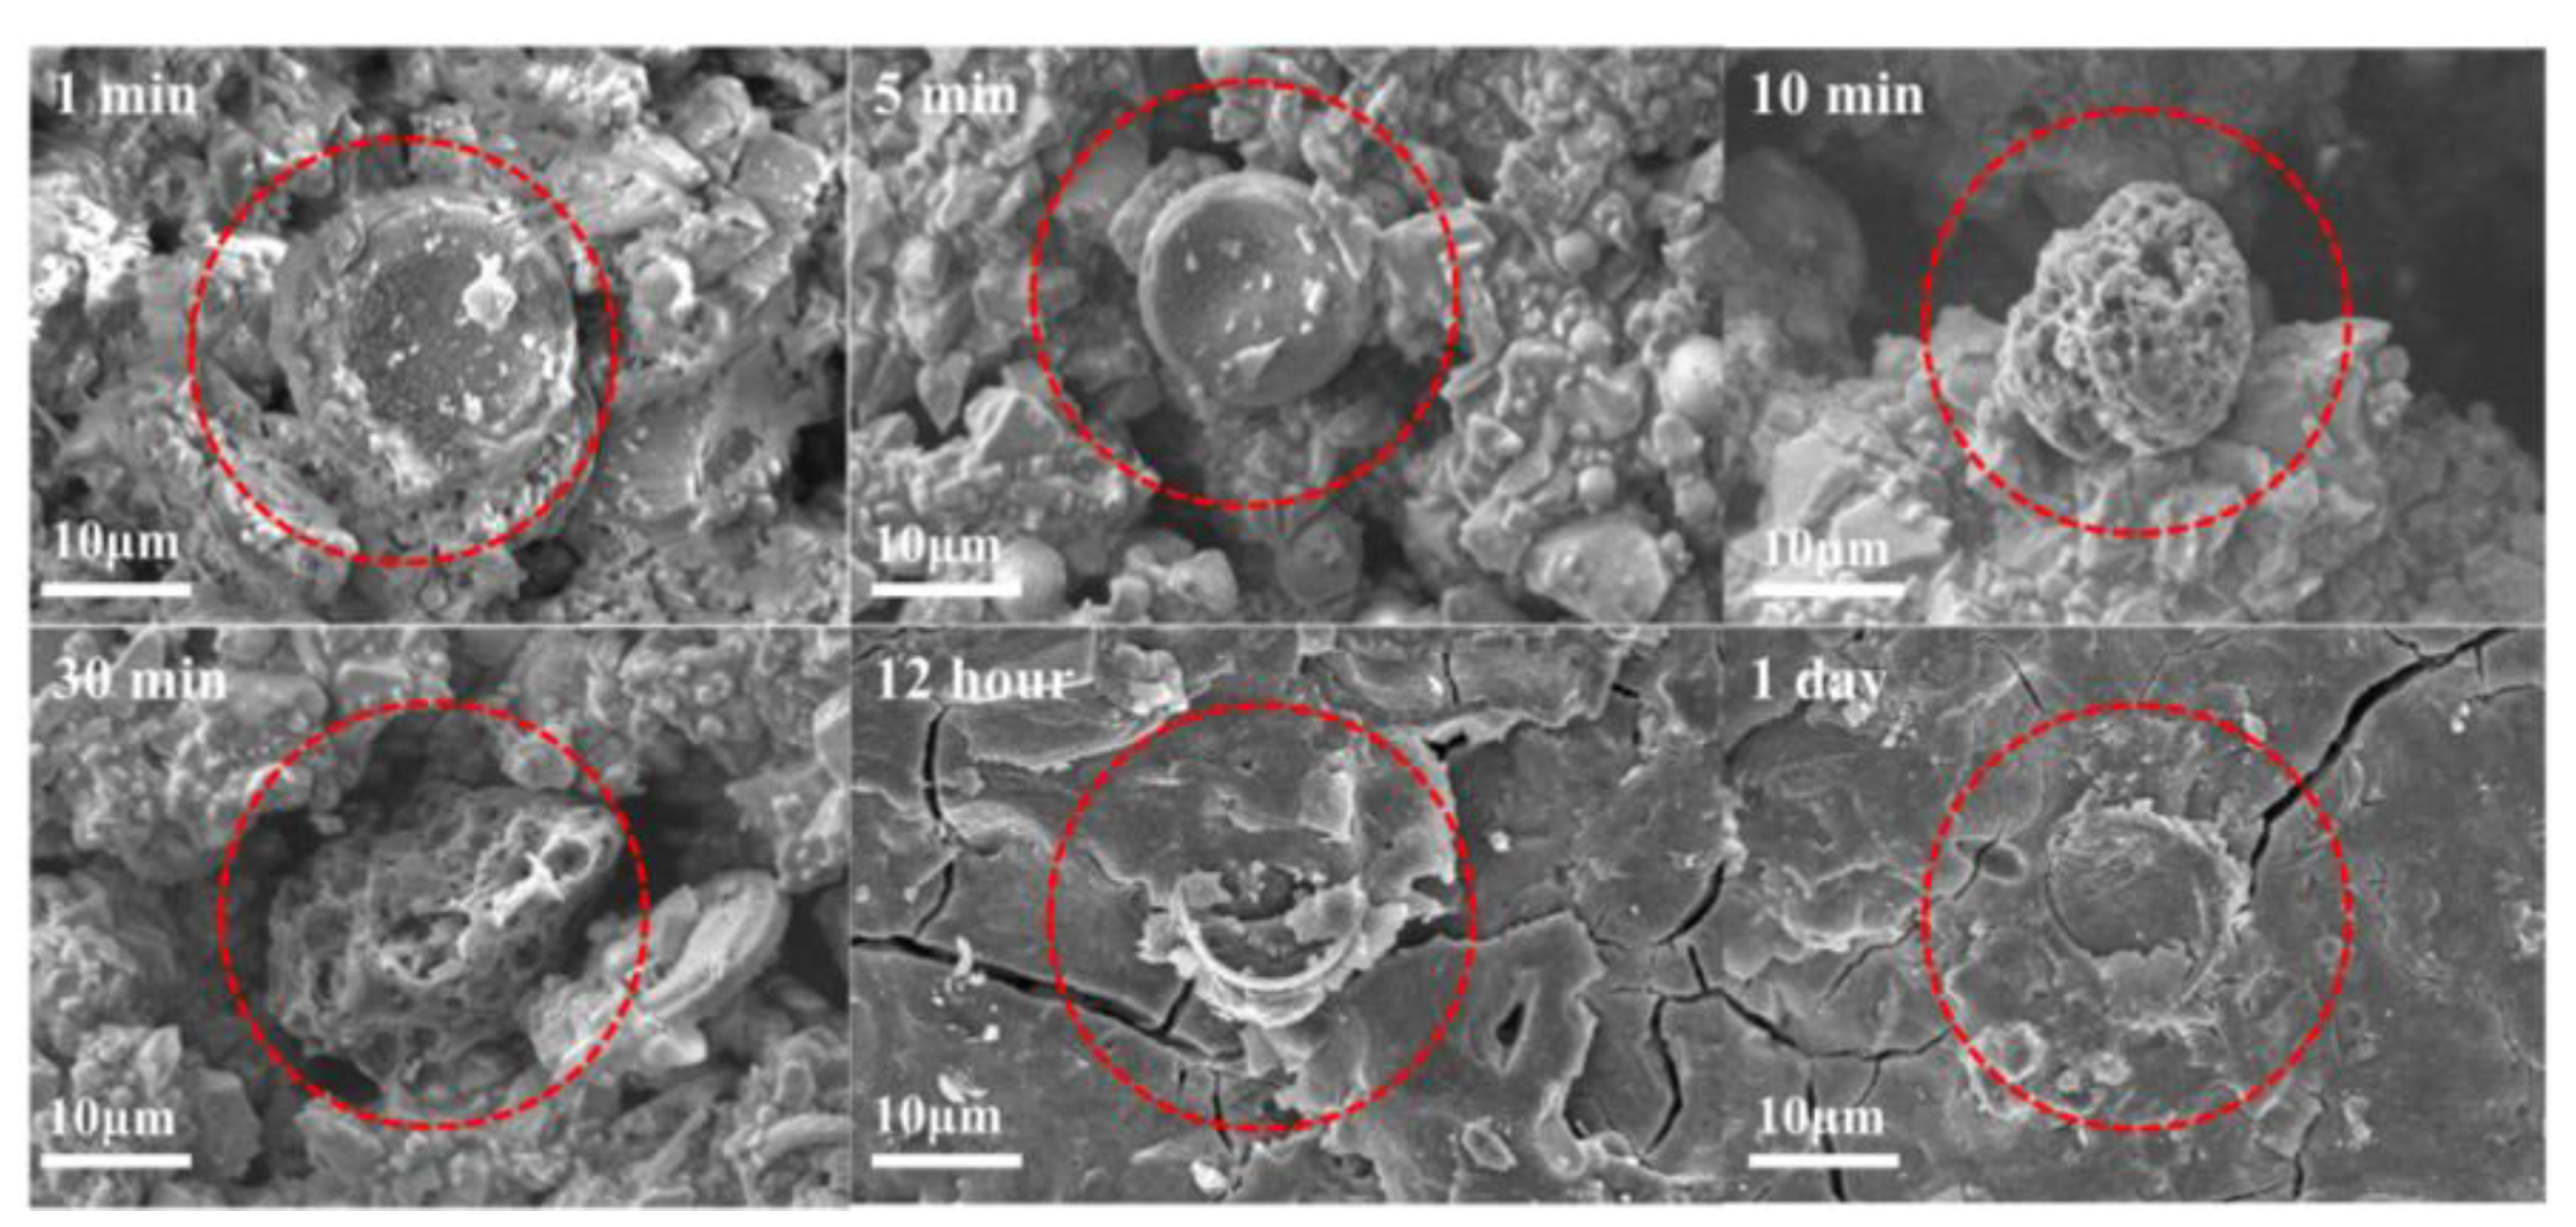
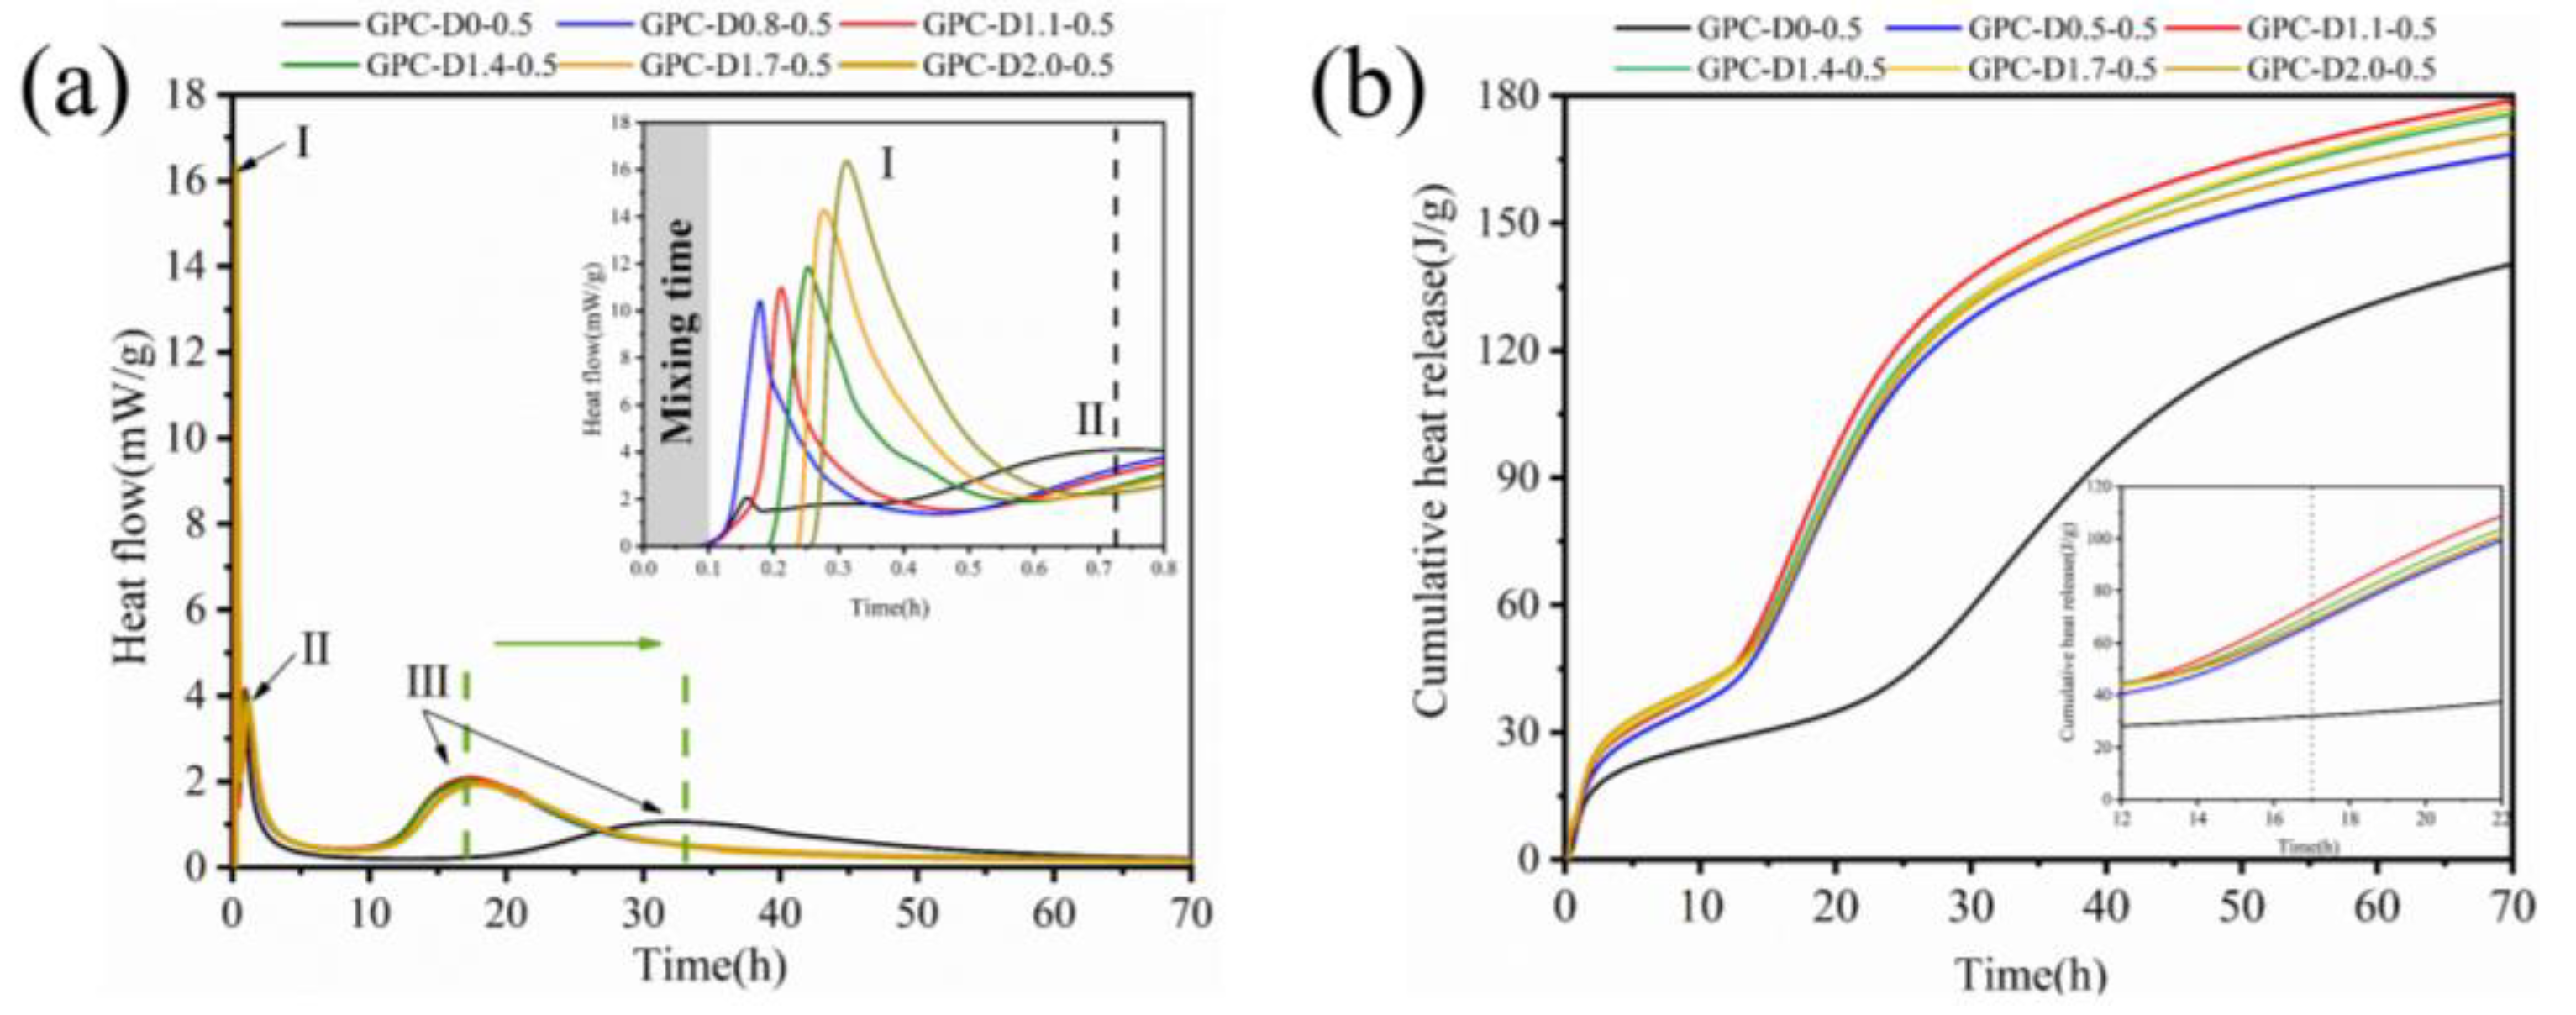
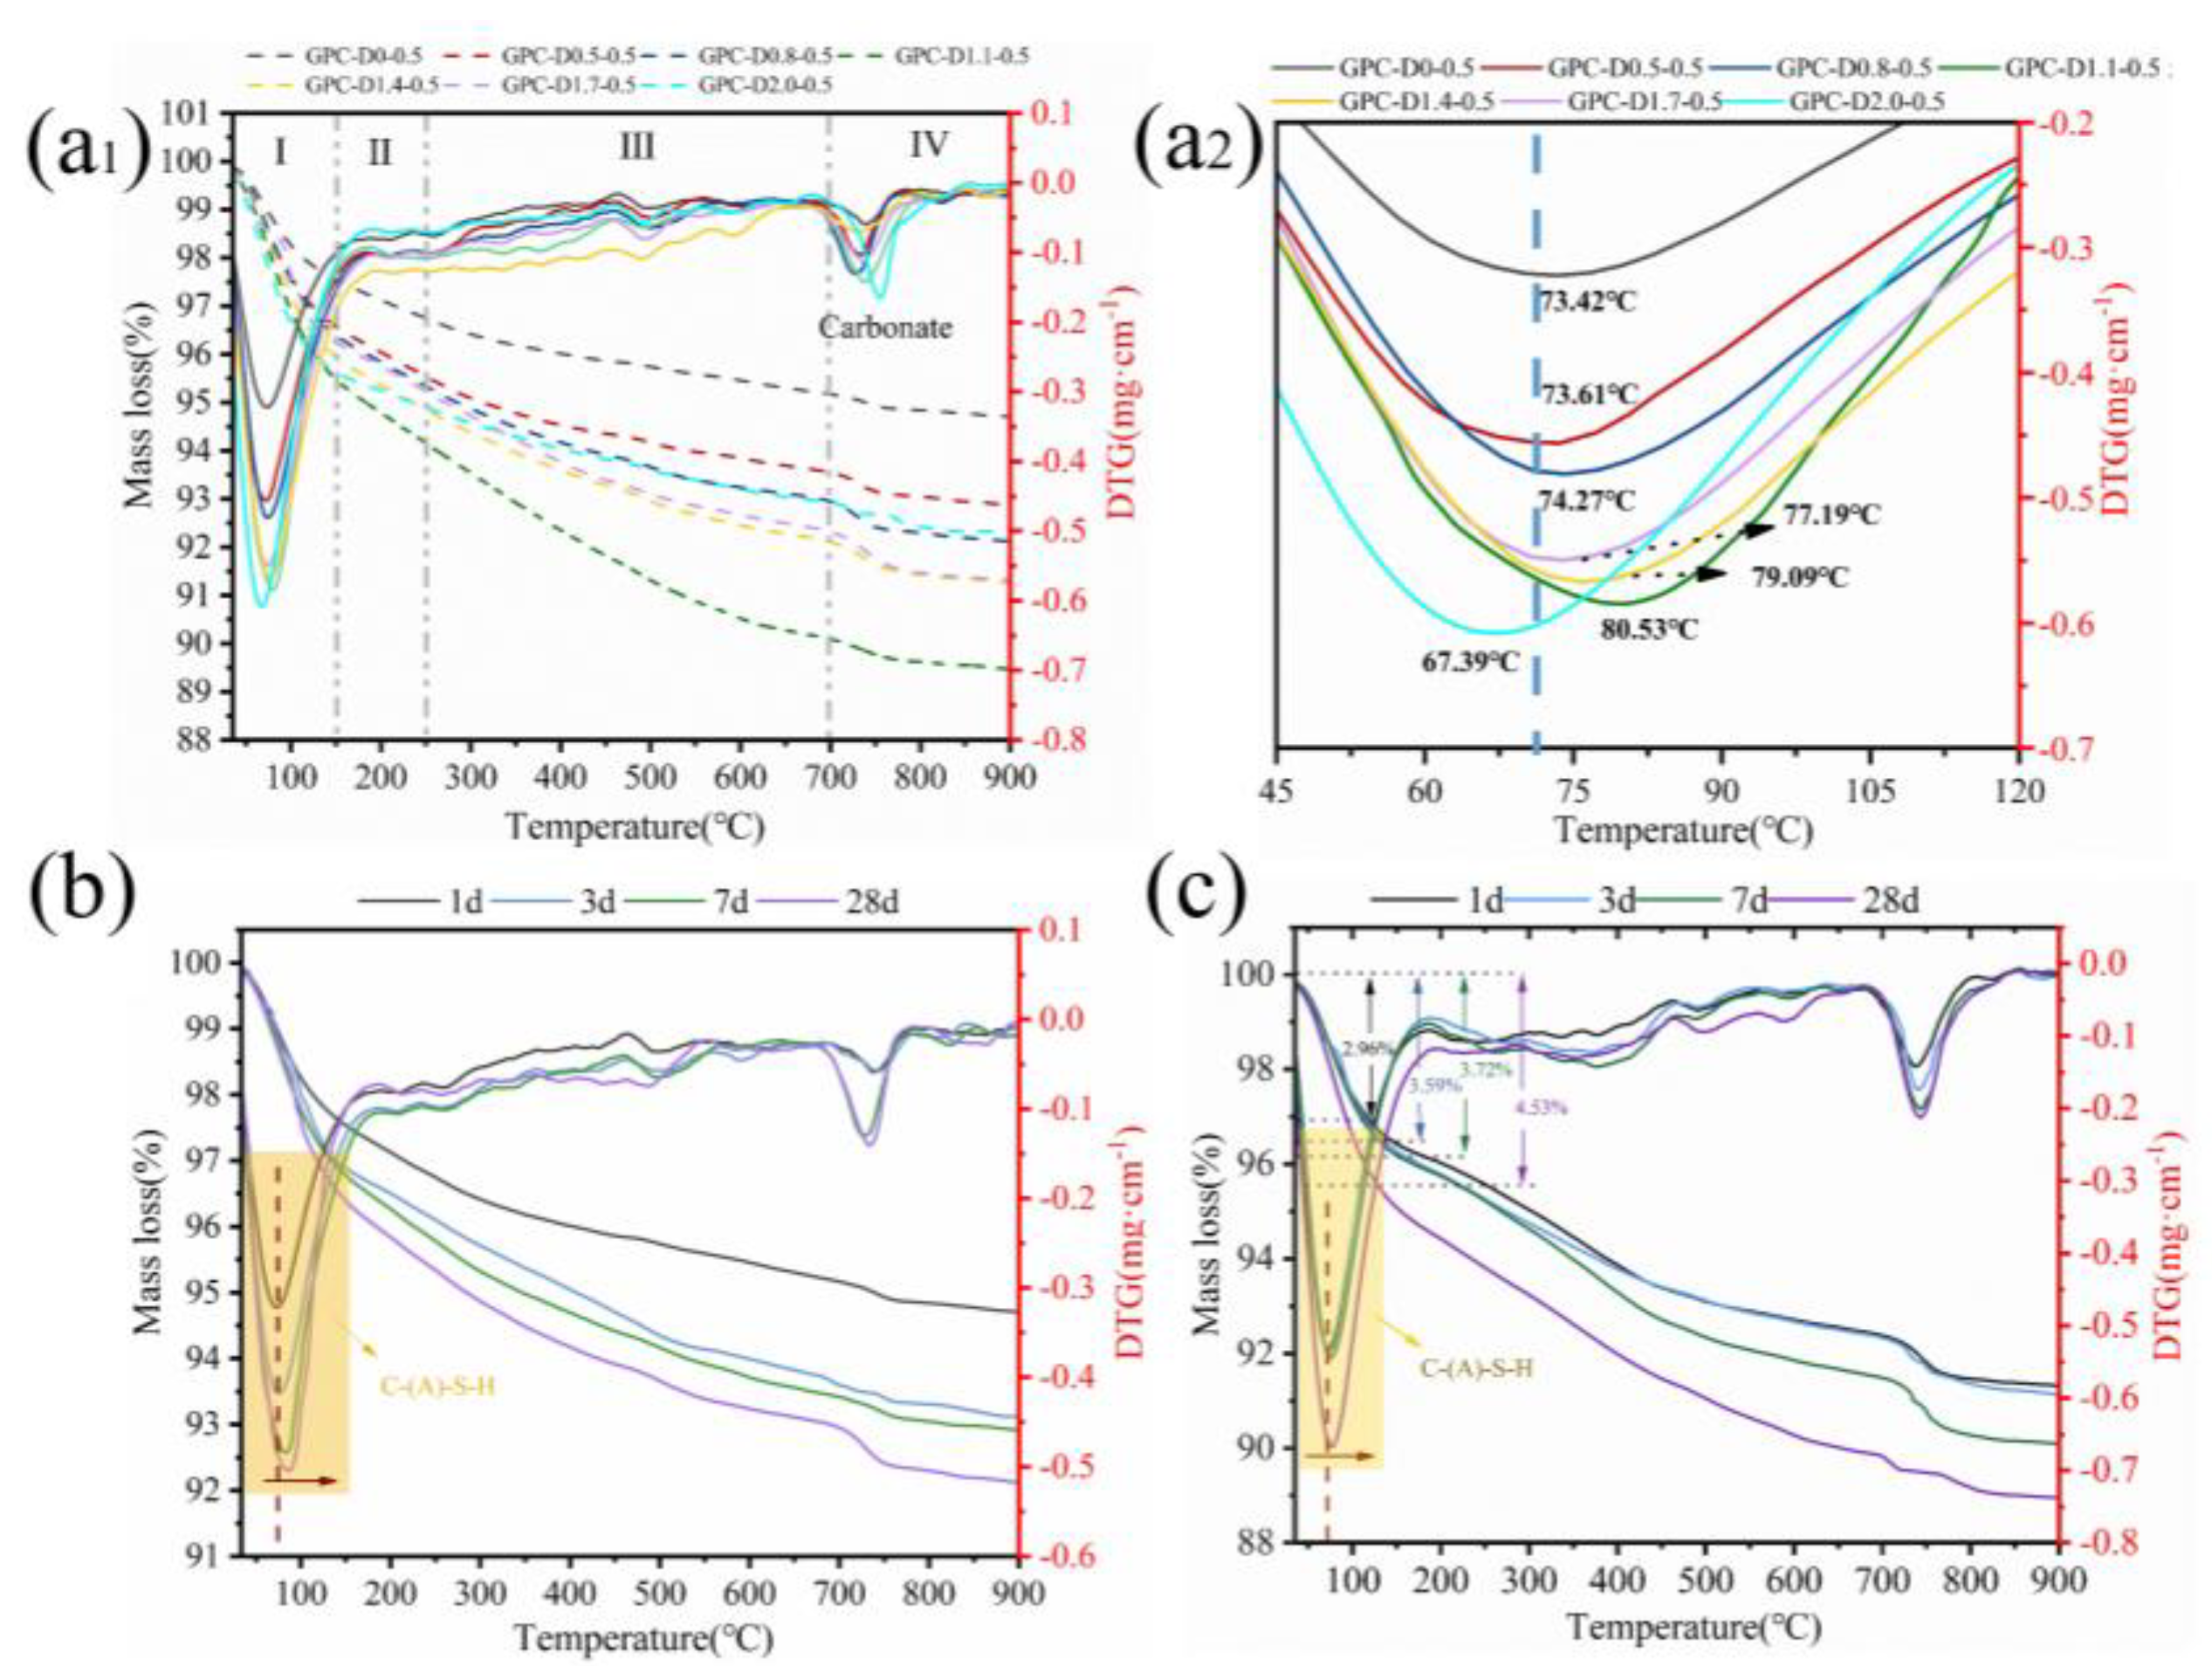
- The addition of diatomite accelerated the wetting and dissolution of slag and fly ash particles during early hydration, augmenting total hydration heat and gel phase content in the coatings. This augmentation enhances bond strength and surface hardness. At a concentration of 1.1% diatomite, the 28-day bonding strength increased by 54.9% compared to the sample without diatomite.
Acknowledgments
References
- X.S. Lv, K.T. Wang, Y. He, X.M. Cui, A green drying powder inorganic coating based on geopolymer technology, Construction and Building Materials 214 (2019) 441-448. [CrossRef]
- Z.T. Zhang, K.T. Wang, S.H. Mo, X.F. Li, X.M. Cui, Preparation and characterization of a reflective and heat insulative coating based on geopolymers, Energy Build. 87 (2015) 220-225. [CrossRef]
- Z.H. Zhang, X. Yao, H.J. Zhu, Potential application of geopolymers as protection coatings for marine concrete I. Basic properties, Applied Clay Science 49(1-2) (2010) 1-6. [CrossRef]
- Z.H. Zhang, X. Yao, H.J. Zhu, Potential application of geopolymers as protection coatings for marine concrete II. Microstructure and anticorrosion mechanism, Applied Clay Science 49(1-2) (2010) 7-12.
- Z.H. Zhang, X. Yao, H. Wang, Potential application of geopolymers as protection coatings for marine concrete III. Field experiment, Applied Clay Science 67-68 (2012) 57-60. [CrossRef]
- M. Arnoult, M. Perronnet, A. Autef, S. Rossignol, How to control the geopolymer setting time with the alkaline silicate solution, Journal of Non-Crystalline Solids 495 (2018) 59-66. [CrossRef]
- X. Xue, Y.L. Liu, J.G. Dai, C.S. Poon, W.D. Zhang, P. Zhang, Inhibiting efflorescence formation on fly ash-based geopolymer via silane surface modification, Cement & Concrete Composites 94 (2018) 43-52. [CrossRef]
- A.Y. Zhu, H.L. Wu, Y.D. Wang, J.Y. Liu, Evaluation of feasibility and performance of foamed Fire-Resistant coating materials, Construction and Building Materials 400 (2023) 10. [CrossRef]
- R.K. Lade, A.D. Musliner, C.W. Macosko, L.F. Francis, Evaluating sag resistance with a multinotched applicator: correlation with surface flow measurements and practical recommendations, J. Coat. Technol. Res. 12(5) (2015) 809-817. [CrossRef]
- R.K. Lade, J.O. Song, A.D. Musliner, B.A. Williams, S. Kumar, C.W. Macosko, L.F. Francis, Sag in drying coatings: Prediction and real time measurement with particle tracking, Prog. Org. Coat. 86 (2015) 49-58. [CrossRef]
- C.S. Wang, G. Chapelle, P. Carreau, M.C. Heuzey, Prediction of sag resistance in paints using rheological measurements, Prog. Org. Coat. 153 (2021) 7. [CrossRef]
- Q.Y. Zhong, H. Nie, G.L. Xie, H. Peng, Experimental study on the characteristics, rheological factors, and flowability of MK-GGBFS geopolymer slurry, Journal of Building Engineering 76 (2023) 15. [CrossRef]
- Y. Rifaai, A. Yahia, A. Mostafa, S. Aggoun, E. Kadri, Rheology of fly ash-based geopolymer: Effect of NaOH concentration, Construction and Building Materials 223 (2019) 583-594. [CrossRef]
- D.W. Zhang, D.M. Wang, Z. Liu, F.Z. Xie, Rheology, agglomerate structure, and particle shape of fresh geopolymer pastes with different NaOH activators content, Construction and Building Materials 187 (2018) 674-680. [CrossRef]
- S. Kawashima, M. Chaouche, D.J. Corr, S.P. Shah, Rate of thixotropic rebuilding of cement pastes modified with highly purified attapulgite clays, Cement and Concrete Research 53 (2013) 112-118.
- Gadkar, K.V.L. Subramaniam, An evaluation of yield and Maxwell fluid behaviors of fly ash suspensions in alkali-silicate solutions, Mater. Struct. 52(6) (2019) 10. [CrossRef]
- J.J. Thomas, H.M. Jennings, J.J. Chen, Influence of Nucleation Seeding on the Hydration Mechanisms of Tricalcium Silicate and Cement, J. Phys. Chem. C 113(11) (2009) 4327-4334. [CrossRef]
- S.L. Xu, J.T. Liu, Q.H. Li, Mechanical properties and microstructure of multi-walled carbon nanotube-reinforced cement paste, Construction and Building Materials 76 (2015) 16-23. [CrossRef]
- M.S. Konsta-Gdoutos, Z.S. Metaxa, S.P. Shah, Multi-scale mechanical and fracture characteristics and early-age strain capacity of high performance carbon nanotube/cement nanocomposites, Cement & Concrete Composites 32(2) (2010) 110-115. [CrossRef]
- K. Kondepudi, K.V.L. Subramaniam, Extrusion-Based Three-Dimensional Printing Performance of Alkali-Activated Binders, ACI Mater. J. 118(6) (2021) 87-96.
- Z.H. Zhao, M.X. Chen, X. Zhong, Y.B. Huang, L. Yang, P.Q. Zhao, S.D. Wang, L.C. Lu, X. Cheng, Effects of bentonite, diatomite and metakaolin on the rheological behavior of 3D printed magnesium potassium phosphate cement composites, Addit. Manuf. 46 (2021) 12. [CrossRef]
- Z.Y. Liu, J.Y. Jiang, X. Jin, Y.C. Wang, Y.S. Zhang, Experimental and numerical investigations on the inhibition of freeze-thaw damage of cement-based materials by a methyl laurate/diatomite microcapsule phase change material, J. Energy Storage 68 (2023) 12. [CrossRef]
- C. Phiangphimai, G. Joinok, T. Phoo-ngernkham, N. Damrongwiriyanupap, S. Hanjitsuwan, C. Suksiripattanapong, P. Sukontasukkul, P. Chindaprasirt, Durability properties of novel coating material produced by alkali-activated/cement powder, Construction and Building Materials 363 (2023) 11. [CrossRef]
- M.A. Salam, M. Mokhtar, S.M. Albukhari, D.F. Baamer, L. Palmisano, A.A. AlHammadi, M.R. Abukhadra, Synthesis of zeolite/geopolymer composite for enhanced sequestration of phosphate (PO43-) and ammonium (NH4+) ions; equilibrium properties and realistic study, J. Environ. Manage. 300 (2021) 10. [CrossRef]
- M.A. Salam, M. Mokhtar, S.M. Albukhari, D.F. Baamer, L. Palmisano, M.R. Abukhadra, Insight into the role of the zeolitization process in enhancing the adsorption performance of kaolinite/diatomite geopolymer for effective retention of Sr (II) ions; batch and column studies, J. Environ. Manage. 294 (2021) 11. [CrossRef]
- C. Alvarado, D. Martínez-Cerna, H. Alvarado-Quintana, Geopolymer Made from Kaolin, Diatomite, and Rice Husk Ash for Ceiling Thermal Insulation, Buildings-Basel 14(1) (2024) 16. [CrossRef]
- M.R. Abukhadra, M.H. Eid, A.M. El-Sherbeeny, A.E. Abd Elgawad, J.J. Shim, Effective desalination of brackish groundwater using zeolitized diatomite/kaolinite geopolymer as low-cost inorganic membrane; Siwa Oasis in Egypt as a realistic case study, J. Contam. Hydrol. 244 (2022) 10. [CrossRef]
- Gadkar, K.V.L. Subramaniam, Rheology control of alkali-activated fly ash with nano clay for cellular geopolymer application, Construction and Building Materials 283 (2021) 12. [CrossRef]
- zsoy, E. rklemez, S. Ilkentapar, Effect of addition diatomite powder on mechanical strength, elevated temperature resistance and microstructural properties of industrial waste fly ash-based geopolymer, J. Mater. Cycles Waste Manag. 25(4) (2023) 2338-2349.
- Saponjic, M. Stankovic, J. Majstorovic, B. Matovic, S. Ilic, A. Egelja, M. Kokunesoski, Porous ceramic monoliths based on diatomite, Ceram. Int. 41(8) (2015) 9745-9752. [CrossRef]
- D.D. Duan, H.B. Wu, F. Wei, H.P. Song, Z. Chen, F.Q. Cheng, Preparation, characterization, and rheological analysis of eco-friendly geopolymer grouting cementitious materials based on industrial solid wastes, Journal of Building Engineering 78 (2023) 18. [CrossRef]
- González-Taboada, B. González-Fonteboa, J. Eiras-López, G. Rojo-López, Tools for the study of self-compacting recycled concrete fresh behaviour: Workability and rheology, Journal of Cleaner Production 156 (2017) 1-18. [CrossRef]
- Y. Tian, C.H. Yang, S.J. Yuan, H.X. Yuan, K. Yang, L.W. Yu, M.T. Zhang, X.H. Zhu, Understanding the rheological properties of alkali-activated slag pastes from the cohesion and friction interactions, Construction and Building Materials 291 (2021) 12. [CrossRef]
- M.T. López-López, P. Kuzhir, J. Caballero-Hernández, L. Rodríguez-Arco, J.D.G. Duran, Yield stress in magnetorheological suspensions near the limit of maximum-packing fraction, J. Rheol. 56(5) (2012) 1209-1224. [CrossRef]
- X.D. Dai, S. Aydin, M.Y. Yardimci, K. Lesage, G. de Schutter, Influence of water to binder ratio on the rheology and structural Build-up of Alkali-Activated Slag/Fly ash mixtures, Construction and Building Materials 264 (2020) 13. [CrossRef]
- H.B. Tan, F.B. Zou, B.G. Ma, Y.L. Guo, X.G. Li, J.P. Mei, Effect of competitive adsorption between sodium gluconate and polycarboxylate superplasticizer on rheology of cement paste, Construction and Building Materials 144 (2017) 338-346. [CrossRef]
- H.H. Qi, B.G. Ma, H.B. Tan, C.B. Li, Z.Z. Zhi, H. Wang, X.H. Liu, Q. Yang, Effect of sodium gluconate on molecular conformation of polycarboxylate superplasticizer studied by the molecular dynamics simulation, J. Mol. Model. 26(3) (2020) 10. [CrossRef]
- X.S. Lv, Y. Qin, Z.X. Lin, Z.K. Tian, X.M. Cui, One-Part Plastic Formable Inorganic Coating Obtain from Alkali-Activated Slag/Starch(CMS) Hybrid Composites, Molecules 25(4) (2020) 14. [CrossRef]
- Bagci, G.P. Kutyla, W.M. Kriven, Fully reacted high strength geopolymer made with diatomite as a fumed silica alternative, Ceram. Int. 43(17) (2017) 14784-14790. [CrossRef]
- C.H. Jiang, A.Y. Wang, X.F. Bao, T.Y. Ni, J. Ling, A review on geopolymer in potential coating application: Materials, preparation and basic properties, Journal of Building Engineering 32 (2020) 16. [CrossRef]
- P.R. Jackson, D.W. Radford, Effect of initial cure time on toughness of geopolymer matrix composites, Ceram. Int. 43(13) (2017) 9884-9890. [CrossRef]
- S.M. Wang, X. Luo, S.D. Hua, Y.A. Zhang, T.Z. Chen, Graphene's effect and mechanism on the properties of alkali-activated slag coating, Mater. Res. Express 10(6) (2023) 13.
- H.J. Zhu, Z.H. Zhang, F.G. Deng, Y.L. Cao, The effects of phase changes on the bonding property of geopolymer to hydrated cement, Construction and Building Materials 48 (2013) 124-130. [CrossRef]
- Zanotti, P.H.R. Borges, A. Bhutta, N. Banthia, Bond strength between concrete substrate and metakaolin geopolymer repair mortar: Effect of curing regime and PVA fiber reinforcement, Cement & Concrete Composites 80 (2017) 307-316. [CrossRef]
- Sicakova, The Influence of Different Pre-Treatments of Concrete Surface on the Bond Strength of Geopolymer-Type Coating Layer, Sustainability 10(11) (2018) 11. [CrossRef]
- Phiangphimai, G. Joinok, T. Phoo-ngernkham, S. Hanjitsuwan, N. Damrongwiriyanupap, W. Sae-Long, P. Sukontasukkul, P. Chindaprasirt, Shrinkage, compressive and bond strengths of alkali activated/cement powder for alternative coating applications, Construction and Building Materials 400 (2023) 12. [CrossRef]
- P. Li, T. Yang, P.F. Ma, X.J. Fei, F. Li, J.Y. Ye, P.Z. Zhuang, Luminous and bonding performance of self-luminescent cementitious coatings based on white cement and geopolymer, Construction and Building Materials 362 (2023) 15. [CrossRef]
- K. Sahbudak, Mechanical and Thermal Evaluation of Diatomite Doped Fly Ash Based Geopolymers, Mater. Sci.-Medzg. 28(1) (2022) 75-81. [CrossRef]
- J.B. Wang, T.T. Zhou, D.Y. Xu, Z.H. Zhou, P. Du, N. Xie, X. Cheng, Y. Liu, Effect of nano-silica on the efflorescence of waste based alkali-activated inorganic binder, Construction and Building Materials 167 (2018) 381-390. [CrossRef]
- S. Llamas, A.P. Torres, L. Liggieri, E. Santini, F. Ravera, Surface properties of binary TiO2-SiO2 nanoparticle dispersions relevant for foams stabilization, Colloid Surf. A-Physicochem. Eng. Asp. 575 (2019) 299-309. [CrossRef]
- M.E. Simonsen, C. Sonderby, E.G. Sogaard, Synthesis and characterization of silicate polymers, J. Sol-Gel Sci. Technol. 50(3) (2009) 372-382. [CrossRef]
- P. Duxson, G.C. Lukey, J.S.J.V. Deventer, Thermal Evolution of Metakaolin Geopolymers: Part 1 – Physical Evolution, Journal of Non-Crystalline Solids 352(52-54) (2006) 5541-5555. [CrossRef]
- H. Ye, Autogenous formation and smart behaviors of nitrite- and nitrate-intercalated layered double hydroxides (LDHs) in Portland cement-metakaolin-dolomite blends, Cement and Concrete Research 139 (2021) 106267. [CrossRef]
- N.T.H. Dung, T. J. N.Unluer, C., Accelerating the reaction kinetics and improving the performance of Na2CO3-activated GGBS mixes, Cement and Concrete Research 126 (2019).



| Material | SiO2 | Al2O3 | Fe2O3 | CaO | K2O | TiO2 | Na2O | MgO | P2O5 |
|---|---|---|---|---|---|---|---|---|---|
| Slag | 32.889 | 19.275 | 0.320 | 35.669 | 0.330 | 0.907 | 0.649 | 9.944 | 0.017 |
| Fly ash | 53.030 | 34.580 | 5.000 | 2.719 | 1.587 | 1.136 | 0.889 | 0.845 | 0.214 |
| Diatomite | 92.260 | 2.988 | 1.300 | 0.204 | 0.360 | 0.000 | 2.476 | 0.340 | 0.072 |
| Sample(GPC-Dz-0.5) | Precursor(g) | Water glass solution(g) | Diatomite(g) | NaOH(g) | Water(g) |
|---|---|---|---|---|---|
| GPC-D0-0.5 | 200 | 38.8 | 0.0 | 6.02 | 78.2 |
| GPC-D0.5-0.5 | 1.0 | ||||
| GPC-D0.8-0.5 | 1.6 | ||||
| GPC-D1.1-0.5 | 2.2 | ||||
| GPC-D1.4-0.5 | 2.8 | ||||
| GPC-D1.7-0.5 | 3.4 | ||||
| GPC-D2.0-0.5 | 4.0 |
| Sample | Bingham model | Correlation coefficient(R2) | Yield stress(Pa) | Plastic viscosity(Pa·s) | Thixotropy(Pa·s-1) |
|---|---|---|---|---|---|
| GPC-D0-0.5 | 0.999 | 0.528 | 0.649 | 133.10 | |
| GPC-D0.5-0.5 | 0.998 | 0.625 | 0.737 | 142.51 | |
| GPC-D0.8-0.5 | 0.996 | 0.876 | 0.777 | 150.28 | |
| GPC-D1.1-0.5 | 0.999 | 2.748 | 0.921 | 313.85 | |
| GPC-D1.4-0.5 | 0.999 | 0.998 | 0.740 | 298.87 | |
| GPC-D1.7-0.5 | 0.998 | 0.996 | 0.623 | 273.65 | |
| GPC-D2.0-0.5 | 0.999 | 0.423 | 0.617 | 261.33 |
Disclaimer/Publisher’s Note: The statements, opinions and data contained in all publications are solely those of the individual author(s) and contributor(s) and not of MDPI and/or the editor(s). MDPI and/or the editor(s) disclaim responsibility for any injury to people or property resulting from any ideas, methods, instructions or products referred to in the content. |
© 2024 by the authors. Licensee MDPI, Basel, Switzerland. This article is an open access article distributed under the terms and conditions of the Creative Commons Attribution (CC BY) license (http://creativecommons.org/licenses/by/4.0/).


