1. Introduction
Oligodendrocytes represent a specialized brain cell population which play a key neuroprotective role by myelinating neurons/axons and facilitating optimal electrical conductance[
1,
2]. However, abnormal growth of oligodendrocytes is also responsible for aggressive oligodendroglial neuronal/brain tumors, and constitute 5% of all neuroepithelial tumors and an incidence rate of thousand new cases per year in USA [
3,
4,
5,
6]. Gliomas, brain tumors of oligodendroglial or astroglial origin, are extremely difficult to treat due to their low response to DNA alkylating agents as well as the activation of pro-survival pathways. The myelinating oligodendrocytes evolve from oligodendrocyte precursor cells (OPCs) and are morphologically distinct with multiple tentacle or arm like processes [
7,
8,
9,
10]. These oligodendrocyte processes wrap around neurons/axonal segments to maintain cell-cell contact and regulated by both intracellular tubulin (microtubules) and actin filaments [
1,
2]. Functionally, they regulate oligodendrocyte function of cell migration as well as active cell debris clearing processes [
1,
2]. Targeting microtubule with microtubule interfering agents has long been a therapeutic target against oligodendroglial cancer [
11,
12]. However, resistance to these agents has also be well documented and the underlying mechanisms remain unclear [
13,
14]. Since OPCs are involved in both good (neuroprotective) and bad (cancer/tumor) pathophysiologies [
1,
2,
10], a better understanding the mechanisms driving their activity is required. Moreover, role of endogenous molecules that modulate oligodendrocyte activity may be of clinical importance.
2-methoxyestradiol (2ME), an anticancer drug in phase II clinical trials, has been documented to have antiproliferative and antiangiogenic effects both in vitro and in vivo [
15,
16]. Although it is generally accepted that 2ME interacts with tubulin, resulting in faulty spindle formation and cell cycle arrest, there is no evidence for a universal mechanism of action and the mediators of apoptotic signalling by 2ME might even be cell-type dependent. In this regard, 2ME protects against multiple proliferative disorders such as atherosclerosis, injury induced neointimal thickening, glomerulosclerosis, pulmonary hypertension, endometriosis, and multiple cancers by targeting mechanisms driving cell growth and death [
15,
16]. For example, 2ME induced apoptosis in ovarian carcinoma cells via p38 and phospho-Bcl2 pathway [
17]. In prostate cancer cells, cyclin B1 and cdc2 phosphorylation and its upstream regulatory molecular networks may be associated with 2ME-induced apoptosis and inhibition of ERK, JNK and p38 abrogated apoptosis in these cells [
18]. In breast cancer cells, 2ME-induced apoptosis was associated with JNK activation and increased phosphorylation of the antiapoptotic proteins Bcl-2 and Bcl-xL [
19]. In sarcoma cells, the pro-apoptotic protein BAX as well as formation of ROS were involved in the initial apoptotic event and furthermore 2ME treatment caused upregulation of death receptor ligands FasL and TNF- and induced caspase-8 activation [
20].
Taken together, the pleiotropic antitumor activities of 2ME, together with the fact that OPCs contribute to glioblastoma growth, suggests that 2ME might be a promising agent for the treatment of glioma and warrants in-depth investigation of 2ME actions and underlying mechanisms in modulating OPC growth. The fact that 2ME was found to have moderate side effects in clinical phase I/II studies [
21] and is effective in an orthotropic rat glioma model highlights its potential in treating gliomas [
22]. It is therefore of therapeutic importance for future drug development to understand the mechanism behind 2-ME actions, also in oligodendrocyte cells of the brain.
Hence, the aim of our study was to assess the effects of 2-methoxyestradiol on an oligodendroglial cell line (Oli-neu cells), and to dissect the underlying mechanisms. Oli-neu cells were established from O2A progenitor cells [
23]. We chose this cell line as the model system since OPCs are implicated in glioblastoma growth and retain most of OPC phenotypical and electrophysiological characteristics even after several passages. Since 2ME is an investigational cytostatic drug for future, the overall goal of our study was to investigate its impact on oligodendrocyte/OPC health, particularly at pharmacological concentrations of 2ME. To attain our goals we assessed whether: 2ME inhibits OPC growth; 2ME influences OPC morphology; 2ME induces apoptosis in OPCs; 2ME triggers endoreduplication in OPCs; and molecular mechanisms driving the growth inhibitory, apoptotic and endoreduplication actions of 2-ME. Our results show that in OPCs, 2ME induced abnormalities in the cell cycle (endoreduplication) and mitosis eventually lead to cell death. Additionally, we show that 2ME induced endoreduplication in OPCs involves p53.
2. Materials and Methods
2.1. Cell Culture
Oli-neu Cells (OPCs): Culture dishes and flasks used to culture OPCs were coated with poly-D-lysine solution (5 mg/ml H2O). After coating the surface for 30 min with poly-D-lysine solution, the solution was removed, the coated surface rinsed with sterile water prior to addition of culture medium to the flasks or plates. Freshly defrosted OPCs were plated in 6 cm culture dish and grown to confluence. Subsequently the cells were dislodged by trypsinization and transferred to a T 75 flask. OPCs were plated at a density of 1 or 1.3 million cells in 10 cm plates or in T75 flasks, respectively. OPCs were grown in SATO medium (DMEM containing 1% FCS, 25 g/mL gentamicin, 10 g/mL transferrin, 0.5 M L-thyroxine, 222 nM Na-selenite, 10 g/mL insulin, 16.1/mL putrescine, 62 ng/mL progesterone, 2 mM L-glutamine, 1 mM pyruvate, and 340 ng/mL tri-iodo-thyrodine) or in DMEM/F12 medium supplemented with B27 (DMEM/F12 containing 1% Penicillin/Streptomycin, 2% B27 supplement [with vitamin A], and 1% glutamine).
2.2. Protein Concentration Assay
Protein concentrations were determined by colorimetric assay using bichinonic acid (BCA) protein assay kit (Pierce) according to the manufacturer’s protocol. The absorbance was measured with a SpectraFluor Plus (Tecan) and analyzed with the Magellan 6 or 7 software.
2.3. Western Blotting
Western blot analysis was performed with whole-cell lysates. Cells were grown on 6 cm dishes, washed twice with HBSS with Ca2+ and Mg2+, and lysed by the addition of 100 µL lysis buffer (Cell Signaling Technology) containing 20 mM Tris (pH 7.5), 150 mM NaCl, 1 mM ethylenediaminetetraacetic acid (EDTA), 1 mM ethylene glycol tetraacetic acid (EGTA), 1% triton X-100, 2.5 mM sodium pyrophosphate, 1 mM -glycerophosphate, 1 mM sodium vanadate (Na3VO4), 1 g/mL leupeptin, 0.287mM phenylmethanesulfonyl fluoride (PMFS), and 0.2% sodium dodecyl sulphate (SDS). The cell-lysate were scraped from the dishes and homogenized by sonication (thrice for 3 seconds each). The protein concentration was determined spectrophotometrically using bichinonic acid protein assay kit from Pierce and SpectraFluor Plus (Tecan).
Equal amounts of proteins (20-25 g per lane) were diluted with 5X loading buffer (0.313 mM Tris/HCl pH 6.8, 10% SDS, 0.05% bromphenol blue, 50% glycerol; Fermatas, Hanover, MD, USA (R0891) and 0.1 M dithiotheritol (DTT) was added. Thereafter samples were denatured at 95° C for 5 min. After separation in 10% SDS-polyacrylamide gel, the proteins were transferred to a nitrocellulose membrane. Successful transfers were visualized by Ponceau S staining. For this the Ponceau S solution (Sigma) was added to the membrane. After two seconds, the Ponceau S solution was transferred back to the vial and the membrane was washed in PBS (phosphate buffered saline) until the red staining disappeared. When necessary, the membranes were cut at the appropriate molecular weight before the Ponceau staining was washed out. Membranes were blocked in 5% nonfat dry milk in PBS/0.2% Tween 20 either over night at 4° C or at RT for 1 hour. After blocking, the membrane was incubated with the primary antibody (1-4 hours at RT or overnight at 4° C). Primary and secondary antibodies were dissolved in 1% nonfat dry milk in PBS containing 0.2% Tween 20. To remove unbound primary antibodies, the membrane was washed three times for 10 min each, with 1% milk in PBS/0.2% Tween 20. Incubation with peroxidase-conjugated secondary antibodies was again performed either for 1-4 hours at RT or over night at 4 _C. The membrane was washed one time with 1% nonfat dry milk in PBS/0.2% Tween 20 and two times with PBS/0.2% Tween 20. Peroxidase activity was detected using ECL (Pierce) and the membranes were exposed to X-OMAT LS films. When the membranes were analyzed with the LI-COR system, all steps were performed as described above, except that the membranes were blocked in 5% nonfat dry milk in PBS without Tween and incubated with the secondary antibody (IRDye 680/800 conjugated goat-rabbit IgG) for 45 min, and thereafter washed with PBS without Tween 20. For successive detection of different proteins on the same membrane, the membrane was washed with PBS/0.2% Tween 20 after analysis of the first protein, incubated for 20 min with stripping buffer 1 (0.1 M glycine in PBS, pH 2-3) and subsequently shortly washed in stripping buffer 2 (1M NaCl in PBS). Subsequently the membranes were washed three times with PBS/0.2% Tween-20.
2.4. Growth Studies
Studies were conducted using phenol-red free medium. When not specified, cells were growth arrested for 24 hours in medium containing 0.1% steroid-free FCS. Pretreatment of cells was done by adding the compound of interest during starvation. Cell growth was induced by addition of 2.5% steroid-free FCS in the presence or absence of 0-10µM of 2ME. In all cell-growth experiments, cell growth was analyzed by 3H-thymidine incorporation and by counting cell number. For 3Hthymidine incorporation experiments, cells were treated with 2.5% steroid-free FCS plus treatments for 20 hours and subsequently fresh treatment medium was added with 1.0 µM Ci/well 3H-thymidine for 4 hours. Aliqouts from 4 different wells per treatment were mixed with 10 mL scintillation fluid and counted in a liquid scintillation counter. For cell number experiments, sub-confluent cells were growth arrested for 24 hours and subsequently treated for 24 hours as mentioned above. After 24 hours the cells were dislodged by trypsinization and counted in a coulter cell-counter.
2.5. FACS Analysis
For cell cycle distribution analysis, 0.4 million cells were plated in growth medium into 10 cm dishes. After attachment overnight, the cells were washed once with PBS and the medium was replaced medium containing different 2ME concentrations (0-10 µM). After incubation at 37° C and 5% CO2 for two days cells were washed twice with HBSS without Ca2+ and Mg2+ and harvested by trypsinization. After addition of an equal amount of medium, cells were centrifuged for 10 min at 1250 rpm and 4° C. The pellet was re-suspended in 1 mL sample buffer (1 g/L glucose in PBS). Cells were counted and sample buffer was added until the cell number reached a concentration of 1 million cells per mL. The cell suspension (1ml) was centrifuged in a FACS tube for 10 min at 1350 rpm and 4° C. After removal of the supernatant, cells were fixed by drop-wise addition of ice-cold 70% ethanol and stored at 4° C until analysis. For DNA staining with propidium iodide (PI), the fixed cells were centrifuged for 7 min at 2600 rpm and 4° C. Subsequently, the pellet was resuspended in 0.5-1 mL PI-staining solution (50 µg/mL propidium iodide, 100 U/mL RNase A, sample buffer) and the tubes were shaken for 0.5-1 hour at RT in the dark. The DNA amount was analyzed by flow cytometry.
2.6. Metabolic Activity Using MTT Assay
Cells were grown over night in a 96 well plate (10’000 cells per well). After the treatment with the test compound the medium was replaced by fresh media containing 0,5 mg/mL MTT and the test compound. After incubation for 3-4 hours, the medium was aspirated and the cells were lysed by the addition of 200µL DMSO. The absorbance was analyzed by the Spectrofluormeter Plus reader (Tecan Group Ltd.) at 540 nm.
2.7. Apoptosis Studies
To assess the apoptotic impact of 2ME in OPCs, cells plated in culture dishes were grown to sub-confluence and subsequently treated with or without 0 to 10µM of 2ME. The OPC lysates were analyzed by western blotting for caspase mediated mechanism by assessing caspase-3 and caspase-7 fragmentation. Moreover, involvement of PARP was assessed by measuring PARP fragmentation. Staining with Apopercentage dye, a specific marker for apoptosis which stains externalized phosphatidylserines was used to assess whether 2ME has apoptotic or necrotic actions on OPCs.
2.8. Microscopy (Bright Field, Fluorescence and Live)
For the analysis of DAPI stained OPCs, the cells were grown on coverslips coated with poly-D-lysine. After the treatment with 2ME for the indicated times, cells were fixed by slowly adding fresh ethanol plus acetic acid mixture to the cell (7,5 mL EtOH 100 puriss, 2.5 mL acetic acid) and waiting until it evaporates. Thereafter, 10 µL of DAPI counterstain was added on top of the cells, and the fluorescence was analyzed using the Olympus Microscope BX61.
For live microscopy, cells treated with or without 2ME and observed and/or live images recorded for subsequent analysis using Olympus IX81 microscope. Time-lapse phase contrast imaging of the effects of 2ME on OPN cell activation and fusion. Live videos were recorded following 48 hour treatment of cultured OPCs with 2ME (5 or 10µM) and using Olympus IX81 microscope. To analyze the effects of 2ME on OPCs, cells were plated on pre-coated 6 well plates at a density of 200,000 cells /well and allowed to attach and grow for 24 hours. Subsequently, the cells were treated with 2ME for 24 or 48 hours, in presence of complete OPN growth medium and the effects observed by employing phase contrast microscopy.
2.9. Statistical Analysis
Data was analyzed using ANOVA and statistical significance (p<0.05) was calculated using Fisher’s Least Significant Difference test.
4. Discussion
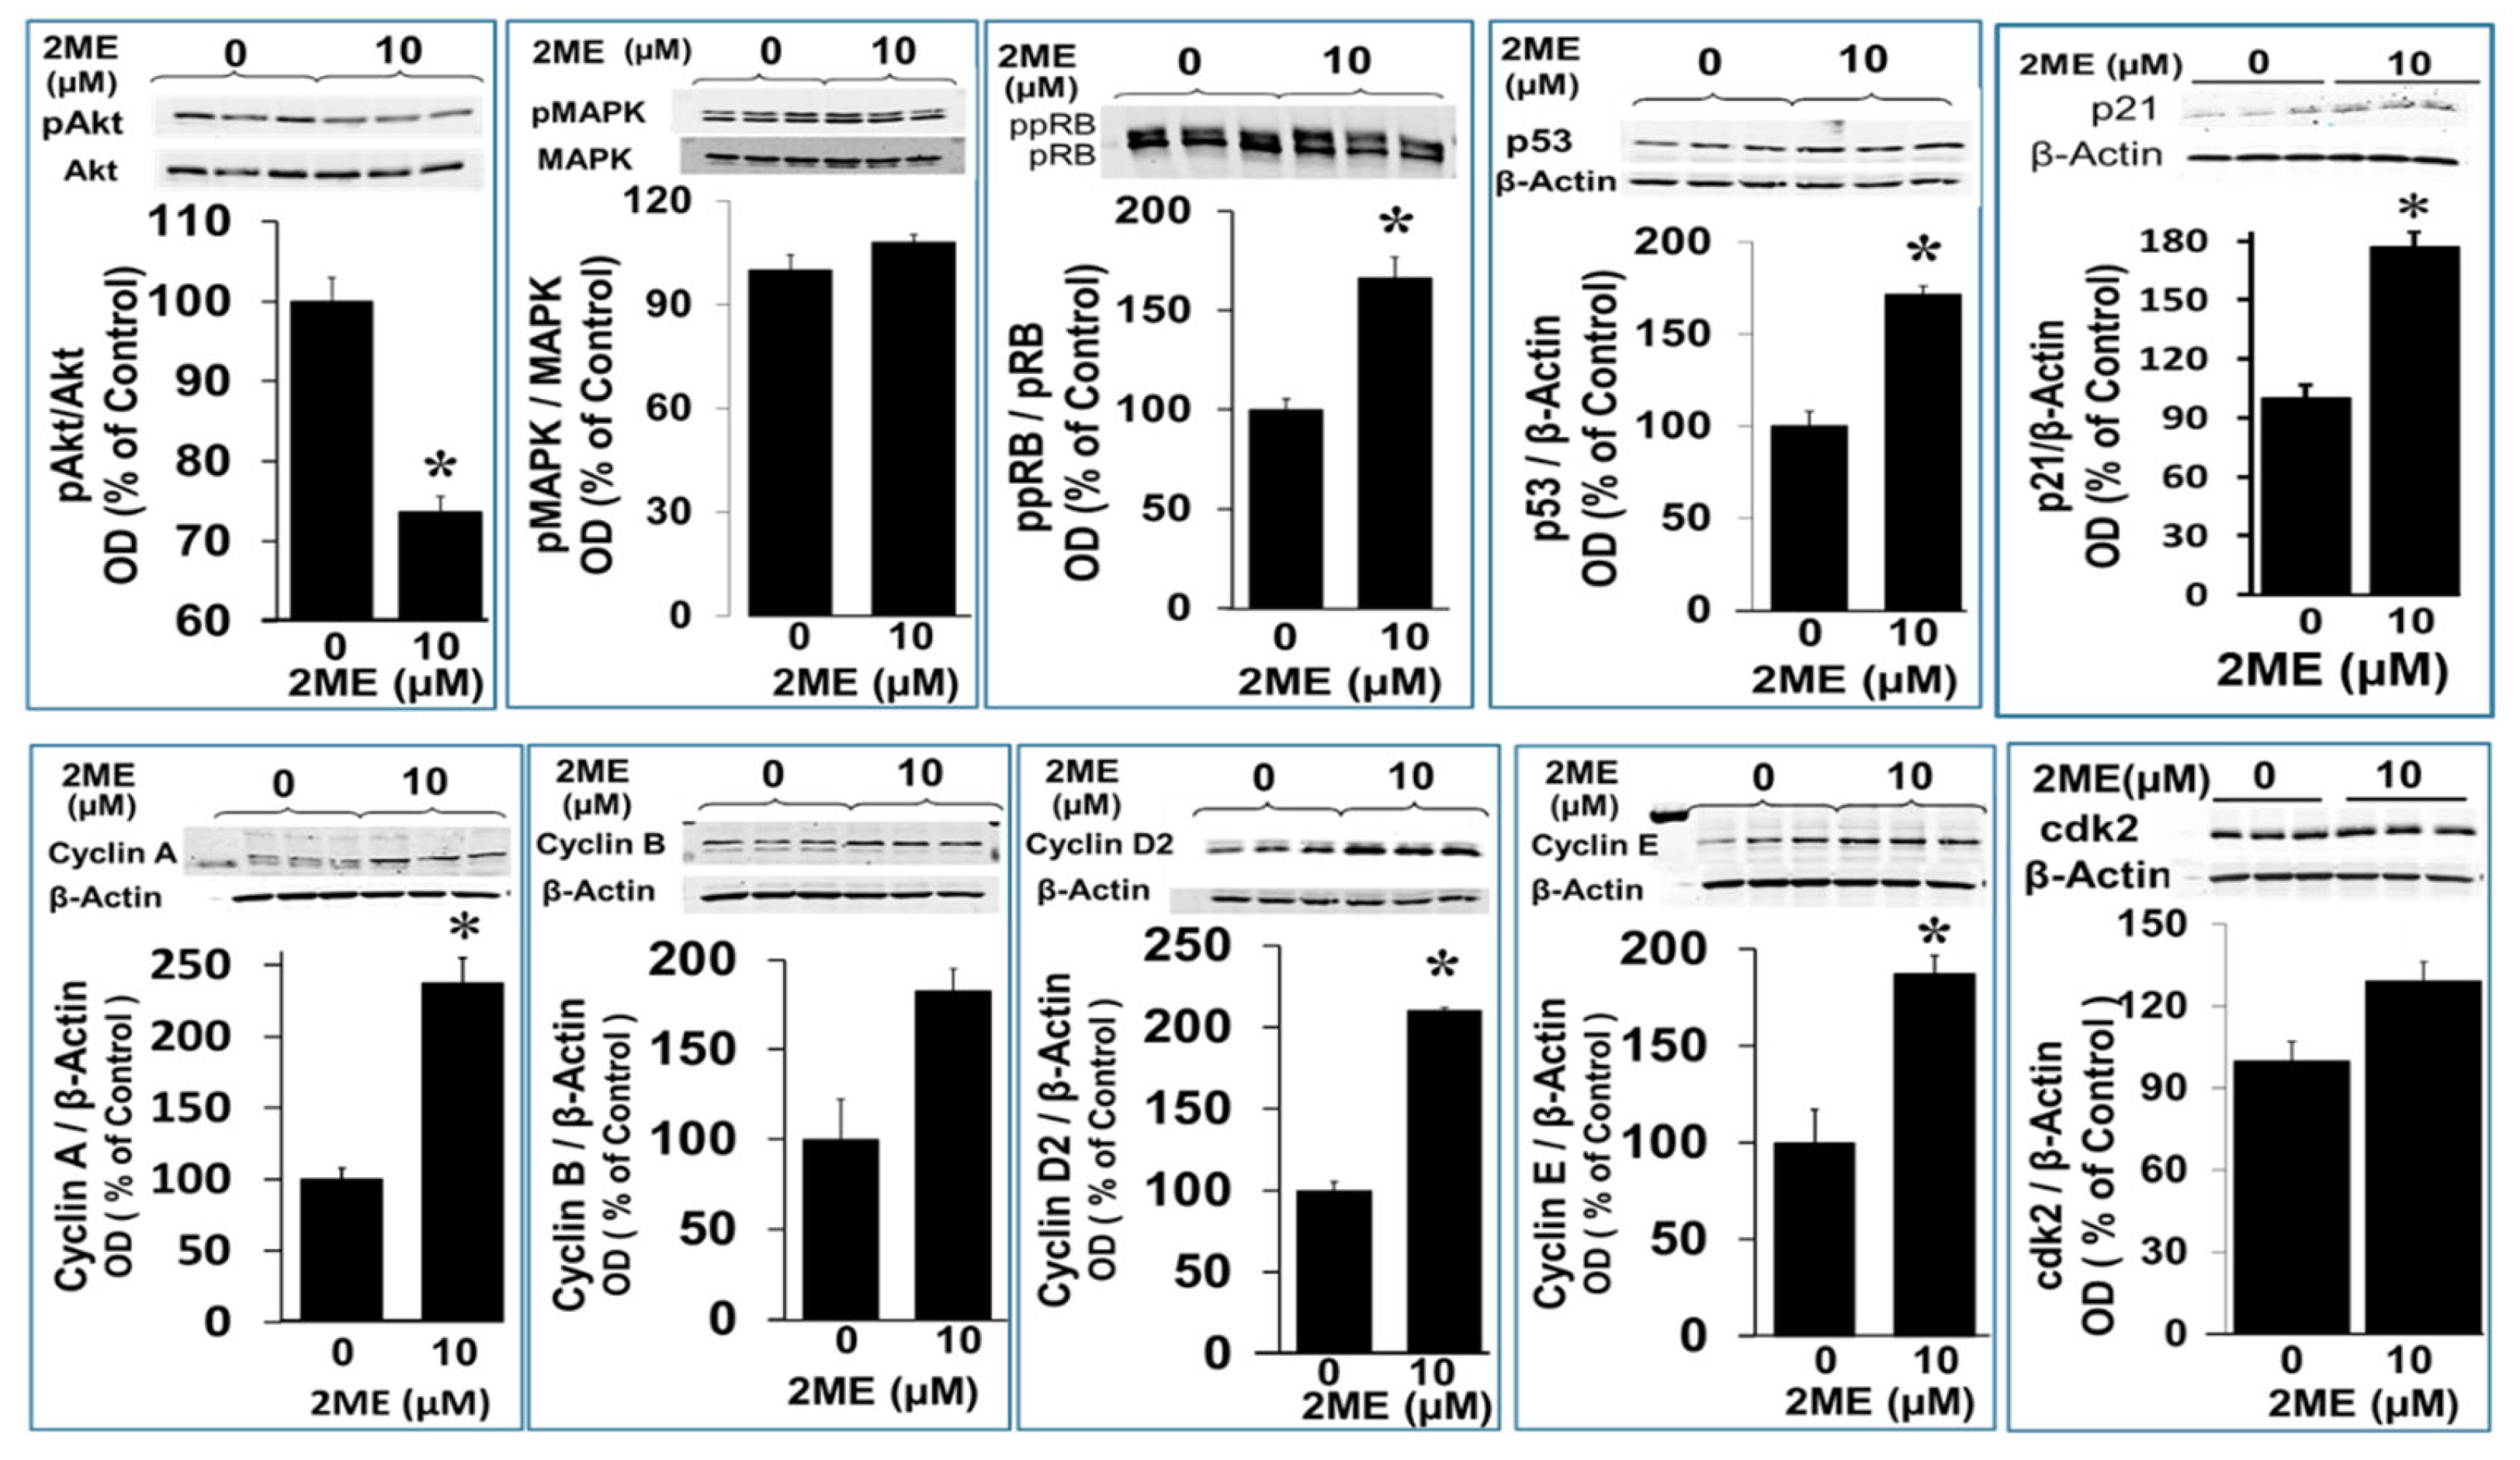
2-Methoxyestradiol and endogenous estradiol metabolite is effective against multiple proliferative disorders including various cancer cells. In the present study we demonstrate that 2ME-treatment induced OPCs to be metabolically more active than control cells and caused an accumulation of cells with a DNA content >4N, indicating that cells underwent endoreduplication. Our in vitro findings show that 2ME inhibits OPC growth, in part, by inducing apoptosis and up-regulation of pro-apoptotic markers (caspase 3, caspase 7 and PPAR fragmentation; and phosphatidylserine externalization). Importantly, 2ME altered OPC morphology by reducing their characteristic arm processes, moreover at concentrations of >1µM 2ME induced endoreduplication in OPCs. The growth inhibitory actions of 2ME were accompanied with upregulation of p21 and p27 (negative regulators of cell cycle) whereas, endoreduplication was accompanied with significant upregulation of many cell-cycle proteins (cyclin A, cyclin B, cyclin D2, cyclin E) as well as p53 a tumor suppressor known to cooperate with cyclin E and drive endoreduplication. At signal transduction level, 2ME failed to influence MAPK phosphorylation; inhibited Akt phosphorylation; and induced pRb as well as JNK1/JNK2 phosphorylation. Interestingly, 2ME upregulated the expression of survivin and triggered OPC cell fusion. Importantly, we demonstrate that inhibition of p53 with pifithrin-α prevented 2ME induced endoreduplication, but not morphological alterations (retraction of cell processes), suggesting that 2ME mediates endoredulication via p53, whereas its morphological actions involve other mechanism. Our findings provide the first evidence that 2ME not only inhibits OPC growth but also triggers apoptotic and cell survival processes leading to endoreduplication. We hypothesize that combining p53 inhibitors with MTIs may help prevent MTI induced endoreduplicationin of cancer cells and be of clinical relevance.
Endoreduplication has been observed in pathological evaluation of various cancers including myomas. More it is prevalent in cells treated with MTIs, such as colchicine and nocodazole [
24,
25]. Our finding that 2ME, a tubulin interfering agent, induced endoreduplication in OPCs is consistent with these observations. This supports the concept that MTIs can switch on a new replication cycle without anaphase chromosome segregation. Additionally, our data shows that several cell cycle proteins are regulated by 2ME treatment and that inhibition of p53 abrogated endoreduplication, indicating that microtubule inhibition leads to endoreduplication by a p53-dependent mechanism.
Although polyploidy in mammals is evident in different mammalian cells under normal conditions (e.g. in trophoblast or myocardial cells) studies indicate that aneuploidy, genomic instability, and defects in cell cycle checkpoints can contribute to tumorigenesis [
24]. In this regard, it has been shown that aneuploidy is a characteristic of the great majority of human tumors [
26]. Furthermore, it is linked to the progressive development of high-grade, invasive tumors [
27,
28] and it is a necessary intermediate in the formation of many solid human tumors [
29]. Additionally, a high degree of aneuploidy correlates with poor patient prognosis [
30,
31]. Although polyploidy is observed in tumors and is linked to its progression, a cause and effect relationship remains unclear. Many MTIs known to induce polyploidy also inhibit tumor progression and cancer cell growth, hence it is crucial to understand the mechanisms contributing to endoreduplication, and whether this leads to aneuploidy and tumorigenesis.
In the present study we show that at high concentrations 2ME induces deleterious effects in OPCs. Considerable effort has been made to investigate whether 2ME could be used therapeutically to treat brain cancers, called gliomas, that originate from glial cells such as astrocytes and oligodendrocytes [
32,
33] by targeting their growth. Since gliomas as they are extremely difficult to treat and often fatal, new therapeutic molecules targeting their growth are required. Chemotherapy often fails in patients with gliomas due to their resistance to the commonly used DNA alkylating agents and due to the activation of pro-survival pathways. The reasons why 2ME is a promising agent for the treatment of gliomas are the following: 1) 2ME is a MTI [
34], and chemotherapy regimes that use MTIs such as vincristine are already used to treat gliomas [
35]. 2) 2ME has pleiotropic antitumor activities, that include both, inhibition of angiogenesis and cytotoxic effects on tumor cells. 3) Its mechanism does not rely on DNA alkylation. 4) It has been shown to be effective in an orthotopic rat glioma model. 5) It has moderate side effects in clinical phase I/II studies.
Although 2ME has been shown to inhibit growth of tumors and cancer cells, our findings that 2ME induces polyploidy in OPCs. These findings, together with the fact that endoreduplication is linked to tumorigenesis, suggests that a better understanding of the cause and effect relationship between tumor/cancer growth and polyploidy/endoreduplication is required. Moreover, it is important to explore ways to reduce the risks of polyploidy development in response to drugs that interfere with microtubule dynamics. At a molecular level endoreduplication results from an erroneous exit from mitosis due to a failure of the checkpoints, which normally regulate cell cycle arrest at specific stages when previous events have not been completed. Although most cells sense the disturbance of the microtubule assembly after MTI treatment, some cells arrest only transient and thereafter exit mitosis without chromosome segregation and become tetraploid.
Consistent with our observation, 2ME has been shown to induce endoreduplication in both non-cancerous [
36], and cancer cells [
19,
37,
38]. The mechanism underlying 2ME-induced endoreduplication remains unclear, although its interaction with tubulin and inhibition of polymerization seems to be involved. Indeed, 2ME is known to be a MTI molecule [
34] and endoreduplication has been observed in response to MTIs in cells lacking p53, pRb and CdkIs p21 or p16 [
39,
40,
41,
42,
43]. Moreover, in vacular smooth muscle cells, 2ME induced endoreduplication by a Cdk2-dependent pathway [
37].
Our results showed that p53 expression was regulated by 2ME. However, most studies so far indicate that p53 plays a major role in preventing endoreduplication by being a component of a spindle checkpoint that ensures the maintenance of diploidy. Data from several studies support the role of p53 in this mechanism: 1) p53 was shown to participate in a mitotic checkpoint that inhibits the formation of polyploid cells, since fibroblasts in cultures of p53-deficient mouse embryos exposed to spindle inhibitors formed tetraploid and octaploid cells [
43]; 2) p53- and pRb-deficient fibroblasts re-replicate after treatment with the nocodazole, a strong MTI, whereas normal cells arrest in G1 [
39,
44]; 3) Abrogation of p53 in cooperation with Bcl-xL allowed rapid and progressive polyploidization following mitotic spindle damage [
41].
In contrast to the above findings on p53, we observed that 2ME induced endoreduplication was accompanied with p53 upregulation and this was blocked by the p53 inhibitor pifithrin-α. The reasons for abrogation of endoreduplication by p53-inhibitor in OPCs remains unclear. We hypothesize that p21 action may be responsible for this effect as p53-dependent inhibition of endoreduplication has been shown to induce p21 [
40,
42]. Moreover, upregulation of p21 is known to negatively regulate cell cycle progression at G1 and inhibit Oli-neu progression [
45]. In oligodendrocytes, however, p21 has a controversial role as p21 levels increase during S-phase entry [
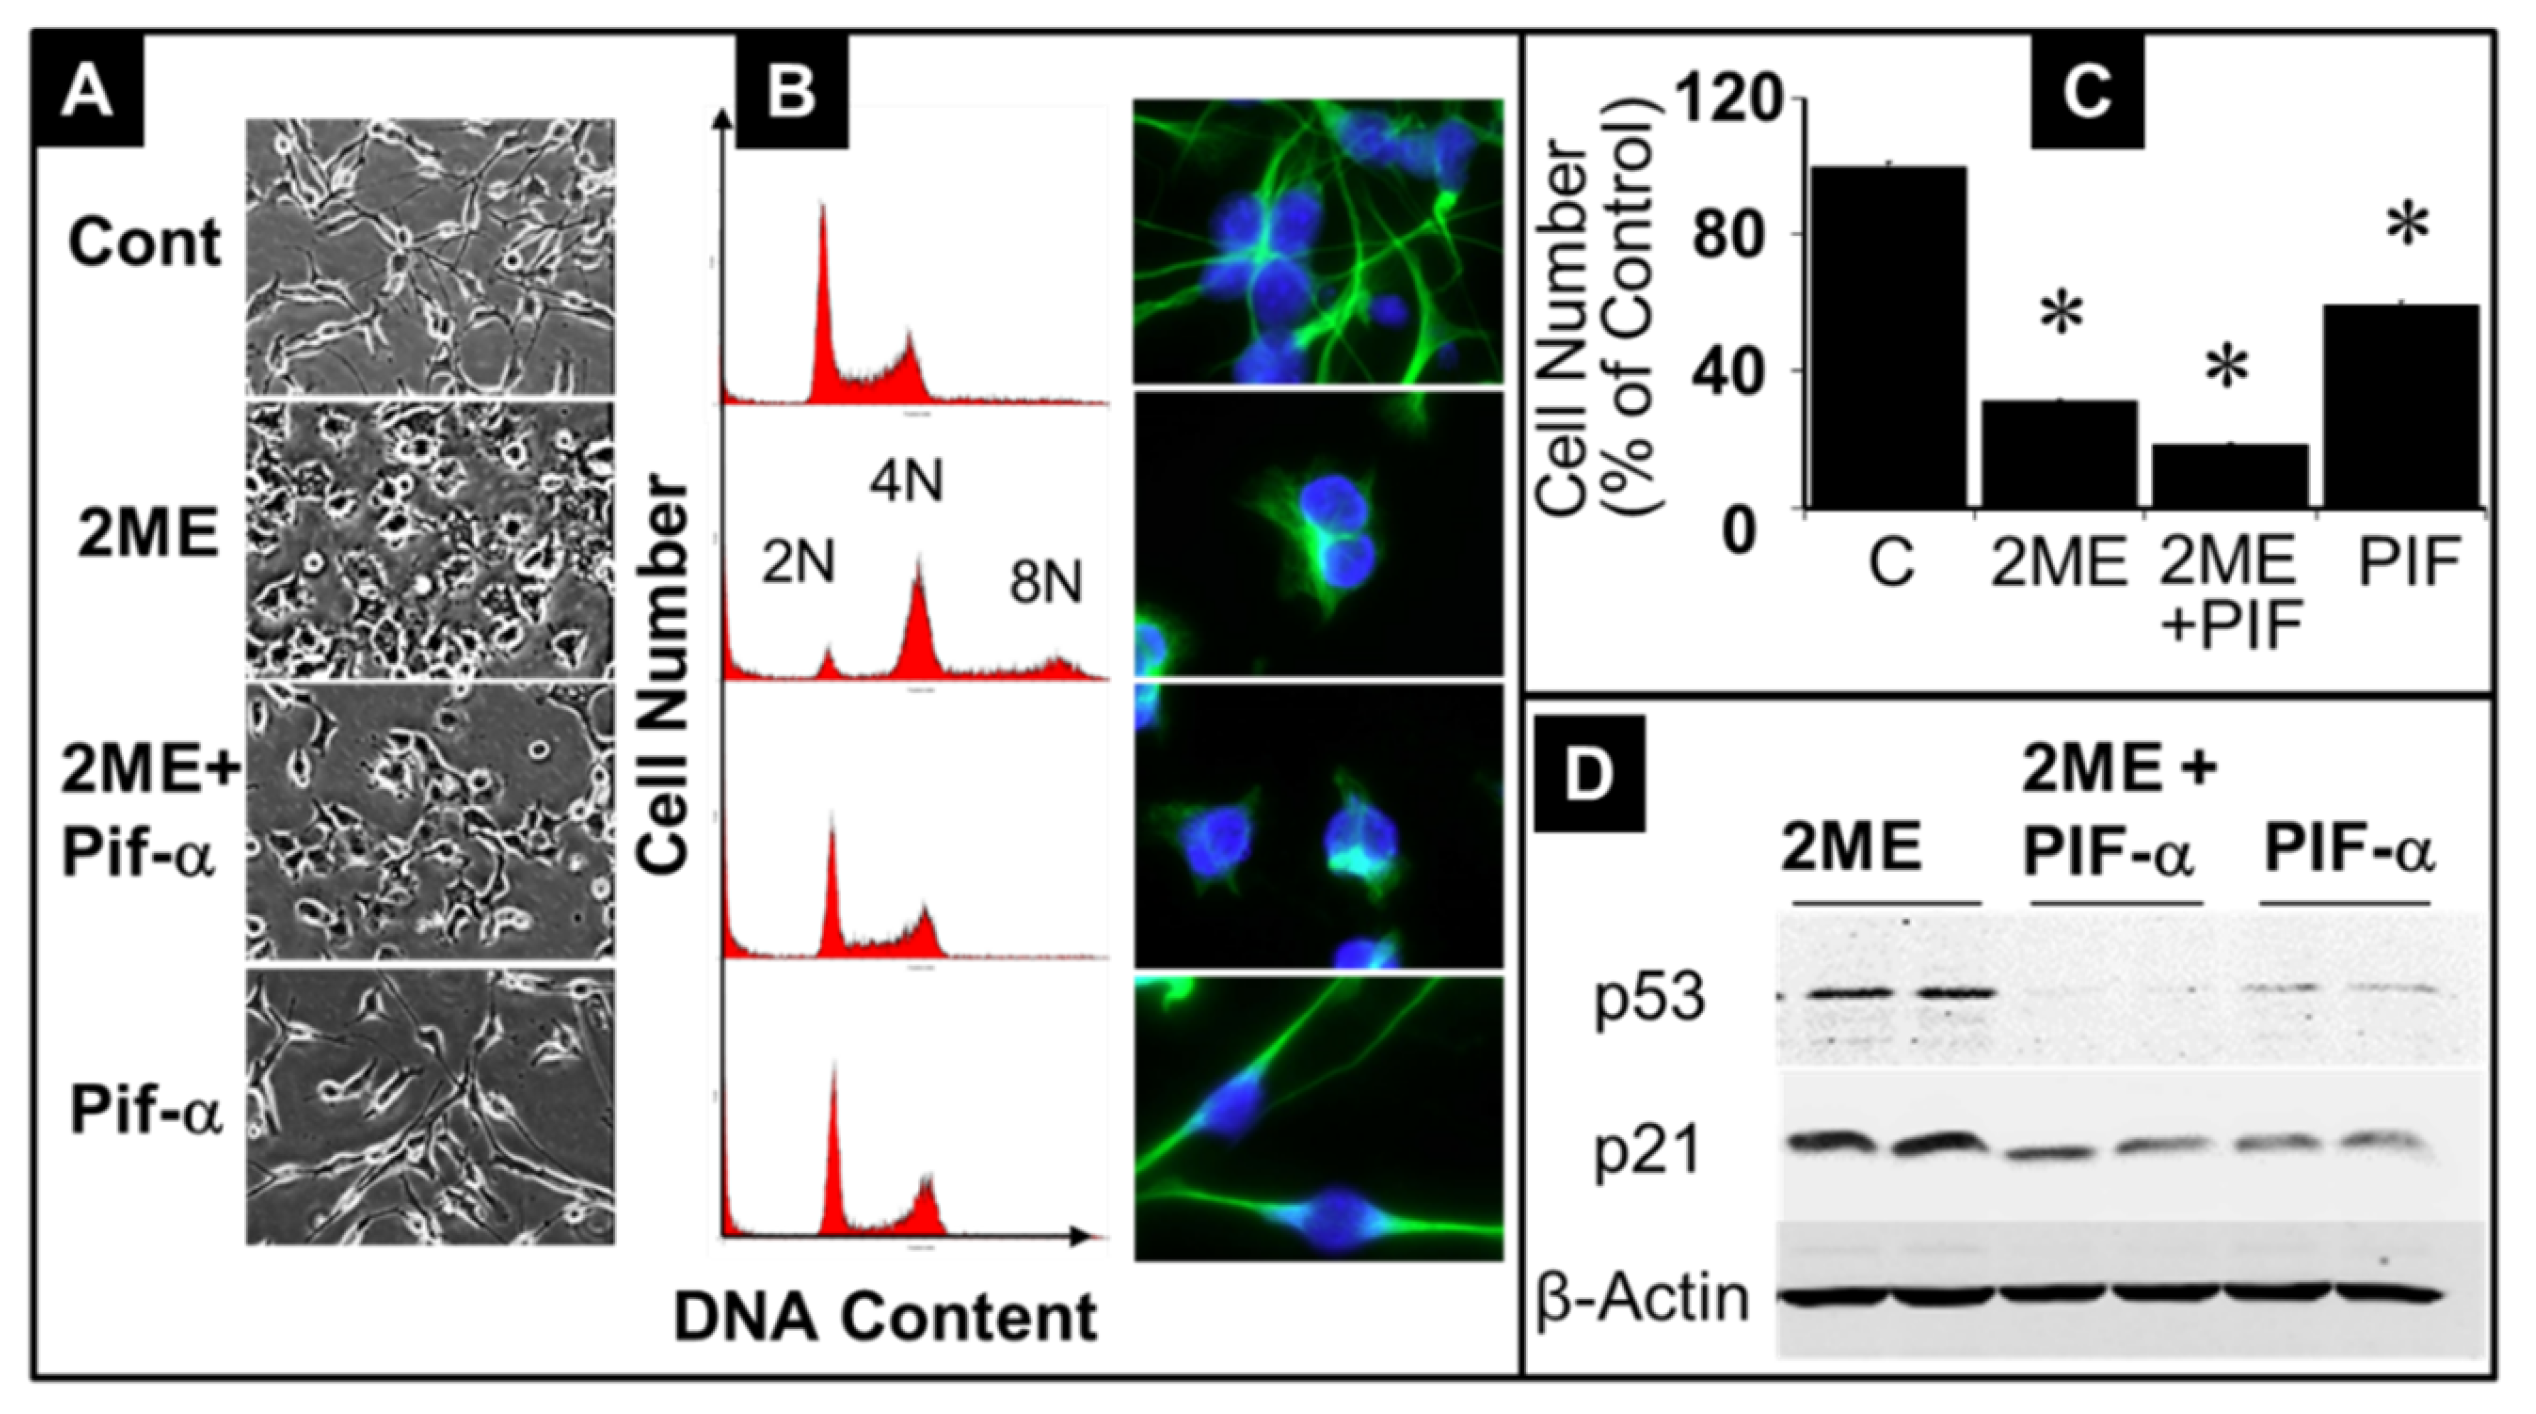
46].We speculate that the increase in p53 in response to 2ME leads to the expression of p21. Hence, instead of inhibiting the cell cycle as in other mammalian cell types, this induces cells into S-phase entry, resulting in endoreduplication. This contention is supported by the fact that inhibition of p53 by Pifithrin-α inhibited cell cycle progression, moreover treatment with Pifithrin-α alone decreased the percentage of cells in the S-phase compared to control.
Consistent with our findings that p53 may be driving 2ME mediated endoreduplication in OPCs, it has been recently reported that cyclin E driven replicative stress promotes p-53 dependent mitotic bypass and whole-genome duplication (WGD) in p53 proficient cells [
47]. This implies that tumor suppressor p53 can directly contribute to cancer evolution. Indeed, many genomics studies have shown that approximately half of the WGD events in cancer happen with wild-type p53 background. Moreover, p53 has been shown to promote mitotic bypass after genotoxic or oncogene stress. However, how WGD happens in p53 proficient cells is still unclear. Zeng and colleagues [
47] proposed that elevated cyclin E1 in concert with p53 and its downstream target p21, inhibits mitotic Cdk activity to promote mitotic bypass and complete endoreduplication. Consistent with this contention we observed significant increase in both p53 and p21 and a minor change in cdk2.
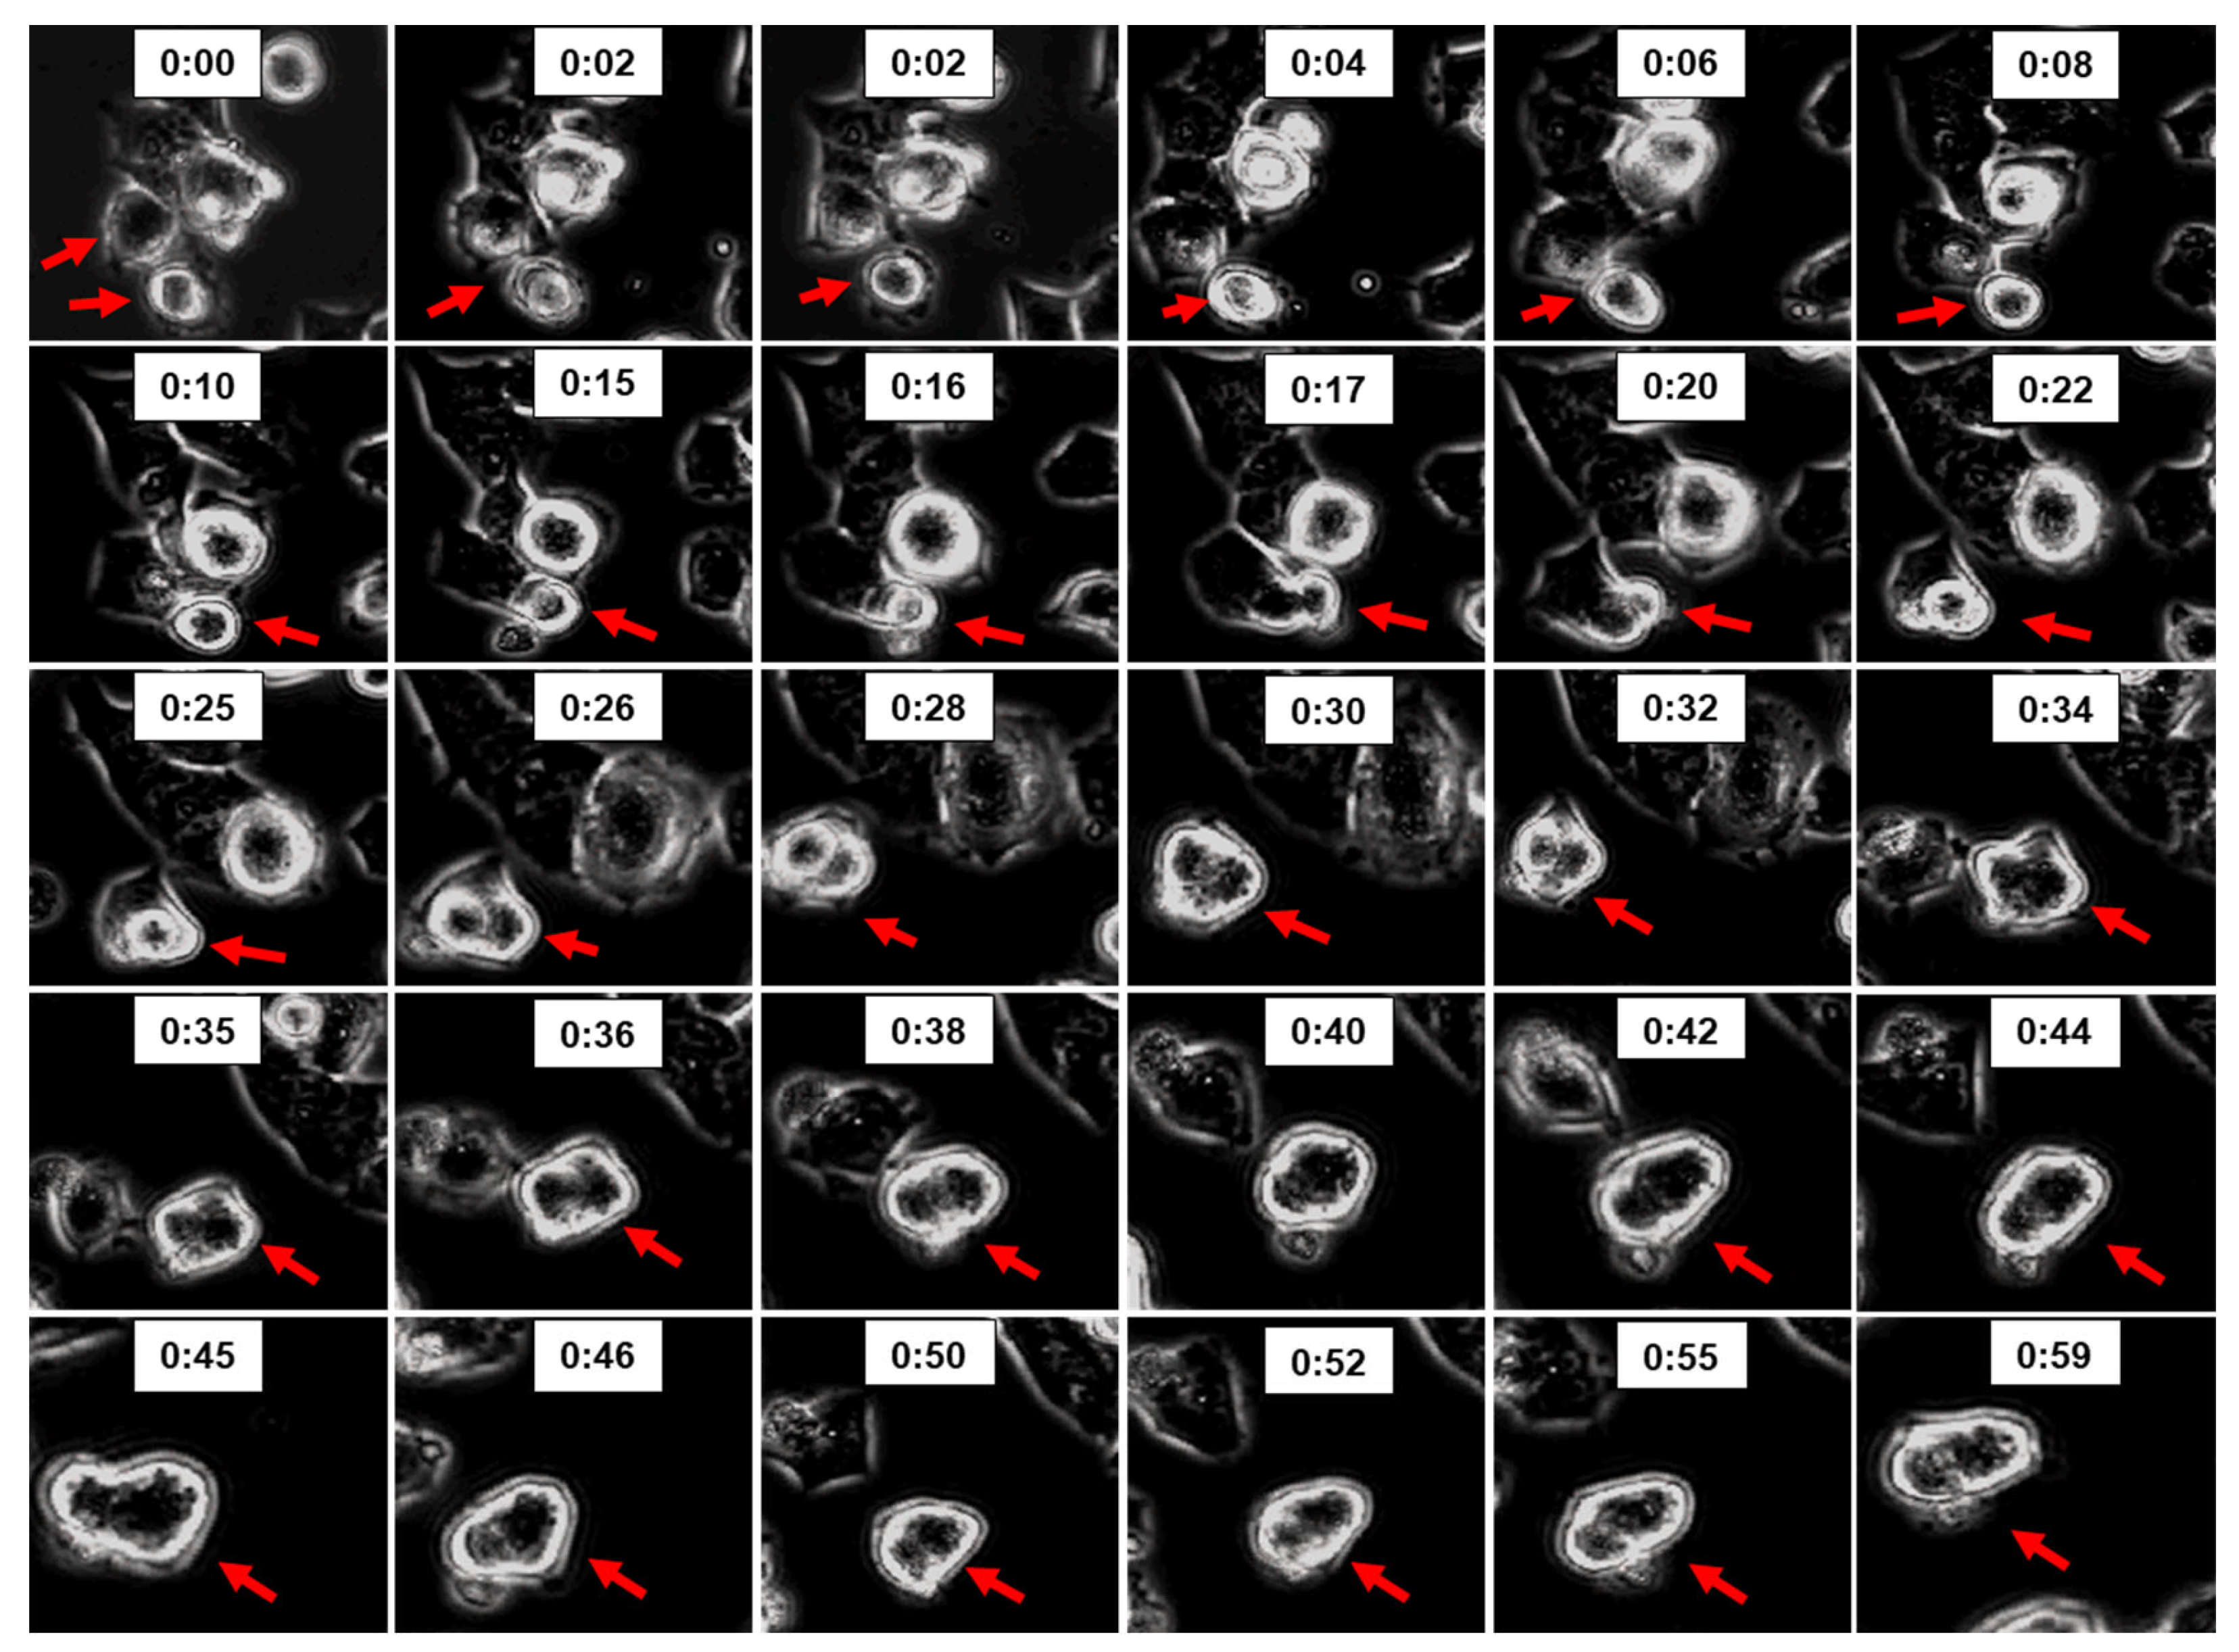
Another potential mechanism leading to WGD is cell fusion. Interestingly, we observed increased metabolic and cell fusion activity in OPCs that were treated with 2ME. It is feasible that treatment with 2ME creates a survival crisis in OPCs and the vulnerable cells find partners to escape resist and escape cell death. This may also contribute to MTI drug resistance observed in cancer cells. Interestingly, in OPCs, 2ME induced expression of survivin, which is a member of chromosomal passenger complex implicated in cytokinesis and modulate microtubule dynamics as well as nucleation [
48]. Survivin plays an important role in the surveillance mechanism called mitotic spindle assembly checkpoint (MSAC) which regulates metaphase to anaphase transition during mitosis potentially by interacting with p53 [
49,
50]. Interestingly p53 is also linked to mitochondrial metabolic activity in cancer cells and regulates the balance between cell survival and death [
51]. Finally, it is also possible that there are different population of OPCs that express and react differently as has been documented for mcroglial cells [
52].
Our findings could have clinical relevance in deciding whether a glioma should be treated with a MTI or not. Moreover, it might be crucial to determine whether a glioma originates from oligodendrocytes or from another cell type in the brain, such as astrocytes. If the glioma was of oligodendroglial origin, chemotherapy with high concentrations of MTIs could lead to genomic instability and polyploidy. Our results suggest that polyploidy might be inhibited by Pifithrin-α, however, it is obvious that inhibition of a major tumor suppressor protein in vivo might not be the solution to treat cancer cells.
Apart from tumor suppressor proteins, cyclins critically regulate cell cycle progression. One of the cyclins, cyclin B, is a direct target of the anaphase promoting complex (APC). The APC plays an important role in the transition of cells from metaphase to anaphase [
53]. The APC acts as a ubiquitin ligase and is required to label cyclin B for subsequent proteolysis, which in turn initiates the transition to the anaphase. It has been shown that 2ME enhances the amount of cyclin B in a tubulin-dependent manner, since the cyclin B enhancement was absent in a tubulin-mutant clone [14 (55)]. The authors suggest that 2ME could induce mitotic arrest by inhibiting APC action. In our experiments, cyclin B was upregulated in response to 2ME. Although, this should lead to a cell cycle arrest, in 2ME treated cells we did not observe a G1 arrest. However, the possibility that 2ME treated cells were arrested in a pseudo G1 phase with a 8N DNA content cannot be excluded as cell arrest in this phase could be accompanied with an increase in cyclin B expression.
Based on the above findings, 2ME treatment could result in cell cycle arrest even in the presence of induction of both cyclin B and p53 expression. Importantly upregulation of p53 and p21 may occur in non-arrested endoreduplicating cells, as observed here. Our data also showed that 2ME treated cells had less pRB than control cells but similar amounts of ppRb. Therefore the percentage of pRb compared to total Rb was less in 2ME treated cells than in control cells. It is known that pRb binds to E2F, thereby hindering the initiation of gene transcription. Since endoreduplication was associated with less pRb in Oli-neu cells, we suggest that the absence of pRb induced E2F to initiate S-phase transition despite tetraploidy. Our findings indicate that pRb is an important factor in the cellular response to MTIs, particularly in the context of regulation of DNA replication. Indeed, several studies have shown that pRb plays an important role in the cell cycle arrest after tetraploidy and that a functional pRb is crucial for ensuring appropriate cell cycle arrest [
39,
40,
44,
54]. Interestingly, we see that 2ME upregulates of JNK1, an important up-stream activator of cyclin B1 and cdc2, and is responsible of 2ME induced endoreduplication in human breast cancer cells [
19].
We also observed that 2ME treatment regulated the expression of cyclin E which is a regulatory subunit of Cdk2 and drives cells from G1 to S phase. Increased cyclin E expression is frequently observed in human malignancies and is associated with poor prognosis in various cancers. Under quiescent conditions, cyclin E forms a complex with Cdk2, which inhibits the phosphorylation of pRb and prevents the release of E2F and thereby inhibiting the entry of cells into the S-phase. 2ME has been shown to induce endoreduplication in human smooth muscle cells, and a role for Cdk2 was proposed [
37]. In our experiments, however, we observed a minor increase in Cdk2 expression. In another study on MTI induced endoreduplication, it was shown that p21 inhibition of cyclin E/Cdk2 activity prevented endoreduplication after mitotic spindle disruption and, similar to our finding the Cdk2 levels remained constant [
42]. In that study, the expression of cyclin E was also investigated and, after an initial decline, probably due to loss of cells in the G1 state, cyclin E levels increased, consistent with the presence of cells in a pseudo G1-state.We speculate that cells undergo endoreduplication after contact with MTIs either by upregulating Cdk2 or by increasing cyclin E expression. Additionally, the expression of cyclin E could be linked to the expression of p21, since increased expression of p53 transactivates p21, which binds to the cylinc E/Cdk2 complex and thereby inhibits the progression to the S-phase.
In addition to cyclin B and E, 2ME treatment also increased expression of cyclin A, a suggested target for oncogenic signals, and is associated with E2F transcription factor. A study by Pagano et al. [
55] demonstrated that cyclin A has two distinct kinase activities, one appearing in S-phase, the other in G2. Cyclin A was found to bind to both Cdk2 and Cdc2 and cyclin A complexes with p21 and PCNA. However, no connection between cyclin A and endoreduplication has been found in mammalian cells so far [
56] and could potentially be ruled out.
2ME treatment also upregulated cyclin D2 expression. In nocodazole (another strong MTI) treated HCT116 cells [
42], cyclin D expression was analyzed in a time-dependent manner. A small decrease in cyclin D1 protein levels was observed after 18 hours of treatment, consistent with the loss of G1 cells and accumulation of cells in G2/M. Nevertheless, the cyclin D1 protein levels increased again after 32 hours of treatment, which was consistent with the presence of cells in a G1-like biochemical state. In our FACS experiments, we found an accumulation of cells with 8N after 48 hours of treatment with 2ME. The 8N peak in the FACS diagram tails on the right towards zero, indicating that cells might be arrested in a pseudo-G2 state. Interestingly, in our experiments we observed that cells pretreated with Pifithrin-α and treated with 2ME showed the typical morphological alterations of MTI treatment, such as retraction of cell processes and rounding-up. Interestingly, these cells did not undergo endoreduplication. Since 2ME treatment is known to induce spindle aberrations [
33,
57], we speculate that the round morphology of 2ME-treated cells was due to a destruction of the microtubule network, which causes the failure of the spindle apparatus. We speculate that there is a mechanism which senses the failure of spindle function in the 2ME and Pifithrin-α treated cells and forces the cells to arrest. However, when p53 is not inhibited the mechanism is abrogated or overridden by the presence of p53.
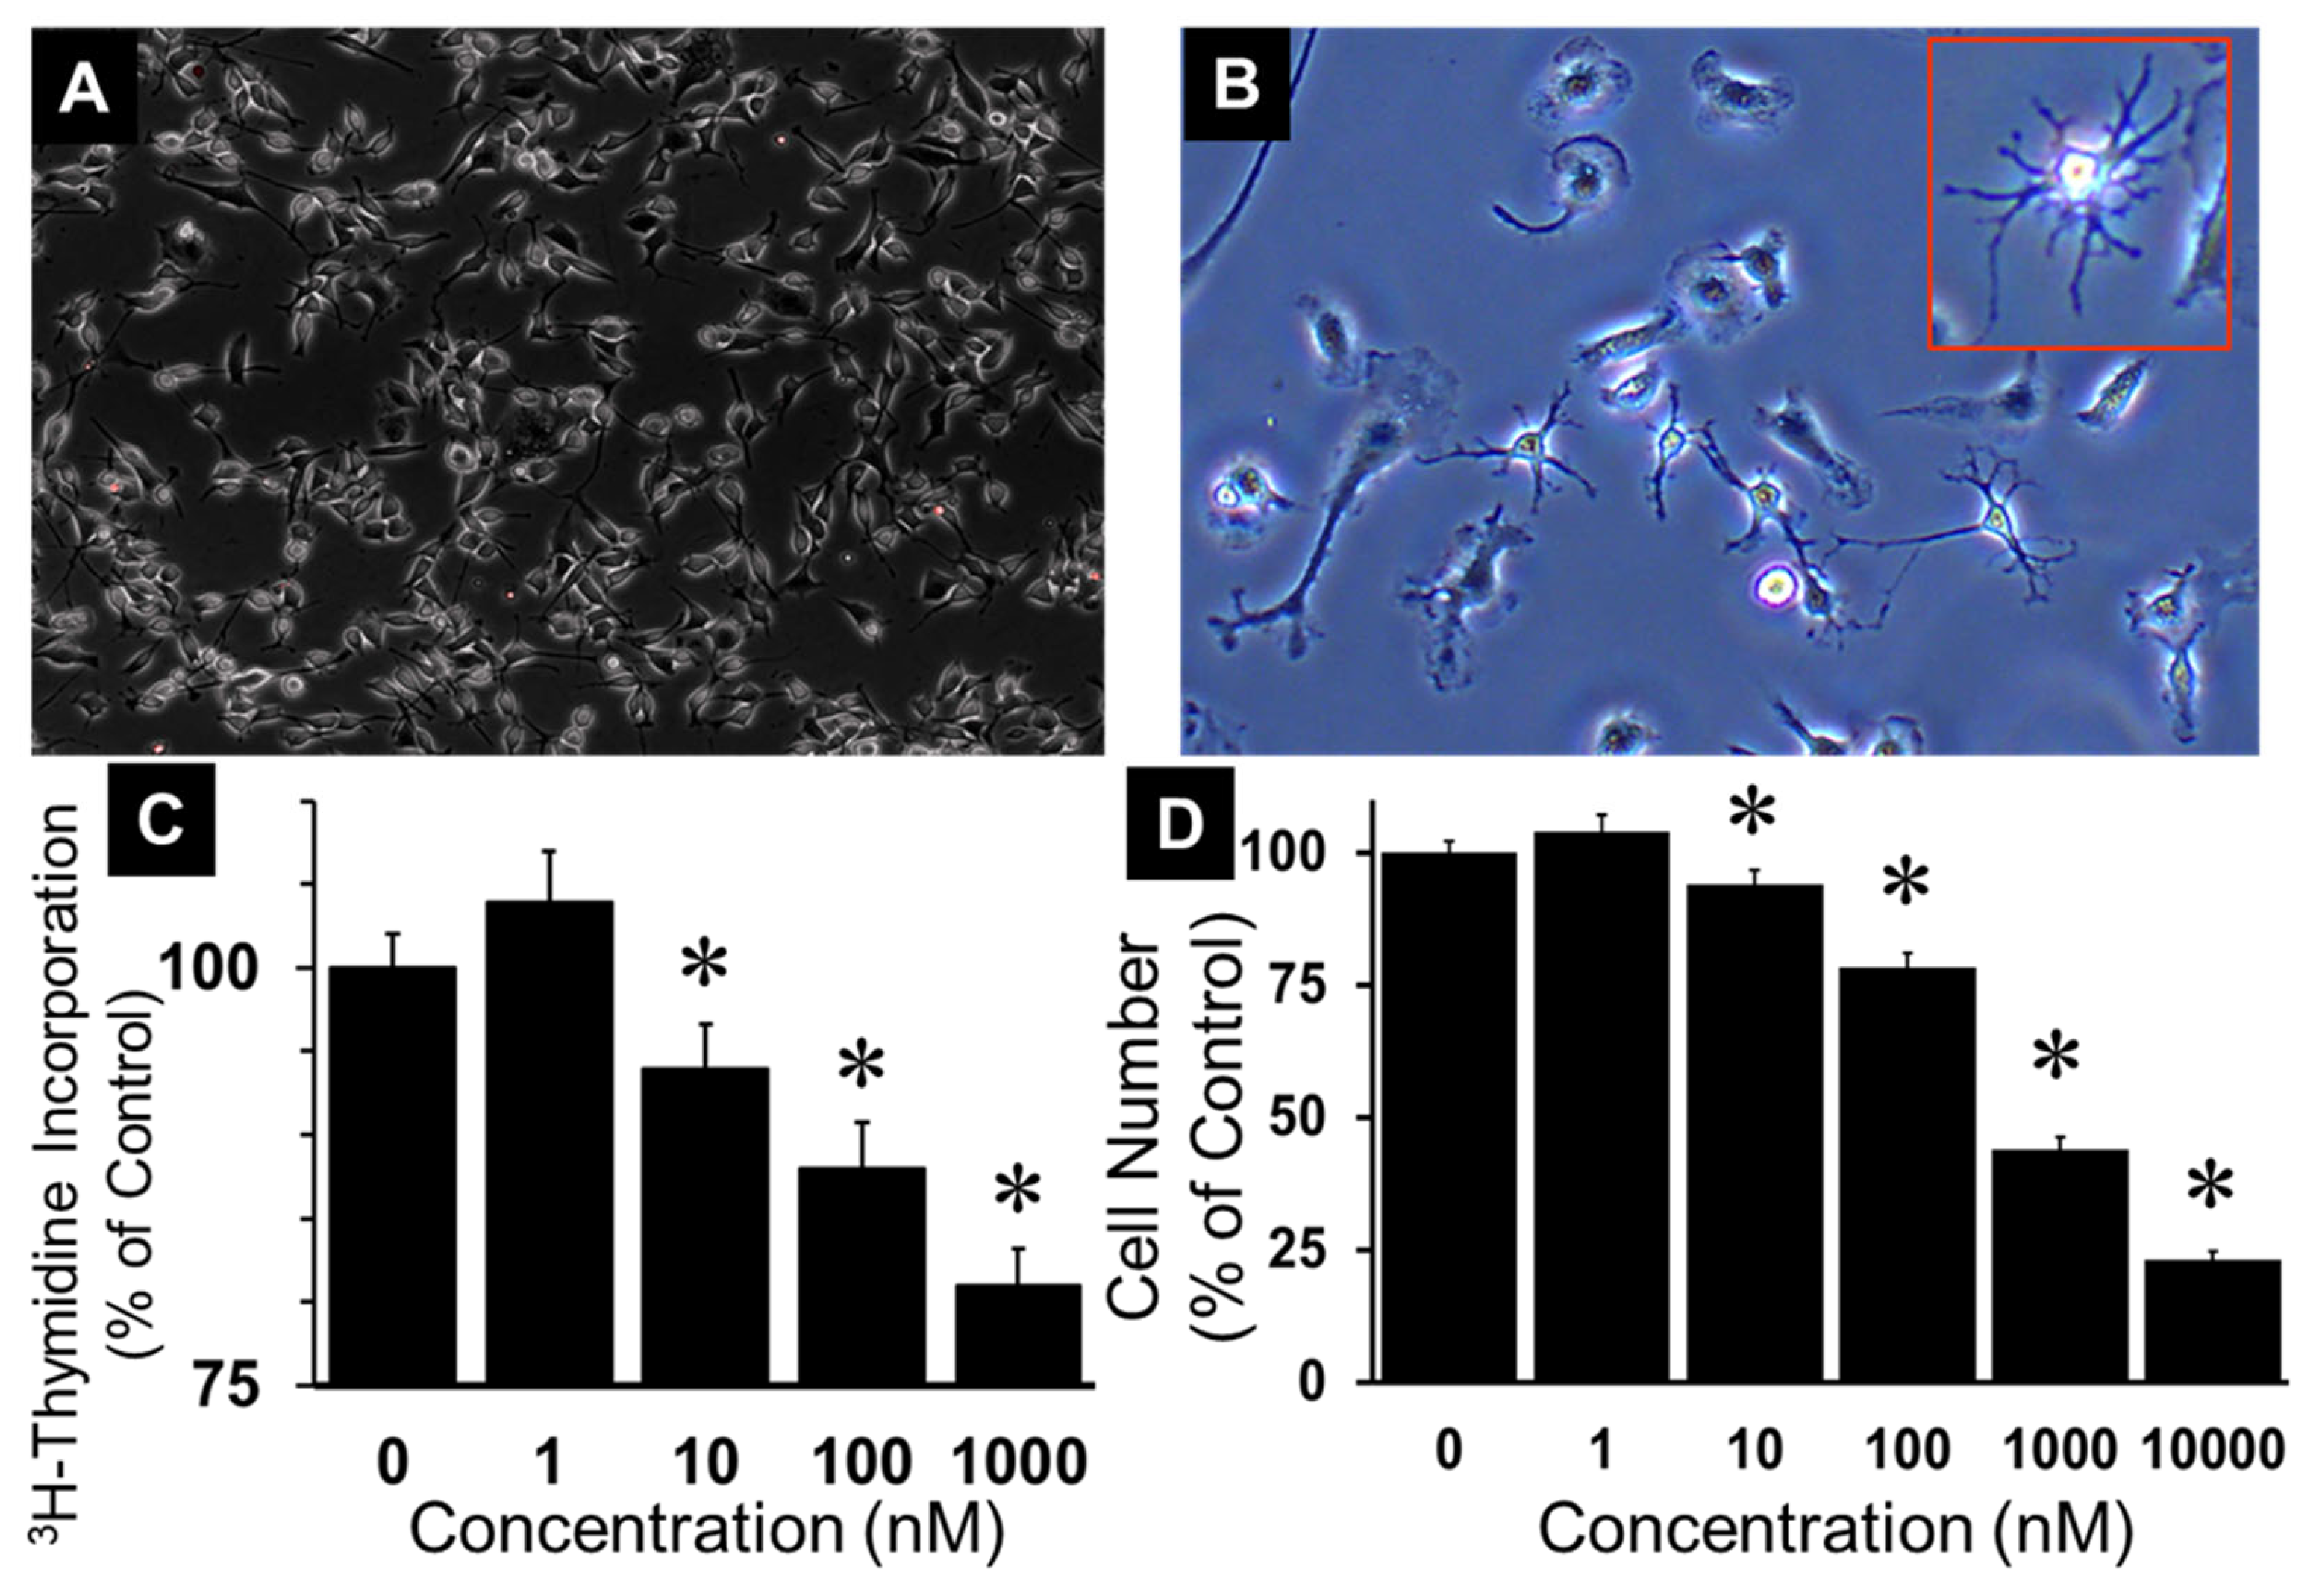
Figure 1.
Growth inhibitory effects of 2-methoxyestradiol (2ME) in Oli-neu (OPCs) cells. (A) Representative photomicrograph showing cultured OPCs (4x mag); (B) Representative photomicrograph depicting OPCs with characteristic oligodendrocyte morphology at a higher magnification (400 x); (C) Bar graph showing the concentration-dependent inhibitory effects of 2ME on FCS (2.5%) induced DNA synthesis measured by assessing 3H-thymidine incorporation; (D) Bar graph depicting the inhibitory actions of 0-10 µM 2ME on 2.5% FCS induced change in cell (OPC) number. Each data point represents mean ± SEM from 3 separate experiments, each conducted in triplicate or quadruplicate; * P < 0.05 vs vehicle treated control.
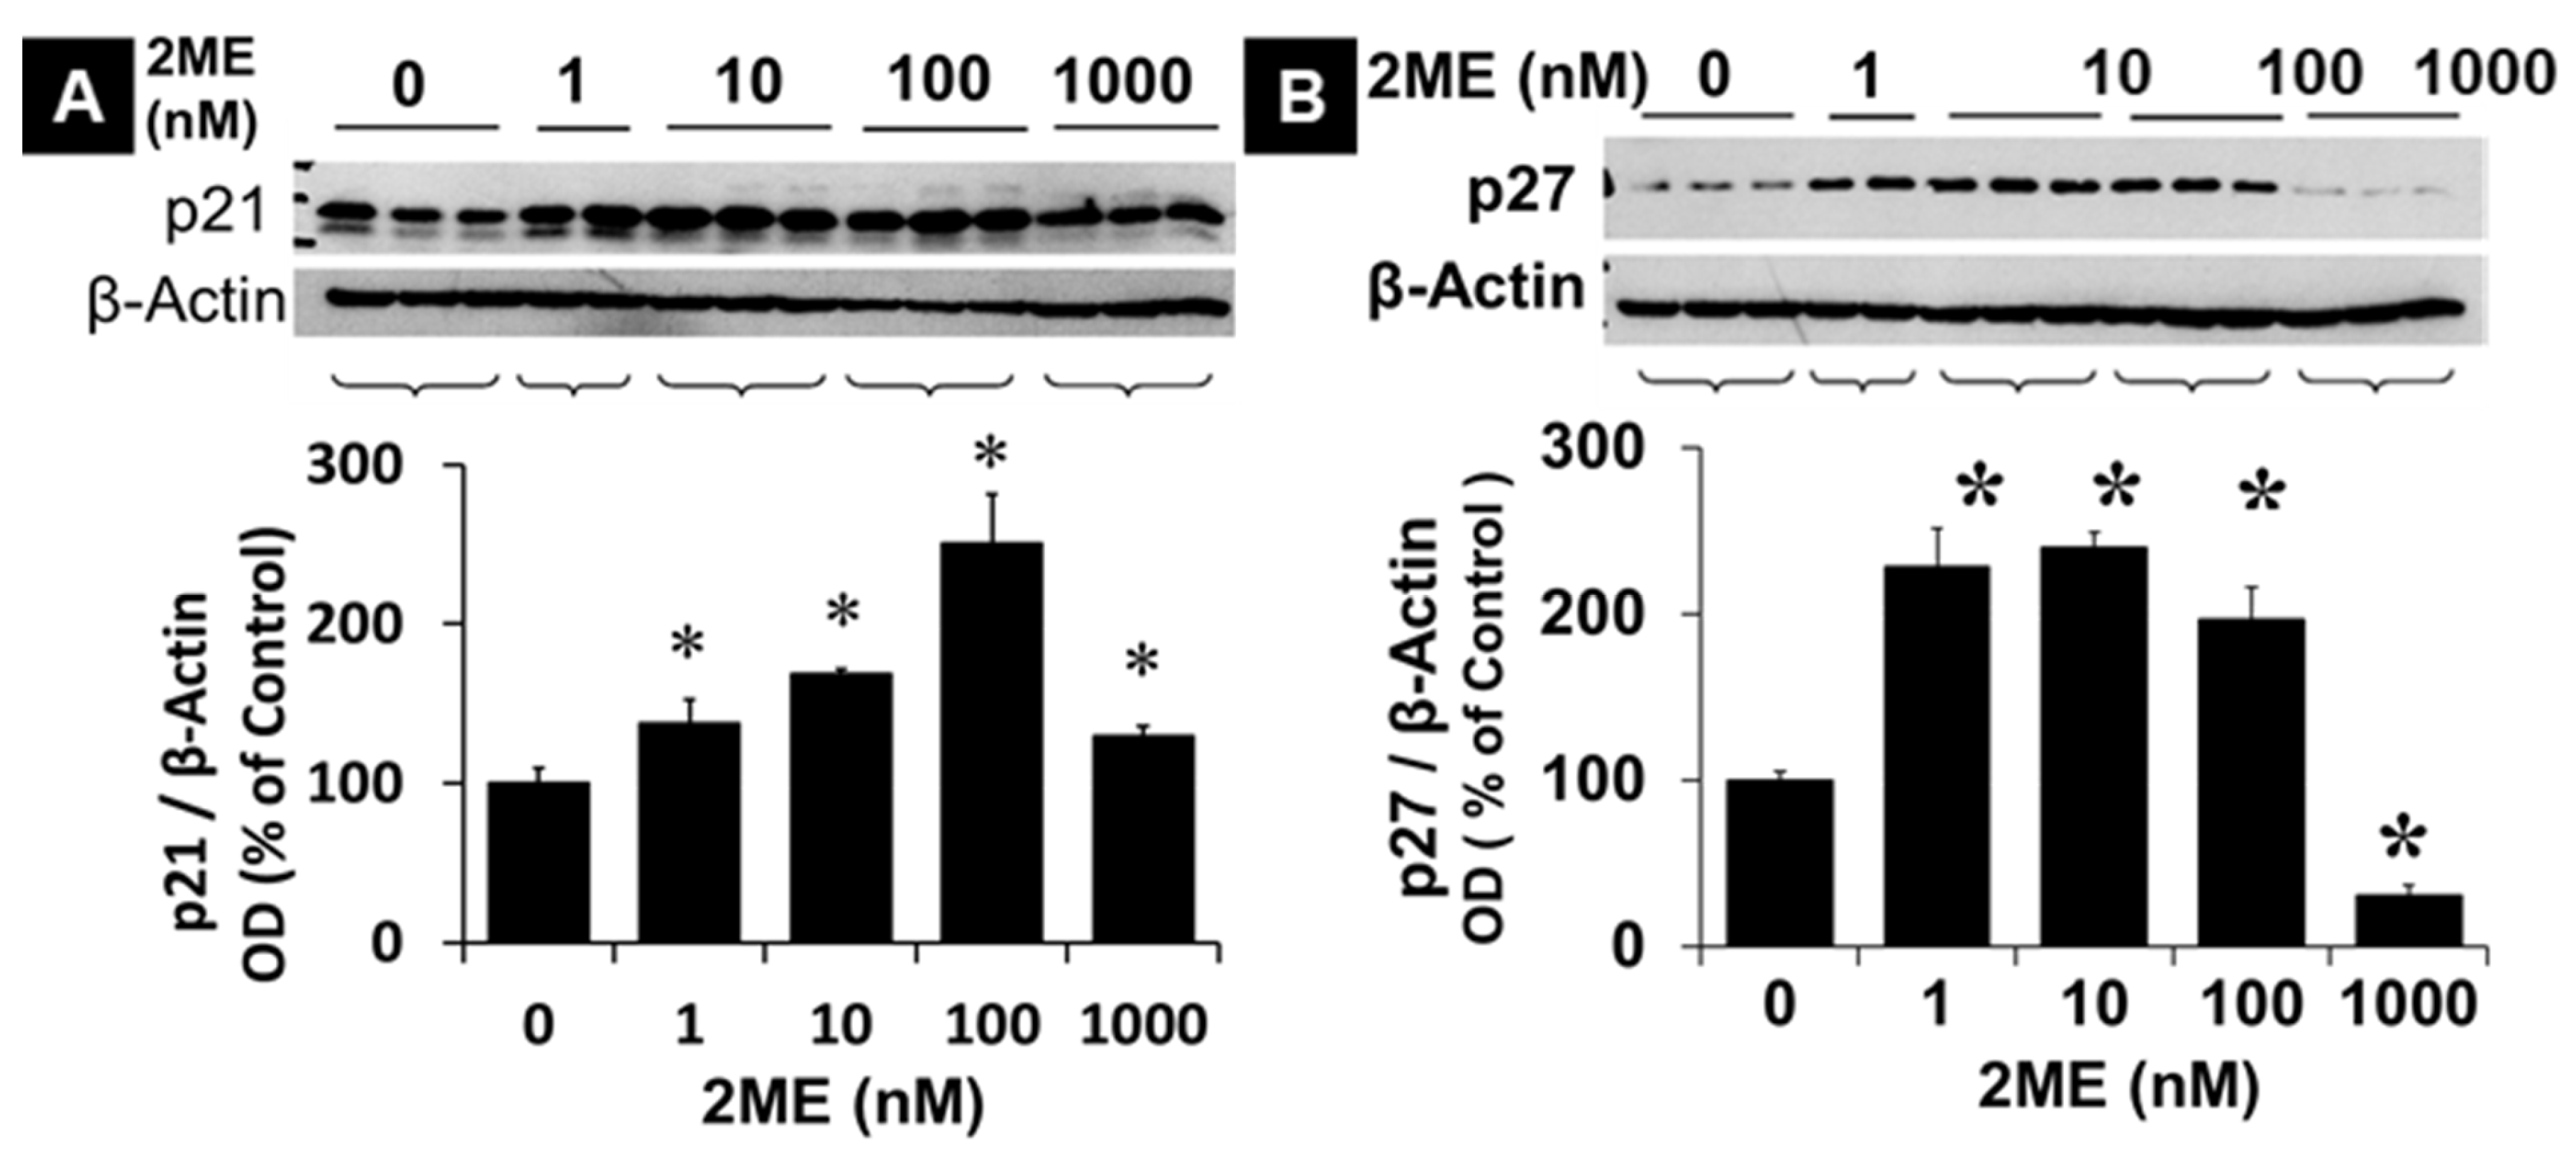
Figure 2.
Modulatory effects of 2ME on p21 and p27 expression. Representative Western blot showing the effects of 2ME on the expression of p21 (A) and p27 (B) in Oli-neu cells. Cells were serum-starved for 24 hours in SATO medium without phenol red, without progesterone, and containing 0.25% steroid-free FCS. Subsequently cells were treated with 1-1000 nM 2ME for 48 hours in SATO without phenol red, without progesterone, and containing 1% steroid-free FCS. The bar graphs show the densitometric analysis of the changes observed and normalized to the internal standard, β-actin. The results are presented as mean ± SEM (n=3). ∗ P<0.05 vs control.
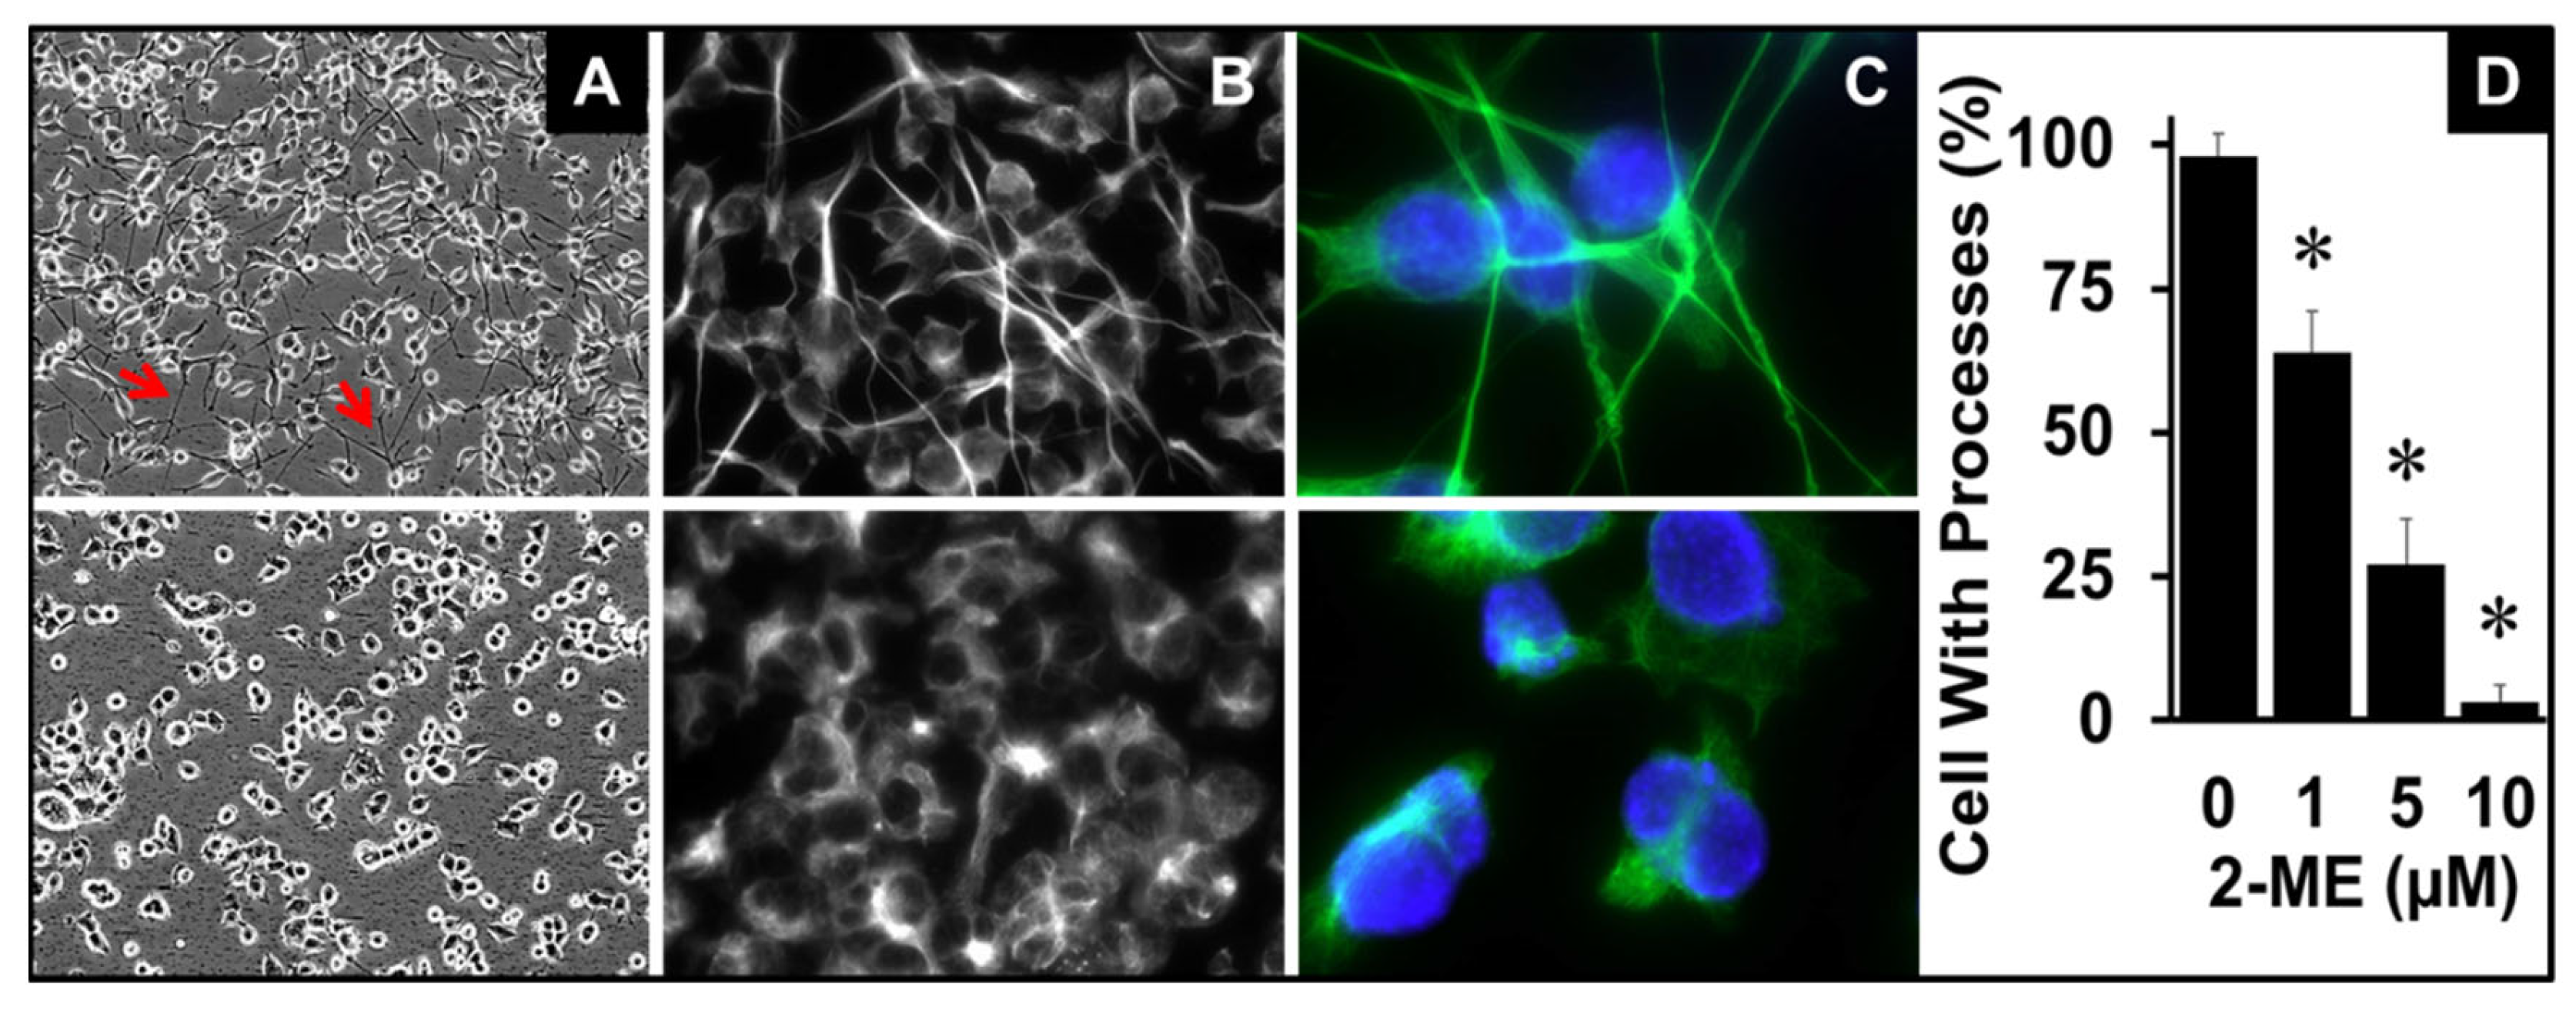
Figure 3.
Morphological changes induced by 2ME in Oli-neu cells (OPC). Representative phase contrast (A) and bright field fluorescent (B and C) images showing retraction of OPC arms/tentacles in OPCs treated with 2ME (5µM) for 24 hours. DAPI was used for nuclear staining (blue). Panel D depicts bar graph depicts the concentration-dependent effects of 2ME on OPC arm retraction. Cells at 10 different location of the photomicrograph were observed and counted to assess the effects of 2ME on cell rounding or loss of tentacles. * P < 0.05 vs vehicle treated control.
Figure 4.
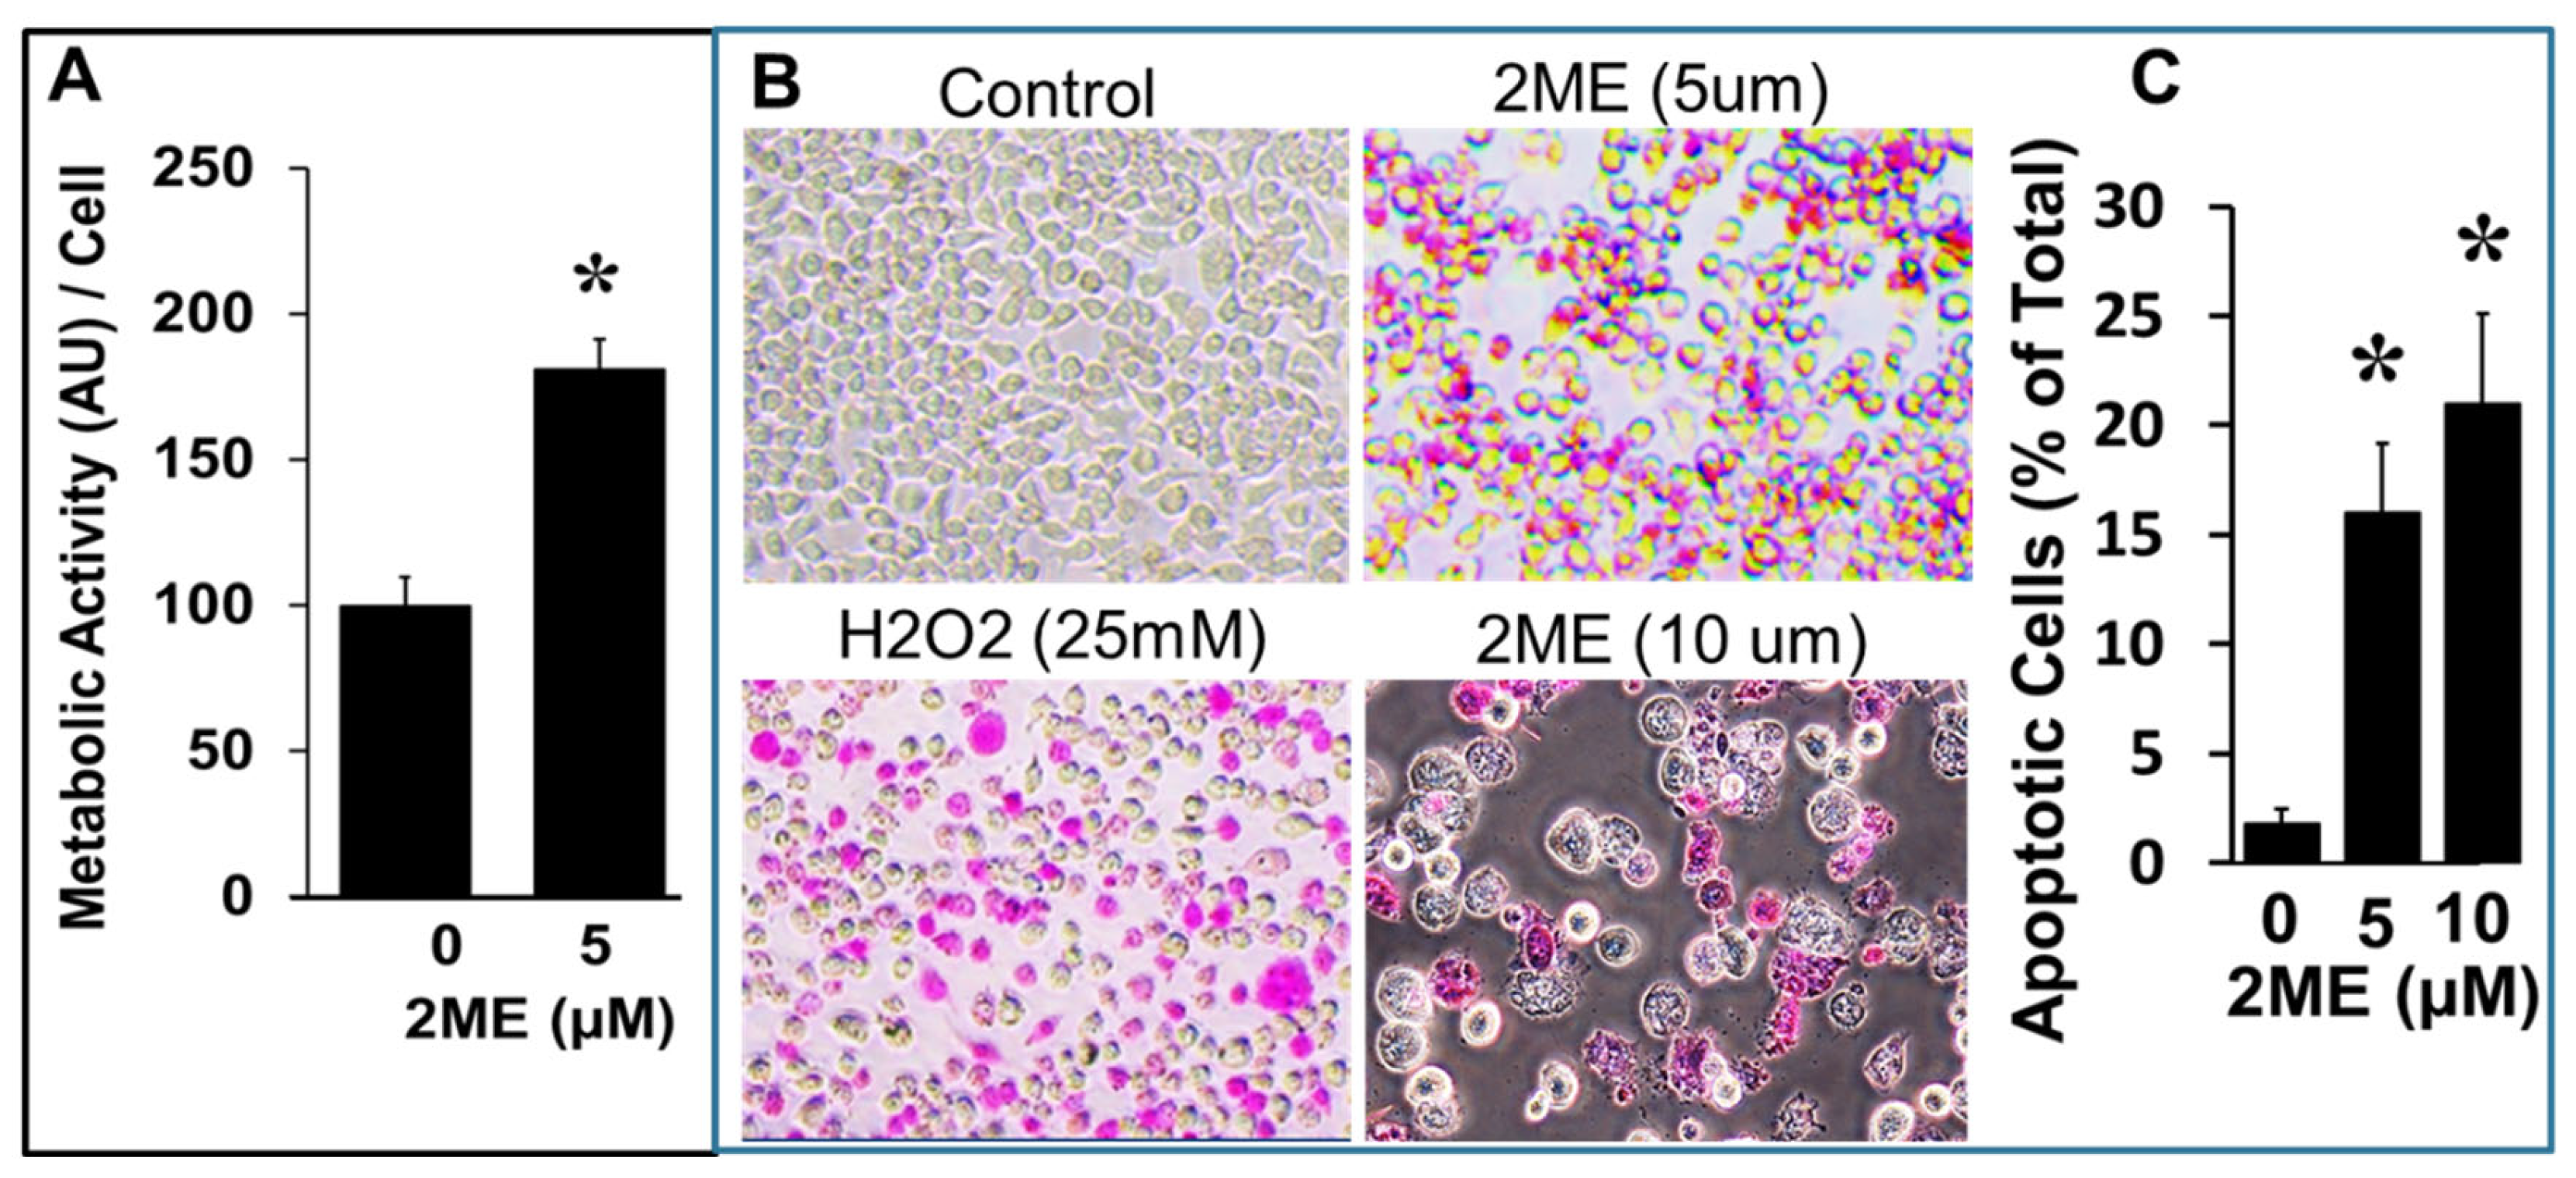
Activation of metabolic activity and apoptosis in Oli-neu (OPC) cells by 2ME. (A) Bar graph depicting the effects of 5µM 2ME on OPC metabolic activity measured by MTT assay and normalized to OPC numbers counted after treatment with vehicle or 5 µM 2ME. The graph represents the metabolic activity per cell. Data represents mean ± SEM (n=3 each in triplicates). *<.05 vs control. (B) Representative photomicrographs stained with the Apopercentage dye, a specific marker for apoptosis, which stains the externalized phosphaditylserines. OPCs treated with H2O2 (25mM) served as positive control for apoptosis. (C) Bar graph depicting percentage of apoptotic cells (Apopercentage) in response to 2ME (mean ± SEM n=3). ∗ P<.05 vs control.
Figure 5.
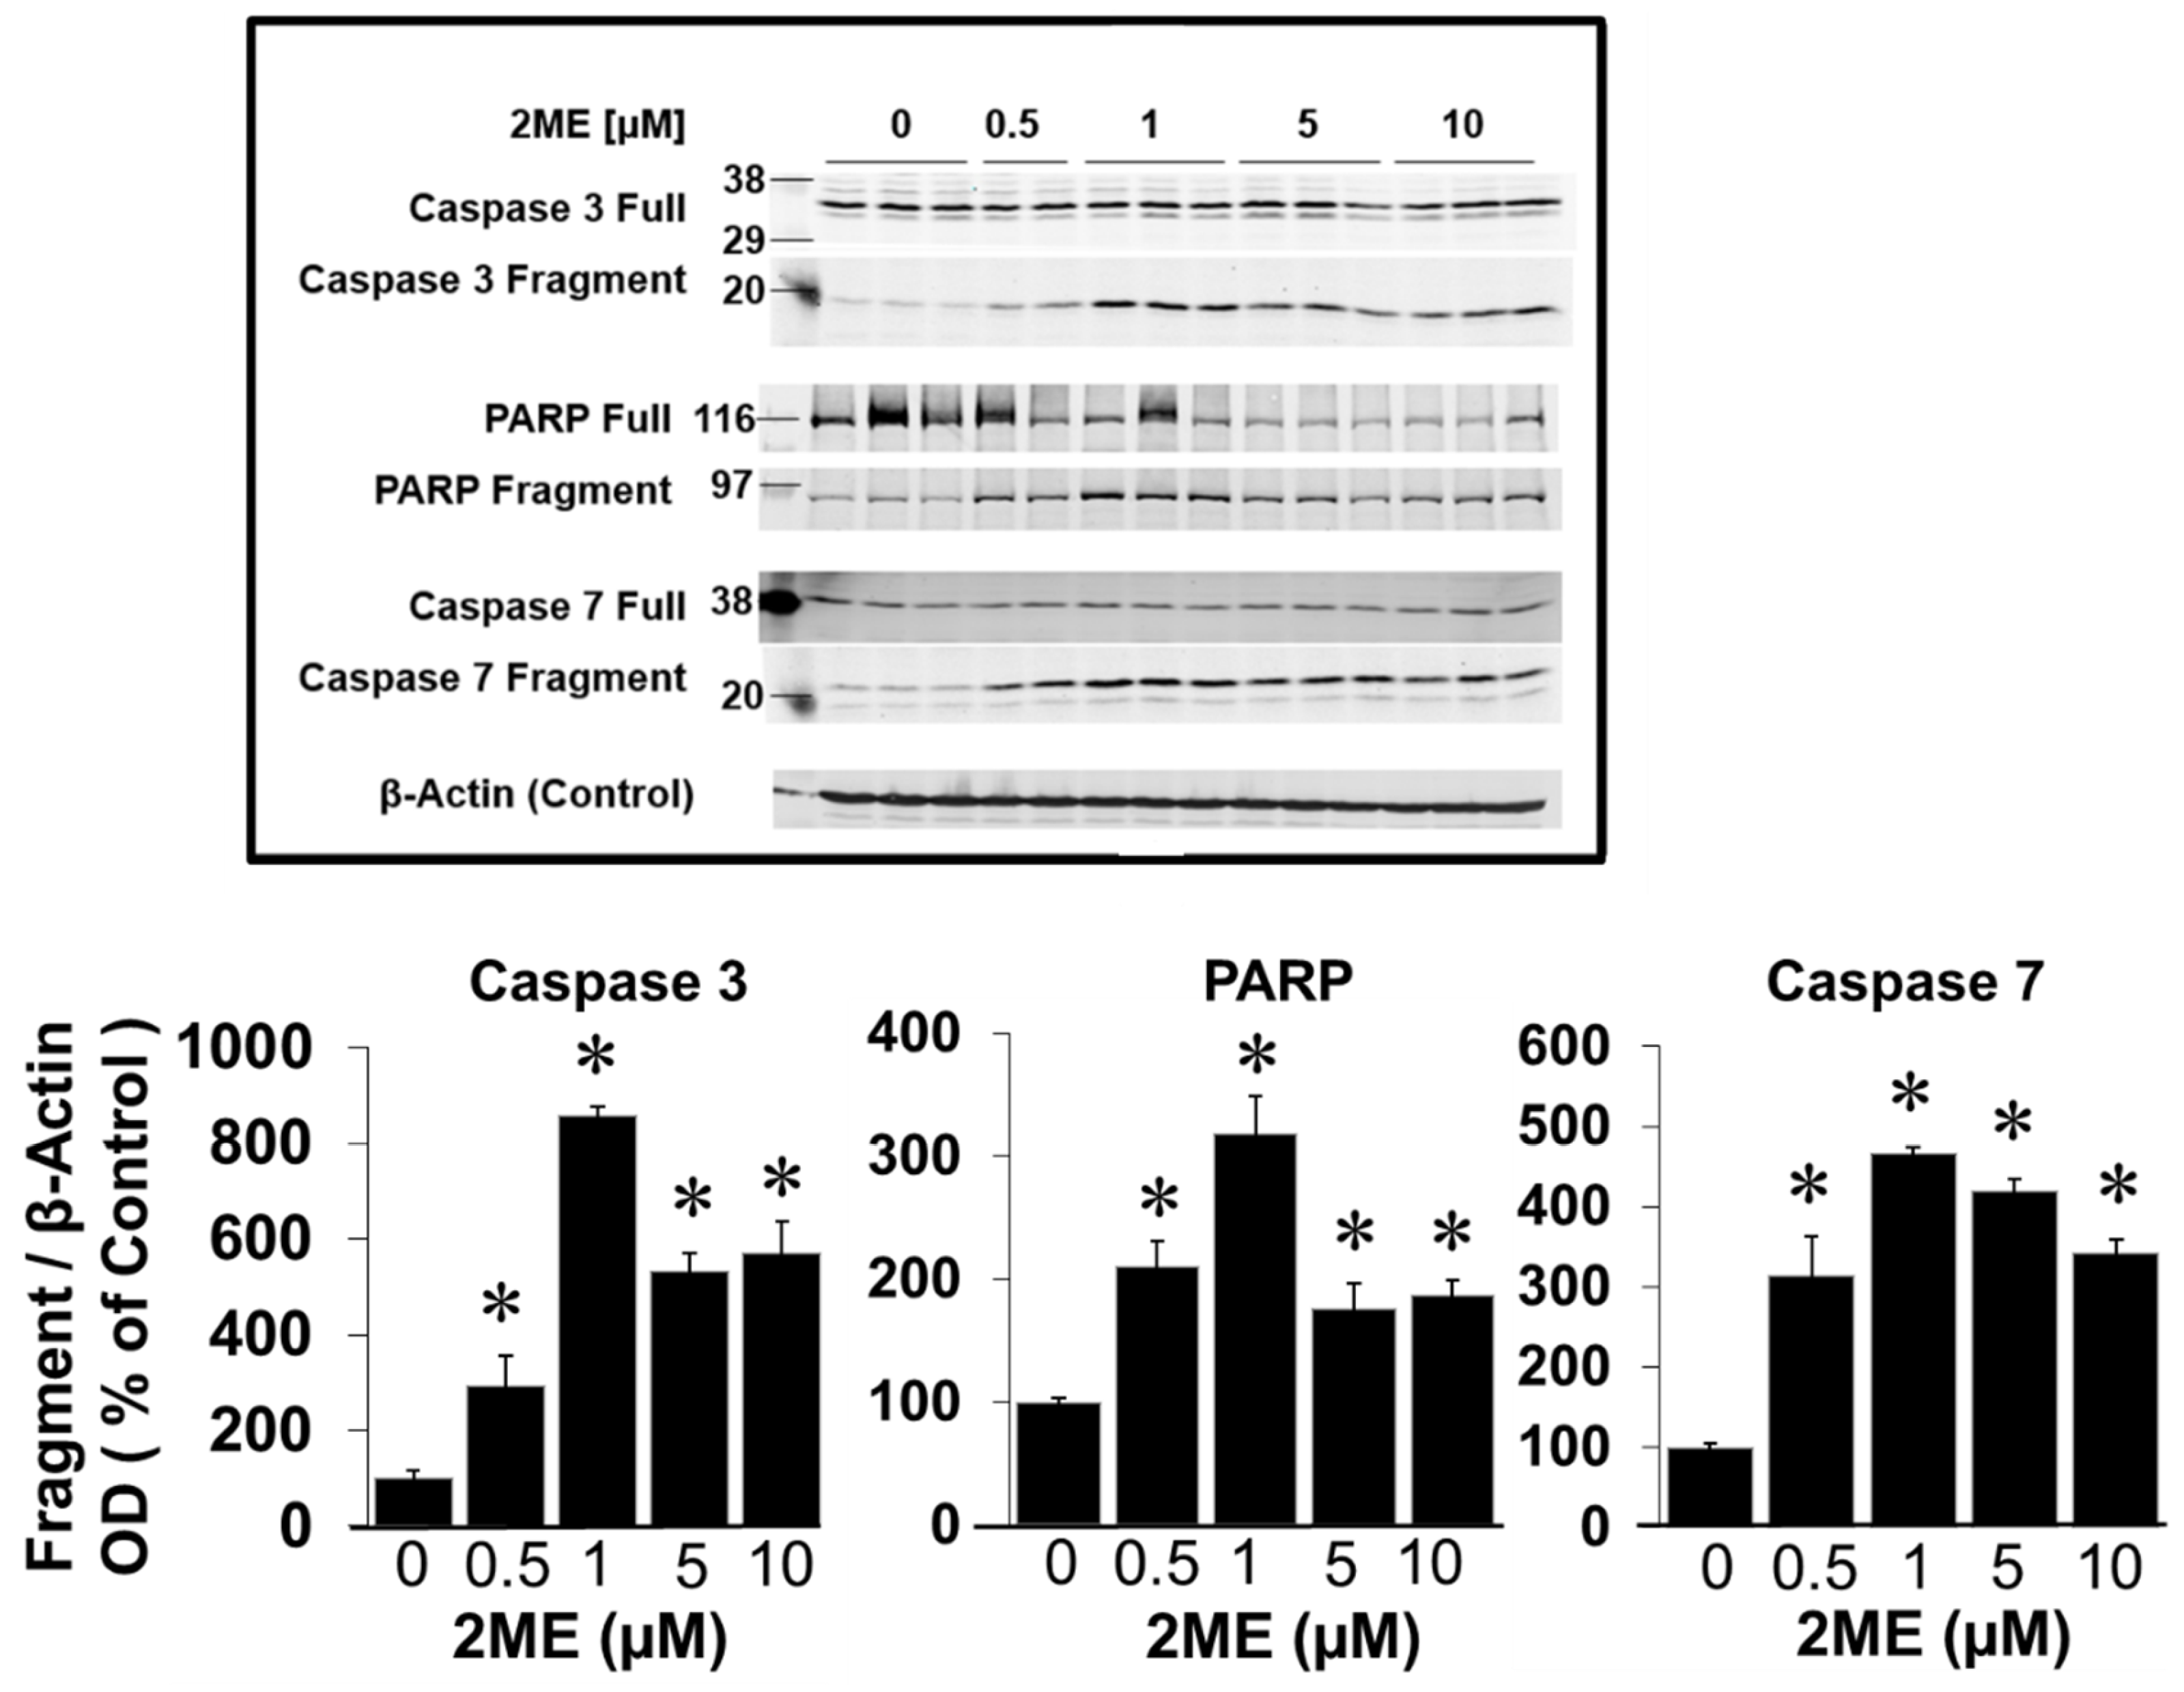
Western blots showing the modulatory effects of 2ME on Caspase 3 and Caspase 7 cleavage as well as on PARP fragmentation in Oli-neu cells. The bar graphs depicts the densitometric analysis of the changes observed in cleavage products or fragments, normalized to the total protein amount. The results are presented as mean ± SEM (n=3). ∗ P<.05 vs control.
Figure 6.
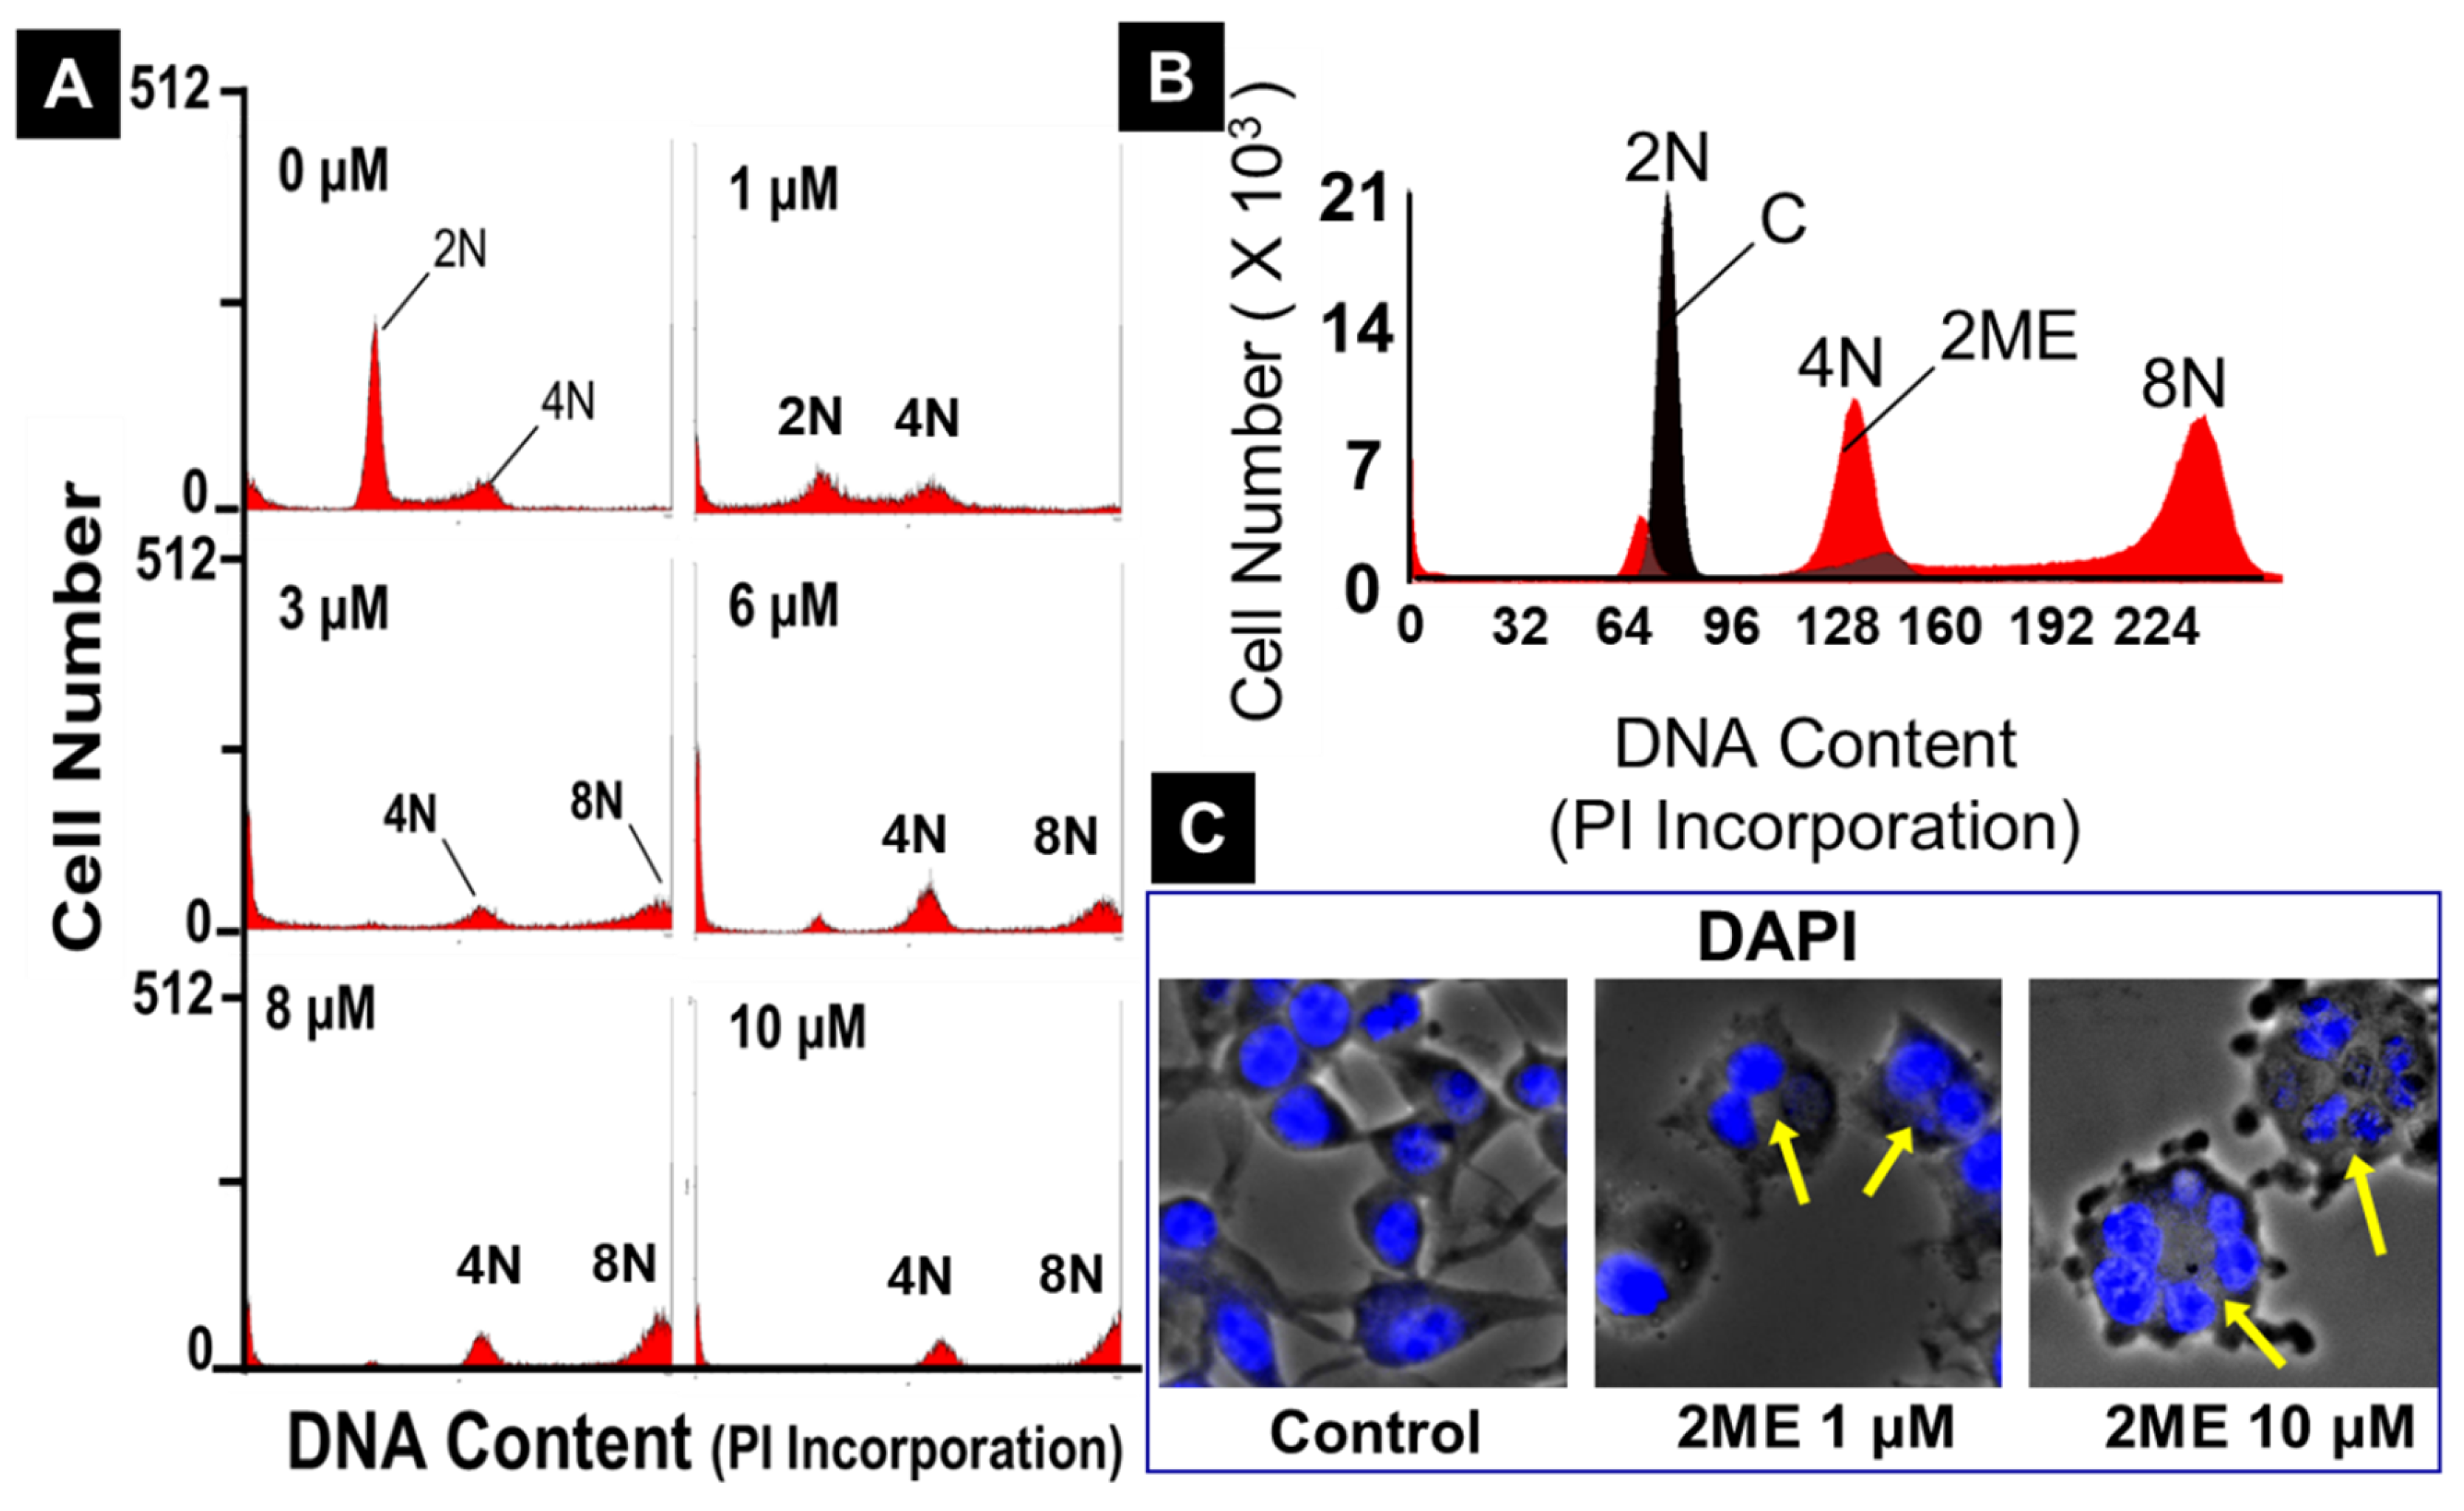
Endoreduplication promoting effects of 2ME in Oli-neu (OPCS) cells. FACS analysis of PI stained OPCs (A and B) and fluorescent microscopy of DAPI stained cells (C) showing that treatment with 2ME induces endoreduplication in OPCs. Panel A depicts OPCs treated with 1 - 10 µM 2ME for 48 hours and the DNA was stained with propidium iodide prior to FACS analysis. Appearance of 8N cell population is evident in representative FACS of 2ME treated OPCs. Panel B compares normal and 2ME treated OPCs by overlapping untreated OPCs (black) and 2ME treated OPCs (red). Panel C depicts DAPI stained multinucleated OPCs following 2ME treatment. .
Figure 8.
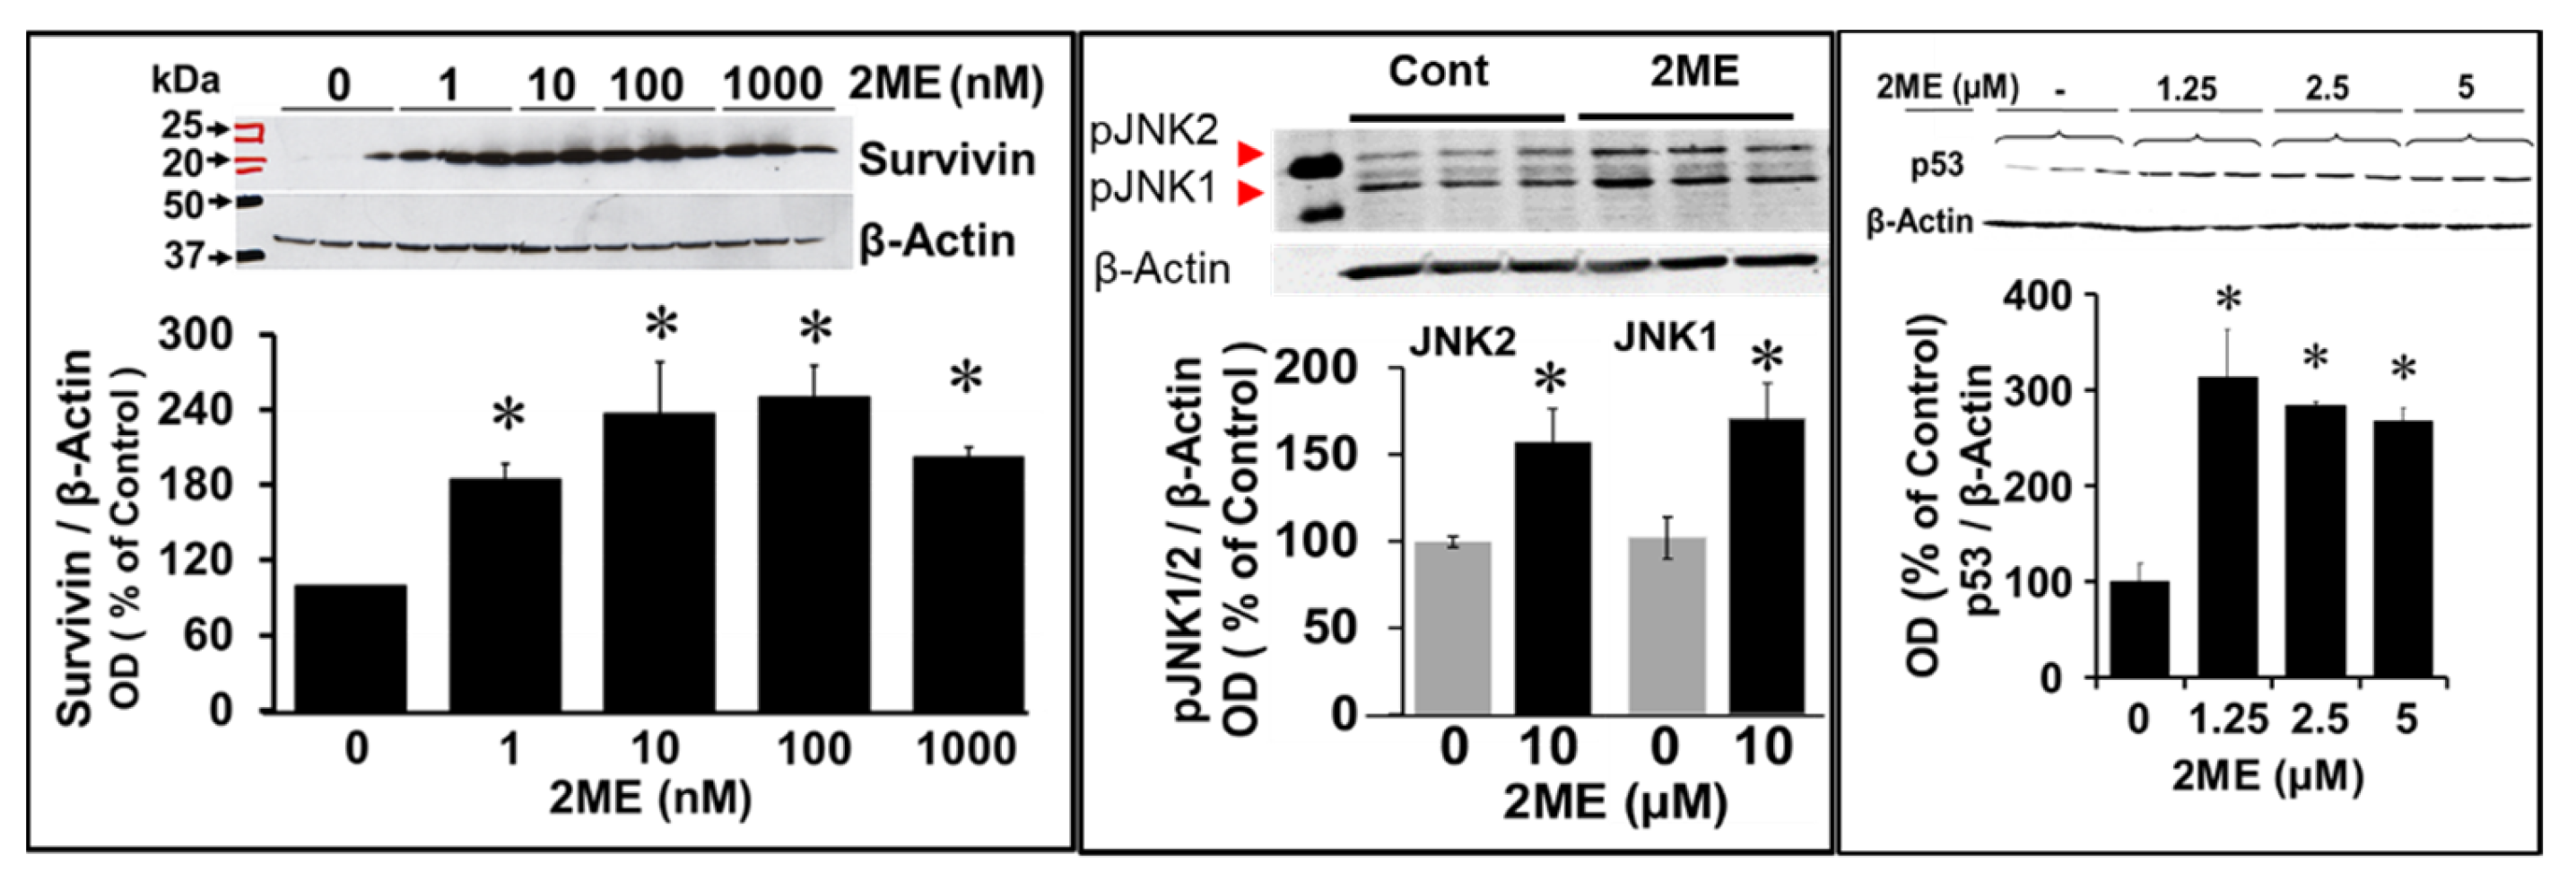
Western blots depicting the modulatory effects of 2ME on various signalling proteins associated with endoreduplication. OPCs were treated with 0-10µM 2ME for 48 hours and the changes in JNK1, JNK2, Survivin and p53 expression assessed in the lysates. Representative blots and bar graphs depict the effects of 2ME as compared to vehicle treated control. The bar graphs depict modulatory actions of 2ME and presented as mean ± SEM (n=3). ∗ P<.05 vs control.
Figure 9.
Inhibition of p53 with Pfithrin-α prevents 2ME-induced endoreduplication, but not arm process retraction, in Oli-neu cells. Bright-field microscopy (A) and FACS analysis (B) of Oli-neu cells treated with 5 µM 2ME for 18 hours after pretreatment with or without Pifithrin-α 20 µM for 2 hours. For FACS analysis the DNA was stained with propidium iodide. Representative fluorescent images show 2-ME induced changes in Oli-neu morphology in presence and absence of Pifithrin-α. Bar graph depicts changes in Oli-neu cell number (C) and change in expression of p53 and p21 (D) in presence and absence of Pfithirin-α. All experiments were repeated thrice and values in bar graph represent mean ± SEM (n =3). ∗ P<.05 vs control.
Figure 10.
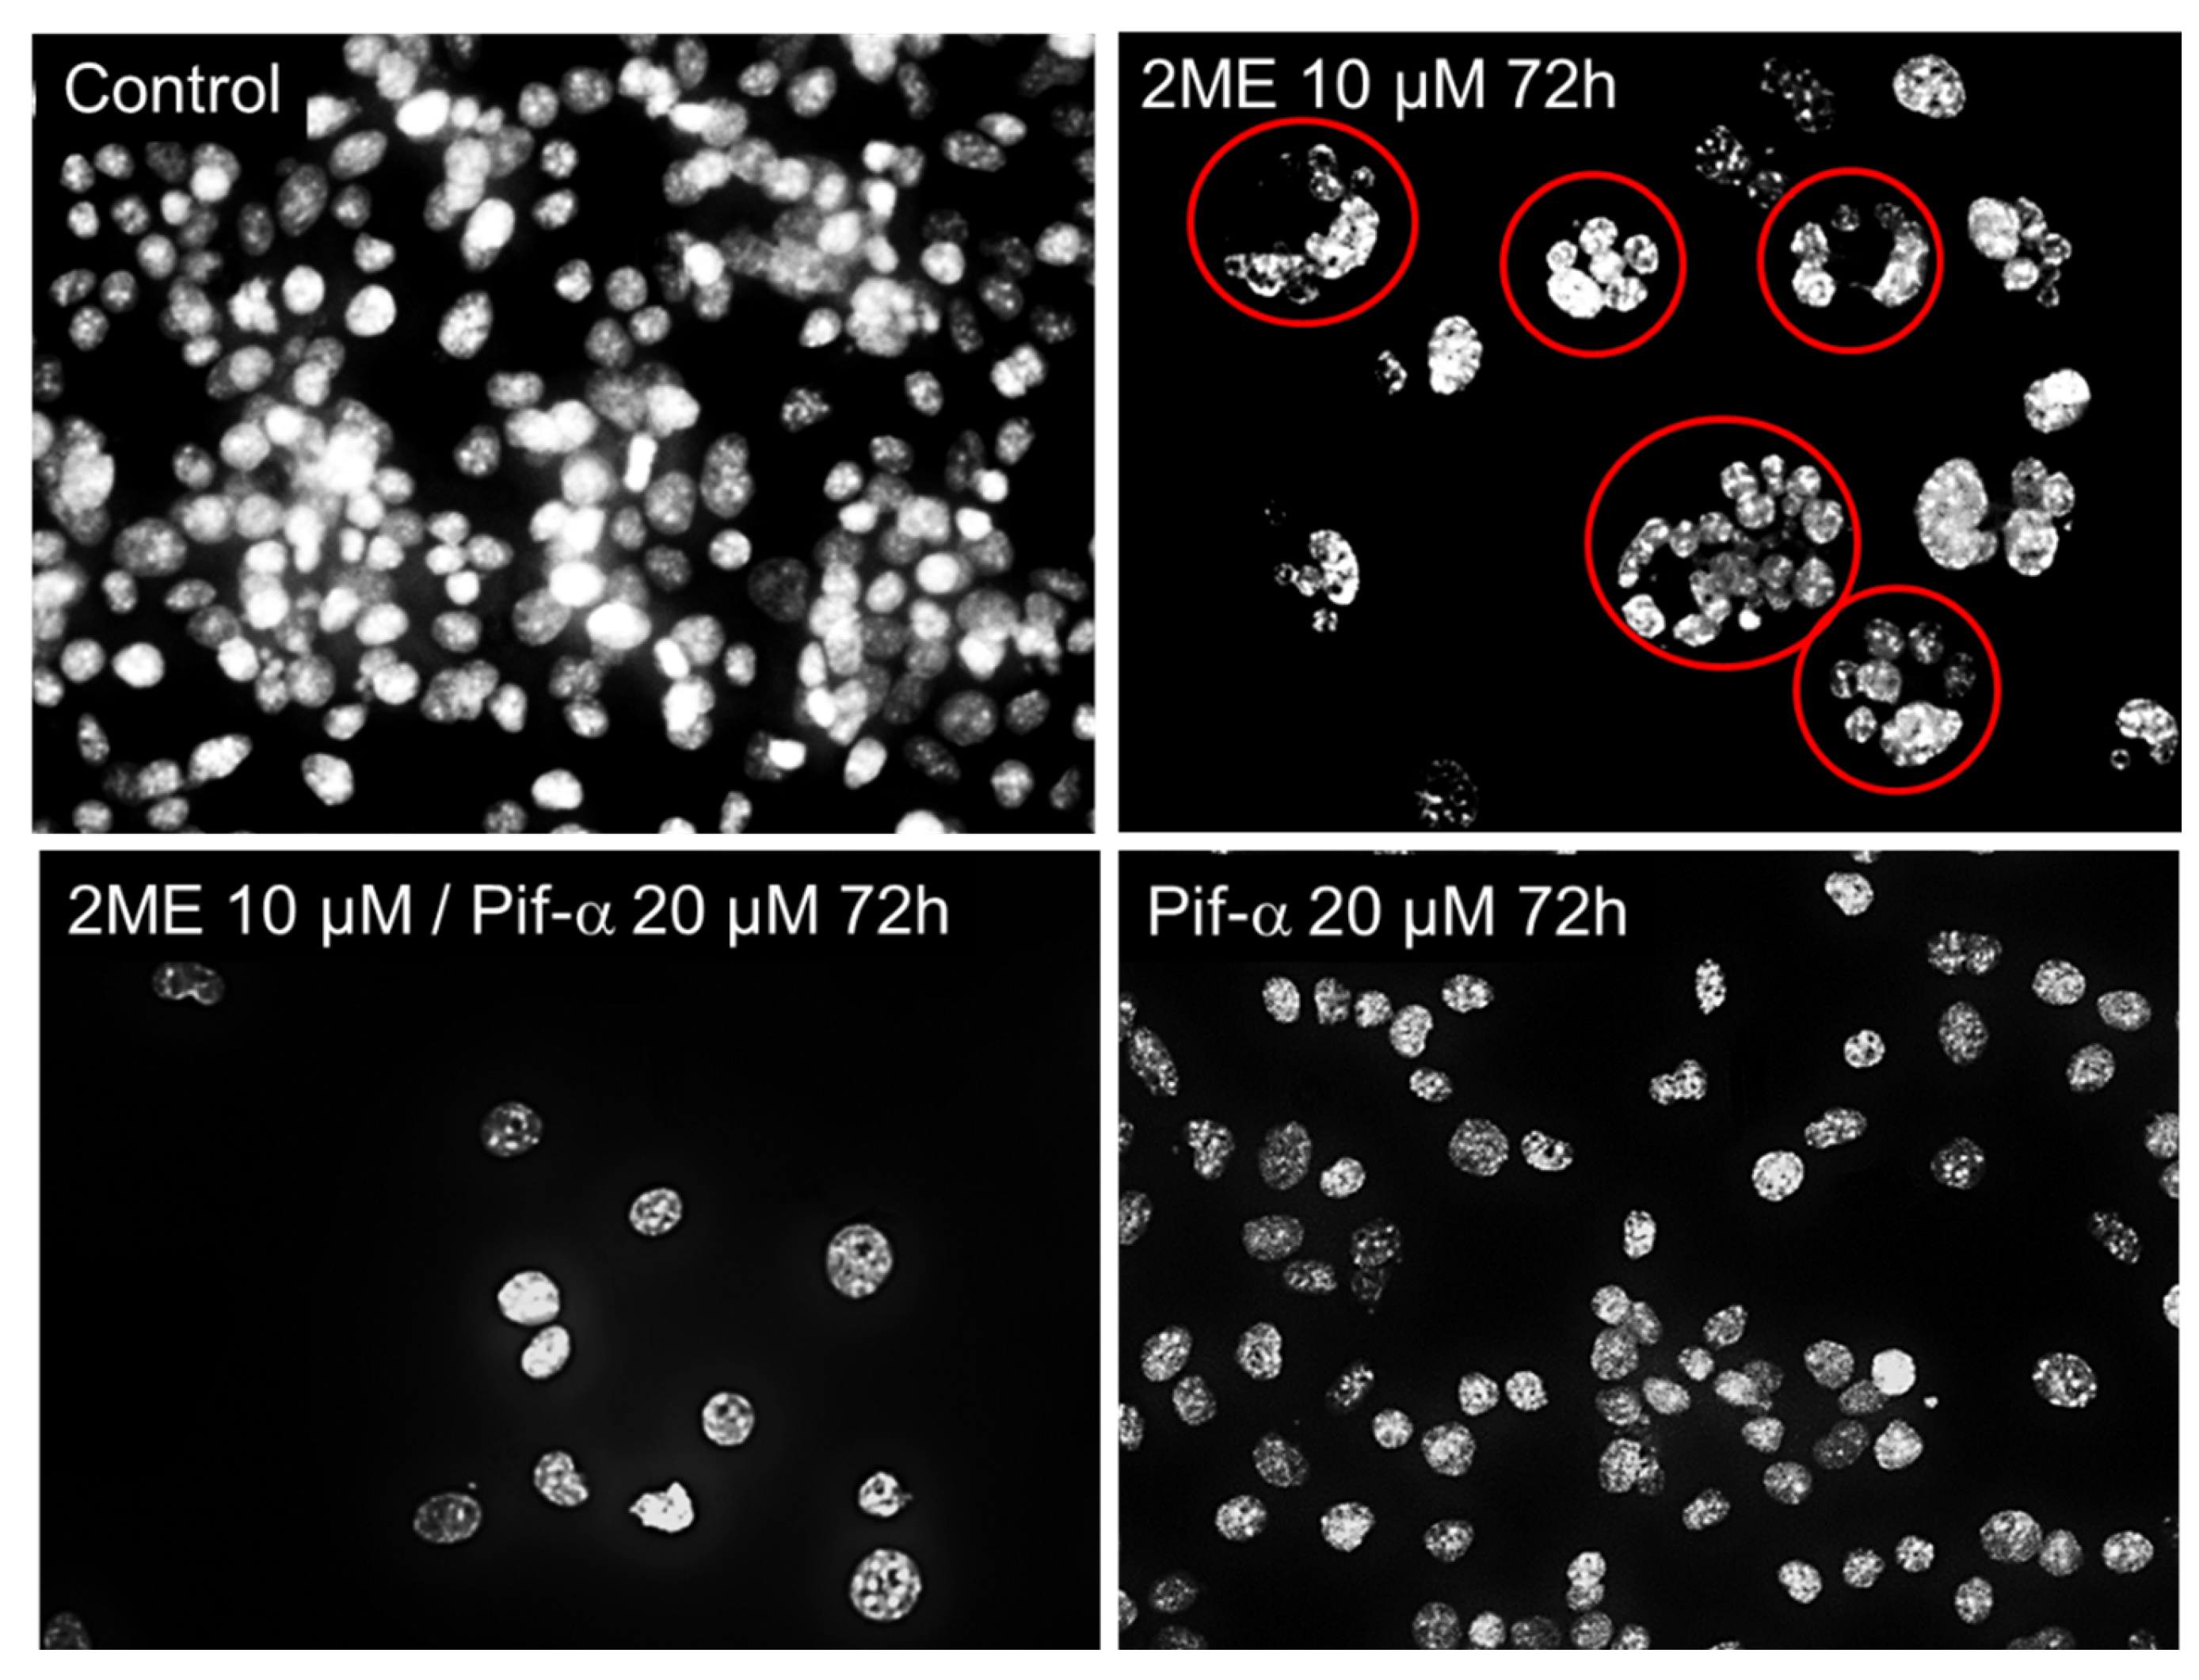
Representative fluorescent photomicrographs showing the of Oli-neu clustering pattern following treatment with 5 µM 2ME for 72 hours after pretreatment with or without Pifithrin-α 20 µM for 2 hours. Inhibition of p53 prevented cell prevented 2ME-induced clusters of multinucleated cells.
Figure 10.
Representative fluorescent photomicrographs showing the of Oli-neu clustering pattern following treatment with 5 µM 2ME for 72 hours after pretreatment with or without Pifithrin-α 20 µM for 2 hours. Inhibition of p53 prevented cell prevented 2ME-induced clusters of multinucleated cells.
Figure 11.
Time-lapse phase contrast imaging showing 2ME induced cell fusion in Oli-neu. Photomicrographs depicts time-sequence of two Oli-neu cells undergoing cell fusion (indicated by red arrows) following treatment of cultures with 5µM 2ME. Similar effects were observed in four different experiments.
