1. Introduction
The BPC (Basic Pentacysteine) gene family is characterized by a firmly sustained DNA-binding domain and five cysteine residues located in its C-terminus [
1]. BPC family members specifically bind to the GA-rice box or C-box (RGARAGRRAA) elements in the promoter to interact with downstream genes and show a specific response by regulating gene expression [
2]. Additionally, BPC proteins are recognized for their capacity to bind to the GAGA motif within promoter sequences, earning them the designation of GAGA-binding transcriptional activators [
3]. All BPC/BBR proteins possess a conserved DNA-binding domain at the C-terminus, enabling them to bind to the GA-repeat promoter sequence of their target genes in vitro [
4]. Hence, there's a proposal suggesting that BPC proteins exhibit functional similarity to animal GAGA-binding factors. These factors are known to regulate the transcriptional expression of homeobox genes, thereby orchestrating various developmental events [
2,
5]. Similar to GAGA-binding factors, BPCs are involved in numerous developmental processes, as evidenced by the pleiotropic phenotypes witnessed in higher-order BPC mutants [
6].
The BPC protein engages in interaction with LEAFY COTYLEDON 2 (LEC2) protein, which regulates the process of seed development and is notably expressed exclusively in embryos [
5,
7]. To sustain the shoot apical meristem, the BPC protein interacts with homeobox transcription factors (TFs) such as SHOOTMERISTEMLESS and BREVIPEDICELLUS [
8,
9]. HOMEOBOX genes, particularly members of the KNOX, WUS, and BELL families are directly regulated by BPC class I [
10]. In cucumber, seed germination is regulated by BPC through its interaction with ABI3 [
11]. In rice, OsGBP1 and OsGBP2 transcription factors (TFs) bind to GAGA and induce functional variation, impacting plant growth and grain size [
12]. Nonetheless, direct binding of OsBPC1 to the promoter region of the OsLFL1 (LEC2/FUS3-like) gene which postpones the flowering [
12,
13]. A prior investigation documented that CsBPC2 enhances salinity stress tolerance in cucumbers by stimulating the activation of the defense system [
14].
Wild cabbage, or
B. oleracea, is a wonderful illustration of the diversity that exists in the natural world. Its various varieties—broccoli, cauliflower, Brussels sprouts, kale, and cabbage—illustrate how farming over many generations has allowed people to modify plants [
15]. Originating in the Mediterranean,
B. oleracea is currently cultivated globally and plays a significant role in several culinary traditions [
16]. In addition to being delicious, it is also quite healthy, being rich in vitamins, minerals, and antioxidants [
17]. Comprehensive studies of the BPC gene have been reported so far in a variety of crop species. Nevertheless, there is still much to learn about the expression patterns and evolutionary history of BPC in
B. oleracea. It is essential to conduct a thorough investigation using genome-wide analysis to clarify the role of BPC in the complexities of growth and development in
B. oleracea. In order to clarify and define the BPC family within
B. oleracea, this investigation was carried out. The findings of this study provide the foundation for more detailed studies on BPC gene functioning in
B. oleracea.
2. Materials and Methods
2.1. Identification of BoBPC Genes
Using the ID PF06217 available on PFAM (
http://pfam.xfam.org/), the amino acid sequence for the BPC was acquired from the
Arabidopsis thaliana peptide genome through the accession number NP_176979.3. Phytozome (
https://phytozome-next.jgi.doe.gov) was used to locate BPC genes using this peptide sequence in the genomes of
B. oleracea. Redundant genes were eliminated to remove redundancy. Using NCBI-CDD (
http://www.ncbi.nlm.nih.gov/Structure/cdd/wrpsb.cgi) and the Motif-Finder online database, the non-redundant protein sequences were further verified [
18]. The chromosomal positions and the amino acids that are encoded in
B. oleracea genes were identified using the publicly available database Phytozome. The physicochemical properties of the BoBPC family genes, such as molecular weight, protein length, isoelectric point, and instability index, were obtained using ProtParam, an online tool accessible at
http://web.expasy.org/protparam/ [
19]. The CELLO 2.5 program (
http://cello.life.nctu.edu.tw/) was used to identify the subcellular localization of BoBPC proteins [
20]. Additionally, the subcellular locations of the BoBPC genes were predicted using WoLF PSORT (
https://wolfpsort.hgc.jp/) [
21].
2.2. Bioinformatics Analyses of BoBPC Genes
To investigate the evolutionary dynamics of BPC proteins in Arabidopsis, tomato, cucumber, potato, and cabbage, MUSCLE was used to align the whole amino acid sequences of these genes. To assure statistical reliability, neighbor-joining phylogenetic trees were built using MEGA11 with bootstrap replication set to 1000 [
22]. For improved visual representation and analysis, the aligned dataset was subsequently uploaded to iTol (
https://itol.embl.de/personal_page.cgi) [
23].
Phytozome genomic and coding sequences (CDS) were used to map the BoBPC gene's intron/exon architecture. Using the default parameters, the BoBPC gene's structure was visualized and analysed via an online server accessible at
http://gsds.cbi.pku.edu.cn/. Using the MEME suite (
https://meme-suite.org/meme/) and NCBI (
https://www.ncbi.nlm.nih.gov/Structure/cdd/wrpsb.cgi) with default parameters, a comparative motif analysis of the BPC protein in
B. oleracea was conducted. The TBTool program was then used to integrate the hit-data, phytogenic data, and MEME-suite data in order to visualize motifs.
To ascertain the chromosomal location of genes, Phytozome and ProtParam were utilized, enabling the identification of genes based on their chromosome number and exact start and end positions. Using TBtools, the chromosomal lengths were extracted from the genome assembly. To simplify the visual evaluation of BPC genes in
B. oleracea, an inclusive chromosomal map was subsequently created using an online application (
http://mg2c.iask.in/mg2c_v2.0/) with default parameters [
24]. Ks and Ka values were utilized to evaluate the date of divergence within the BoBPC gene family, and Ka/Ks ratios were employed to calculate the rates of molecular evolution for every pair of paralogous genes. Assuming λ to be 6.96 × 10⁻⁹, the divergence time (T) was computed using the method T=Ks/2 [
25]. To create graphical representations for the synteny study, TBtools' Multiple Synteny Plot function was used. Using the TBtools Advanced Circos view module, a thorough circos map demonstrating the syntenic links between orthologous BPC genes in
B. oleracea was created [
26].
Molecular-level information from Arabidopsis.org was used to understand the roles and subcellular locations of the BoBPC genes. Furthermore, by examining the accessible datasets, the more comprehensive biological processes involving these genes were found. A static network graph for BoBPC genes was created using ShinyGO v0.741, which made it easier to see how genes overlap in different biological processes. This may comprehend the roles that various genes play in different biological processes and their functional interconnectedness
PlantCARE (
http://bioinformatics.psb.ugent.be/webtools/plantcare/html) was used to identify potential cis-acting elements (CREs) present in BoBPC genes by analyzing the 1.5 kb genomic sequences upstream of the initiation codon (ATG) of each gene [
27]. TBtools was used to map the particular values of the regulatory elements.
2.3. Expression Analysis
Analyzing the transcriptome involves studying each transcript of RNA found in various tissues. In order to validate their functional importance in response to growth stimulation and stress, BoBZR1 genes were analyzed in order to find out about their function in the synthesis of cuticular wax and their expression patterns in various tissues.
2.3.1. BoBZR1 Gene Expression in Nwgl Mutant vs. Wild-Type
Expression patterns in cabbage leaf samples from both a glossy mutant corresponding to wild-type were analyzed using high-throughput RNA sequencing data. Three replications of the experiment were carried out to ascertain the accuracy of the results. The subsequent analysis enabled the identification of the genes that were either elevated or downregulated in the nwgl mutant leaves relative to the wild-type.
2.3.2. Tissue-Specific Expression Patterns of BoBZR1 Genes
Differential expression analysis was conducted using RNA-Seq data from seven distinct B. oleracea tissues to identify genes potentially associated with plant developmental processes. To investigate variations in BoBZR1s, their expression levels were quantified in fragments per kilobase of transcript per million mapped reads (FPKM) across these seven distinct tissues.
3. Results
3.1. Identification of BoBPC Genes in B. oleracea and Their Localization
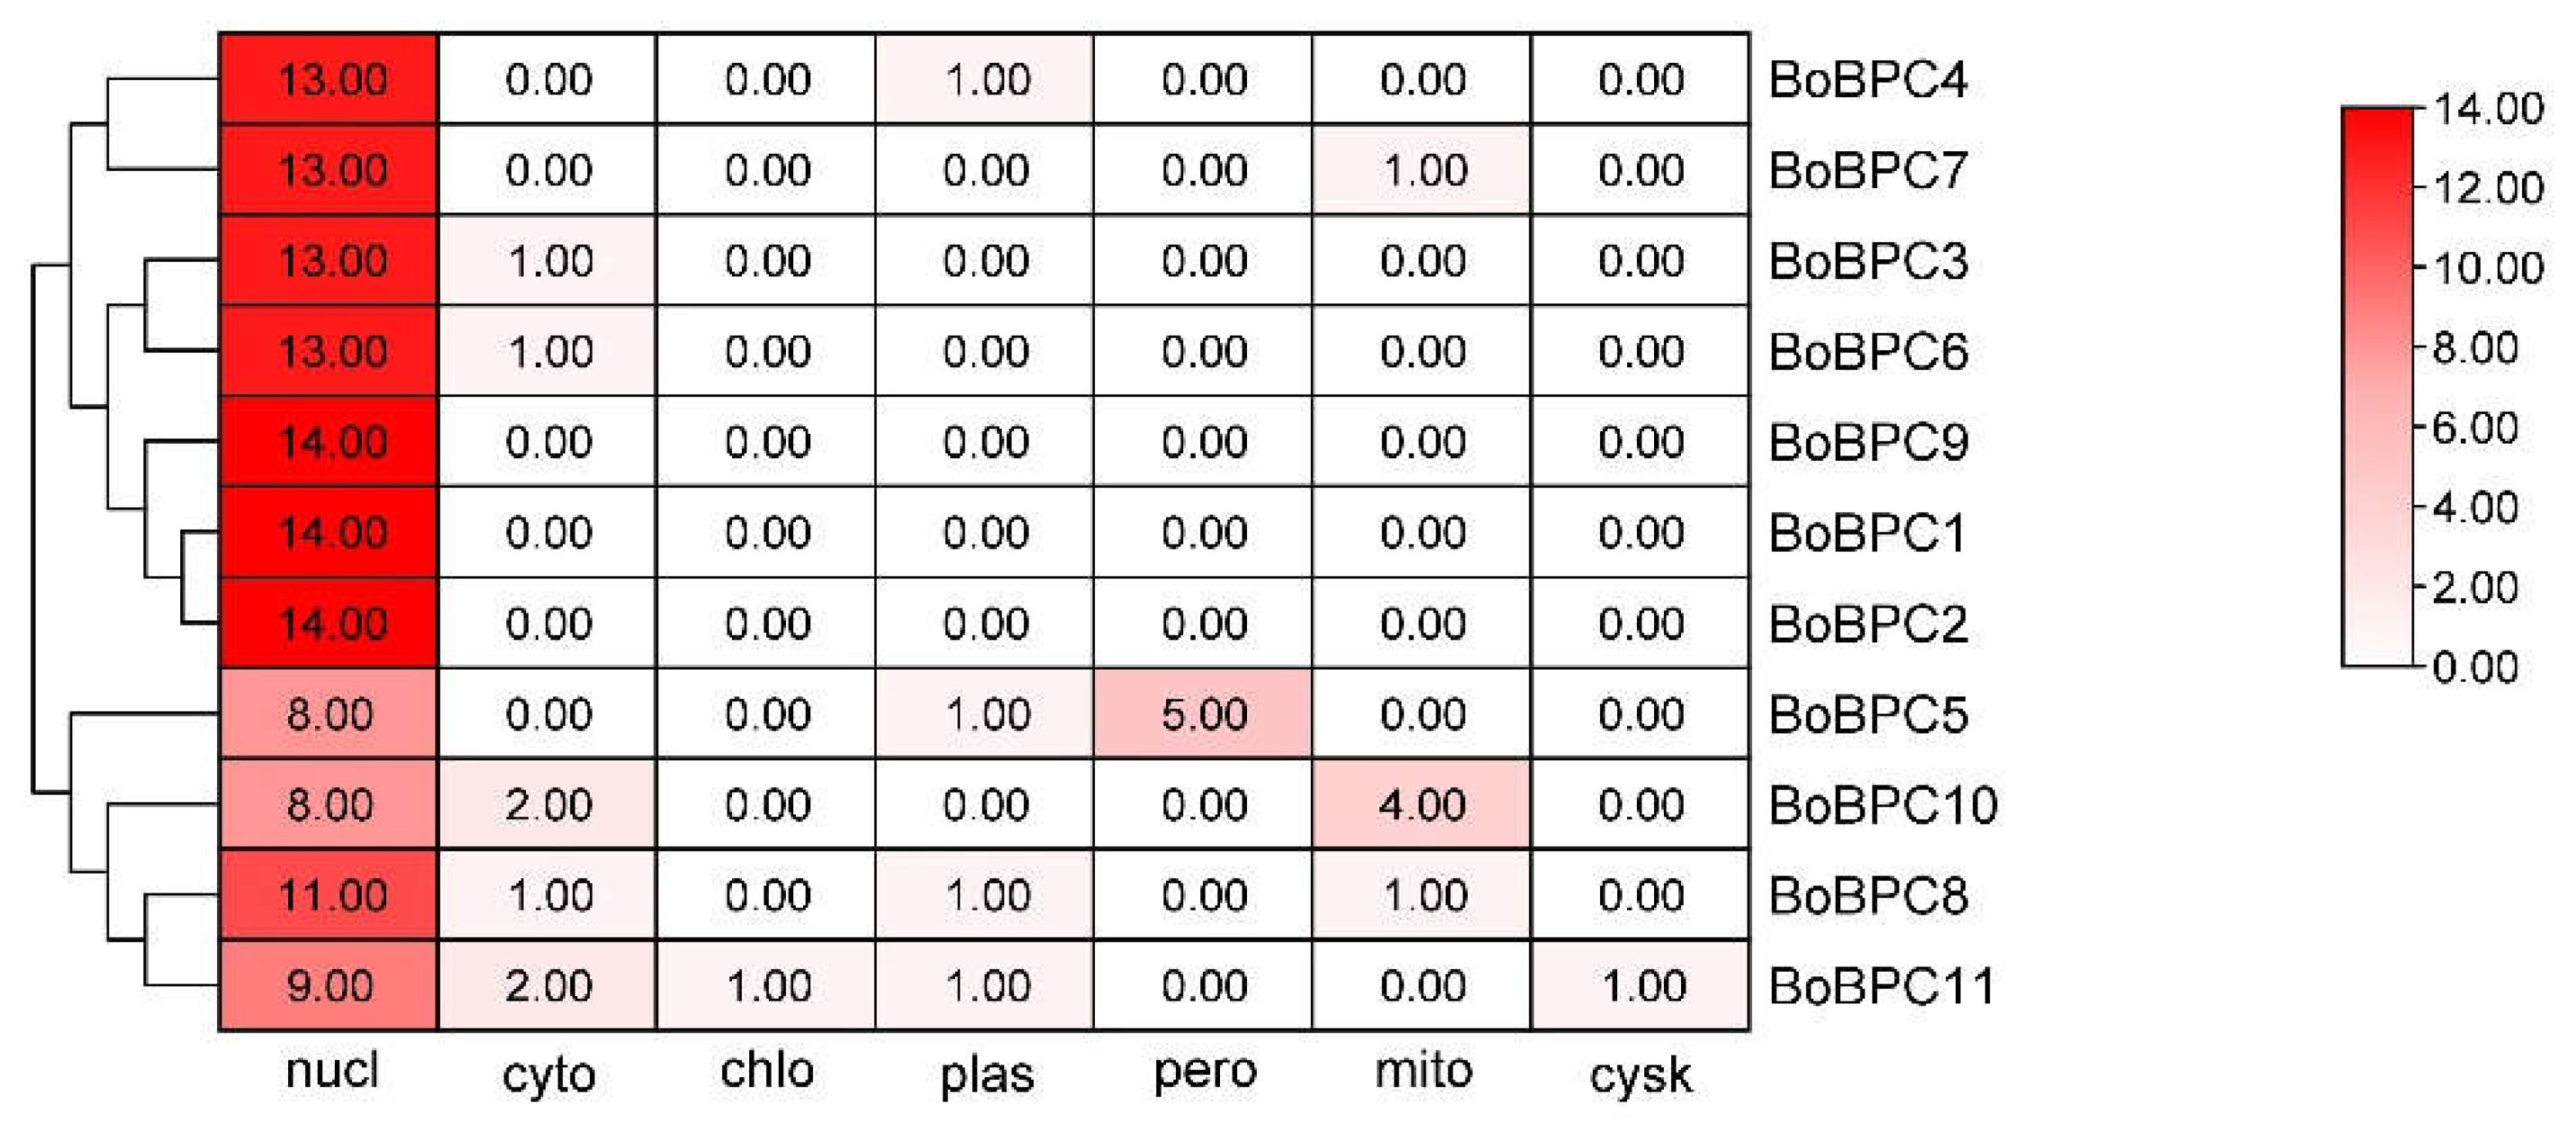
B. oleracea has 11 BPC genes in total, The isoelectric point (pI), molecular weight (MW), GRAVY score, instability index, and predicted subcellular localization of the BoBPC proteins, along with other physicochemical properties, are presented in (
Table 1) (
Figure 1). The encoding protein lengths range from 690 to 1833 amino acids and molecular weights range from 58.02 to 150.09 kDa. BoBPC5 was the smallest protein among them, while BoBPC11 was the longest. If a protein's instability index was 40 or above, it was deemed unstable; otherwise, it was regarded as stable. According to the grand average of hydropathy (GRAVY) scores, the majority of genes were mostly hydrophobic. These proteins' isoelectric point (pI) values varied from 4.9 to 5.11, meaning that within this pH range, they would not carry any overall electrical charge. Of the genes that were found, 36.36% had a forward orientation and the remaining 63.6% had a reverse orientation.
3.2. Exploration of Evolutionary Relationships, Structures, and Conserved Motifs of BoBPC Genes
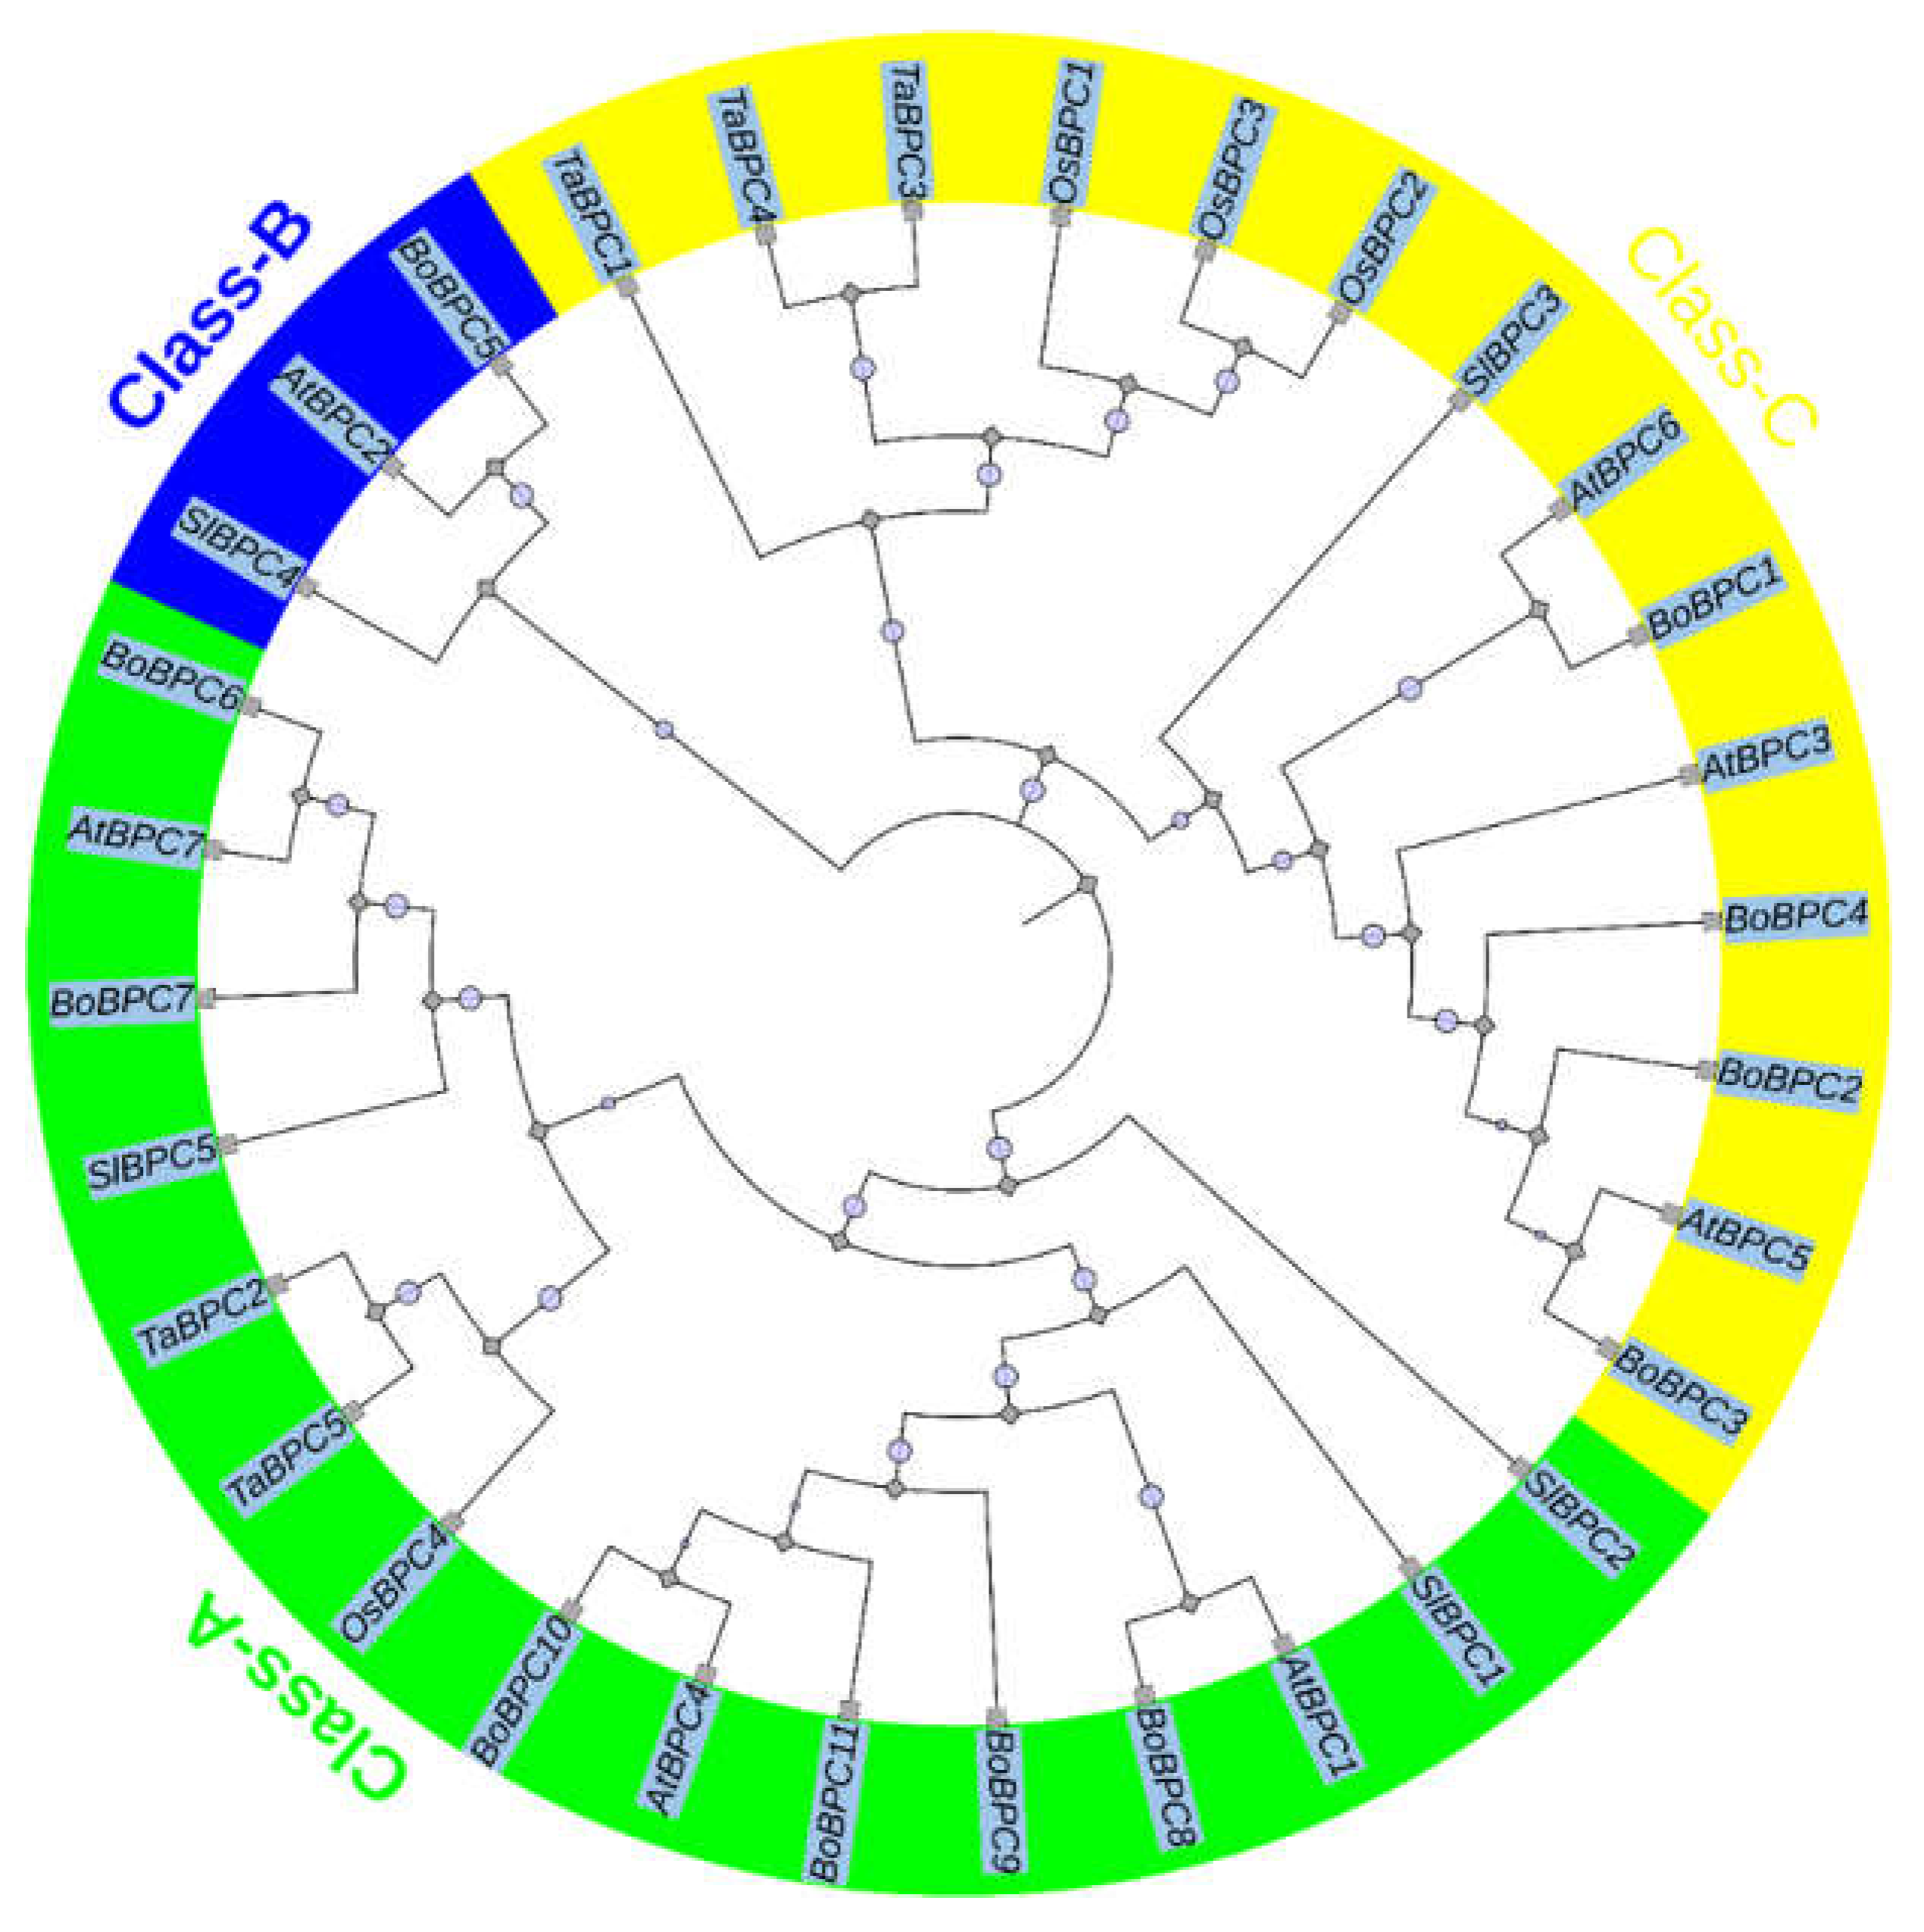
The phylogenetic analysis of BoBPC genes was conducted to assess their evolutionary relationships in comparison to BPC genes from potato and Arabidopsis (
Figure 2). Using the Neighbor-Joining (NJ) method within MEGA X v10.2.4 software, full-length protein sequences were aligned to construct a phylogenetic tree. The analysis revealed three discernible groups, classified as Class-A, Class-B, and Class-C. Among the analyzed BoBPC genes, BoBPC6, BoBPC7, BoBPC8, BoBPC10, and BoBPC11 were assigned to Class-A, while BoBPC5 was categorized under Class-B. This classification indicates that BoBPC6, BoBPC7, BoBPC8, BoBPC10, and BoBPC11 share evolutionary affinities with other members of Class-A, whereas BoBPC5 exhibits closer evolutionary relationships with Class-B genes. Within the dataset, there were 15 BPC genes classified under Class-A, 3 under Class-B, and 14 under Class-C.
The arrangement of a gene's exons and introns, which are the gene's structural components, can significantly affect how the gene acts [
28]. Gene functions vary depending on how these building blocks are combined [
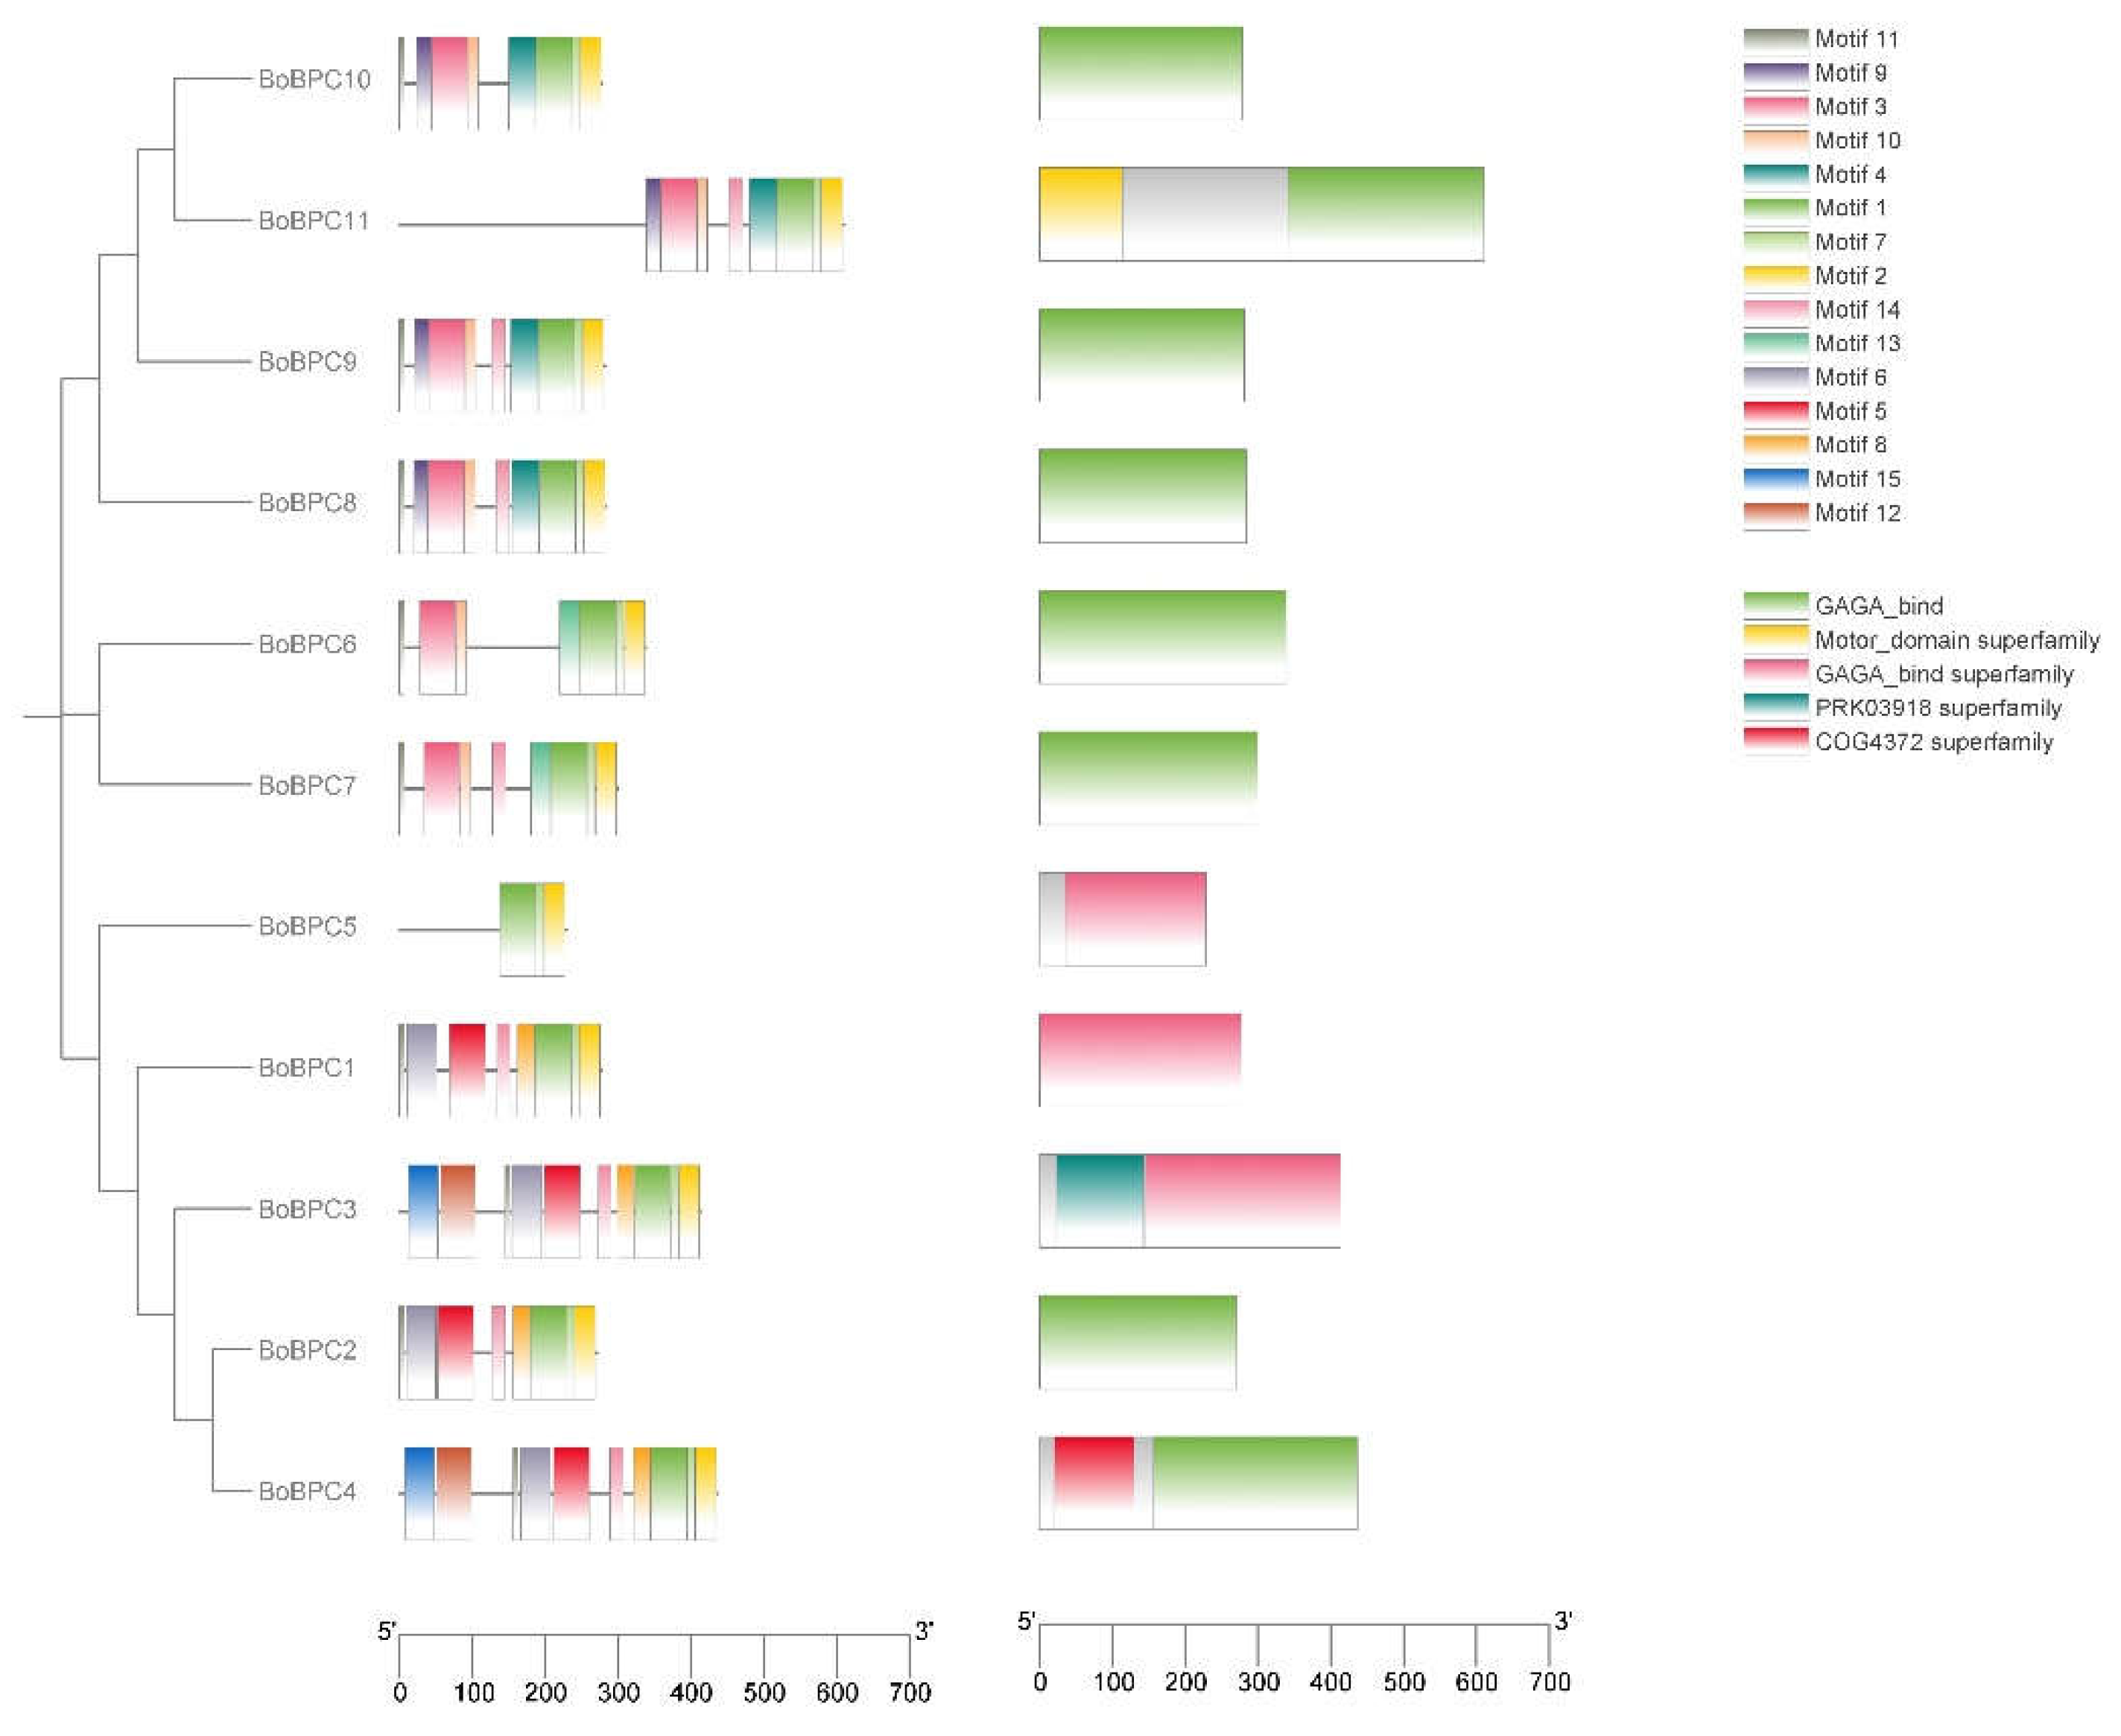
29]. Gene's function is determined by the arrangement of its exons and introns. Seven of the eleven genes that were examined each exhibited a consistent structure made up of one intron and two exons (
Figure 3). Two genes included just exons, whereas one gene contained three introns and four exons. A common ancestor and similar structural and functional traits between these genes are suggested by the observed pattern of shared exons and introns. According to the genomic architecture, BoBPC1 had three introns, BoBPC1 and BoBPC5 had none, and BoBPC2, BoBPC3, BoBPC4, BoBPC6, BoBPC7, BoBPC8, BoBPC9, and BoBPC10 each included one intron. These results show that the presence of introns was very consistent throughout these genes.
By examining the distribution of motifs within the
B. oleracea BPC genes, the functional characteristics of these genes were examined. 15 different motifs in the BoBPC proteins were found using the MEME program (
Figure 4). The results demonstrated that Motifs 1 and 2 were shared by all BoBPC genes. Furthermore, Motif 15 was exclusive to BoBPC3 and BoBPC4. Gene expansion may have influenced the evolutionary history of the BPC protein family members due to the conservation of comparable motifs among them.
3.3. Genomic Localization and Duplication Analysis of BoBPC Genes
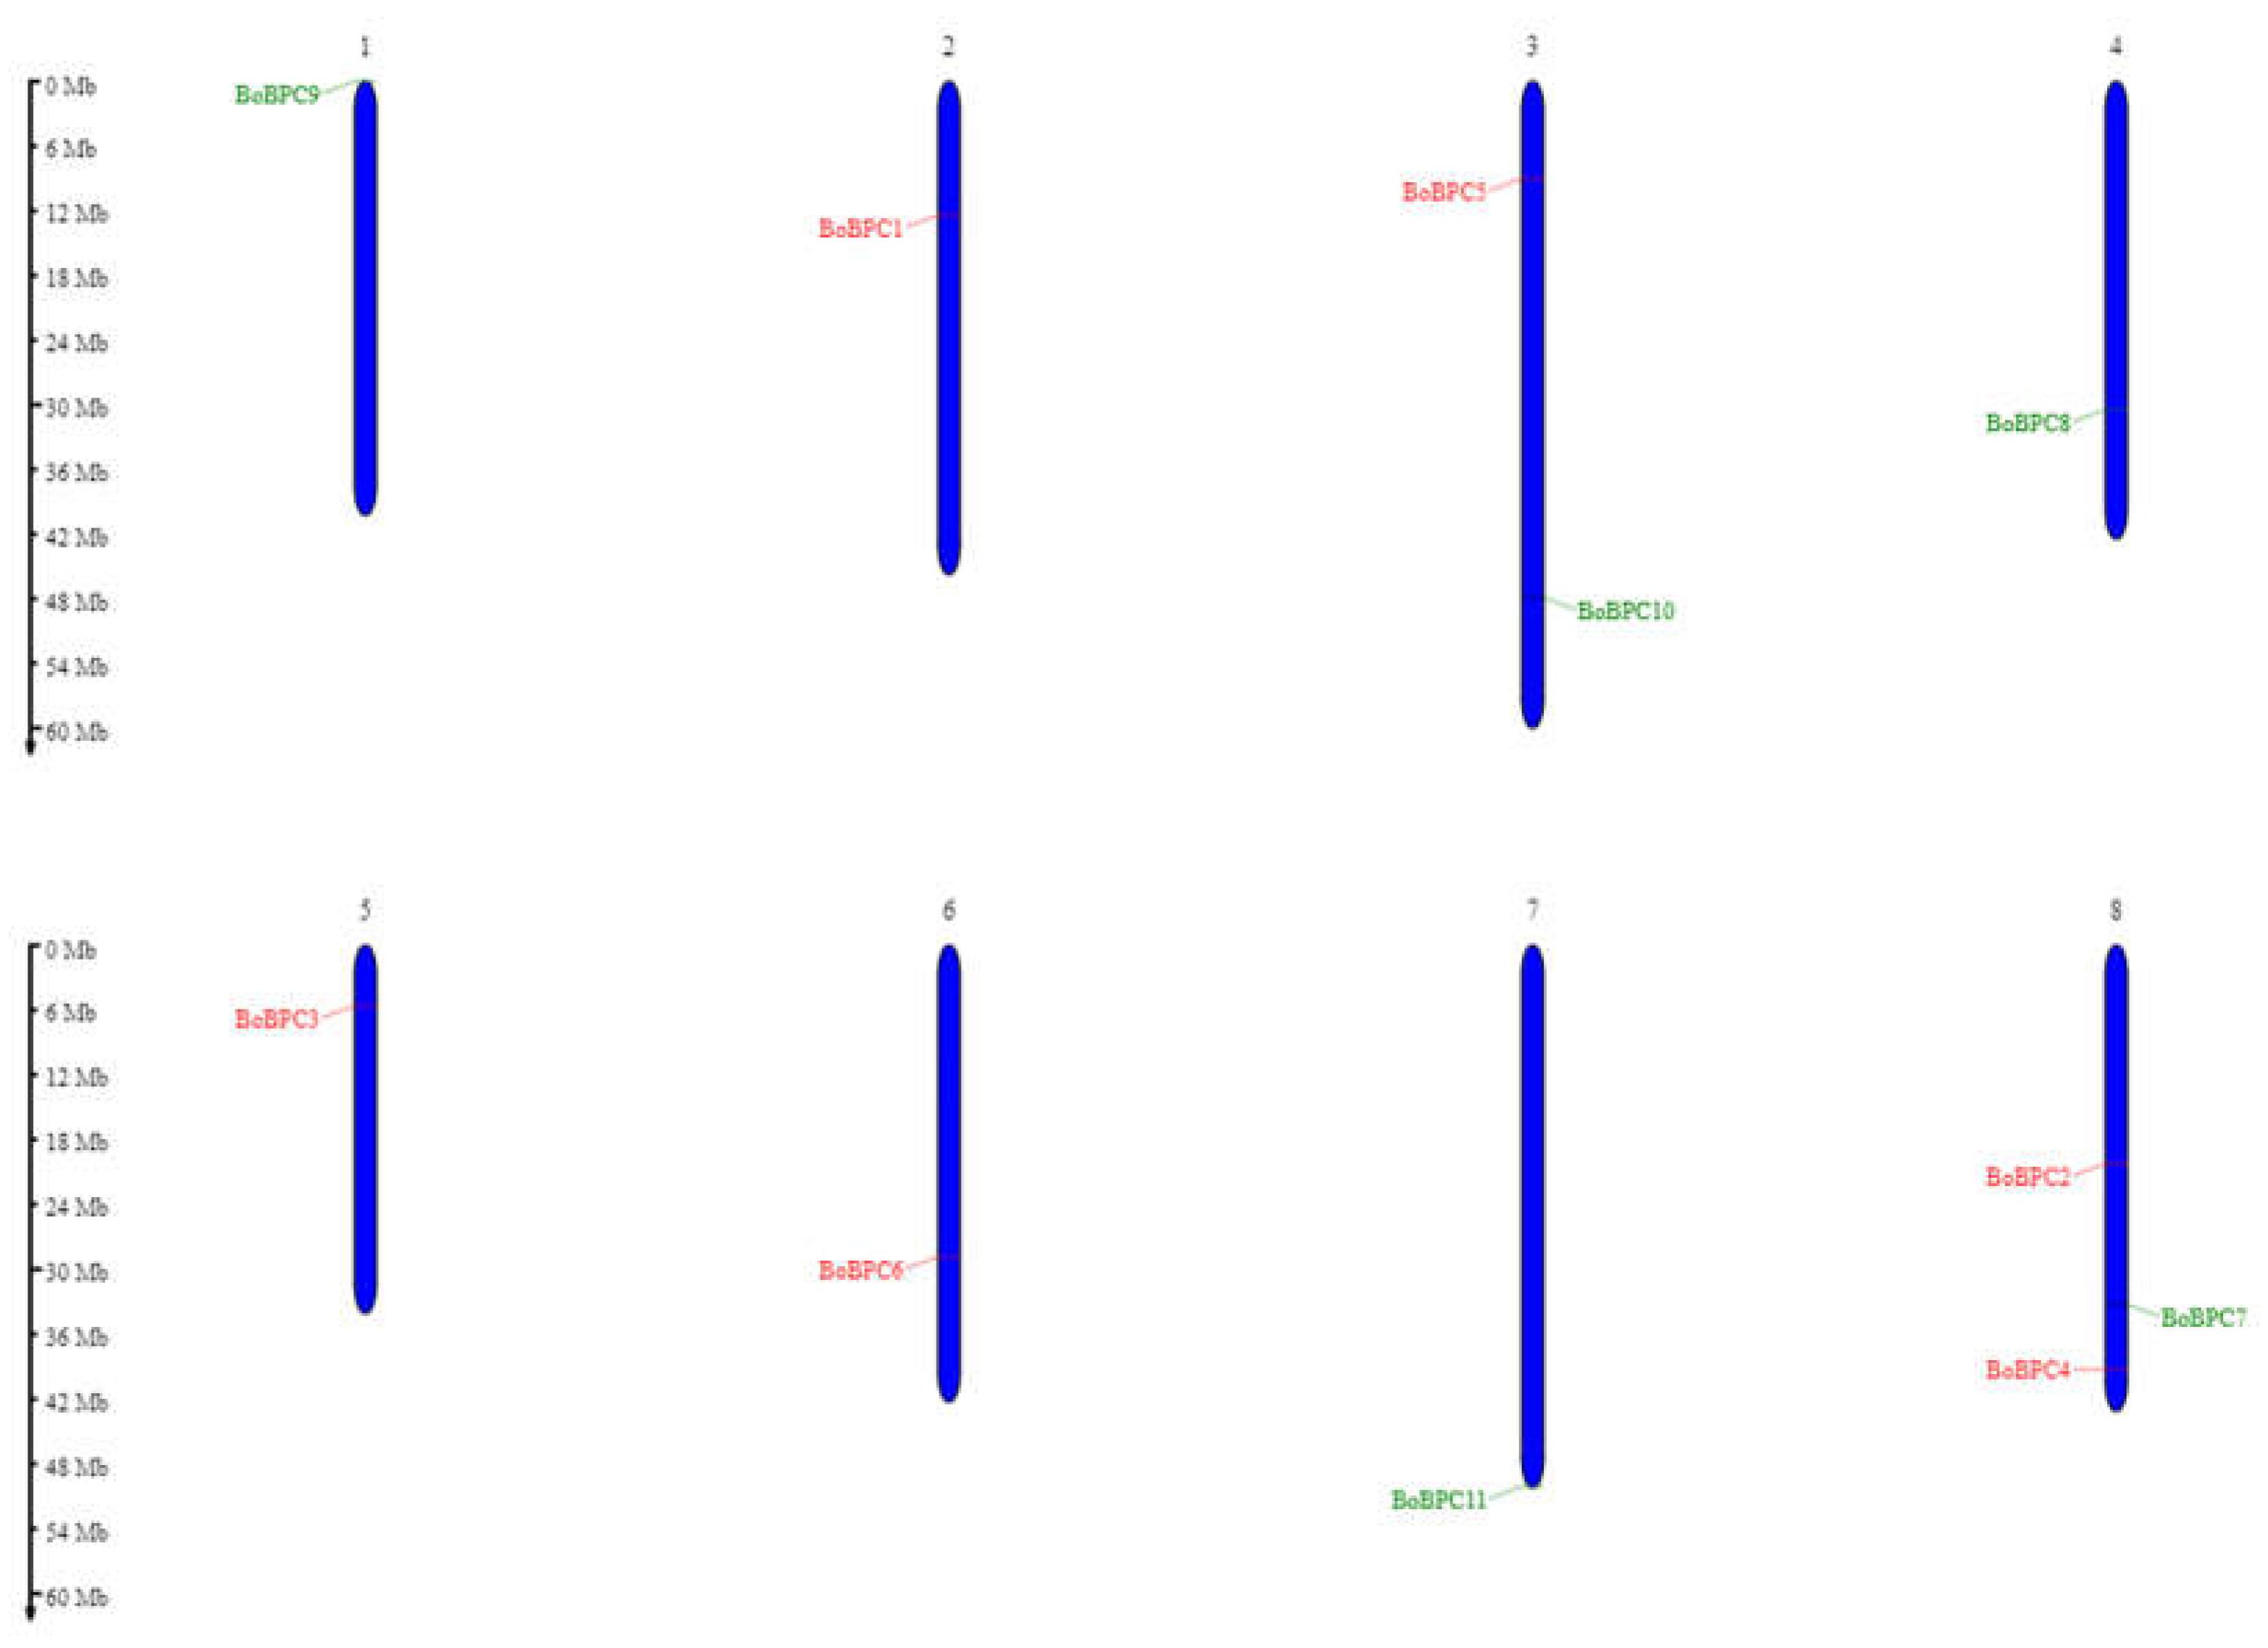
The analysis of chromosomal distribution in BoBPC genes revealed their presence across eight out of nine chromosomes in
B. oleracea, designated as chromosomes 1-8 (
Figure 5). The highest concentration was observed on chromosome 8, with three BPC genes: BoBPC2, BoBPC4, and BoBPC7. Chromosome 3 contained BoBPC5 and BoBPC10, while the rest of the chromosomes each contained a single BoBPC gene.
To unravel the evolutionary trajectory of the BoBPC gene family, syntenic analysis to explore their relationships with genes in
Arabidopsis thaliana and
Solanum tuberosum (
Figure 6). This analysis unveiled several BoBPC genes in
B. oleracea that showed orthologous relationships with genes in both
A. thaliana and
S. tuberosum, as evidenced by collinearity analysis. The analysis revealed that nine out of the eleven BoBPC genes (81.8%) displayed syntenic relationships with BPC genes found in other species. Specifically, Arabidopsis and potato exhibited one to several copies of genes that were orthologous to BoBPC genes. Notably, five BoBPC genes showed collinearity with potato genes, while nine BoBPC genes exhibited collinearity with Arabidopsis genes.
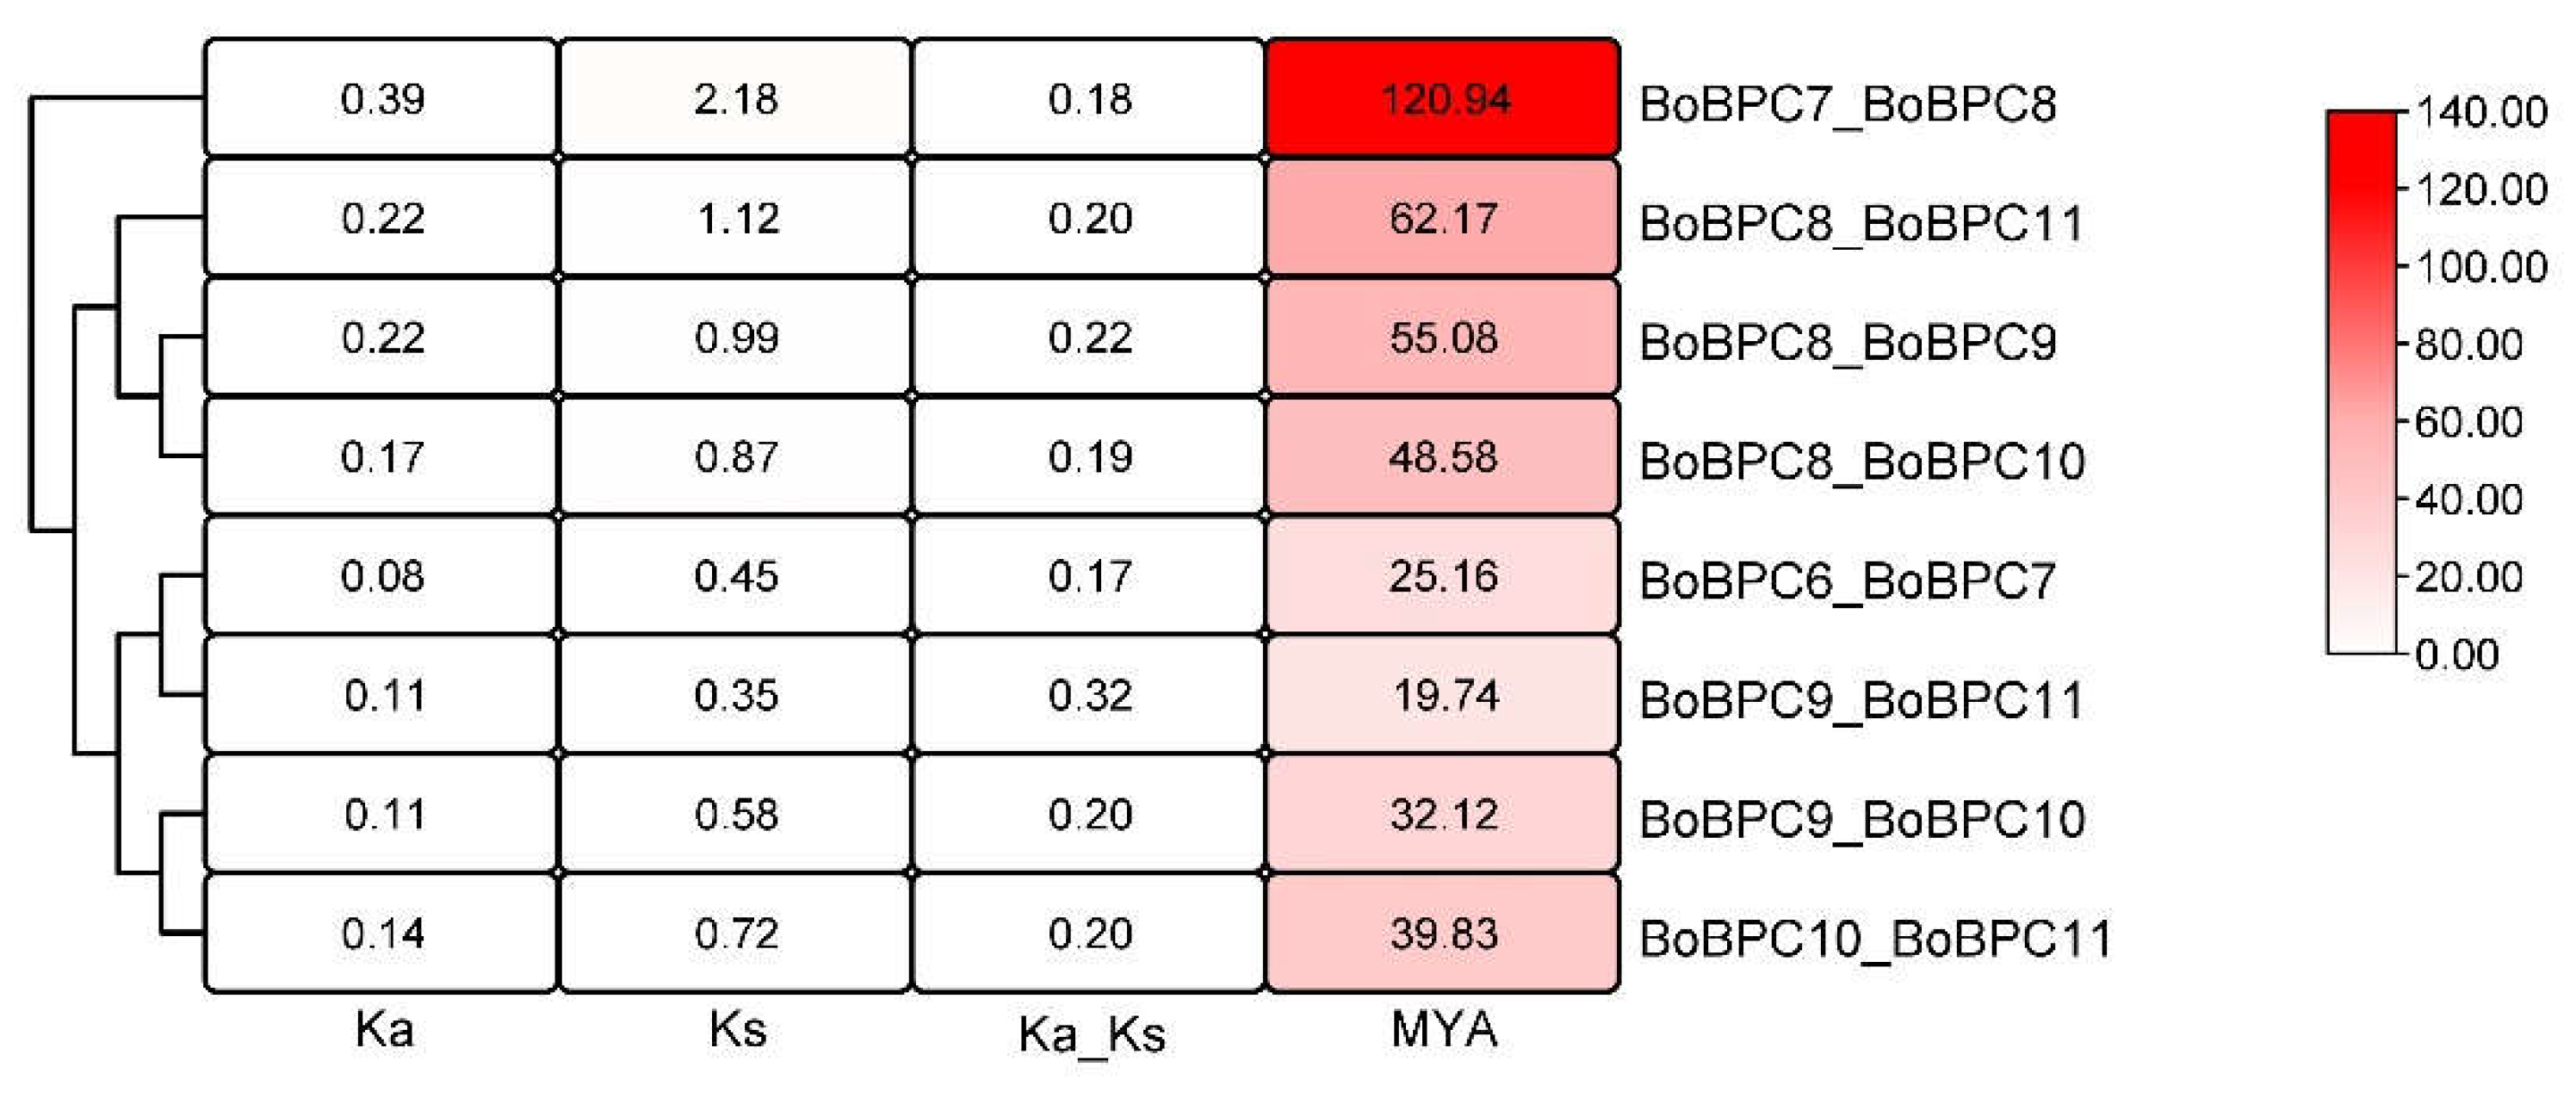
Using a basic Ka/Ks calculator in TBtools, the Ks, Ka, and Ka/Ks ratio values of BoBPC gene pairs were acquired (
Figure 7). In contrast to Ka, which shows the number of nonsynonymous substitutions per nonsynonymous site, Ks denotes the number of synonymous substitutions per synonymous site. The Ka/Ks ratio reflects the ratio of nonsynonymous (Ka) to synonymous (Ks) mutations, providing insight into selective pressures acting on the genes. Across the analyzed pairs, the Ka/Ks ratio ranged from 0.17 in the BoBPC6_BoBPC7 pair to 0.32 in the BoBPC9_BoBPC11 pair. Notably, all four paralogous pairs in
B. oleracea exhibited Ka/Ks ratios below 1. This observation suggests the likelihood of limited functional divergence during the duplication process, likely due to the prevalence of purifying selection.
3.4. BoBPC Orthologs Identification
Utilizing characterized orthologs for functional prediction of genes is a common practice in computational biology. Orthologous proteins, found in different species, often perform similar biological functions [
30]. This observation underscores the utility of orthology-based methods in predicting gene functions. BoBPC1 exhibited the highest percentage of homology with AtBPC6. AtBPC6 was detected to be expressed in various plant structures including collective leaf structure, flower, plant embryo, root, seed, and sepal (
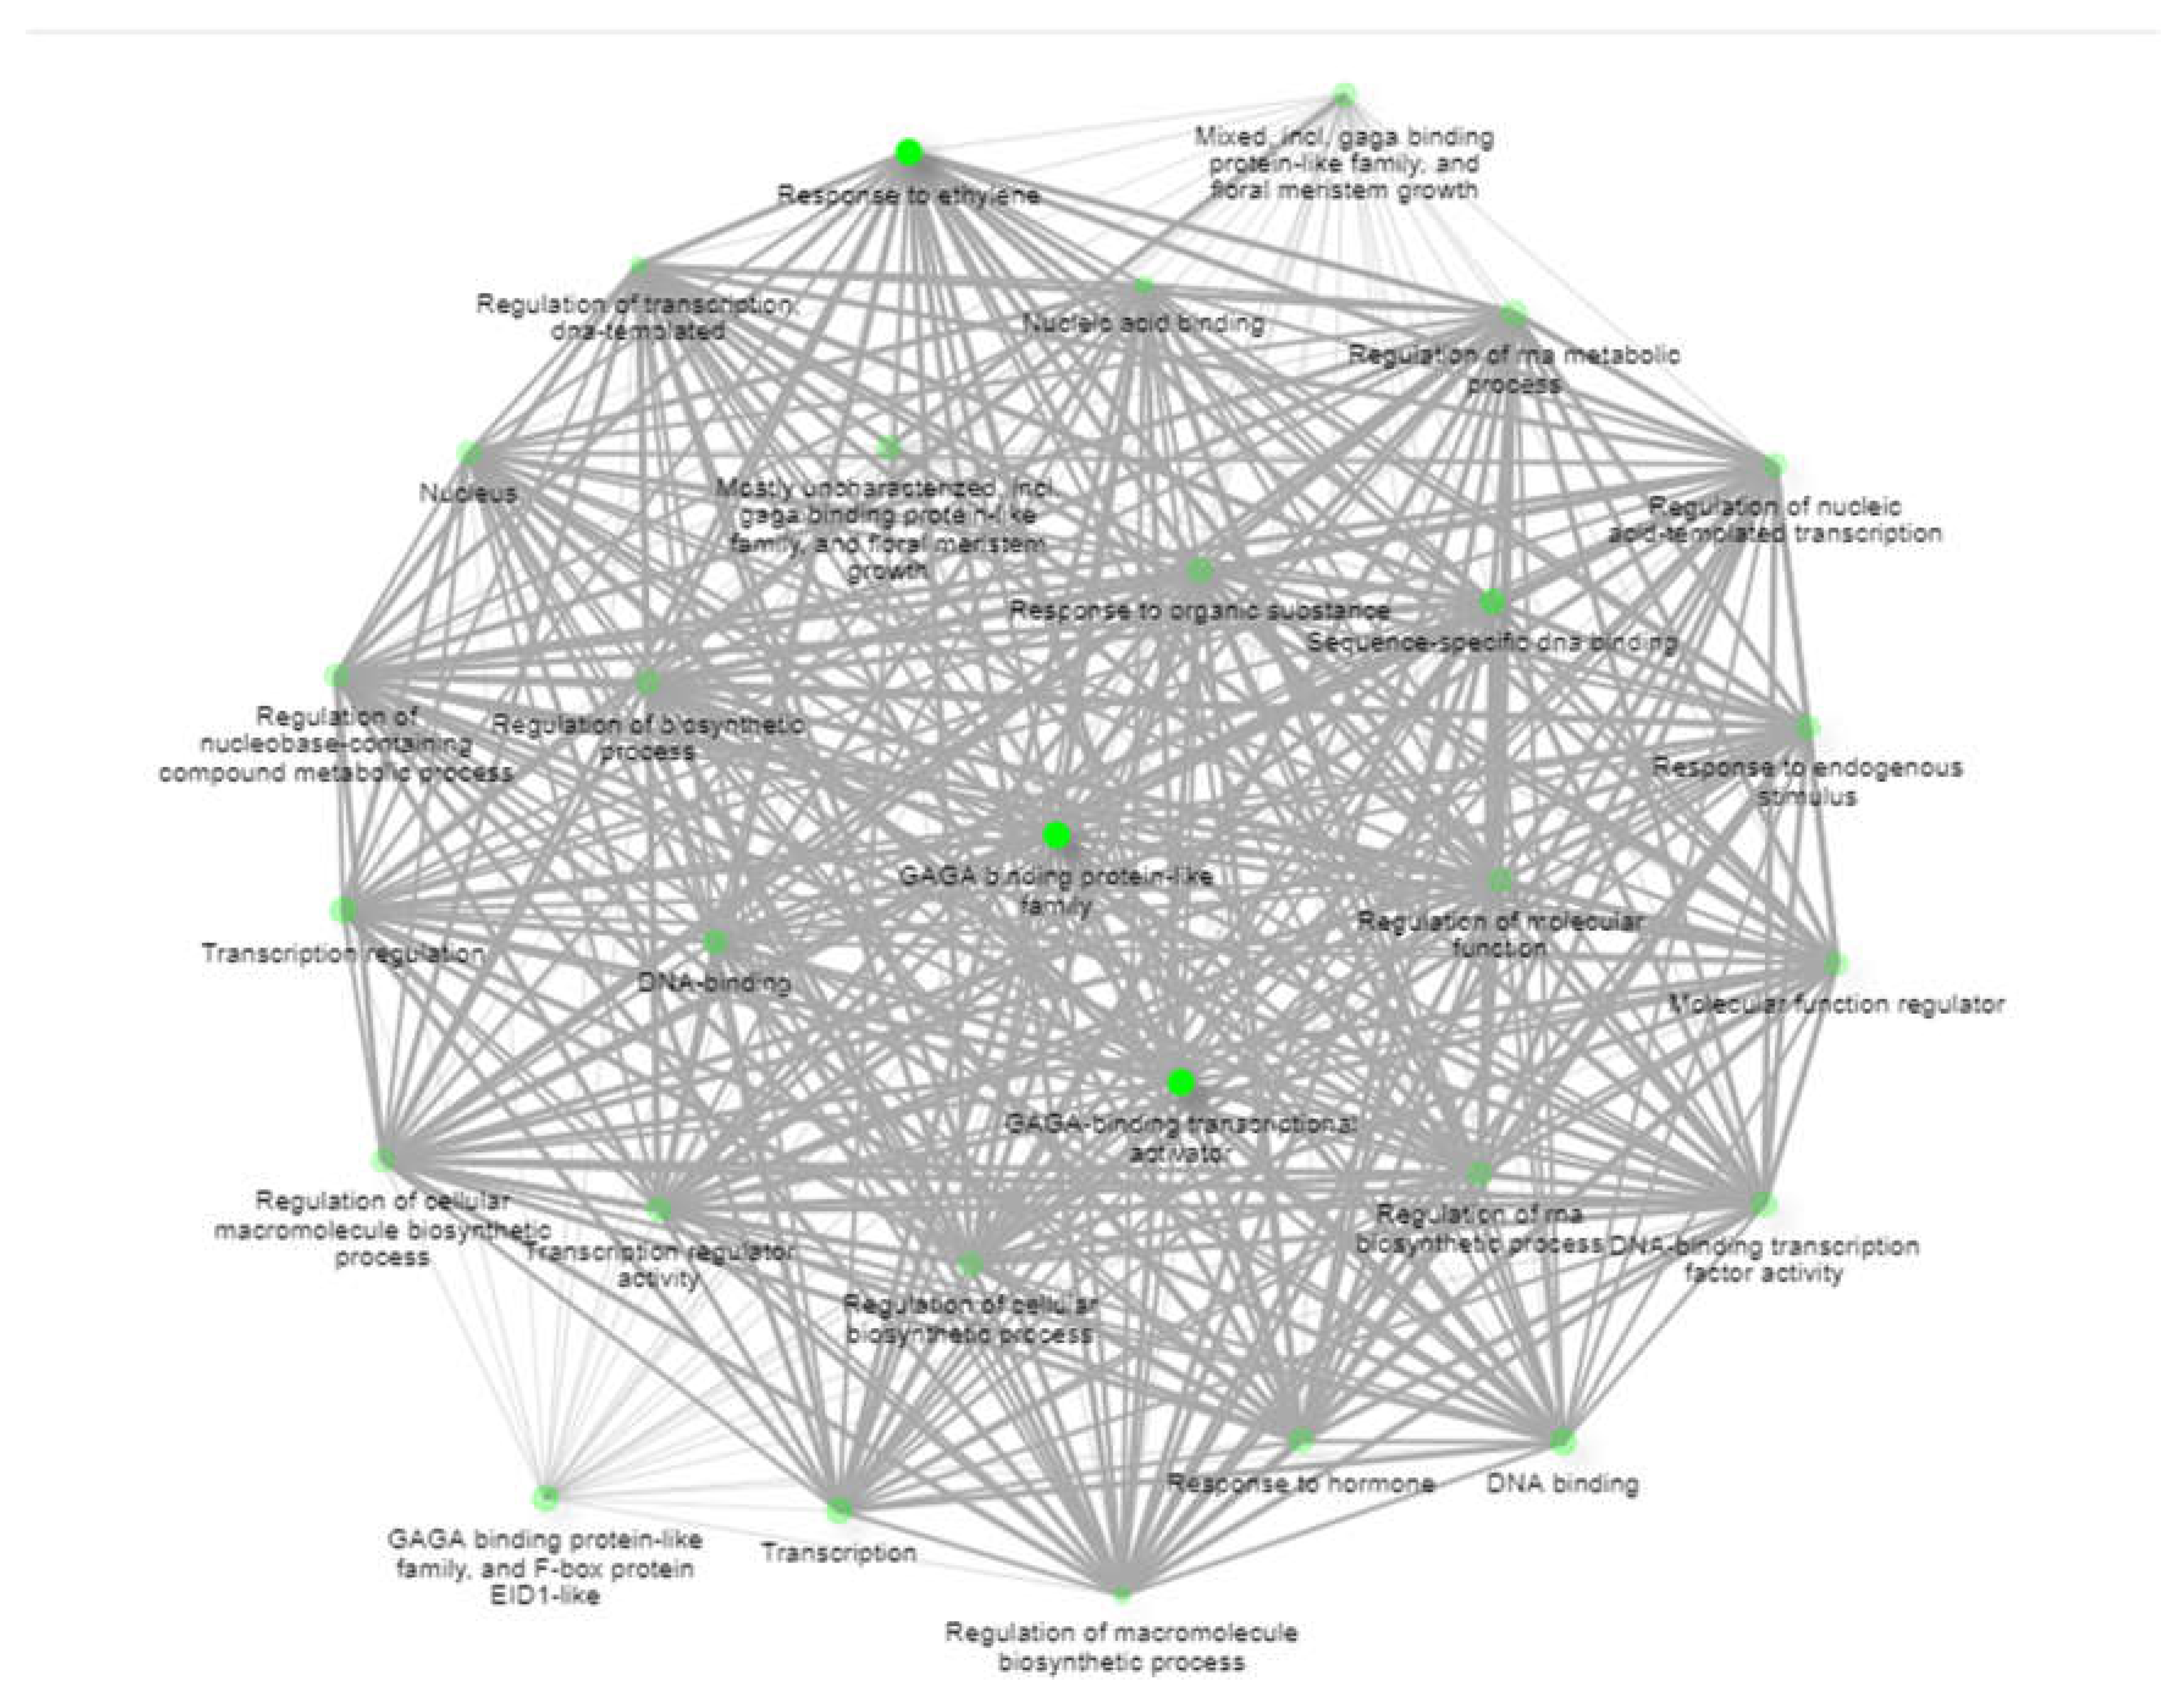
Table 2). Its molecular functions include DNA binding and transcription corepressor binding. BoBPC2, BoBPC3, and BoBPC4 exhibited the highest percentage of homology with AtBPC5, which has previously been observed to be expressed in cauline leaf, cotyledon, flower, guard cell, hypocotyl, and inflorescence meristem during various developmental stages. AtBPC5 is known to play a role in DNA binding and cis-regulatory region sequence-specific DNA binding. BoBPC5 displayed the highest percentage of homology with AtBPC2, and BoBPC8 homology percentage with AtBPC1 was the most significant. Both have been observed to be expressed in various developmental stages in different plant structures such as flower, inflorescence meristem, petal, plant embryo, and plant sperm. Additionally, AtBPC2 is known to be involved in DNA binding. BoBPC6 and BoBPC7 exhibited the highest percentage of homology with AtBPC7, while BoBPC9, BoBPC10, and BoBPC11 showed the highest homology with AtBPC4. These genes were found to be expressed in various plant structures including carpel, cauline leaf, flower pedicel, guard cell, leaf apex, and leaf lamina. Additionally, they are associated with molecular functions such as DNA binding and transcription cis-regulatory region binding. Additionally, ShinyGO v0.741 was employed to generate a static network graph for BoBPC genes (
Figure 8). This tool helps visualize overlaps and interactions among genes within various biological processes, enhancing the understanding of their collective functions and roles in the organism.
3.5. Analysis of CREs in BoBPC Genes
Genes' spatiotemporal transcriptomic expression is greatly influenced by the configuration of cis-regulatory elements, which operate as binding sites for transcription factors, within the promoter region [
31]. Using the PlantCare database, an in-silico study was carried out to evaluate the possible roles of the BoBPC genes (
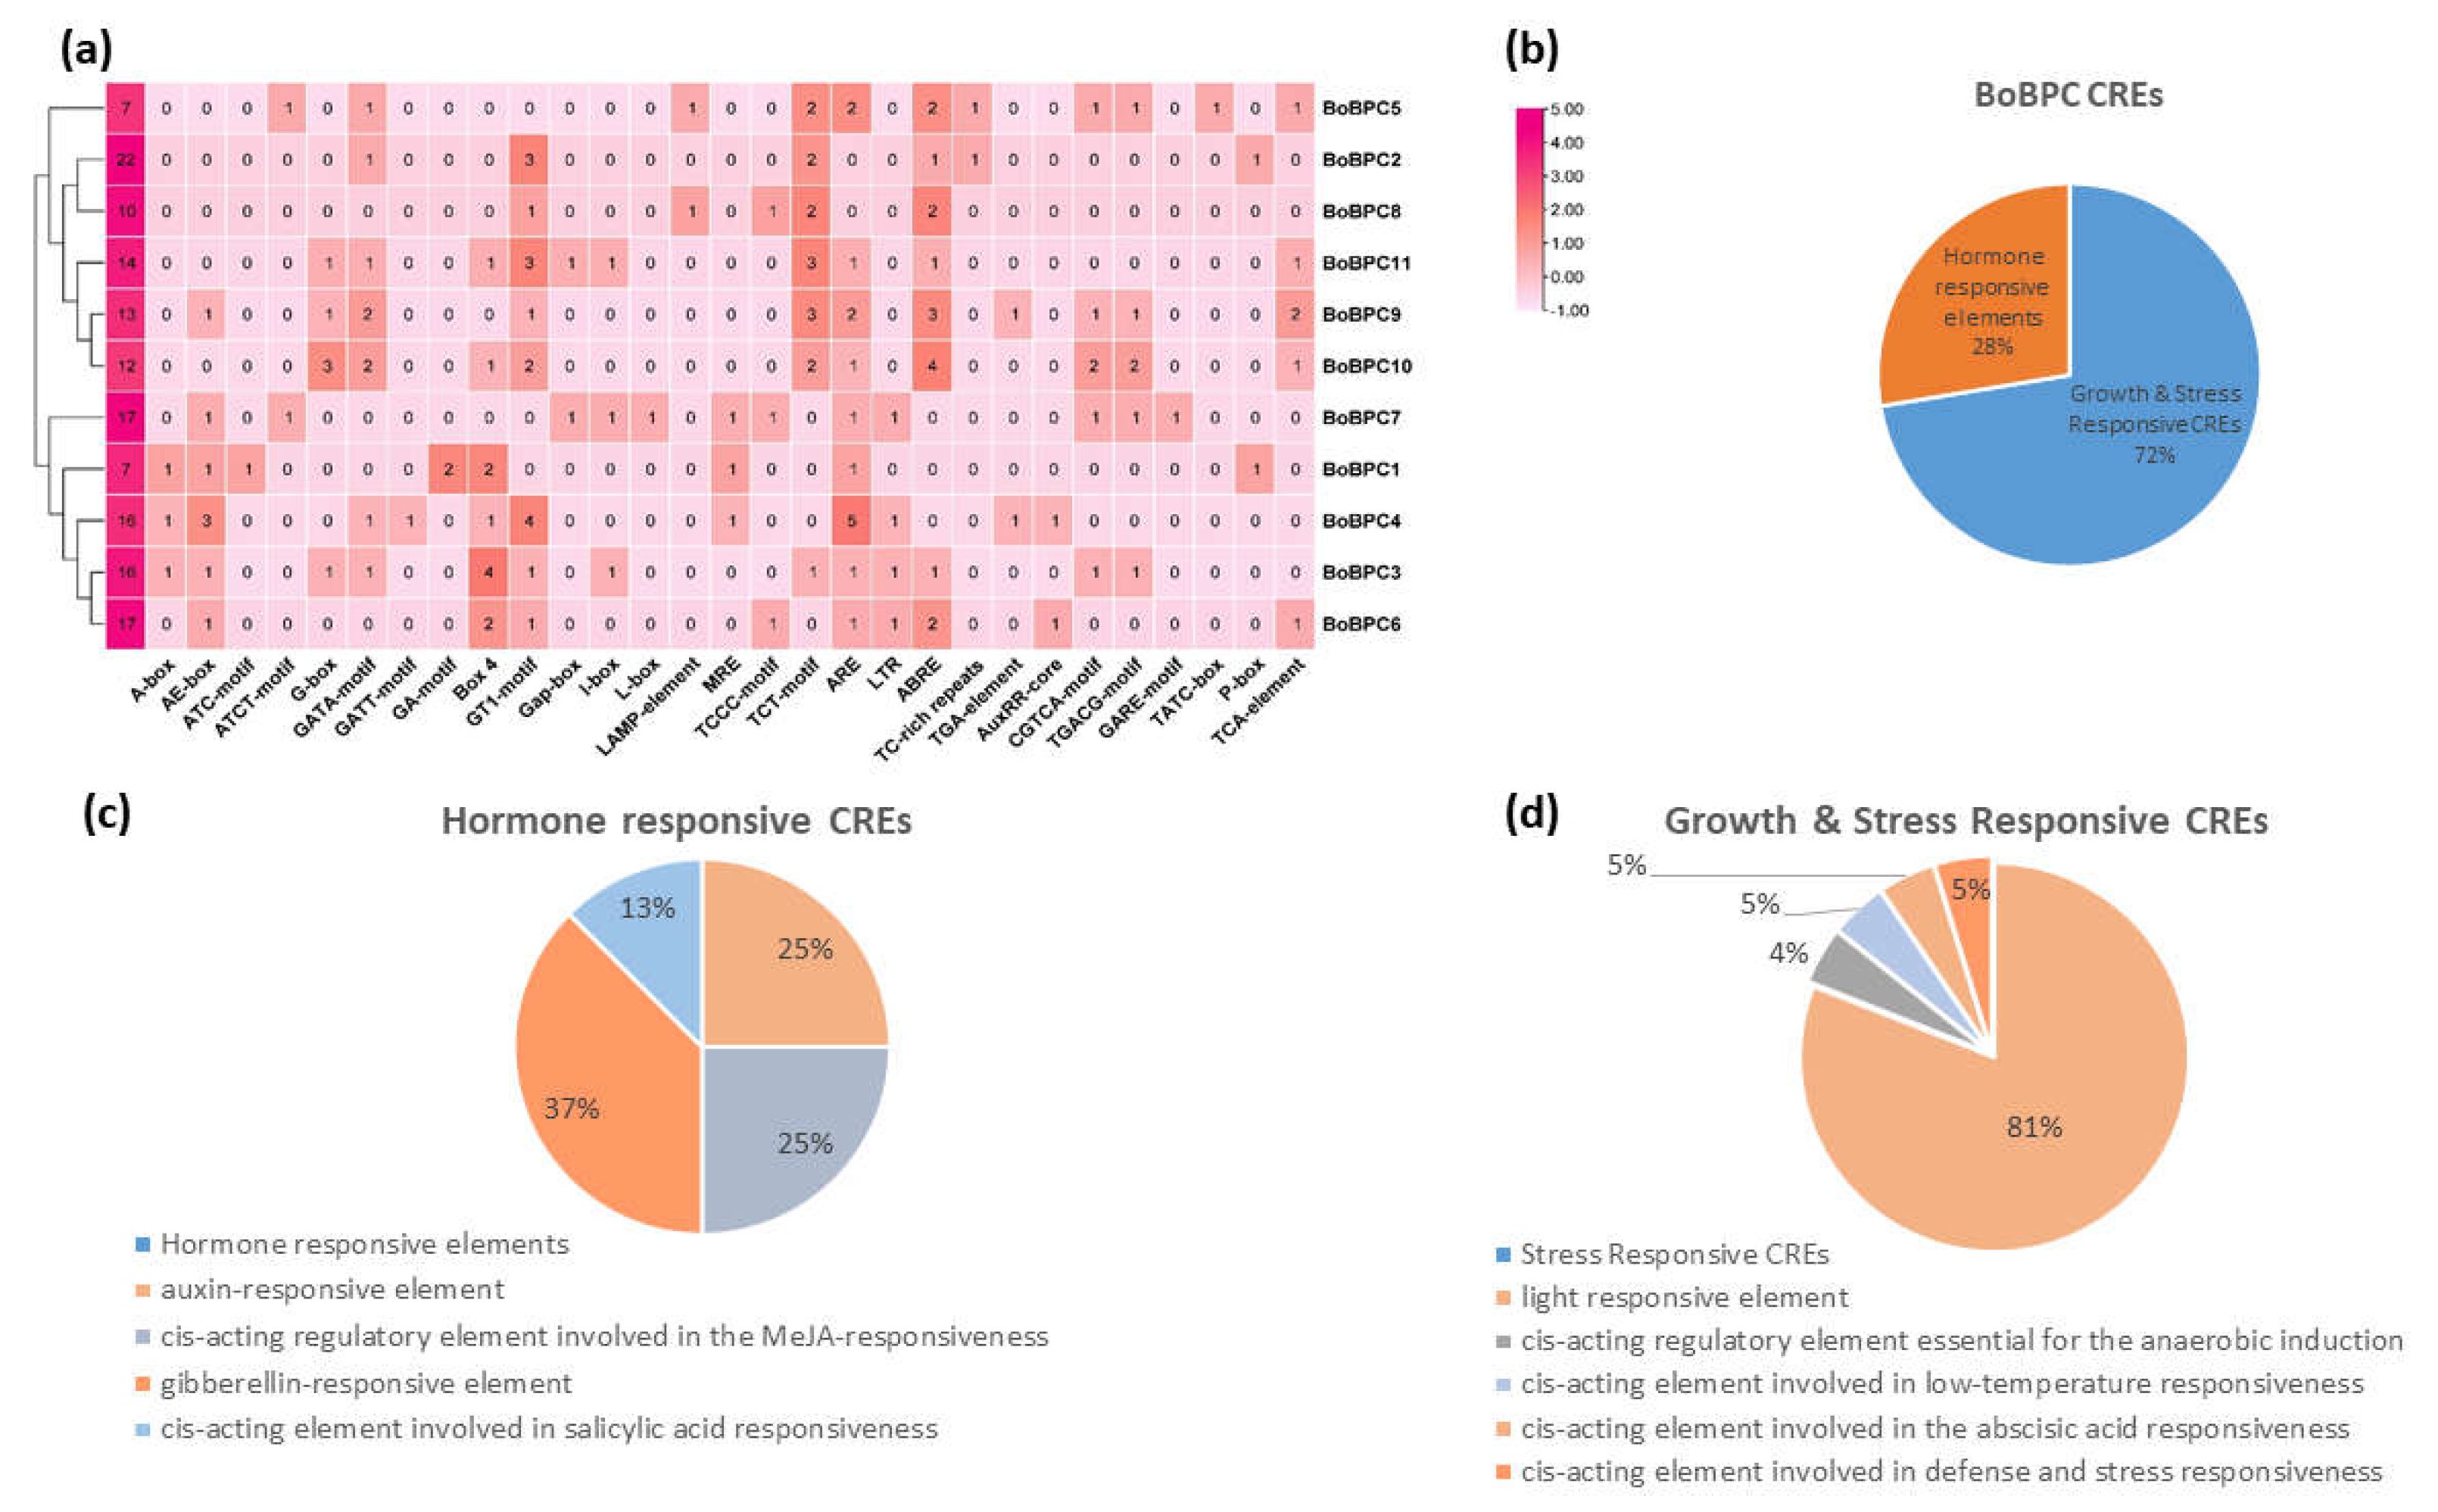
Figure 9). The BoBPC genes contain cis-regulatory regions relevant to growth, stress, and defense, as well as hormones. These results suggest that a wide variety of cis-regulatory elements (CREs) that may be involved in gene regulation are included in promoter regions. A broad spectrum of functions, including defense and stress response, anaerobic induction, endosperm expression, drought and light responsiveness, salicylic acid (SA), methyl jasmonate, auxin, gibberellic acid, cell regulation, and low temperature, were identified by the analysis of CREs found within the BoBPC promoter. The promoter regions of all BcBPC genes were found to contain abiotic stress-responsive cis-regulatory elements (CREs), defense- and stress-responsive CREs, low-temperature CREs, and drought-inducible CREs. Specifically, the analysis revealed that 72% of the CREs were stress & growth-responsive, while the remaining 28% were hormone-responsive.
Figure 8.
BoBPC genes CREs associated with hormones, growth and stress responsiveness.
Figure 8.
BoBPC genes CREs associated with hormones, growth and stress responsiveness.
3.6. BoBPC Genes Expression Analysis
3.6.1. The Expression of BoBZR1 Genes Correlates with Cuticular Wax Biosynthesis
This study involved the cultivation and comparative investigation of two types of Brassica oleracea: the glossy mutant (nwgl) and the wild-type [
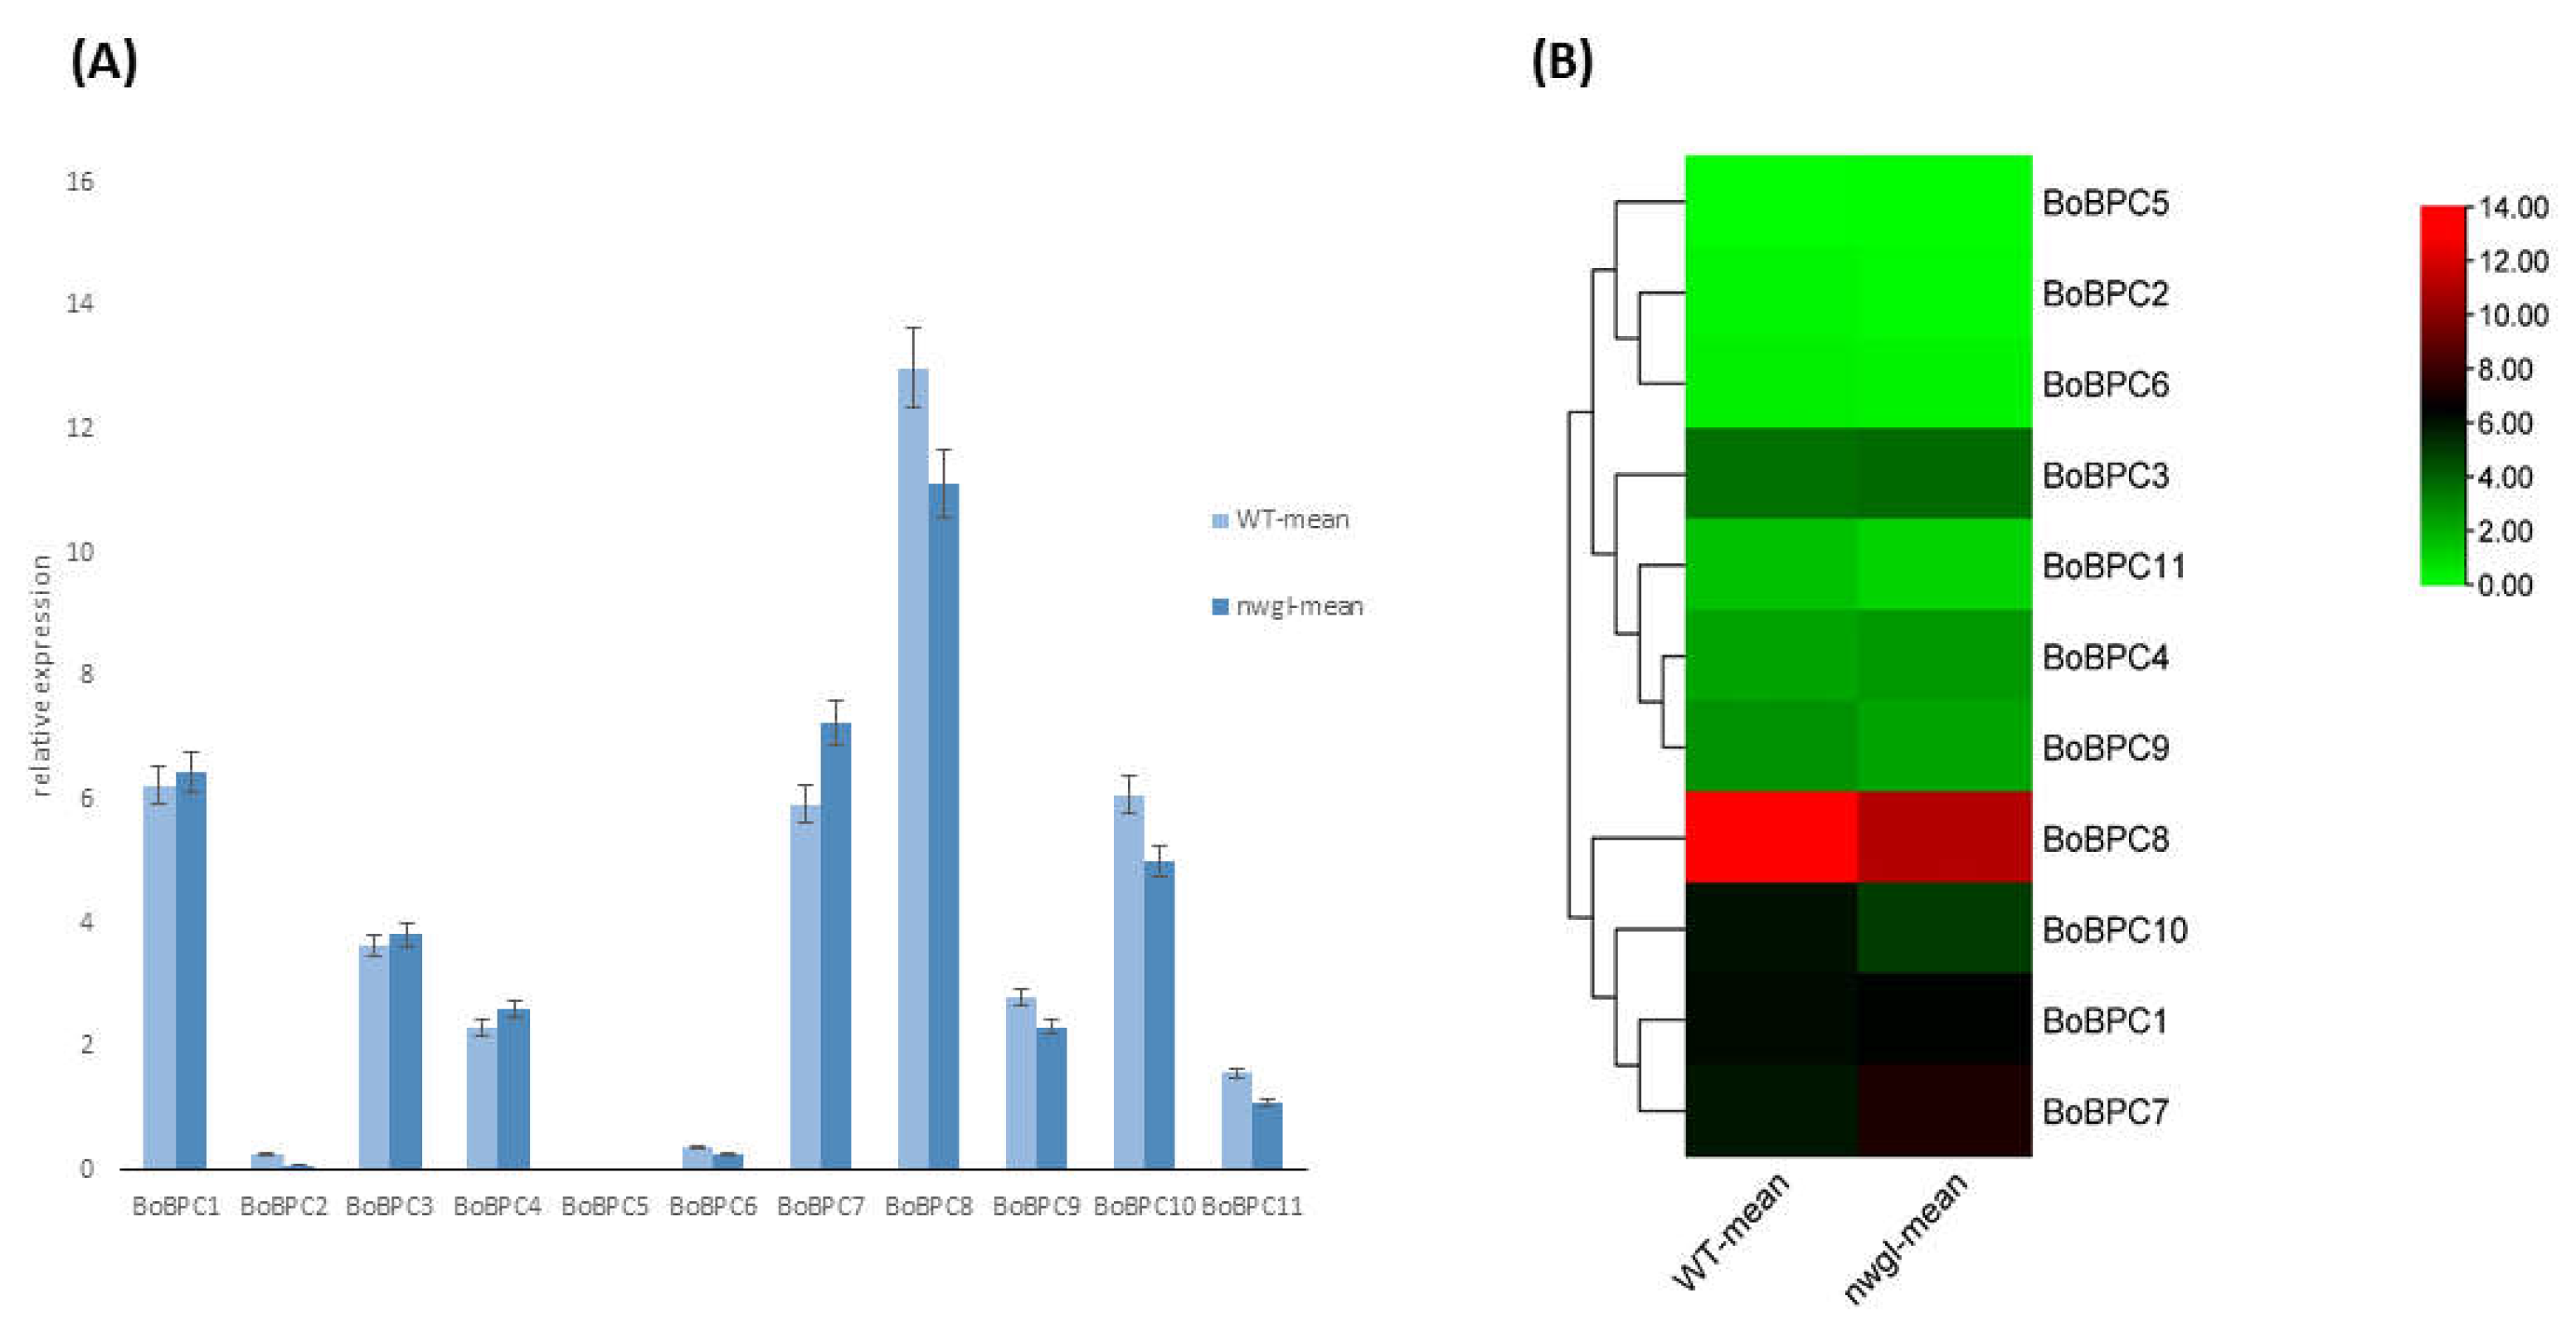
32]. In order to assess the differences in gene expression between the two types, p-values and log2fold change calculations were performed. The genes BoBPC1, BoBPC3, BoBPC4, and BoBPC7 showed overexpression from the wild-type to glossy mutant types, whereas the expression of other genes showed downregulation (
Figure 9). The gene BoBPC7 depicted maximum upregulation while BoBPC8 depicted maximum downregulation from wild to mutant variety.
Figure 9.
BoBPC genes expression in B. oleracea towards cuticular wax development.
Figure 9.
BoBPC genes expression in B. oleracea towards cuticular wax development.
3.6.2. BoBPC Genes Expression in Various Tissues
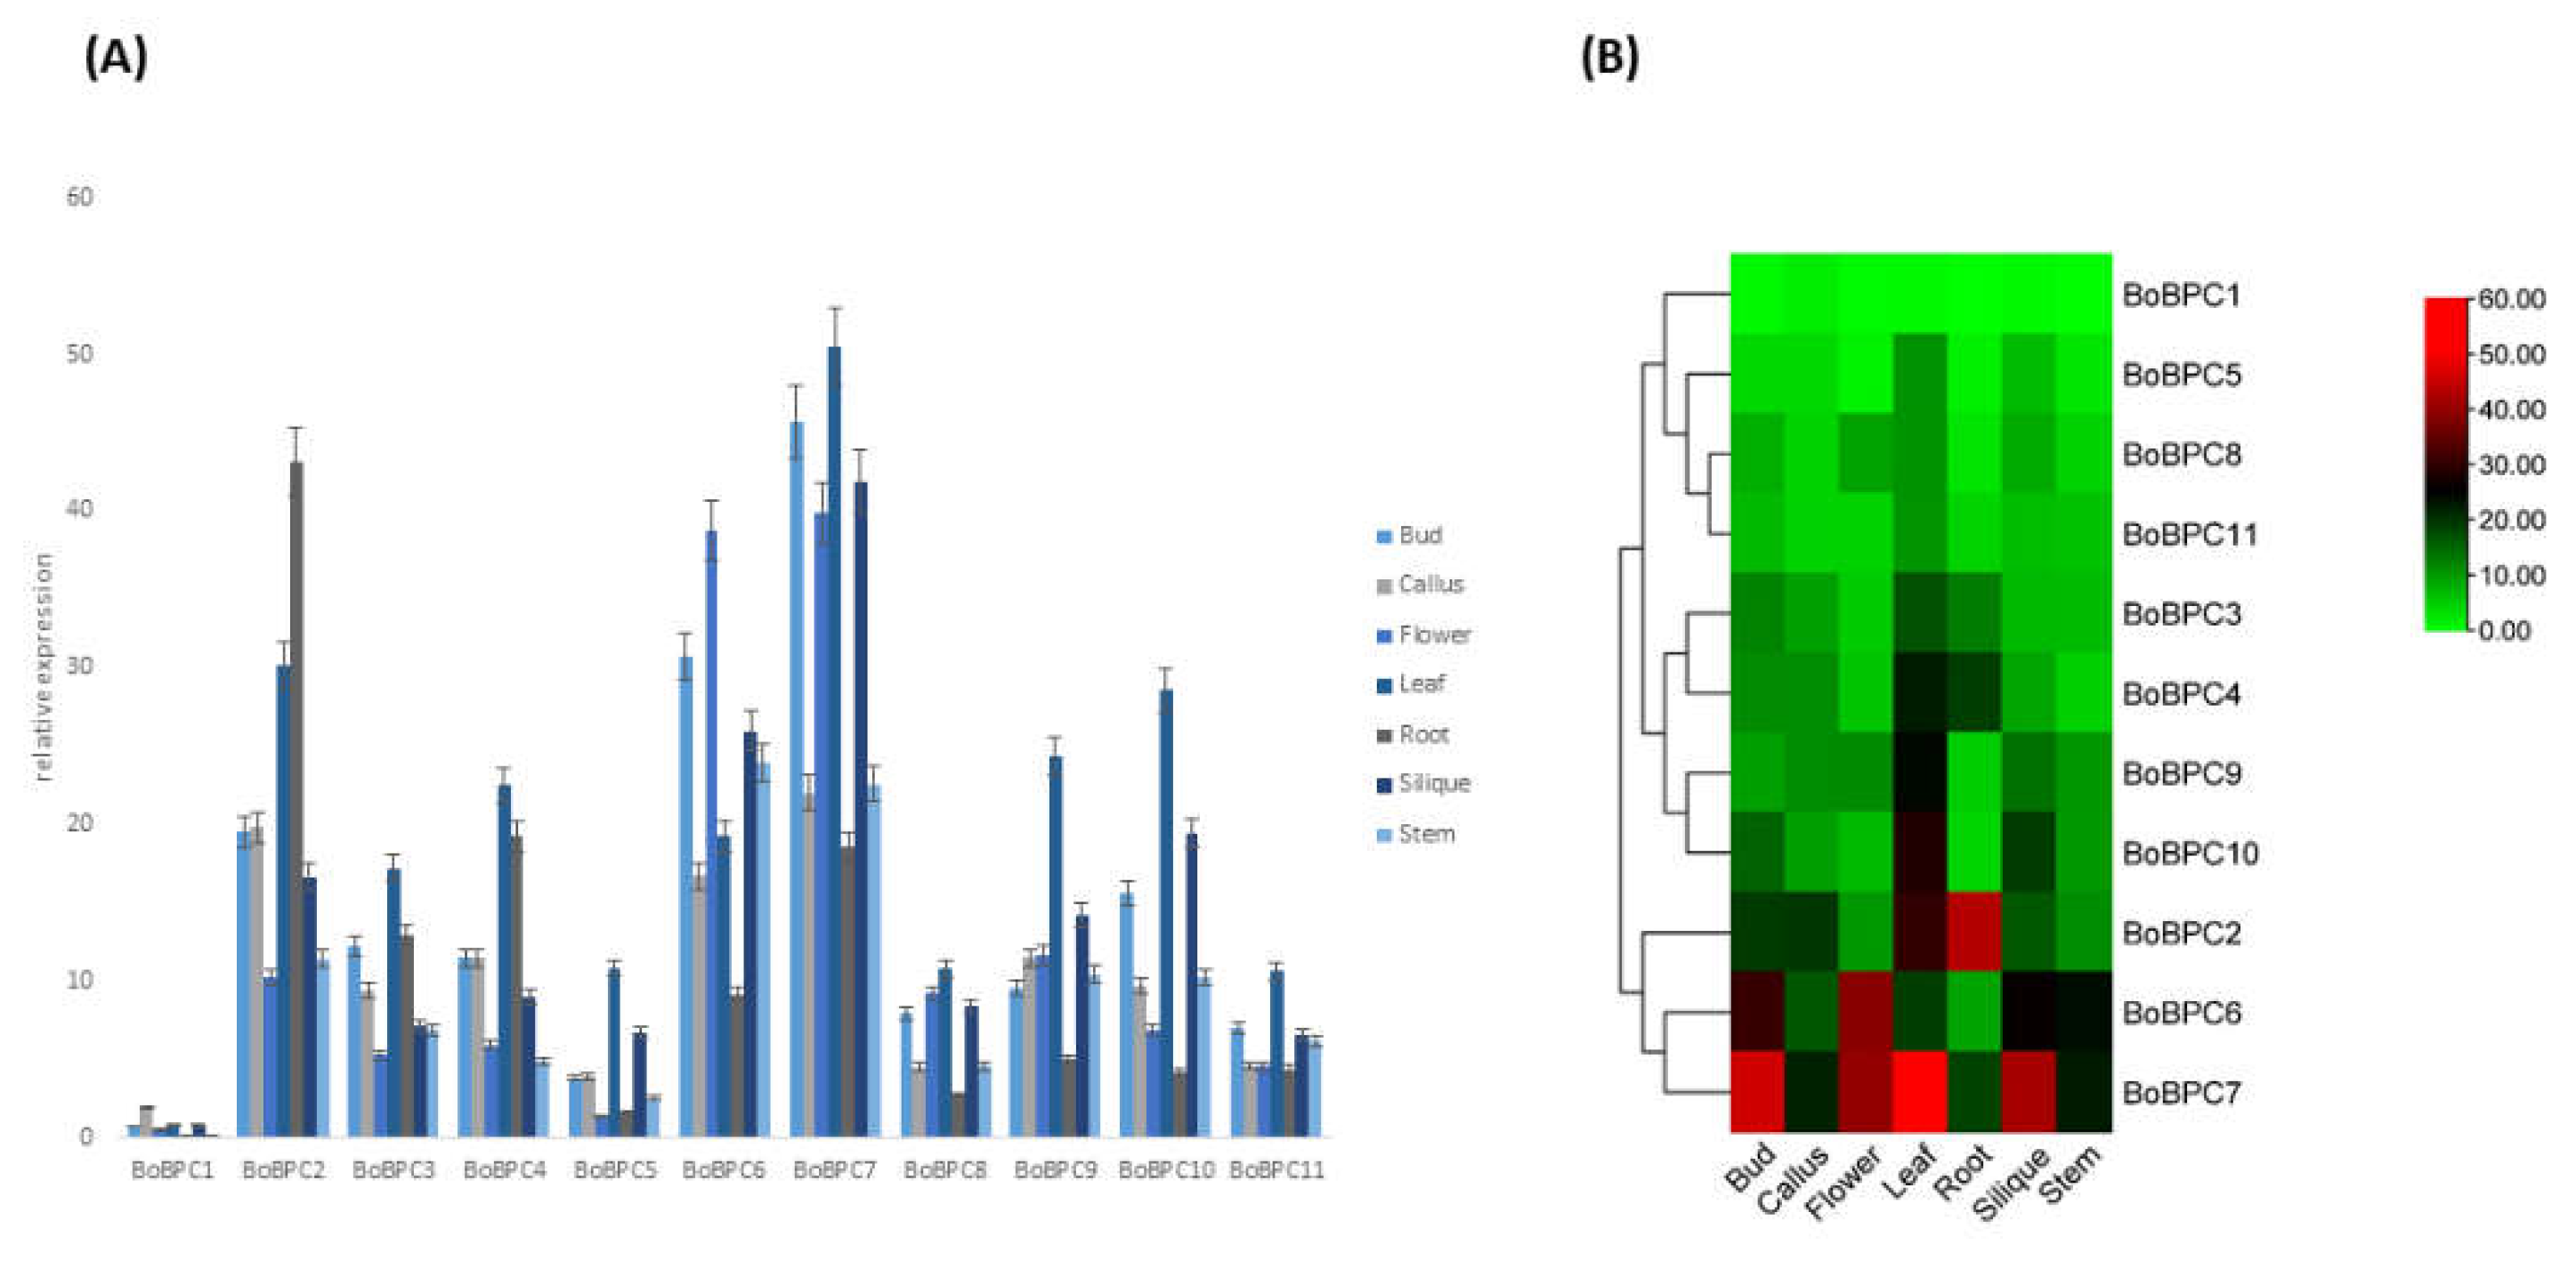
RNA-Seq analysis of gene expression profiles across various tissues was conducted for all BoBPC genes [
33]. The tissues examined included callus, root, stem, leaf, flower, and silique. Expression of BoBZR1 members was consistently detected across all seven tested tissues (
Figure 10). Additionally, all BoBPC genes exhibited significant differential expression across the various tissues, with maximum expression consistently observed in the leaf for all genes. Specifically, BoBPC7 showed high expression levels in bud, flower, leaf, and silique tissues. In contrast, BoBZR1 demonstrated comparatively lower expression levels across all tissues.
4. Discussion
In natural environments, plants often experience simultaneous exposure to many stressors, resulting in distinct and unpredictable circumstances. Unlike their separate responses to single stressors, plants may experience changes in their metabolism as a result of the combined effects of many stressors [
34]. Plants must adapt genetic responses to accommodate the unique physiological and developmental demands imposed by the multitude of stresses they encounter [
35]. This includes adjustments to photosynthesis, regulation of hormonal signaling pathways, activation of molecular mechanisms, and enhancement of antioxidant defenses [
36]. Transcription factors are crucial for regulating plant growth, development, and responses to various abiotic stresses by controlling the expression of downstream genes. While extensive research has focused on major gene families like bHLH, MYB, and WRKY [
37], the BPC family has received comparatively little attention in recent years. Despite their potential significance, there has been a notable lack of comprehensive studies investigating the roles and regulatory mechanisms of the BPC family.
In our current investigation, we conducted a thorough examination of eleven predicted BPC proteins within B. oleracea on a whole-genome scale. We juxtaposed these findings with BPC proteins from four rice, five wheat, seven Arabidopsis, and five tomato species. Through phylogenetic analysis, we categorized these BPC proteins into three classes, mirroring the classification observed in Arabidopsis. Interestingly, we observed a notable difference in gene distribution among the classes. Class-A exhibited 15 genes, while Class-C contained 14. In contrast, Class-B displayed a much smaller presence, comprising only 3 members. This suggests that the diversification of BPC genes likely occurred prior to the divergence of various species, with the possibility of some Class-B members being lost during evolution. Analysis of gene structure and conserved motifs revealed that BoBPC genes within the same group exhibited similar patterns of exon-intron organization and motif arrangements. Conversely, BoBPC genes belonging to different groups displayed distinct exon-intron structures and motif compositions. These findings imply a closer evolutionary relationship among members within the same group, while also suggesting functional variation among members of different groups. In essence, the conservation of gene structure and motifs within groups may reflect shared evolutionary history and potential functional similarities. Furthermore, the structure analysis showed that all of the genes shared motifs 1, 2, 3, and 5. This shared feature raises the possibility that these genes have functional similarities or that their motifs are conserved. These motifs are consistently present, which suggests that they are probably important for the regulation or function of genes. This suggests that these motifs probably have important functions in controlling the biological processes linked to the BoBPC genes.
The evolutionary mechanisms of gene families can be clarified by comparative syntenic mapping [
38]. The results of a collinearity study showed that BoBPC orthologous genes are widely distributed in Arabidopsis and potatoes. The existence of BoBPC orthologs in Arabidopsis and potatoes spanning several chromosomes was further demonstrated by a collinearity study. The diversity of BoBPC genes seen in various species is probably the result of evolutionary processes and environmental factor-influenced mutations [
39]. One typical method for evaluating selection pressure on amino acid alterations is to use the Ka/Ks ratio [
40]. Positive selection may be present when the Ka/Ks ratio is more than 1, while purifying selection may be indicated when the ratio is smaller than 1. The interpretation of functional residues and protein shifts is made easier by this technique, which offers insightful information on the evolutionary dynamics of protein sequences [
41]. The calculated Ka/Ks values for the BoBPC genes were all less than 1, ranging from 0.14 to 0.32. This suggests that these genes are largely subject to significant purifying selection pressure.
The promoter region, consisting of enhancers and silencers, plays a critical role in regulating gene expression in response to environmental and developmental signals [
42]. Within this region, cis-regulatory elements (CREs) are essential for gene function and regulatory mechanisms [
43]. The promoters of BoBPC genes exhibit a diverse array of CREs associated with various metabolic and biological processes. These CREs can be categorized into three main groups: growth and stress-responsive elements, as well as hormone-responsive elements. The analysis revealed that growth and stress-responsive elements were more abundant than hormone-responsive elements within the BoBPC gene promoters. This suggests that BoBPC genes may play important roles in mediating responses to growth stimuli and environmental stresses. Additionally, the presence of hormone-responsive CREs implies their involvement in hormone-mediated regulatory pathways. Overall, these findings indicate that BoBPC genes likely contribute to the regulation of hormonal responses, stress adaptation, and growth in
B. oleracea.
Gene expression is vital for functional manifestation, and promoters directly influence it [
44]. In the context of cuticular wax development, analysis of BoBPC genes revealed upregulation of BoBPC1, 3, 4, and 7, possibly due to the presence of ABA-responsive CREs in their promoters. This indicates their positive contribution to coordinating growth and defense mechanisms [
45]. RNA-Seq data demonstrated constitutive expression of BoBPC genes across all tested tissues, suggesting their involvement in fundamental cellular processes and as integral components of defense machinery throughout plant growth. Furthermore, BoBPC genes were expressed across all organs and significantly induced by developmental signals, highlighting the crucial role of BoBPC proteins in organ growth and development [
46]. One might conjecture about the probable roles of the BoBPC genes in accordance with these findings. Furthermore, this study establishes a framework for investigating these genes in response to different conditions.
5. Conclusion
We identified 11 members of the BPC gene family in B. oleracea and conducted a thorough examination encompassing chromosomal localization, protein motif analysis, gene structure, phylogenetic relationships, collinear relationships, selective force, gene functional divergence, orthologous identification, and gene expression patterns. Our analysis of synonymous and nonsynonymous substitutions revealed that purifying selection predominantly influenced the evolution of the BoBPC gene family. Additionally, the presence of specific cis-regulatory elements in the promoters of BoBPC genes strongly indicates their significance in hormone regulation, stress tolerance, and growth-related responses. Variations in the expression levels of BoBPC gene members in correlation with cuticular wax development suggest their potential role in safeguarding plants against diverse environmental stresses. Tissue expression patterns unveiled significant differential expression levels of BoBPC across various tissues, underscoring its importance as a pivotal regulator in plant growth and development. To summarize, our study offers valuable insights into the evolutionary dynamics and expression patterns of the BoBPC gene family, laying the groundwork for future investigations into BPC genes of B. oleracea.
Supplementary files
Table 1S: BoBPC genes expression data from wild to mutant type of B. oleracea; Table 2S: BoBPC gene expression data in seven tissues of B. oleracea.
Authors Contribution
Conceptualization, MAU; methodology, MAU and AZ; software, MAU; validation, MAU.; formal analysis, A.P., I.U.H., H.M.A., W.A.A.A. and M.E.H.; investigation, MAU; resources, H.M.A., W.A.A.A. and M.E.H.; data curation, A.P., I.U.H., H.M.A., W.A.A.A. and M.E.H.; writing—original draft preparation, H.M.A., W.A.A.A. and M.E.H.; writing—review and editing, A.P., I.U.H.; visualization, AZ; supervision, MAU.; project administration, MAU.; funding acquisition, A.P., H.M.A., W.A.A.A. and M.E.H.. All authors have read and agreed to the published version of the manuscript.
Data-Availability
The datasets analyzed in this study were sourced from the NCBI-GEO database, accessible at [
https://www.ncbi.nlm.nih.gov/geo/query/acc.cgi] under the accession numbers GSE130405 and GSE42891. All data utilized in this research are fully disclosed in the publication and its supplementary materials.
Institutional Review Board Statement
Not applicable.
Informed Consent Statement
Not applicable.
Funding
This work was funded by the Researchers Supporting Project number (RSP2024R123), King Saud University, Riyadh, Saudi Arabia. University of the Punjab also assisted in this work.
Acknowledgment
Authors would like to extend their sincere appreciation to the Researchers Supporting Project number (RSP2024R123), King Saud University, Riyadh, Saudi Arabia.
Conflicts of Interest
The authors declare no conflict of interest.
References
- Zhang, S.; Wang, J.; Feng, Y.; Xue, Y.; Wang, Y.; Zhao, M.; Chen, M.; Chen, C.; Su, W.; Chen, R. Genome-wide identification of flowering Chinese cabbage BPC family genes and BcBPC9 functional analysis in Cd stress tolerance. Plant Stress 2023, 10, 100220. [Google Scholar] [CrossRef]
- Hecker, A.; Brand, L.H.; Peter, S.; Simoncello, N.; Kilian, J.; Harter, K.; Gaudin, V.; Wanke, D. The Arabidopsis GAGA-Binding Factor BASIC PENTACYSTEINE6 Recruits the POLYCOMB-REPRESSIVE COMPLEX1 Component LIKE HETEROCHROMATIN PROTEIN1 to GAGA DNA Motifs. Plant Physiol. 2015, 168, 1013–1024. [Google Scholar] [CrossRef] [PubMed]
- Theune, M.L.; Bloss, U.; Brand, L.H.; Ladwig, F.; Wanke, D. Phylogenetic Analyses and GAGA-Motif Binding Studies of BBR/BPC Proteins Lend to Clues in GAGA-Motif Recognition and a Regulatory Role in Brassinosteroid Signaling. Front. Plant Sci. 2019, 10, 466. [Google Scholar] [CrossRef] [PubMed]
- Mu, Y.; Zou, M.; Sun, X.; He, B.; Xu, X.; Liu, Y.; Zhang, L.; Chi, W. Basic Pentacysteine Proteins Repress Abscisic Acid Insensitive4 Expression via Direct Recruitment of the Polycomb-Repressive Complex 2 in Arabidopsis Root Development. Plant Cell Physiol. 2017, 58, 607–621. [Google Scholar] [CrossRef] [PubMed]
- Kilian, K.H., V. Gaudin. The Arabidopsis GAGA-binding factor BPC6 recruits PRC1 component 28 LHP1 to GAGA DNA-motifs 29. 2015.
- Monfared, M.M.; Simon, M.K.; Meister, R.J.; Roig-Villanova, I.; Kooiker, M.; Colombo, L.; Fletcher, J.C.; Gasser, C.S. Overlapping and antagonistic activities of BASIC PENTACYSTEINE genes affect a range of developmental processes in Arabidopsis. Plant J. 2011, 66, 1020–1031. [Google Scholar] [CrossRef] [PubMed]
- Nielsen, M. , Deciphering the role of PRC2 accessory proteins in promoting cold-induced epigenetic switching in Arabidopsis thaliana. 2021, University of East Anglia.
- Wils, C.R.; Kaufmann, K. Gene-regulatory networks controlling inflorescence and flower development in Arabidopsis thaliana. Biochim. et Biophys. Acta (BBA) - Gene Regul. Mech. 2017, 1860, 95–105. [Google Scholar] [CrossRef] [PubMed]
- Godwin, J.; Farrona, S. The Importance of Networking: Plant Polycomb Repressive Complex 2 and Its Interactors. Epigenomes 2022, 6, 8. [Google Scholar] [CrossRef] [PubMed]
- Simonini, S.; Kater, M.M. Class I BASIC PENTACYSTEINE factors regulate HOMEOBOX genes involved in meristem size maintenance. J. Exp. Bot. 2014, 65, 1455–1465. [Google Scholar] [CrossRef] [PubMed]
- Mu, Y.; Liu, Y.; Bai, L.; Li, S.; He, C.; Yan, Y.; Yu, X.; Li, Y. Cucumber CsBPCs Regulate the Expression of CsABI3 during Seed Germination. Front. Plant Sci. 2017, 8, 459. [Google Scholar] [CrossRef] [PubMed]
- Gong, R.; Cao, H.; Zhang, J.; Xie, K.; Wang, D.; Yu, S. Divergent functions of the GAGA-binding transcription factor family in rice. Plant J. 2018, 94, 32–47. [Google Scholar] [CrossRef]
- Shanks, C.M.; Hecker, A.; Cheng, C.; Brand, L.; Collani, S.; Schmid, M.; Schaller, G.E.; Wanke, D.; Harter, K.; Kieber, J.J. Role of BASIC PENTACYSTEINE transcription factors in a subset of cytokinin signaling responses. Plant J. 2018, 95, 458–473. [Google Scholar] [CrossRef]
- Li, S.; Sun, M.; Miao, L.; Di, Q.; Lv, L.; Yu, X.; Yan, Y.; He, C.; Wang, J.; Shi, A.; et al. Multifaceted regulatory functions of CsBPC2 in cucumber under salt stress conditions. Hortic. Res. 2023, 10, uhad051. [Google Scholar] [CrossRef]
- Mabry, M.E. , et al., The evolutionary history of wild, domesticated, and feral Brassica oleracea (Brassicaceae). Molecular Biology and Evolution, 2021. 38(10): p. 4419-4434.
- Hammer, K.; Montesano, V.; Direnzo, P.; Laghetti, G. Conservation of Crop Genetic Resources in Italy with a Focus on Vegetables and a Case Study of a Neglected Race of Brassica Oleracea. Agriculture 2018, 8, 105. [Google Scholar] [CrossRef]
- Ciju, R.J. , Brassica Vegetables: Growing Practices and Nutritional Information. 2019: Agrihortico.
- Wang, L.; Sun, W.; Liu, X.; Xu, Y.; Lyu, Z.; Liu, R.; Jiu, S.; Zhang, C.; Wang, J. Genome-wide identification of the NCED gene family and functional characterization of PavNCED5 related to bud dormancy in sweet cherry. Sci. Hortic. 2023, 319. [Google Scholar] [CrossRef]
- Mostafa, K.; Yerlikaya, B.A.; Abdulla, M.F.; Aydin, A.; Yerlikaya, S.; Kavas, M. Genome-wide analysis of PvMADS in common bean and functional characterization of PvMADS31 in Arabidopsis thaliana as a player in abiotic stress responses. Plant Genome 2024, e20432. [Google Scholar] [CrossRef]
- Thakare, H.S. , The In-Silico Study on Structural, Functional and Sub-Cellular Localization of Hypothetical Proteins in the Orf Virus. EC Microbiology, 2021. 17: p. 10-20.
- Imai, K.; Nakai, K. Tools for the Recognition of Sorting Signals and the Prediction of Subcellular Localization of Proteins From Their Amino Acid Sequences. Front. Genet. 2020, 11. [Google Scholar] [CrossRef]
- Tnah, L.H.; Lee, S.L.; Lee, C.T.; Ng, K.K.S.; Ng, C.H.; Zawiah, N. DNA barcode identification of cultivated and wild tropical fruit species. 3 Biotech 2023, 14, 1–10. [Google Scholar] [CrossRef]
- Rehman, O.U.; Uzair, M.; Chao, H.; Fiaz, S.; Khan, M.R.; Chen, M. Role of the type-B authentic response regulator gene family in fragrant rice under alkaline salt stress. Physiol. Plant. 2022, 174, e13696. [Google Scholar] [CrossRef] [PubMed]
- Huang, B.; Huang, Z.; Ma, R.; Chen, J.; Zhang, Z.; Yrjälä, K. Genome-wide identification and analysis of the heat shock transcription factor family in moso bamboo (Phyllostachys edulis). Sci. Rep. 2021, 11, 1–19. [Google Scholar] [CrossRef]
- Miao, L. , et al., Comparative analysis of basic helix–loop–helix gene family among Brassica oleracea, Brassica rapa, and Brassica napus. BMC genomics, 2020. 21: p. 1-18.
- Ramírez-Tejero, J.A.; Jiménez-Ruiz, J.; Leyva-Pérez, M.D.L.O.; Barroso, J.B.; Luque, F. Gene Expression Pattern in Olive Tree Organs (Olea europaea L.). Genes 2020, 11, 544. [Google Scholar] [CrossRef]
- Li, J.; Zhang, N.; Zhou, Y.; Huang, Q.; Xu, J.; Cen, H.; Ali, B.; Shi, B.; Xu, L.; Yang, C.; et al. Whole-genome identification and expression analysis of basic leucine zipper genes under cadmium, drought and Orobanche cumana stresses in Helianthus annuus L. . Ind. Crop. Prod. 2023, 193. [Google Scholar] [CrossRef]
- Fedorova, L. and A. Fedorov, Introns in gene evolution. Origin and evolution of new gene functions, 2003: p. 123-131.
- Rogozin, I.B.; Sverdlov, A.V.; Babenko, V.N.; Koonin, E.V. Analysis of evolution of exon-intron structure of eukaryotic genes. Briefings Bioinform. 2005, 6, 118–134. [Google Scholar] [CrossRef] [PubMed]
- Nehrt, N.L.; Clark, W.T.; Radivojac, P.; Hahn, M.W. Testing the Ortholog Conjecture with Comparative Functional Genomic Data from Mammals. PLOS Comput. Biol. 2011, 7, e1002073. [Google Scholar] [CrossRef] [PubMed]
- Hernandez-Garcia, C.M.; Finer, J.J. Identification and validation of promoters and cis-acting regulatory elements. Plant Sci. [CrossRef]
- Zhu, X. , et al., Genome-wide analysis of coding and long non-coding RNAs involved in cuticular wax biosynthesis in cabbage (Brassica oleracea L. var. Capitata). International journal of molecular sciences, 2019. 20(11): p. 2820.
- Liu ShengYi, L.S. , et al., The Brassica oleracea genome reveals the asymmetrical evolution of polyploid genomes. 2014.
- Niinemets, Ü. Responses of forest trees to single and multiple environmental stresses from seedlings to mature plants: Past stress history, stress interactions, tolerance and acclimation. For. Ecol. Manag. 2010, 260, 1623–1639. [Google Scholar] [CrossRef]
- Sahu, P.P.; Pandey, G.; Sharma, N.; Puranik, S.; Muthamilarasan, M.; Prasad, M. Epigenetic mechanisms of plant stress responses and adaptation. Plant Cell Rep. 2013, 32, 1151–1159. [Google Scholar] [CrossRef] [PubMed]
- Foyer, C.H.; Shigeoka, S. Understanding Oxidative Stress and Antioxidant Functions to Enhance Photosynthesis. Plant Physiol. 2010, 155, 93–100. [Google Scholar] [CrossRef] [PubMed]
- Li, S.; Miao, L.; Huang, B.; Gao, L.; He, C.; Yan, Y.; Wang, J.; Yu, X.; Li, Y. Genome-Wide Identification and Characterization of Cucumber BPC Transcription Factors and Their Responses to Abiotic Stresses and Exogenous Phytohormones. Int. J. Mol. Sci. 2019, 20, 5048. [Google Scholar] [CrossRef]
- Wang, Y.; Tang, H.; DeBarry, J.D.; Tan, X.; Li, J.; Wang, X.; Lee, T.-H.; Jin, H.; Marler, B.; Guo, H.; et al. MCScanX: A toolkit for detection and evolutionary analysis of gene synteny and collinearity. Nucleic Acids Res. 2012, 40, e49. [Google Scholar] [CrossRef] [PubMed]
- Kendler, K.S. , et al., The genetic epidemiology of phobias in women: The interrelationship of agoraphobia, social phobia, situational phobia, and simple phobia. Archives of general psychiatry, 1992. 49(4): p. 273-281.
- FAISAL, I. , Analysis of evolutionary pressure and pathogenicity of missense variations. 2012.
- Marsh, J.A.; Teichmann, S.A. Parallel dynamics and evolution: Protein conformational fluctuations and assembly reflect evolutionary changes in sequence and structure. BioEssays 2013, 36, 209–218. [Google Scholar] [CrossRef]
- Biłas, R.; Szafran, K.; Hnatuszko-Konka, K.; Kononowicz, A.K. Cis-regulatory elements used to control gene expression in plants. Plant Cell, Tissue Organ Cult. (PCTOC) 2016, 127, 269–287. [Google Scholar] [CrossRef]
- Kwasnieski, J.C.; Mogno, I.; Myers, C.A.; Corbo, J.C.; Cohen, B.A. Complex effects of nucleotide variants in a mammalian cis -regulatory element. Proc. Natl. Acad. Sci. 2012, 109, 19498–19503. [Google Scholar] [CrossRef] [PubMed]
- Ayoubi, T.A. and W.J. Van De Yen, Regulation of gene expression by alternative promoters. The FASEB Journal, 1996. 10(4): p. 453-460.
- Abdullah-Zawawi, M.-R.; Ahmad-Nizammuddin, N.-F.; Govender, N.; Harun, S.; Mohd-Assaad, N.; Mohamed-Hussein, Z.-A. Comparative genome-wide analysis of WRKY, MADS-box and MYB transcription factor families in Arabidopsis and rice. Sci. Rep. 2021, 11, 1–18. [Google Scholar] [CrossRef] [PubMed]
- Ma, L.; Sun, N.; Liu, X.; Jiao, Y.; Zhao, H.; Deng, X.W. Organ-Specific Expression of Arabidopsis Genome during Development. Plant Physiol. 2005, 138, 80–91. [Google Scholar] [CrossRef] [PubMed]
Figure 1.
The subcellular location of all BoBPC genes across the nucleus, cytoplasm, chloroplast, Golgi apparatus, mitochondria, plasmid, and peroxisomes of a plant cell shown in a heat map. The colour red in this visualization signifies the gene's highest functional relevance in that location, whereas white shows the gene's absence in the designated region.
Figure 2.
The evolutionary relationships among BPC genes in B. oleracea, wheat, rice, tomato, and Arabidopsis.
Figure 2.
The evolutionary relationships among BPC genes in B. oleracea, wheat, rice, tomato, and Arabidopsis.
Figure 3.
Genomic architecture of BoBPC genes.
Figure 3.
Genomic architecture of BoBPC genes.
Figure 4.
The motif distribution on BoBPC proteins was analyzed alongside a phylogenetic tree, utilizing a specific color code to distinguish between different motifs.
Figure 4.
The motif distribution on BoBPC proteins was analyzed alongside a phylogenetic tree, utilizing a specific color code to distinguish between different motifs.
Figure 5.
BoBPC genes distribution on various chromosomes of B. olecracea.
Figure 5.
BoBPC genes distribution on various chromosomes of B. olecracea.
Figure 6.
Synteny analysis across the genomes of B. oleracea, potato, and Arabidopsis, with duplicated genes in each genome represented by blue lines.
Figure 6.
Synteny analysis across the genomes of B. oleracea, potato, and Arabidopsis, with duplicated genes in each genome represented by blue lines.
Figure 7.
ka/ks ratio of BoBPC gene pairs in B. oleracea.
Figure 7.
ka/ks ratio of BoBPC gene pairs in B. oleracea.
Figure 8.
The functional network of BoBPC genes is represented by a Static Network Enrichment graph. Darker nodes in this graph indicate gene sets that have been considerably enriched, which suggests higher levels of functional relevance or activity. Greater numbers of genes are indicated by larger nodes in gene sets. Furthermore, wider margins separating nodes signify greater gene overlap between related sets, indicating shared pathways or functional linkages.
Figure 10.
BoBPC genes expression in seven tissues of B. oleracea.
Figure 10.
BoBPC genes expression in seven tissues of B. oleracea.
Table 1.
BoBPC genes of B. oleracea with their physiochemical features.
Table 1.
BoBPC genes of B. oleracea with their physiochemical features.
| transcript id |
gene name |
chr# |
location |
AA |
strand |
Molecular weight |
pl |
GRAVY |
introns |
Exons |
Cellular localization |
| Start |
end |
| Bol010505 |
BoBPC1 |
2 |
12026072 |
12026906 |
834 |
Reverse |
68.29021 |
5.1 |
0.769 |
0 |
1 |
nucleus |
| Bol029220 |
BoBPC2 |
8 |
19403048 |
19403864 |
816 |
forward |
66.80343 |
5.1 |
0.896 |
0 |
1 |
nucleus |
| Bol038065 |
BoBPC3 |
5 |
5380614 |
5383681 |
1245 |
forward |
100.80989 |
5 |
0.843 |
1 |
2 |
nucleus |
| Bol031512 |
BoBPC4 |
8 |
37738825 |
37741639 |
1314 |
reverse |
107.92766 |
5 |
0.871 |
1 |
2 |
nucleus |
| Bol039798 |
BoBPC5 |
3 |
8673181 |
8673871 |
690 |
forward |
58.02416 |
5.1 |
0.919 |
0 |
1 |
nucleus |
| Bol023830 |
BoBPC6 |
6 |
27763265 |
27764380 |
1020 |
reverse |
82.4893 |
5.1 |
0.963 |
1 |
2 |
nucleus, nucleolus |
| Bol044524 |
BoBPC7 |
8 |
32128473 |
32129483 |
903 |
reverse |
72.87759 |
5.1 |
0.978 |
1 |
2 |
nucleus, nucleolus |
| Bol006733 |
BoBPC8 |
4 |
29327013 |
29327963 |
855 |
reverse |
69.97974 |
5.1 |
0.878 |
1 |
2 |
nucleus |
| Bol028788 |
BoBPC9 |
1 |
42304 |
43238 |
849 |
reverse |
70.10452 |
5.1 |
0.92 |
1 |
2 |
nucleus, nucleolus |
| Bol016050 |
BoBPC10 |
3 |
46068171 |
46069101 |
840 |
reverse |
68.39542 |
5.1 |
0.933 |
1 |
2 |
nucleus, nucleolus |
| Bol018522 |
BoBPC11 |
7 |
48251210 |
48258632 |
1833 |
forward |
150.09543 |
4.9 |
0.832 |
3 |
4 |
nucleus, nucleolus |
Table 2.
Ortholoues of BoBPC with arabidopsis.
Table 2.
Ortholoues of BoBPC with arabidopsis.
| Gene IDs |
Orthologue in arabidopsis |
Molecular function |
Biological process |
Localization |
Expressed in |
| BoBPC1 |
AtBPC6 |
DNA binding, transcription corepressor binding |
response to ethylene |
nucleus |
collective leaf structure, flower, flower pedicel, petal, plant embryo, plant sperm cell, pollen, pollen tube cell, root, seed, sepal |
| BoBPC2, BoBPC3, BoBPC4 |
AtBPC5 |
DNA binding, cis-regulatory region sequence-specific DNA binding |
response to ethylene |
nucleus |
Cauline leaf, cotyledon, flower, guard cell, hypocotyl, inflorescence meristem, plant sperm cell, pollen, pollen tube cell, root, seed, shoot system |
| BoBPC5, BoBPC8 |
AtBPC1, AtBPC2 |
DNA binding |
response to ethylene |
nucleus |
Anther, carpel, collective leaf structure, flower, flower pedicel, guard cell, hypocotyl |
| BoBPC6, BoBPC7, BoBPC9, BoBPC10, BoBPC11 |
AtBPC4, AtBPC7 |
DNA binding, transcription cis-regulatory region binding |
response to ethylene |
nucleus, nucleulous |
Collective leaf structure, cotyledon, flower, guard cell, leaf apex, plant embryo, pollen, root, seed, sepal, shoot apex, shoot system, stamen, stem, vascular leaf |
|
Disclaimer/Publisher’s Note: The statements, opinions and data contained in all publications are solely those of the individual author(s) and contributor(s) and not of MDPI and/or the editor(s). MDPI and/or the editor(s) disclaim responsibility for any injury to people or property resulting from any ideas, methods, instructions or products referred to in the content. |
© 2024 by the authors. Licensee MDPI, Basel, Switzerland. This article is an open access article distributed under the terms and conditions of the Creative Commons Attribution (CC BY) license (https://creativecommons.org/licenses/by/4.0/).
