3.1. The Influences of the Waviness Amplitude and Frequency
This section discusses the results simulated with
w = 200 N,
us = 2 m/s, and
θ = 0° in detail as an example to show the waviness amplitude and frequency effects, primarily when the systems work in the mixed lubrication regime.
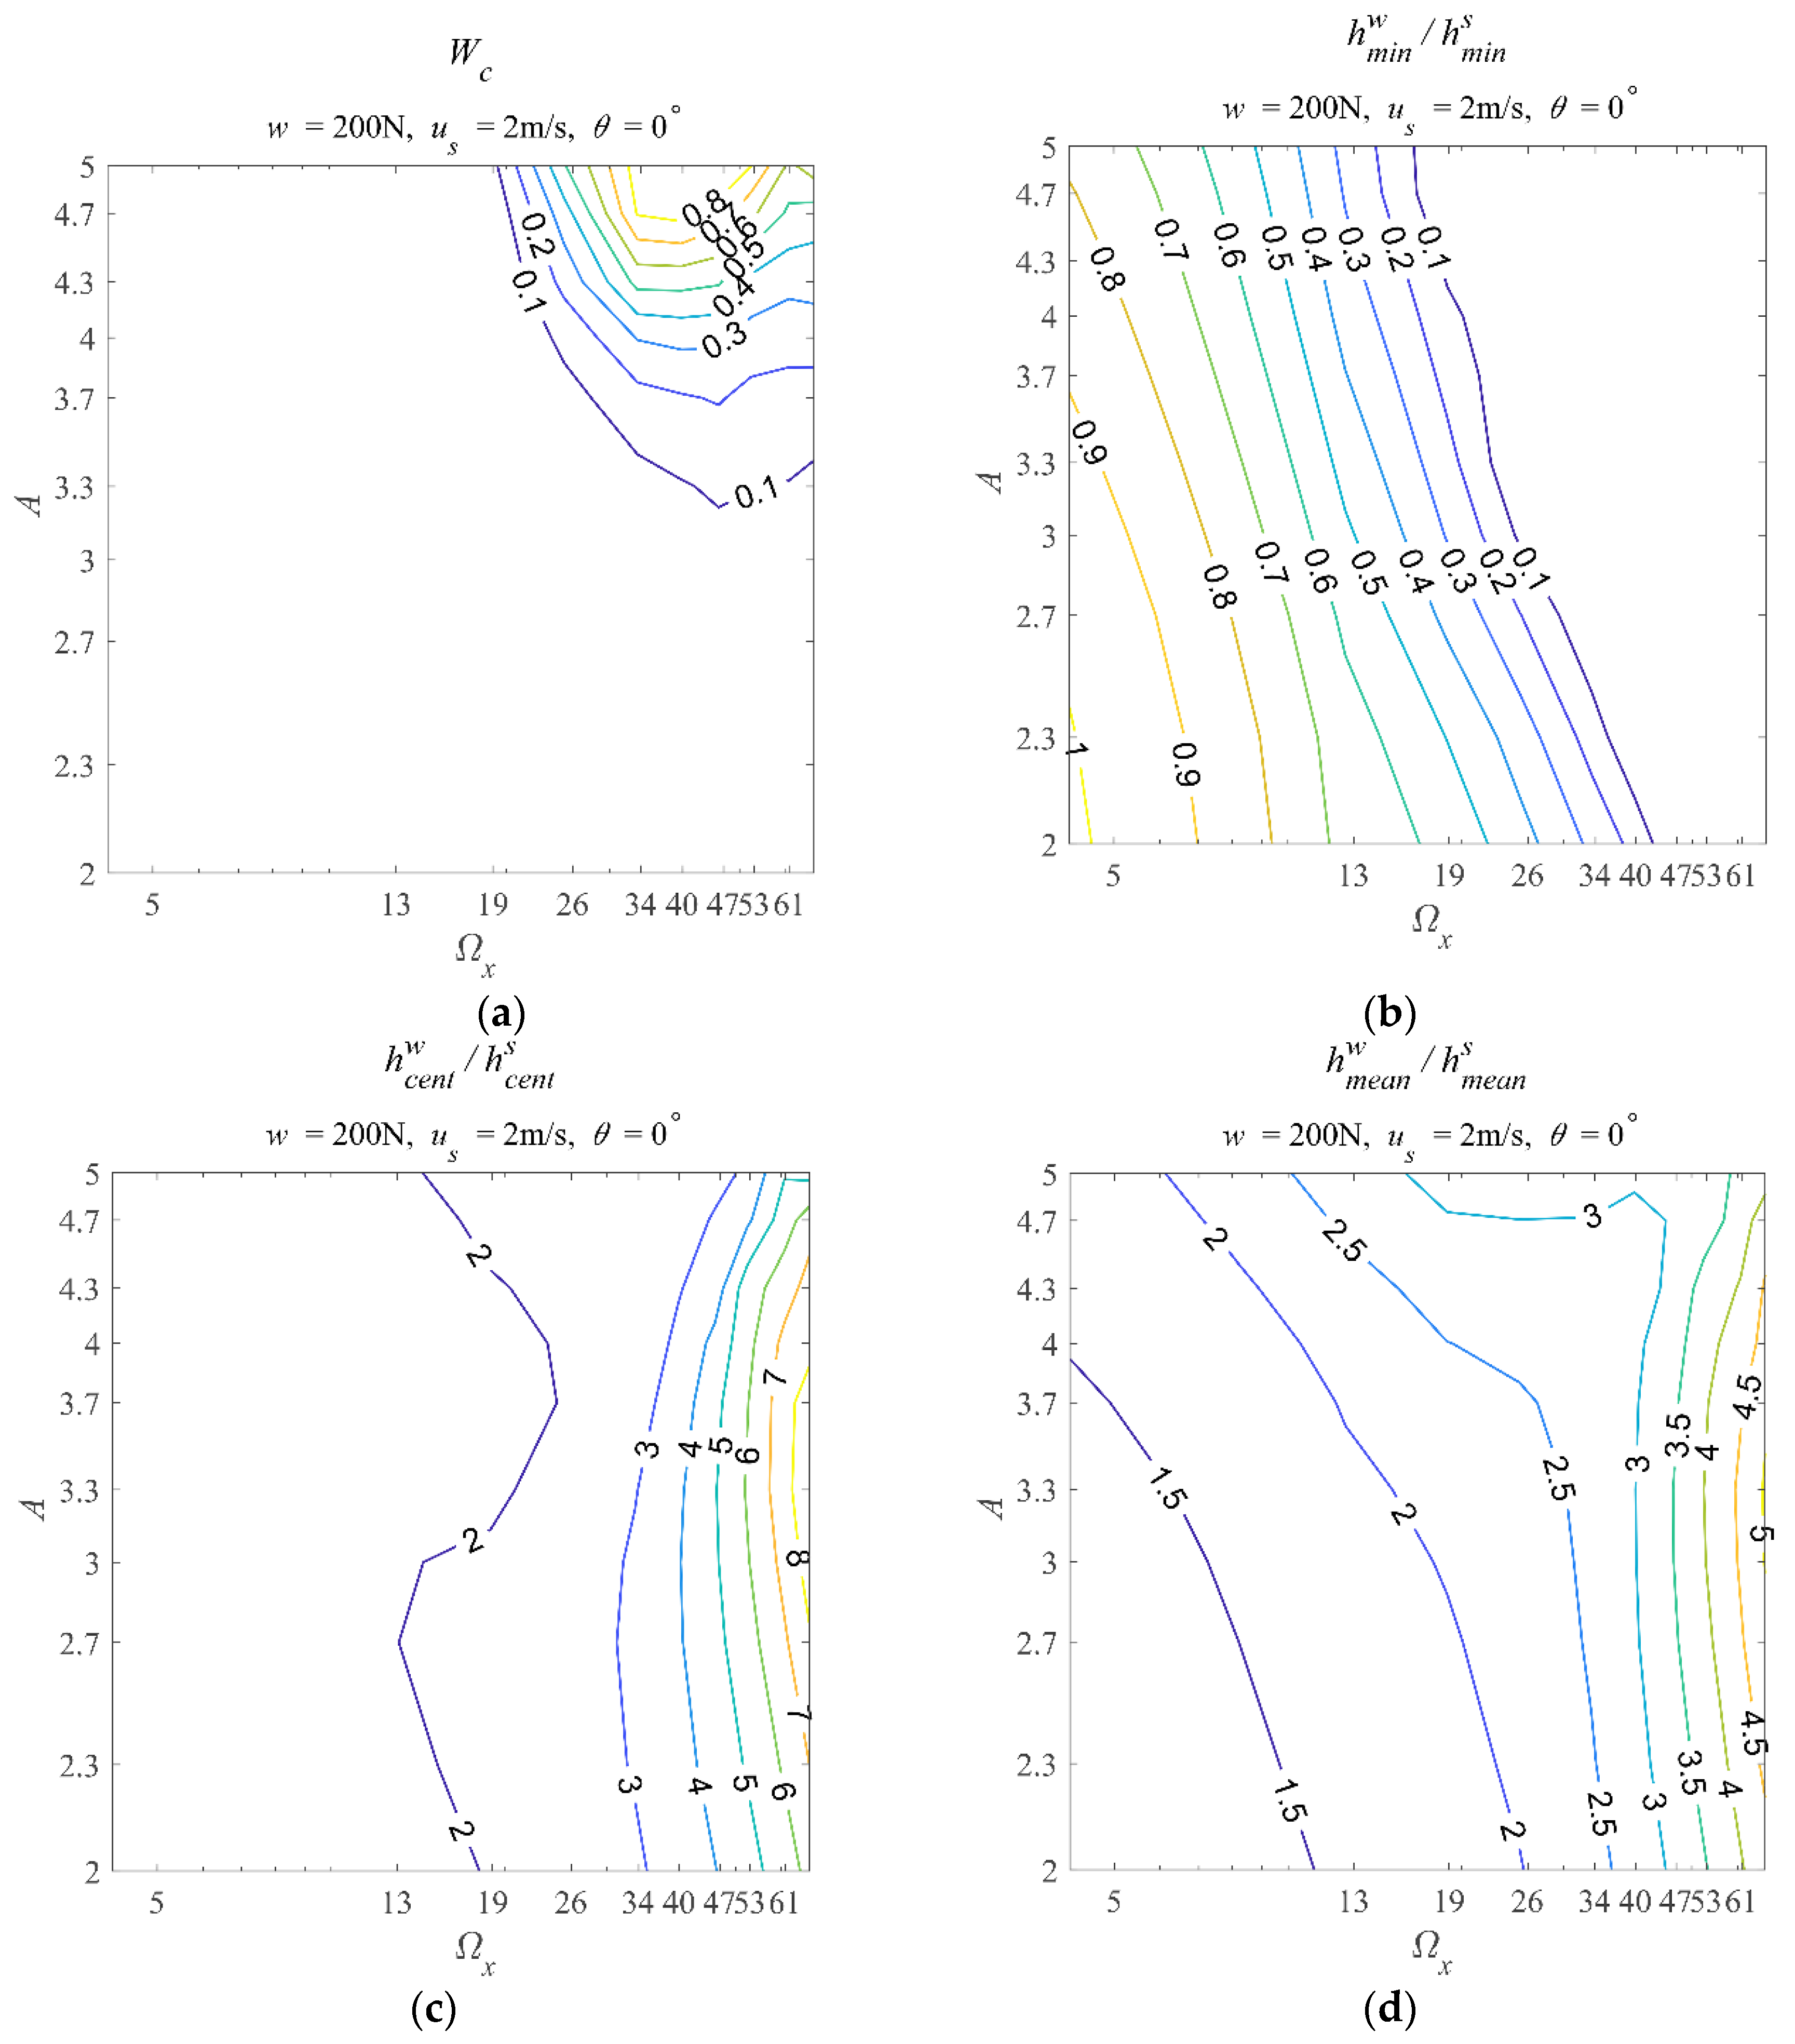
Figure 3 and
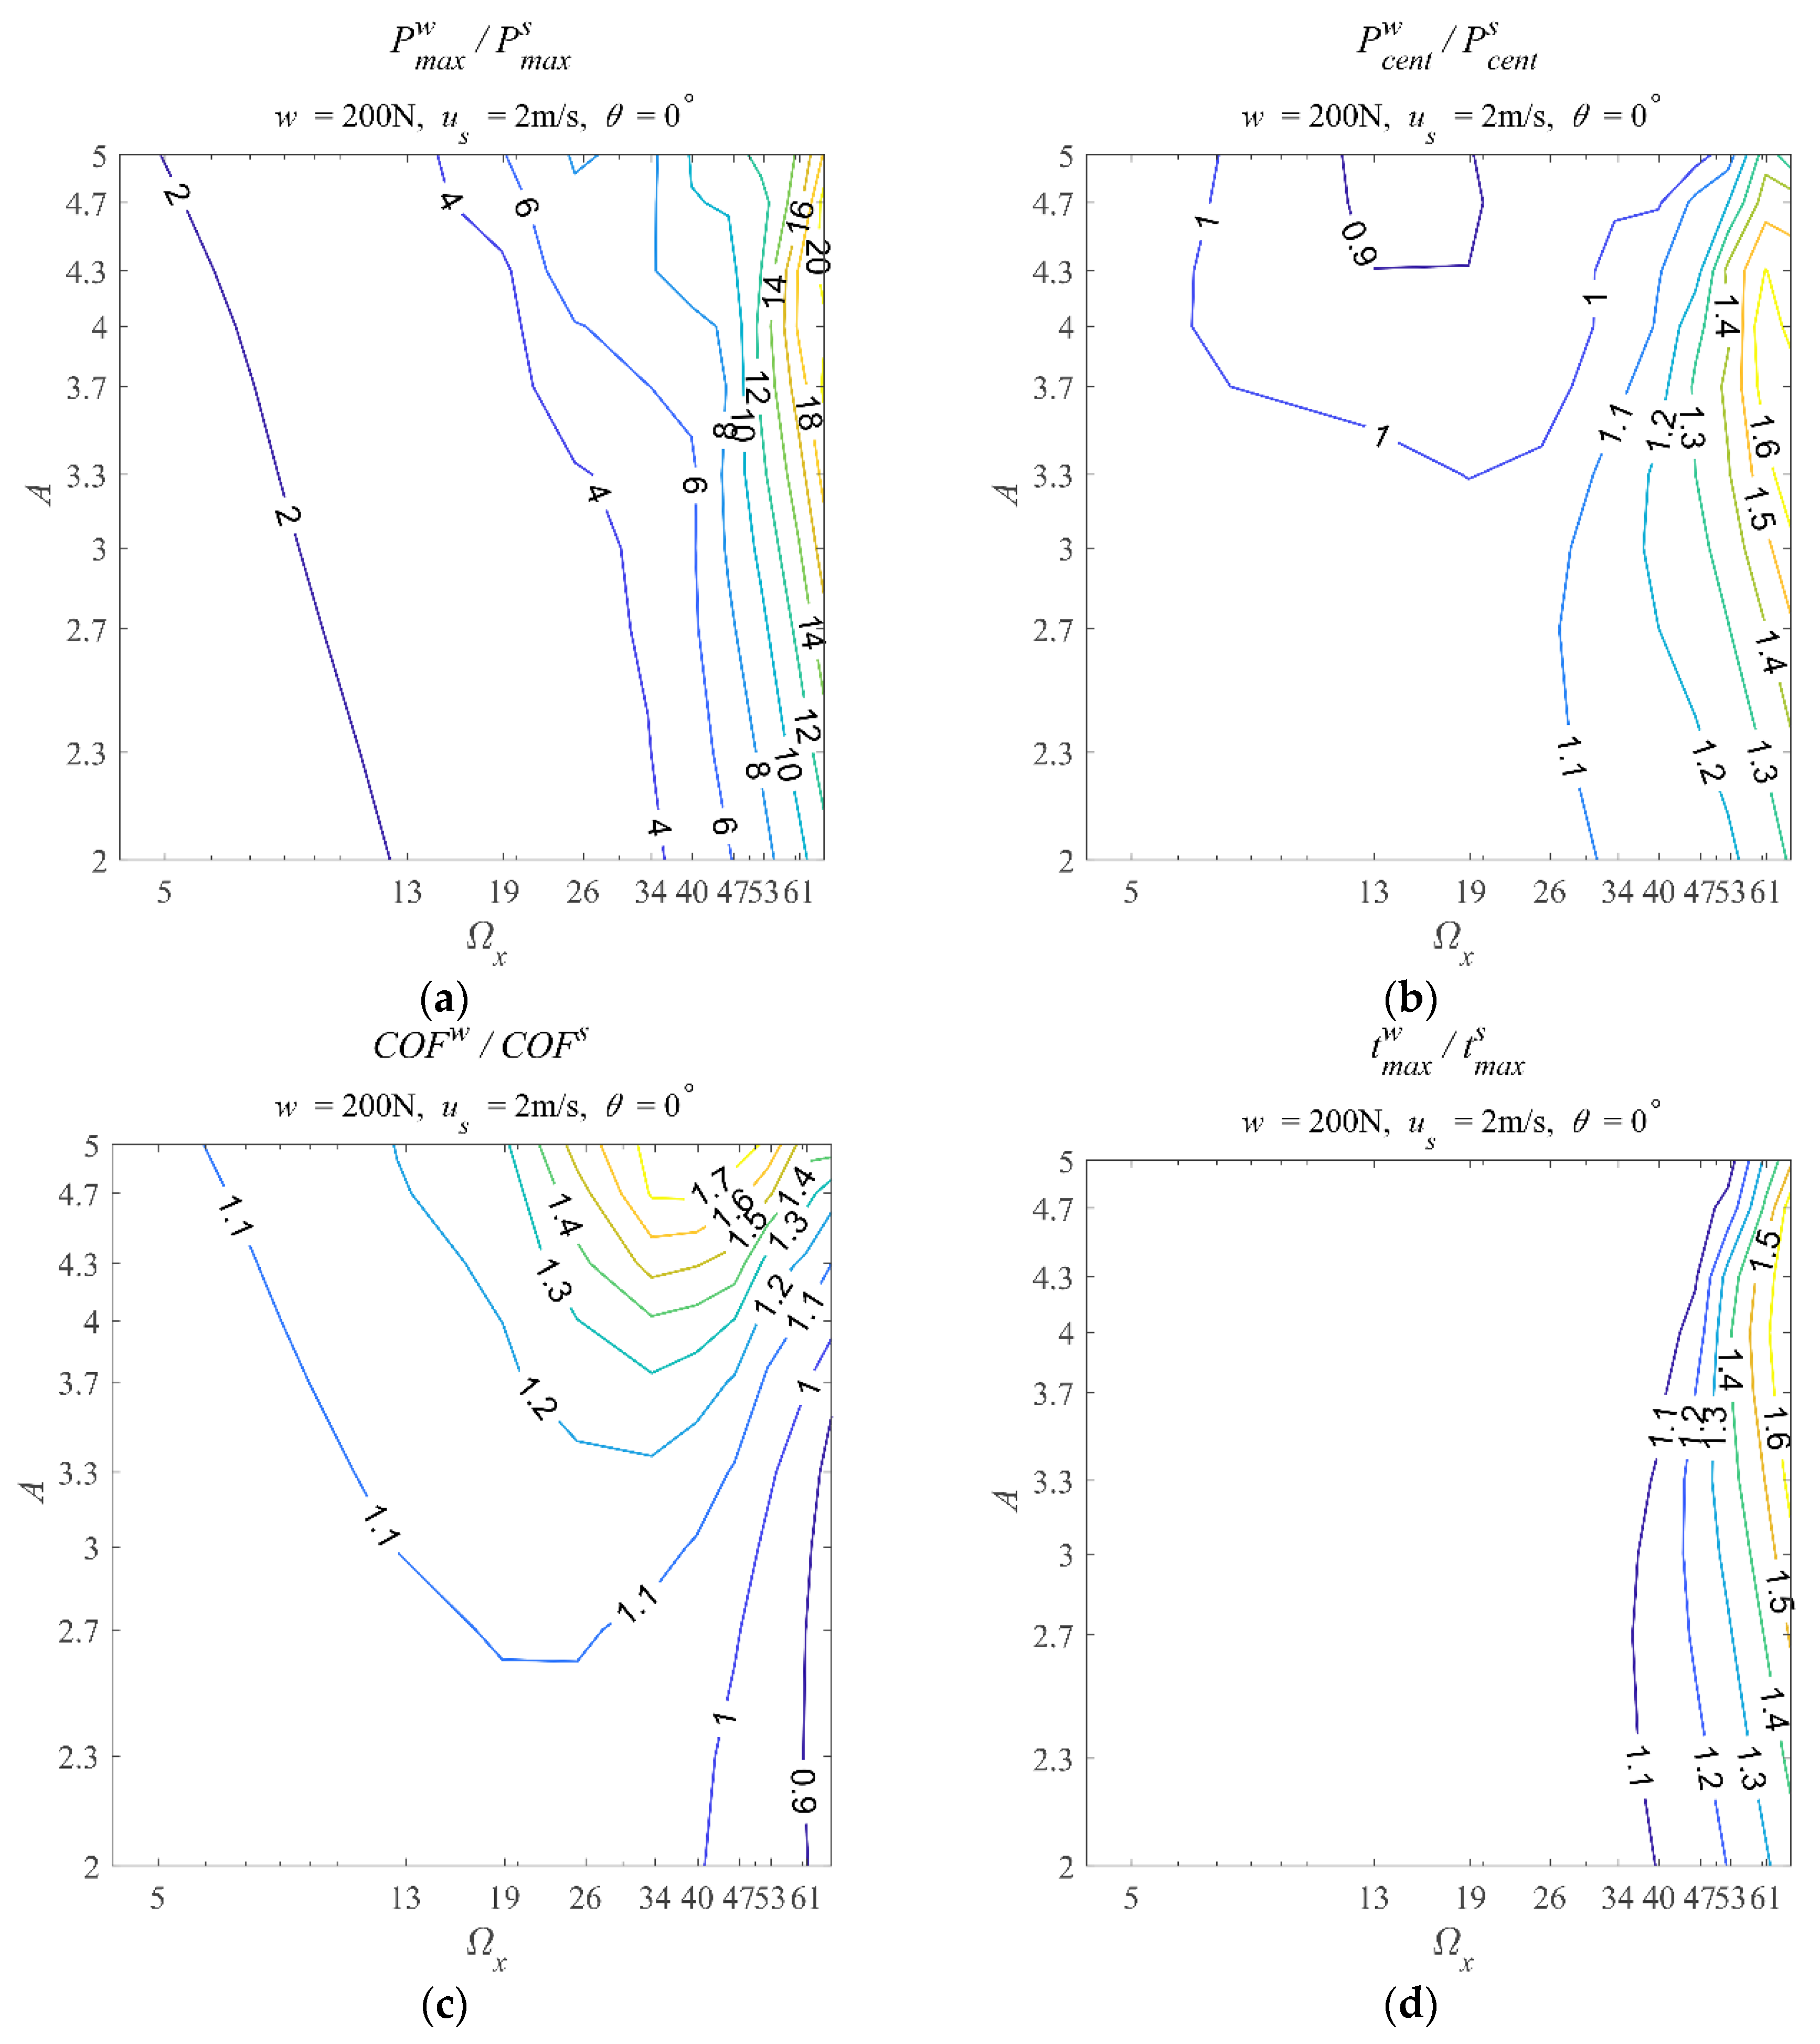
Figure 4 show the eight contour maps and
Table 3 lists the corresponding range of values shown in the contour maps, rounded to three decimal places.
The contour maps of the asperity contact ratio and those related to the film thickness parameters are shown in
Figure 3. In
Figure 3a, the asperity contact ratio shows that the system runs into the partial film regime as the amplitude and frequency increase. The maximum asperity ratio is around 0.9 (
Table 3), meaning severe asperity contacts. It should be noted that many full film cases are still shown in
Figure 3a, such as (Ω
x ≈ 13,
A = 3.3) and (Ω
x ≈ 19,
A = 3). Such results are unexpected because the waviness amplitude has been three times the central film thickness of the corresponding smooth EHL situations. So, the simulation results shown here illustrate the power of the micro-EHL effects at the asperity scale.
Moreover, the maximum asperity ratio occurs at Ωx ≈ 46 and A = 5. The corresponding amplitude value is the maximum amplitude used in this work. However, the corresponding frequency value is among the frequency range used. This phenomenon means the asperity contact ratio increases as the frequency rises to a maximum value. Then, as the frequency further increases, the asperity contact ratio decreases. Also, this result illustrates that even in the partial film regime where asperity contacts occur, high-frequency waviness can enhance the micro-EHL effects.
Figure 3b shows that the
values are less than one in most cases, meaning the minimal film thickness is reduced when waviness is incorporated. The result is the same as the full film condition discussed in the Part I paper [
1]. However, the maximum
value seems greater than one (1.016 in
Table 3), meaning the minimum film thickness is enhanced when considering the designated waviness with relatively small amplitude and frequency (Ω
x ≈ 4.2 and
A = 2). Such results were not in our previous studies within the full film regime. The frequency range is the same for the full (Part I paper) and partial film simulations (current work). The enhancement of minimal film thickness should be due to the amplitudes used. The amplitudes used in the current work are between
A = 2 and
A = 5. The amplitude range used in our previous work is between 0.02 and 0.3. Therefore, it can be inferred that when the amplitude value is significant to a certain extent, and the frequency is minor, the waviness can slightly increase the minimum film thickness.
Another point is that the minimal film thickness decreases monotonically till zero (
Table 3) as the amplitude and frequency increase. This phenomenon is different from the results shown in our previous work (Part I paper). In Part I, the minimal film thickness first decreases and then increases as the frequency increases. Such a difference means the minimal film thickness won’t be enhanced by increasing frequency when the system works in the partial film regime.
Figure 3c shows that the
ratio values are more significant than one, indicating that the central film thickness is enhanced when waviness is incorporated. Generally, the
ratio increases as
A or Ω
x increases. Within the simulated ranges of
A and Ω
x, the maximum
value is around 8.799 (
Table 3), corresponding to Ω
x ≈ 67 and
A = 3.3. The frequency value has reached the upper-frequency limit used in this work. The amplitude value is at the middle of the amplitude range. This result means that an amplitude value exists that enhances the central film thickness the most. In other words, the central film thickness is more sensitive to waviness amplitude.
The contour map of the mean film thickness ratio (
Figure 3d) has a similar pattern to that of the central film thickness (
Figure 3c). The
ratio values are greater than one, meaning the waviness can enhance the mean film thickness. In general, the
ratio increases as
A or Ω
x increases. Within the simulated ranges of
A and Ω
x, the maximum
value is around 5.056 (
Table 3), corresponding to Ω
x ≈ 67 and
A = 3.3. This pair of amplitude and frequency is the same as that corresponds to the maximum
value. It is expected that the maximum
value (5.056) is smaller than the maximum
value (8.799). Moreover, a specific amplitude value still enhances the mean film thickness the most, just like the situation in the central film thickness. Thus, the mean film thickness can be considered more sensitive to waviness amplitude.
When comparing the contour maps of the central and mean film thicknesses between the partial (this paper) and full (Part I paper) film conditions, the most significant difference is the amplitude and frequency values corresponding to their maxima. In our previous work, where the amplitude range is between 0.02 and 0.3, the amplitude and frequency corresponding to the maximum central and mean film thickness ratios are at the right-up corner of the contour map, representing the maximum frequency and amplitude used in the simulations. However, in this work (), the maximum and values are obtained with the maximum frequency and a medium amplitude (A = 3.3). Such a difference illustrates that as the amplitude continuously increases, the central and mean film thickness won’t monotonically increase. The central and mean film thickness will decrease when the asperity contact ratio is high enough. As for the frequency value, it is clear that within the frequency range used, the higher the frequency is, the greater the enhancement of central and mean film thickness.
In summary, when the point contact EHL system runs into the partial film regime, the waviness can increase the central and mean film thickness but decrease the minimum film thickness in most cases. The central film thickness is the film thickness at the fixed central point (,) in the solution domain. The mean film thickness is the average value of the film thickness values within the nominal Hertzian contact zone. The increase in the central and mean film thickness proves that incorporating waviness can further lift the ball, enhancing the EHL effect. As the name suggests, the minimum film thickness is the minimum value of the film thickness distribution. The decreased minimum film thickness indicates that the lifting effect of the ball is inadequate to counteract the effects of the wave valleys on the minimum film thickness. The decrease in the minimum film thickness is usually considered to be a degradation of the EHL performance.
It should be highlighted that the minimal film thickness can be enhanced with the minimum frequencies and amplitude (Ω
x ≈ 4.2 and
A = 2) used in the simulations with
w = 200 N,
us = 2 m/s, and
θ = 0°. Therefore, one can have a specific situation in which the central, mean, and minimum film thickness all increase by controlling the amplitude and frequency of the waviness. That is the waviness with Ω
x ≈ 4.2 and
A = 2. In our previous paper [
1], the recommended waviness parameters were the maximum frequency (Ω
x ≈ 67) and maximum amplitude (
A = 0.3) used in the simulations for the EHL problem with
w = 200 N,
us = 3 m/s, and
θ = 0°. Such an opposite recommendation is due to the lubrication regime and the amplitude range considered. Therefore, one should remember that when approaching the partial film regime by increasing the waviness amplitudes, the best choice of amplitudes and frequencies to enhance the EHL effects needs to be re-examined.
Figure 4 shows the contour maps of ratios of the pressure parameters, friction coefficient, and the maximum temperature rise with and without waviness.
Figure 4a shows that the
ratios are greater than one, indicating that incorporating waviness results in a more significant maximum pressure. When the
A or Ω
x increases, the
ratio increases. The maximum
value is approximately 20.808, again occurring at the point with the maximum frequency (Ω
x ≈ 67) and an intermediate amplitude value (
A = 4.7 ), nearing the maximum amplitude used in the simulations. Such results suggest that increasing the amplitude or frequency results in a higher maximum pressure in most cases. Increasing them has synergistic effects in enhancing the maximum pressure. Moreover, the maximum
value here exceeds our previous Part I paper. The reason should be that the amplitudes used here are much greater than those in the Part I paper.
If one looks at
Figure 3a and
Figure 4a simultaneously, it can be found that the maximum pressure occurs when the asperity contact occurs. However, the maximum pressure and maximum asperity contact ratios have different corresponding frequencies and amplitudes. The maximum asperity ratio occurs at Ω
x ≈ 46 and A = 5, while the maximum
value occurs at Ω
x ≈ 67 and A = 4.7. Generally, researchers prefer to think the larger the asperity contact ratio is, the higher the maximum contact pressure will be. Thus, such a difference challenges this common idea and suggests one should consider the asperity contact ratio and maximum pressure separately.
Furthermore,
Figure 3 has shown that waviness with a high frequency and large amplitude can generate a thicker lubricant film in terms of the central and mean film thickness. At the same time,
Figure 4a shows that such cases lead to more significant maximum pressure. Maximum pressure increases are usually regarded as unfavorable in an EHL system. Thus, it is necessary to comprehensively consider the influences of waviness on the film thickness and pressure when one wishes to utilize waviness to enhance the EHL effects.
Figure 4b shows the central point pressure ratios (
) with and without waviness. The
results fluctuate between 0.875 and 1.699. This range is around one and much smaller than that of the
(between 1.242 and 20.808). Moreover, the fluctuation of the
ratios is more relevant to the change in the frequencies. Such results are similar to that in the Part I paper. The central pressure is the pressure at the fixed central point. Its value is more dominated by the maximum Hertzian contact pressure, a constant in a given EHL problem. Therefore, whether in the full or partial film regime, the
ratio contour map provides less information than the
ratio contour map.
Figure 4c shows the ratios of the COF with and without waviness (
). The
ratios vary from 0.847 to 1.766. It is clear that the COF ratio increases first and then decreases as the frequency increases. As for the amplitude, increasing it increases the COF ratio within the simulations of the current work. Thus, the minimum COF ratio occurs at Ω
x ≈ 67 and
A = 2.7, a waviness with a high frequency and small amplitude. The maximum COF ratio occurs at Ω
x ≈ 40 and
A = 5. This specific combination of frequency and amplitude is close to the parameters leading to the maximum asperity contact ratio (
Figure 3a, Ω
x ≈ 46 and
A = 5). This phenomenon indicates that the maximum COF mainly depends on the asperity contact ratio when the system works in the partial film regime.
It should be highlighted that in our Part I paper, where the amplitude is relatively small (), the decreases to smaller than one as the amplitude and frequency increase. Such a vast difference should be due to the differences in the composition of friction force between full and partial film regimes. The friction force in the full film regime is merely the viscous shear force within lubricants. In the partial film regime, the friction force comprises the lubricant’s viscous shear and the solid friction between asperities. The solid friction between asperities is much greater than the viscous shear force. Therefore, once the asperity contacts are severe to a certain extent, the solid friction between them will dominate the comprehensive friction. Furthermore, it can be concluded that once the EHL system runs in the partial film regime, it would be better to have a relatively smooth surface topography to reduce the COF.
Figure 4d shows that the
ratios are greater than one, indicating that incorporating waviness results in a higher temperature rise in the lubricated zone. The
ratio seems to be more sensitive to the frequency values. As the frequency increases, the
ratio increases significantly. When increasing the amplitude, the
ratio slightly increases and then decreases. It is worth reminding readers that the results in the Part I paper show that the increasing of
value leads to decreasing viscosity, then reducing the COF when the EHL system is within the full film regime. This relationship is still valid in the current work, although the asperity contacts occur. The maximum
ratio is approximately 1.680 when Ω
x ≈ 67 and
A = 3.7. The COF and asperity contact ratios corresponding to this specific frequency and amplitude are around 0.921 and 0.144, respectively. This result means that even when the asperity contacts occur, one can still obtain a reduction of COF by designing the amplitude and frequency of waviness to decrease the viscosity by increasing the temperature.
Combining the information in
Figure 3 and
Figure 4, when the amplitude increases to initiate asperity contacts, generally, waviness with a high frequency and large amplitude can generate severe asperity contact ratio, a thicker lubricant film in terms of the mean and central film thickness, with a higher maximum pressure, and result in a greater COF, with a higher temperature rise. Generally, a thick lubricant film and small COF are positive results, but high maximum pressure and temperature rise are negative when studying EHL problems. Incorporating waviness can affect them simultaneously. Thus, the conclusion as to whether waviness benefits or does not benefit an EHL problem cannot be drawn directly. After comprehensively considering these pros and cons, one may decide whether incorporating waviness will benefit their studies.
3.2. The Influence of the Wave Direction
The results simulated with
w = 200 N and
us = 2 m/s are used to discuss the influence of the wave direction. In order to highlight the influences of the wave directions, two cross lines of each contour map were extracted, which are the lines with fixed
A = 3.7 or fixed
Nw = 19 (Ω
x ≈ 39.8). Then, the extracted lines with the same performance parameters were plotted in one graph. In each graph, the four curves correspond to the four directions
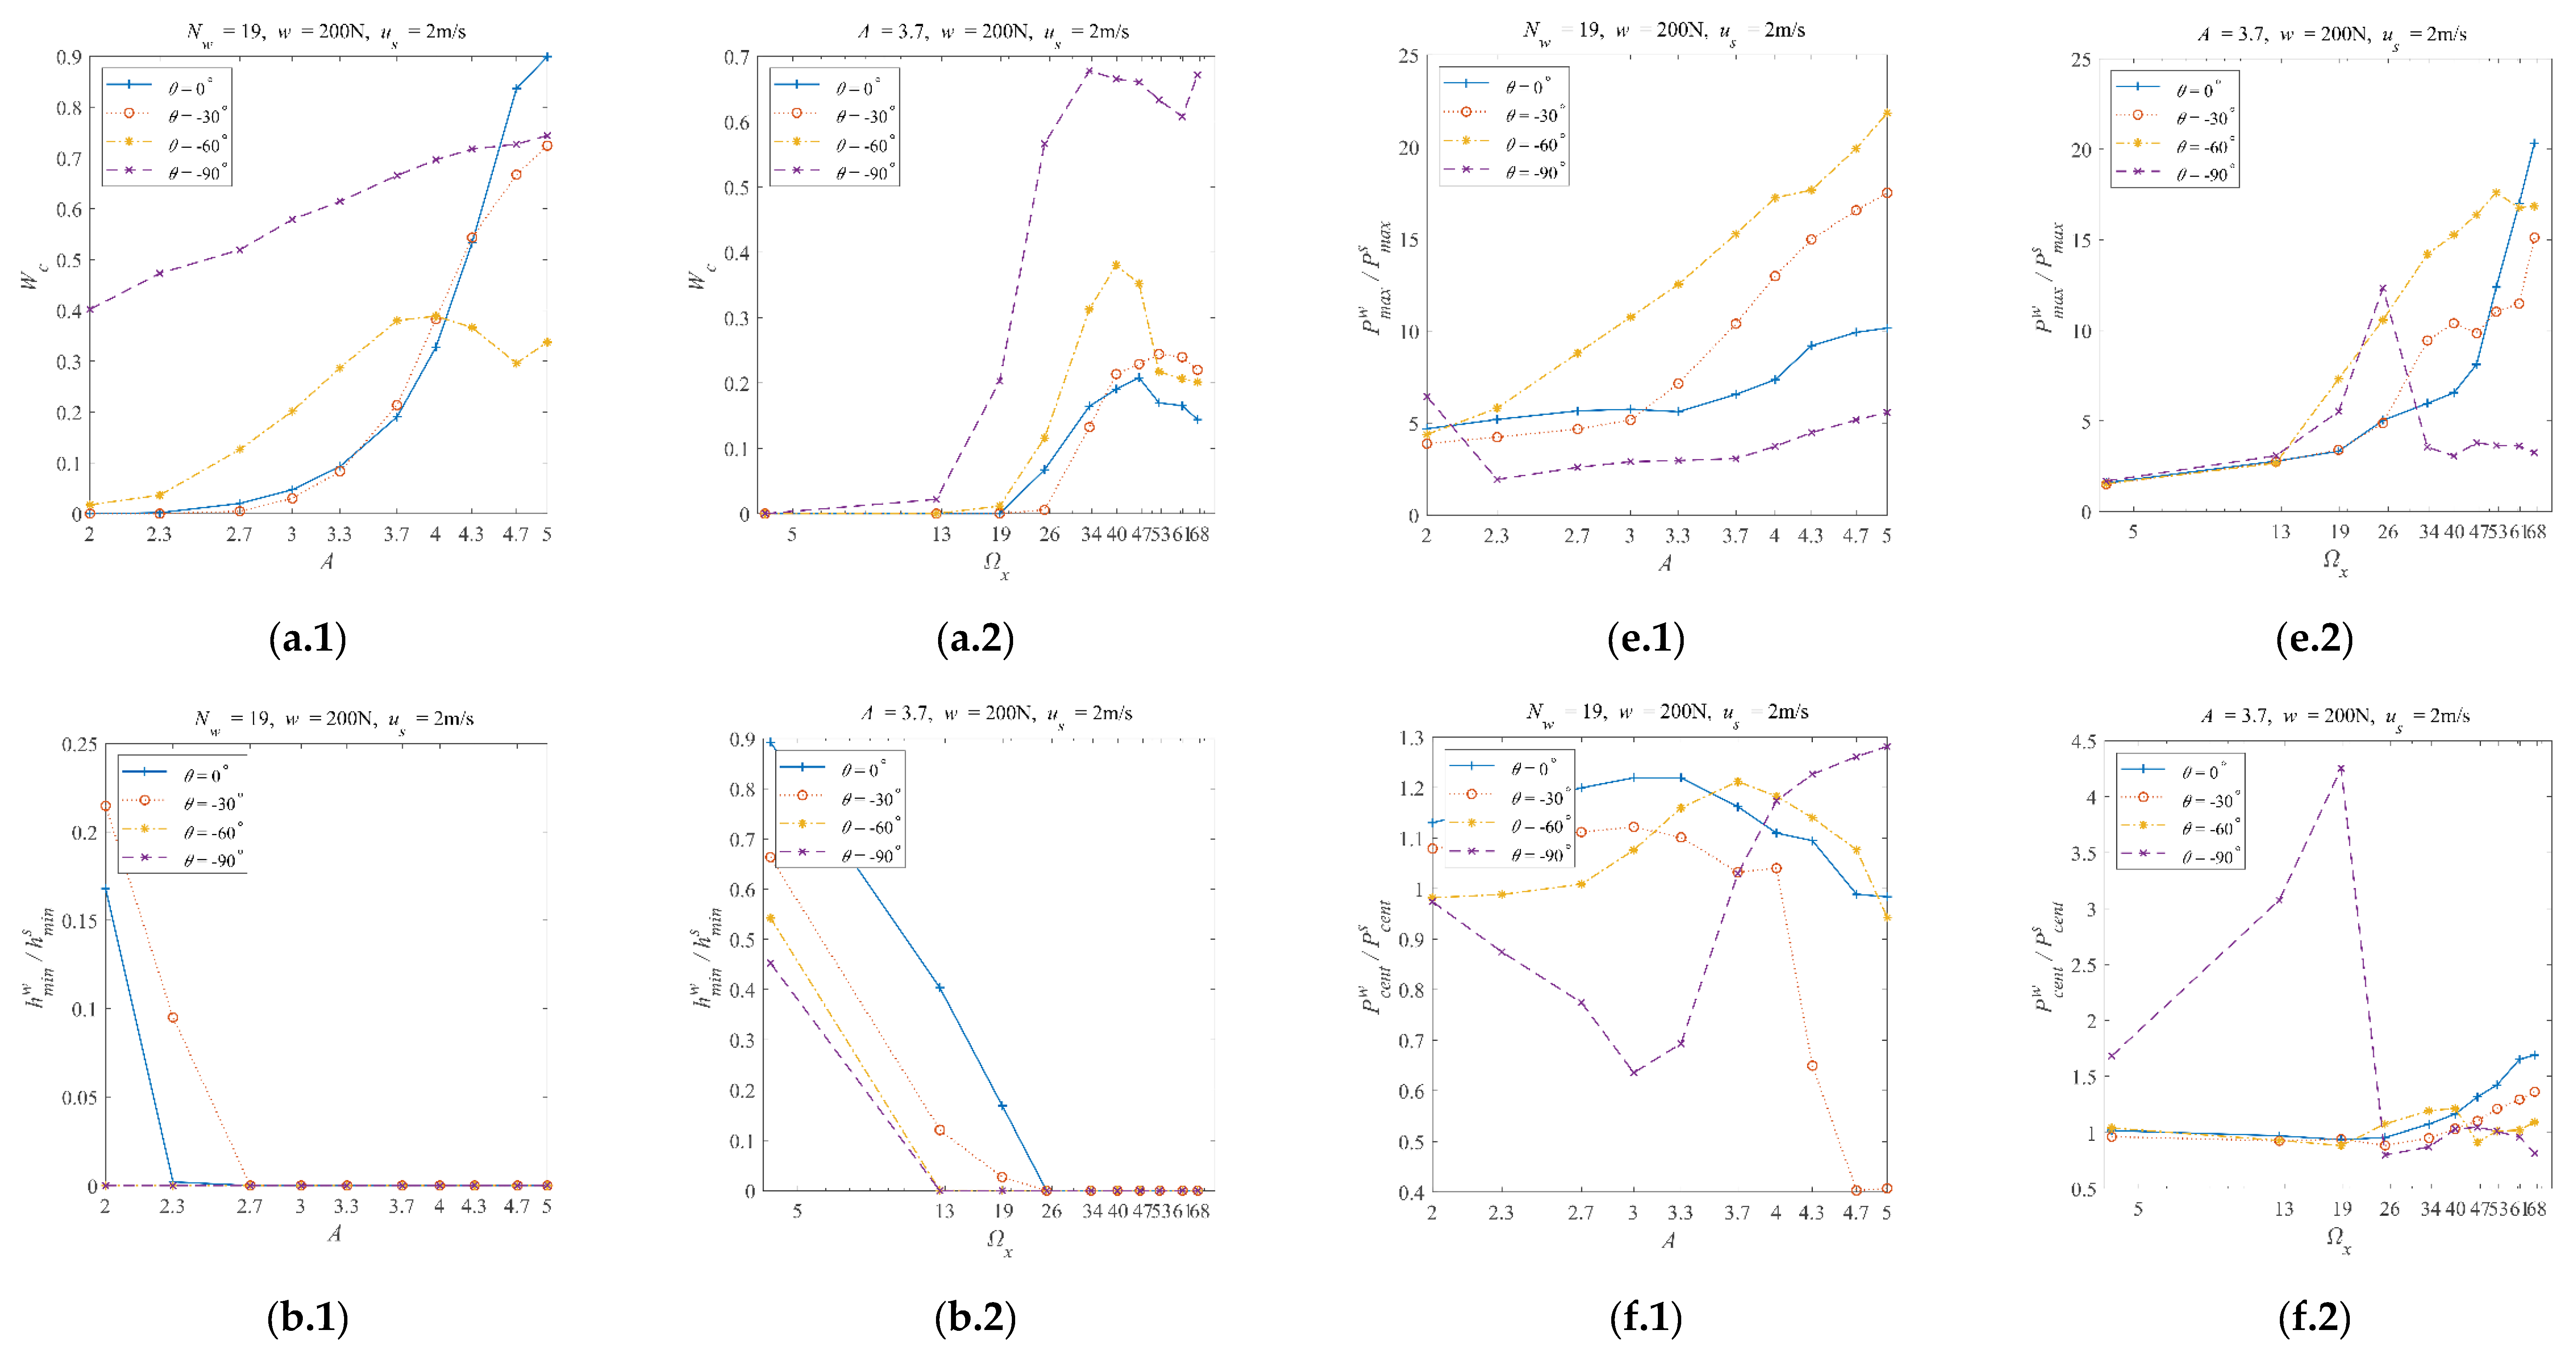
θ = 0°, −30°, −60°, and −90°. There are sixteen such graphs organized as sub-figures in
Figure 5. Indices a to h represent the eight performance parameters, where ‘1’ and ‘2’ indicate the results of the fixed
Nw = 19 and
A = 0.09, respectively.
Figure 5a.1 shows that the asperity contact ratio generally increases as the amplitude increases for most cases. The increase trends are similar for the wave directions of 0°, -30°, and -60°. That is, when the amplitude is relatively small, the asperity contact ratio is zero, meaning no asperity contact. However, for the longitudinal (−90°) waviness, there are significant asperity contacts even with the minimal amplitude used in the current simulations. Such differences between longitudinal and other directions of waviness also appeared in our previous Part I paper.
Figure 5a.2 shows that all the wave directions have similar trends of asperity contact ratio as the frequency increases. The asperity contact ratio first increases from zero to a maximum value and then decreases as the frequency increases. This phenomenon means that specific waviness frequencies may weaken the micro-EHL effects most in the mixed lubrication regime, resulting in the maximum asperity contact ratio. Moreover, considering the transformation of transverse (0°) waviness to longitudinal waviness (−90°), Figures 5a.1 and 5a.2 clearly show that the asperity ratios generally increase along with such a process.
All the
ratios in
Figure 5b.1,b.2 are smaller than one, indicating the minimum film thickness decrease due to waviness. Moreover, as the amplitude or frequency increases, the EHL system works in the partial film regime; thus, the minimum film thickness is gradually reduced to zero, indicating that asperity contacts are occurring. When the wave direction turns from transverse (0°) to longitudinal (−90°), the amplitude or frequency value corresponding to the zero minimum film thickness decreases. This result shows again that the transverse waviness can enhance the EHL effects the most, while the longitudinal waviness has little positive effect on the EHL effects. This point is consistent with the results reported in our previous Part I paper [
1].
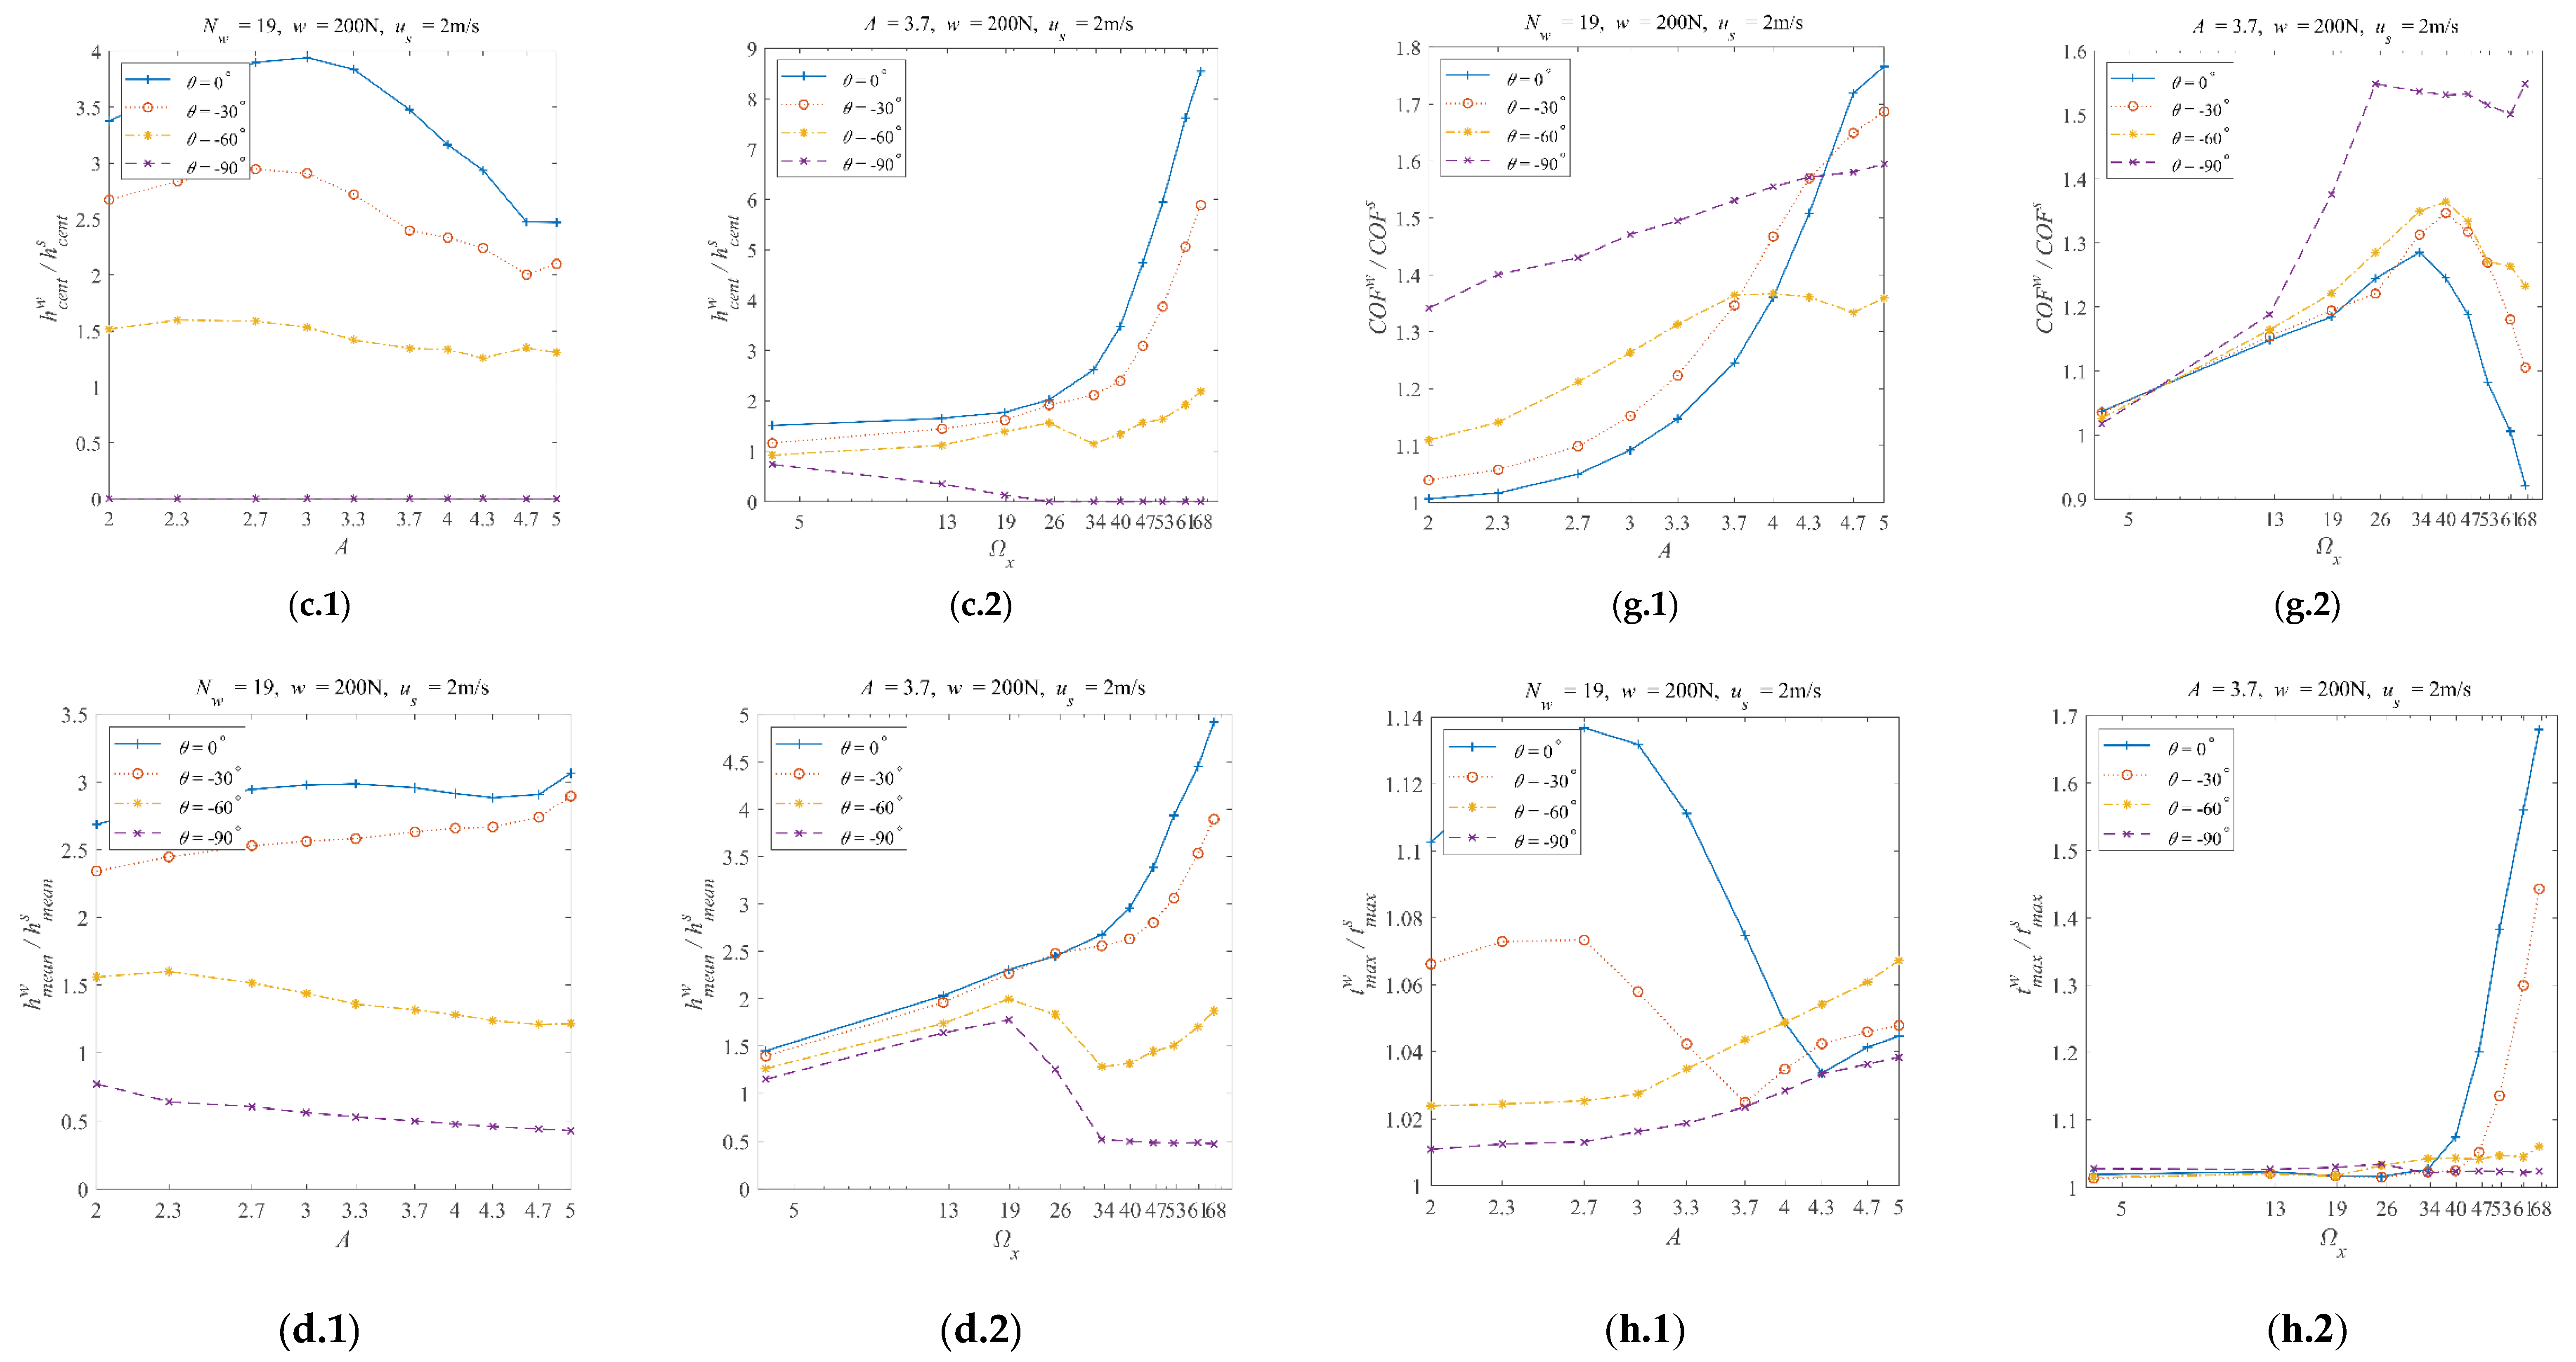
Figure 5c.1,c.2 show the
ratios. It is evident that the longitudinal waviness (
θ = −90°) results in a different trend of the central film thickness ratios compared to the other three wave directions (
θ = 0°, −30°, and −60°). In
Figure 5c.1, when
θ = 0°, −30°, and −60°, the central film thickness ratios are greater than one and decrease as the amplitude increases. When
θ = −90°, the central film thickness is zero and does not change as the amplitude changes. In
Figure 5c.2, when
θ = 0°, −30°, and −60°, the central film thickness ratios are almost greater than one and follow an increasing trend as the frequency increases. When
θ = −90°, a decreasing trend is observed as the frequency increases. Moreover, as the wave directions turn from
θ = 0° to
θ = −30°, the
ratios decrease. Thus, converting the transverse waviness to longitudinal waviness generally decreases the
ratio.
Figure 5d.1,d.2 show the mean film thickness ratios. They have similar patterns to the central film thickness ratios shown in
Figure 5c.1,c.2. In
Figure 5d.1, when
θ = 0°, −30°, and −60°, the mean film thickness ratios are greater than one, while
θ = −90°, the mean film thickness ratios are smaller than one. Moreover, when
θ = 0°, −30°, the mean film thickness ratios increase as the amplitude increases. In comparison, the mean film thickness ratios decrease as the amplitude increases when
θ = -60°, −90°. In
Figure 5d.2, when the frequency is not greater than 19, the four directions of waviness correspond to mean film thickness ratios greater than one. The
ratios increase as the frequency increases. When the frequency is greater than 19, the mean film thickness ratios still increase as the frequency increases for
θ = 0°, −30°. While for
θ = -60°, −90°, the mean film thickness decreases rapidly as the frequency increases to around 34. Then, the mean film thickness ratio increases again for
θ = −60° and decreases slowly for
θ = −90°. Furthermore, the mean film thickness ratio can be smaller than one when
θ = −90°. These results mean that the
ratios decrease as the wave directions turn from transverse to longitudinal. Moreover, the effects of amplitude and frequency on the mean film thickness ratios show different trends as the wave directions turn to longitudinal.
Considering Figures 5a to 5d comprehensively, it can be concluded that converting transverse waviness to longitudinal waviness decreases the EHL effects in terms of the film thickness under most circumstances. This point is the same as that drawn from the simulations within the full film regime. This should be because converting the waviness from transverse to longitudinal decreases the waviness’s equivalent frequency in the direction of the relative motion (
X-direction). The deviation in the surface geometry in the direction of the relative motion plays a critical role in generating hydrodynamic effects. According to the discussion in
Section 3.1, the frequency decrease in the
X-direction usually decreases the EHL effects regarding the film thickness.
Furthermore, comparing the results regarding the film thickness in this paper (corresponding to partial film regime) with those in our previous Part I paper [
1] (corresponding to full film regime), it can be found that the longitudinal waviness has more significant effects when the EHL system works in the partial film regime.
Figure 5e.1,e.2 show that the
ratios are significantly affected by the alterations in the wave directions. This phenomenon differs from that shown in the Part I paper, where the maximum pressure ratios are almost unaffected by wave directions except
θ = −90°. The maximum pressure ratios increase as the amplitude increases for most cases, as shown in
Figure 5e.1. As the wave direction turns from transverse (0°) to longitudinal (−90°), the growth rate of such an increasing trend first increases and then decreases. The fastest case in the current simulations is the waviness, whose direction is −60°.
Figure 5e.2 shows similar trends, but the growth rate is also sensitive to the frequency of waviness. When the frequency is no greater than 13, the maximum pressure ratios increase as the frequency increases. Moreover, the corresponding growth rate is almost the same. When the frequency further increases to around 47, the maximum pressure ratios increase at a different rate corresponding to wave directions. The wave direction of −60° is still the fastest-increasing case. A sharp peak appears for the longitudinal waviness. As the frequency increases to the maximum value used in the current simulations, the increase rate corresponding to the transverse waviness gradually exceeds other wave directions. Overall, combining Figures 5e.1 and 5e.2, the longitudinal waviness produces the slightest increase in the maximum pressure.
Figure 5f.1 shows that the
ratios vary differently as the amplitude increases when the wave direction changes. The central pressure ratio values can be greater or less than one. When
θ = 0°, −60°, the variation range of the central pressure ratios is relatively small compared with that corresponding to
θ = −30°, −90°. The minimum central pressure ratio is around 0.4 when the wave direction is −30° and the amplitude reaches 4.7. The maximum central pressure ratio is close to 1.3 when the wave direction is −30° and the amplitude is 5. In
Figure 5f.2, the
ratios are close to one and have slight differences when
θ = 0°, −30°, and −60°. When
θ = −90°, the central pressure ratio sharply peaks as the frequency increases. The maximum value is greater than 4 when the frequency is around 19. These results suggest that longitudinal waviness increases the central pressure, while the other wave directions have relatively small impacts on the central pressure.
Figure 5g.1,g.2 provide the
ratios. It should be highlighted that the patterns are pretty much the same as those shown in
Figure 5a.1,a.2, representing the asperity contact ratios. This phenomenon is because the simulated EHL system works in the partial regime. When asperity contacts occur, the friction force between asperities is much greater than the viscous friction. The summation of asperity friction force and viscous friction equals the total friction force. Thus, the COF ratios show the same patterns as the asperity contact ratios. Another point to address is that the COF ratios can be smaller than one, meaning a friction reduction by incorporating waviness when the amplitude and frequency of waviness are appropriately designed (e.g.,
A=3.7, Ω
x ≈ 67,
θ = 0° in
Figure 5g.2 ). It should be noted that the longitudinal waviness cannot decrease the COF in most cases.
Figure 5h.1 shows that the
ratios fluctuate as the amplitude increases. When
θ = 0° or −30°, the maximum temperature rise ratio first slowly increases, rapidly decreases, and then increases again as the amplitude increases. When
θ = −60° or −90°, the maximum temperature rise ratio slowly increases as the amplitude increases. These results suggest that the variation of the maximum temperature rise ratio corresponding to amplitude is sensitive to the wave directions. In
Figure 5h.2, the results are pretty different from those in
Figure 5h.1. The maximum temperature rise ratio for all four wave directions does not vary much when the frequency value is no greater than 34. As the frequency further increases, the maximum temperature rise ratio corresponding to the wave direction of 0° first increases rapidly, then the −30° and −60° waviness. The −90° waviness does not significantly increase the maximum temperature rise ratio. These results indicate that longitudinal waviness can reduce the maximum temperature rise within the EHL zone compared with other forms of directional waviness.
According to the discussions above, the waviness with θ = 0°, −30°, and −60° results in more similar patterns than those with longitudinal waviness (θ = −90°). In summary, waviness moving toward the longitudinal direction increases the asperity contact ratio, reduces the film thickness, and increases the COF. In the meantime, the maximum pressure increases, and the maximum temperature rise decreases as the wave direction turns from 0° to −60°. The central pressure is relatively slightly affected by changing the wave directions. The increase in COF is due to the rise of asperity contact ratios, which dominate in generating friction force. In our previous Part I paper, the COF reduces when the transverse waviness turns to longitudinal waviness because the system works in a full film regime.
The longitudinal (θ = −90°) waviness is expected to result in different patterns than other wave directions. In our previous Part I paper, such phenomena have been thoroughly analyzed. The reason is that the longitudinal waviness does not change the initial surface geometry in the relative motion direction. This means little additional EHL effect is generated as the longitudinal waviness passes the Hertzian contact zone. Therefore, the current paper does not discuss the results separately with longitudinal waviness. However, all the contour maps can be found in
Supplementary Material S1 for readers’ convenience.
3.3. The Influences of the Load and Speed
According to
Section 3.2, the transverse waviness (
θ = 0°) generates the most significant additional EHL effects in most cases. Thus, the results regarding transverse waviness are discussed to represent and highlight the influences of the load and speed.
The two cross lines of each contour map, i.e., the lines with
A = 3.7 or Ω
x ≈ 39.8 (
Nw = 19), were also extracted. Then, the extracted lines with the fixed wave direction (
θ = 0°), the same type of performance parameter, and the same constant
A or Ω
x were plotted in one graph. In each graph, the four curves representing the four combinations of loads (
w = 200 N or 500 N) and speeds (
us = 0.3 m/s or 2 m/s) show the impacts of the load and speed. The four combinations are indexed as i: (
w = 500 N,
us = 0.3 m/s), ii: (
w = 200 N,
us = 0.3 m/s), iii: (
w = 500 N,
us = 2 m/s), and iv: (
w = 200 N,
us = 2 m/s). As the working conditions change from i to iv, the corresponding smooth central (or minimum) film thickness increases (see
Table 2). The thinner the film thickness is, the harsher the working conditions are. For one wave direction, there are sixteen such graphs. They are organized as sub-figures.
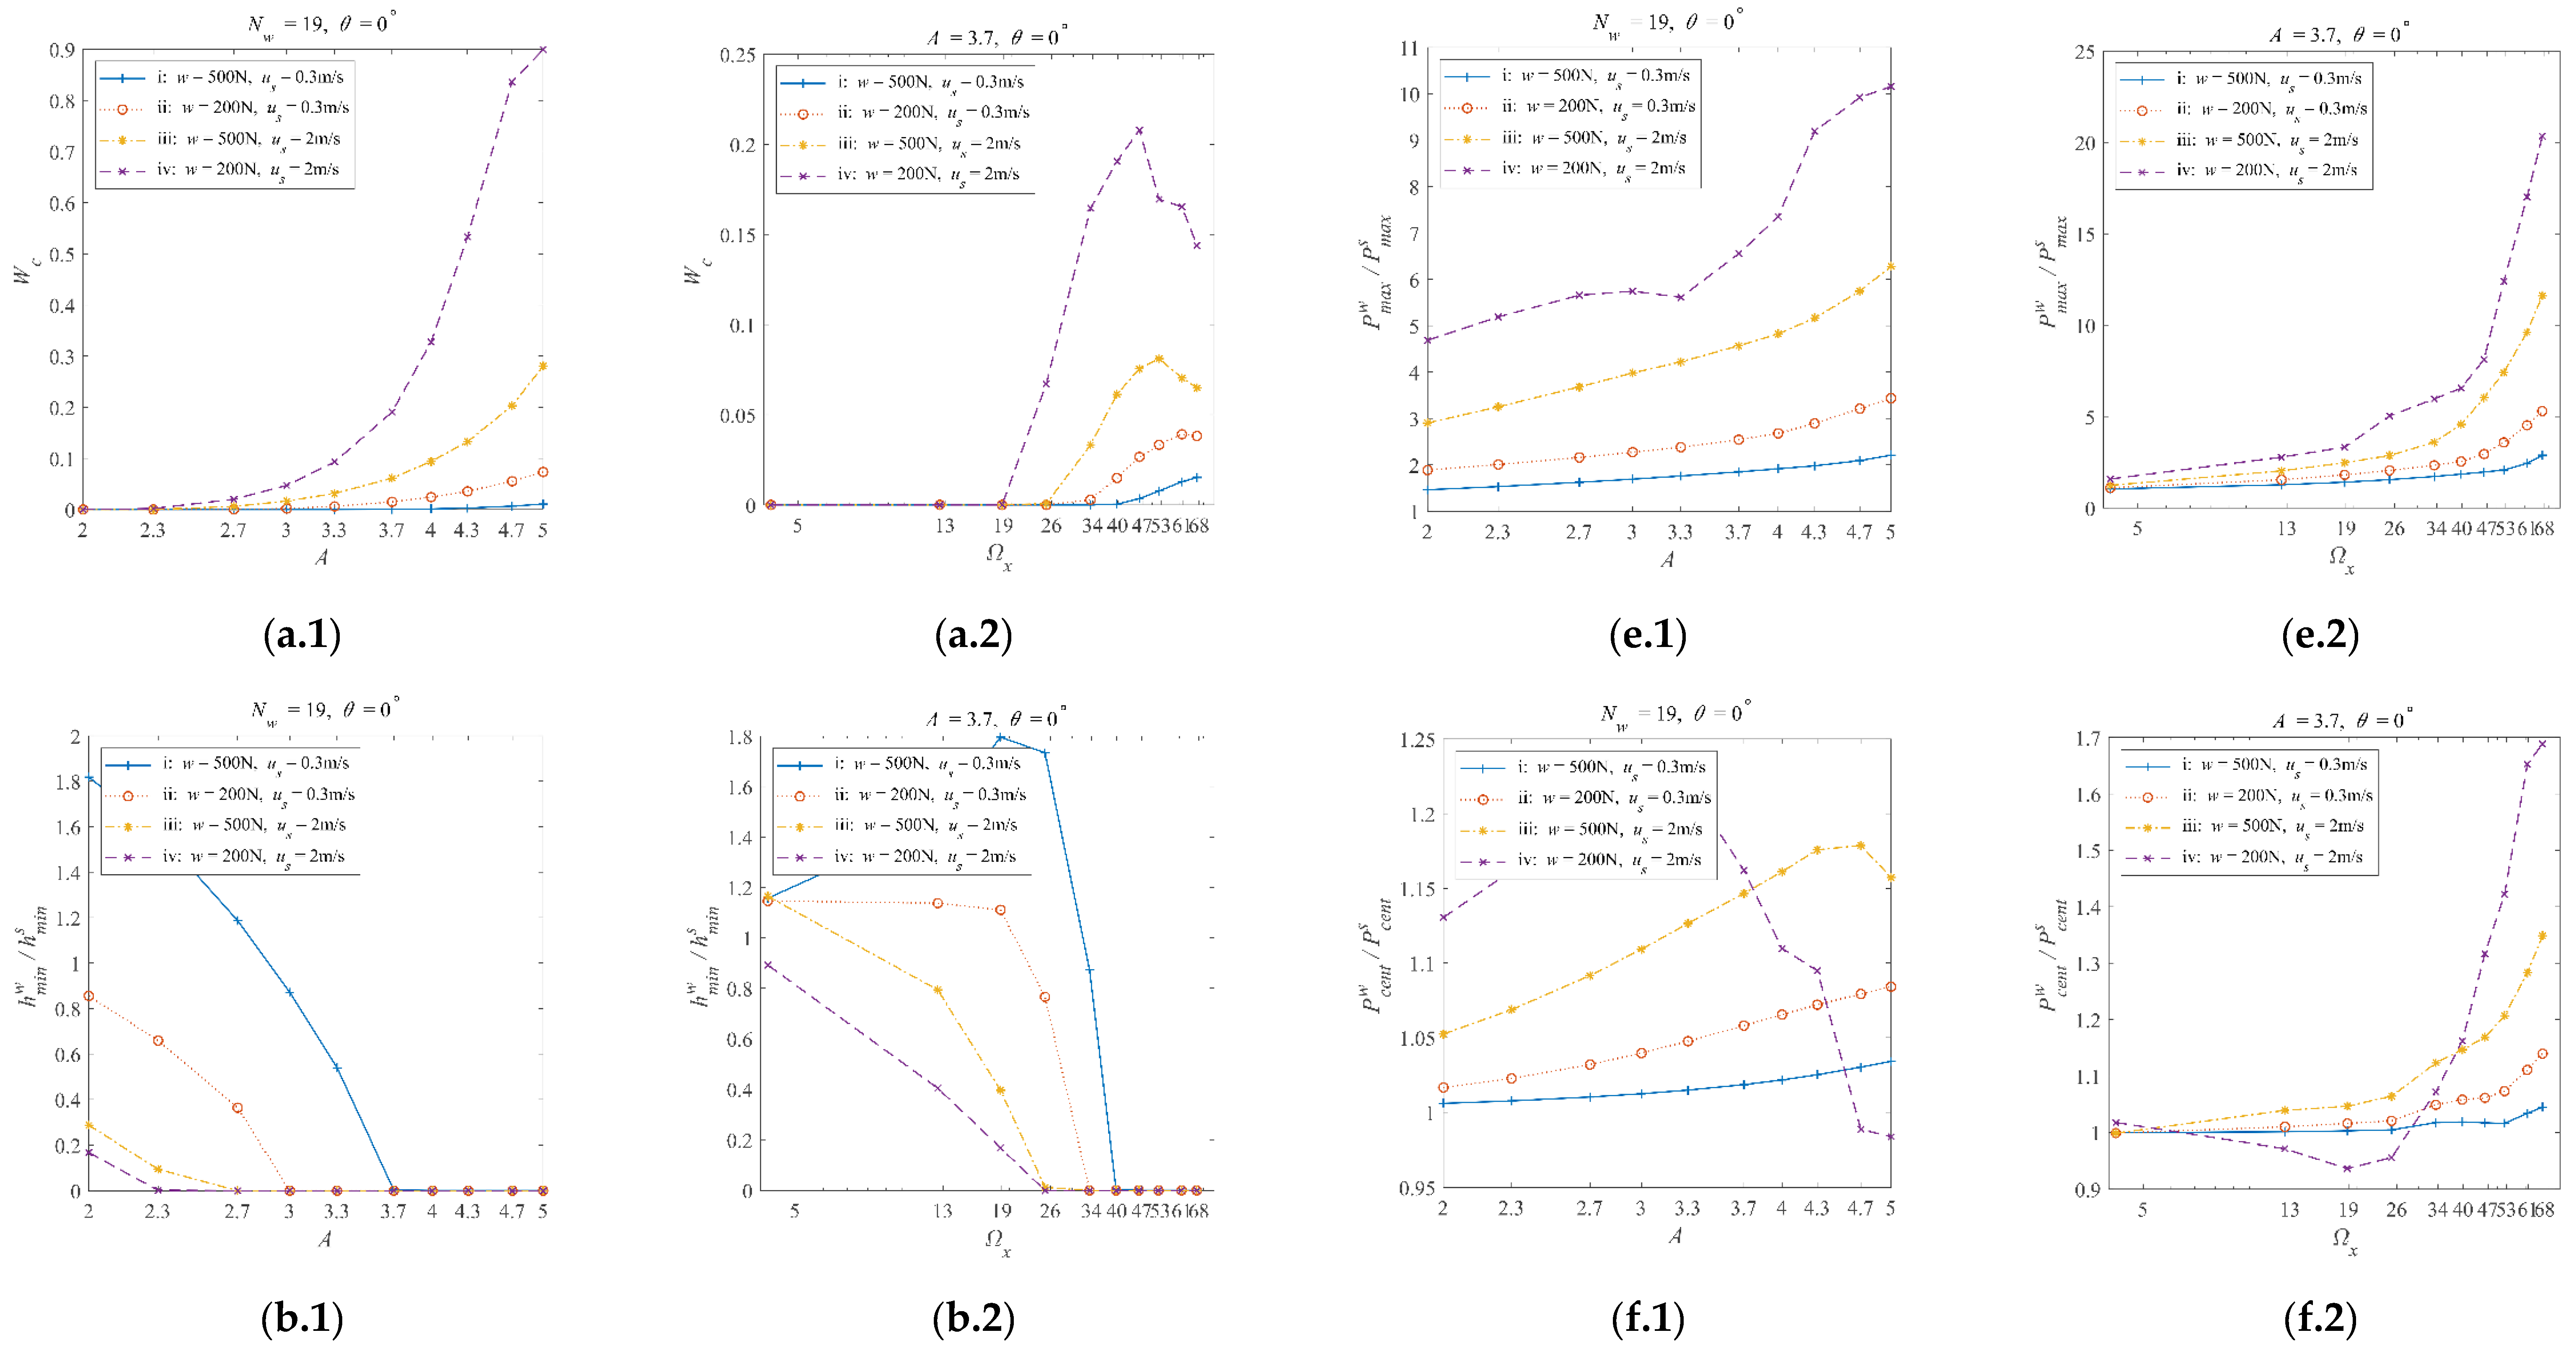
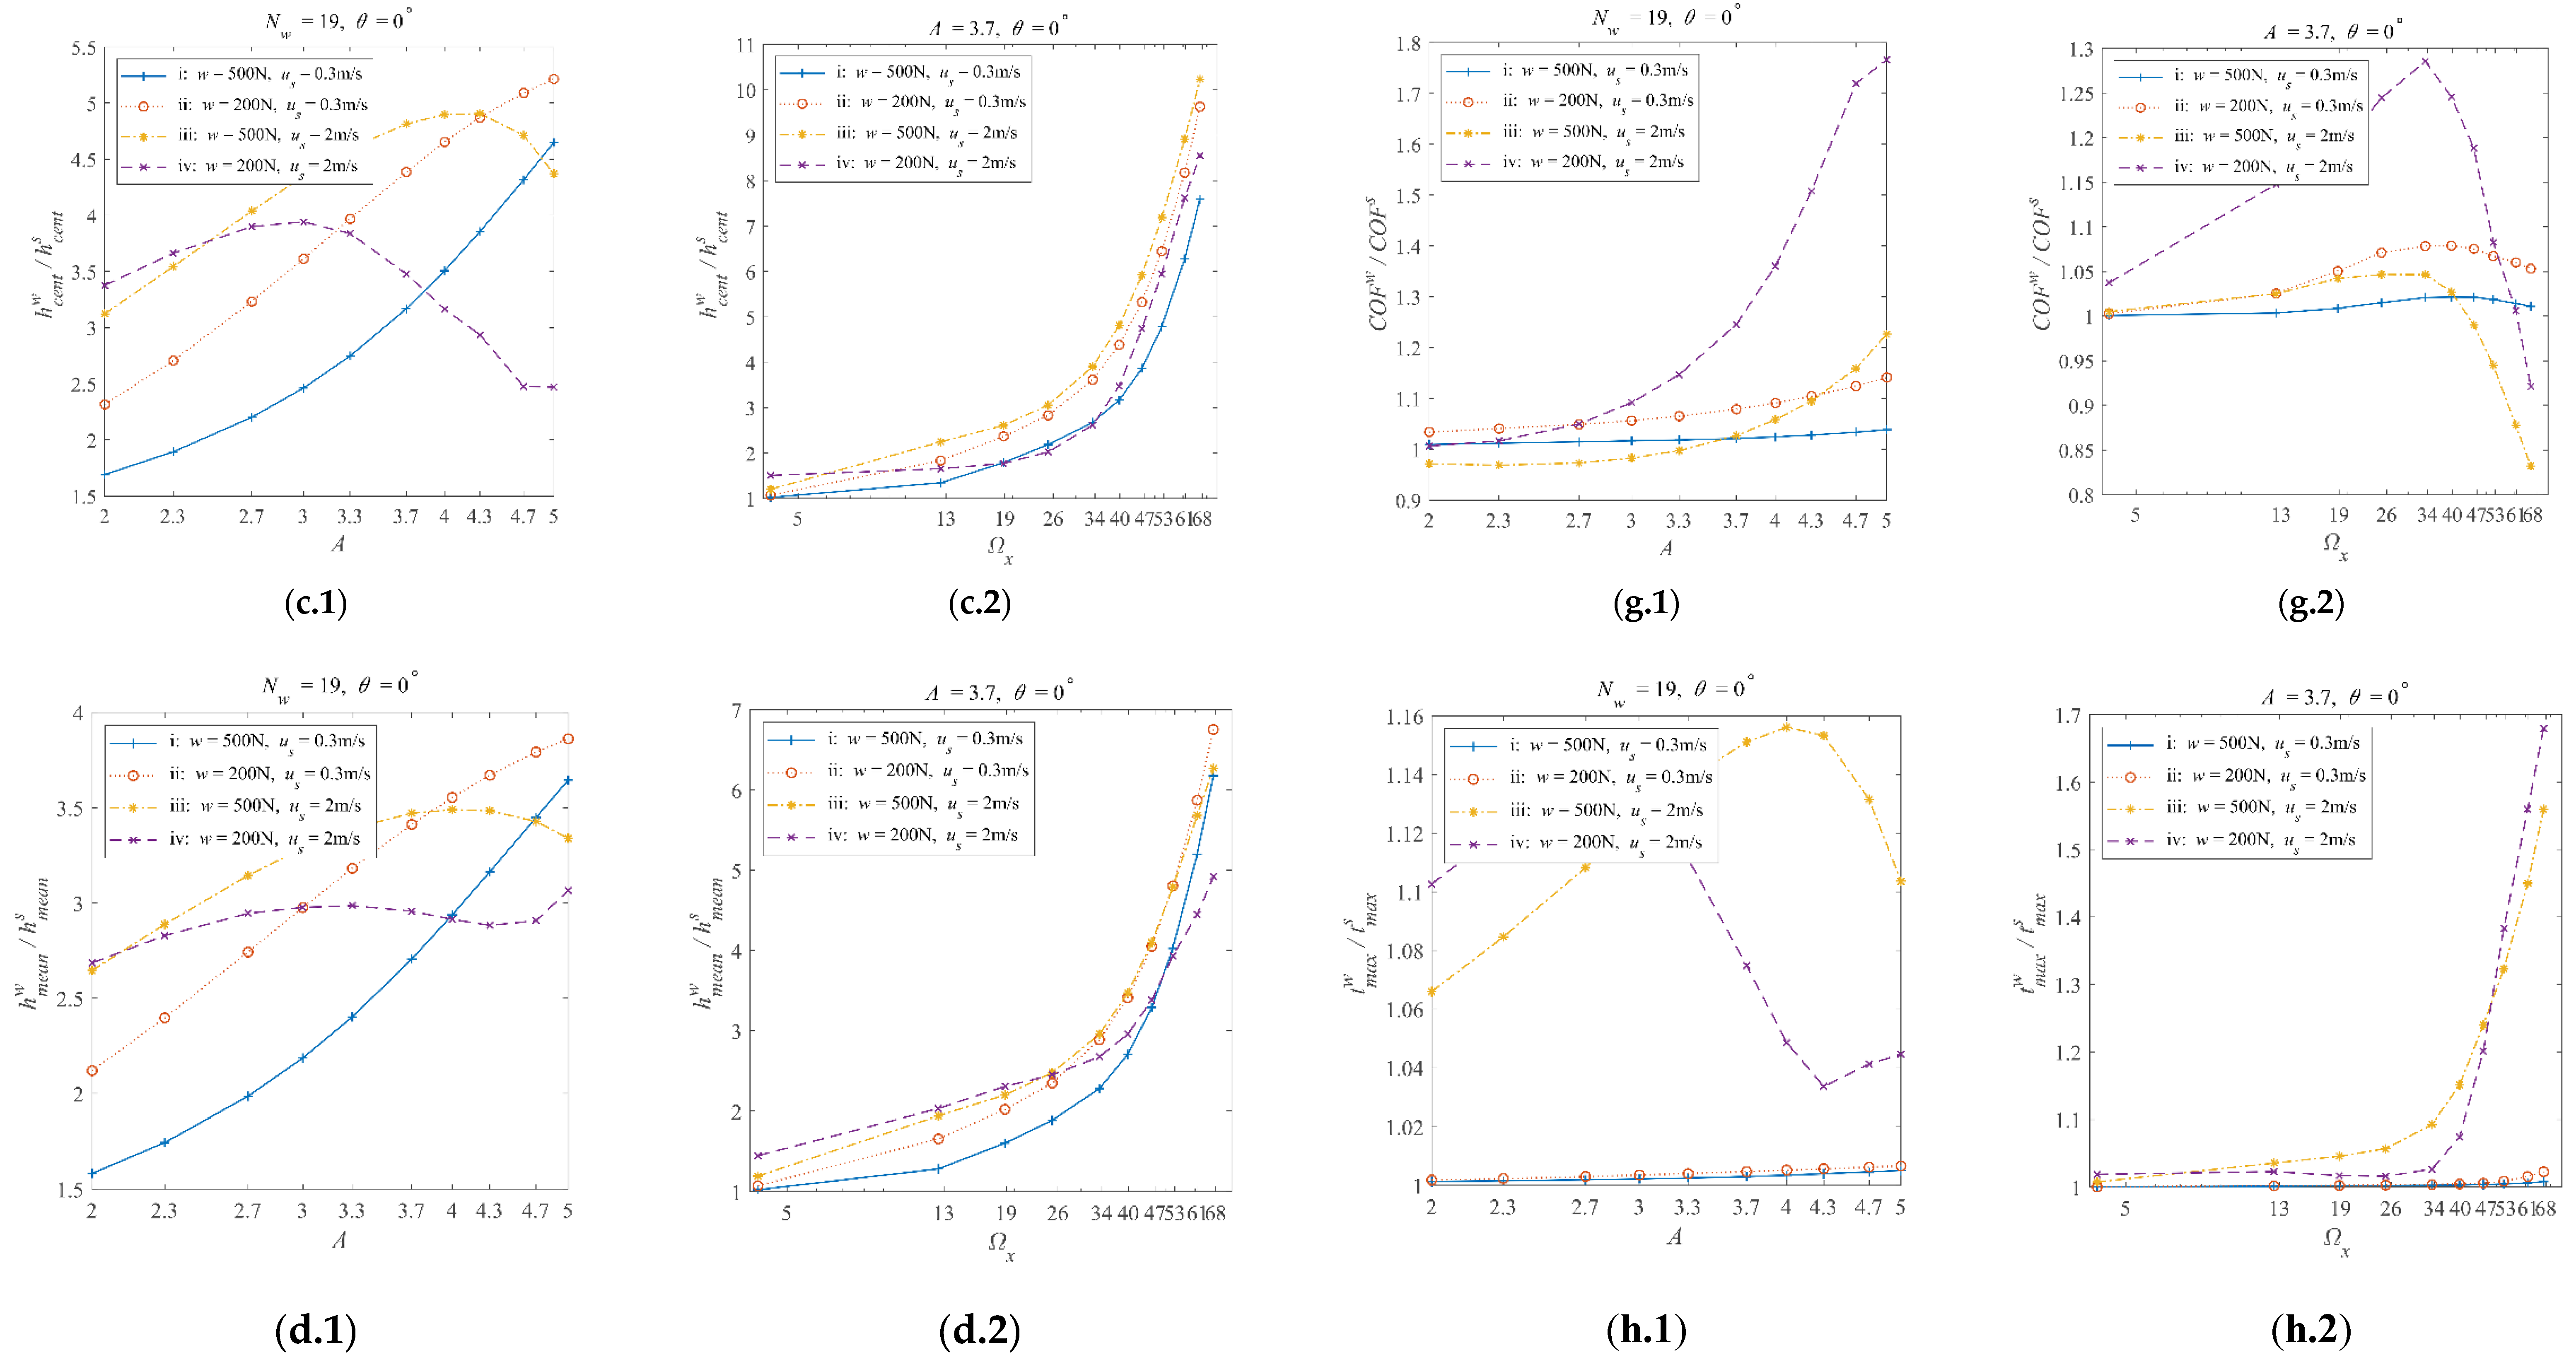
Figure 6 shows the graphs for transverse waviness, where indices a to h represent the seven performance parameters, where ‘1’ and ‘2’ indicate the results of the fixed Ω
x ≈ 39.8 (
Nw = 19) and
A = 3.7, respectively.
Figure 6a.1,a.2 show that different working conditions significantly affect the asperity contact ratio. The
increases as the working condition changes from i to iv for most of the amplitude and frequency values. Such results indicate that mild working conditions result in relatively severe asperity contacts. In order to understand this phenomenon, the definition of the amplitude and frequency should be considered. Equations 3 to 5 show that the non-dimensional amplitude and frequency are related to the central film thickness and Hertzian contact radius corresponding to the smooth EHL. Thus, although the non-dimensional amplitude and frequency shown in
Figure 6a.1,a.2 are the same for the four working conditions, the dimensional amplitude and frequency are very different.
For example, in mild working conditions, such as working condition iv, the film thickness is thicker than other harsher working conditions, showing more significant EHL effects. However, according to equations 3, the same non-dimensional amplitude A results in a much greater dimensional amplitude for working condition iv than for other harsher working conditions. Such a difference in the dimensional wavy amplitude can neutralize the significant EHL effects of mild working conditions and result in relatively severe asperity contacts compared to harsh working conditions.
Figure 6b.1,b.2 show that the minimal film thickness ratio,
, is significantly affected by different working conditions. The minimal film thickness ratio decreases from greater to smaller than one as the working condition turns from i to iv for most of the
A and Ω
x values. This phenomenon indicates that waviness can increase the minimum film thickness under harsh working conditions. When the working conditions become mild ( i to iv), the waviness gradually decreases the minimum film thickness.
Figure 6c,d show that as the working condition turns from harsh (i) to mild (iv), the central film thickness ratio,
, and mean film thickness ratio,
, show an increasing trend.
Figure 6e,f illustrate the influences of the working conditions on the maximum pressure ratio,
, and the central pressure ratio,
. It shows that changing the working conditions from harsh (i) to mild (iv) increases the maximum and central pressure ratios in most cases. It should be noted again that incorporating waviness increases the maximum pressure no matter which working condition is used. As for the central pressure, decreasing it using specific waviness is possible.
Figure 6g.1,g.2 show that the effects of waviness on the COF are the most significant at the mildest condition in the current simulations (condition iv:
w = 200 N,
us = 2 m/s). Another point is that the COF can be reduced by incorporating waviness with specific amplitudes and frequencies, regardless of the working conditions used. On the other hand, adjusting the amplitudes and waviness can increase the COF. One should carefully choose the amplitude and frequency of waviness based on their purposes.
Figure 6h.1,h.2 indicate that the maximum temperature rise is more closely related to the speed value. For a higher speed (
us = 2 m/s, working conditions iii and iv), the maximum temperature rise ratio changes more significantly as the amplitude or frequency changes. This phenomenon is expected, as the shear heat causes the temperature to rise nearly proportionally to the relative speed.
In summary, the effects of the working conditions on the EHL performance with waviness are generally enhanced as the working conditions become mild. Such trends are the same as those in the previous Part I paper, considering only the full film lubrication regime. Moreover, the non-dimensional amplitude and frequency values are determined by the characteristic parameters of an EHL problem (Equations (3) –(5)). Thus, the same non-dimensional waviness indicates that the waviness incorporated is the same regarding scales compared with the EHL system. Based on the simulated results shown above, it is clear that the same non-dimensional waviness leads to very different results for different working conditions. These results indicate the nonlinear nature of the EHL system. A case-by-case basis should be followed to analyze the effects of waviness on the EHL performance.
Furthermore, two points should be addressed. First, the minimum film thickness could be increased by incorporating waviness when the working conditions are harsh. Second, the COF and maximum temperature rise results are more sensitive to changes in speed. This should be because the friction force and the temperature rise are closely related to the shear stresses, which are strongly affected by the relative speed.
