Preprint
Article

Study on Body Weight-Length Relationship and Relative Fatness of Bigeye Grunt Brachydeuterus auritus in the Coastal Waters off Sierra Leone

Altmetrics

Downloads

83

Views

40

Comments

0

Submitted:

24 April 2024

Posted:

24 April 2024

You are already at the latest version

Alerts
Abstract
Bigeye grunt Brachydeuterus auritus is an important economic species in the waters off Sierra Leone in West Africa, with great ecological value. Based on the survey data of bottom trawl nets from 6 voyages from 2019 to 2021, the body weight-length relationship (WLR), as well as their relative fatness, were studied in depth using the method of body length and its corresponding mean body weight. This study fitted the WLR of bigeye grunt by gender, calculated its fullness, and analyzed the influence of environmental factors. The results showed that month and gender had a significant impact on body length and weight distribution (P<0.01). There was a highly significant negative correlation (P<0.01) between the condition factor (a) and the allometric factor (b) in the WLR, and salinity significantly affects b (P<0.05). The (lga)/b ratio was less affected by environmental factors which may be related to the body size and density of the fish. The difference in b between male and female populations was extremely significant (P<0.01). The relative fatness had significant seasonal variation characteristics, with highly significant effects of sex and body length (P<0.01). With increasing body length, the relative fatness showed two types of changes, continuously increasing and first increasing then decreasing, with salinity and b significantly affecting the type of change (P<0.05) and depth having a highly significant effect (P<0.01). The bigeye grunt off the coast Sierra Leone exhibited significant seasonal growth characteristics, with significant differences in growth characteristics between male and female individuals. This study suggested that salinity may be the main factor affecting its growth and development. In addition, this study hypothesised that the peak breeding season may occur during the dry season, beginning in December and ending before April of the following year. The study provides updated and more comprehensive insights into the biology and ecology of the bigeye grunt offshore Sierra Leone, West Africa, which can provide scientific basis for its resource assessment, development and utilization, and resource management.
Keywords: 
Subject: Biology and Life Sciences  -   Aquatic Science

1. Introduction

The bigeye grunt (Brachydeuterus auritus) is an important economic fish species near Sierra Leone, which can be caught by various nets such as bottom trawl nets, gill nets, custom nets, beach seine nets, and portable seine nets [1]. Due to its low price and high protein content, it is the main source of animal protein for many coastal households [2] and is also considered an ideal supplier of high-quality proteins in the diets of infants [3], making important contribution to food security and nutritional provision for local people. Due to its inherent commercial value, the bigeye grunt has been heavily caught in the coastal waters of Sierra Leone in recent years, and its resources may have declined. Moreover, due to national economic and political reasons, there is a lack of systematic and scientific fishery surveys in the region, which has led to an extreme lack of research on fisheries biology and resource assessment [4], and a serious imbalance between fishery production and management. Hence, understanding the ecological characteristics and biological parameters of Sierra Leone's coastal fishes is important for the effective assessment, conservation and management of their fishery resources for sustainable utilisation.
The WLR of fish is the most intuitive characterisation of the low age and small size of fish individuals [5], and provides an important parameter for fishery resource assessment models [6]. Huang et al. [7], demonstrated the rationality and significance of the WLR power function (W=aLb). The a values and b values can reflect the stability and adaptability of fish growth [8], which is influenced by hydrology, season, habitat, bait, sex of fish, growth and development [9,10]. The a value is the condition factor, which represents the environmental conditions under which the population grows and responds to the favourable or unfavourable environment in which the population lives [11]. The b value is the the allometric factor, which reflects the growth status of fish and indicates the heterogeneity of growth [12]. Relative fatness is the condition index, an extension of body length and weight that reflects the energy status and nutritional status of fish at the individual level. When fish of the same species are of equal length, the greater the weight, the higher the relative fatness of the fish and the healthier it is, which is the premise of using the relative fatness to judge the nutritional status of the fish. The relative fatness is often related to fish growth, reproduction, swimming ability, and the ability to withstand exploitation [13,14,15], and can reflect the population dynamics of fishery resources, and can also be used to indirectly evaluate the condition of the living environment [16], which is an indicator of ecosystem suitability [17], and is often used in the conservation evaluation of fishery resources [18].
Currently, there is a relative lack of systematic scientific research on Sierra Leone's offshore fishery resources, and research on single species of fish based on fisheries science surveys is even rarer. Therefore, this study analysed the WLR and the relative fatness of bigeye grunt based on surveys from 2019-2021, and explored the influence of environment factors, with a view to providing reasonable parameters for the establishment of a more accurate stock assessment model, and for the development of effective resource management strategies and conservation measures to ensure the sustainable use of bigeye grunt in the Coastal Waters off Sierra Leone.

2. Materials and Methods

2.1. Study Area and Data Acquisition

The samples of bigeye grunt used in this paper were obtained from the bottom trawl fishery resources survey in the coastal waters of Sierra Leone, which covered the areas of 6°52′~8°52′ N, 11°37′~13°45′ W, with a total of 41 survey stations (Figure 1), and the survey consisted of six cruises, which were conducted in September in 2019 (Sep), October in 2019 (Oct), December in 2020 (Dec), January in 2021 (Jan), April in 2021 (Apr) and May in 2021 (May). Research manuscripts reporting large datasets that are deposited in a publicly available database should specify where the data have been deposited and provide the relevant accession numbers. If the accession numbers have not yet been obtained at the time of submission, please state that they will be provided during review. They must be provided prior to publication.
The survey vessel has an overall length of 42.8 m, a beam of 8 m, a depth of 5.2 m, and a gross tonnage of 399 t. The survey gear was a single-vessel, sleeved, single bladder trawl with a perimeter mesh of 480 mesh, and the main scale of the gear was 144 m × 90.13 m. The operating time per station is 45 to 75 min and the towing speed is 3 to 3.5 kn. For each station, all samples were measured if the number of samples was less than 30, and 50 samples were measured if the number of samples was greater than 30, with a total of 6,642 samples measured.

2.2. Laboratory Analyses

Samples were collected and biological measurements were made in accordance with the Code of Practice for Marine Surveys (CPMS). Measurements included sex, body length, weight, and gonadal maturity, with an accuracy of 1 mm for body length and 0.1 g for weight. According to the visual observation method to record the gonadal maturity and feeding intensity, the gonads were divided into 6 stages, which were expressed as I~VI, and in this study, the grade IV~VI was recognised as the gonadal maturity [19].

2.3. Laboratory Analyses

In this paper, the Paudly power function relationship function was used to fit the WLR of the bigeye grunt [20]. WLR was derived by the formula:
W=aLb
where W is the weight (g) and L is the body length (cm); a and b are condition factor and the allometric factor, respectively. To facilitate the analysis of parameter variability, lna and b were fitted with linear regressions of natural log-transformed body length and mean weight:
lnW=lna+blnL
The parameter a is then calculated:
a=exp(lna)
To avoid taking a value greater than the average weight as a reference point for length selection, the average weight (Wrm) derived from the average length weight relationship representing the entire population was chosen here to represent the level of fecundity. The Wrm formula is as follows:
W rm = 100 W a m L b m
where Wrm is relative body weight (%), L is body length, W is measured weight, am is the geometric mean of the non-abnormal a values of the population in each month, and bm is the arithmetic mean of the non-abnormal b values of the population in each month. The linear relationship between lga and b was used to test for a and b outliers, and when a point deviated from the regression straight line by more than two times the standard deviation it was considered that the point corresponded to an abnormal WLR [10,21]. To exclude the possible effect of age differences on Wrm, samples from the same body length group in each month were taken to calculate Wrm and analysed comparatively in this study [10].
WLRs were fitted and fecundity calculated separately by sex. Mean body length, skewness of body length frequency distribution, proportion of sexual maturity, sea surface temperature (SST), salinity (Sal) and depth (Dep) in each survey month were selected for correlation analyses as factors that might affect the WLRs, and the measured indicators during the survey period are shown in Table 1.

2.4. Statistical Analyses

Variability in body length, weight and relative fatness across months and sexes was tested using one-way ANOVA, skewness of body length frequencies was tested using the Shapiro-Wilk test, and variability in the parameters of the WLR between sexes, as well as differences in the parameter b versus 3, was analysed using an independent samples T-test.

3. Results

3.1. Seasonal Changes in Body Length and Weight

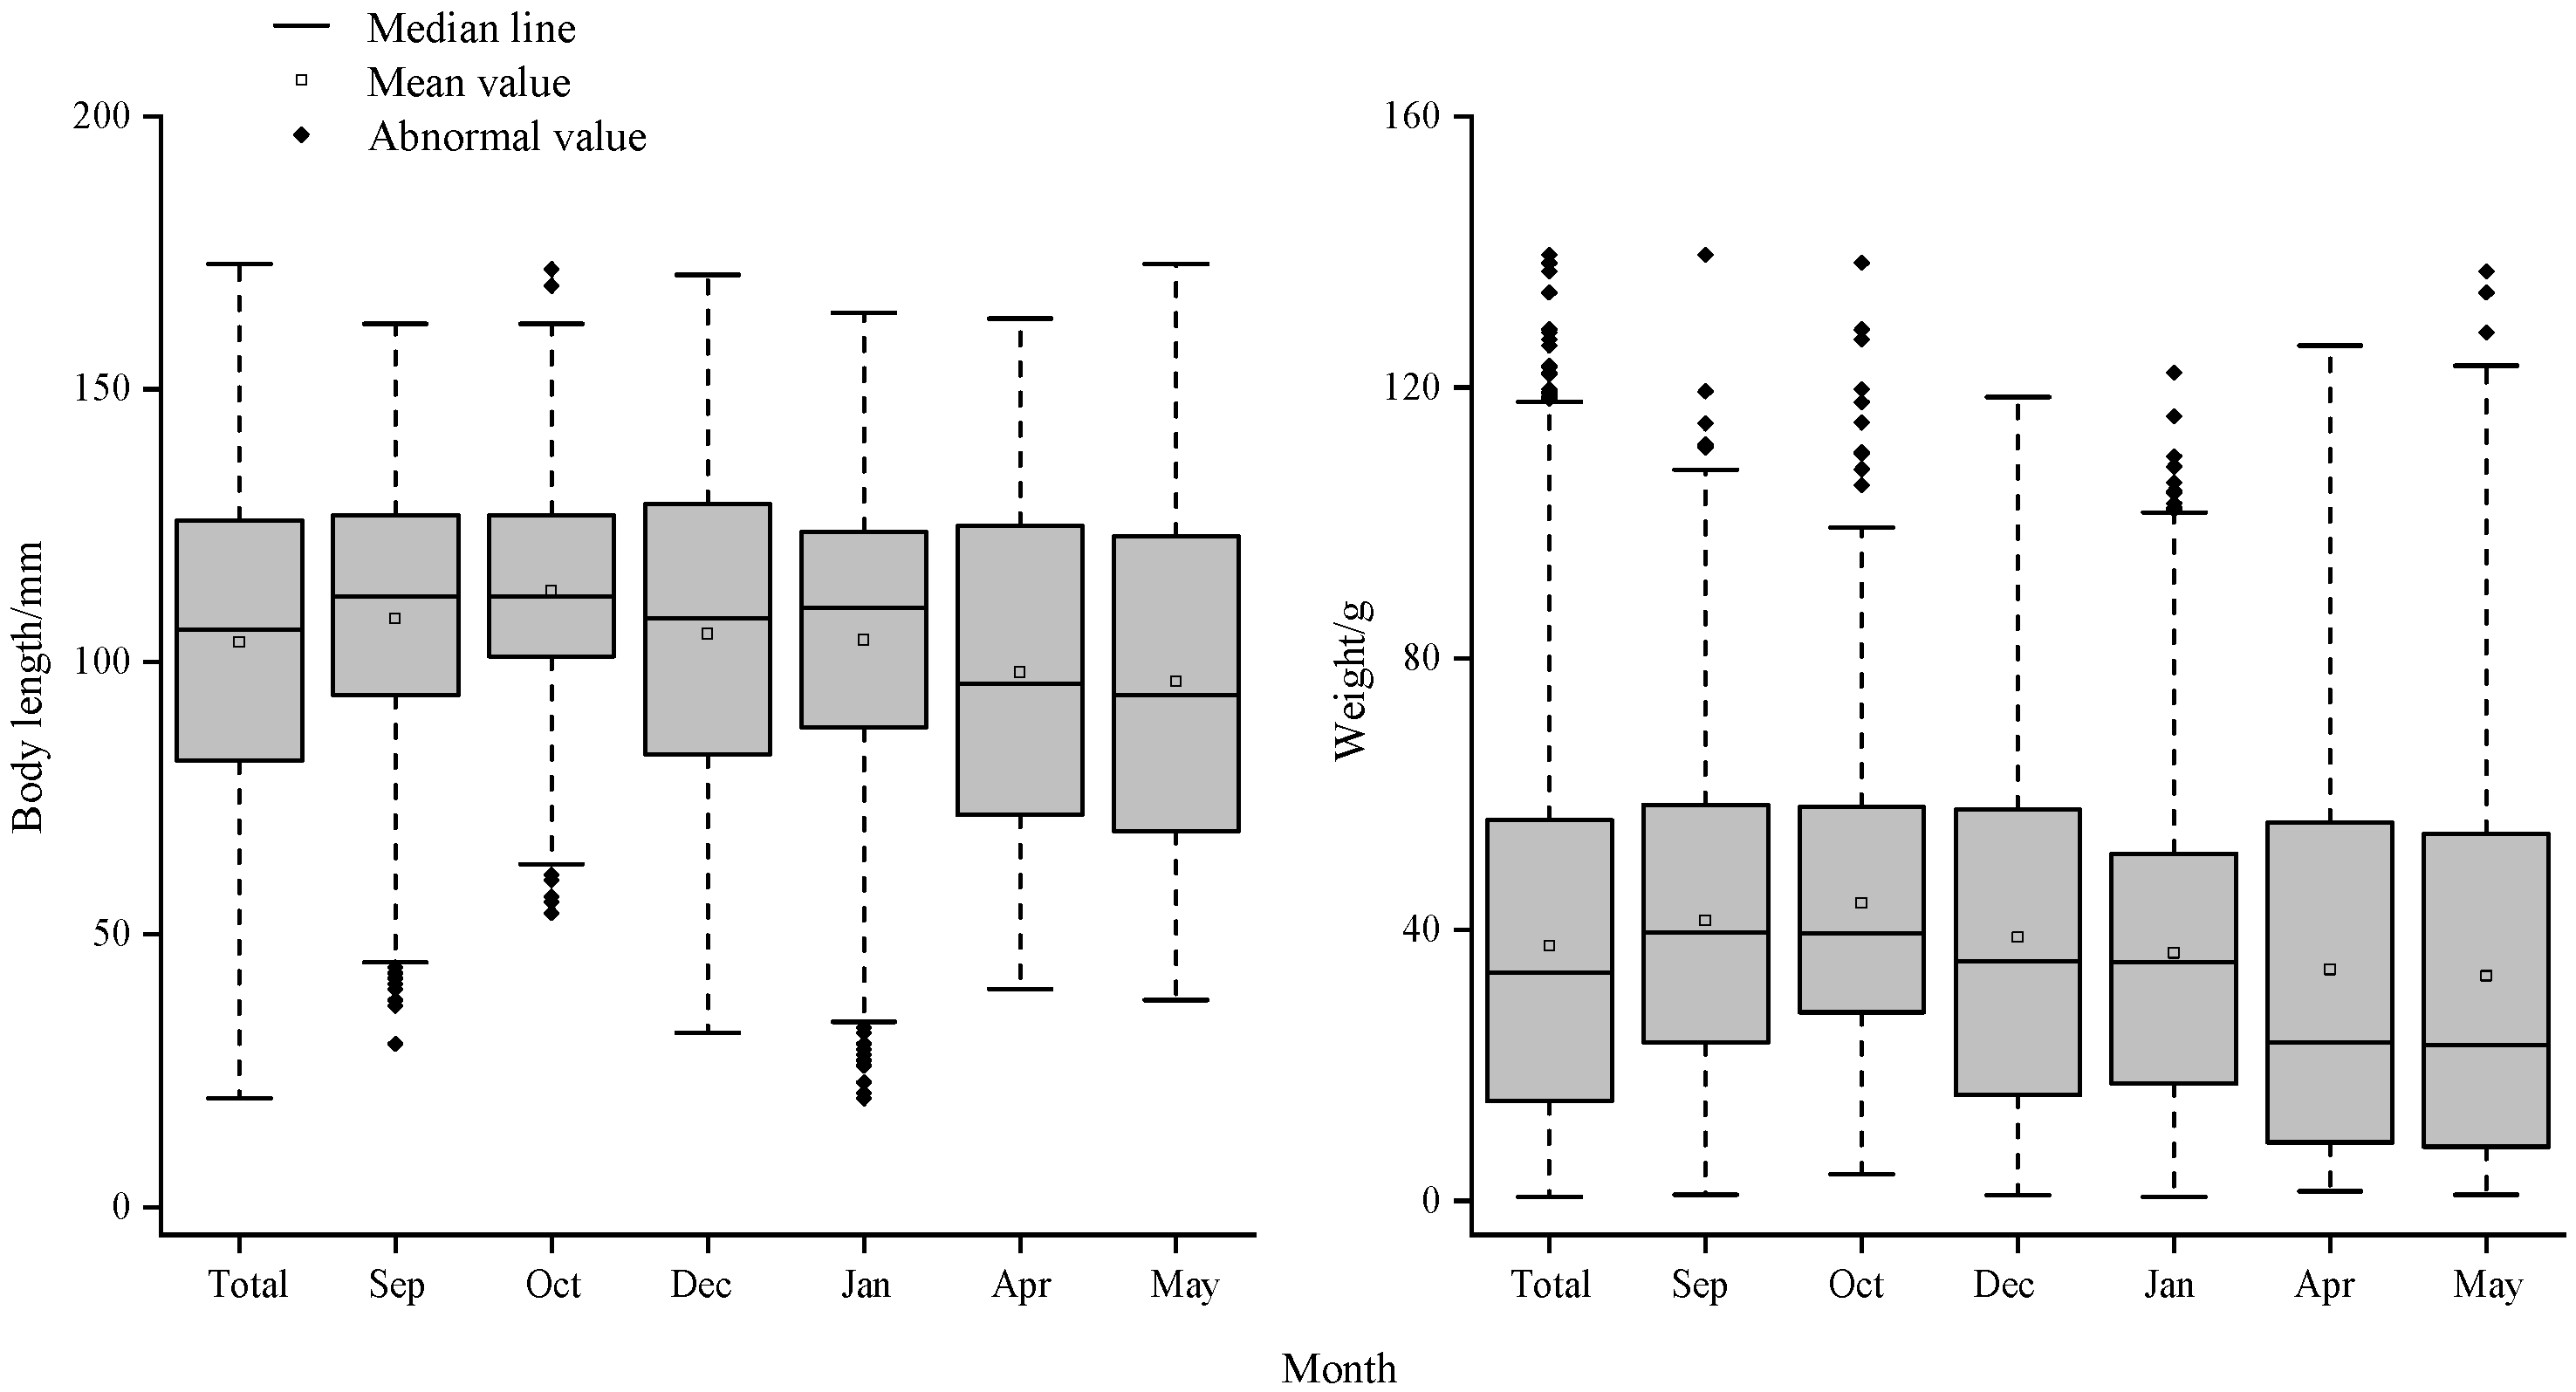
The characteristics of the distribution of body length and weight of bigeye grunt are shown in Table 1. Mean body length of individuals of different sexes varied little from month to month, with the range of mean body length of females and males from 11.14 (Sep) - 12.26 cm (Apr) and 10.75 (Sep) - 11.88 cm (Apr), respectively. Month highly significantly (P<0.01) and sex highly significantly (P<0.01) affected the distribution of mean body length and mean weight in both female and male groups. Mean body length and weight showed an overall gradual decline over time, with large decreases in April and May 2021 (Figure 2). The length frequency distribution of fish reflects their population structure, with multiple age groups in the population when the length frequency is shown to be right-skewed. Males in September and females in October were right-skewed, suggesting that walleye nudibranchs contain multiple age groups at this time.
Table 2. Distribution characteristics of body length and weight of B. auritus.
Month Sex Sample size Length/cm Weight/g
Range Mean CV Skewness Range Mean Skewness
Sep 102 8~15.7 12.14 15.3 -0.28nd 15.2~111.2 53.76 23.35
114 7.8~15.6 11.3 13.7 0.23rs 12.8~106.7 42.94 20.24
Oct 427 5.6~17.2 11.72 14.84 0.15rs 5.9~128.6 54.85 21.41
524 6.5~16.9 11.36 21.14 0.11rs 5.8~138.4 46.92 17.8
Dec 390 3.4~17.1 12.12 19.54 -0.77ls 1~118.4 47.47 25.07
393 5.6~16 10.75 21.14 -0.05ls 4.5~107.5 41.97 22.33
Jan 483 6~16.4 11.14 20.21 -0.01ls 5.4~108.4 44.57 23.99
559 6.2~15.8 11.4 15.28 -0.21ls 5.1~94.6 42.74 19.4
Apr 287 5.2~16.3 12.26 17.85 -0.31ls 3~117.8 54.04 29.6
349 6.1~16 11.88 16.17 -0.49ls 4.8~104.6 45.95 23.82
May 430 5.2~17.3 11.27 26.11 -0.08ls 3.2~134 49.82 33.43
405 6.2~16.4 11.24 18.2 -0.15ls 5.9~12.31 44.41 23.04
Sample size is the number of data pairs of body length pairing off with body weight; ls represents left skewed distribution of body length frequency; rs represents right skewed distribution of body length frequency; nd represents the normal distribution of body-length frequency.

3.2. Seasonal Changes in Body Length and Weight

The parameters of the WLR for the female and male populations of bigeye grunt are shown in Table 3. Because of the similarities between a and the representation of relative fatness, which will be analysed in Section 3.6, only b is analysed here.
In females, b was highly significant less than 3 (P<0.01) in September, October and December, with populations dominated by negative anisotropic growth, and highly significant greater than 3 (P<0.01) in January, April and May, with populations dominated by positive anisotropic growth. In males, b was not significantly different from 3 in October, the population was dominated by isochronous growth, it was significantly less than 3 (P<0.05) and the population was dominated by negative anisochronous growth in September and December, and it was highly significant greater than 3 (P<0.01), so that the population was dominated by positive anisochronous growth.

3.3. Changes in the Parameters of the WLR

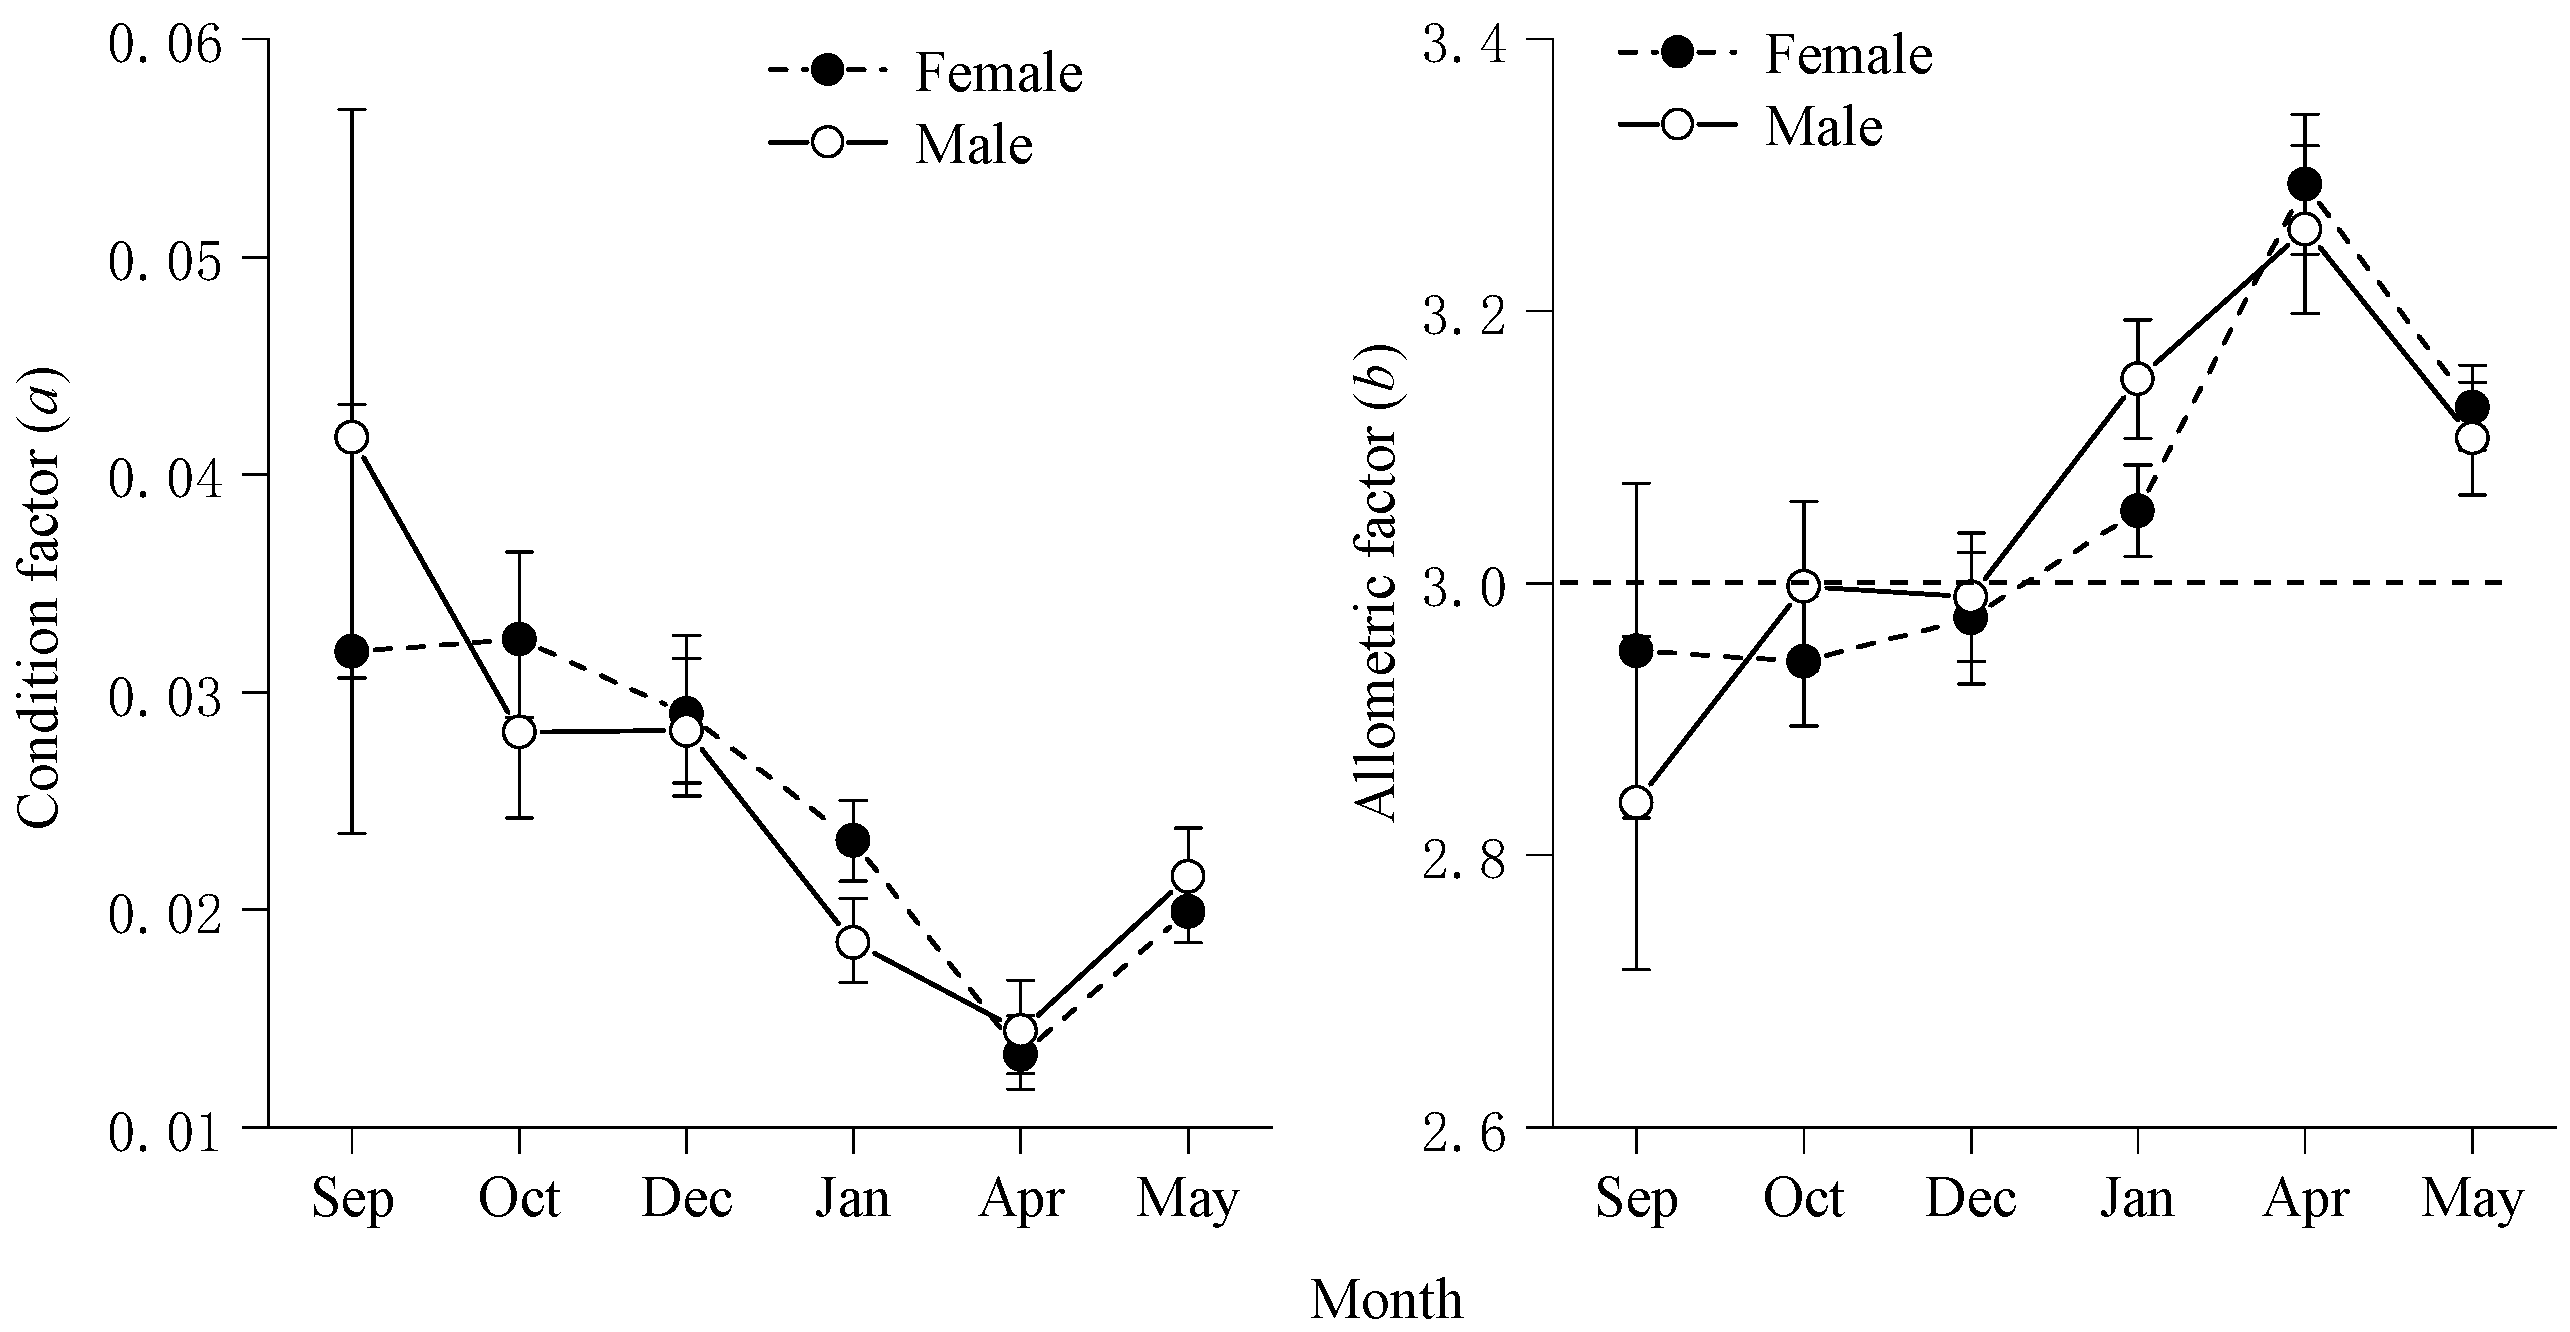
The variation of a and b for the bigeye grunt is shown in Figure 3. As a and b showed a highly significant negative correlation (R<-0.89, P<0.01, Table 5), only b was analysed here to avoid repetition. Month significantly affected b values (P<0.01), with b increasing and then decreasing over time. b was less than 3 and negatively anisotropic in October, December and January, and greater than 3 and positively anisotropic in January, April and May. Sex significantly affected the b-value (P<0.05), which basically showed an increasing and then decreasing trend over time for both females and males. Comparisons between male and female populations showed that females had highly significant b values greater than males in September, April and May (P<0.01), and the b values of males were highly significantly greater than those of females in the other months (P<0.01, Table 4).

3.4. Outlier Tests for Parameters of the WLR

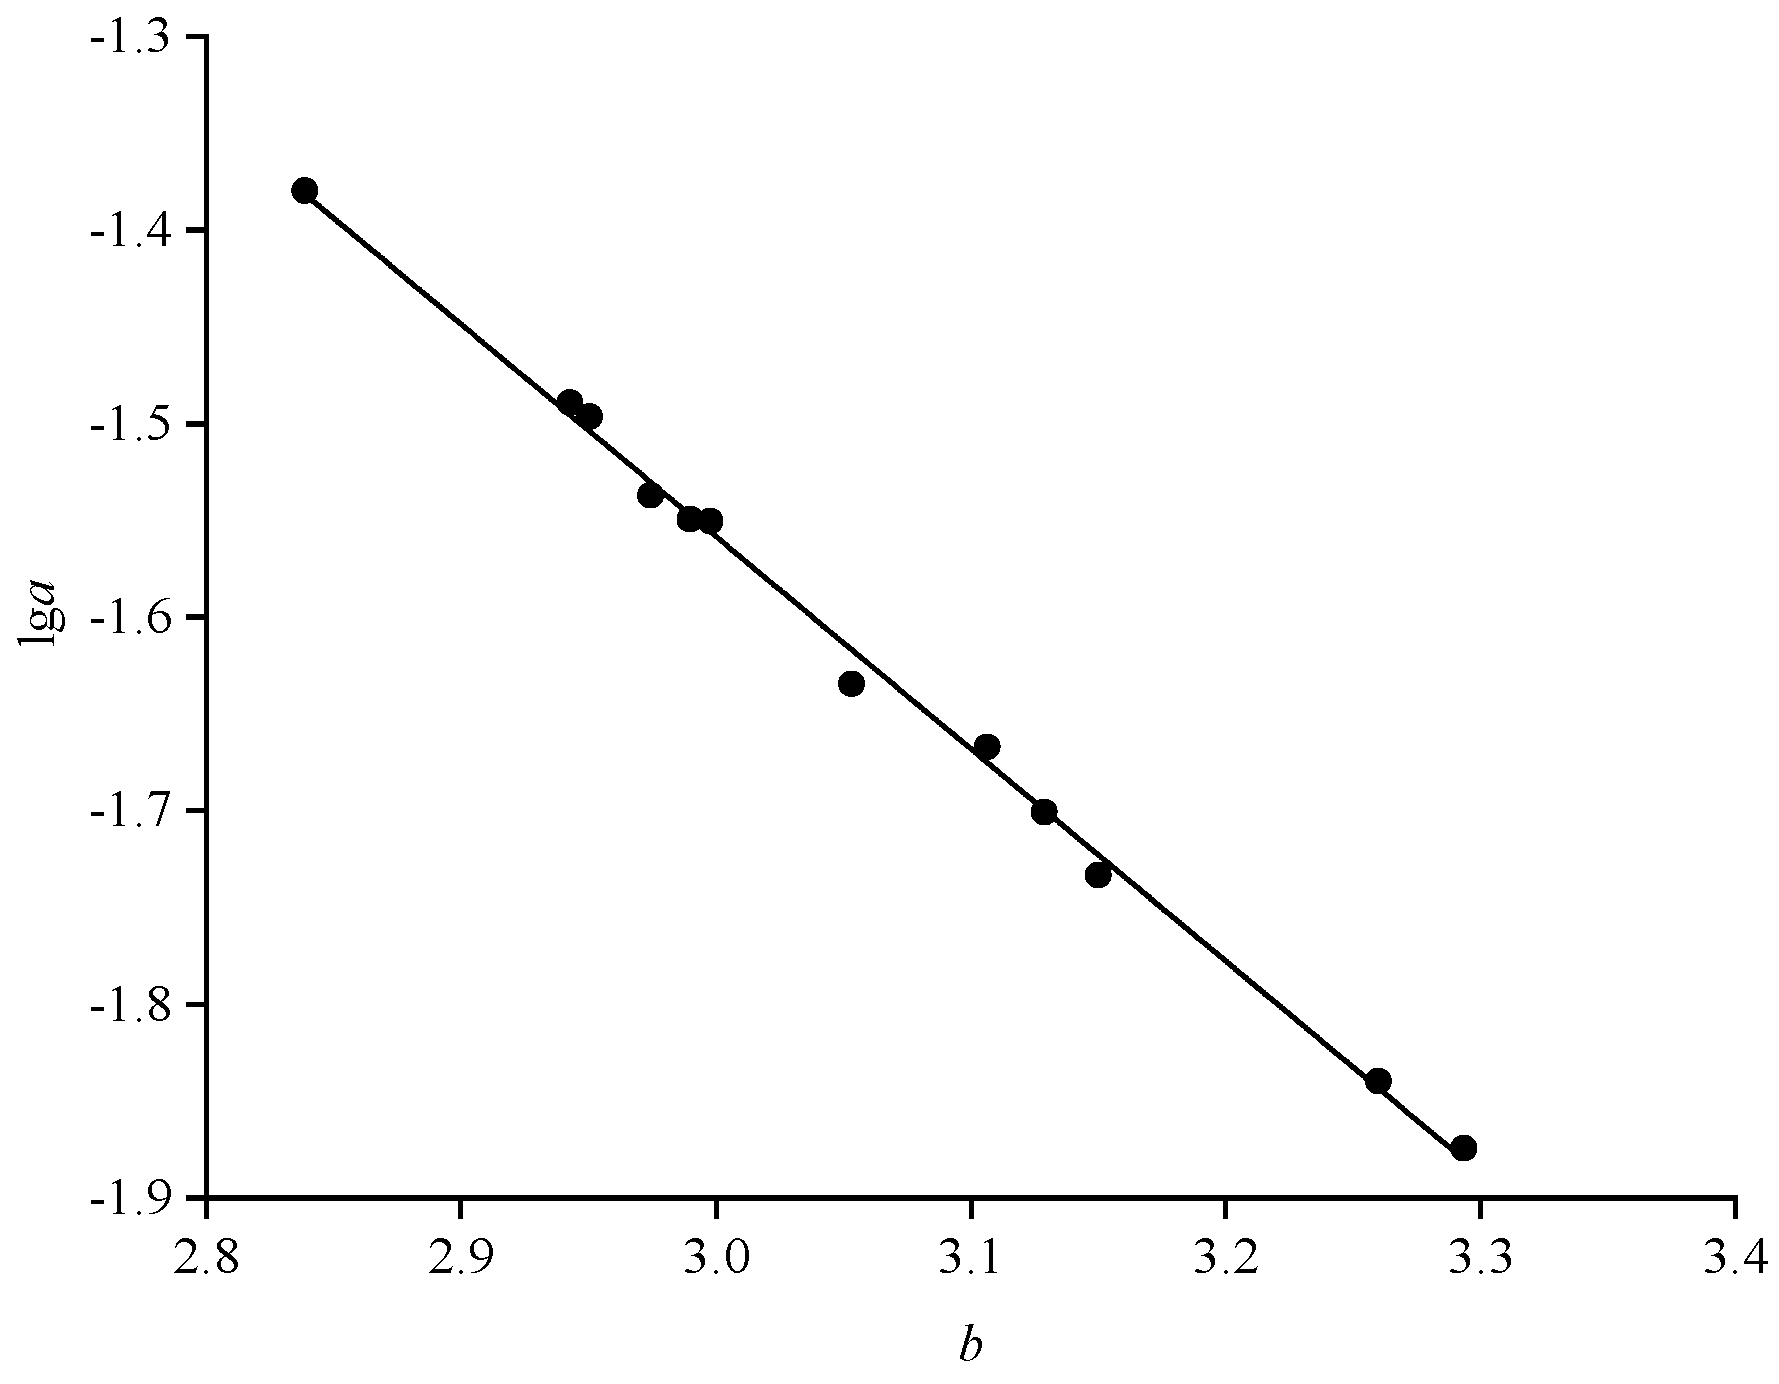
The linear relationship between lga and b for walleye naked jawed perch for each month is shown in Figure 4, with no outliers in a values and b values for each month. Thus, am = 0.024 and bm = 3.06.

3.5. Relevance Analysis

The relationship between the parameters of the WLR and the potential influencing factors of the bigeye grunt is shown in Figure 4. The a values and b values of WLR were highly significantly negatively correlated (P<0.01), so that a parameter that is positively correlated with one of a and b must be negatively correlated with the other, and therefore only parameter b is analysed here. Mean body length, skewness, proportion of sexual maturity, SST and Dep did not significantly affect b, and Sal significantly affected b values (P<0.05). The b values of females were negatively correlated with the skewness of the body length frequency distribution, whereas the b values of males were positively correlated with it. In addition, the a-value of males was significantly and negatively correlated with the skewness of the frequency distribution of body length, indicating that the more pronounced the right-skewed distribution of body length, the smaller the a-value of males.

3.6. Seasonal Changes in Relative Fatness

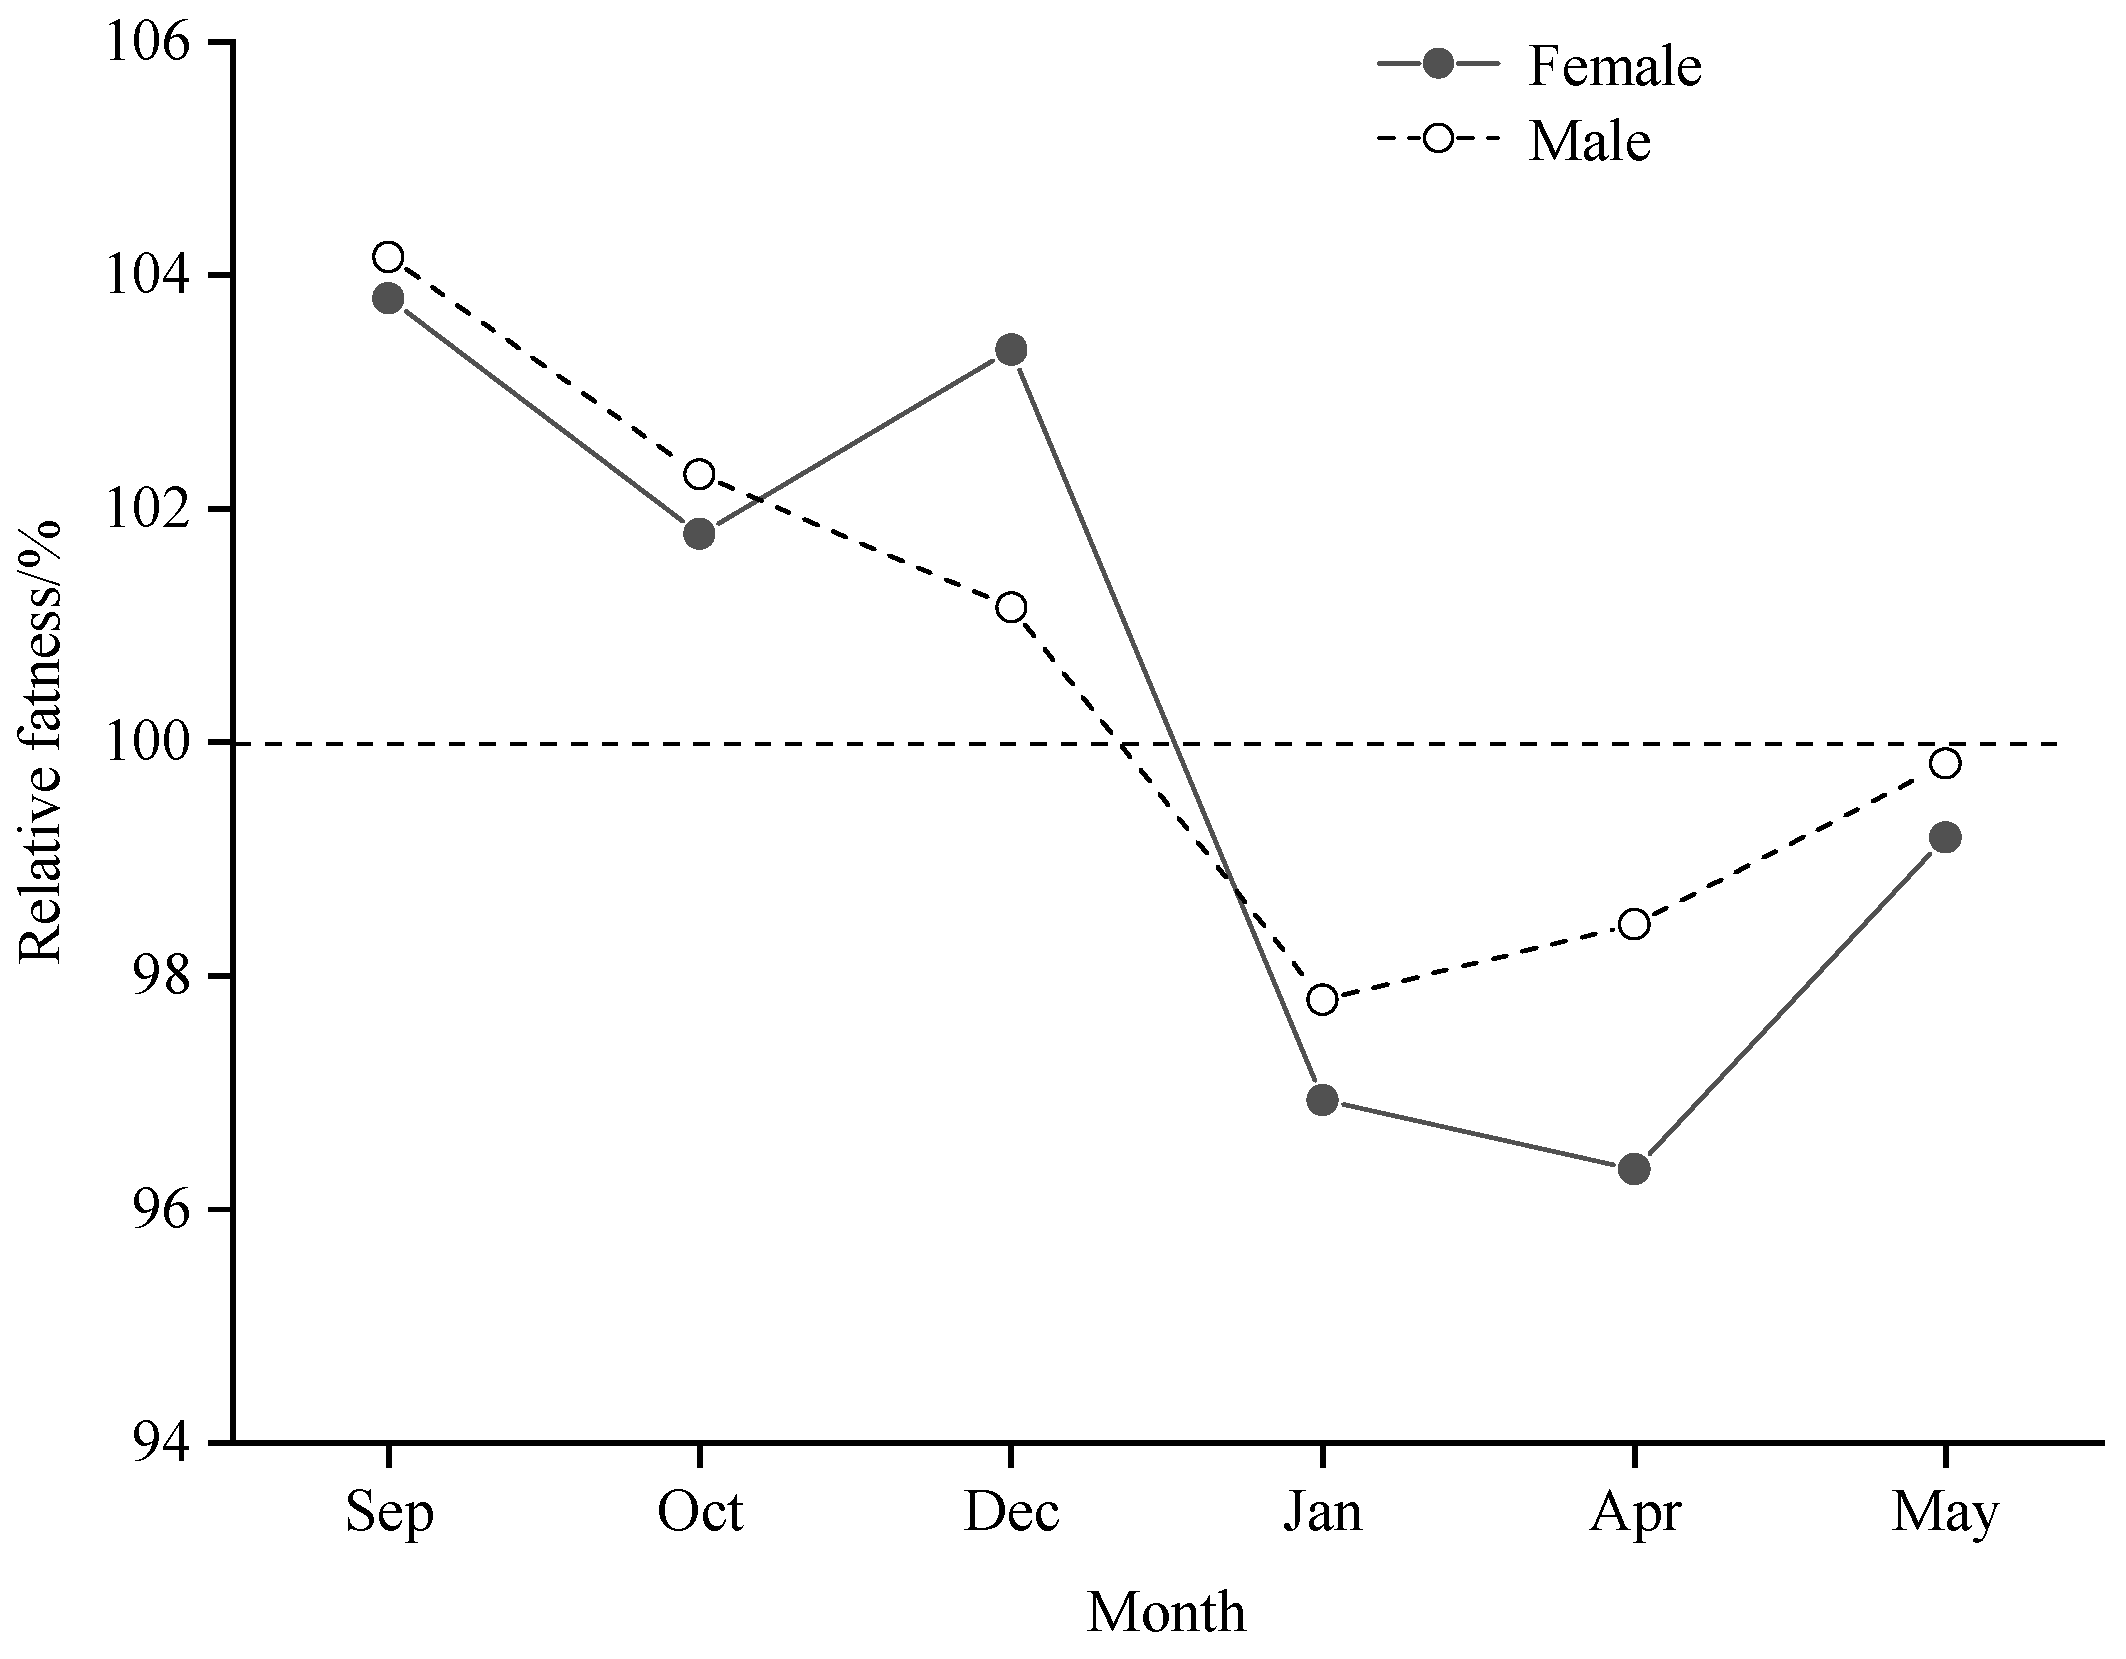
Based on the results in Table 2, samples from the body length group of 10.5-11.5 cm were taken in this study to calculate the relative fatness, and the results are shown in Figure 5. Males were more plump than females in all months except December. Relative fatness values were greater than 1 in September, October and December and less than 1 in January, April and May. In males, relative fatness decreased and then increased over time, and in females, the trend was consistent with that of males, except for an unusually large increase in September. Sex highly significantly affected relative fatness (P<0.01).
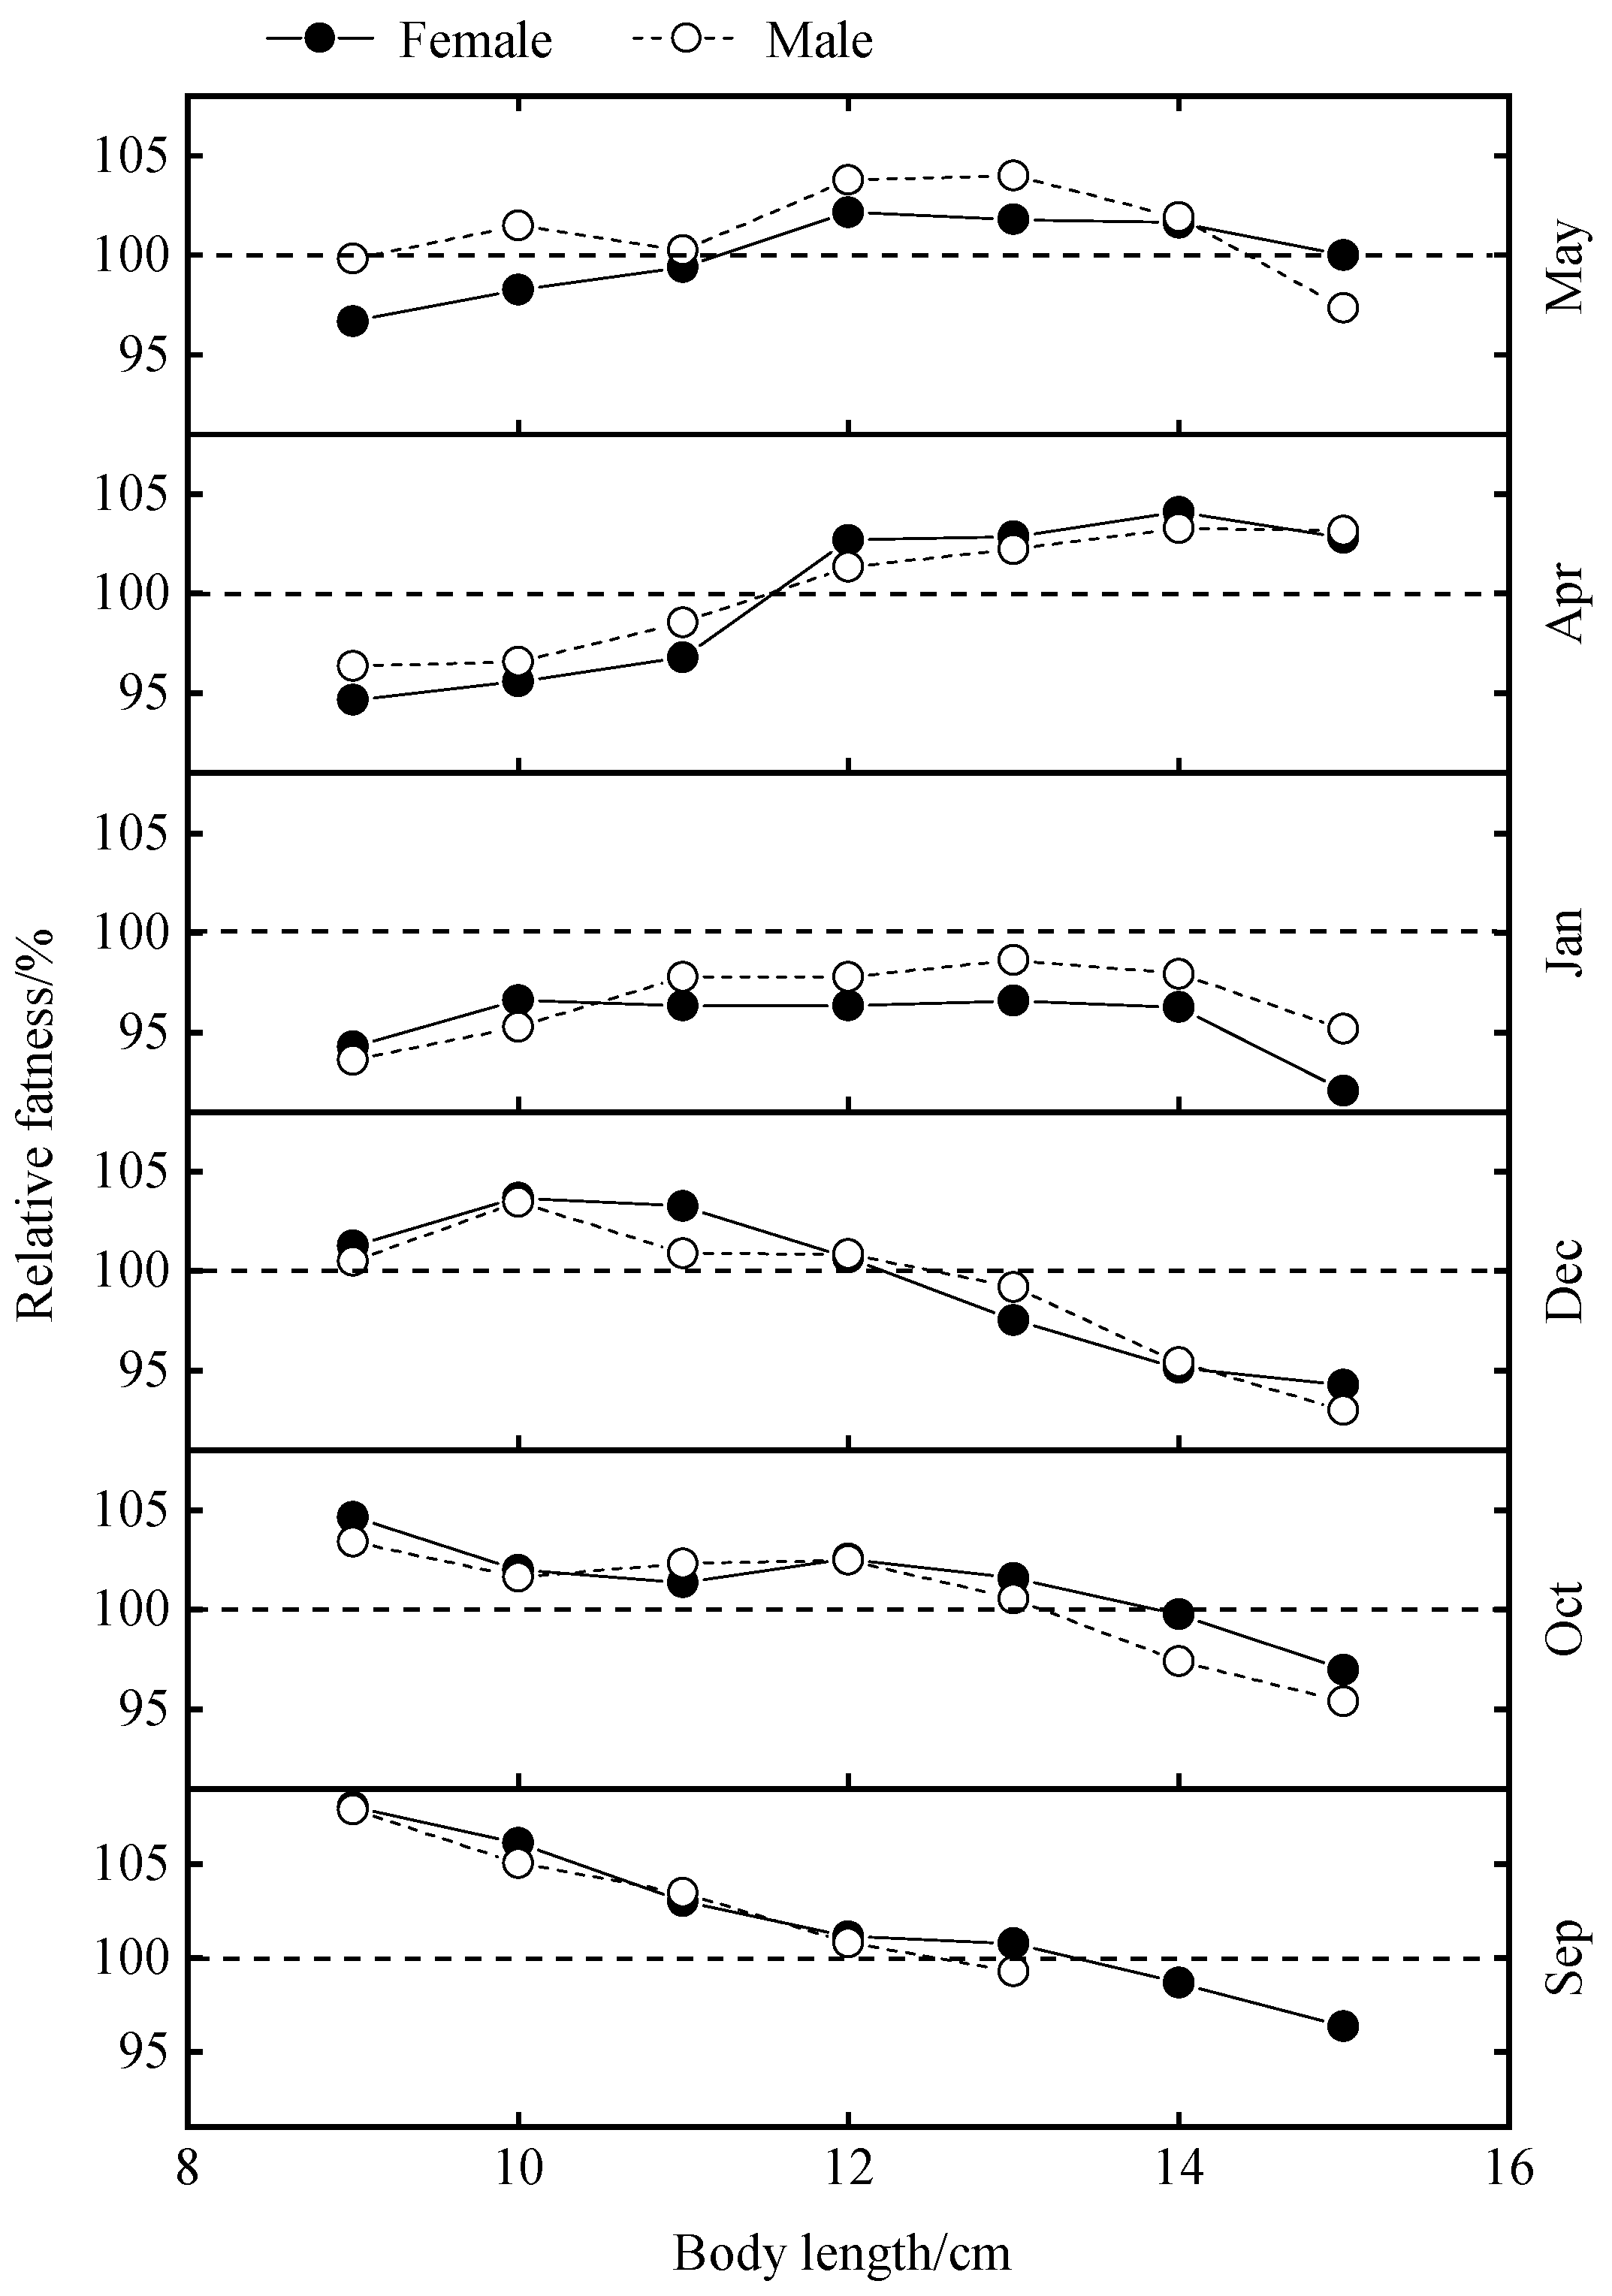
The variation of hypertrophy by month, by body length group and by sex was studied and the results are shown in Figure 6. Changes in relative fatness with increasing body length were variable, but the trends were generally the same for females and males in the same month. In all the months investigated, only in January did all the body length groups have a fattening of less than one.
With increasing body length, relative fatness basically showed two types of variation, which were a continuous decrease (Sep, Oct) and an increase followed by a decrease (Dec, Jan, Apr and May), respectively. The two types of changes in relative fatness were defined and their correlation analyses with SST, Sal, Dep and b values showed that Sal and b values significantly influenced the types of changes in relative fatness (P<0.05) and Dep had a highly significant effect (P<0.01) (Table 6).

4. Discussion

4.1. Analysis of the WLR

WLRs in fish vary with region, year or season, and intraspecific variation in WLRs can be significant due to a variety of factors, with more than a twofold variation in weight estimates based on length compared to actual [10]. Therefore, how to eliminate the impact of various non-human factors should attract sufficient attention. In addition, human factors also contribute to the uncertainty in the estimation of WLRs in fish, for example, the limited number of samples and the single time of origin lead to a low representativeness of the WLR, and the selection of length measurements is many times more arbitrary, with randomness in the selection of lengths of the body, fork lengths, and overall lengths [22]. However, the choice of length is critical for the determination of the WLR, and for conspecifics, the shorter the chosen measurement length the greater the a value, i.e., body length > fork length > full length [23]. The biology of the bigeye grunt is currently plagued by low sample representativeness and different measurement lengths, with body length[24], fork length [25] and total length [4,26]being used, but current studies do not delve deeply into the errors or implications of this.
The coastal waters of Sierra Leone have a typical tropical monsoon climate, with the year divided into a distinct dry season (May to October) and a rainy season (November to April), characterised by high temperatures throughout the year and small changes in temperature and large changes in salinity [27]. In this study, the seasonal variation of b-value of bigeye grunt was obvious, which was greater than 3 in the dry season, showing positive anisotropic growth, where the body height or body width increased faster than the body length, and the weight of the fish increased faster. In the rainy season, the b-value was less than 3, showing negative anisotropic growth, where the body length increased faster than the body height or body width, and the fish became more elongated at this time. Moreover, the b-value showed a gradual increase and then a gradual decrease during the transition from the rainy season to the dry season and then to the excess of the rainy season. More interestingly, it was closer to uniform growth during the alternating rainy and dry seasons (Figure 3), a phenomenon that was particularly salient since males were less affected by sexual maturity [12]. For this phenomenon, salinity may be a better explanation for the variation in b-values than water temperature, as evidenced by the fact that SST did not significantly affect b-values, while salinity significantly affected them (Table 5). Secondly, although the mean SST value was as high as 29.40 °C in December, which was close to the SST of the dry season, the salinity was only 31.85, which was lower than that of January, April and May, and closer to that of the rainy season (Table 1), and the b-value was more similar to that of October, which was close to the same characteristics as those of the alternating rainy and dry seasons (Table 3). Bigeye grunt was reported to be a dominant species off the coast of Sierra Leone with obvious seasonal variation characteristics, with its dominance and share of landed catch showing minimum and maximum values in September and April, respectively [28]. Coincidentally, the b-value and salinity in this study varied in synchrony with it, suggesting that the dominance of bigeye grunt significantly affected the b-value. We hypothesise that in the coastal Sierra Leone, which is located in a tropical monsoon climate, salinity not only influences the abundance of bigeye grunt, but may also be a major factor in regulating their growth, development and reproduction.
As the WLRs provide the basis for fishery stock assessment and management, we should try to avoid the variability introduced to them by various external factors. Firstly, nets of the same size should be used as much as possible during specimen collection to avoid the selectivity of nets leading to an increased probability of fish with the same characteristics being caught, forexample, gillnets are more inclined to select fat fish in small individuals and lean fish in large individuals [29]. Secondly, the selection of samples should exclude early juveniles whose bodies are not yet fully formed and those over-aged individuals whose body shape is deformed by excessive accumulation of fat [30], In addition, individuals who are stunted, abnormally thin, or have other pathological causes of physical deformity should be discarded [10]. Finally, the time span of the sample sources should include every month as much as possible, and they should be analysed by month to obtain seasonal variation characteristics.

4.2. Relationship between Parameters a and b

Froese [31] pointed out that even if there are multiple WLRs in the same fish species, there will still be a definite linear relationship between the logarithm (lga) of the condition factor a and the allometric factor b, and the relationship graph will form a straight line and can be used to detect outliers. Similarly, Stergiou et al. [21] statistically analysed the WLR for a large number of different species of fish and found a negative linear relationship between lga and b for the same species. In our study, the parameters of the WLR of the bigeye grunt also conformed to a negative linear correlation, with b decreasing according to a certain linear relationship as lga increased, and no outliers were observed (Figure 4). Thus, the ratio of lga to b for the same fish may be a constant, and factors such as time and changes in geography and external environment have little effect on it. Based on fractal theory [7], fish body shape [10] and fish body density [12] may be the main factors governing the size of the ratio. Therefore, when discussing the intraspecific variation in the length-body mass relationship of fish, the relationship between lga and b should first be plotted to detect and exclude outliers.
Additionally, Froese [31] argued that the slope of lga versus b can be interpreted as a morphometric factor for a species or population, which can be used to determine whether the body size of a particular population or species is significantly different from that of other populations or species. Kulbicki et al. [22] found that the upper and lower limits of the relationship between lga and b may be related to the physical limits of fish body dimensions and suggested that there is a link between body ratio and WLR in fish. However, apart from detecting outliers or explaining fish morphology, the linear relationship between lga and b may still have deeper meanings to be explored.

4.3. Environmental Factors for Relative Fatness

For adult fish, relative fatness decreases during low temperatures or bait shortages, increases during the spawning season when energy is accumulated for reproductive activities, and then decreases sharply after the end of the reproductive season. Subsequently, a large amount of food is consumed to satisfy their physiological activities, resulting in a rapid increase in relative fatness, especially in females [32]. This is the main cause of seasonal and in-breeding variation in fish fecundity and the general pattern of variation in adult fish fecundity. In our study, the relative fatness of bigeye grunt was characterised by significant seasonal variation, with females showing a sudden increase in December, followed by a sharp decrease in January and a rapid increase in May, which may characterise significant variation in the breeding season of bigeye grunt. It has been studied that sexually mature individuals of the bigeye grunt off the coast of Sierra Leone, West Africa, are present throughout the year, but the proportion of sexually mature individuals is higher in December and January [24]. In this study, we found that relative fatness was generally low in January and rebounded to normal levels in April (Figure 6), so we hypothesised that the peak breeding season may start in December, with large numbers of reproduction beginning in January and ending by April of the following year. We also found that b values and relative fatness were significantly lower in females than in males in January, which supports the conclusion that bigeye grunt are undergoing breeding activities in January. Therefore, it is hypothesised in this paper that the spawning activity of bigeye grunt occurs mostly in the dry season, that b value and salinity significantly affect the variation of their relative fatness (Table 6), and that salinity may be an important factor in regulating their reproduction. The results we obtained are similar to the breeding habits of most dominant species along the coast of Sierra Leone, in that the peak breeding season occurs during the dry season or alternates between the dry and rainy seasons [26,33]. Primary productivity along the coast of Sierra Leone rises significantly during the dry season [34], providing a large amount of bait for fish, which may be the main reason for the high reproductive activity of the fish. However, it has been shown that the breeding period of bigeye grunt along the coast of West Africa varies according to the sea area, for example, the breeding period of them along the Ivory Coast of Côte d'Ivoire, the coast of Lagos in Nigeria, and the coast of Senegal is from February to July [25], from July to September [35], and from October to March [36], respectively, and spawning takes place throughout the year along the coast of Ghana [37]. Thus, changes in relative fatness of bigeye grunt across coastal waters off the west coast of Africa are not synchronous and may be directly related to geographic location and ecology. In addition, bigeye grunt in the coastal waters of West Africa may belong to different communities, just as the Sierra Leonean waters include two communities, the inshore community and the offshore community away from the coast [29,38], and there may also be some differences in the growth and development of the populations in the different communities.
There is a direct relationship between the level of fish relative fatness and the availability of food, and it is common for feeding habits to shift with increasing body length for the same population [39,40]. We found significant differences in changes in relative fatness of bigeye grunt from month to month as body length increased. Small groups of individuals that had not reached sexual maturity had high levels of relative fatness in September, October and December, with a gradual decrease with increasing body length, in contrast to the dry season, when small groups of individuals had lower levels of relative fatness and large individuals had high levels (Figure 6). In January, bigeye grunt may be in their reproductive prime and the energy stored in mature individuals is depleted, resulting in lower fattening (Figure 6). Fish feeding conforms to Gerking's "optimal feeding theory", which states that predators will always feed on the largest possible individual bait to maximise the amount of energy available [41]. It has been studied that during the rainy season, especially in September and October towards the end of the rainy season, the richness index of benthic species along the coast of Sierra Leone decreases significantly [29,42], and the number of species that qualify as optimal food choices decreases, which may be an important reason for the low level of relative fatness of the large individual population during the rainy season. In addition, during the rainy season, a large number of adult marine organisms prefer to move from shallow water to deeper water away from the coastline [33,43], while juveniles may remain in shallow water due to their weak swimming ability and avoidance of the risk of predation by large individual marine organisms, which may also precisely reduce the feeding competition for the ungulates of bigeye grunt and lead to a high level of relative fatness at this time. Changes in relative fatness are the result of the interaction of various factors such as environment, physiology, and human activities, and the related issues still need further research.

5. Summary and Outlook

The findings presented in this study carry substantial implications for fisheries management practices in Sierra Leone. Through meticulously conducted scientific fisheries surveys, the researchers have gathered a robust dataset to examine both the WLR and seasonal variations in the relative fatness of the Bigeye grunt. The parameters derived from the WLR analysis are crucial for developing precise population assessment models, which are indispensable for setting sustainable fishing quotas and maintaining healthy fish populations. Thus, providing a solid scientific foundation for informed fisheries management decision-making. Furthermore, the observed fluctuations in the relative fatness underscore the importance of considering specific body size differences when formulating management strategies. Implementing size-specific regulations can effectively safeguard populations of different body sizes, thereby ensuring successful reproduction and population stability. Additionally, understanding the health status of fish populations aids in predicting potential changes in recruitment patterns and assessing the species' resilience to environmental fluctuations. In summary, this study offers significant scientific support for fisheries management in Sierra Leone, aiding in the development of more effective management strategies to ensure the sustainable utilization of fisheries resources.
Although this study has enriched our understanding of the biological characteristics of the Bigeye grunt in Sierra Leone, deeper investigations are necessary to enhance our grasp of its biology and ecology. Areas warranting further research include: (1) Predatory Strategies: Exploring the dietary composition of individuals of varying body sizes across different seasons and its correlation with condition factor would provide a more comprehensive insight into their feeding habits. (2) Environmental Influences: Conducting a more thorough assessment of environmental factors such as temperature, habitat quality, primary productivity, and food availability on the length-weight relationship and condition factor variation would elucidate the underlying drivers of seasonal fluctuations. (3) Long-term Monitoring: Establishing long-term monitoring protocols for the bigeye grunt population would enable researchers to track changes in growth patterns, health status, and population dynamics over time. This longitudinal approach would facilitate a better understanding of the species' responses to environmental changes and fishing pressures. Addressing these aspects through further research endeavors will not only broaden our understanding of the bigeye grunt’s ecology but also provide valuable insights for its conservation and sustainable management.

Author Contributions

Conceptualization, G.Z.; investigation, L.L. and J.Y.; data curation, G.Z. and S.L.; writing—original draft preparation, G.Z. and X.R.; writing—review and editing, G.Z., H.H., L.L.; supervision, S.C.; visualization, X.R.; project ad-ministration, H.H. and L.L.; funding acquisition, H.H. All authors have read and agreed to the published version of the manuscript.

Funding

This work was financially supported by the National Key Research and Development Program of China (2022YFC2807504), and the Open Subject Fund of Shanghai Frontiers Science Center of Polar Science (SOO2024-15).

Institutional Review Board Statement

All fish collection procedures and experiments in this study were conducted in accordance with the approval of the Research Ethics Committee of the East China Sea Fisheries Research Institute, CAFS for the Care and Use of Laboratory Animals.

Informed Consent Statement

Not applicable.

Data Availability Statement

The data presented in this study are avilable on request from the corresponding author. The data are not publicy available due to privacy restrictions.

Acknowledgments

We extend our heartfelt gratitude to the entire crew and research team of the scientific research vessel "ZYK 212," who ventured to the coastal waters of Sierra Leone to conduct surveys during the outbreak of the COVID-19 pandemic from 2019 to 2021. We also wish to express our sincere appreciation to the marine fisheries authorities of Sierra Leone for their invaluable support and assistance throughout the survey work. Your dedication and collaboration have been instrumental in the successful execution of our research efforts, and we are deeply grateful for your unwavering commitment and contributions.

Conflicts of Interest

The authors declare no conflict of interest.

References

  1. Aggrey-Fynn, J.; Sackey-Mensah, R. Species diversity and relative abundance of fisheries resources found in beach seine along the central coast of ghana. West African J. Appl. Ecol. 2012, 20, 1–9. [Google Scholar]
  2. Amponsah, S.K.K.; Danson, P.K.O.; Nunoo, F.K. Study of the population parameters of the bigeye grunt, brachydeuterus auritus (valenciennes, 1831) in ghanaian coastal waters and its implications for management. International Journal of Fisheries and Aquatic Studies 2016, 4, 413–419. [Google Scholar]
  3. Abbey, L.D.; Glover-Amengor, M.; Atikpo, M.O.; Howell, N.K. Proximate and biochemical characterization of burrito (bachydeuterus auritus) and flying gurnard (dactylopterus volitans). Food Sci. Nutr. 2017, 5, 369–373. [Google Scholar] [CrossRef] [PubMed]
  4. Seto, K.; Belhabib, D.; Mamie, J.; Copeland, D.; Vakily, J.M.; Seilert, H.; Baio, A.; Harper, S.; Zeller, D.; Zylich, K.; Seilert, H. War, fish, and foreign fleets: the marine fisheries catches of sierra leone 1950–2015. Mar. Policy 2017, 83, 153–163. [Google Scholar] [CrossRef]
  5. Froese, R. Keep it simple: three indicators to deal with overfishing. Fish Fish. 2004, 5, 86–91. [Google Scholar] [CrossRef]
  6. Zhan, B.Y. Fisheries resource assessment. Beijing, China Agriculture Press, 1995.
  7. Huang, Z.L.; Chang, J.B. Fractal characteristics of length-weight relationship in fish. Acta hydrobiol. Sin. 1999, 4, 330–336. [Google Scholar]
  8. Pitcher, T.J.; Hart, P.J.B. Fisheries ecology. London, Croom Helm, 1982.
  9. Zhang, K.; Chen, Z.Z.; Wang, Y.Z.; Su, D.R.; Qiu, Y.S. Population structure of Priacanthus macracanthus in the Beibu Gulf, and parameters for its growth, mortality and maturity. J. Trop. Oceanograph 2016, 35, 20–28. [Google Scholar]
  10. Froese, R. Cube law, condition factor and weight–length relationships: history, meta-analysis and recommendations. J. Appl. Ichthyol. 2006, 22, 241–253. [Google Scholar] [CrossRef]
  11. Stergiou, K.I.; Fourtouni, H. Food habits, ontogenetic diet shift and selectivity in zeus faber linnaeus, 1758. J. Fish Biol. 1991, 39, 589–603. [Google Scholar] [CrossRef]
  12. Li, Z.L.; Jin, X.S.; Shan, X.J.; Dai, F.Q. Inter-annual changes on body weight-length relationship and relative fatness of small yellow croaker (Larimichthys polyactis). J. Fish. Sci. Chin. 2011, 18, 602–610. [Google Scholar] [CrossRef]
  13. Bavevi, L.; Petrovi, S.; Karamarko, V.; Luzzana, U.; Klanjek, T. Estimating fish energy content and gain from length and wet weight. Eco. Model. 2020, 436, 109280. [Google Scholar] [CrossRef]
  14. Martínez, M.; Guderley, H.; Dutil, J.D. Condition, prolonged swimming performance and muscle metabolic capacities of cod gadus morhua. J. Exp. Biol. 2003, 206, 503–511. [Google Scholar] [CrossRef] [PubMed]
  15. Schloesser, R.W.; Fabrizio, M.C. Condition Indices as Surrogates of Energy Density and Lipid Content in Juveniles of Three Fish Species[J]. T. Am. Fish. Soc. 2017, 146, 1058–1069. [Google Scholar] [CrossRef]
  16. Jones, R.E.; Petrell, R.J.; Pauly, D. Using modified length–weight relationships to assess the condition of fish. Aquacult. Eng. 1999, 20, 261–276. [Google Scholar] [CrossRef]
  17. Latour, R.J.; Gartland, J.; Bonzek, C.F. Spatiotemporal trends and drivers of fish condition in chesapeake bay. Mar. Ecol‐prog. Ser. 2017; 579, 1–17. [Google Scholar]
  18. Haberle, I.; Bavčević, L.; Klanjscek, T. Fish condition as an indicator of stock status: Insights from condition index in a food-limiting environment. Fish Fish. 2023, 24, 567–581. [Google Scholar] [CrossRef]
  19. Nikolskiy, G.V. The ecology of fishes. London and New York, Academy press, 1963.
  20. Pauly, D. Some simple methods for the assessment of tropical fish stocks. Rome, FAO Fish Technical Paper, 1983.
  21. Stergiou, K.I.; Moutopoulos, D.K. A review of length-weight relationships of fishes from Greek marine waters. Naga 2001, 24, 23–39. [Google Scholar]
  22. Kulbicki, M.; Guillemot, N.; Amand, M. A general approach to length-weight relationships for new caledonian lagoon fishes. Cybium 2005, 29, 235–252. [Google Scholar]
  23. Carlander, K.D. Handbook of freshwater fishery biology. Ames, The Iowa State University Press, 1997.
  24. Zhao, G.Q.; Huang, H.L.; Li, L.Z.; Q, T.C.; Fan, R.L.; Feng, C.L.; Li, S.; Yang, J.L. Biological characteristics of bigeye grunt, Brachydeuterus auritus (Valenciennes, 1831) in the Coastal Waters off Sierra Leone. Mar. Fish. 2003, 45, 680–390. [Google Scholar]
  25. Sylla, S.; Zan-Bi, T.T.; Konan, K.J.; Tia, C.B.; Tidiani, K. Reproductive biology of big-eye grunt Brachydeuterus Auritus in Ivory coast fishery (West Africa). Sci. J. biolo. Sci. 2016, 5, 158–166. [Google Scholar]
  26. Konoyima, K.J.; Seisay, L.D. Aspects of reproductive biology of Pseudupeneus prayensis collected from the coast off Sierra Leone, West Africa. J. Appl. Biosci. 2021, 158, 16371–16381. [Google Scholar] [CrossRef]
  27. Le Løeuff, P.; CoselR, R.V. Biodiversity patterns of the marine benthic fauna on the Atlantic coast of tropical Africa in relation to hydroclimatic conditions and paleogeographic events. Acta Oecol. 1998, 19, 309–321. [Google Scholar] [CrossRef]
  28. Feng, C.L.; Huang, H.L.; Qu, T.C.; Fan, R.L.; Coker, I.C.R.; Seisay, L.D.; Chen, S.; Yang, J.L.; Rao, X.; Li, L.Z. Temporal and spatial patterns of demersal fish assemblages in the coastal water of Sierra Leone[J]. Reg. Stud. Mar. Sci. 2002, 56, 102674. [Google Scholar] [CrossRef]
  29. Charlotte, K. The use of the scales of the brown trout (Salmo trutta L.) for the back-calculation of growth. ICES J. Mar. Sci. 1962, 27, 304–315. [Google Scholar]
  30. Safran, P. Theoretical analysis of the weight-length relationship in fish juveniles. Mar. Biol. 1992, 112, 545–551. [Google Scholar] [CrossRef]
  31. Froese, R. Evaluating length–weight relationships. In: Froese R, Pauly D (Eds), FishBase 2000: concepts, design and data sources. ICLARM, Los Ban˜os, Laguna, Philippines, 2000, 133.
  32. Cren, E.D.L. The length-weight relationship and seasonal cycle in gonad weight and condition in the perch (Perca fluviatilis). J. Anim. Ecol. 1951, 20, 201–219. [Google Scholar] [CrossRef]
  33. Panfili, J.; Thior, D.; Ecoutin, J.M.; Ndiaye, P.; Albaret, J.J. Influence of salinity on the size at maturity for fish species reproducing in contrasting west african estuaries. J. Fish Biol. 2010, 69, 95–113. [Google Scholar] [CrossRef]
  34. Longhurst, A.R. Benthic-pelagic coupling and export of organic carbon from a tropical atlantic continental shelf-sierra leone. Estuar. Coast. Shelf Sci. 1983, 17, 261–285. [Google Scholar] [CrossRef]
  35. Adebiyi, F.A. Growth pattern of the big eye grunt Brachydeuterus auritus (Valenciennes, 1832) off Lagos, Nigeria[J]. Indian J. Fish. 2013, 60, 9–12. [Google Scholar]
  36. Samb, B. On the biology of Brachydeuterus auritus Senegalese waters. In: Palomares M L D, Samb B, Diouf T, et al. (Eds.), Fish biodiversity: Local studies as basis for global inferences[R]. Brussels: African Caribbean and Pacific Groups of States, European Union, 2003, 1-13.
  37. Asabere-Ameyaw, A. Observations on the reproductive biology and recruitment of the big eye grunt Brachydeuterus auritus (Pisces: Haemulidae), in Ghana. J. Gh. Sci. Assoc. 2003, 3, 14–21. [Google Scholar]
  38. Longhurst, A.R. Bionomics of the sciaenidae of tropical west africa. ICES J. Mar. Sci. 1965, 1, 93–114. [Google Scholar] [CrossRef]
  39. Šantić, M.; Rađa, B.; Pallaoro, A. Diet and feeding strategy of thornback ray Raja clavata[J]. J. Fish Biol. 2012, 81, 1070–1084. [Google Scholar] [CrossRef] [PubMed]
  40. Correa, F.; Claudino, M.C.; Bastos, R.F. ; Huckembeck; Garcia, M.A. Feeding ecology and prey preferences of a piscivorous fish in the Lagoa do Peixe National Park, a Biosphere Reserve in Southern Brazil[J]. Environ. Biol. Fish. 2012; 93, 1–12. [Google Scholar]
  41. Gerking, S.D. Feeding Ecology of Fish. San Diego, Academic Press, 1994.
  42. Ssentongo, G.W.; Ansa-Emmin, M. Marine Fishery Resources of Sierra Leone: A Review of Exploited Fish Stocks[R]. In: CECAF/ECAF Series (FAO), 1986.
  43. Kantoussan, J.; Ecoutin, J.M.; Simier, M. Effects of salinity on fish assemblage structure: an evaluation based on taxonomic and functional approaches in the casamance estuary (senegal, west africa) - sciencedirect. Estuar. Coast. Shelf Sci. 2012, 113, 152–162. [Google Scholar] [CrossRef]
Figure 1. The sample area of survey stations.
Preprints 104705 g001
Figure 2. The boxplot for changes in body length and weight distribution of B. auritus by months.
Preprints 104705 g002
Figure 3. Changes of condition factor a and allometric factor b of B. auritus by different months.
Preprints 104705 g003
Figure 4. Negative linear relationship between lga and b for B. auritus.
Preprints 104705 g004
Figure 5. Changes in relative fatness of B. auritus by different months.
Preprints 104705 g005
Figure 6. Changes in relative fatness by body length of B. auritus in different months.
Preprints 104705 g006
Table 1. Environment factors of fishery survey.
Survey indicators Sep Oct Dec Jan Apr May
SST/℃ 27.76±1.00 27.76±0.79 29.40±0.48 28.64±0.44 28.89±0.39 29.29±0.47
Sal 28.13±5.68 30.70±2.63 31.85±0.79 33.90±0.38 35.54±0.10 35.36±0.47
Dep/m 30.72±9.40 31.40±7.15 26.94±8.80 25.54±7.59 26.66±8.08 25.51±8.22
Table 3. Parameters of body length-weight relationship for female and male B. auritus.
Month Female Male
a(×10-2 b R2 t a(×10-2 b R2 t
Sep 3.19 2.95 0.98 -11.41** 4.17 2.84 0.98 -35.36**
Oct 3.24 2.94 0.99 -26.28** 2.82 2.99 0.99 -0.74ns
Dec 2.90 2.97 0.99 -7.22** 2.82 2.99 0.99 -3.22*
Jan 2.32 3.05 0.99 27.63** 1.85 3.14 0.99 64.64**
Apr 1.34 3.29 0.99 125.05** 1.45 3.26 0.99 88.15**
May 1.99 3.13 0.99 58.55** 2.15 3.11 0.99 44.41**
a and b are parameters of body length (cm)-weight (g) relationship; R2 is correlation coefficient; t is t test for b (H0: b=3); ns denotes no significant difference between b and 3 (P>0.05); *denotes significant difference between b and 3 (P<0.05); **denotes extremely significant difference between b and 3 (P<0.01).
Table 4. Changes of condition factor a and allometric factor b of B. auritus by different months.
Parameter Month
Sep Oct Dec Jan Apr May
F 0.038** 0.94** 0.14** 0.21** 1.34** 0.045**
**denotes extremely significant difference in alometric factors between sexes (P<0.01).
Table 5. Correlations between parameters of WLR and potential environment factors for B. auritus.
Sex b Mean body length Skewness Proportion of maturity in female SST Sal Dep
Female a -0.89** 0.51 0.57 0.53 -0.581 -0.85* 0.74
b -0.48 -0.6 -0.55 0.486 0.84* -0.61
Male a -0.9** 0.07 -0.86* -0.573 -0.79* 0.73
b -0.12 0.77 0.522 0.83* -0.83
values in the table are correlation coefficients; * denotes significant correlation between skewness and a of male (P<0.05); ** denotes extremely significant correlations between parameters b and a (P<0.01).
Table 6. Comparison in shapes of fatness growth for different months of B. auritus.
Factor SST Sal Dep b
Correlation
Coefficient
0.63 0.88* -0.97** 0.88*
values in the table are correlation coefficients; * denotes significant correlation between shapes of fatness growth and factor (P<0.05); ** denotes extremely significant correlations between shapes of fatness growth and factor (P<0.01). (P<0.01).
Disclaimer/Publisher’s Note: The statements, opinions and data contained in all publications are solely those of the individual author(s) and contributor(s) and not of MDPI and/or the editor(s). MDPI and/or the editor(s) disclaim responsibility for any injury to people or property resulting from any ideas, methods, instructions or products referred to in the content.
Copyright: This open access article is published under a Creative Commons CC BY 4.0 license, which permit the free download, distribution, and reuse, provided that the author and preprint are cited in any reuse.
Prerpints.org logo

Preprints.org is a free preprint server supported by MDPI in Basel, Switzerland.

Subscribe

© 2024 MDPI (Basel, Switzerland) unless otherwise stated