1. Introduction
Rapid economic growth, urbanization, pollution and climate changes worldwide pose a serious threat to biodiversity loss and ecosystem dysfunction. As in the aquatic ecosystem, algae are the predominant primary producer they are playing a major role in the ecosystem. Green algae are largely freshwater organism may grow on moist terrestrial substrate. They are grass-green colour due to the presences of pigments chlorophyll a and b, α and β carotenes and xanthophylls. They are unicellular, multicellular or filamentous. According to the newer classification proposed by Leliaert et al. (2011, 2016) green algae are segregated into two phyla, Chlorophyta and Charophyta. The members of phylum Chlorophyta are morphologically diverse, including one to eight flagella and non-motile (coccoid) unicells and include about 4300 species worldwide. Whereas phylum have certain unique enzymes, lateral flagella in flagellate members and mitosis by phragmoplasts.
From India, so far 7,411 species of algae are known, which is 14.98% of the total Indian flora Mao & Dash (2019). Their diversity and distribution are varied according to the habitat, season and water quality. Some of the algae are known to be pollution indicators. Green algae usually grow better in less polluted ponds and streams; however, some species could present in heavily polluted water (Dasgupta et al. 2017). The parameters such as pH, conductivity, salinity, total dissolved solids (TDS), dissolved oxygen (DO) are rapid and reliable indicators of water quality of particular water body (Patil et al. 2012).
In India, despite several algal diversity studies carried out in different places, but there is an apparent lacuna in the study of algal diversity in relation to pollution and seasonal effects. Lucknow, the capital of Uttar Pradesh and an important historical city has witnessed rapid urbanization in the recent past, which has led to changes in algal flora. However this city has been rarely explored for algal diversity and distribution pattern. Only a few reports are available on green algal flora of Uttar Pradesh and especially on Lucknow. Gupta (2012) reviewed and revealed the occurrence of a total of 703 taxa of Chlorophyta of Uttar Pradesh. Some enumeration of fresh water algal flora of Uttar Pradesh has also been carried out by Suseela et al. (2015). Kumar and Suseela (2004) reported 85 taxa of Chlorophyta from Uttar Pradesh. Singh (2015) have studied phytoplanktonic diversity of Gomti River and Lucknow ponds in relation to seasonal variation and pollution. Recently the initiative was taken by Dasgupta et al. (2017) to determine the relation between water parameters and algal flora in late summer in different sites of Lucknow and revealed occurrence of a total of 40 taxa belong to 32 genera of 4 different phyla namely Cyanophyta, Chlorophyta, Bacillariophyta and Euglenophyta in eleven study sites of urban water bodies near Lucknow city in summer. However, none of the studies were focused on a thorough exploration of green algal species, their diversity indices and distribution pattern relation to water quality and season.
Nowadays, the crisis in taxonomic and biodiversity studies stimulated us to determine the relation between water parameters and green algal diversity in seven different sites of Lucknow. Morphological analysis was carried out to determine the taxonomic composition of green algae in aquatic ecosystems, both qualitative and quantitative. Diversity indices and a topographical map of algal distribution were determined by mathematical analysis. Water parameters were analyzed to reveal the water quality of a particular site.
2. Material and Methods
2.1. Collection of Microalgae
Lucknow is spread over an area of 310 km
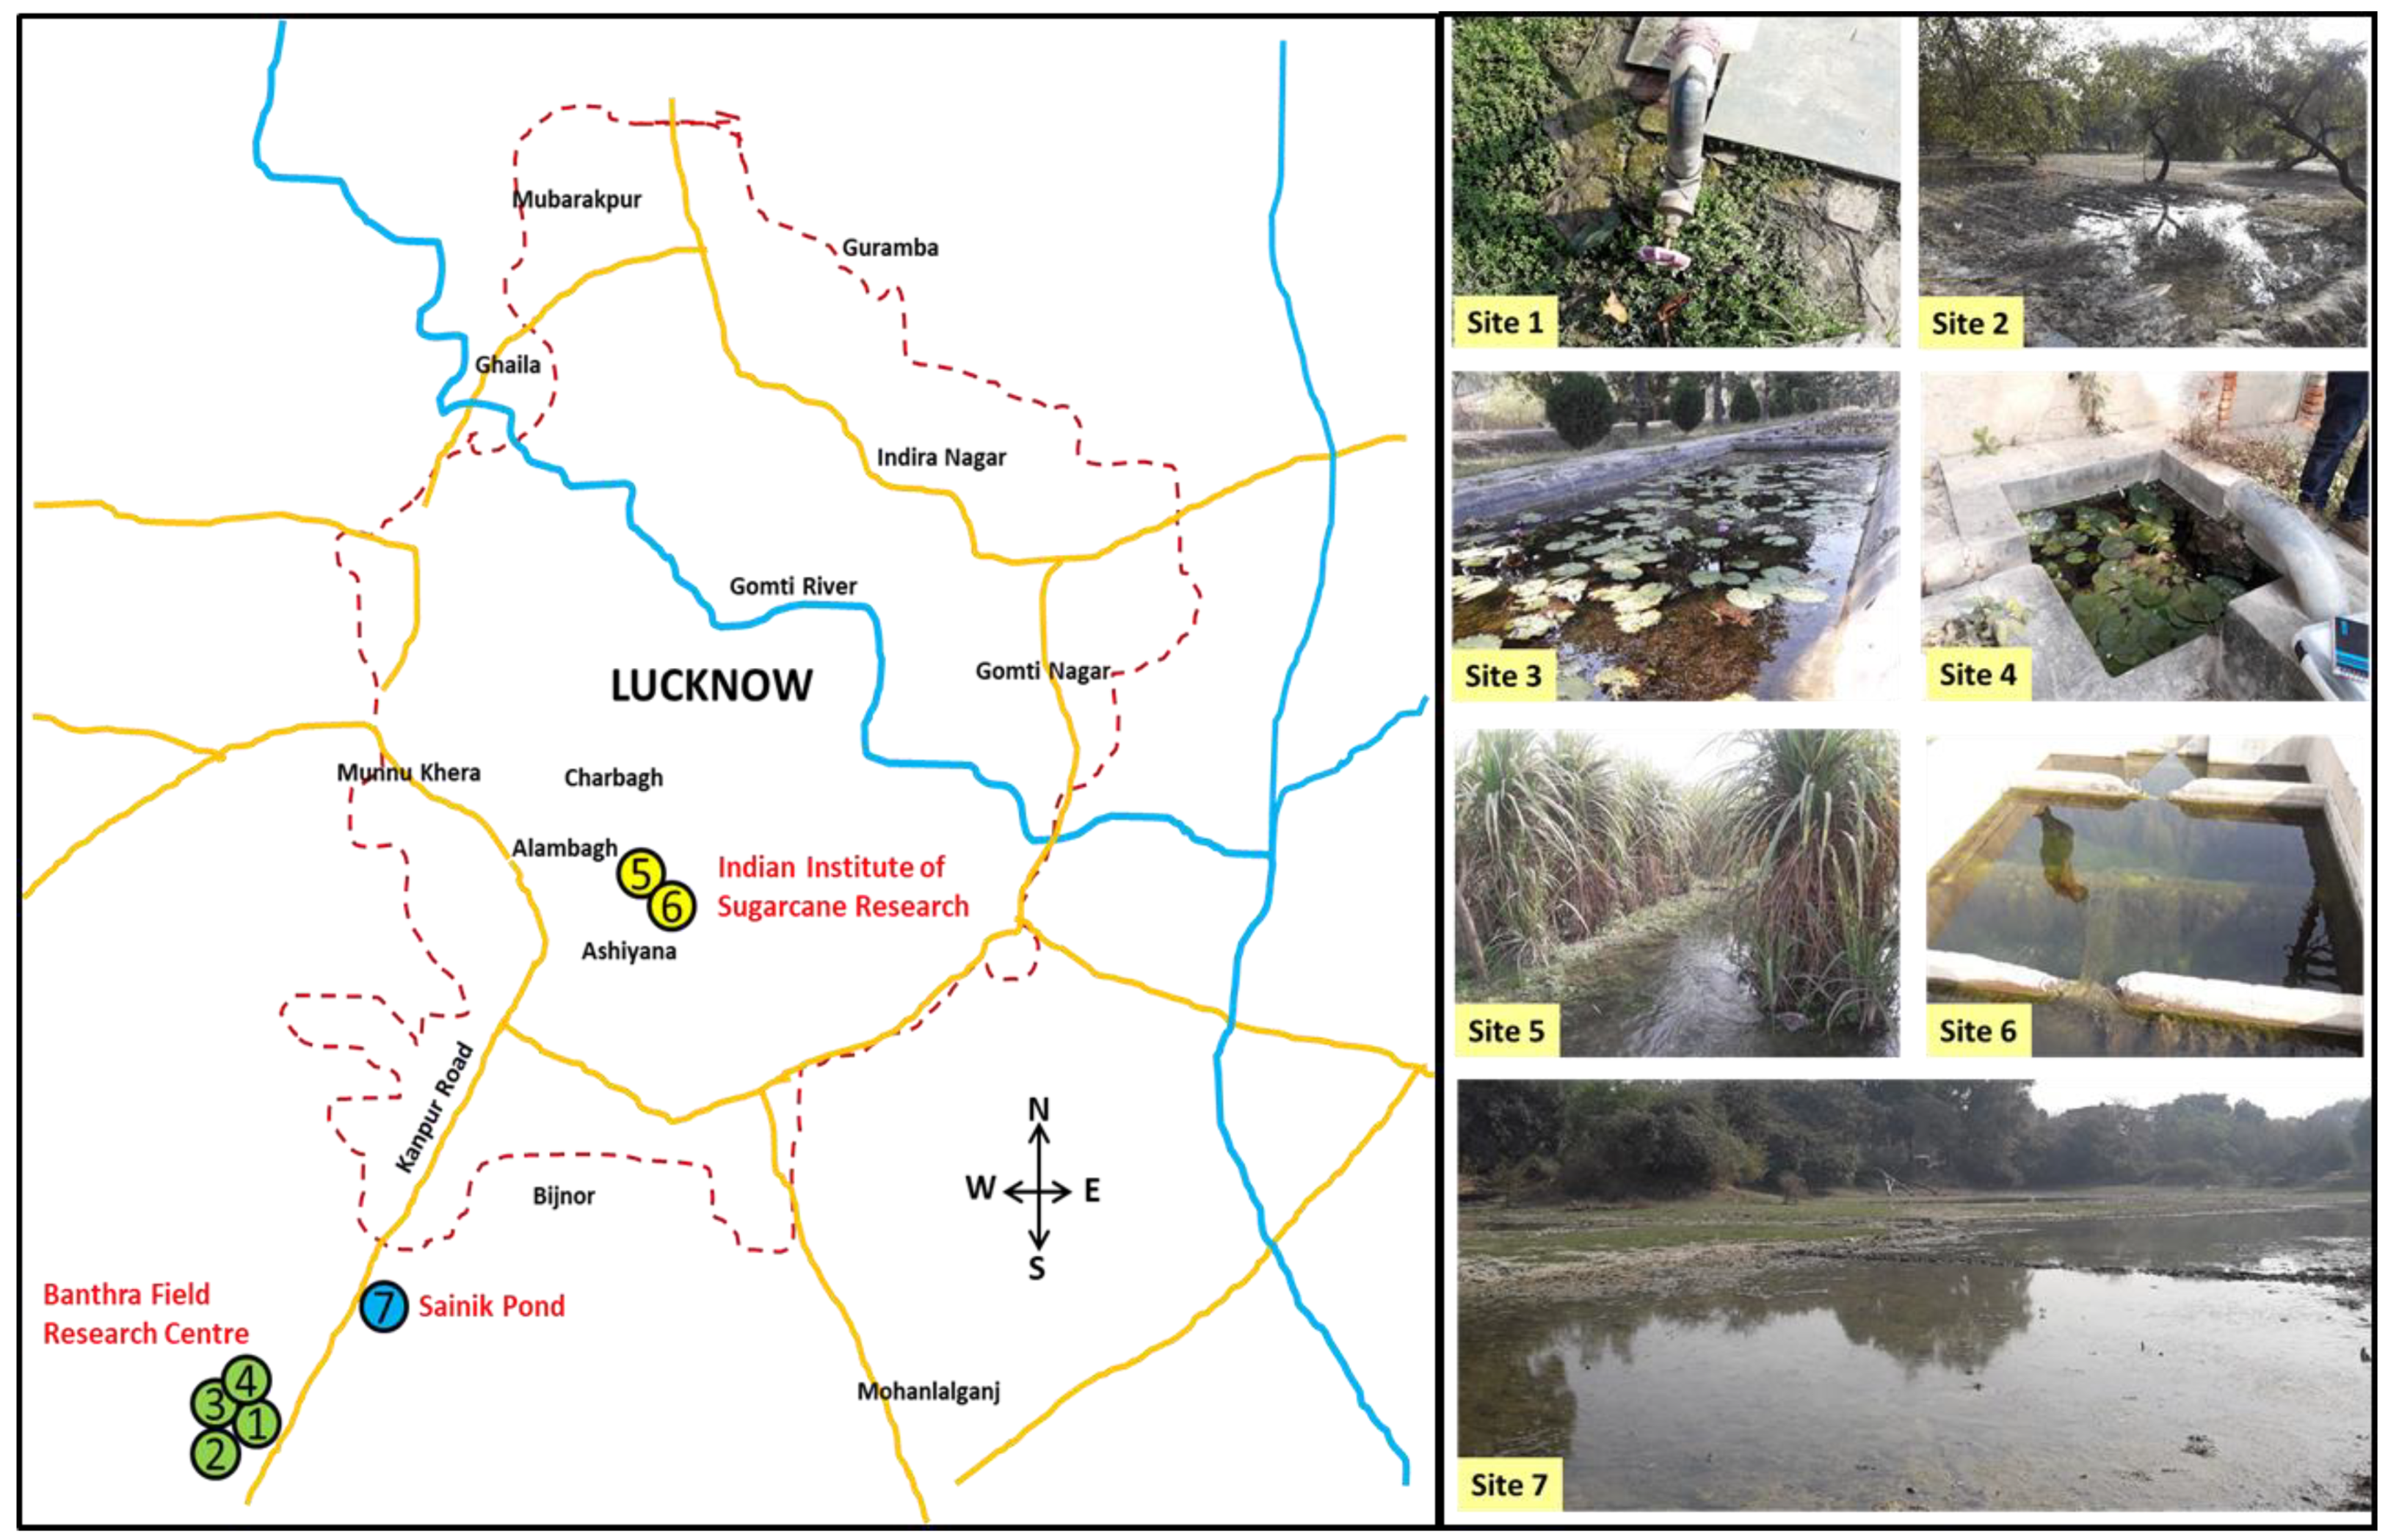
2 in the central plain of the Indian subcontinent. Samples have been collected from field research stations at Banthra, CSIR-NBRI, Lucknow which cover the 85-hectare land surface. The moist bricks and surrounding waters, water bodies, agricultural fields, different plantations and forest were assessed in four sites in Banthra Field Research Centre, CSIR-NBRI (N 26⁰ 41’ 34.584’’; E 80⁰ 50’ 3.443’’), two sites in Indian Institute of Sugarcane Research (ICAR-IISR) (N 26⁰ 50’ 21.408’’; E 80⁰ 55’ 23.268’’) and Sinik pond (Kanpur road) ((N 26⁰ 49’ 45.48’’; E 80⁰ 54’ 34.919’’) during winter season (December, 2018) (
Figure 1).
Site 1: Banthra (moist bricks and surrounding water)
Site 2: Banthra (soil of Ziziphus jujuba plantation and surrounding water)
Site 3: Banthra (Lotus pond)
Site 4: Banthra (small water tank)
Site 5: IISR (sugarcane field soil and water)
Site 6: IISR (water pumping station)
Site 7: Sinik pond (Kanpur road)
2.2. Analysis of Water Parameters
Water parameters such as temperature (T⁰C), pH, dissolved oxygen (DO in mg/L), conductivity (Cd. in µs/cm), total dissolved solid (TDS in mg/L), salinity (Sl. in ⁰%) were measured at sampling site by multi-parameter analyzer (HQ 40d multi, HACH).
2.3. Identification
The collected algal samples were observed under the Leica DM 500 light microscope attached with Leica EC3 Camera and computerized image analysis system. Taxa were identified by using the standard publications of Prescott (1951) Scott and Prescott (1961), Tiffany and Britton (1952), Philipose (1967), Prasad and Misra (1992) and nomenclature were updated from Guiry and Guiry (2019;
http://www.algaebase.org).
2.3. Mathematical Calculation of Diversity
Diversity indices such as Dominance (D), Simpson’s Index (1-D), Shannon and Weaver’s Index (H’), Species Evenness (E), Menhinick's Index (MN), Margalef's richness index (ML) and Berger-Parker Dominance (BP) were calculated for each site on the basis of number of taxa (S), the number of individuals of each species in the sample (n), the total number of individuals in the sample (N) or algal density (cells/mL) (Harper, 1999). The analysis was also carried out using the PAST3 statistical software.
Algal density was calculated by the following equation.
Where C = number of cells counted, A = area of the field, D = depth of field, F = number of fields counted
Dominance (D) of taxa in a sample is represented by the equation below
Species diversity is represented by Simpson's Index of Diversity (Simpson, 1949)
Shannon and Weaver (1963) index of diversity (H’) is represented by the equation below:
Where, H' is the index of species diversity, p = n/N, the proportion of total sample belonging to particular species.
Berger-Parker Dominance (Berger and Parker, 1970) is one of the best and simplest index was considered by May (1975). It is a simple measure of the numerical importance of the most abundant species.
Where Nmax is the number of individuals in the most abundant species.
3. Results
3.1. Water Parameters of Study Sites and Diversity of Green Algal Species
A total of 36 taxa of green algae belonging to 11 genera have been identified from the seven study sites. Water parameters such as temperature, pH, DO, conductivity, TDS and salinity, as well as algal flora (
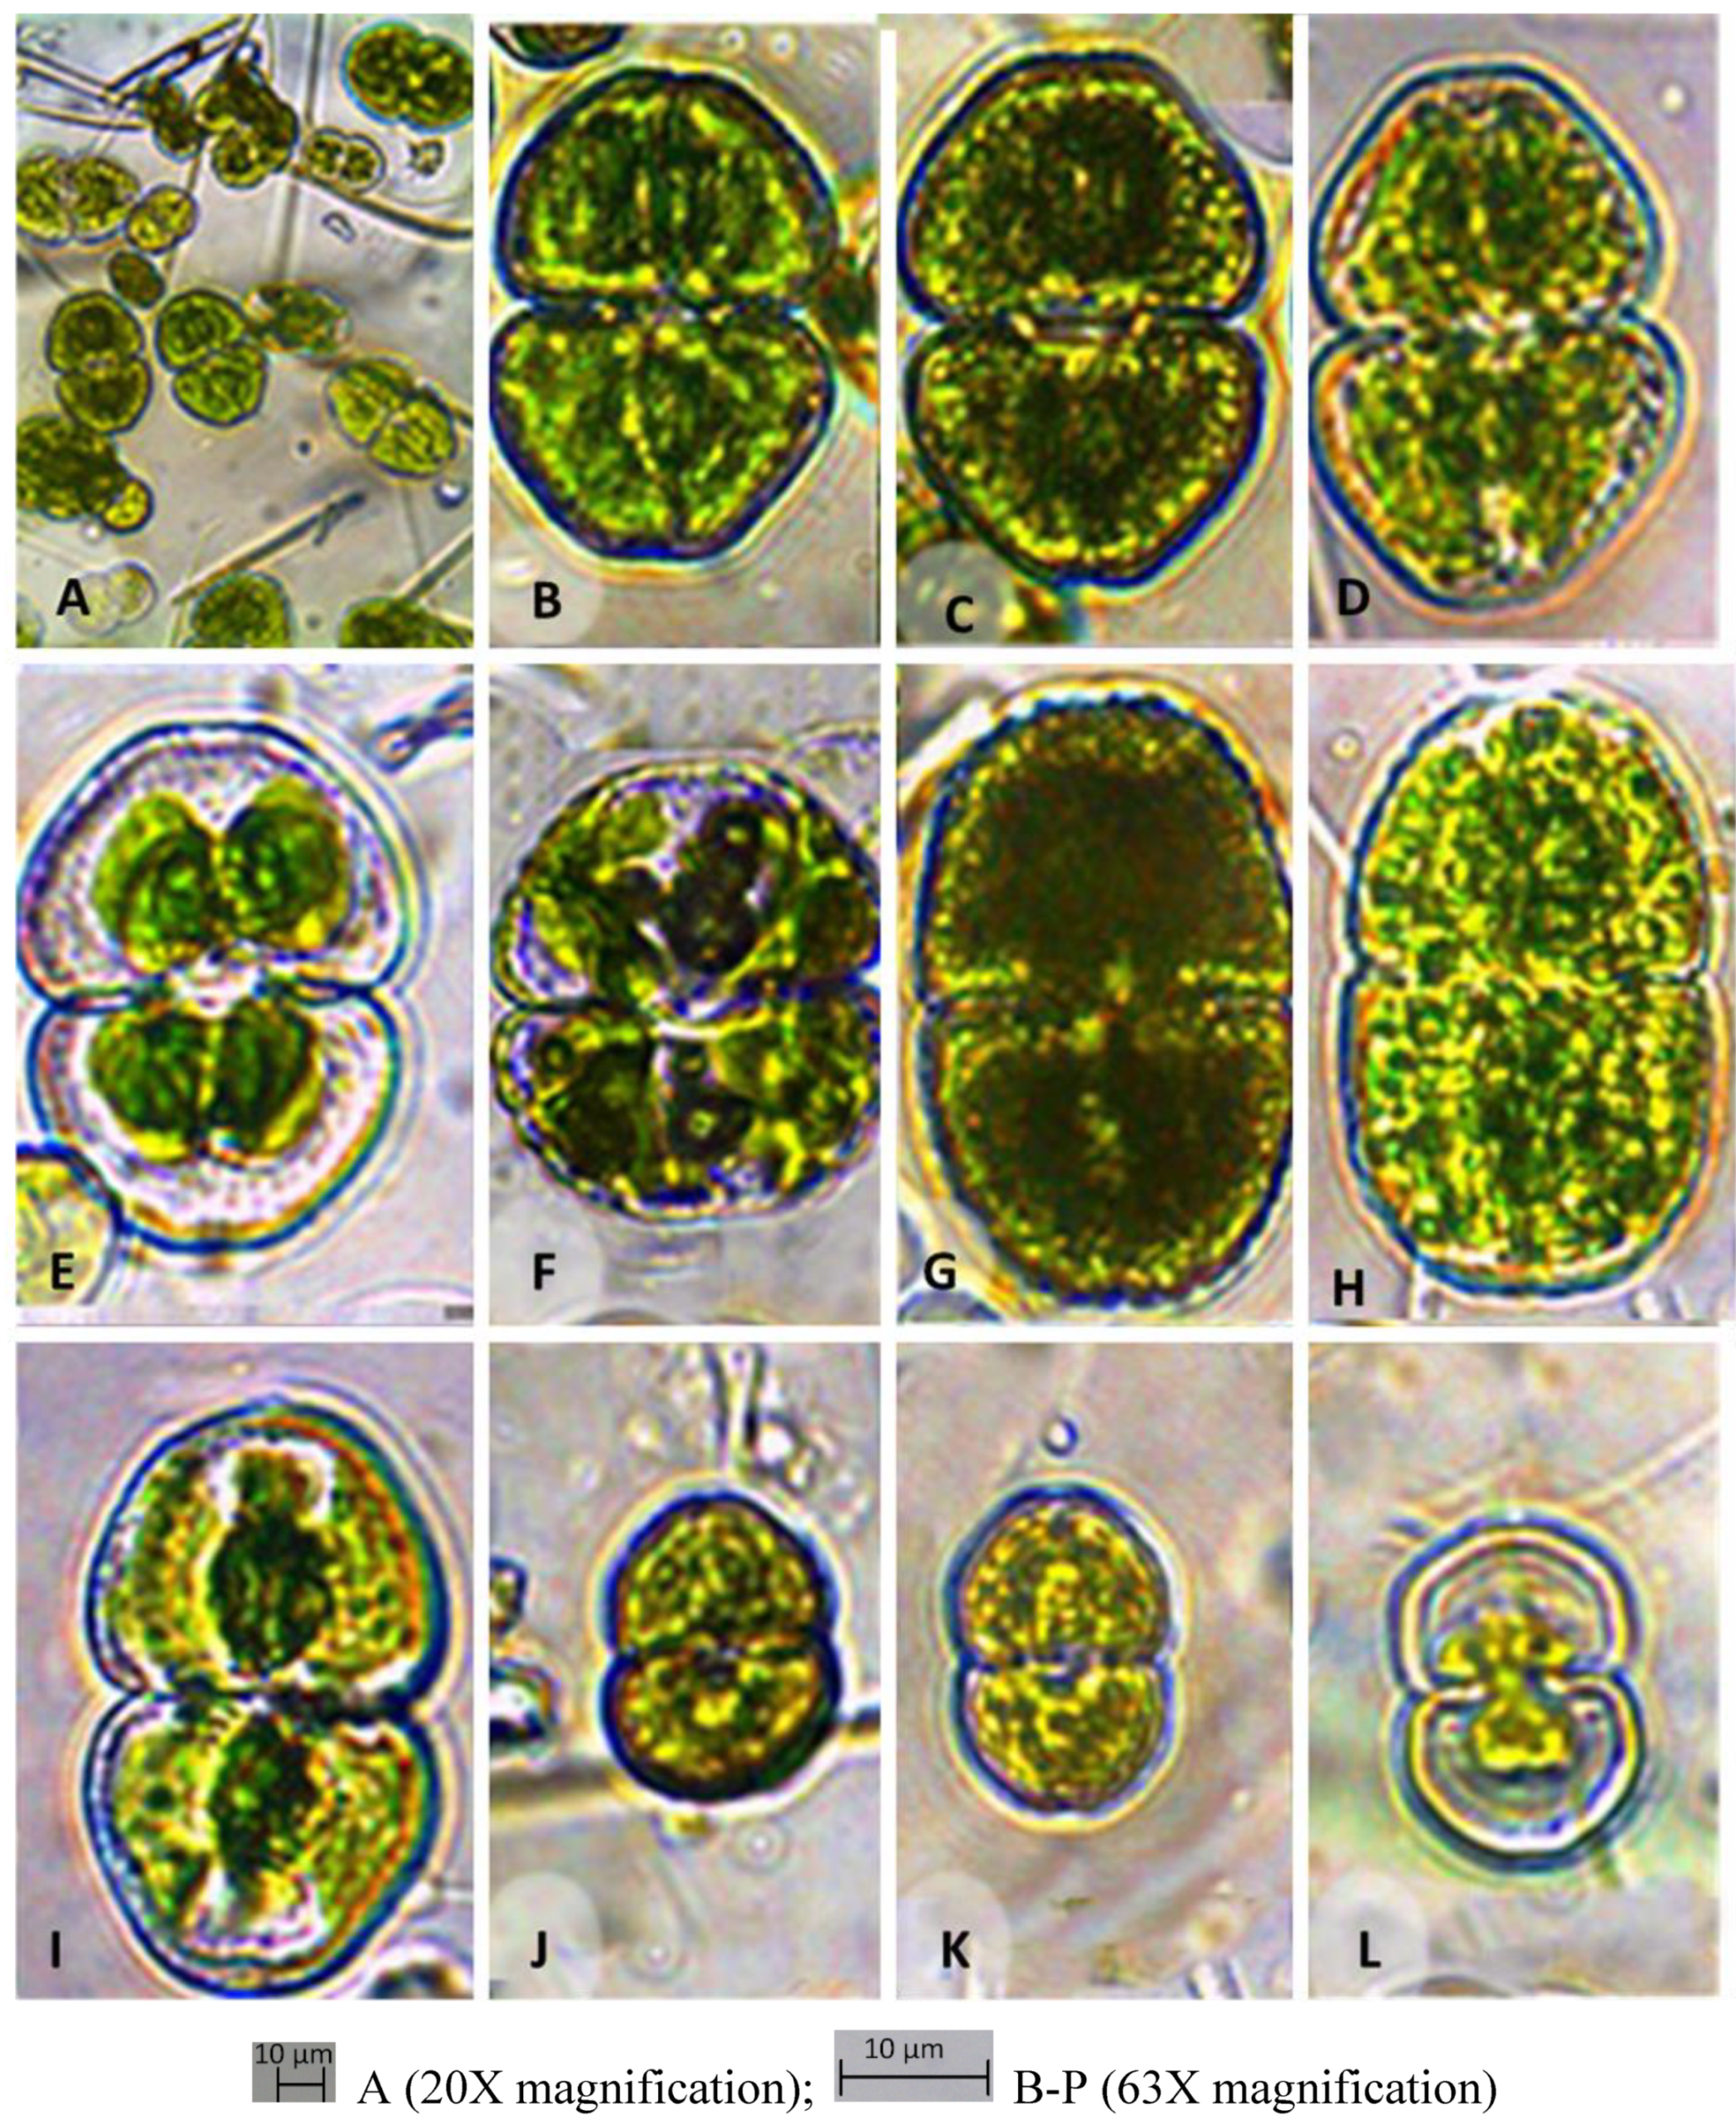
Table 1). As the sampling was carried out in winter, the temperature of surface water at the point of sampling was ranged from 15.8⁰C to 23.8⁰C, which stimulated the growth of low temperature loving algae. Variation in pH was found in the range of 7.56 to 8.65. It has been observed that sampling sites having high algal density showed a high concentration of DO such as 19.06 (site 7), 14.14 (Site 2), 11.45 (site 1) and 11.6 (site 3) mg/L. Sainik pond (site 7) having a large surface area exposed to air showed the maximum DO concentration. Conductivity (650 µs/cm), TDS (361 mg/L) and salinity (0.31⁰%) were found higher in Banthra moist bricks and surrounding water (site 1) which was dominated by seven different species of
Cosmarium such as
C. pyramidatum,
C. subspeciosum,
C. variolatum var.
skujae, C
. maculatum, C. pericymatium, C. granatum,
C. angulosum var.
concinnum and two species of
Closterium such as
C. moniliferum var.
concavum,
C. dianae (
Table 1,
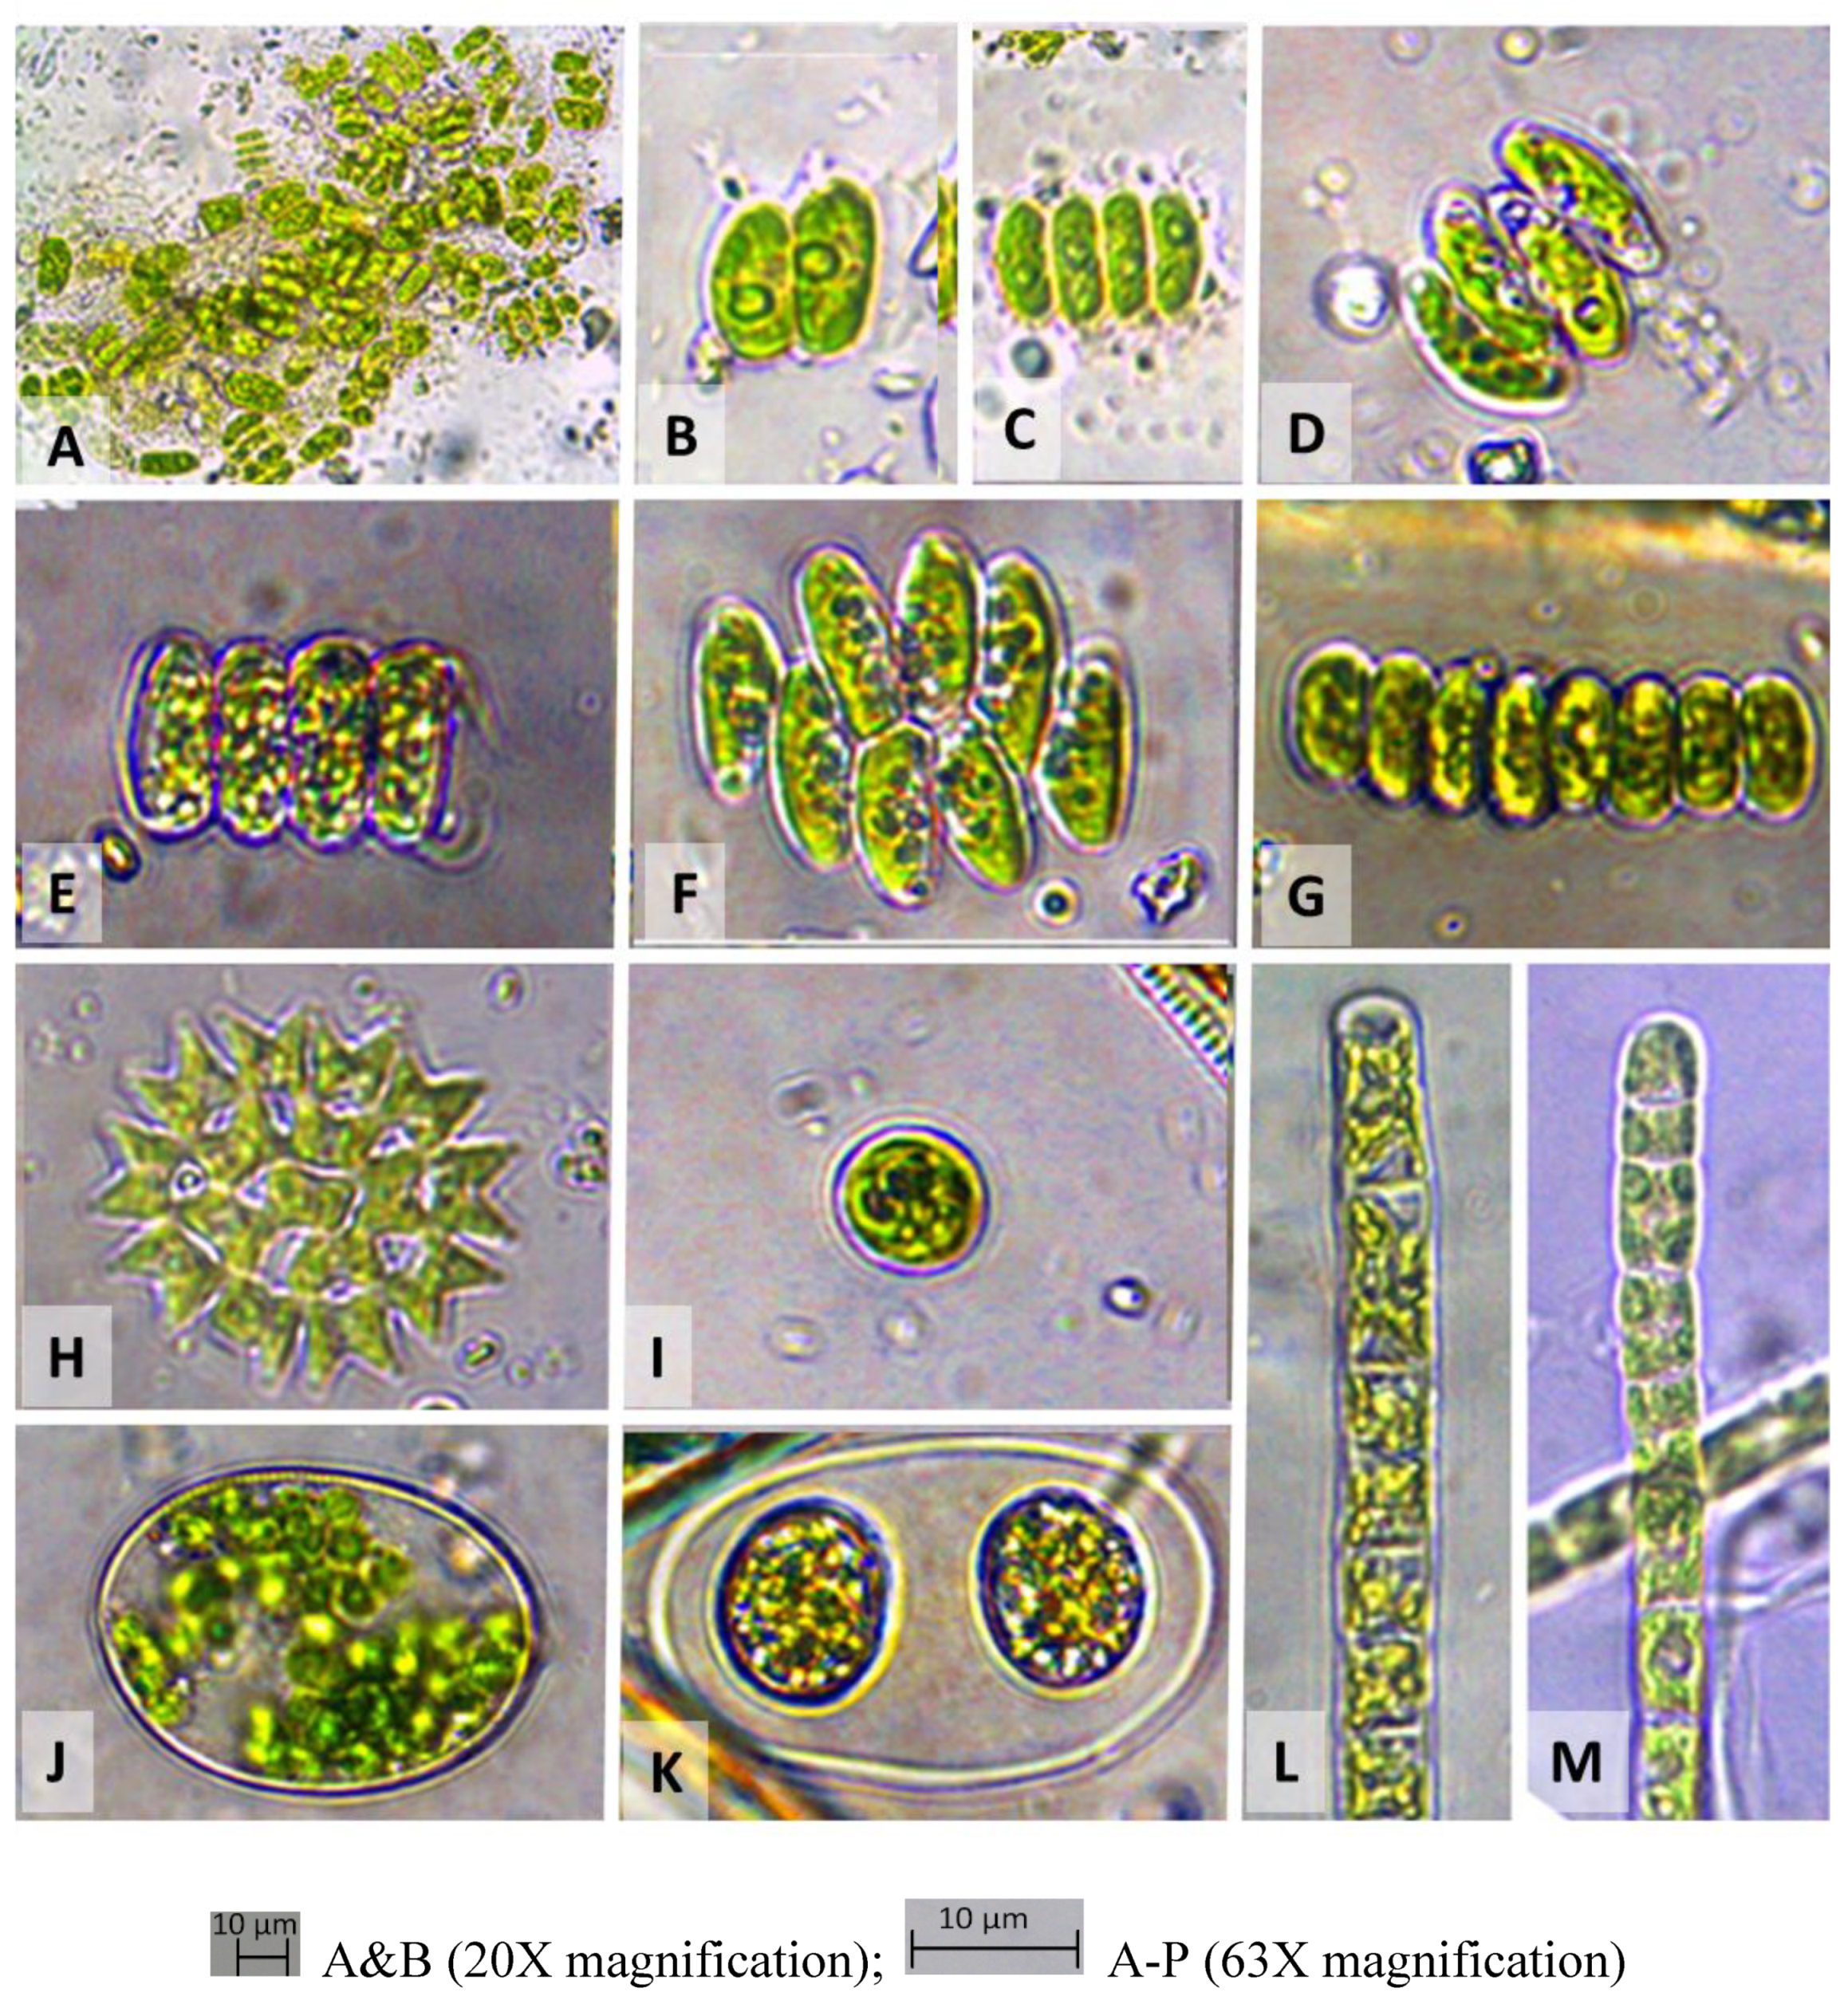
Figure 2). The samples collected from soil of jujube plantation and surrounding water (site 2) were showed higher DO (14.14 mg/L), lower conductivity (572 µs/cm), TDS (277 mg/L) and salinity (0.28 ⁰%), which was typified by mixed flora of
Closterium praelongum,
Scenedesmus bijugatus,
Oocystis gigas and 4 different species of
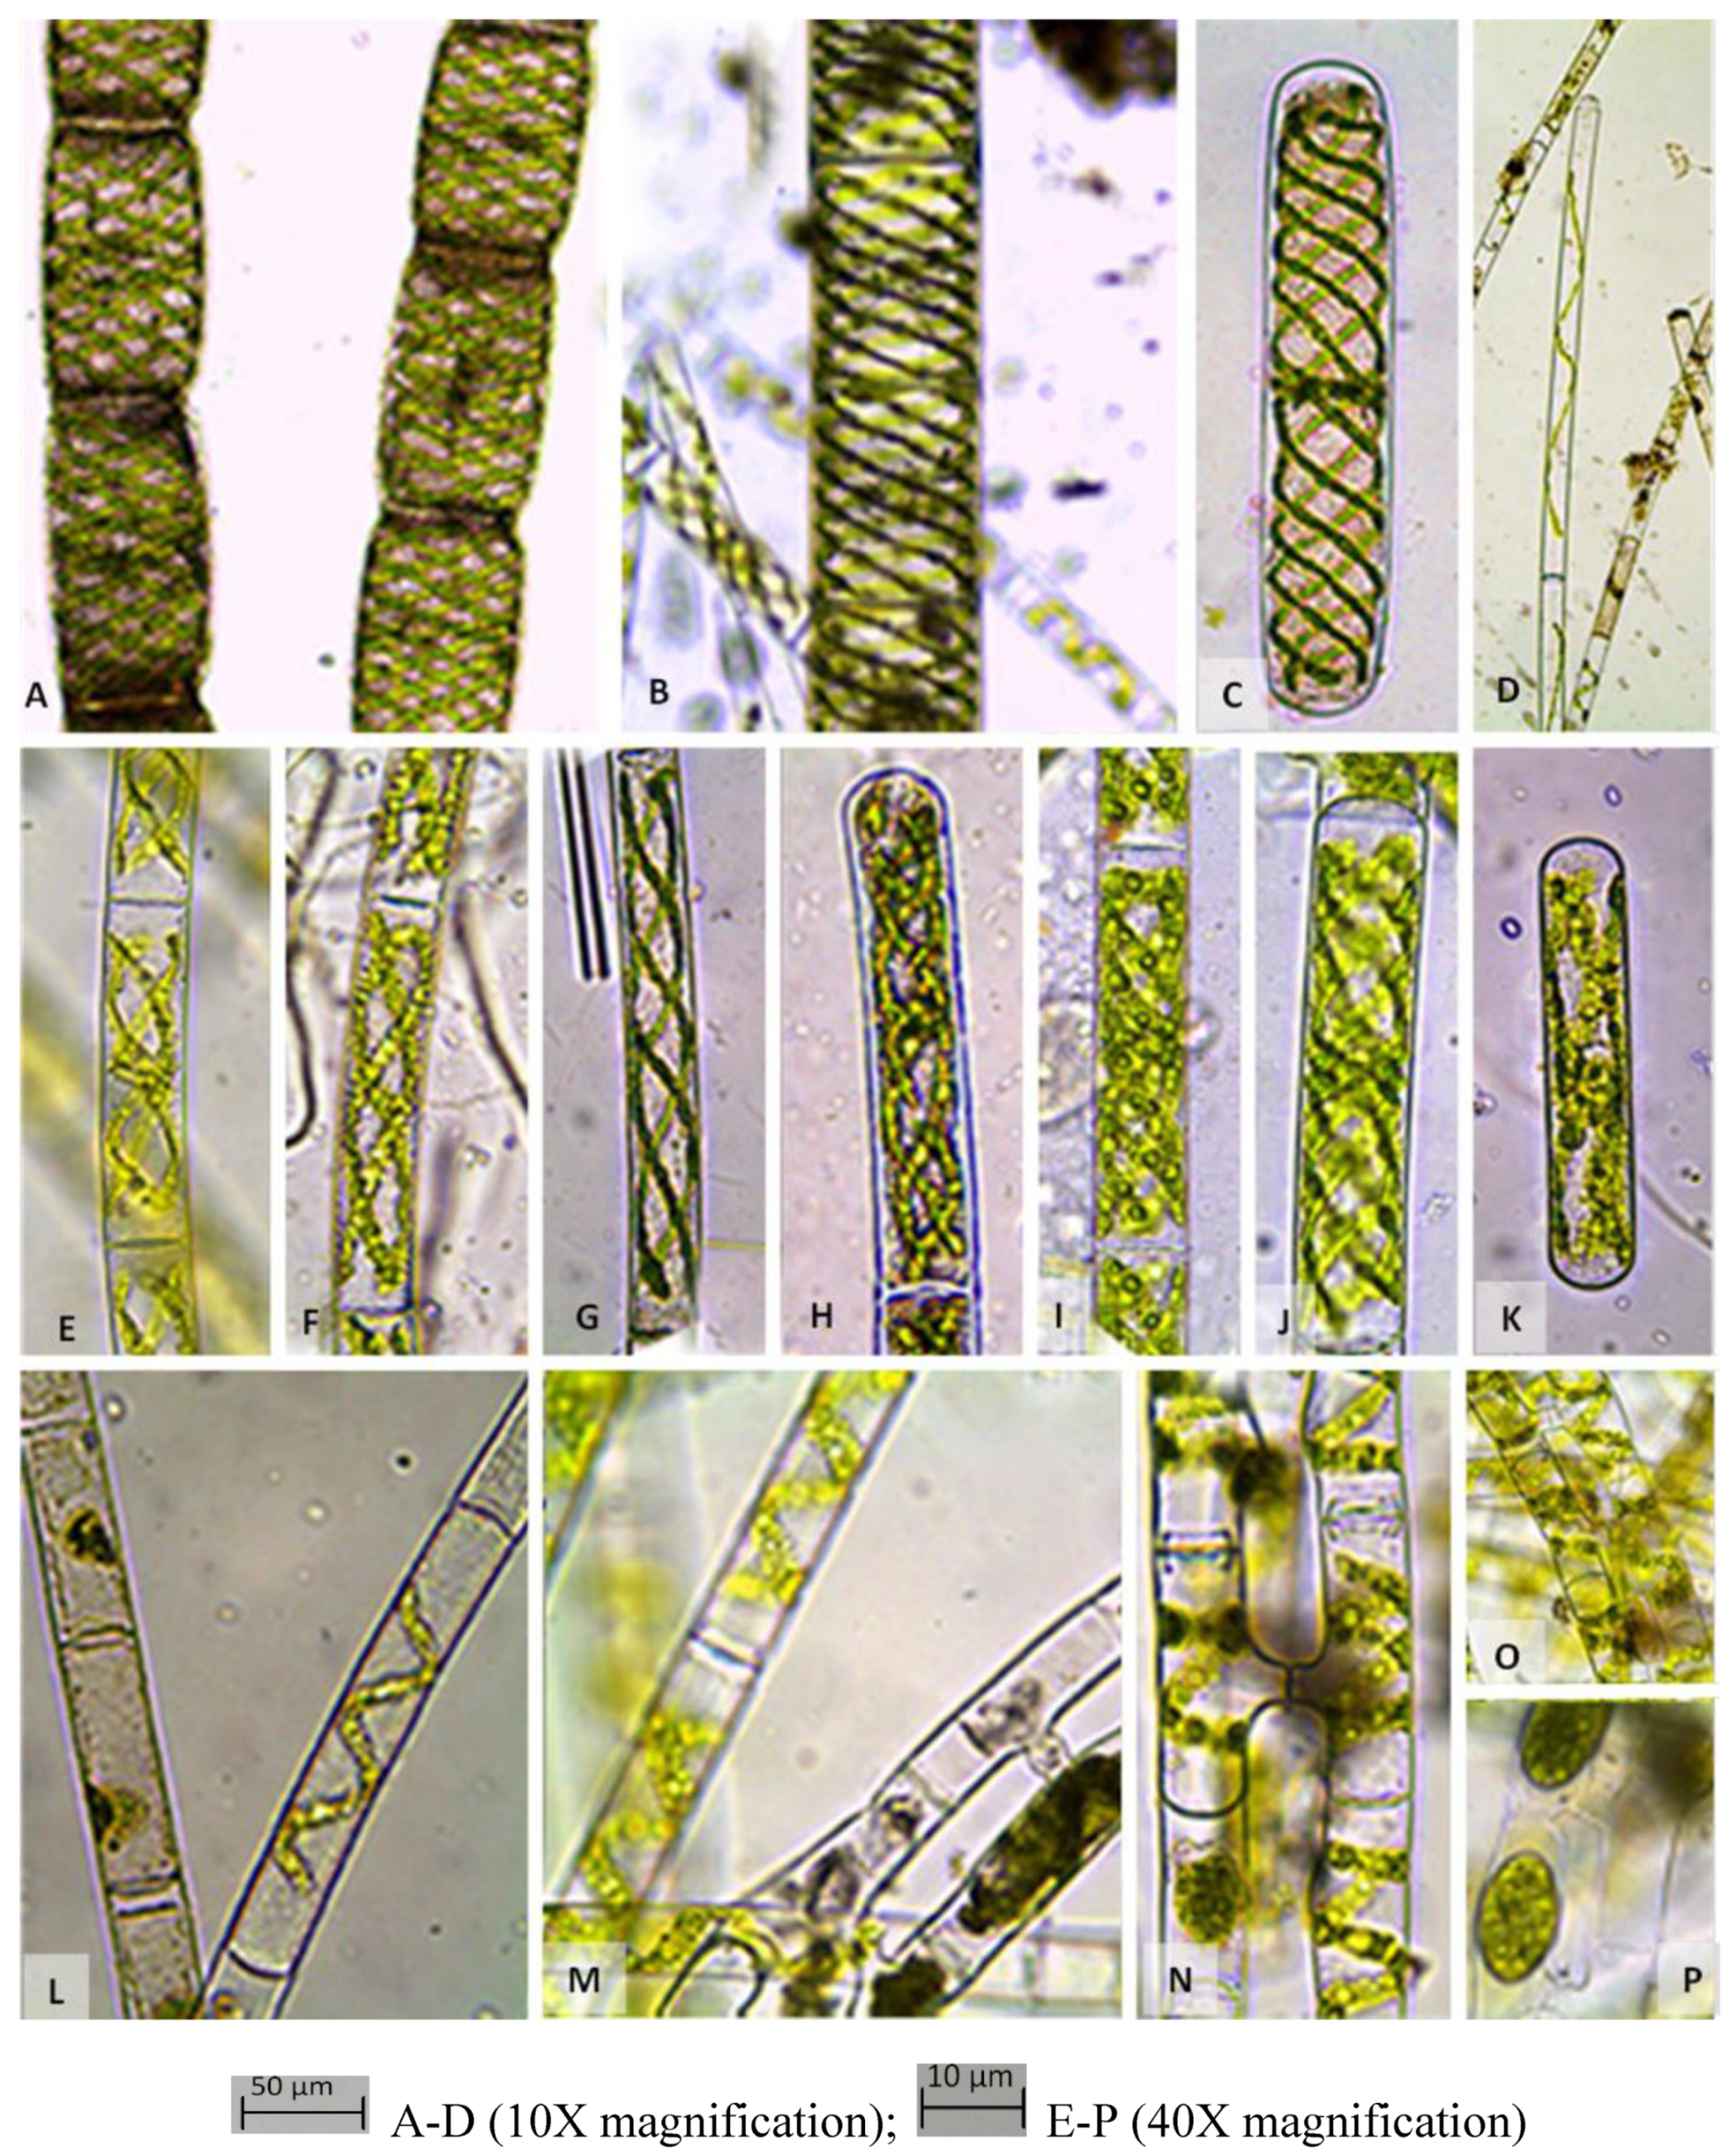
Spirogyra such as
S. maxima, S. crassa, S. elongate and S. inflata (
Table 1,
Figure 3,
Figure 4 and
Figure 5). There are several lotus ponds in Banthra (site 3) with different green algal flora (conductivity 572 µs/cm, TDS 277 mg/L and salinity 0.28 ⁰%). Most of them are dominated with mixed taxa of
Closterium, Scenedesmus and thick filaments of
Spirogyra such as
C. ehrenbergii var.
malinvernianum,
C. parvulum,
C. incurvum, C. leibleinii var.
boergesenii,
S. bijugatus var.
bicellularis, S. decimina, S. neglecta (
Table 1,
Figure 3,
Figure 4 and
Figure 5). Small water tank in Banthra (Site 4) was found to be colder (15.8 ⁰C) than other sites with very low concentration of DO (4.10 mg/L). Conductivity was measured 663 µs/cm, TDS 323 mg/L, salinity 0.32 ⁰% and typified by
Closterium attenuatum,
Closterium rectimarginatum and
Oocystis solitaria (
Table 1,
Figures 3 ad 4). Sugarcane field water was found to be very low in DO (2.27 mg/L) and (site 5) was dominated by a different variety of
Scenedesmus bijugatus and
Scenedesmus quadricauda. Some filamentous green algae such as
Zygnema micropunctatum,
Ulothrix subtilissima,
Spirogyra novae-angliae were also found in water of sugarcane field (
Table 1,
Figure 3 and
Figure 4). We have also collected the sample from the tanks of water pumping station of IISR (site 6) (conductivity 579 µs/cm, TDS 281 mg/L and salinity 0.28 ⁰%) which was dominated by the thick filaments of
Spirogyra crassa and
Spirogyra fluviatilis associated with desmids
Cosmarium granatum (
Table 1,
Figure 2,
Figure 4 and
Figure 5). An open pond (Sinik pond) situated in Kanpur road (Site 7) showed highest DO concentration (19.06 mg/L) as well as lowest conductivity (435µs/cm), TDS (210 mg/L) and salinity (0.21⁰%). The mixed flora of desmids
Cosmarium pyramidatum, Cosmarium formosulum, Staurastrum avicula var.
lunatum, other green algae such as
Scenedesmus bijugatus var.
alternance f.
parvus,
Pediastrum duplex,
Chlorococcum infusionum, filaments of
Spirogyra crassa,
Spirogyra aequinoctialis and
Spirogyra triplicate were identified from Sainik pond (
Table 1,
Figure 2,
Figure 3,
Figure 4 and
Figure 5).
3.2. Topographical Map of the Algal Distribution Pattern
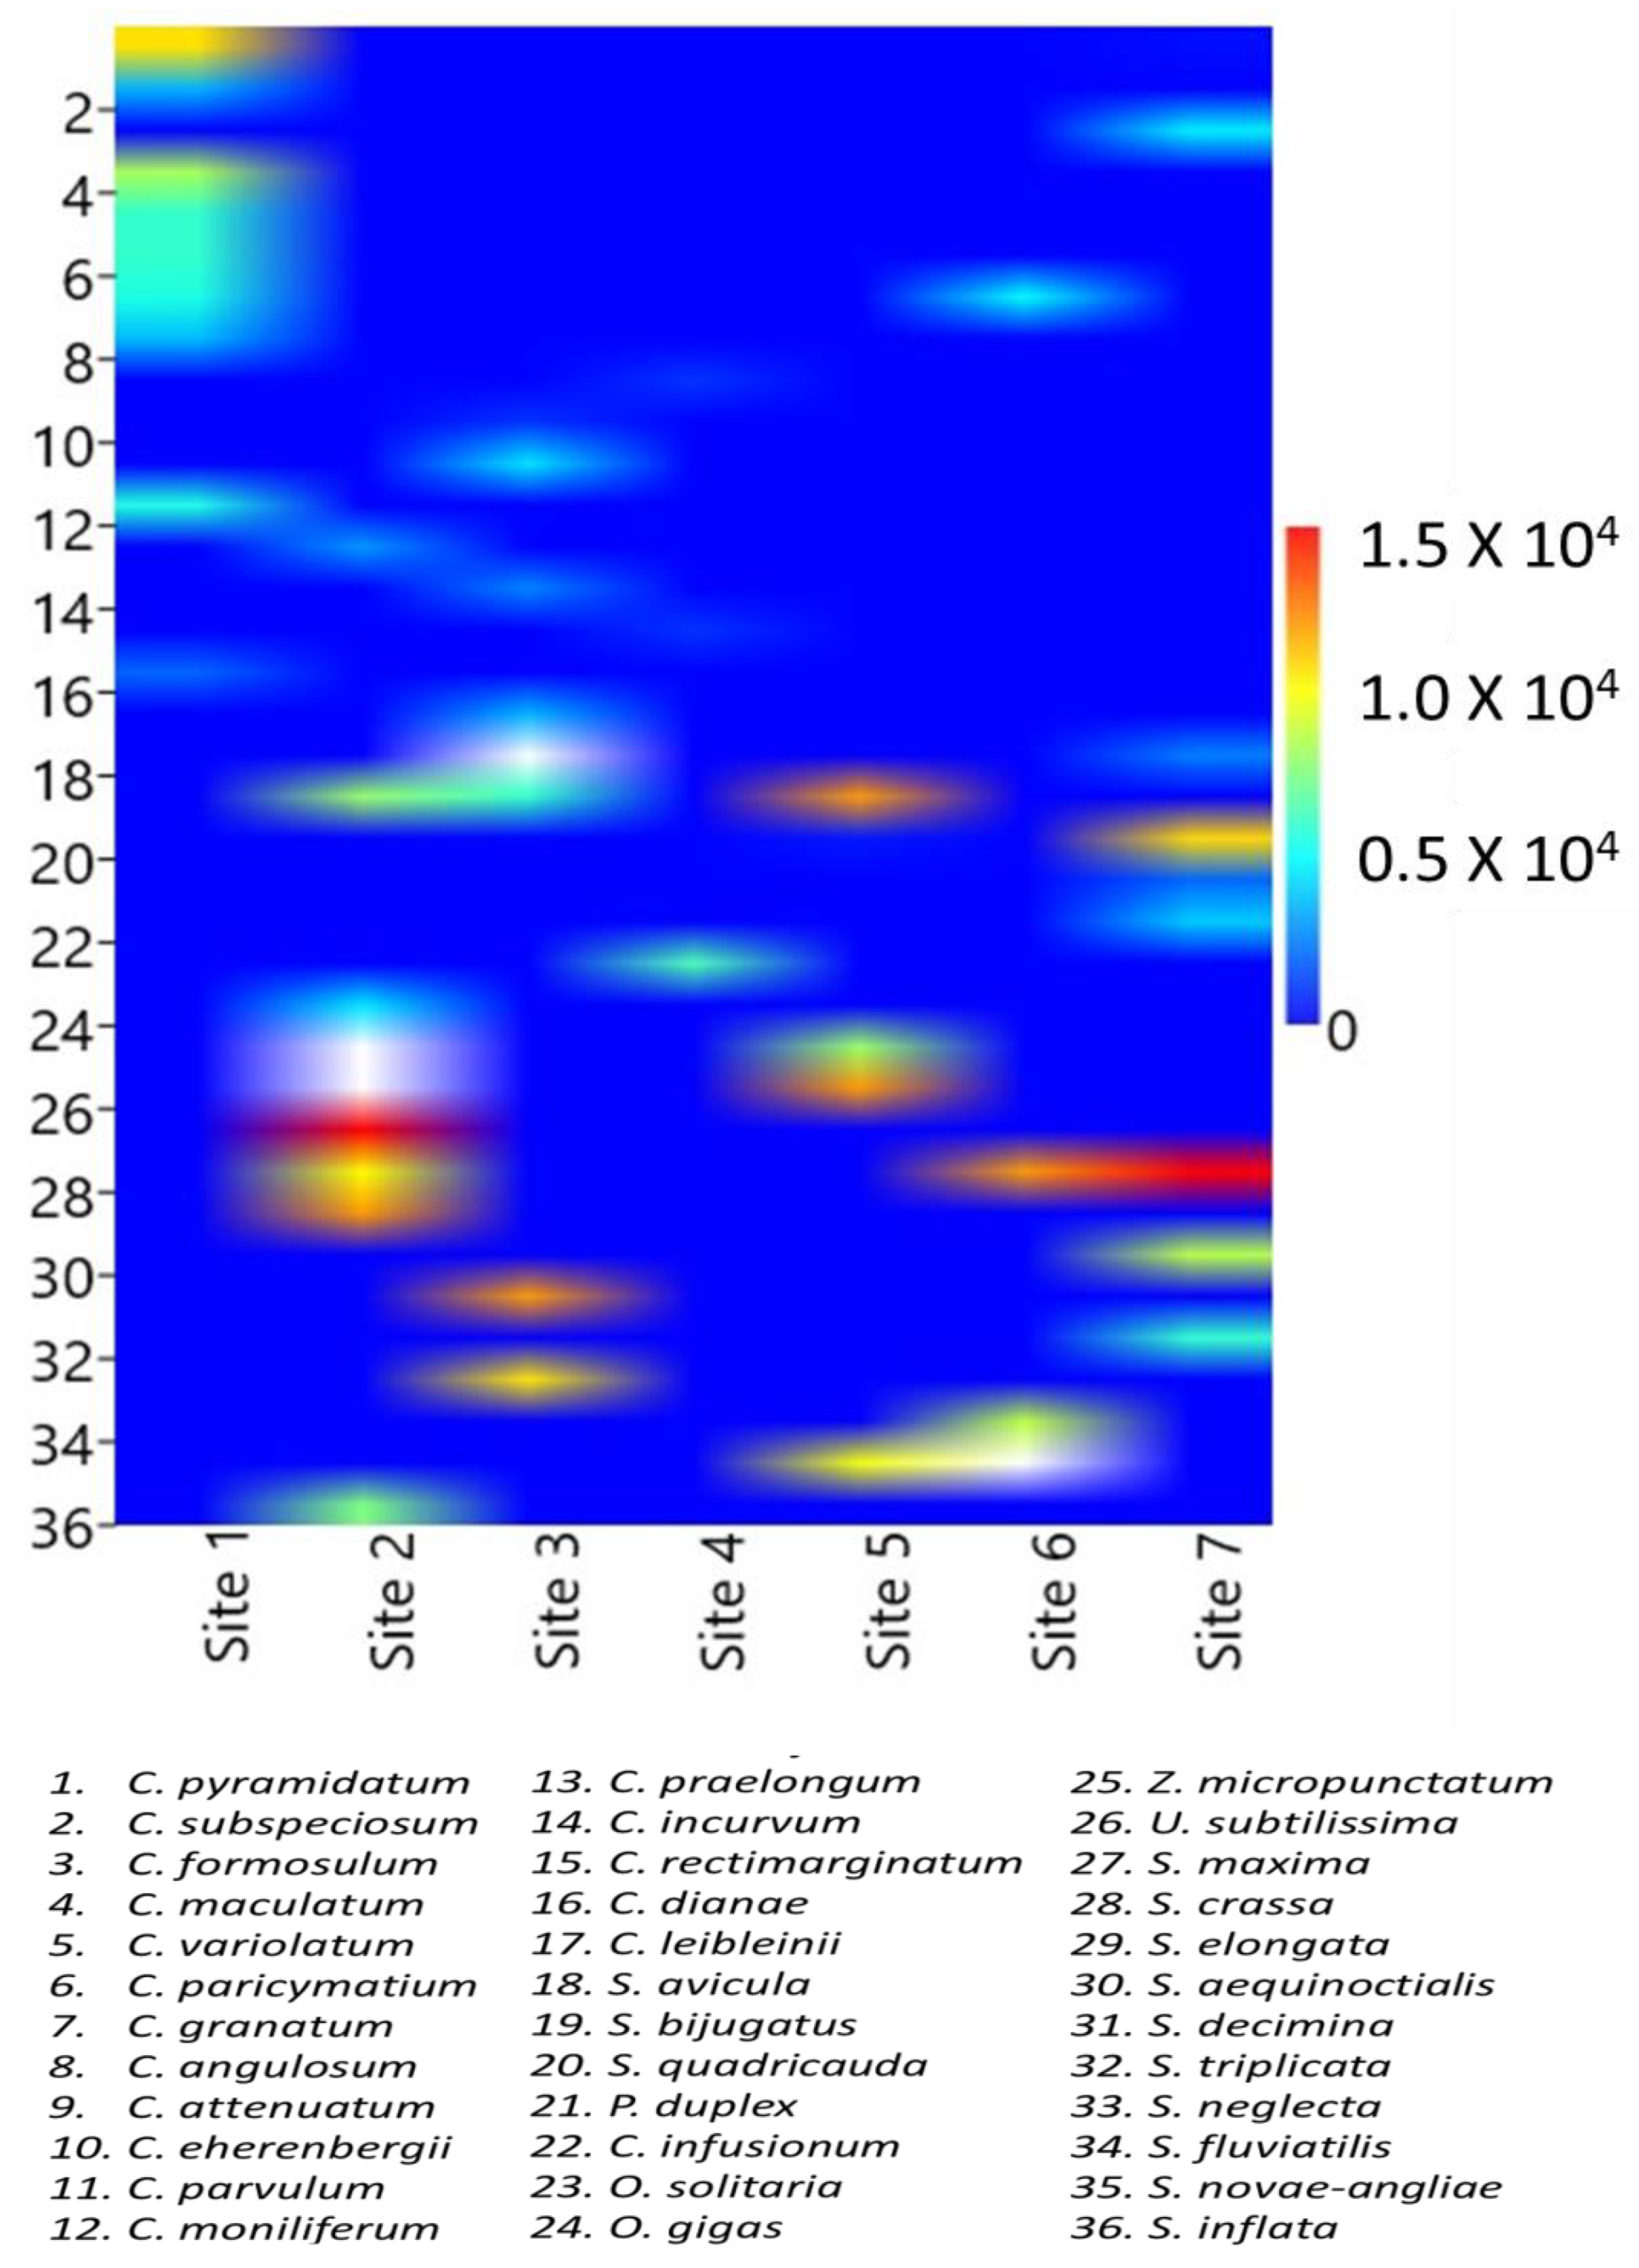
The two-dimensional topographical map was drawn with a colour scale to depict the overview of algal species densities in a particular site (
Figure 6). In two sites densities of 1.5 X 10
4 cells/ml was found and depicted by deep red colour in the map;
S. maxima (no. 27) in site 2 and
S. crassa (no. 28) in site 7. The density of 1.2 X 10
4 cells/ml (orange colour) was contributed by
S. elongata (no. 29) in site 2,
S. crassa (no. 28) in site 6,
S. bijugatus (no. 19) and
U. subtilissima (no. 26) in site 5. About 1.0 X 10
4 cells/ml density was depicted by yellow colour contributed by
C. pyramidatum (no. 1) in site 1,
S. crassa (no. 28) in site 2,
S. neglecta (no. 33) in site 3,
S. quadricauda (no. 20) in site 6. Cell density of 0.5 X 10
4 cells/ml was represented by light blue colour in the map and contributed by different species (more than 9 numbers of species). Gradually darker the blue colour lesser densities were represented. Zero density means the absence of species was represented by dark blue colour and the major portion of the map is blue as many of the total identified species were present in a particular site and absent in others.
3.3. Diversity Indices
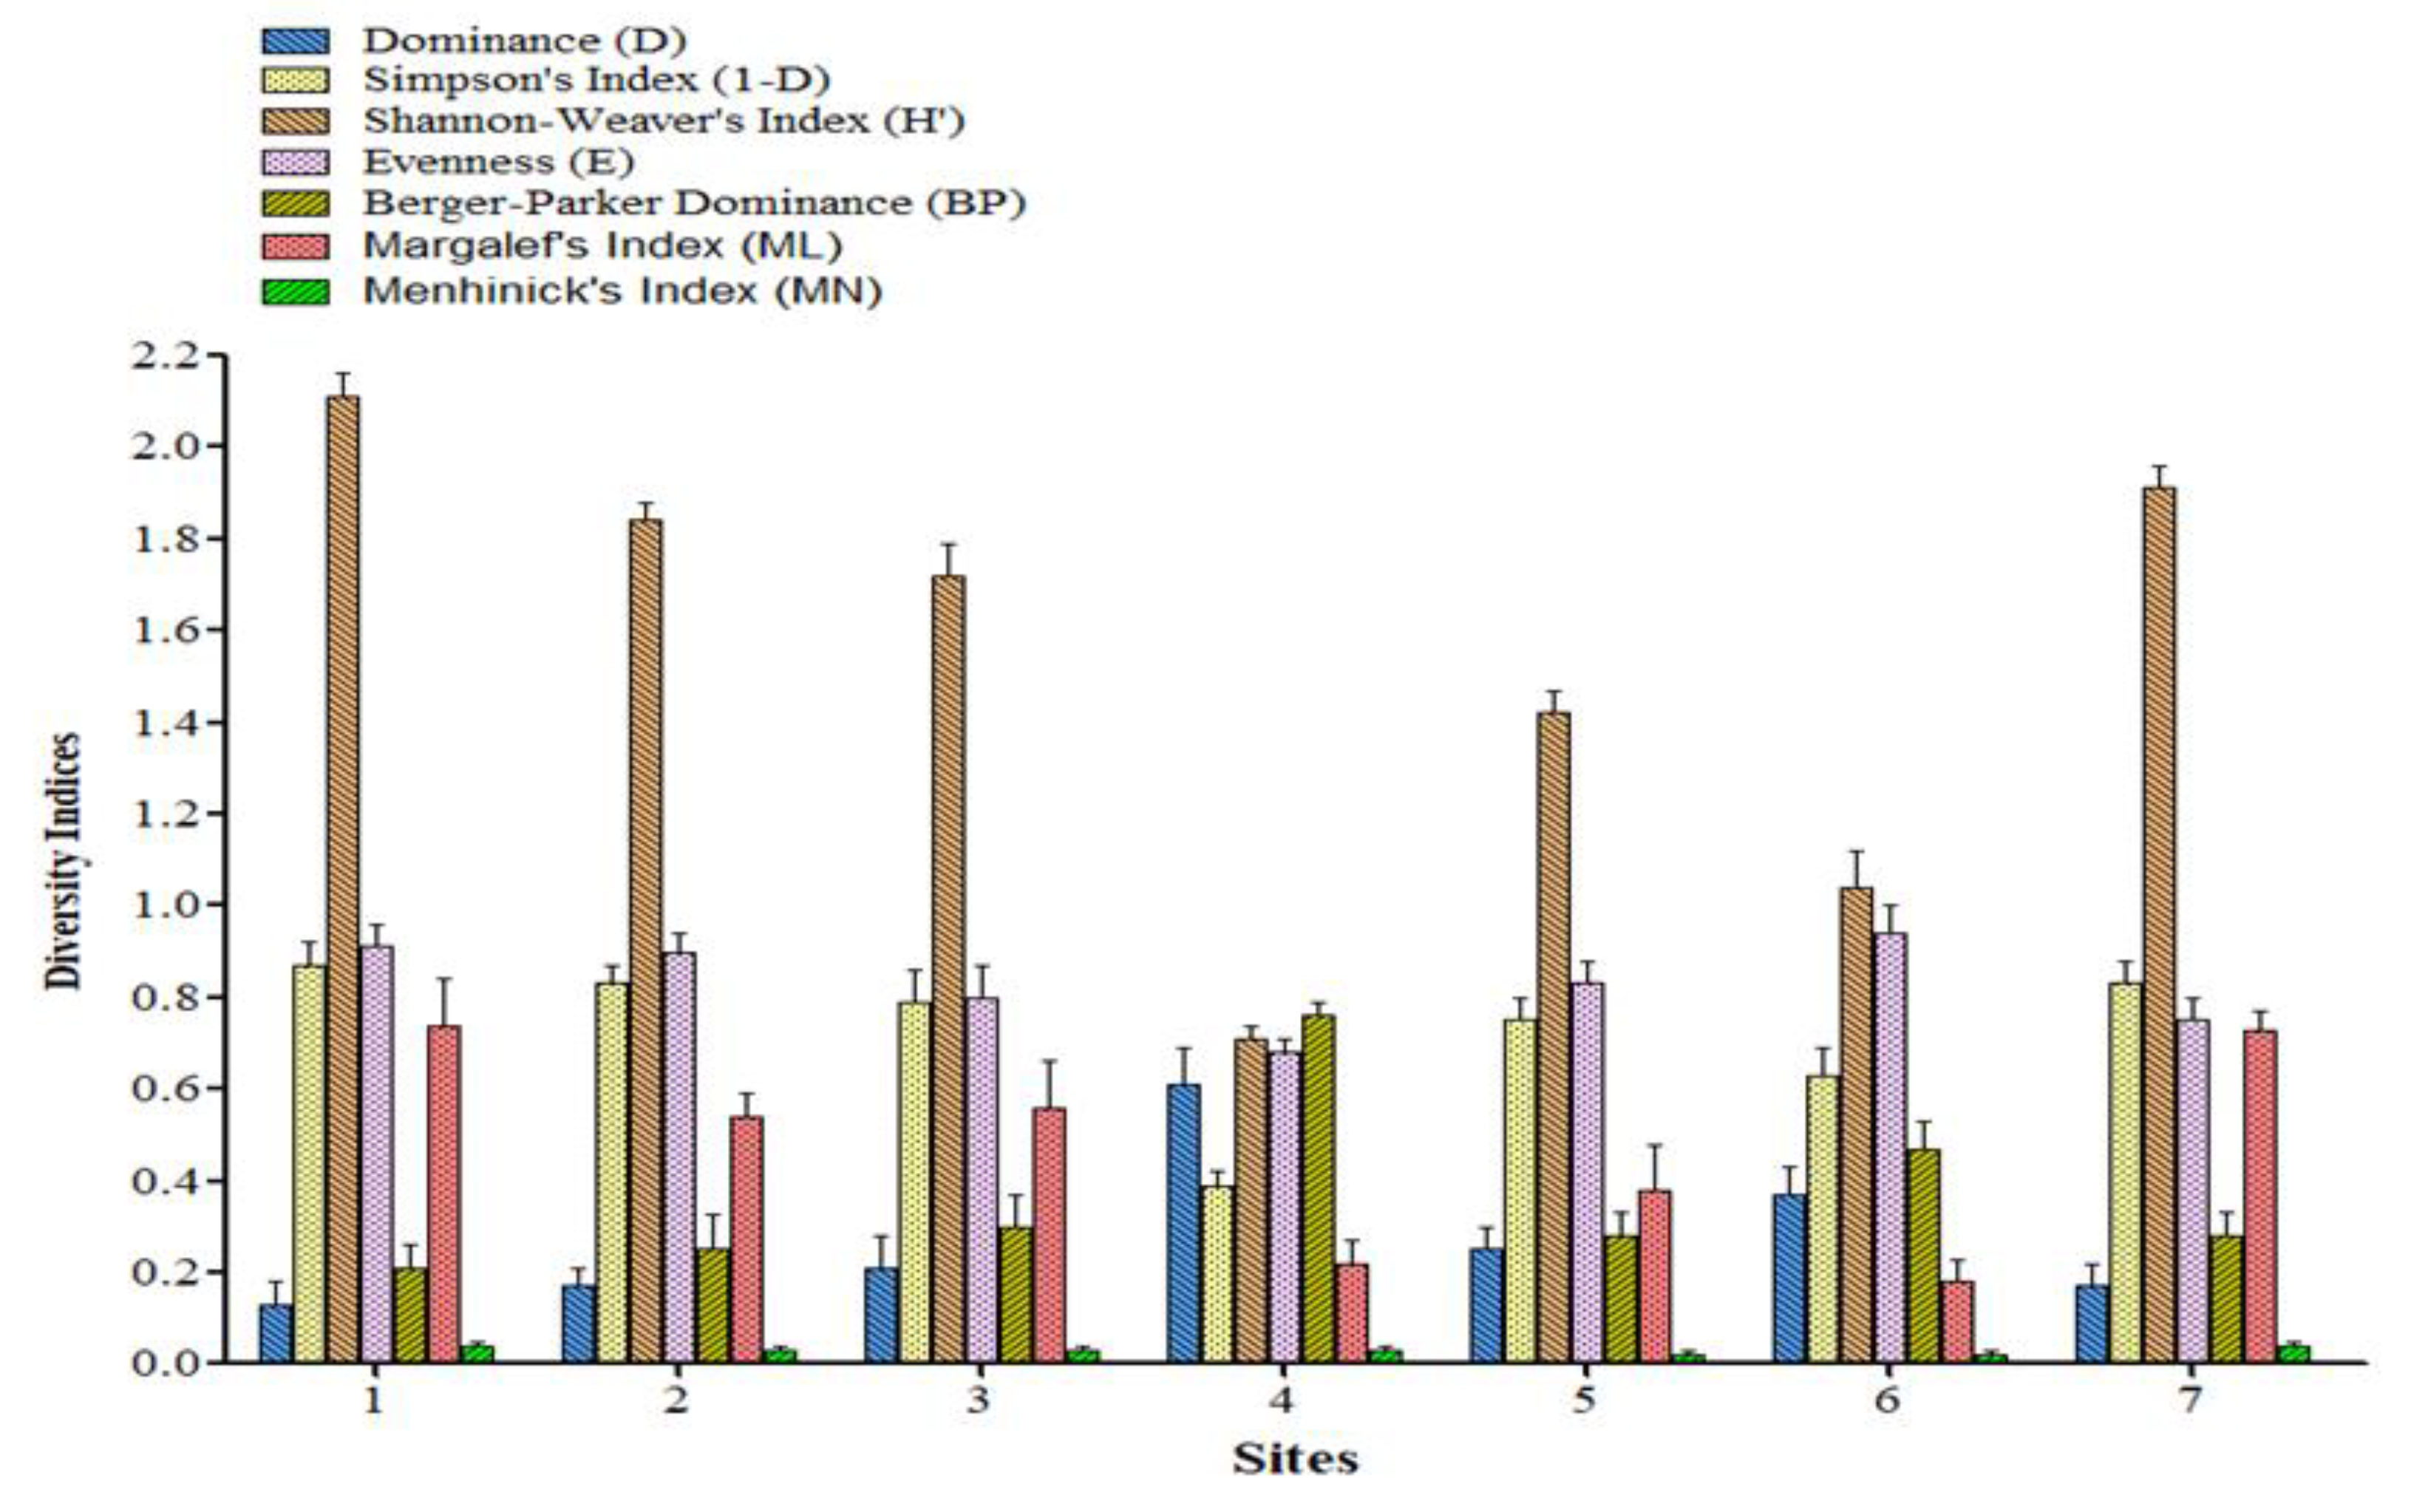
Diversity indices are the mathematical representation of species diversity in a community represented in
Figure 7. Diversity indices provided more information about community composition than simply species richness (i.e., the number of species present); they also have taken the relative abundances of different species into account. The Dominance index represented the quantitative measure of species diversity, lower the value lower the species diversity. Dominance index was found highest in site 4 (0.61) where only three taxa were identified, whereas the lowest one was measured in site 1 (0.13) where 9 taxa were identified. Simpson’s and Shannon-Weaver’s diversity index were measured on the basis of number of species present, as well as the relative abundance of each species in each sites. We have found the highest value in site 1 (0.87 and 2.105) where the number of species (9 taxa) and abundance were more and the lowest one in site 4 (0.61 and 0.38). Species Evenness refers to the frequencies of the different taxon making up a flora of a particular site, 1 is absolute species evenness of a particular site. Generally when species diversity increased evenness increased simultaneously as observed in site 1 (0.91) which consisted of 9 taxa; but exceptionally the greater evenness (0.94) was also observed in site 4 where only 3 taxa were identified. Berger-Parker Dominance is a simple measure of the numerical importance of the most abundant species. The abundance of species is greater when a number of taxa is low. In the present study the site 4 showed the highest Berger-Parker Dominance (0.76) as it consisted of only 3 taxa. Margalef’s and Menhinic’s index were used as a simple measure of species richness (Margalef, 1958). The measurements depended on number of species and number of individuals at a particular site. The sites consisted of a higher number of species had higher value of Margalef's and Menhinic's index such as site 1(0.74 and 0.04) and 7 (0.73 and 0.04) respectively.
4. Discussion
Algal community structure depends on the place, water parameters and seasonal variations. Nowadays, algal flora is very much affected by the changes in the environment, global warming and pollution related problems. Some species may become endangered and many of them could be newly introduced in the particular place. They can be effectively used as an indicator of water quality and pollution. Many of the research papers are presented the taxonomic (morphological) identification of different taxa available in different places of India (Patil et al., 2011; Kalita et al., 2015; Ramesh and Aruna, 2015; Handa and Jadhav, 2015); but limited publication is available related to the taxonomic (morphological) identification, diversity and distribution of algae with respect to water quality or seasonal variation. We have also studied the water parameters of collection sites, plotted the overview of distribution and density of algal species in particular sites and measured the diversity indices. Morphological features were analyzed and compared with several published monographs for correct identification of the taxa and regenerate the taxonomic keys for the particular species. As the sampling was carried out in winter season (15.8⁰C to 23.8⁰C) thereby the 36 green algal taxa identified can be marked as low temperature loving algae. The pH of the water was found within the optimum ranges of pH (7.0- 9.0) for algal growth (Munir et al.. 2015). It has been observed that sampling sites having high algal density showed a high concentration of DO, which is obvious as algae contribute directly to DO concentration during photosynthesis. Large water surface exposed to air also dissolve more oxygen as observed in Sainik pond where the diversity of algae was also in a greater extent. TDS and salinity these are the important parameters to measure water quality. After analyzing the distribution and occurrence of the green algal species we have observed that less polluted water is dominated by Spirogyra; where conductivity, TDS and salinity of water were low (site 2, 5 and 7). Whereas the more polluted water was dominated by desmids (site 1 and 4). Sometimes we have seen that the particular place influences the growth and dominancy of particular species. Perhaps the bricks and rocky surface facilitate the growth of Cosmarium as observed in Banthra moist bricks and surrounding water (site 1). We have also observed the dominancy of Scenedesmus in sugarcane agricultural field soil (site 5). Earlier studies have reported that plant roots release a variety of organic compounds, sugars, amino acids, organic acids etc. which may influence the algal flora in the plant rhizosphere (Neumann and Romheld, 2001). Probably the root exudates of sugarcane influence the growth of Scenedesmus, as it is known to be growing on external carbon sources in heterotrophic mode (Dasgupta et al., 2015). However the overall water quality of these water bodies in winter were within the range of standard norms (DO 5.0-7.0 mgL-1, pH 6.5-8.5, conductivity <750 mgL-1, TDS <500 mgL-1) of World Health Organization (WHO), Bureau of Indian Standard (BIS), Central Public Health and Environmental Engineering Organization (CPHEEO), The Environment Protection Rule, 1986 (EPR) and Central Pollution Control Board (CPCB), Govt. of India. Whereas as reported by Dasgupta et al. (2017) polluted water with higher conductivity, TDS and salinity were mostly dominated by blue-green algae and diatoms. Some of the genus and taxa identified in the present study have also been reported previously from different sites of Lucknow (Singh, 2015). There are few Chlorophycean genera has been reported previously (Kumar and Suseela, 2004; Singh, 2015) but all the species identified in the present study are new to the records of Lucknow except C. angulosum, O. gigas and P. duplex which was identified earlier from Lucknow by Dasgupta et al. (2017).
Conclusion
Rapid economic growth, urbanization, industrialization and pollution contributed to worldwide changes in the environment and water quality, which also reflected in the diversity and distribution of microalgal communities. The study revealed that in winter water quality was within the standard norms and Spirogyra and desmids can act as indicators of water quality. Mostly less polluted water with low conductivity, TDS and salinity was typified by a greater diversity of Spirogyra and highly polluted one dominated by different species of desmids. This is an extensive work on green algal species of Lucknow and most of the species identified are new to the records of Lucknow. In-depth analysis of community composition, simple species richness and relative abundances of different species in a particular site were measured by two-dimensional topographical map and mathematical measurements of diversity indices.
Acknowledgement
Work is supported by Science and Engineering Research Board (SERB) (Grant No. SPG/2021/001796), New Delhi and Amity University Uttar Pradesh Lucknow Campus and CSIR-National Botanical Research Institute, Lucknow.
Author Contributions
Conceptualization, Chitralekha Nag Dasgupta; Formal analysis, Chitralekha Nag Dasgupta and Sanjeeva Nayaka; Methodology, Atul Singh; Resources, Atul Singh; Writing – original draft, Chitralekha Nag Dasgupta; Writing – review & editing, Sanjeeva Nayaka.
References
- Berger WH and Parker FL 1970 Diversity of planktonic foraminifera in deep-sea sediments. Sci 168 1345-134. [CrossRef]
- Guiry MD and Guiry GM 2019 AlgaeBase. World-wide electronic publication, National University of Ireland, Galway. http://www.algaebase.org.
- Gupta RK 2012 Algae of India: A checklist of Chlorophyceae, Xanthophyceae, Chrysophyceae and Euglenophyceae. Volume 2, Botanical Survey of India.
- Handa S and Jadhav R 2015 Pre and Post monsoon diversity of Chlorophycean algae in Mithi River, Mumbai. Int J Sci Res Pub 5 (9) 1-3.
- Harper DAT 1999 Numerical Palaeobiology. John Wiley & Sons.
- Kalita J, Bhuyan SI and Das R 2015 An assessment of Green algae (Chlorophyceae) diversity in different habitats of RiBhoi, Meghalaya. The Pharma Innovation 4(2, Part B) Pp.50.
- Kumar S and Suseela MR 2004 Freshwater algal variation of river Gomti at three different sites in winter months. J Econ Taxon Bot 28(2) 398-402.
- Leliaert F, Tronholm A, Lemieux C, Turmel M, DePriest MS, Bhattacharya D, Karol KG et al. 2016 Chloroplast phylogenomic analyses reveal the deepest-branching lineage of the Chlorophyta. Sci Reports 6(1) 25367. [CrossRef]
- Leliaert F, Verbruggen H and Zechman FW 2011 Into the deep: new discoveries at the base of the green plant phylogeny. BioEssays 33 (9) 683-92. [CrossRef]
- May RM 1975 Patterns of species abundances and diversity. In: Cody ML, Diamond JM (eds), Ecology and Evolution of Communities. Belknap Press of Harvard University Press, Cambridge, MA Pp. 81–120.
- Munir N, Imtiaz A, Sharif N and Naz S 2015 Optimization of growth conditions of different algal strains and determination of their lipid contents. J Anim Plant Sci 25 546-553.
- Dasgupta CN, Suseela MR, Mandotra SK, Kumar P, Pandey MK, Toppo K and Lone JA 2015 Dual uses of microalgal biomass: an integrative approach for biohydrogen and biodiesel production. Appl Energ 146 202-208. [CrossRef]
- Dasgupta CN, Toppo K, Nayaka S and Singh AK 2017 Algal Diversity and Water Quality Assessment During Summer in Some Suburban Water Bodies of Lucknow, Uttar Pradesh. Crypt Biodivers Assess 2 (2) 1-10. [CrossRef]
- Neumann G and Romheld V 2001 The release of root exudates as affected by the plants physiological status. In: The rhizosphere: Biochemistry and organic substances at the soil-plant interface, eds. R. Pinto, Z. Varanini, and P. Nannipieri, New York: Marcel Dekker, Pp 41–93.
- Patil K J, Mahajan RT and Mahajan SR 2011 Phytonic diversity of Jalgaon district, Maharashtra (India). J Algal Biom Utiliz 3(2) 71-102.
- Patil PN, Sawant DV and Deshmukh RN 2012 Physico-chemical parameters for testing of water-A review. Int J Environ Sci 3(3) 1194.
- Philipose MT 1967 Chlorococcales, monograph on algae. Indian Council of Agricultural Research, New Delhi.
- Prasad BN and Misra PK 1992 Algal flora of Andaman and Nicobar island, vol. II, B. Singh and M. P. Singh, Publ. Dehradun Pp. 284.
- Prescott GW 1951 Monograph of Algae of the Western Great Lakes Area. Cranbrook Institute of Science, Michigan, U.S.A.
- Ramesh B and Aruna M 2015 Diversity of fresh water algae in Trivenisangamam of Nizamabad district, Telangana state. India Euro J Bot 2 31-37.
- Scott AM and Prescott GW 1961 Indonesian desmids. Hydrobiol 17 1-132.
- Shannon CE, Weaver W 1963 The mathematical theory of communication Urbana. University of Illinois Press.
- Simpson EH 1949 Measurement of diversity. Nat 163 688. arXiv:10.1038/163688a0.
- Singh P 2015 A seasonal study of phytoplanktons diversity of Gomti river Lucknow, (UP) India: A pollution indicator. Int J Adv Res 4(3) 1900-05.
- Suseela MR, Toppo K and Usmani MA 2015 Enumeration of fresh water algal flora of Uttar Pradesh. In: Mishra GK, Nayaka S and Saini DC (eds) Plant diversity of Uttar Pradesh (Including Algae and Fungi). ASR Publications. Ghaziabad.
- Tiffiny LH and Britton ME 1952 Monograph on the algae of Illinois. The University of Chicago press.
|
Disclaimer/Publisher’s Note: The statements, opinions and data contained in all publications are solely those of the individual author(s) and contributor(s) and not of MDPI and/or the editor(s). MDPI and/or the editor(s) disclaim responsibility for any injury to people or property resulting from any ideas, methods, instructions or products referred to in the content. |
© 2024 by the authors. Licensee MDPI, Basel, Switzerland. This article is an open access article distributed under the terms and conditions of the Creative Commons Attribution (CC BY) license (http://creativecommons.org/licenses/by/4.0/).
