Preprint
Article

Photodegradation of a Broad-Spectrum Antibiotic Azithromycin Using H2O2 under UV Irradiation

Altmetrics

Downloads

99

Views

53

Comments

0

This version is not peer-reviewed

Submitted:

23 April 2024

Posted:

24 April 2024

You are already at the latest version

Alerts
Abstract
The photodegradation of azithromycin present was carried out in water using H2O2 under UV irradiation. The reaction variables considered in this study were the amount of H2O2 solution and the initial concentration of azithromycin to evaluate the performance of the photodegradation process. The azithromycin degradation was not observed in the dark during stirring for 20 minutes. The study showed efficient photodegradation of azithromycin using H2O2 as an oxidant in the presence of UV irradiation. The azithromycin degradation was affected significantly by the pH of the irradiated solution. The degradation was low at an acidic pH and showed an increasing trend as the pH changed to basic. The azithromycin degradation was increased with a higher amount (higher concentration) of H2O2. The degradation of azithromycin decreased with a higher concentration of azithromycin in the reacting solution. The highest degradation of AZT was achieved in 1 hour using a 1.0 ppm AZT solution containing 3 ml of H2O2. The experimental data obtained was well-fitted to zero-order reaction kinetics. The results of this study were found to be superior when compared with those reported in the literature, with photocatalysis using nanomaterials and photolysis using irradiation and H2O2. The UV/H2O2 system was found to be quite efficient for the photodegradation of azithromycin, and this system can be applied to degrade other organic pollutants present in industrial wastewater. To this point, such a study has not been reported specifically for AZT photodegradation.
Keywords: 
Subject: Environmental and Earth Sciences  -   Environmental Science

1. Introduction

Researchers all over the world are trying to eliminate organic pollutants from wastewater using several techniques such as adsorption, photolysis, photocatalysis, electrochemical conversion, etc. These organic pollutants consist of dyes, pharmaceuticals, surfactants, etc. Organic dyes have been degraded in water by photocatalysis using different types of nanocomposites. For example, photocatalysts have been used to eliminate methylene [1,2], methyl orange and Eriochrome black T [3], reactive red 250 dye [4], methylene blue and methyl orange [5], rhodamine B and crystal violet [6], methyl orange and alizarin red [7], and congo red and methylene blue [8]. Similarly, pharmaceuticals present in wastewater have been eliminated by photocatalysis. Hussain et al. [9] used a photo-Fenton process using MnO2 and moving bed biofilm reactor treatment followed by an ozonation process and reported more than 90% removal rates for Ibuprofen and Ofloxacin. Likewise, photocatalysis has been used for the degradation and elimination of azithromycin (AZT) antibiotic that has been used successfully and widely in the treatment of COVID-19, as well as against several other infections. AZT belongs to a class of medications called macrolide antibiotics. Because of its wide use in the treatment of coronavirus conditions as well as in other infectious diseases, its concentration in wastewater has been quite significantly increased in recent years and thus poses health hazards for humans and other living organisms. One of the effective ways to remove AZT from the environment is photodegradation either through photolysis or photocatalytic degradation. Several investigators have used a variety of semiconductor nanomaterials to eliminate AZT and other related drugs. Over the years, several types of nanomaterial-based catalysts have been synthesized and used under variable conditions of pH, and AZT concentration with or without oxidants. These nanomaterials contain titanium, iron, zinc, molybdenum, cobalt, and other metals mostly in oxide form alone or with other metals. Other research studies have been conducted using UV or visible irradiation only (photolysis) and have employed H2O2 as an oxidant. Some of these studies are reported here. Sharma et al [10] used Cu2O–TiO2 nanotubes for the photodegradation of AZT and achieved complete degradation within 90 min in a solution having 100 μg/mL AZT concentration and 1.5 g/L of nanotubes at pH 7 under visible light irradiation. Ling et al [11] synthesized g-C3N4/Fe-MCM-48 nanosize composite with a 3-D structure and used it for photocatalytic ozonation of AZT under simulated solar light. The degradation achieved was almost 100% within 11 min. Shajahan and AbuHaija [12] used CuFe2O4, binary CdS/CuFe2O4, and ternary g-C3N4/CdS/CuFe2O4 nanocomposite, for photodegradation of AZT using visible light source. The ternary nanocomposite exhibits the highest degradation efficiency of 85% within 90 min. Mehrdoost et al [13] utilized PAC/Fe/Ag/Zn nanocomposites for photodegradation by UV irradiation and achieved 99.5% degradation of AZT (10 mg/L) at pH  9 within 120 min irradiation time using 0.04 g/l of PAC/Fe/Ag/Zn. Mohammed et al [14] used ZnO/Co3O4 nanocomposites and reported 71.7% degradation of AZT within 80 minutes under visible light irradiation. Shukla et al [15] reported a 40% degradation of AZT (10 mg/L) using ZnO nanoparticles under UV irradiation. Kumar et al [16] reported 98.4% AZT photodegradation in 90 min under visible light using an Ag@Bi4O5I2/SPION@calcium alginate catalyst. Ospino-Atehortúa et al [17] used persulfate and simulated sunshine to photodegrade AZT. After 120 min of irradiation, the photodegradation of AZT was about 70%. Furthermore, it was revealed that AZT removal was enhanced at a higher pH (basic). Tenzin et al [18] utilized SrTiO3 for the photodegradation of AZT under UV irradiation. The photodegradation at pH 2 was 55% within 150 min of irradiation, while at pH 12, it was 98% within 90 min. Li et al [19] used MoS2-GO composites for photocatalytic degradation of AZT (100 mg/L) under visible light and reported 87% degradation within 3 hours. Rueda-Márquez et al [20] used natural solar irradiation with immobilized TiO2 and achieved degradation of AZT of more than 80% in urban wastewater effluents. Sayadi et al. [21] used 1 g/L of GO@Fe3O4/ZnO/SnO2 nanocomposites and achieved 90% of AZT (30 mg/L) within 120 min of UV-C irradiation at pH 3. Čizmic et al [22] investigated the use of nanostructured TiO2 film (comprised of pure anatase) and achieved degradation using UV-C irradiation at pH 10. Naraginti et al. [23] used nanorod ternary nanocomposite ZrO2/Ag@TiO2 for effective AZT degradation and achieved 90% of AZT (20 mg/L) within 8h exposure to visible light radiation. Biancullo et al [24] investigated the efficiency of TiO2-based photocatalytic treatment using UVA-LEDs for wastewater samples spiked with AZT and reported complete degradation of AZT within 1 hour using 1 g/L of TiO2. Luo et al [25] used La-TiO2/AC nanocomposites for photocatalytic degradation of AZT under UV irradiation in wastewater and reported that at pH 4 and AZT concentration of 10 mg/L, irradiation for 90 min degraded 95.6% of AZT.
Some investigators have reported the use of photolysis using UV or visible irradiation with or without oxidants. Chen [26] performed photolysis of AZT under visible and UV light irradiation and concluded that UV irradiation provided higher degradation (82.6%) than visible light (53.1%) using an AZT concentration of 10 mg/L at pH 4. Cano et al [27] used simulated sunlight radiation and H2O2 to photodegrade AZT. The AZT degradation was almost complete after 120 min of photolysis. Voigt et al [28] achieved photoinduced degradation of AZT using UVC/VUV-irradiation. Tong et al [29] reported photolysis of AZT under simulated solar radiation.
The literature cited above has shown a variety of nanomaterials used for AZT elimination from water and the effect of H2O2 on the photodegradation of AZT. We have utilized in this study UV irradiation with H2O2 to perform AZT degradation without using any solid expensive catalytic nanomaterials. When H2O2 is exposed to light irradiation, photolysis of hydrogen peroxide occurs and produces hydroxyl radicals (•OH), which are highly reactive. These highly reactive hydroxyl radicals created during this process, oxidize and break down a variety of organic contaminants. The idea of using H2O2 as an oxidant and not using any expensive catalysts was also to economize the research study and to achieve the research goals with minimum chemicals, materials, effort, and time. These features of this study are very important during the scaling up of this photodegradation process.
The parameters studied were the pH of the irradiated solution and variable concentrations of H2O2 and AZT in the solution. First, the pH of the solution was varied to determine the effect of pH on the degradation efficiency of AZT. Then keeping the optimized pH constant (at which maximum AZT degradation was achieved), the concentration of H2O2 was varied followed by varying the concentration of AZT. Figure 1 shows the photos of AZT in solid powder form and its molecular structure.

2. Materials and Methods

2.1. Materials

The chemicals used in this study were 98.0% purity azithromycin dehydrate (molecular formula C38H72N2O12●2H2O and molecular weight 785.0) and 30% hydrogen peroxide (H2O2) solution, purchased from Sigma Aldrich. NaOH and HCl were obtained from Alfa-Aesar and were used to maintain the pH of the irradiated solution. All chemicals used were of analytical grade. All the AZT-containing solutions were prepared in drinking water.

2.2. Methods

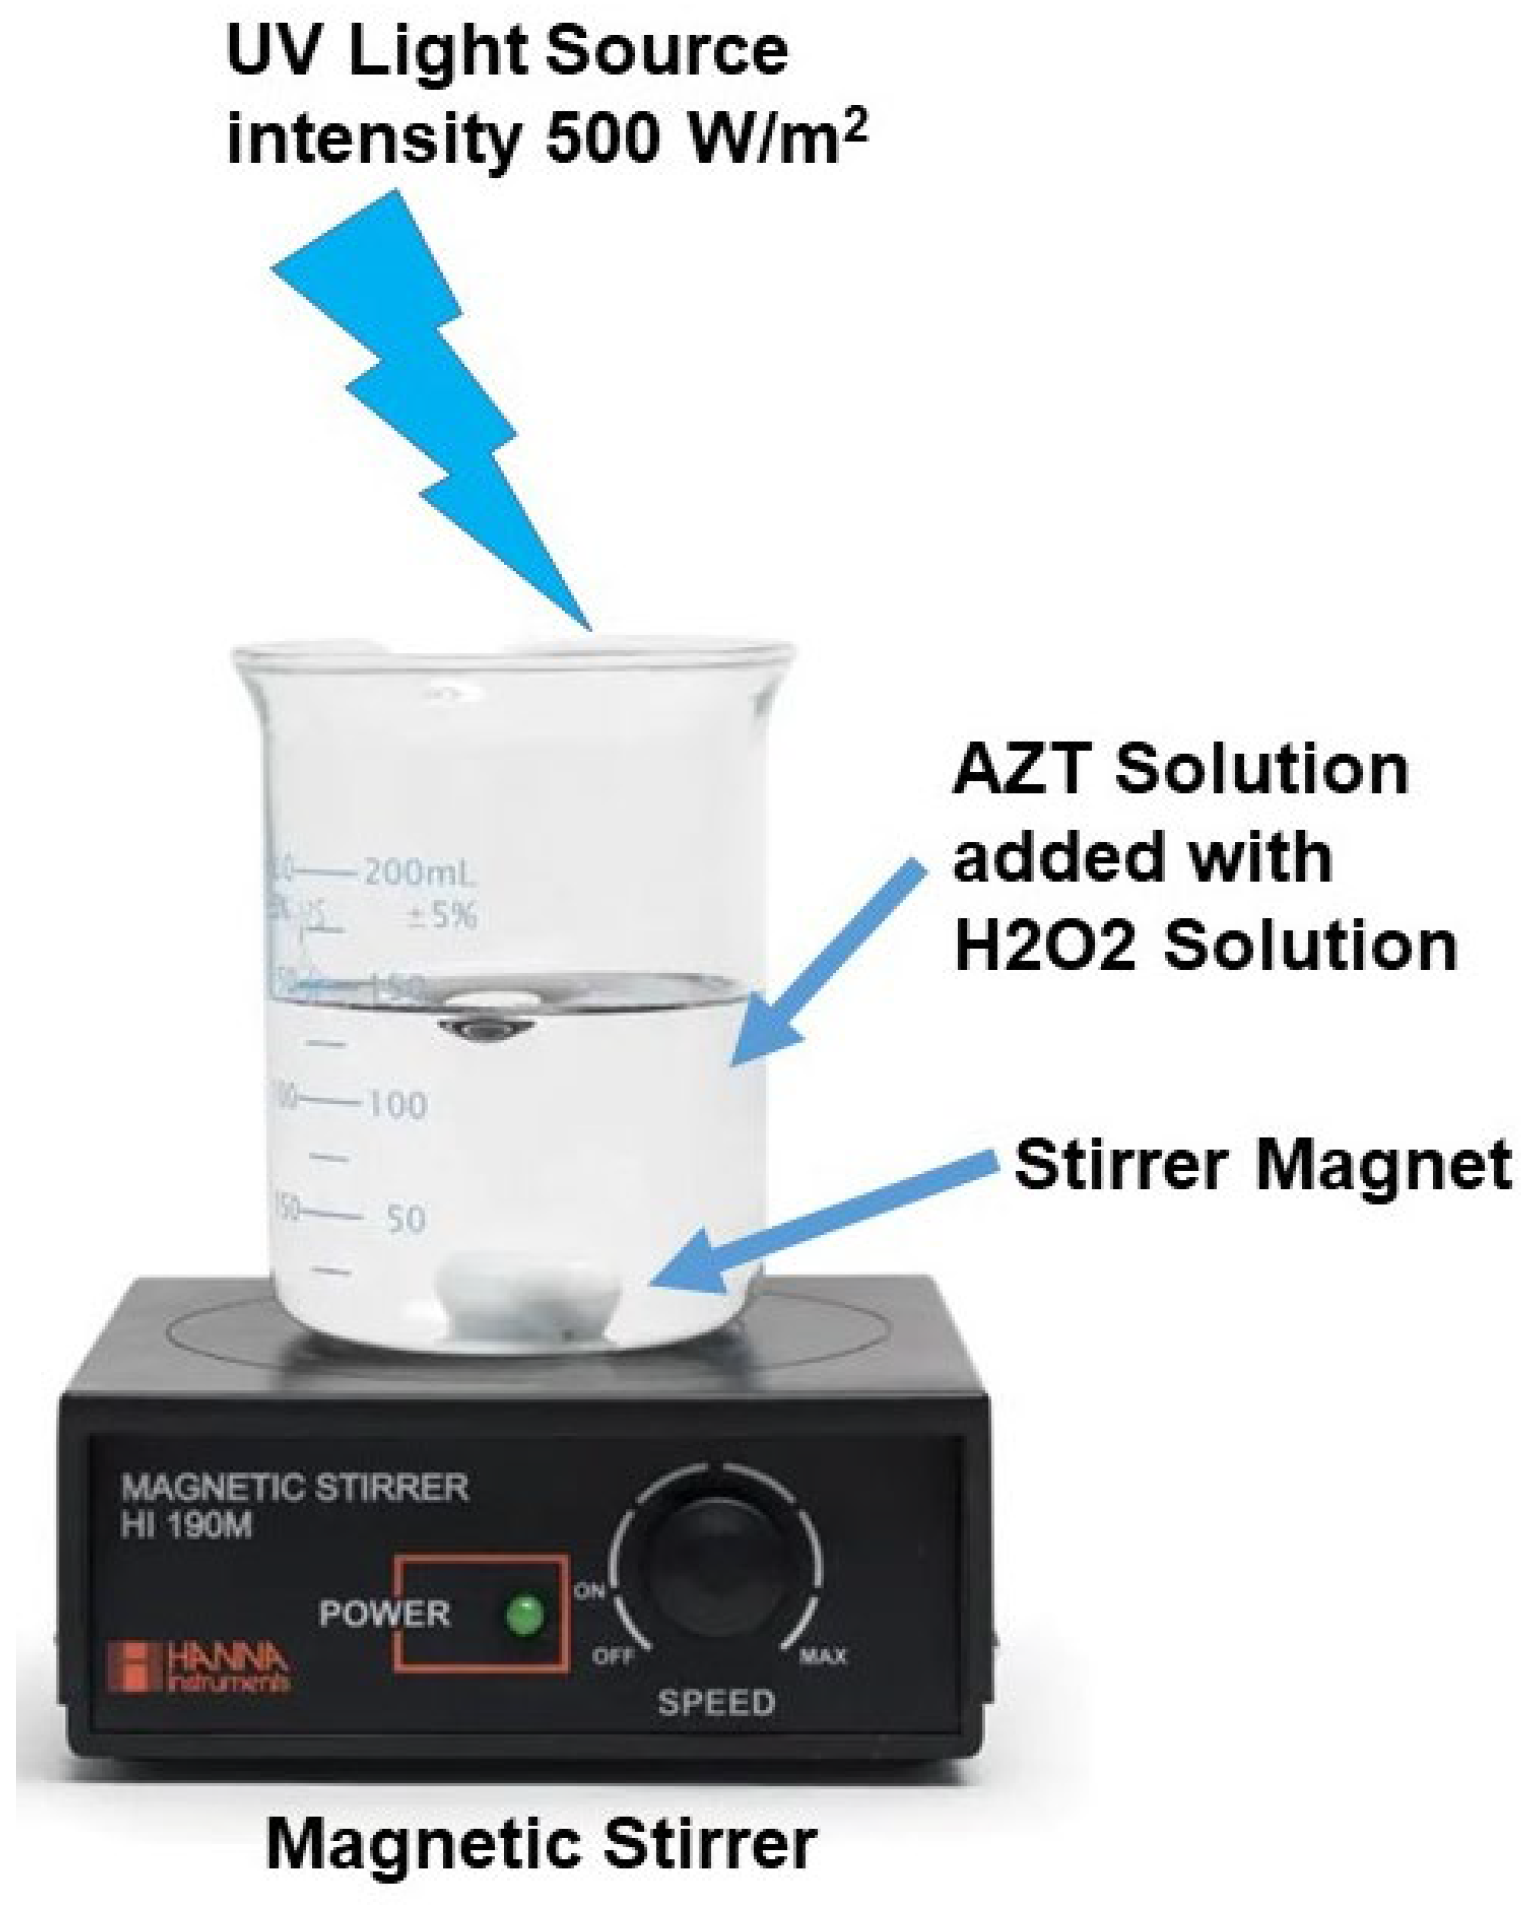
The AZT solutions of 1.0, 3.0, and 5.0 ppm concentration were prepared in drinking water. Fifty ml of AZT solution from each concentration was taken in separate glass beakers and a known amount of 30.0% H2O2 solution was added. The mixture was agitated for 20 minutes in the dark to check for AZT degradation with H2O2 in the dark. Then, the mixture was irradiated with UV light under continuous stirring. Figure 2 shows an aqueous solution containing AZT and H2O2 on a magnetic stirrer cum hot plate, which was irradiated with UV light having 500 W/m2 intensity, 230 V input voltage, and 50/60 HZ. The external temperature of the sample was maintained at 40 °C during irradiation. After every 20 minutes, 1.0 ml of the solution was sampled from the beaker and analyzed for AZT concentration by the HPLC system. There was no need to separate the solid catalyst from the sampled solution using a centrifuge since no solid catalyst was used in the degradation process. The pH of the solution was adjusted using dilute solutions of NaOH and HCl. The separation of the components was accomplished on a reverse phase C18 column (5.0 μm, 250.0 mm × 4.6 mm) installed in an HPLC analytical system (Waters Corporation) coupled with a triple quadrupole mass spectrometer. The mobile phase was optimized to achieve fast separation of the components of the solution at a flow rate of 1.5 mL/min. An isocratic methanol/buffer mobile phase at the ratio of 90:10 v/v provided the separation of the components [30]. The components of the solution were eluted from the column and converted into mass spectra, which were matched with the MS library for identification. Using this method, all irradiated solutions were HPLC chromatographed and the amounts of unconverted AZT present in the solutions were determined. The concentration of AZT present in the irradiated solutions was the unconverted AZT amount that provided the percent degradation of AZT. The parameters studied were, the pH of the solution (3, 6, and 9), the concentration of H2O2 (1, 2, and 3 ml), and the concentration of AZT (1, 3, and 5 ppm). For determining the effect of pH, the AZT concentration was 1 ppm, 60 min irradiation time, UV irradiation intensity 500 W/m2, and the amounts of H2O2 added were 1, 2, and 3 ml. Once the pH of the solution was optimized, it was kept and the concentration of H2O2 was varied followed by varying the concentration of AZT.

3. Results and Discussion

3.1. Effect of Solution pH on the AZT Degradation Efficiency

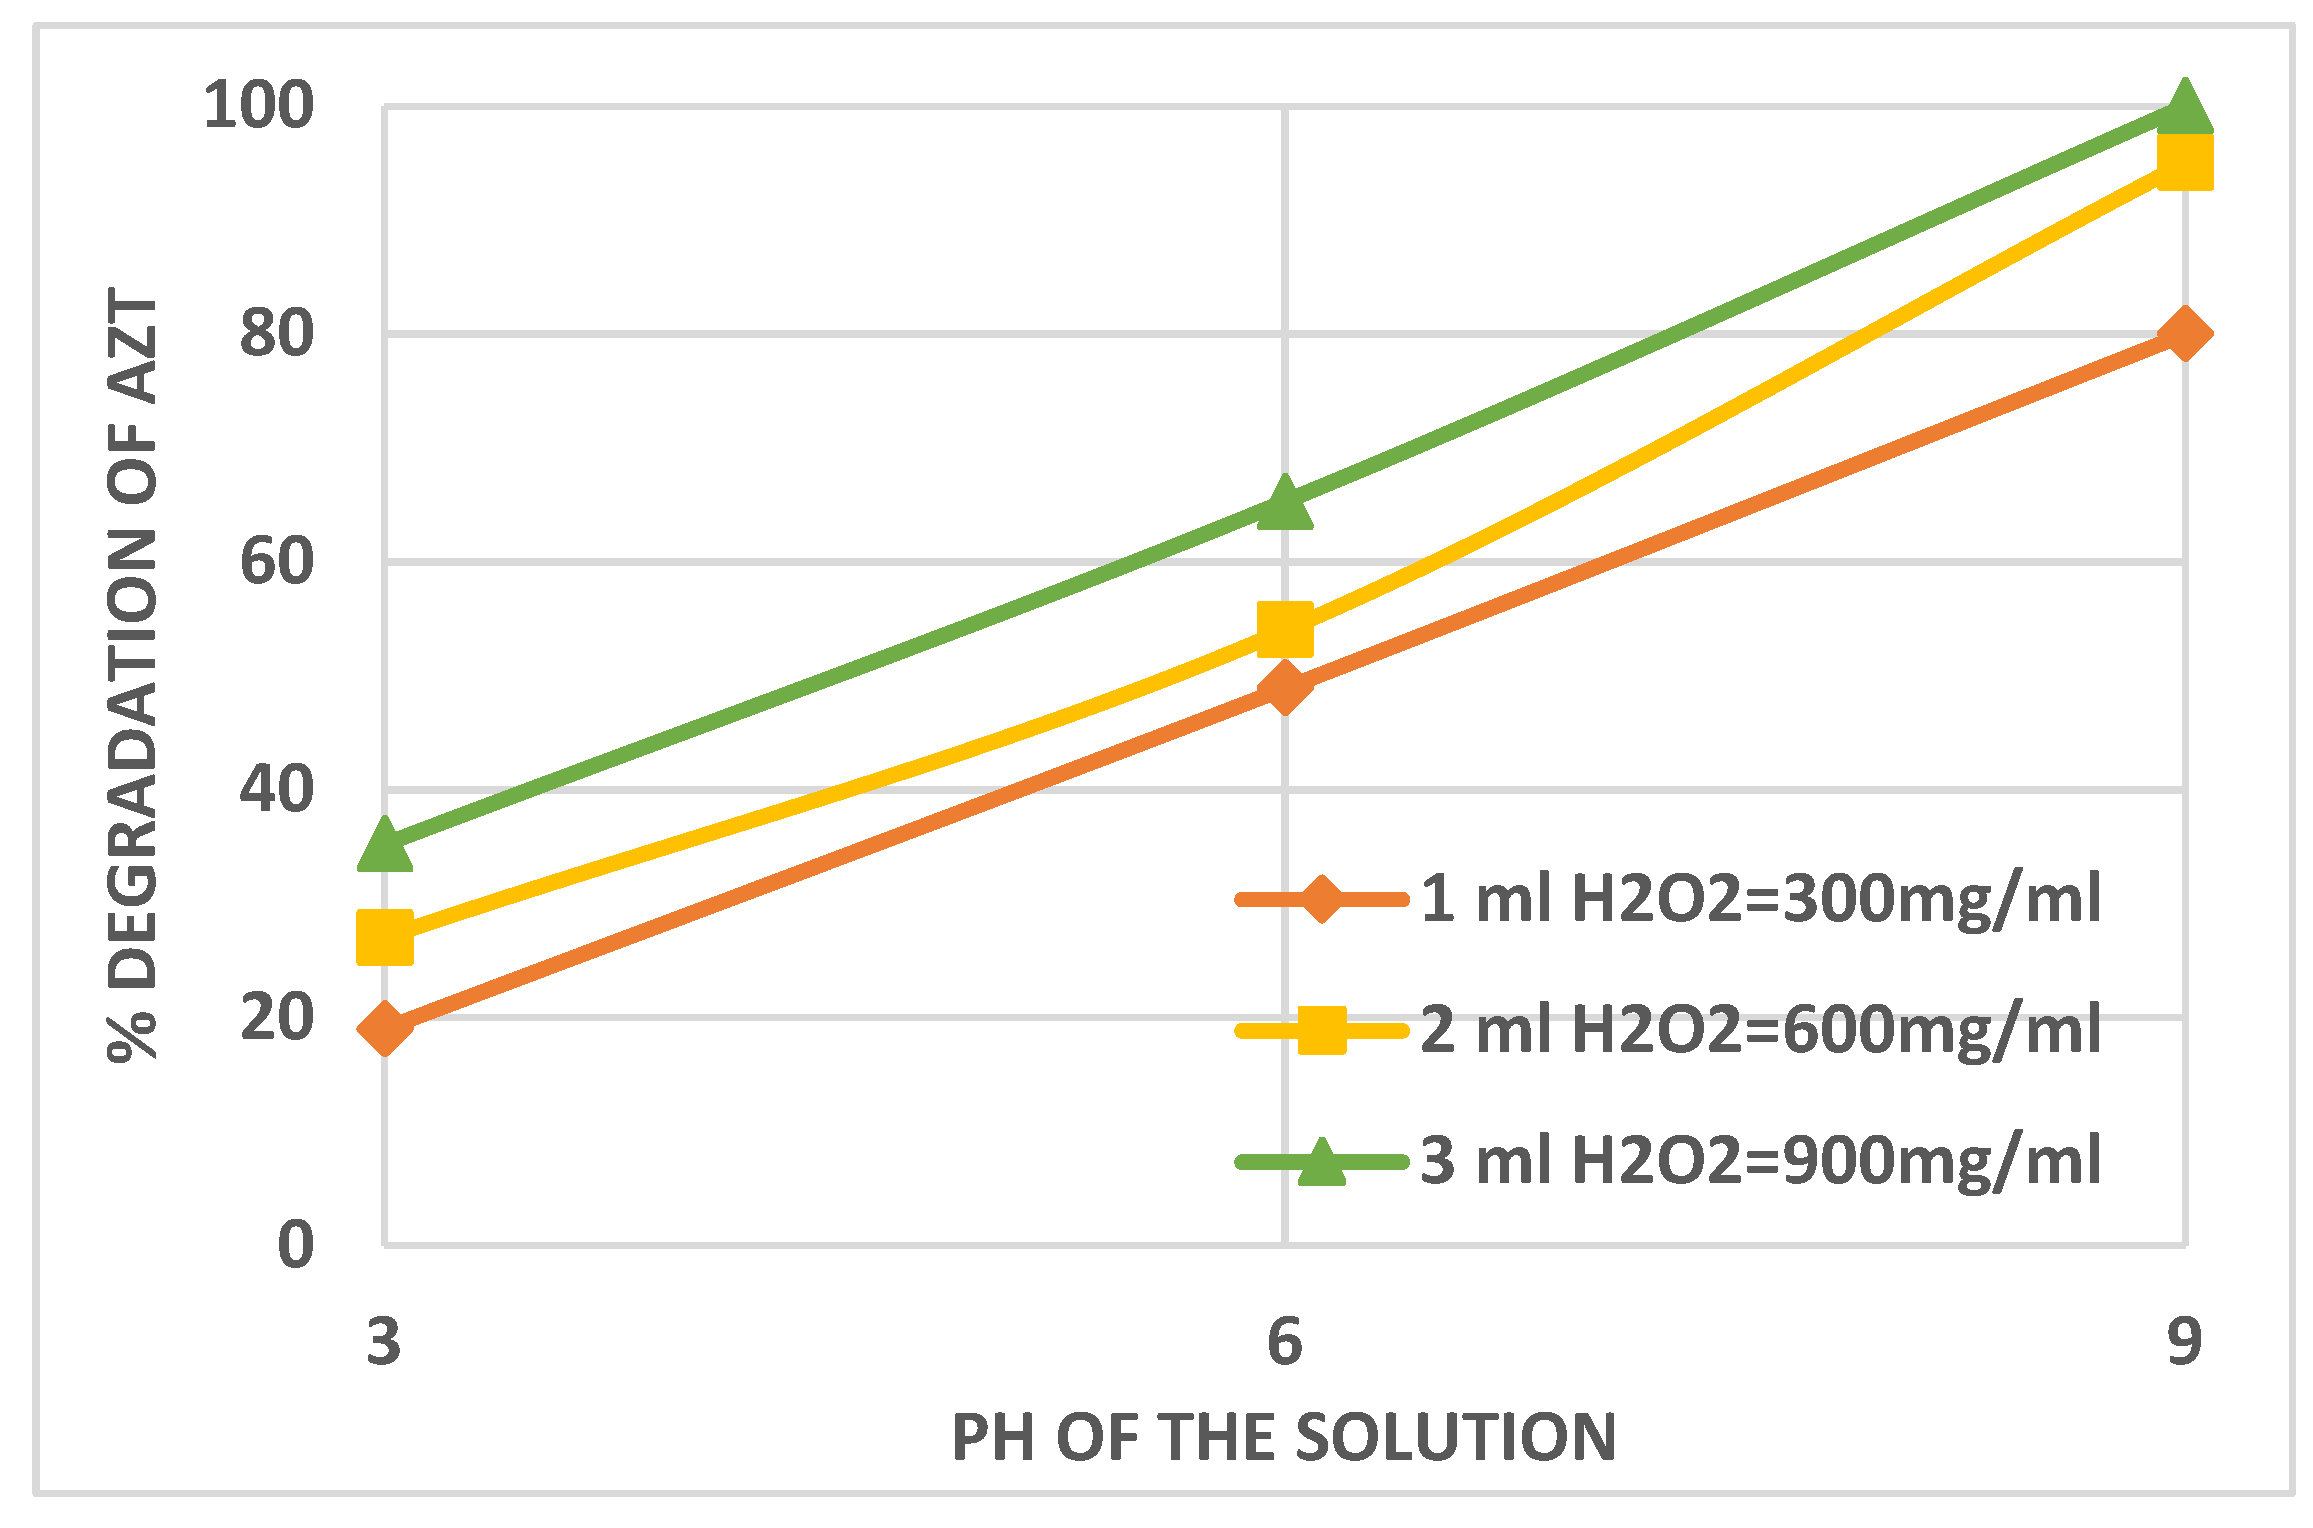
Figure 3 shows the result of varying the pH of the irradiated solution on the percent photodegradation of AZT. The degradation was low at a pH of 3 (acidic). The degradation was increased upon increasing the pH to 6 and it was further increased at pH of 9 (basic). The complete degradation of AZT was achieved at pH 9 using a 50 ml solution having an AZT concentration of 1.0 ppm, added with 3 ml of 30% H2O2 solution, which was irradiated with UV light for 60 minutes. At higher pH in the basic region, the degradation of AZT increased due to the higher concentration of OH radicals produced which attacked the AZT molecules more frequently and converted them into degraded products and finally into CO2 and H2O [27].

3.1. Effect of Amount/Concentration of H2O2 in the Reacting Solution

The effect of the amount of 30%H2O2 (1, 2, and 3 ml) in the photocatalytic degradation of AZT was recorded. It was witnessed that the AZT degradation was increased with increasing amounts of H2O2 solution and with increasing UV irradiation time. Figure 4 shows the percent degradation of AZT for variable amounts of H2O2 using three different initial AZT concentrations (1, 3, and 5 ppm). The reason was that a higher amount of H2O2 provided a higher amount of OH radicals generated due to the interaction with UV light irradiation. As a result, more and more AZT molecules were attacked by highly reactive OH radicals and experienced breakdown and thus the percent AZT photodegradation was higher.

3.2. Effect of Initial AZT Concentration on the AZT Degradation
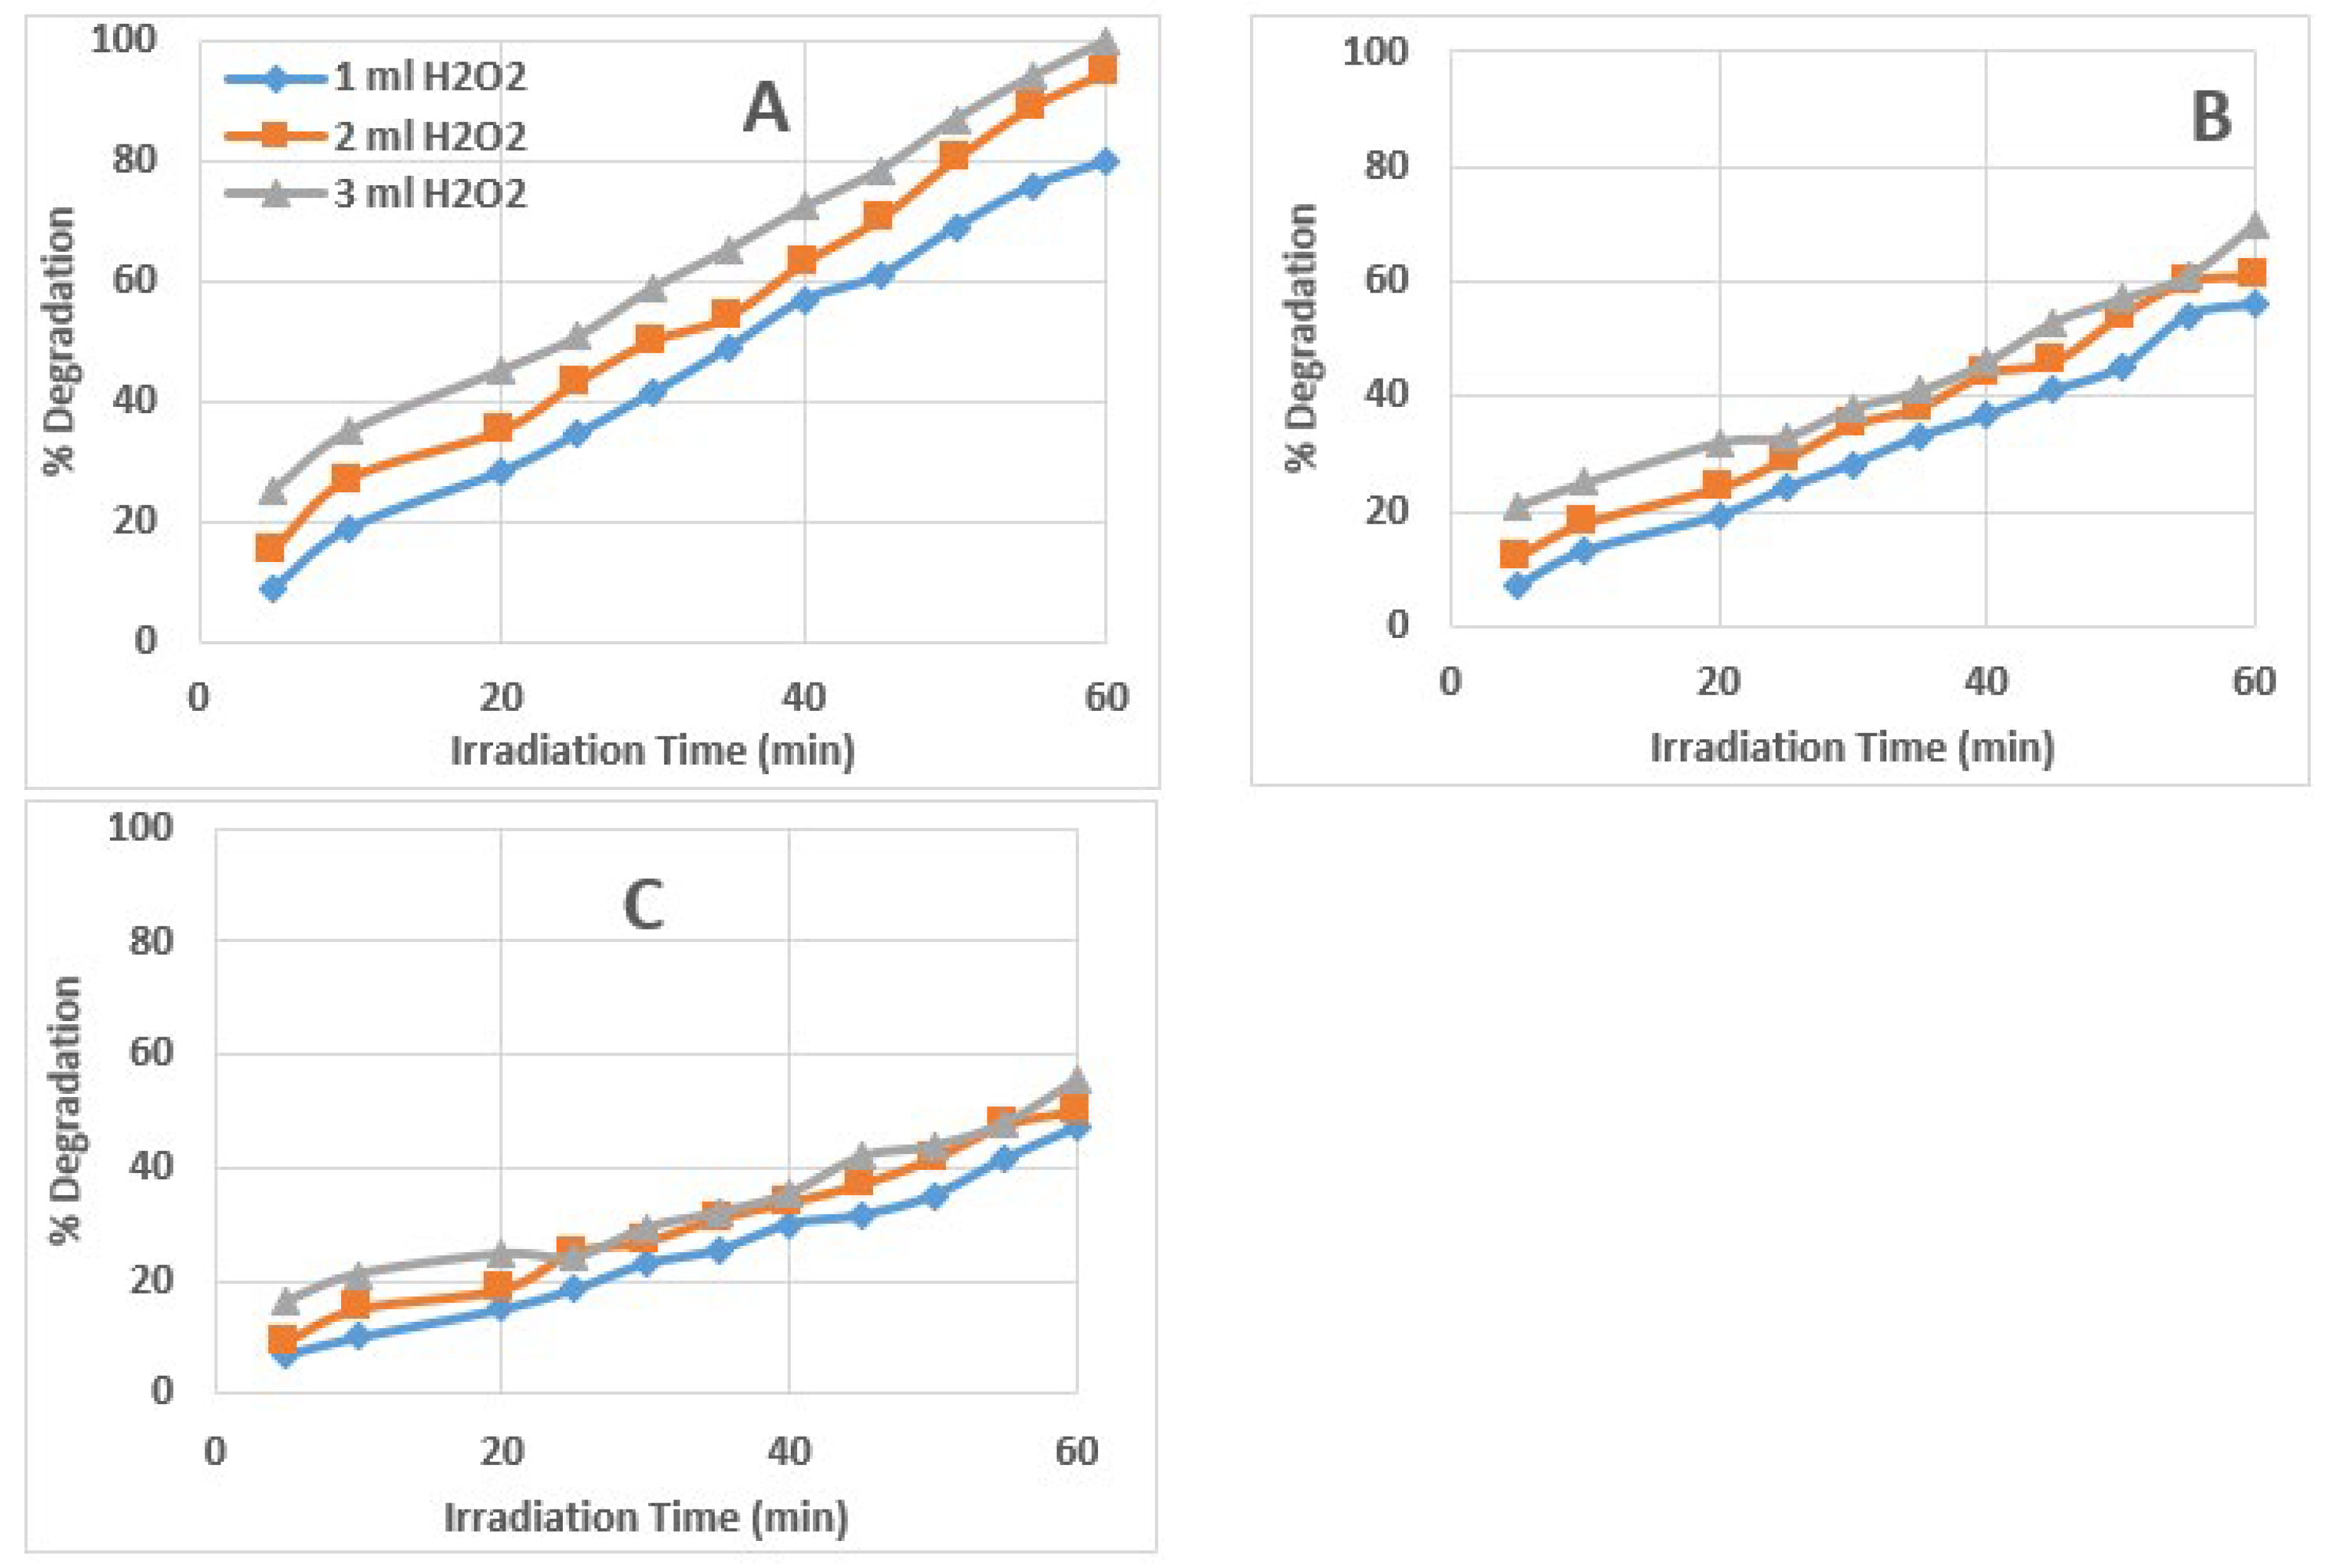
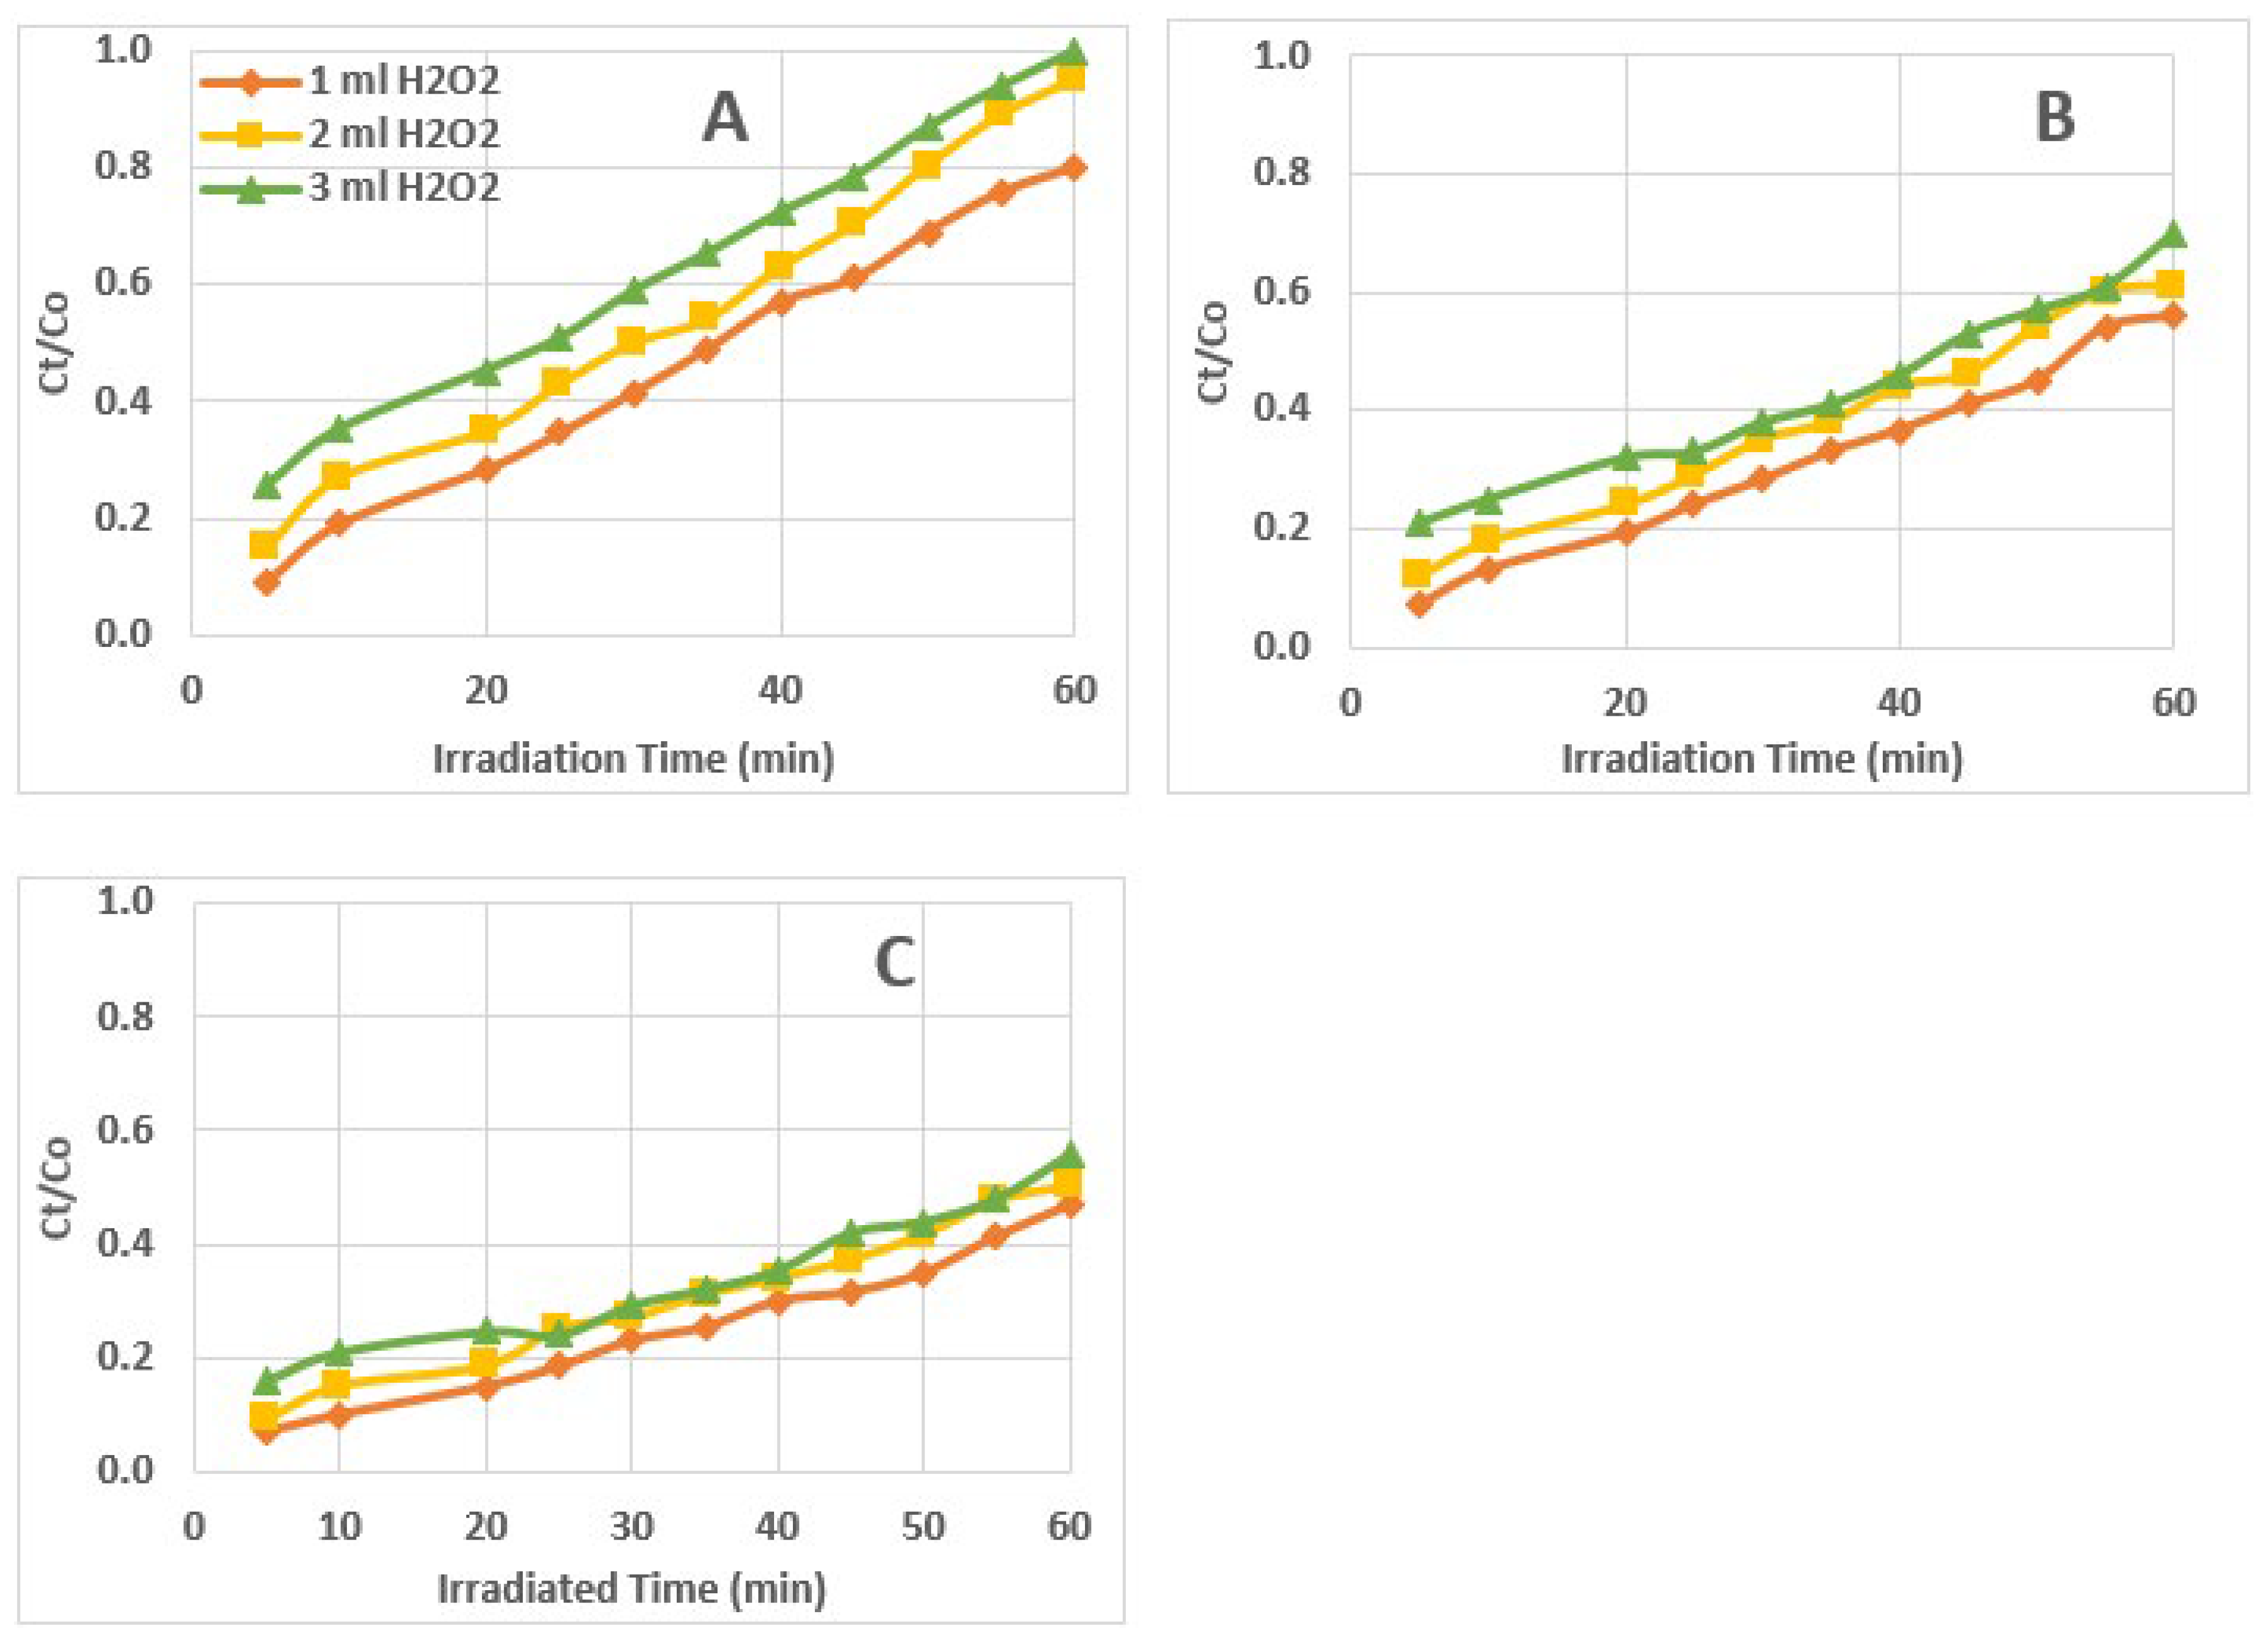
The initial AZT concentration was varied from 1 to 3 and 5 ppm to observe the effect on the percent degradation of AZT. As shown in Figure 4, at a low AZT concentration of 1ppm (Figure 4A), the highest and complete degradation of AZT was observed. Figure 4A showed that the 3 ml H2O2 solution added provided the highest and complete (100%) degradation of AZT in a solution having 1ppm AZT, in 60 min of UV irradiation followed by 2 ml H2O2 solution, which provided 95% AZT degradation. The 1 ml H2O2 yielded 80% AZT degradation. The AZT percent degradation was low at 3 ppm initial AZT concentration which was further reduced in the case of 5 ppm AZT concentration (Figure 4B and 4C). The full breakdown of AZT was promoted greatly with a greater concentration of 30%H2O2 solution. Reaction solutions containing 1 and 3 ppm of AZT showed a greater rate of AZT degradation than those containing 5 ppm of AZT. Using 3 mL of 30%H2O2 solution, the maximum and highest deterioration trend was noted for the 1 ppm AZT solution.
Figure 4. Percent degradation of AZT with respect to initial AZT concentration and variable amount of H2O2 in 50 ml of irradiated solution, A=1.0 ppm AZT solution, B=3.0 ppm AZT solution, C=5.0 ppm AZT solution. (Irradiated AZT solution volume 50 ml, pH 9, and UV irradiation intensity 500 W/m2).
Preprints 104689 g004

3.3. Kinetics of AZT Photodegradation

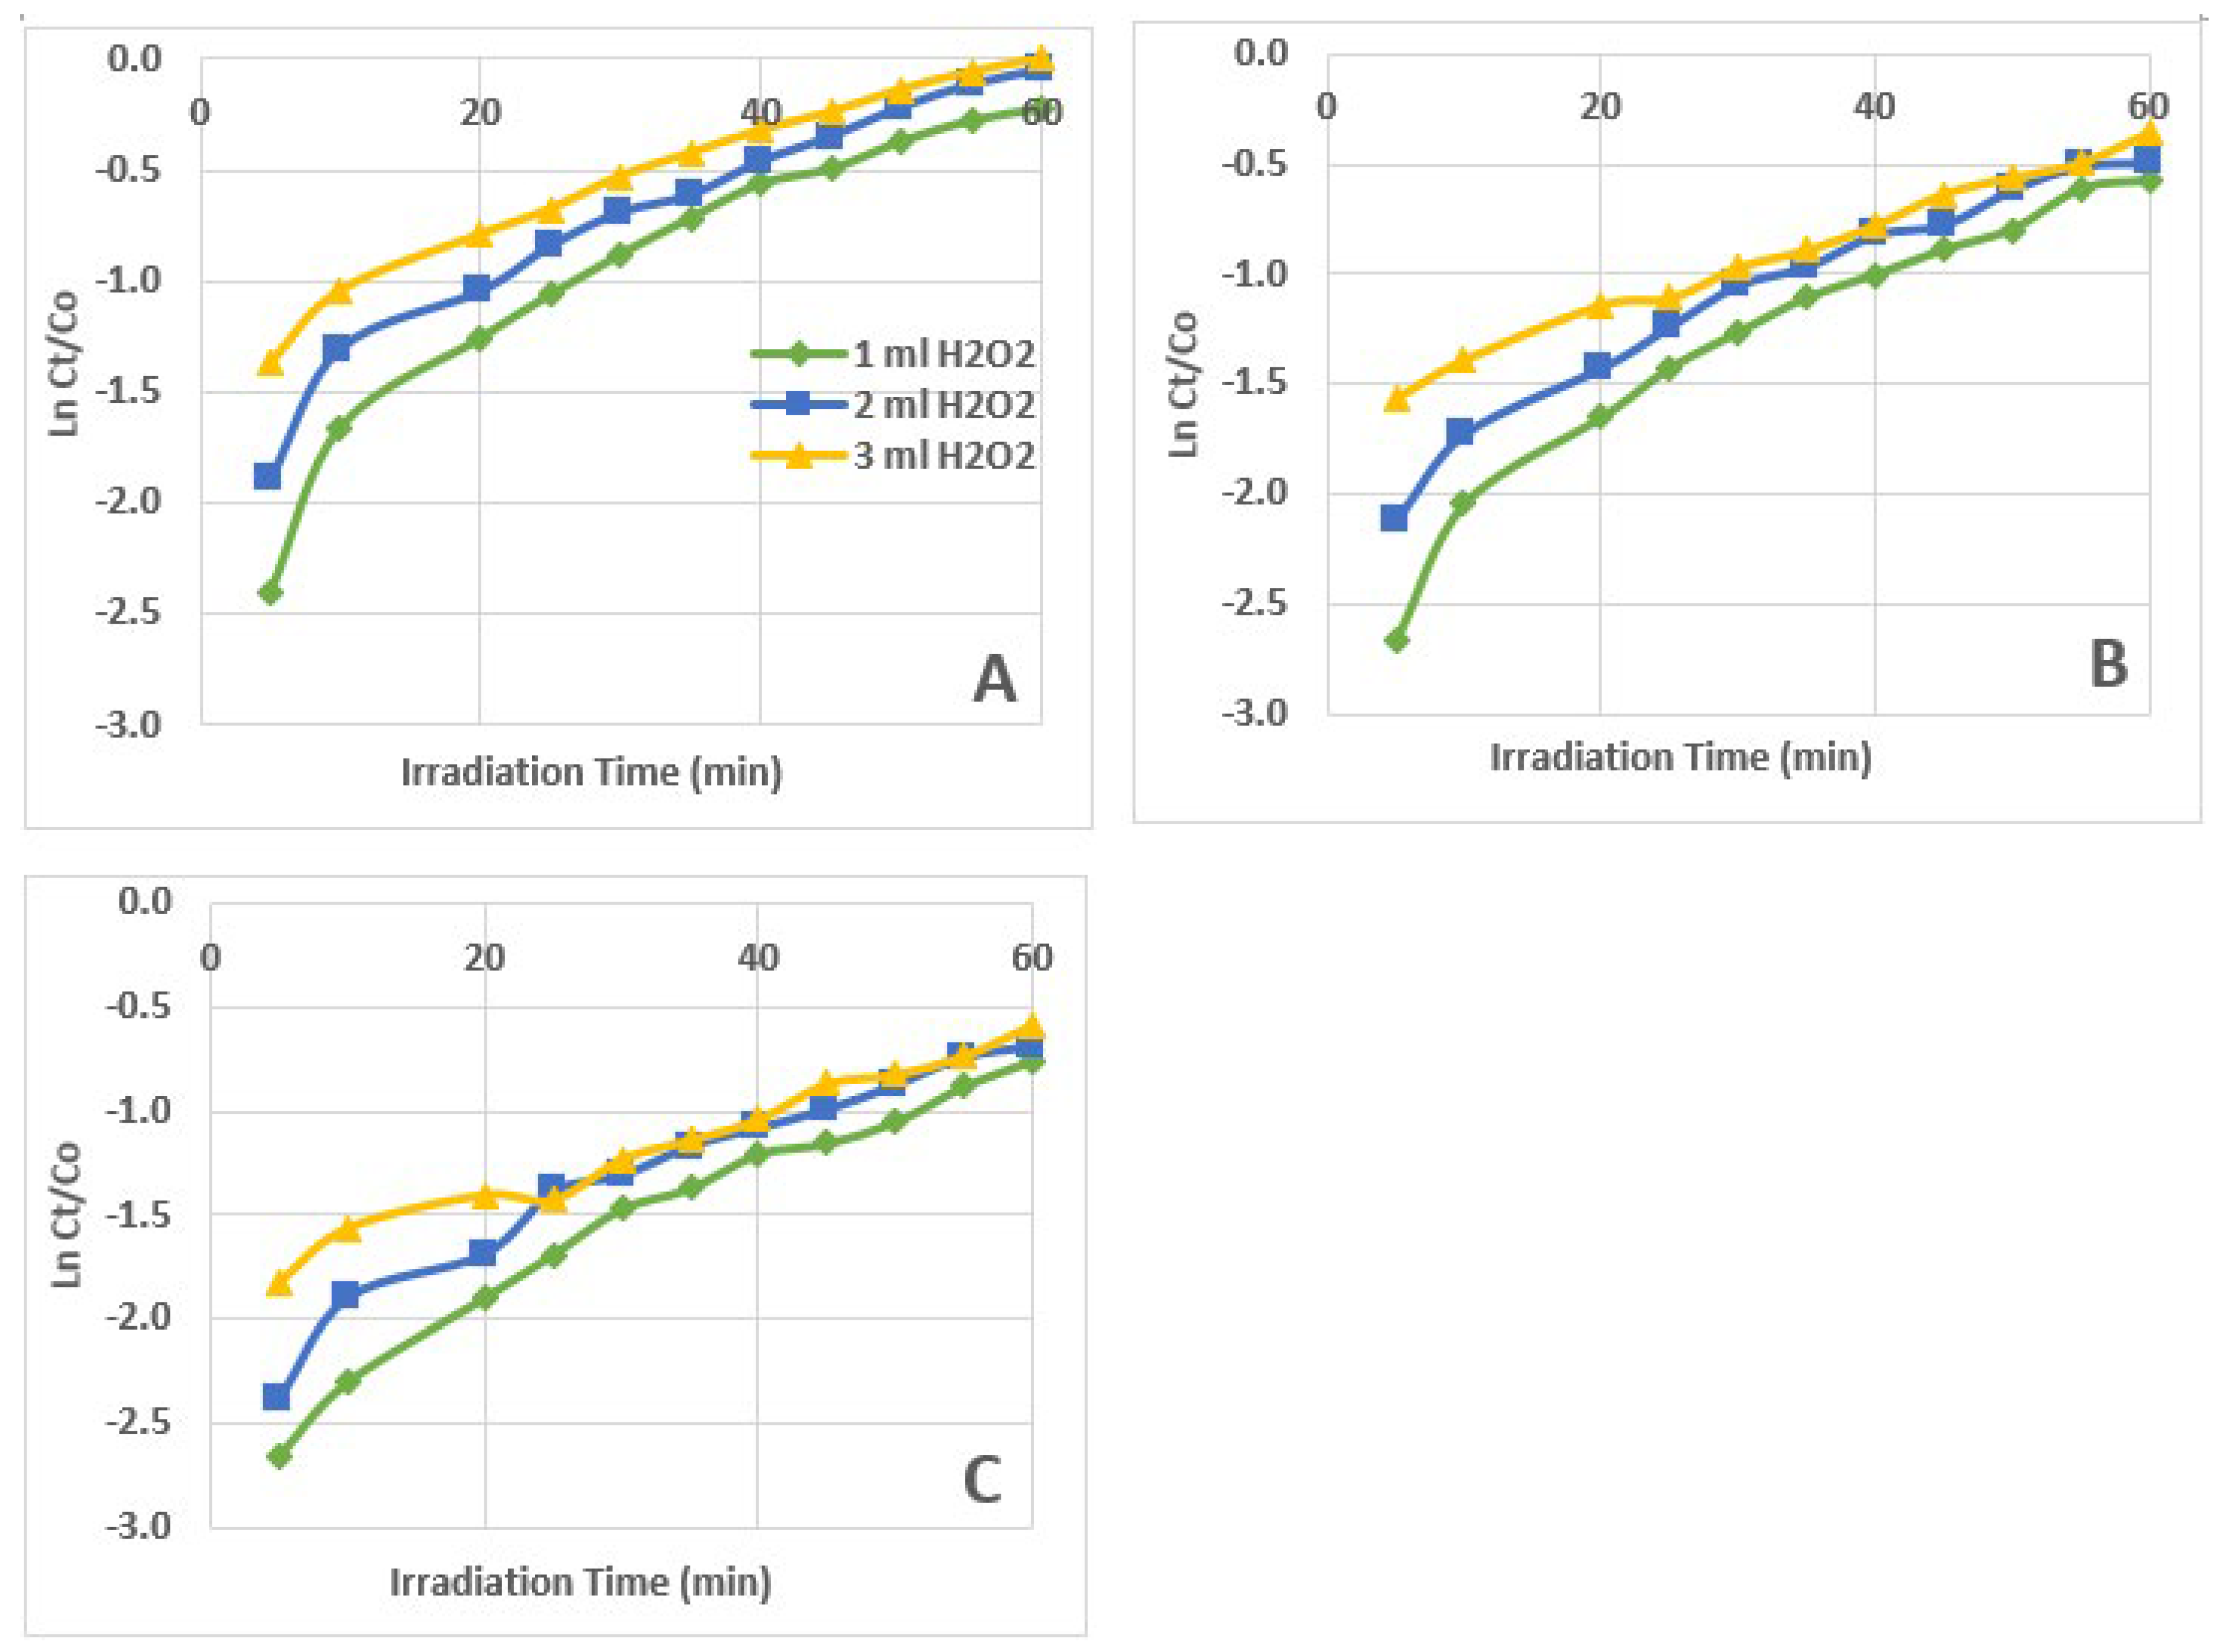
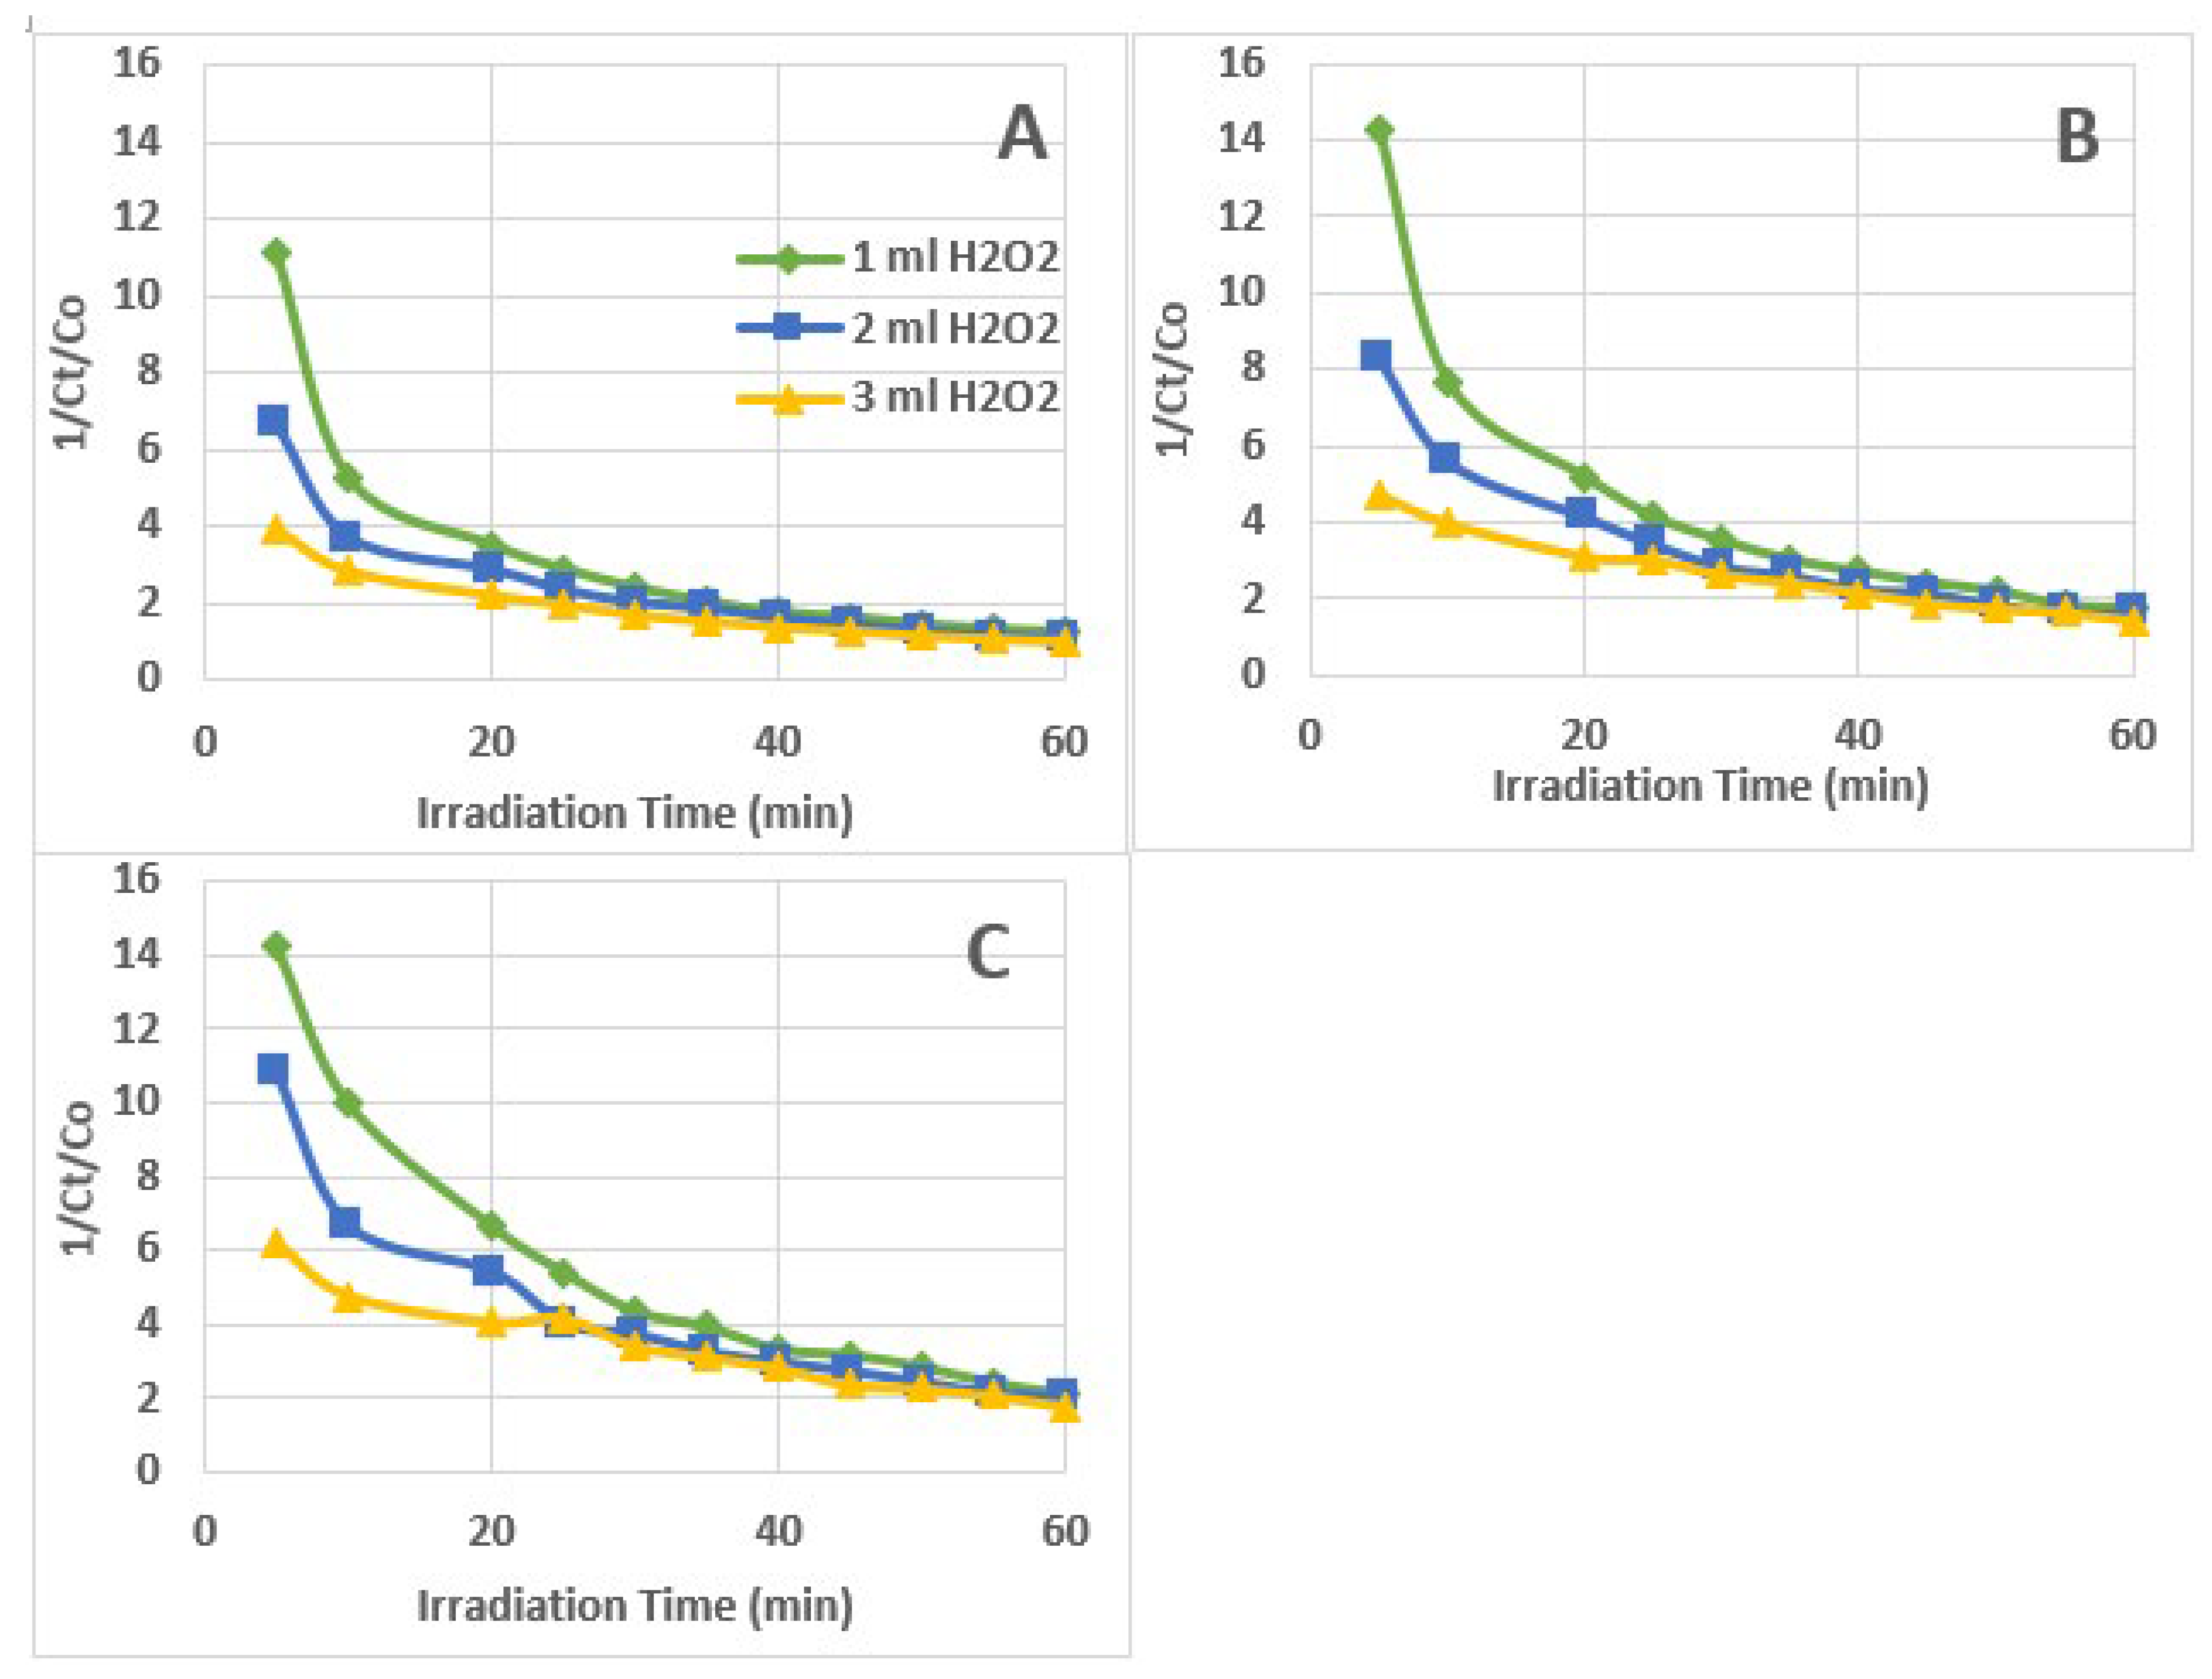
To decide on the kinetics of the AZT photodegradation reaction, three plots were developed which are as follows: (1). Ct /Co versus t (If the plot is linear, then it is a zero-order kinetic reaction), rate = k; (2). Ln Ct /Co versus t (If linear, then it is a first-order kinetic reaction), rate = k[Ct]; (3). 1/Ct /Co versus t (If linear, then it is a second-order kinetic reaction), rate = k[Ct]2.
Among the three plots (Figure 5, Figure 6, and Figure 7), the plot of Ct/Co vs. t (Figure 5) yielded the best straight-line equation in which the slope of the equation represented the rate constant (k). This endorsed that the kinetics of the AZT photodegradation reaction using the UV/H2O2 reaction system is zero order.
Table 1 displays the values of the correlation coefficient (R2) and the rate constant (k) obtained for the degradation of AZT under UV irradiation for the zero, first, and second orders of reaction. The correlation coefficient values indicate that the data fit well with the zero-order kinetics. However, the correlation coefficient values obtained for first-order kinetics are also close to zero-order ones. Here a point can be made that the reaction kinetics may be between the zero and first order.

3.4. Photodegradation Mechanism

The photodegradation of AZT with H2O2 under UV irradiation was supposed to proceed by the following reactions.
H2O2 + hν → OH
2H2O2 → 2H2O + O2
e- + H2O2 → OH + OH-
h+ + OH- → OH
e- + O2 → O2●-
OH + AZT → Intermediates + CO2 + H2O
O2●- + AZT → Intermediates + CO2 + H2O
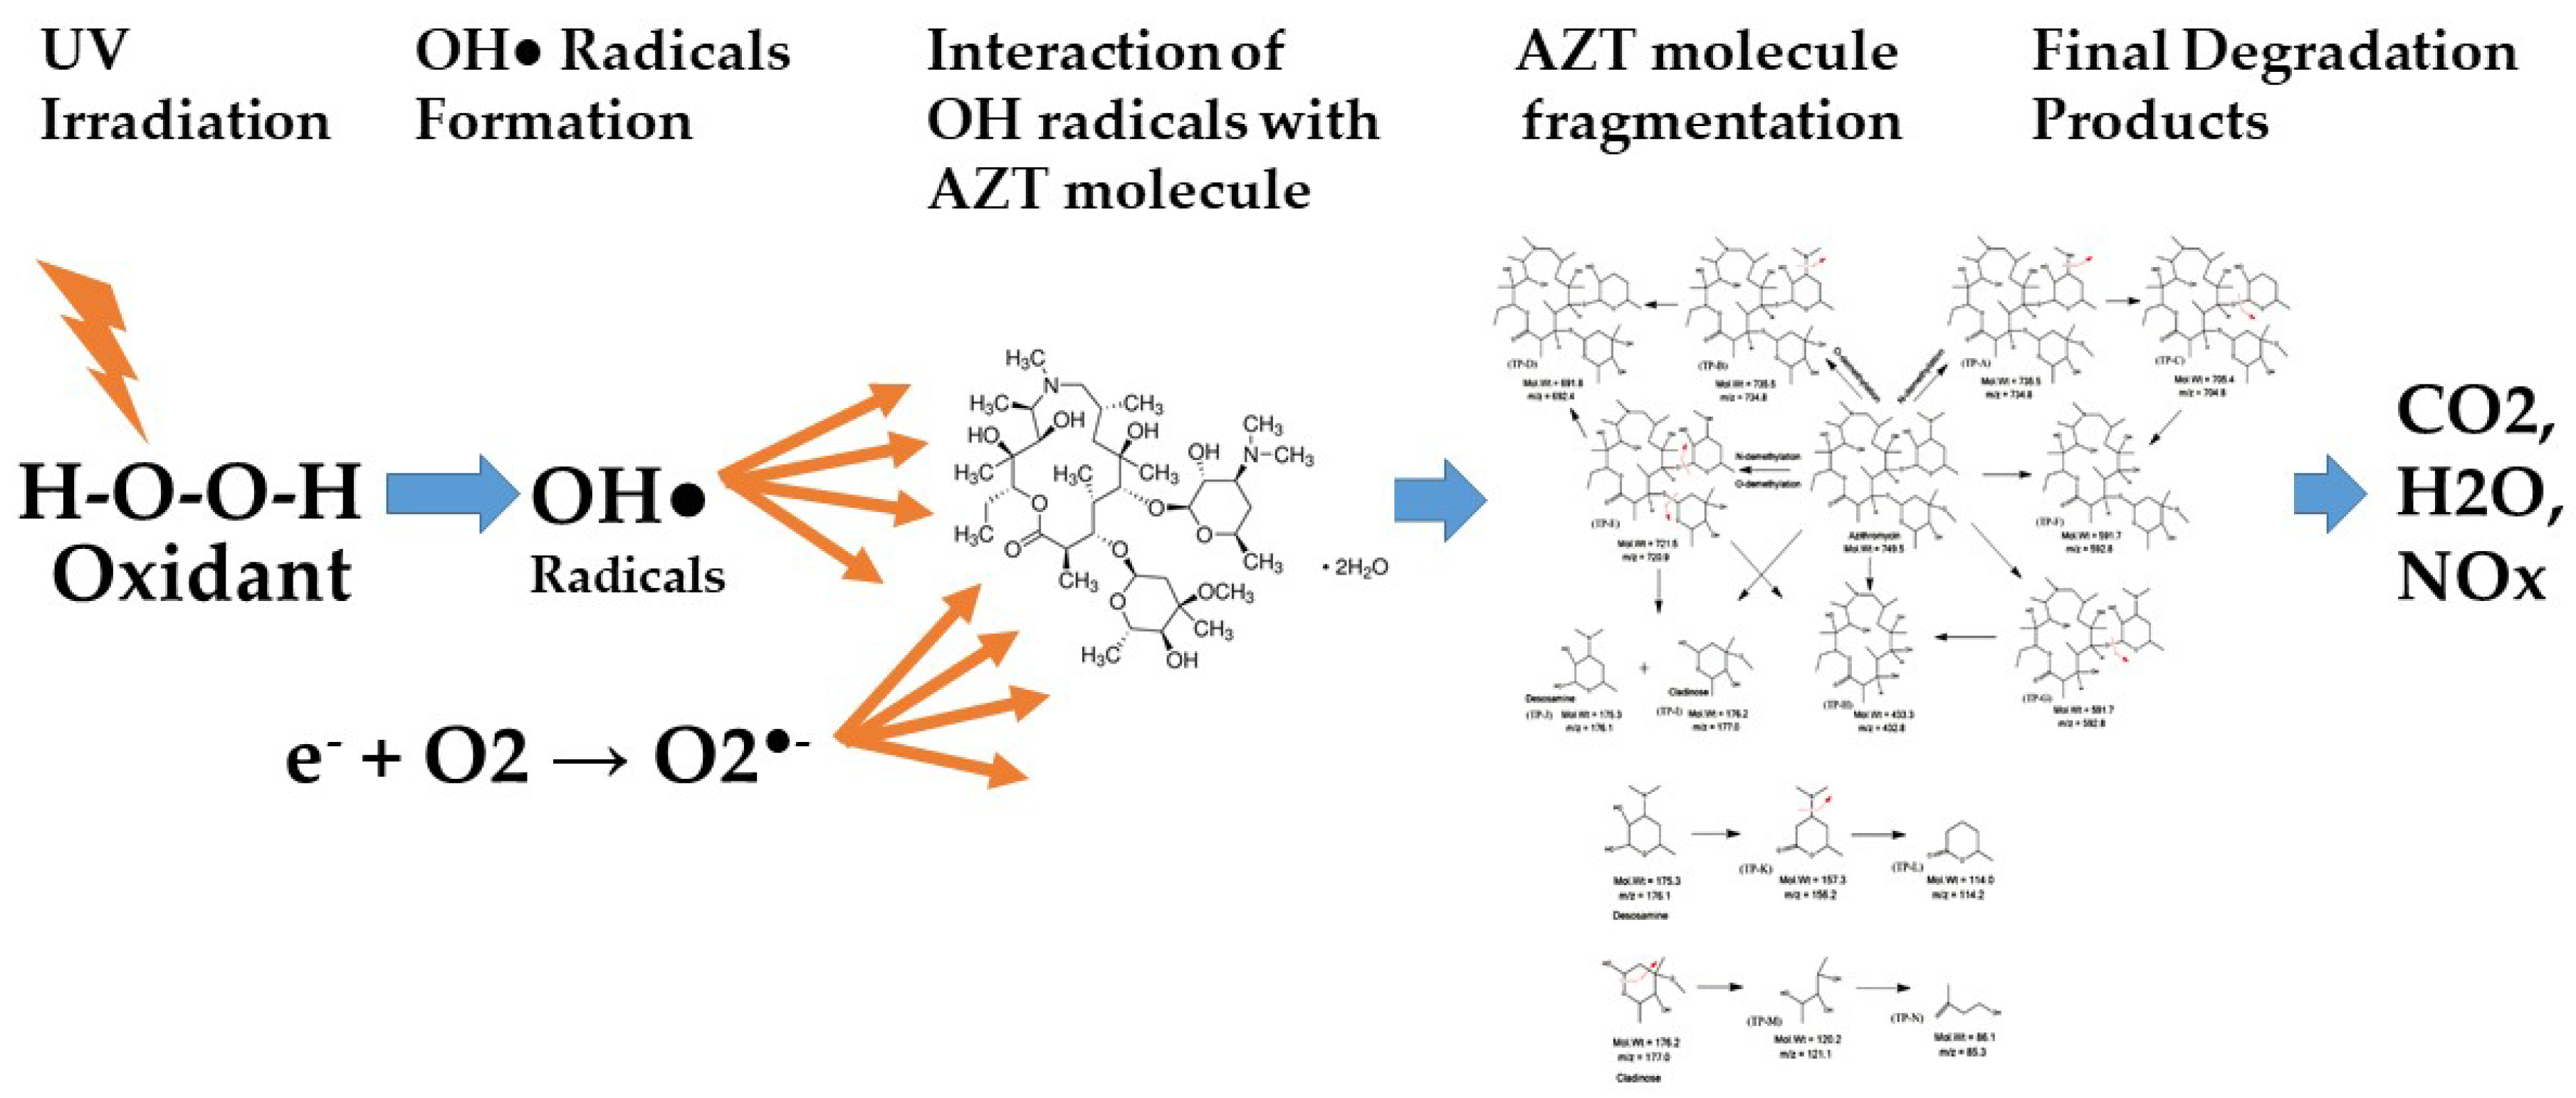
First, the H2O2 under UV irradiation produced OH radicals (OH) which are quite reactive species and attacked the AZT molecules. This resulted in the fragmentation of AZT molecules into different species that are further oxidized and converted into intermediates and then finally into CO2, H2O, and NOx. This reaction scheme advocates that the critical part is the generation of hydroxyl radicals from the photolysis of H2O2 that reacts with the AZT molecules. In addition, the O2●- generated also attacked the AZT molecules and degraded them into intermediates and finally into CO2, H2O, and NOx. The scheme of AZT photodegradation using H2O2 under UV irradiation is illustrated in Figure 8.

3.5. Comparison of this Work with the Literature

Table 2 presents a comparison of the photodegradation efficiency of this research work with the literature-reported results. The comparison is made with those results produced with and without catalysts. The results of this study were found quite excellent and showed 100% degradation in 1 hour when compared with those reported in the literature, both photocatalysis using nanomaterials as well as photolysis using light irradiation and/or H2O2.

Conclusion

This study shows efficient photodegradation of AZT using H2O2 as an oxidant in the presence of UV irradiation. The effects of variable concentrations of AZT and H2O2 present in the irradiated solution have been demonstrated successfully. The degradation of the AZT was not observed in the dark in the presence of H2O2. The AZT degradation was affected drastically by the pH of the irradiated solution. The AZT degradation was found low at acidic pH and showed an increasing trend as the pH changed to basic. The highest AZT degradation was observed at pH 9. The percent degradation of the AZT was decreased with a higher concentration of AZT in the reacting solution. The degradation of the AZT was found to increase with a higher amount (higher concentration) of H2O2. The experimental data obtained was well fitted to the plot of Ct/Co vs t and thus verified that the AZT photodegradation with H2O2 under UV irradiation followed the zero-order reaction kinetics. The correlation coefficients obtained for the pseudo-first-order kinetics are also quite matching with the zero-order kinetics. It may be argued that the kinetics of the reaction could be somewhere in between the zero-order and pseudo-first order. It is predicted that the OH radicals (OH●) and oxygen radicals (O2●) generated during the breakdown of H2O2 attack the MB molecules and produce MB radicals (MB●). After going through an oxidation process, these MB radicals are converted to intermediate fractions, and then finally produce CO2 and H2O. The results of this study were found quite better when compared with those reported in the literature, both using photocatalysis with nanomaterials as well as using photolysis using irradiation and H2O2. The UV/H2O2 system was found quite efficient for the photodegradation of AZT without the use of any solid catalyst and this system can be applied to degrade other pollutants and drugs present in the industrial wastewater. Such a study has not been reported so far for AZT photodegradation. Future studies are recommended to be conducted using continuously stirred reactors for AZT elimination from real wastewater containing other pollutants as well as using UV irradiation with different wavelengths and intensities. Other oxidants and activators can also be tested to see their effect on the degradation of AZT and other pollutants present in wastewater.

Author Contributions

The author contributed to the research and preparation of this manuscript (Nasser Ibrahim Zouli).

Funding

The research was funded by the Deputyship for Research and Innovation, Ministry of Education in Saudi Arabia for funding this research work through project number ISP23-166.

Institutional Review Board Statement

Not applicable.

Acknowledgments

The authors extend their appreciation to the Deputyship for Research& Innovation, Ministry of Education in Saudi Arabia for funding this research work through project number ISP23-166.

Competing or Conflicting Interest

The author has no relevant financial or non-financial interests to disclose.

Consent to Publish

Not Applicable

Ethical Approval

No human or animal participants were involved in this study.

References

  1. Javed, M.; Iqbal, S.; Qamar, M.A.; Shariq, M.; Ahmed, I.A.; BaQais, A.; Alzahrani, H.; Ali, S.K.; Masmali, N.A.; Althagafi, T.M.; Khan, M.S.; Fabrication of Effective Co-SnO2/SGCN Photocatalysts for the Removal of Organic Pollutants and Pathogen Inactivation. Crystals 2023, 13(2), 163; [CrossRef]
  2. Thilagavathi, T.; Venugopal, D.; Thangaraju, D.; Marnadu, R.; Palanivel, B.; Imran, M.; Shkir, M.; Ubaidullah, M.; AlFaify, S.; A facile co-precipitation synthesis of novel WO3/NiWO4 nanocomposite with improved photocatalytic activity, Materials Science in Semiconductor Processing, 2021, 133, 105970. [CrossRef]
  3. Qamar, Muhammad Azam; Sammia Shahid, Mohsin Javed, Mohammad Shariq, Mohammed M. Fadhali, Osama Madkhali, Syed Kashif Ali, Imam Saheb Syed, Majed Yusef Awaji, Mohd. Shakir Khan, et al. "Accelerated Decoloration of Organic Dyes from Wastewater Using Ternary Metal/g-C3N4/ZnO Nanocomposites: An Investigation of Impact of g-C3N4 Concentration and Ni and Mn Doping. Catalysts 2022, 12(11) 1388. [CrossRef]
  4. Helmy, Elsayed T.; Usama A. Soliman, A. M. Elbasiony, Ba-Son Nguyen. CuCe-Ferrite/TiO2 Nanocomposite as an Efficient Magnetically Separable Photocatalyst for Dye Pollutants Decolorization, Topics in Catalysis 2023, 66, 53–63. [CrossRef]
  5. Ghaffar, Sadia; Azhar Abbas, Muhammad Naeem-Ul-Hassan, Nasir Assad, Muhammad Sher, Sami Ullah, Hassan A Alhazmi, Asim Najmi, Khalid Zoghebi, Mohammed Al Bratty, Ali Hanbashi, Hafiz A Makeen, Hatem M A Amin. Improved Photocatalytic and Antioxidant Activity of Olive Fruit Extract-Mediated ZnO Nanoparticles, Antioxidants (Basel). 2023 Jun 1;12(6):1201. [CrossRef]
  6. Fallatah, A.M.; Alahmari, S.D.; Farid, H.M.T. Facile Synthesis of the MOF Derived ZnMn2O4 Nanorods for Dyes Degradation in Water. J Mater Sci: Mater Electron 2023, 34, 1630. [CrossRef]
  7. Dilawar, Sundas; Karma Albalawi, Afaq Ullah Khan, Kamran Tahir, Magdi E.A. Zaki, Ebraheem Abdu Musad Saleh, Zainab M. Almarhoon, Talal M. Althagafi, Adel A. El-Zahhar, E. El-Bialy. Rapid photodegradation of toxic organic compounds and photoinhibition of bacteria in the presence of novel hydrothermally synthesized Ag/Mn–ZnO nanomaterial, Environmental Research, 231, Part 1, 2023, 116093. [CrossRef]
  8. Bessy T.C.; Sarojini V.; Chadlia El Manna, Marwah Bakri, Sasi Florence S., Johnson J., Bindhu M. R. Optical, Structural, Morphological, Antibacterial, and Photodegradation Characteristics of BaxMg0.8−xFe2O4 (x = 0.2, 0.4, and 0.6) Nanocrystalline Powders Synthesized by Combustion Method. physica status solidi (a) –applications and materials science (pssa), 2022. [CrossRef]
  9. Husain, A.; Khan, H.A.A.; Nadeem, A.K.; Ahmed, S.; Mehtab, M.S.; Vambol, S.; Vambol, V.; Changani, F.; Islam, S.; Pharmaceuticals of emerging concern in hospital wastewater: removal of Ibuprofen and Ofloxacin drugs using M BBR method. International Journal of Environmental Analytical Chemistry, 2023, 103(1), 140-154. [CrossRef]
  10. Ling Y, Hai L, Biqing L, Biaojun Z, Yixiao W, Heping H, Deyou Y, Shaobin H (2023) Efficient photocatalytic ozonation of azithromycin by three-dimensional g-C3N4 nanosheet loaded magnetic Fe-MCM-48 under simulated solar light, Appl Catal B: Environmental, 324, 122208. [CrossRef]
  11. Sharma, M; Deepanshi R, Vinod K, Indu J, Tejraj MA, Gunda M, Ravi K, Kashyap KD (2023) Photocatalytic degradation of four emerging antibiotic contaminants and toxicity assessment in wastewater: A comprehensive study, Environmental Research, 231, Part 2, 116132. [CrossRef]
  12. Shajahan, S.; Abu Haija, M.; Effective removal of azithromycin by novel g-C3N4/CdS/CuFe2O4 nanocomposite under visible light irradiation, Chemosphere, 2023, 337, 139372. [CrossRef]
  13. Mehrdoost A, Reza J.Y, Mohammad K.M, Azadeh H, Ali A.B.; Adsorption removal and photocatalytic degradation of azithromycin from aqueous solution using PAC/Fe/Ag/Zn nanocomposite. Environ Sci Pollut Res 2022, 29, 33514–33527. [CrossRef]
  14. Mohammed, H,T,; Alasedi, K.K.; Ruyid, R.; ZnO/Co3O4 Nanocomposites: Novel Preparation, Characterization, and Their Performance toward Removal of Antibiotics from Wastewater. J. Nanostruct 2022, 12(3), 503-509. [CrossRef]
  15. Shukla, Shraddha, Himanshu Pandey, Prashansha Singh, Anish Kumar Tiwari, Vikas Baranwal, Jai Singh & Avinash C. Pandey. Time and Concentration Dependent; UV Light–Mediated Photocatalytic Degradation of Major Antibiotic Consortium Using ZnO. Braz J Phys. 2022, 52, 183. [CrossRef]
  16. Kumar, A.; Anamika, R.; Changsheng, G.; Gaurav, S.; Khadijah, M.S.M.K.; Fatimah, M.A.; Mu, N.; Mika, S.; Pooja, D.; Florian, J.S.; Acceleration of photo-reduction and oxidation capabilities of Bi4O5I2/SPION@calcium alginate by metallic Ag: Wide spectral removal of nitrate and azithromycin, Chemical Engineering Journal, 2021, 423, 130173. [CrossRef]
  17. Ospino-Atehortúa, B.A.; Zúñiga-Benítez, H.; Peñuela, G.A.; Potential Application of Persulfate and Simulated Sunlight Radiation on Azithromycin Removal. Environ. Eng. Res., 2021, 26, 200189. [CrossRef]
  18. Tenzin, T,; Yashas S.R.; Anilkumar, K.M.; UV–LED driven photodegradation of organic dye and antibiotic using strontium titanate nanostructures. J Mater Sci Mater Electron, 2021, 32, 21093–21105. [CrossRef]
  19. Li, C.; Jin, H.; Hou, Z.; Guo, Y.; Study on degradation of azithromycin antibiotics by molybdenum sulfide graphene oxide composites under visible light. IOP Conf. Ser. Mater. Sci. Eng. 2020, 774, 012019. [CrossRef]
  20. Rueda-Márquez, J.J.; Palacios-Villarreal, C.; Manzano, M.; Blanco, E.; Ramírezdel, S.M.; Levchuk, I.; Photocatalytic degradation of pharmaceutically active compounds (PhACs) in urban wastewater treatment plants effluents under controlled and natural solar irradiation using immobilized TiO2. Sol Energy 2020, 208:480–492. [CrossRef]
  21. Sayadi, MH,; Sobhani S, Shekari H.; Photocatalytic degradation of azithromycin using GO@Fe3O4/ZnO/SnO2 nanocomposites. J. Clean. Prod. 2019, 232:127–136. [CrossRef]
  22. Čizmić M, Ljubas D, Rožman M, Ašperger D, Ćurković L, Babić S (2019) Photocatalytic Degradation of Azithromycin by Nanostructured TiO2 Film: Kinetics, Degradation Products, and Toxicity. Materials. 2019; 12(6):873. [CrossRef]
  23. Naraginti, S.; Yu, Y.Y.; Fang, Z.; Yong, Y.C.; Visible light degradation of macrolide antibiotic azithromycin by novel ZrO2/Ag@TiO2 nanorod composite: transformation pathways and toxicity evaluation. Proc. Saf. Environ. Prot. 2019, 125, 39–49. [CrossRef]
  24. Biancullo F, Nuno FF. Moreira, Ana R. Ribeiro, Célia M. Manaia, Joaquim L. Faria, Olga C. Nunes, Sérgio M. Castro-Silva, Adrián M.T. Silva. () Heterogeneous photocatalysis using UVA-LEDs for the removal of antibiotics and antibiotic-resistant bacteria from urban wastewater treatment plant effluents, Chem Eng J 2019, 367, 304-313. [CrossRef]
  25. Luo, X.; Hao, T.; Yue, L.; Hong, G.; Lu, Y.; Azithromycin wastewater treatment with La doping titanium dioxide /active carbon composites, International Conference on Sensors, Measurement and Intelligent Materials (ICSMIM 2015), Atlantis Press: Amsterdam, The Netherlands, 2016, 861–870.
  26. Chen, X.; Photodegradation of Azithromycin in Aqueous System under VIS/UV Irradiation, International Journal of Scientific Advances, 2022, 3, Issue: 5. [CrossRef]
  27. Cano, P.A.; Marcela, J-B.; Henry, Z-B.; Yudy, AL.; Gustavo, A.P.; Use of simulated sunlight radiation and hydrogen peroxide in azithromycin removal from aqueous solutions: Optimization and mineralization analysis, Emerging Contaminants, 2020, 6, 53-61. [CrossRef]
  28. Voigt, M.; Indra, B.; Anna, N-H.; Martin, J.; Elimination of macrolides in water bodies using photochemical oxidation, AIMS Environ Sci 2018, 5(5), 372-388. [CrossRef]
  29. Tong L, Peter E, Sandra P, Yanxin W, Damià B () Photodegradation of azithromycin in various aqueous systems under simulated and natural solar radiation: Kinetics and identification of photoproducts, Chemosphere, 2011, 83(3), 340-348. [CrossRef]
  30. Ghari, Tayebeh; Kobarfard, Farzad; Mortazavi, Seyed. Development of a Simple RP-HPLC-UV Method for Determination of Azithromycin in Bulk and Pharmaceutical Dosage forms as an Alternative to the USP Method, Iranian journal of pharmaceutical research, 2013, 12, 57-63.
  31. 31. Mathon, Baptiste; Martial Ferreol, Marina Coquery, Jean-Marc Choubert, Jean-Marc Chovelon, Cécile Miège, Direct photodegradation of 36 organic micropollutants under simulated solar radiation: Comparison with free-water surface constructed wetland and influence of chemical structure, Journal of Hazardous Materials, 2021, 407, 124801. [CrossRef]
  32. Jaramillo-Baquero, M.; Zúñiga-Benítez, H.; Peñuela, G.A.; Use of photo-Fenton for macrolide antibiotic azithromycin removal. Acta Period Technol 2020, 29–37. [CrossRef]
  33. Orona Návar, Carolina; Irina Levchuk, Javier Moreno-Andrés, Nancy Ornelas-Soto. Removal of pharmaceutically active compounds (PhACs) and bacteria inactivation from urban wastewater effluents by UVA-LED photocatalysis with Gd3+ doped BiVO4, Journal of Environmental Chemical Engineering 2020, 8(6), 104540. [CrossRef]
  34. Talaiekhozani, Amirreza; Sahar Joudaki, Farhad Banisharif, Zeinab Eskandari, Jinwoo Cho, Ghasem Moghadam, and Shahabaldin Rezania.. "Comparison of Azithromycin Removal from Water Using UV Radiation, Fe (VI) Oxidation Process and ZnO Nanoparticles" International Journal of Environmental Research and Public Health 2020, 17(5), 1758. [CrossRef]
  35. Fiorentino, Antonino; Paula Soriano-Molina, María Jesús Abeledo-Lameiro, Irene de la Obra, Antonio Proto, Maria Inmaculada Polo-López, José Antonio Sánchez Pérez, Luigi Rizzo, Neutral (Fe3+-NTA) and acidic (Fe2+) pH solar photo-Fenton Vs chlorination: Effective urban wastewater disinfection does not mean control of antibiotic resistance, Journal of Environmental Chemical Engineering, 2022, 10(6), 108777. [CrossRef]
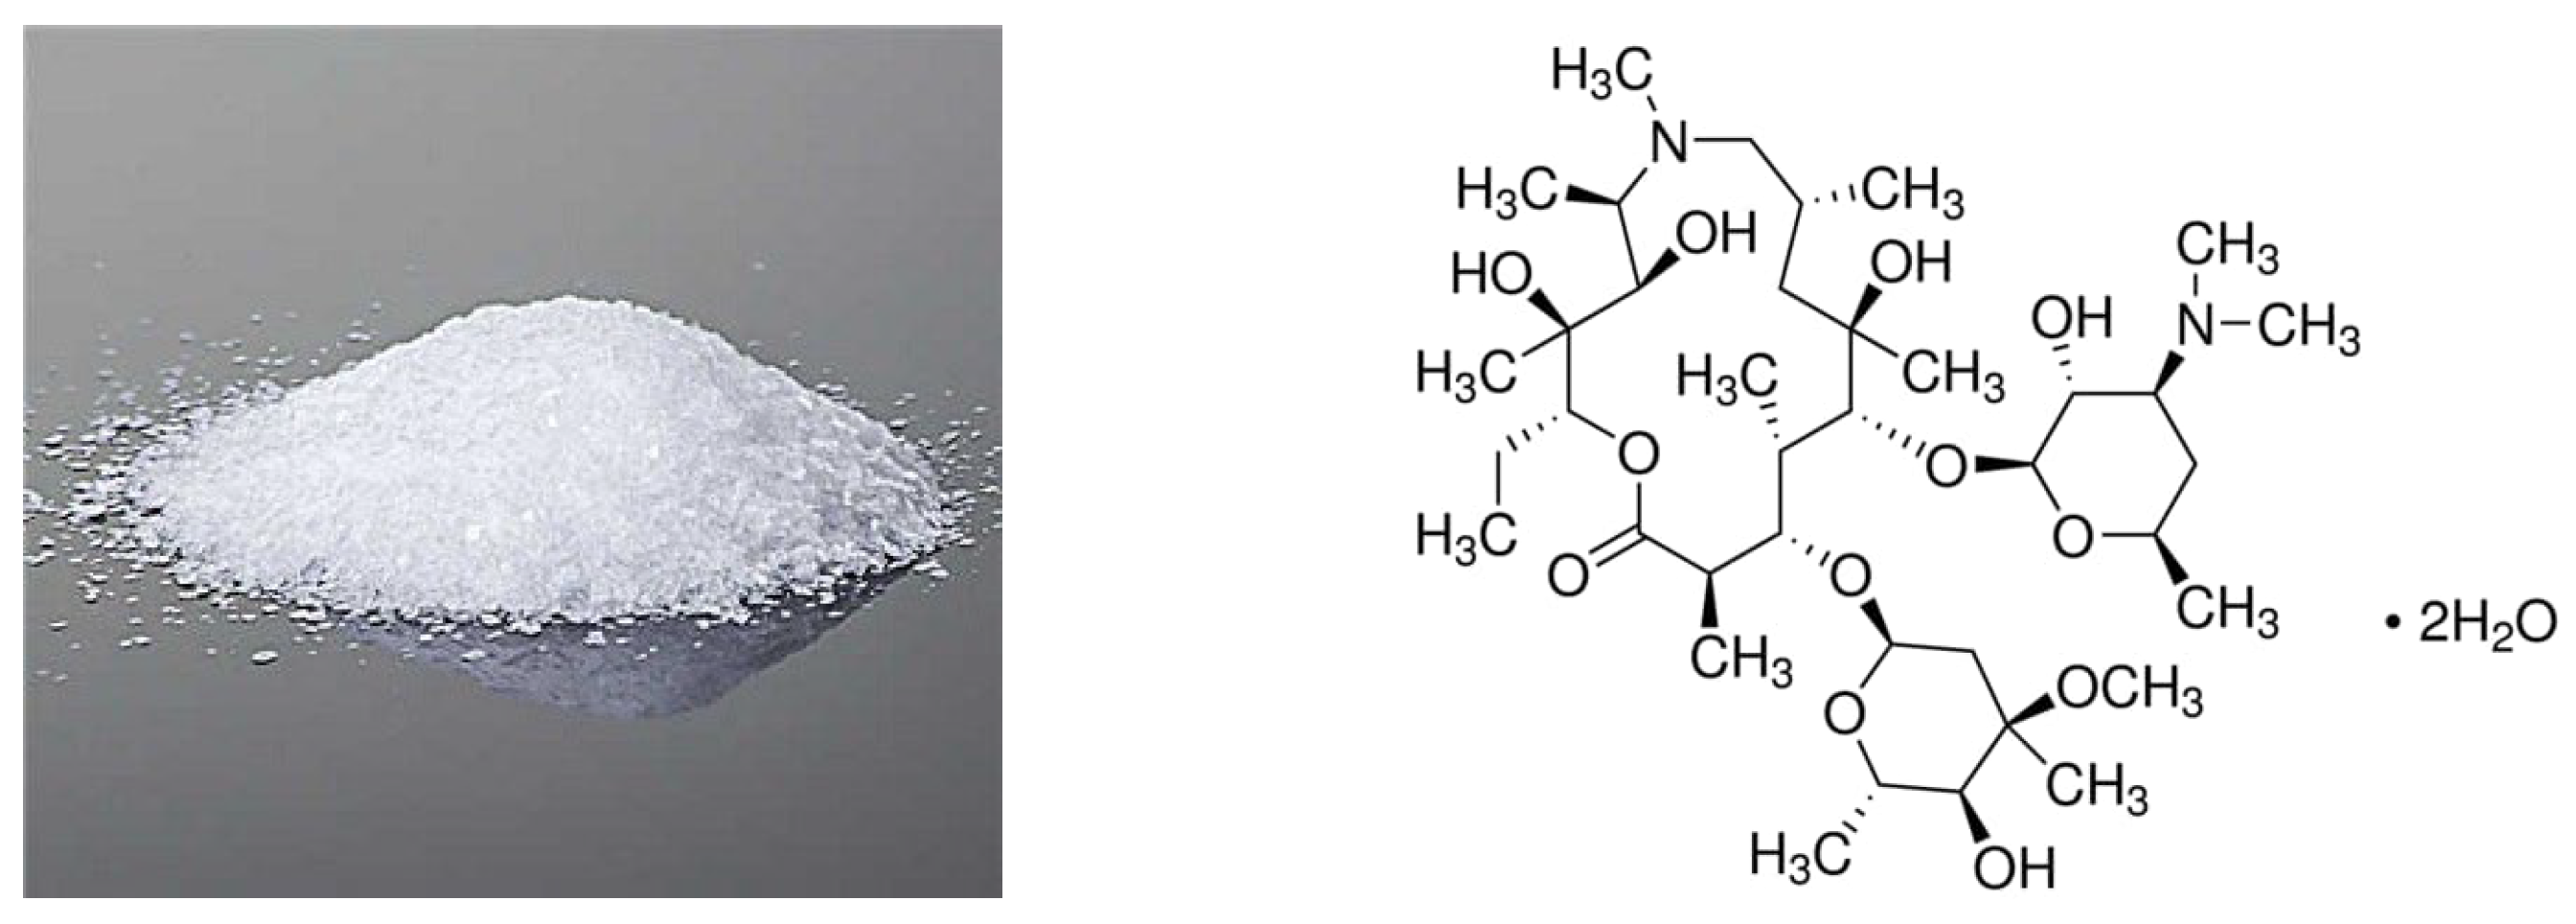
Figure 1. The AZT in solid powder form (white color) along with its molecular structure.
Preprints 104689 g001
Figure 2. An aqueous solution containing AZT and H2O2 on a magnetic stirrer cum hot plate, irradiated with UV light having 500 W/m2 intensity, input voltage 230 V, and 50/60 HZ.
Preprints 104689 g002
Figure 3. Percent degradation of AZT as a function of pH of the solution at different H2O2 concentrations. Experimental conditions: 50 ml solution of AZT 1.0 ppm concentration, 60 min irradiation time, UV irradiation intensity 500 W/m2, 30%H2O2 solution added, 1, 2, and 3 ml.
Preprints 104689 g003
Figure 5. Plots of Ct/Co vs irradiation time (t) for the zero-order reaction kinetics. A=1.0 ppm AZT solution, B=3.0 ppm AZT solution, C=5.0 ppm AZT solution. (Irradiated solution volume 50 ml, pH 9, and UV irradiation intensity 500 W/m2).
Preprints 104689 g005
Figure 6. Plots of Ln (Ct/Co) vs irradiation time (t) for the first-order reaction kinetics. A=1.0 ppm AZT solution, B=3.0 ppm AZT solution, C=5.0 ppm AZT solution. (Irradiated solution volume 50 ml, pH 9, and UV irradiation intensity 500 W/m2).
Preprints 104689 g006
Figure 7. Plots of 1/(Ct/Co) vs irradiation time (t) for the second-order reaction kinetics. A=1.0 ppm AZT solution, B=3.0 ppm AZT solution, C=5.0 ppm AZT solution. (Irradiated AZT solution volume 50 ml, pH 9, and UV irradiation intensity 500 W/m2).
Preprints 104689 g007
Figure 8. Scheme of AZT photodegradation using H2O2 under UV irradiation.
Preprints 104689 g008
Table 1. Correlation coefficient (R2) and rate constant (k) values for the degradation of AZT under UV irradiation for the zero, first, and second orders of reaction.
Zero Order Kinetics
(Ct/Co) vs t
First Order Kinetics
Ln (Ct/Co) vs t
Second Order Kinetics
1/(Ct/Co) vs t
1 ppm AZT solution (50ml) R2 k, min-1 R2 k, min-1 R2 k, min-1
1 ml 30% H2O2 0.9968 0.0130 0.9050 0.0352 0.6569 0.1304
2 ml 30% H2O2 0.9912 0.0142 0.9418 0.0301 0.7418 0.0789
3 ml 30% H2O2 0.9974 0.0134 0.9671 0.0235 0.8589 0.0460
3 ppm AZT solution (50ml) R2 k, min-1 R2 k, min-1 R2 k, min-1
1 ml 30% H2O2 0.9925 0.0089 0.9308 0.0341 0.7107 0.1730
2 ml 30% H2O2 0.9923 0.0092 0.9559 0.0282 0.8164 0.1028
3 ml 30% H2O2 0.9760 0.0085 0.9936 0.0210 0.9491 0.0563
5 ppm AZT solution (50ml) R2 k, min-1 R2 k, min-1 R2 k, min-1
1 ml 30% H2O2 0.9848 0.0070 0.9647 0.0325 0.8150 0.1878
2 ml 30% H2O2 0.9908 0.0073 0.9462 0.0281 0.7872 0.1295
3 ml 30% H2O2 0.9848 0.0070 0.9819 0.0210 0.9405 0.0716
R2 = Correlation Coefficient, k = Rate Constant
Table 2. The photodegradation efficiency of this study compared with the literature-reported results.
No. Catalyst Process conditions Degradation Efficiency Reference
1. 10%Cu2O/TiO2 nanotubes, 1.5 g/L Visible light irradiation, AZT 100 μg/mL, pH 7 100% in 1.5h [11]
2. PAC/Fe/Ag/Zn, 0.04 g/L UV irradiation, pH  9, AZT 10 mg/L, pseudo-first-order kinetic 99% in 2h [13]
3. Ag@Bi4O5I2/SPION@calcium alginate visible light (300W Xe lamp), AZT 10 mg/L, 0.3 mg /mL 98% in 1.5h [16]
4. K2S2O8 5.0 to 80.0 mg/L
Simulated solar irradiation 30 min (1.5 KW xenon lamp, 290-800nm), 50.0 mL solution, AZT 1.0 mg/L, pH 5 70% in 2h [17]
5. SrTiO3, 30 mg UV irradiation, AZT 20 mg/L, pH 12, pseudo-first-order reaction kinetics 99% in 4h [18]
6. (a). MoS2
(b). MoS2-GO
Visible light irradiation, AZT 100 mg/L (a). 75% in 3h
(b). 87% in 3h
[19]
7. TiO2 P25, 227 ng/L (UV), 250 ng/L (solar) UV irradiation 55 Wm−2,
Solar 33W m−2, domestic wastewater
52% (UV),
87% (solar)
[20]
8. GO@Fe3O4/ZnO/SnO2, 1g/L, UV-C Irradiation, AZT 30 mg/L, pH 3 90% in 2h [21]
9. ZrO2/Ag@TiO2 Visible light irradiation, AZT 20 mg/L (50 ml solution) 90% in 8h [23]
10. La-TiO2/active carbon UV irradiation, pH 4, AZT 10 ppm 96% in 1.5h [25
11. Fe (III)-oxalate UV irradiation, AZT 10 mg/L, pH 4, 83% in 2h [26]
12. 35% H2O2, 482.0 ppm as oxidant Simulated sunlight irradiation 500 W/m2, AZT 1 ppm (50 ml solution), pH 9 100% in 2h [27]
13. No catalyst, only UV irradiation, Xenon arc lamp (power 500 watts, UV power: 765 W/m2, Wavelength 300–800 nm), AZT 1.0 μg/L, pH 7, Temp. 40 °C 90% in 7days [31]
14. 7.5 mg/L FeSO4 + 27.5 mg/L H2O2 Simulated solar irradiation, UV power 50mW/cm2, Wavelength 290–800 nm, AZT 3 mg/L, pH 3 92% in 0.5h [32]
15. Gd3+ doped BiVO4, catalyst 2g/L UV-LED irradiation, Wavelength 370 nm, power 4.65 mW/cm2, domestic wastewater 63% in 3h [33]
16. No catalyst, only UV irradiation, UV irradiation power 163 mW/cm2, AZT 110 mg/L, pH 7. Temp. 65°C 73% in 0.8h [34]
17. Solar Photo-Fenton catalyst, Fe2+, 20 mg/L, H2O2 50 mg/L Solar UV power 2.65 ± 0.68 mW/cm2, Reactor volume 2x15 L, AZT 25 ng/L, pH 7 24% in 3h [35]
18. 3 ml of 30% H2O2 solution UV irradiation intensity 500 W/m2, AZT 1.0 ppm (50 ml solution),pH 9.0, zero-order reaction kinetics 100% in 1h This work
Disclaimer/Publisher’s Note: The statements, opinions and data contained in all publications are solely those of the individual author(s) and contributor(s) and not of MDPI and/or the editor(s). MDPI and/or the editor(s) disclaim responsibility for any injury to people or property resulting from any ideas, methods, instructions or products referred to in the content.
Copyright: This open access article is published under a Creative Commons CC BY 4.0 license, which permit the free download, distribution, and reuse, provided that the author and preprint are cited in any reuse.
Prerpints.org logo

Preprints.org is a free preprint server supported by MDPI in Basel, Switzerland.

Subscribe

© 2024 MDPI (Basel, Switzerland) unless otherwise stated