Preprint
Article

Hierarchical Porosity and Surface Oxygenation of Carbon-Based Cathodes Enhances Discharge Capacity and Decreases Discharge Overpotential of Potassium-Oxygen Batteries

Altmetrics

Downloads

91

Views

40

Comments

0

A peer-reviewed article of this preprint also exists.

Submitted:

24 April 2024

Posted:

24 April 2024

You are already at the latest version

Alerts
Abstract
Potassium-oxygen batteries (KOBs) are a promising energy storage technology with high theoretical en-ergy density, low overpotential and long cycle life. Cathode microstructure plays a significant role in the electrochemical performance of KOB. In this article, hierarchical porosity was introduced to commer-cially available carbon paper cathodes by the thermal pretreatment in air at different pretreatment times. This pretreatment modifies the properties, such as, surface area, defects, oxygen functional groups etc. and it has been found to enhance the discharge capacity and it result in reduction of dis-charge overpotentials.
Keywords: 
Subject: Chemistry and Materials Science  -   Electrochemistry

1. Introduction

The demand for the renewable energy over the past decade has grown rapidly due to the depletion of traditional fossil fuels and associated environmental concerns. However, the storage and effective utilization of intermittently harvested energy electricity continue to pose challenges. Lithium-ion batteries (LIBs) have dominated the energy storage market for portable electronic devices since their launch in the 1990s. Nevertheless, their limited energy density, limited earth crustal abundance, and significant cost still challenge their suitability for next-generation large scale energy storage applications. Among the alternatives beyond LIBs, metal-oxygen batteries have attracted considerable attention, especially, the lithium-oxygen battery (LOB) due to their high theoretical energy density of 3505 Wh/kg, and potentially lower cost [1,2,3]. However, the practical capacities of LOB have not reached the theoretical predictions, yet. The main causes can be found in the complex cell chemistry of the LOB, which gives rise to large charging overpotential, low energy efficiency, limited rechargeability, and severe electrolyte/electrode decomposition [4,5]. In particular LOB suffer from cell degradation caused by reactive singlet oxygen (1O2) formed during all stages of cycling [6]. Despite not being fully understood yet, there exists substantial evidence indicating the 1O2 generation is linked to the formation mechanism of the main discharge product lithium peroxide (Li2O2) [7]. In contrast, in the potassium oxygen battery (KOB) the main discharge product is potassium superoxide (KO2), which allows for recharging with negligible 1O2 formation.[8].
The discharge product KO2 is both kinetically favored and thermodynamically stable and a subsequent disproportionation reaction and 1O2 generation is energetically disfavored [9,10]. The formation of KO2 as discharge product offers several additional advantages as detailed in recent review articles [11,12,13]. However, KOB has not yet received significant research attention which could be attributed to its lower specific energy of 935 Wh/kg in comparison to other MOB with multi-electron discharge reaction [12]. Additionally, O2 crossover from the cathode compartment to the K-metal anode leads to permanent self-discharge due to which limited cycle life is observed [15].
Numerous strategies have been devised to mitigate the self-discharge and dendrite formation [15,16,17,18,19,20]. As a very promising approach, an “organic” KOB cell design has been proposed [21]. It applies of a K-β’’alumina solid state electrolyte (KBA) which acts as an O2-impermeable separator and a new type of liquid anode consisting of potassium biphenyl complex (KBp) in 1,2-dimethoxyethane (DME) which offers low interfacial resistances with KBA. In this cell the standard cell potential E(KBp/O2) = 2.18 V is lowered compared to a K-metal anode (2.48 V) and with employing carbon paper as cathode, this setup allows cycling at a limited areal discharge capacity (Q) of 0.25 mAh/cm2 for 3000 cycles with an average current efficiency of 98.5%
For KOB to become an appealing technology, this remarkable rechargeability needs to be further enhanced towards significantly higher capacities. The capacity LIB with Q ranging from 2.5 mAh/cm2 to 4 mAh/cm2 may serve here as a benchmark [22], which points out the need for larger improvements in the performance of KOB. Recently we were able to show that surface functionalization of a commercial carbon paper cathode with hydrophobic PTFE enhances the discharge capacity by improving the mass transport [23]. Further improvements we have achieved by O2 partial pressure increase [24], and by means of a very recently introduced physical-mathematical model, which describes the influence of cathode porosity and the microstructure on the discharge performance, we predicted that increasing cathode porosity and volumetric surface area is further supportive for the discharge performance [25]. Thereby it became evident that a combination of micropores and mesopores is particularly supportive to avoid oxygen transport limitations in inner cathode regions [26]. Therefore, a hierarchical pore design of cathode material is anticipated most promising.
Carbon materials have attracted immense attention as cathode materials due to their abundance, low cost, light weight, structural stability, and environmental compatibility [27,28]. So far, commercial carbon materials with relatively low porosity and surface area have been employed as cathode in the organic KOB design [21,23]. In view of the arguments given above, commercial carbon materials can be structurally optimized to improve the performance of KOB by introducing hierarchical surface porosity. Numerous studies have been conducted to modify the surface properties of carbon paper to enhance the electrochemical performance [29]. The most commonly reported pretreatment involves thermal oxidation in air, which results in surface functionalization and an increase in available and physical surface area [29,30].
In this work, we developed carbon cathode materials with hierarchical porosity by thermal treatment of the commercial carbon paper in air at selected temperature for varied pretreatment time. The pretreatment causes partial thermal oxidation of the carbon fibers and results in surface oxygenation and an increase in available and physical surface area [29,31]. In a systematic study we investigated the discharge performance of the pristine carbon paper cathode and all pretreated cathode samples in an organic KOB to analyze how the change in the properties of carbon paper such as introduction of oxygen functional groups, defects, surface area, etc. affects the discharge performance.

2. Materials and Methods

2.1. Thermal Oxidation of Carbon Paper

Carbon paper, H23, (Freundenberg, Germany), denoted as CP was punched into circular discs (m = 14.6 mg ± 0.1mg, Ø = 14 mm, T = 0.211 mm) and then, they were oxidized under air in a muffle furnace (Nabertherm muffle furnace, Germany) at 450 °C for varying pretreatment time of tpt=4 h, 12 h, and 24 h, denoted as CP_4 h, CP_12 h, and CP_24 h, respectively. CP treated for more than 24 h lost a significant amount of their mass and were too fragile. For the pretreatment, the CP discs were placed on aluminum foil to avoid any contamination, and care was taken to prevent the carbon paper discs from overlapping. The CP discs were kept in the oven at room temperature, and the temperature was ramped to the set-point i.e. 450 °C at 10 °C /min. Then, the oven temperature was held at this temperature for the specified time tpt. After the treatment, the samples were allowed to cool to the room temperature in the oven and were thereafter stored in glass vials.

2.2. Characterization

Electron microscopy was conducted by means of Scanning electron microscope (SEM) at an accelerating voltage of 10 kV with a LEO Supra35VP (Carl Zeiss AG, Germany) SEM device with integrated energy-dispersive X-ray spectroscopy (EDS) INCA Energy 200 detector (Oxford Instruments, UK), a JSM-IT800HL SEM (JEOL, Japan) with integrated EDS Octane Elect from EDAX (AMETEK, Germany), and transmission electron microscope (TEM) using ZEISS LIBRA 200 FE operating at 200 kV. Raman spectroscopy was performed using a Renishaw Virsa/InLux (Renishaw, UK) with a laser wavelength of 532 nm. X-ray photoelectron spectroscopy (XPS) was performed using AXIS Supra instrument (Kratos Analytical Ltd.) with monochromatized Al Kα X-ray source and the base pressure was < 5.0 × 10⁻⁶ Pa. The analysis of the spectra was performed in the CasaXPS software package (Casa Software Ltd.). Nitrogen adsorption/desorption measurements for the Brunauer- Emmett- Teller (BET) surface area determination were obtained using Autosorb-iQ analyzer (Autosorb-iQ, Quantachrome, USA) with liquid nitrogen at 77 k. All the samples were degassed at 120 °C for 12 h under high vacuum to remove any adsorbed species prior to measurement. The mass loss of the samples was determined by weighing the samples before and after the thermal pretreatment using XS205 Mettler Toledo balance. Contact angle measurement of the samples was done to compare the wettability. Measurements were taken in ambient air at room temperature. Specifically, a 2 µL solvent drop of either deionized (DI) water or DMSO was placed on the porous cathode surface, and an image of the droplet on the surface was captured immediately. The contact angle measurement was estimated manually using ImageJ software.

2.3. Battery Cell Assembly

All the solvents were dried over 3 Å molecular sieves for at least two weeks before use. Moisture contents were assessed by Karl-Fischer Titration (KFT) to be < 20 ppm. Biphenyl (Bp, 99 %, Sigma-Aldrich) was vacuum dried at RT for 2 days and transferred to an argon filled glovebox (H2O < 0.1 ppm, O2 < 0.1 ppm) without any air exposure. KPF6 (99.5 %, Sigma-Aldrich) was vacuum dried at 110 °C overnight and transferred to glovebox without any air exposure. K metal (99.5 %, Sigma-Aldrich) were used as received. The cell assembly process was performed in argon filled glovebox. Battery cells were based on ECC-Air cells (EL-Cell, Germany) with a homemade inlay [23]. The cell and inlay components were dried at 105 °C overnight and transferred to the glovebox while hot. Cell assembly was carried out in the glovebox. Cu foam (Ø = 16 mm, T = 2.0 mm, > 99%, Alfa Aesar, USA) and grade GF/B filter (m = 22.0 mg ± 0.1 mg, Ø = 14 mm, Whatman, UK) were inserted into the anode compartment of the inlay. Then, 200 µL of 3.0 M KBp in 1,2-dimethoxy ethane (DME, 99.5 %, anhydrous, Sigma-Aldrich) were added. K-β‘’-alumina disks (KBA, Ø = 20 mm, T = 1.0 mm) was placed on top. The upper polyether ether ketone (PEEK) inlay component was put into the place and the anode compartment was sealed with PEEK clamps. Grade GF/A (m = 10.2 mg ± 0.1 mg, Ø = 16 mm, Whatman, UK) was inserted into the cathode compartment. Then, 60 µL of 0.5 M KPF6 in dimethyl sulfoxide electrolyte (DMSO, 99.9 %, anhydrous, Sigma-Aldrich) was added. Sample was inserted, and a perforated stainless-steel current collector disk was placed on top followed by a copper spring for compression. The inlay was transferred to the ECC-Std cell housing and the cell was sealed with the cell clamp.

2.4. Electrochemical Measurements

Fully assembled cells were removed from the glovebox, transported to the test bench and connected to the O2 supply. Cells were purged under rapid O2 flow for 2 min. Battery tests were performed with CTS battery tester (Basytec, Germany). A 75 min resting step at open-circuit potential was performed prior to battery testing. Discharge currents were normalized to the nominal surface area of electrodes (A= 1.54 cm2). The cutoff cell voltage was 1.50 V. Electrochemical impedance spectroscopy (EIS) measurements were conducted using a potentiostat (BioLogic SP-200, Seyssinet-Pariset, France). EIS spectra were recorded at open-circuit voltage with 5 mV excitation amplitude and the frequency scan range was from 100 KHz to 0.010 Hz with 9 points per decade. EIS spectra were analyzed by Bio-Logic EC lab software.

2.5. Analysis Methods Post Discharge

Samples were prepared by removing cathodes from cells in the glovebox and rinsing them thoroughly with DME in order to remove any residual electrolyte. SEM was performed as described in Section 2.2. Cross-sections of cathodes were obtained by cutting the cathode using a scalpel.

3. Results and Discussion

3.1. Thermal Oxidation of Carbon Paper

3.1.1. Analysis of Cathode Structure and Surface Properties

Figure 1(a) shows the scheme of the thermal oxidation of pristine carbon paper, which consists of interwoven fibers, which show initially a smooth surface. By thermal treatment (4 h, 12 h and 24 h) their surface is intended to be modified in terms of roughness and oxygen containing functional groups. The pristine and modified carbon paper fibers were analyzed by SEM. The images were obtained to qualitatively assess the impact of thermal pretreatment on the microstructure of cathode. At moderate magnifications all cathode samples appear similar with respect to their microstructure (Figure S1). However, Figure 1(d) shows that at higher magnification, the pristine CP exhibited a smooth fiber surface. In contrast, the fiber surfaces of CP_4 h, CP_12 h, and CP_24 h became texturized with increase in pretreatment time indicating that the surface of cathode samples has been modified after thermal pretreatment. EDS mapping was performed for all the cathode samples to locate oxygen on the carbon fiber surface. Even EDS is not ideally suited here for a quantitative determination of the oxygen amount, the oxygen intensities under identical measuring parameters can be compared semi-quantitatively. The oxygen maps of CP, CP_4 h, CP_12 h and CP_24h were shown in Figure 1(c) and reveal almost no intensity for the untreated CP up to a max. intensity for the longest pretreatment time, i.e., CP_24 h. The full set of EDS analysis is given in Figure S2. Supplementing TEM analysis shows that the CP has a smooth fringe while the CP_24 h has become rough (Figure S3).
To determine the mass loss, samples were weighed before and after pretreatment. There was no noticeable mass loss for CP_4 h, while mass loss of 3 to 5 % and 10 to 15 % was observed for CP_12 h and CP_24 h, respectively. To assess the wettability of the cathode samples, contact angle measurements were performed with droplets of DI water and DMSO. The pristine CP is observed to be hydrophobic with an external contact angle of ~ 109 °C for DI water. In contrast, CP_4 h, CP_12 h and CP_24 h immediately imbibe the water droplet upon contact, implying that an introduction of oxygen functional groups on the fiber surface induces wetting (Figure S4). All pristine and pretreated cathode samples immediately imbibe the DMSO droplets, as well, evincing good wettability for the polar electrolyte solvent, DMSO.
Carbon material is widely characterized by Raman spectroscopy [31]. The most interesting Raman bands for sp2 hybridized carbon materials and their composites are two signals at ~ 1350 cm-1 and ~ 1580 cm-1, which are the disordered (D) and graphitic (G) modes of carbon, respectively. Structural changes [32] as defect densities can be monitored by their intensity ratio ID/IG. Here, Raman spectra show two bands at ~ 1351 cm-1 and ~ 1570 cm-1 for all the cathode samples (Figure S5). Intensity ratios ID/IG for CP, CP_4 h, CP_12 h and CP_24 h was found to be 0.92, 0.99, 1.05, and 1.07, respectively, indicating an increase of surface disorder and defects of the carbon structure with increasing pretreatment time.
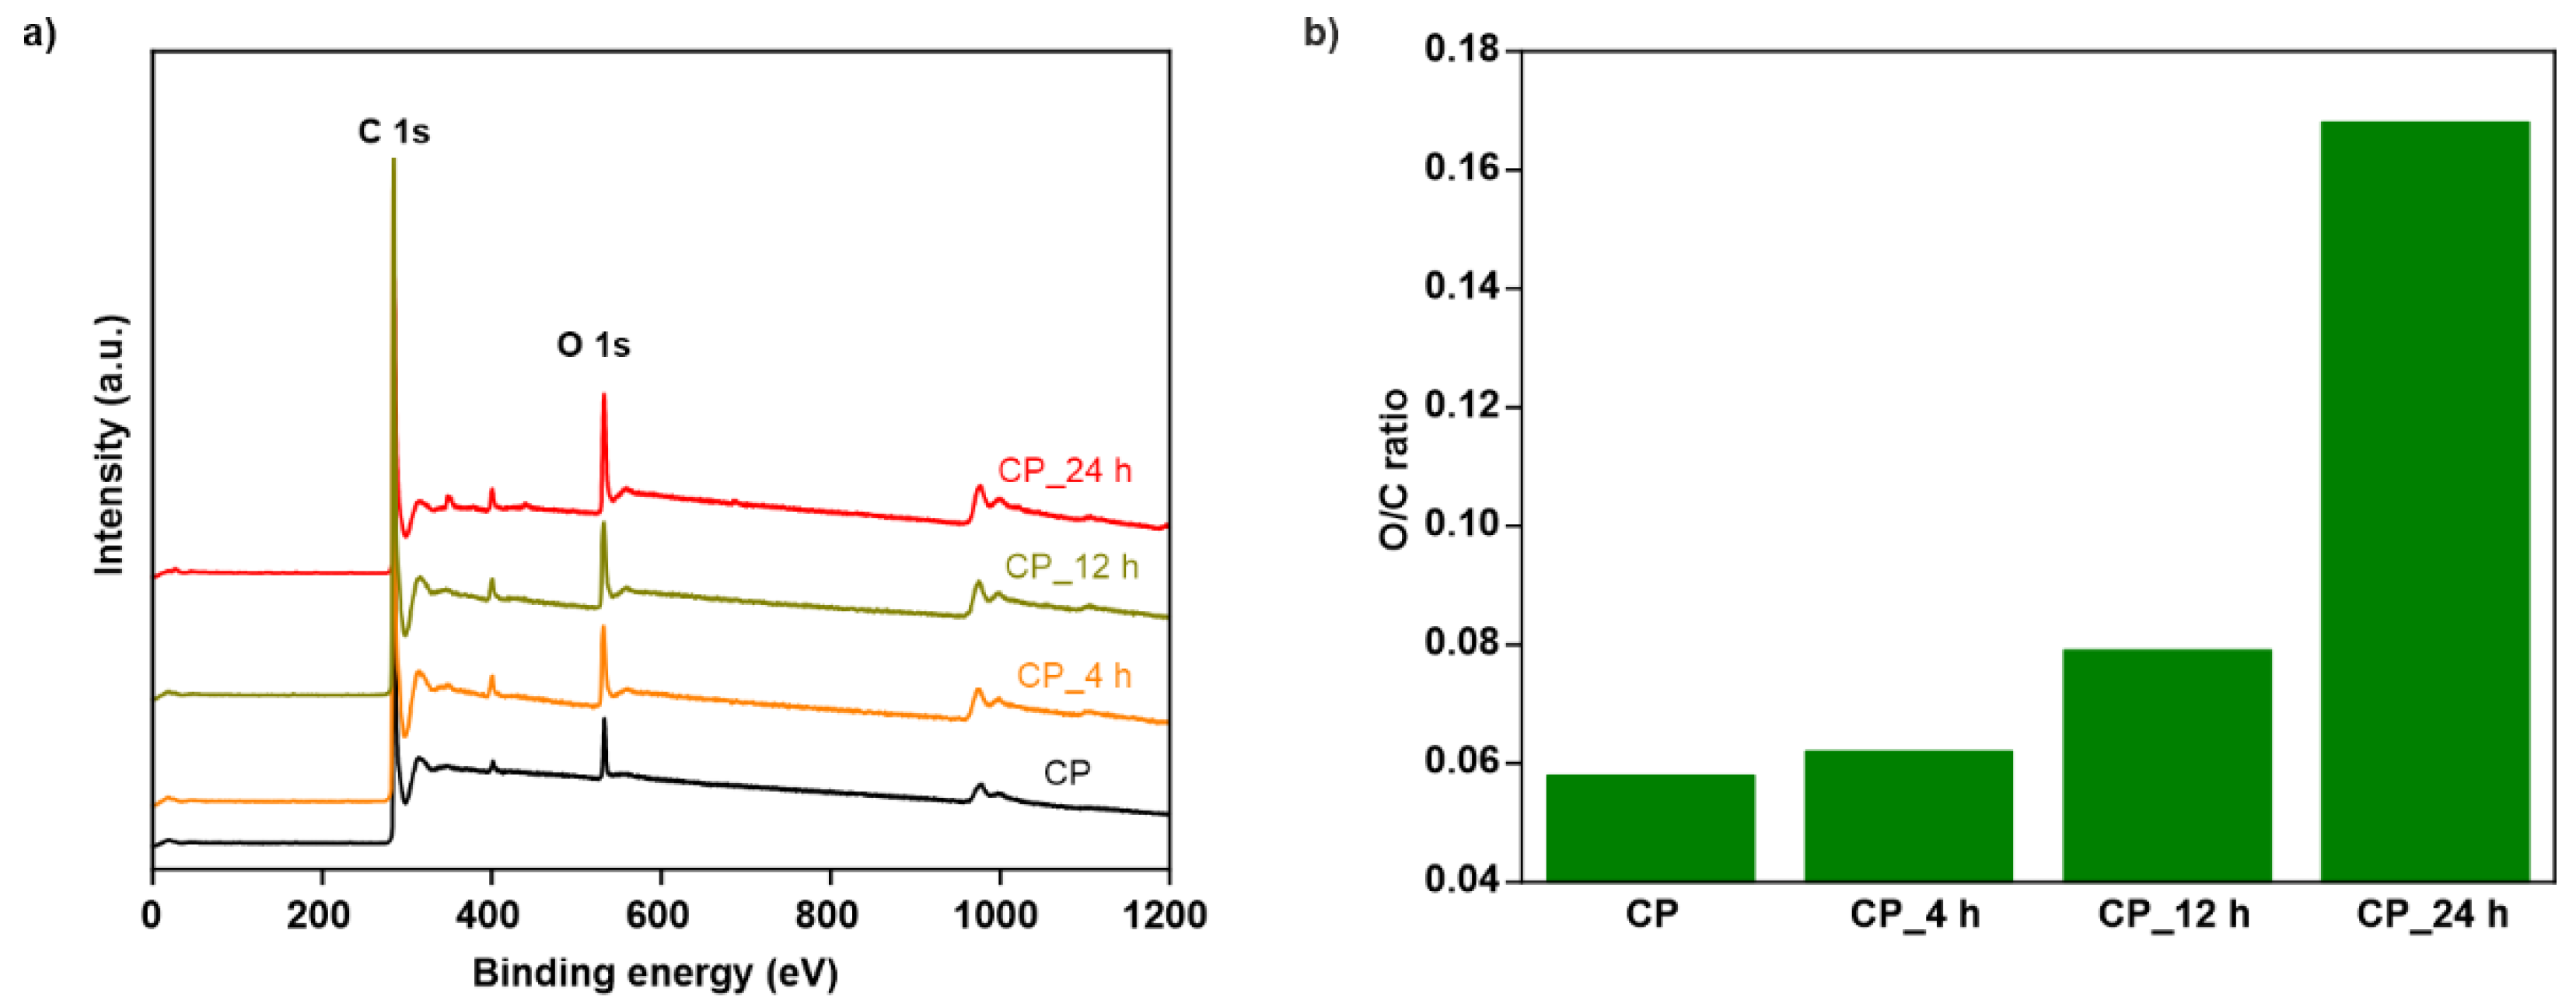
The chemical surface composition of the cathode samples was also investigated by means of XPS. Figure 2(a) shows the wide scan XPS survey spectra of CP, CP_4 h, CP_12 h, and CP_24 h, which indicate the presence of carbon and oxygen at approximately 285.0 eV and 533.0 eV, respectively [33]. The O 1s peak intensity at 533.0 eV is lowest for the CP and it gets more pronounced with thermal treatment time indicating the thermal oxidation process has introduced more oxygen containing functional groups on the surface of the carbon paper. For further analysis, C 1s spectra and O 1s spectra were deconvoluted (Figure S6 and FigureS7). It can be seen that the C 1s spectrum of CP shows deconvoluted peaks for graphitic carbon (~ 284.6 eV), defective carbon (~ 285.3 eV), C-O (~ 286.7 eV), and O-C=O (~ 289.7 eV) while CP_4 h, CP_12 h, and CP_24 h show deconvoluted peaks for graphitic carbon (~ 284.6 eV), defective carbon (~ 285.3 eV), C=O (~ 287.4 eV), and O-C=O (~290.2 eV) [34,35,36,37,38]. This high-resolution C 1s spectrum shows a decrease of graphitic carbon with an increase of defective carbon with increasing pretreatment time. This effect is more pronounced from CP to CP_4 h. The O 1s spectrum of CP reveals deconvoluted peaks for C-O (~ 532.2 eV), O-C=O (~ 533.5 eV) and chemisorbed oxygen or perhaps some water (534.7 eV), while CP_4 h, CP_12 h, and CP_24 h shows peaks for C=O (~ 531.2 eV), O-C=O (~ 533.eV), adsorbed water (~ 535.5 eV) and adsorbed CO2 (~ 536.9 eV) [35,38,39,40]. The content of the O-C=O groups increases with the pretreatment time and the most significant increase is observed from CP to CP_4 h.
To evaluate the introduction of oxygen containing functional groups, the ratio of O/C was calculated from the integrals of O 1s and C 1s peaks. Figure 2b shows the O/C ratio for all samples. It is evident that the O/C ratio increases with the pretreatment time indicating more surface coverage of the oxygen containing functional groups with values of 0.058, 0.062, 0.079 and 0.168, respectively. However, the O/C ratio does not show a significant increase for CP_4h, but successive increase for CP_12h and CP_24h.

3.1.2. Analysis of Surface Area

Table 1 shows the micropore area, external surface area and specific surface area of all the cathode samples. It can be seen that CP and CP_ 4 h have low specific surface area of 0.33 m2/g and 1.2 m2/g, respectively, and the values are too low for the accurate quantification of micropore area and external surface area. The specific surface area of CP_12 h is nearly 29 times that of CP_4 h and CP_24 h is nearly threefold that of CP_12 h. From the pore size distributions of CP_12 h and CP_24 h (Figure S8), micropores presence can be observed in CP_12 h while higher concentration of micropores and very less concentration of mesopores at an average size of around 3 nm and 6 nm can be seen for CP_24 h.

3.2. Electrochemical Measurements

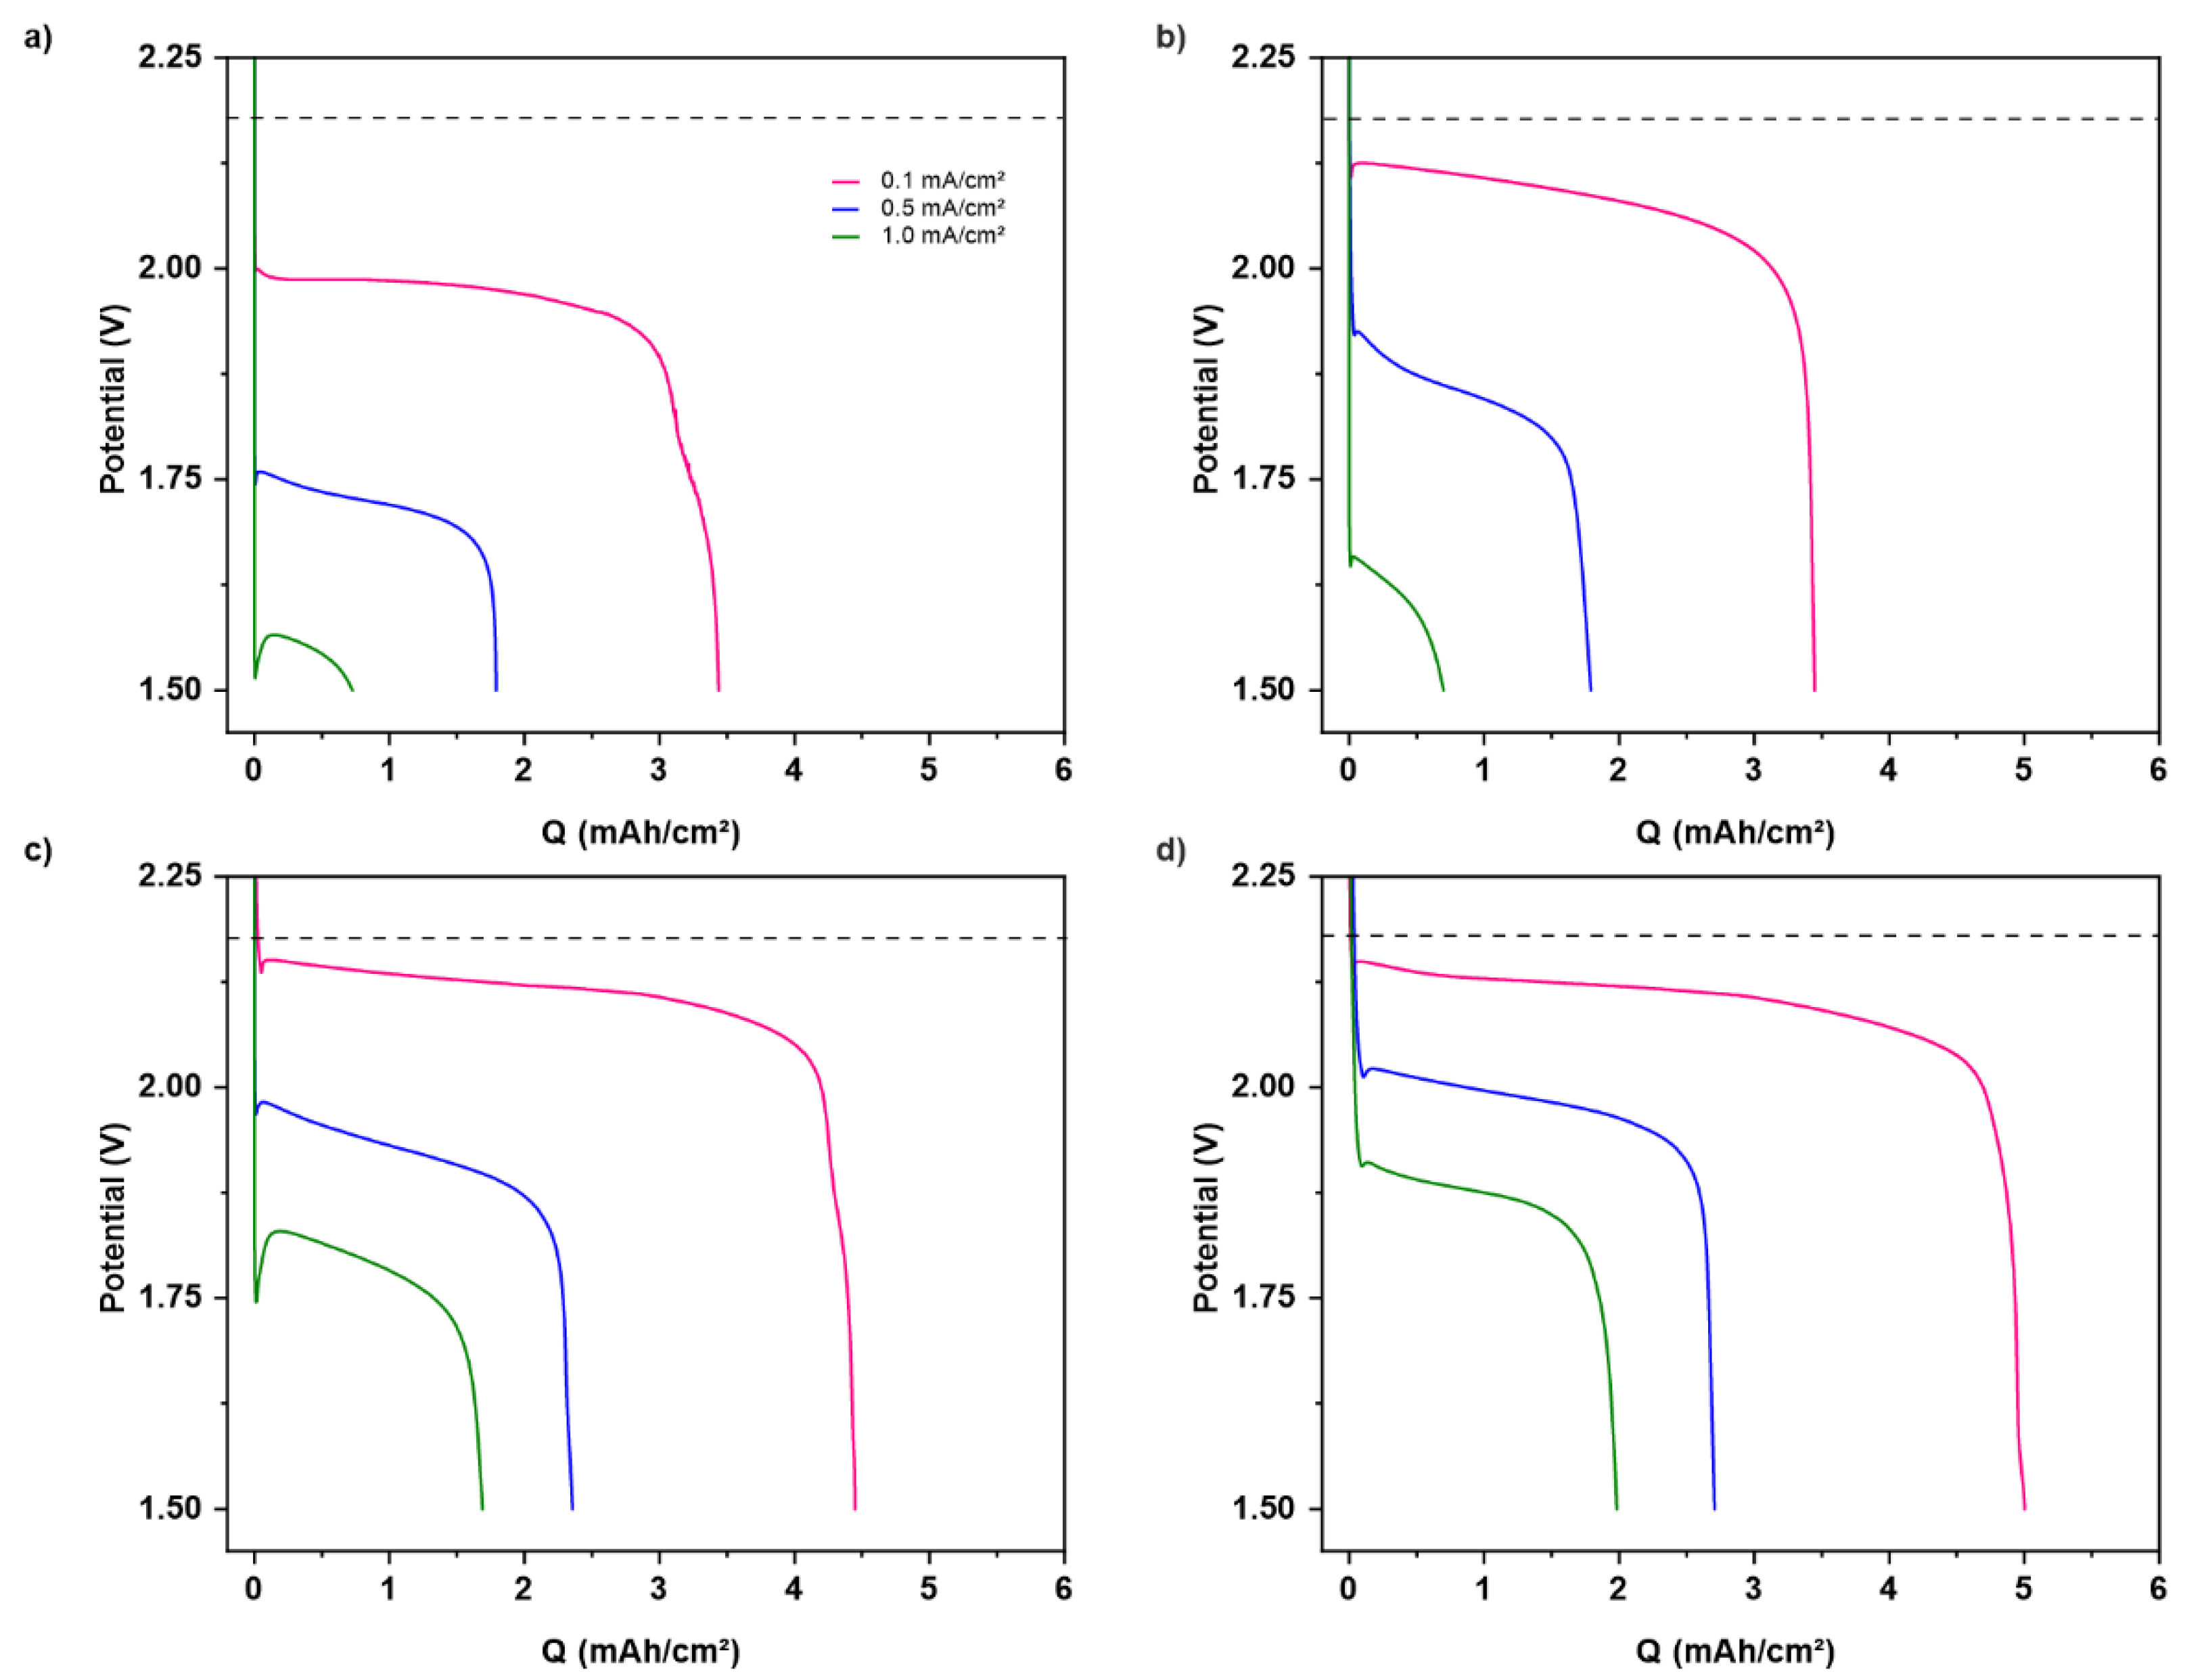
Discharge testing was conducted for all the cathode samples at three different current densities, J of 0.1 mA/cm2, 0.5 mA/cm2 and 1.0 mA/cm2. Discharge profiles of all the cathode samples are shown in Figure 3. For all cathodes, only one plateau is visible at all tested J and a second voltage plateau is not visible which could indicate the unintended formation of K2O2 [22]. In our previous studies, KO2 was already identified as the discharge product by means of X-ray diffraction and Raman spectroscopy [23].Typically, the discharge overpotential, ηdis increases with increase in J, while Q decreases.
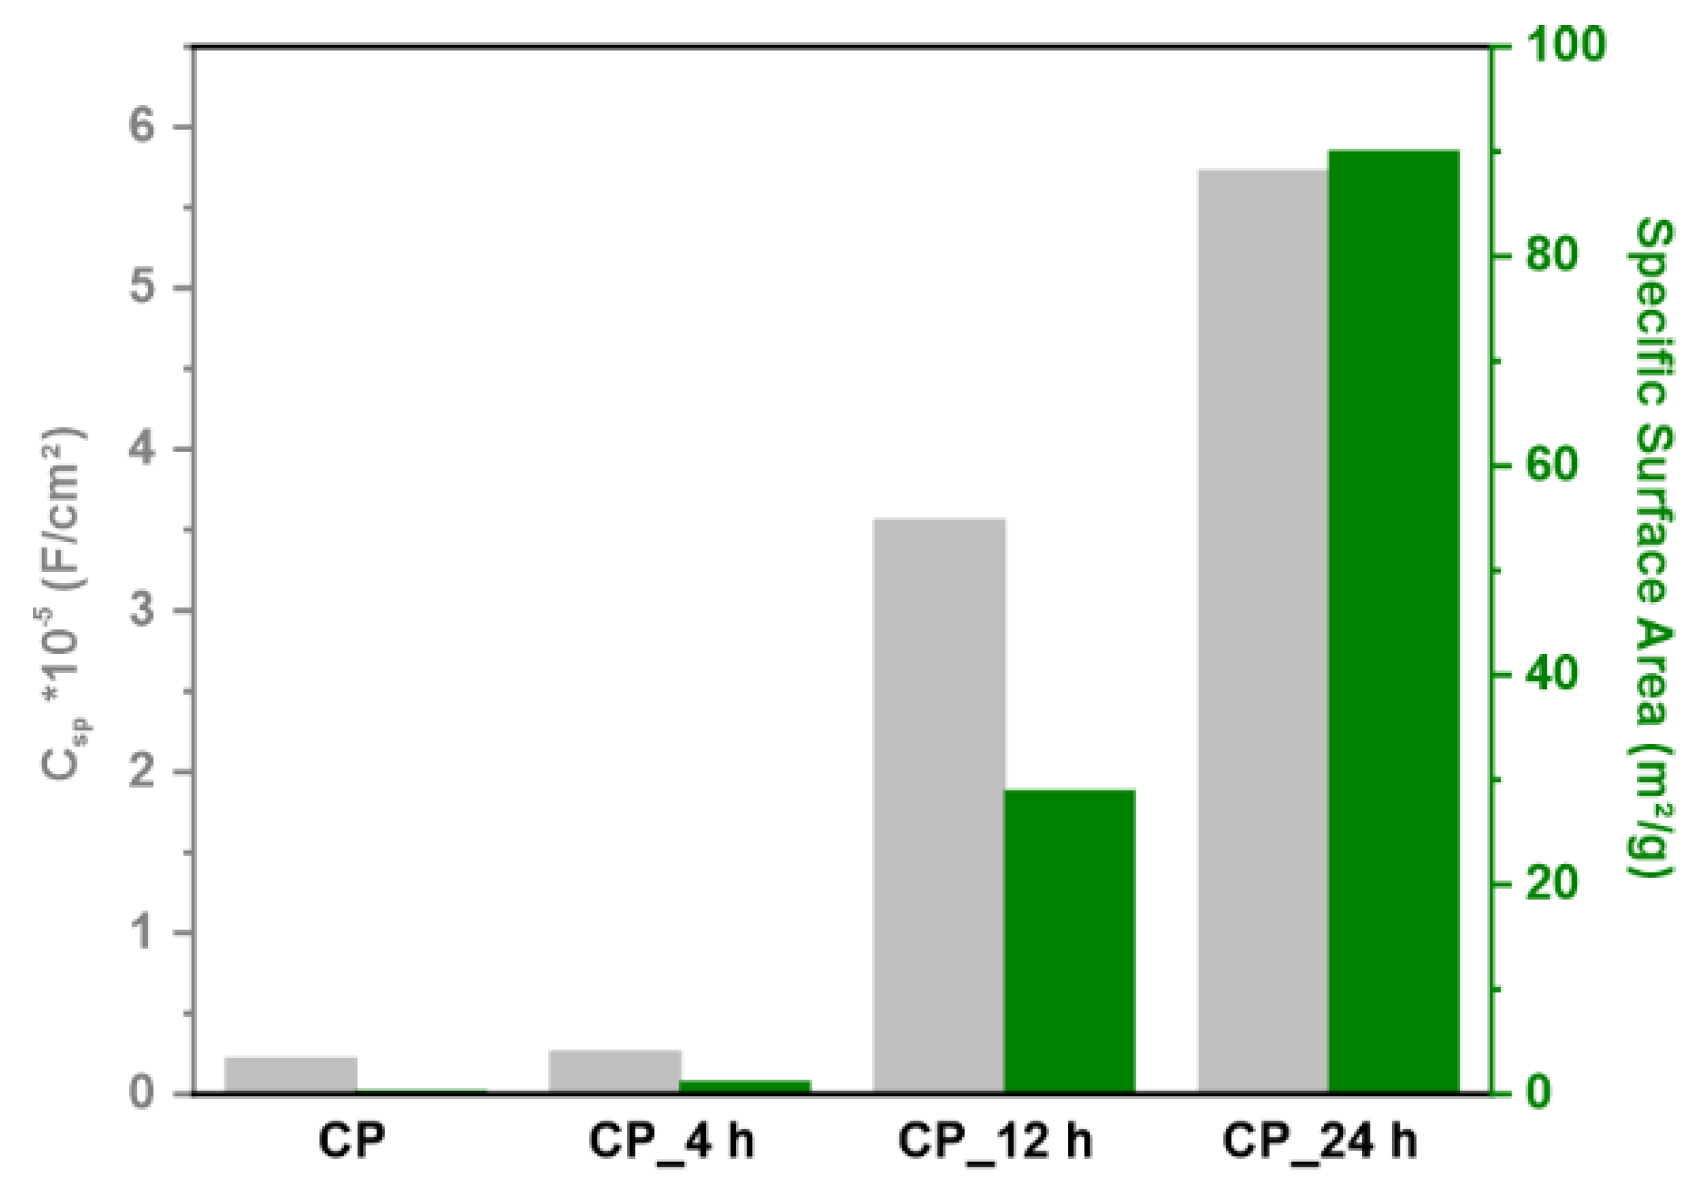
The specific double-layer capacitance, Csp of an electrode in contact with electrolyte was investigated by means of electrochemical impedance spectroscopy via a previously reported method [41]. Csp is known to be directly proportional to the area of solid-liquid interface [42]. Figure 4 shows the bar plot of Csp and of specific surface area (cf. Table 1) of all the cathode samples. The corresponding Bode plots of all the cathode samples can be found in Figure S9. There is a significant increase of Csp from CP_4 h to CP_12 h indicating maximum available active surface area with the increase of 29-fold specific surface area. However, Csp increase gets less pronounced from CP_12 h to CP_24 h as the specific surface area only increases to 3-fold.
Figure 5(a) shows the Q with the specific surface area of the cathode samples CP, CP_4 h, CP_12 h and CP_24 h (left to right). CP and CP_4h shows lowest Q with almost similar values at all the three J which could be due to the lower specific surface area of both samples. It can be observed that CP_12 h shows a tremendous increase in Q of nearly 28 % to 140 % at 0.1 mA/cm2 and 1.0 mA/cm2 than that of CP_4 h, being consistent with the described increase of specific surface area and the introduction of microporosity. The latter is deemed to be beneficial for the transport of oxygen [43] and ion diffusion. These results show that the pore structure with micropores (on the surface of carbon fibers) and macropores (already present as free space between fibers) are supportive for catalytic activity for oxygen reduction reaction. CP_24 h shows a further, but less pronounced increase of nearly 11 % to 17 % of Q at 0.1 mA/cm2 and 1.0 mA/cm2 than that of CP_12 h with a three-fold increase of specific surface area due to the introduction of a higher concentration of micropores and an additional small amount of mesopores at around 3 nm and 6 nm. As discussed in literature, mesopores can be assumed to provide additional accommodation sites for the discharge product and enables better gas diffusion [44]. Furthermore, hierarchical pores with numerous micropores connected to open macropores and mesopores where shown to facilitate oxygen and rapid ion diffusion to the surface of the cathode [45]. In line with these findings, the increase in specific surface area found in our experiments can improve the discharge capacity of the cathode due to hierarchical porosity.
Figure 5(b) shows EDS K maps of the KO2 (indicated by red dots) distribution along the cross sections of CP, CP_12h and CP_24 h at J of 0.1 mA/cm2 and 1.0 mA/cm2. It can be observed that the discharge at low J of 0.1 mA/cm2 leads to a rather homogenous distribution of KO2 along the CP cathode. In contrast, discharge at high J of 1.0 mA/cm2 results in the KO2 formation in the regions close to the O2 supply while very little KO2 is observed near the regions close to electrolyte reservoir. This is consistent with oxygen transport limitations at high J [23]. The discharge of CP_12 h at low J of 0.1 mA/cm2 results in higher pore filling with dense KO2 growth along the entire cathode than the CP at J of 0.1 mA/cm2. Discharge of CP_12 h at high J of 1.0 mA/cm2 results in more KO2 formation than that of CP at same J. However, there are still some unoccupied cathode voids that can be observed. CP_24 h after discharge at 0.1 mA/cm2 shows that the entire cathode is fully occupied by KO2 and almost no free macropore voids are visible while at higher J of 1.0 mA/cm2, there is maximum utilization of the cathode free space by KO2 formation across the cathode structure compared to CP and CP_12 h at J of 1.0 mA/cm2. So, the improvement in Q from CP to CP_12 h can be attributed to the introduction of micropores on the surface of carbon fibers while a little improvement in Q from CP_12 h to CP_24 h can be due to the increase of micropores and an additionally implemented amount of mesopores which leads more filling by the KO2 across the cathode. So, the thermal treatment of carbon paper can lead to enhanced Q by enabling homogeneous KO2 distribution and high degrees of pore filling due to an enhanced surface area with the introduction of micropores and mesopores.
Figure 5(c) shows the discharge overpotentials, ηdis with O/C ratios of CP, CP_4 h, CP_12 h and CP_24 (left to right). It can be observed that the ηdis is decreasing with increasing O/C ratio at the three different current densities, with the most pronounced decrease from CP to CP_4 h. We attribute this to a significant increase of O-C=O groups, as the introduction of O-C=O groups was reported decrease in the discharge overpotentials in LOB, accordingly [38,46]. It is believed that the oxygen containing functional groups and defects have a suitable adsorption energy for oxygen molecules [47], thus lowering the activation energy of the rate determining step and then subsequently enhancing the discharge voltage [38]. Transferred to the presented samples here, the reduction of the overpotential may also be caused the oxygen groups in a similar way.

4. Conclusions

In this work, the effect of the thermal pretreatment in air with three different pretreatment times on the discharge performance of a commercially available carbon paper has been studied. The modification in properties, i.e. in surface area, porosity and surface functionality, have been found to enhance the discharge capacity by enabling homogeneous KO2 distribution and high degrees of pore filling. At the same time, introduction of oxygen containing functional surface groups and defects are considered causative for the observed reduction of discharge overpotentials. Theses finding display a promising way to further enhance the overall performance of KOB by microstructural and functional design of carbon based cathodes.

Supplementary Materials

The following supporting information can be downloaded at the website of this paper posted on Preprints.org.

Funding

This research was funded by the Deutsche Forschungsgemeinschaft (DFG, German Research Foundation) – GRK 1856.

Acknowledgments

We are grateful to K. Fries for TEM measurements, Dr. K. Turke, Anton Paar Germany GmbH for the gas adsorption-desorption measurements, and. P. Pöllmann, Materials Chemistry, RWTH Aachen University for the assistance in XPS measurements

Conflicts of Interest

The authors declare no conflicts of interest.

References

  1. Choi, N.S.; Chen, Z.; Freunberger, S.A.; Ji, X.; Sun, Y.K.; Amine, K.; Yushin, G.; Nazar, L.F.; Cho, J.; Bruce, P.G. Challenges facing lithium batteries and electrical double-layer capacitors. Angew Chem Int Ed Engl 2012, 51, 9994–10024. [Google Scholar] [CrossRef] [PubMed]
  2. Girishkumar, G.; McCloskey, B.; Luntz, A.C.; Swanson, S.; Wilcke, W. Lithium−Air Battery: Promise and Challenges. The Journal of Physical Chemistry Letters 2010, 1, 2193–2203. [Google Scholar] [CrossRef]
  3. Ren, X.; Wu, Y. A low-overpotential potassium-oxygen battery based on potassium superoxide. J Am Chem Soc 2013, 135, 2923–2926. [Google Scholar] [CrossRef] [PubMed]
  4. Aurbach, D.; McCloskey, B.D.; Nazar, L.F.; Bruce, P.G. Advances in understanding mechanisms underpinning lithium–air batteries. Nature Energy 2016, 1, 16128. [Google Scholar] [CrossRef]
  5. Yao, X.; Dong, Q.; Cheng, Q.; Wang, D. Why Do Lithium–Oxygen Batteries Fail: Parasitic Chemical Reactions and Their Synergistic Effect. Angewandte Chemie International Edition 2016, 55, 11344–11353. [Google Scholar] [CrossRef] [PubMed]
  6. Mahne, N.; Schafzahl, B.; Leypold, C.; Leypold, M.; Grumm, S.; Leitgeb, A.; Strohmeier, G.A.; Wilkening, M.; Fontaine, O.; Kramer, D.; et al. Singlet oxygen generation as a major cause for parasitic reactions during cycling of aprotic lithium–oxygen batteries. Nature Energy 2017, 2, 17036. [Google Scholar] [CrossRef]
  7. Mourad, E.; Petit, Y.K.; Spezia, R.; Samojlov, A.; Summa, F.F.; Prehal, C.; Leypold, C.; Mahne, N.; Slugovc, C.; Fontaine, O.; et al. Singlet oxygen from cation driven superoxide disproportionation and consequences for aprotic metal–O2 batteries. Energy & Environmental Science 2019, 12, 2559–2568. [Google Scholar] [CrossRef]
  8. Houchins, G.; Pande, V.; Viswanathan, V. Mechanism for Singlet Oxygen Production in Li-Ion and Metal–Air Batteries. ACS Energy Letters 2020, 5, 1893–1899. [Google Scholar] [CrossRef]
  9. Reinsberg, P.H.; Koellisch, A.; Baltruschat, H. On the importance of ion pair formation and the effect of water in potassium–oxygen batteries. Electrochimica Acta 2019, 313, 223–234. [Google Scholar] [CrossRef]
  10. Xiao, N.; Rooney, R.T.; Gewirth, A.A.; Wu, Y. The Long-Term Stability of KO2 in K-O2 Batteries. Angewandte Chemie International Edition 2018, 57, 1227–1231. [Google Scholar] [CrossRef]
  11. Qin, L.; Schkeryantz, L.; Zheng, J.; Xiao, N.; Wu, Y. Superoxide-Based K–O2 Batteries: Highly Reversible Oxygen Redox Solves Challenges in Air Electrodes. Journal of the American Chemical Society 2020, 142, 11629–11640. [Google Scholar] [CrossRef]
  12. Xiao, N.; Ren, X.; McCulloch, W.D.; Gourdin, G.; Wu, Y. Potassium Superoxide: A Unique Alternative for Metal–Air Batteries. Accounts of Chemical Research 2018, 51, 2335–2343. [Google Scholar] [CrossRef]
  13. Park, J.; Hwang, J.-Y.; Kwak, W.-J. Potassium–Oxygen Batteries: Significance, Challenges, and Prospects. The Journal of Physical Chemistry Letters 2020, 11, 7849–7856. [Google Scholar] [CrossRef] [PubMed]
  14. Chen, K.; Yang, D.-Y.; Huang, G.; Zhang, X.-B. Lithium–Air Batteries: Air-Electrochemistry and Anode Stabilization. Accounts of Chemical Research 2021, 54, 632–641. [Google Scholar] [CrossRef]
  15. Ren, X.; Lau, K.C.; Yu, M.; Bi, X.; Kreidler, E.; Curtiss, L.A.; Wu, Y. Understanding Side Reactions in K–O2 Batteries for Improved Cycle Life. ACS Applied Materials & Interfaces 2014, 6, 19299–19307. [Google Scholar] [CrossRef]
  16. Yu, W.; Lau, K.C.; Lei, Y.; Liu, R.; Qin, L.; Yang, W.; Li, B.; Curtiss, L.A.; Zhai, D.; Kang, F. Dendrite-Free Potassium–Oxygen Battery Based on a Liquid Alloy Anode. ACS Applied Materials & Interfaces 2017, 9, 31871–31878. [Google Scholar] [CrossRef]
  17. McCulloch, W.D.; Ren, X.; Yu, M.; Huang, Z.; Wu, Y. Potassium-Ion Oxygen Battery Based on a High Capacity Antimony Anode. ACS Applied Materials & Interfaces 2015, 7, 26158–26166. [Google Scholar] [CrossRef]
  18. Eftekhari, A.; Jian, Z.; Ji, X. Potassium Secondary Batteries. ACS Appl Mater Interfaces 2017, 9, 4404–4419. [Google Scholar] [CrossRef] [PubMed]
  19. Xiao, N.; Gourdin, G.; Wu, Y. Simultaneous Stabilization of Potassium Metal and Superoxide in K–O2 Batteries on the Basis of Electrolyte Reactivity. Angewandte Chemie International Edition 2018, 57, 10864–10867. [Google Scholar] [CrossRef] [PubMed]
  20. Gilmore, P.; Sundaresan, V.B. A Functionally Graded Cathode Architecture for Extending the Cycle-Life of Potassium-Oxygen Batteries. Batteries & Supercaps 2019, 2, 662–662. [Google Scholar]
  21. Cong, G.; Wang, W.; Lai, N.-C.; Liang, Z.; Lu, Y.-C. A high-rate and long-life organic–oxygen battery. Nature Materials 2019, 18, 390–396. [Google Scholar] [CrossRef]
  22. Lee, J.T.; Jo, C.; De Volder, M. Bicontinuous phase separation of lithium-ion battery electrodes for ultrahigh areal loading. Proceedings of the National Academy of Sciences 2020, 117, 21155–21161. [Google Scholar] [CrossRef]
  23. Küpper, J.; Jakobi, S.; Simon, U. PTFE Enhances Discharge Performance of Carbon Cathodes in Potassium-Oxygen Batteries**. Batteries & Supercaps 2021, 4, 1620–1626. [Google Scholar]
  24. Küpper, J.; Simon, U. The effects of oxygen pressure on the discharge performance of potassium–oxygen batteries. Sustainable Energy & Fuels 2022, 6, 1992–2000. [Google Scholar] [CrossRef]
  25. Küpper, J.; Li, X.; Simon, U. A Model of the Potassium-Oxygen Battery and its Application in Cathode Design. Journal of The Electrochemical Society 2022, 169, 060539. [Google Scholar] [CrossRef]
  26. Küpper, J. Enhancing the Discharge Performance of the Potassium-Oxygen Battery. PhD Thesis, RWTH Aachen University, 2022. [Google Scholar]
  27. Liu, H.; Liu, X.; Li, W.; Guo, X.; Wang, Y.; Wang, G.; Zhao, D. Porous Carbon Composites for Next Generation Rechargeable Lithium Batteries. Advanced Energy Materials 2017, 7, 1700283. [Google Scholar] [CrossRef]
  28. Liu, Y.S.; Ma, C.; Wang, K.X.; Chen, J.S. Recent advances in porous carbons for electrochemical energy storage. New Carbon Mater. 2023, 38, 1. [Google Scholar] [CrossRef]
  29. Singh, A.; Yasari, N.; Karan, K.; Roberts, E. Electrocatalytic Activity of Functionalized Carbon Paper Electrodes and Their Correlation to the Fermi Level Derived from Raman Spectra. ACS Applied Energy Materials 2019, 2. [Google Scholar] [CrossRef]
  30. Greco, K.V.; Bonesteel, J.K.; Chanut, N.; Tai-Chieh Wan, C.; Chiang, Y.-M.; Brushett, F.R. Limited Accessibility to Surface Area Generated by Thermal Pretreatment of Electrodes Reduces Its Impact on Redox Flow Battery Performance. ACS Applied Energy Materials 2021, 4, 13516–13527. [Google Scholar] [CrossRef]
  31. Li, Z.; Deng, L.; Kinloch, I.A.; Young, R.J. Raman spectroscopy of carbon materials and their composites: Graphene, nanotubes and fibres. Progress in Materials Science 2023, 135, 101089. [Google Scholar] [CrossRef]
  32. Stankovich, S.; Dikin, D.A.; Piner, R.D.; Kohlhaas, K.A.; Kleinhammes, A.; Jia, Y.; Wu, Y.; Nguyen, S.T.; Ruoff, R.S. Synthesis of graphene-based nanosheets via chemical reduction of exfoliated graphite oxide. Carbon 2007, 45, 1558–1565. [Google Scholar] [CrossRef]
  33. Kwon, S.; Suharto, Y.; Kim, K.J. Facile preparation of an oxygen-functionalized carbon felt electrode to improve VO2+/VO2+ redox chemistry in vanadium redox flow batteries. Journal of Industrial and Engineering Chemistry 2021, 98, 231–236. [Google Scholar] [CrossRef]
  34. Liu, T.; Li, X.; Xu, C.; Zhang, H. Activated Carbon Fiber Paper Based Electrodes with High Electrocatalytic Activity for Vanadium Flow Batteries with Improved Power Density. ACS Applied Materials & Interfaces 2017, 9, 4626–4633. [Google Scholar] [CrossRef]
  35. Yue, Z.R.; Jiang, W.; Wang, L.; Gardner, S.D.; Pittman, C.U. Surface characterization of electrochemically oxidized carbon fibers. Carbon 1999, 37, 1785–1796. [Google Scholar] [CrossRef]
  36. Ulaganathan, M.; Aravindan, V.; Yan, Q.; Madhavi, S.; Skyllas-Kazacos, M.; Lim, T.M. Recent Advancements in All-Vanadium Redox Flow Batteries. Advanced Materials Interfaces 2016, 3, 1500309. [Google Scholar] [CrossRef]
  37. Zeng, L.; Zhao, T.; Wei, L. Revealing the Performance Enhancement of Oxygenated Carbonaceous Materials for Vanadium Redox Flow Batteries: Functional Groups or Specific Surface Area? Advanced Sustainable Systems 2018, 2, 1700148. [Google Scholar] [CrossRef]
  38. Qian, Z.; Sun, B.; Du, L.; Lou, S.; Du, C.; Zuo, P.; Ma, Y.; Cheng, X.; Gao, Y.; Yin, G. Insights into the role of oxygen functional groups and defects in the rechargeable nonaqueous Li–O2 batteries. Electrochimica Acta 2018, 292. [Google Scholar] [CrossRef]
  39. Yang, S.; Li, L.; Xiao, T.; Zheng, D.; Zhang, Y. Role of surface chemistry in modified ACF (activated carbon fiber)-catalyzed peroxymonosulfate oxidation. Applied Surface Science 2016, 383, 142–150. [Google Scholar] [CrossRef]
  40. Pacheco, F.G.; Cotta, A.A.C.; Gorgulho, H.F.; Santos, A.P.; Macedo, W.A.A.; Furtado, C.A. Comparative temporal analysis of multiwalled carbon nanotube oxidation reactions: Evaluating chemical modifications on true nanotube surface. Applied Surface Science 2015, 357, 1015–1023. [Google Scholar] [CrossRef]
  41. Knudsen, K.B.; Nichols, J.E.; Vegge, T.; Luntz, A.C.; McCloskey, B.D.; Hjelm, J. An Electrochemical Impedance Study of the Capacity Limitations in Na–O2 Cells. The Journal of Physical Chemistry C 2016, 120, 10799–10805. [Google Scholar] [CrossRef]
  42. Wang, F.; Li, X. Effects of the Electrode Wettability on the Deep Discharge Capacity of Li–O2 Batteries. ACS Omega 2018, 3, 6006–6012. [Google Scholar] [CrossRef] [PubMed]
  43. Riaz, A.; Jung, K.-N.; Lee, J.-W. A Mini-Review on Non-Aqueous Lithium-Oxygen Batteries - Electrochemistry and Cathode Materials. J. Electrochem. Sci. Technol 2015, 6, 50–58. [Google Scholar] [CrossRef]
  44. Kim, M.; Yoo, E.; Ahn, W.-S.; Shim, S.E. Controlling porosity of porous carbon cathode for lithium oxygen batteries: Influence of micro and meso porosity. Journal of Power Sources 2018, 389, 20–27. [Google Scholar] [CrossRef]
  45. Zhao, T.; Yao, Y.; Yuan, Y.; Wang, M.; Wu, F.; Amine, K.; Lu, J. A universal method to fabricating porous carbon for Li-O2 battery. Nano Energy 2021, 82, 105782. [Google Scholar] [CrossRef]
  46. Huang, S.; Fan, W.; Guo, X.; Meng, F.; Liu, X. Positive role of surface defects on carbon nanotube cathodes in overpotential and capacity retention of rechargeable lithium-oxygen batteries. ACS Appl Mater Interfaces 2014, 6, 21567–21575. [Google Scholar] [CrossRef] [PubMed]
  47. Xiao, J.; Mei, D.; Li, X.; Xu, W.; Wang, D.; Graff, G.L.; Bennett, W.D.; Nie, Z.; Saraf, L.V.; Aksay, I.A.; et al. Hierarchically Porous Graphene as a Lithium–Air Battery Electrode. Nano Letters 2011, 11, 5071–5078. [Google Scholar] [CrossRef]
  48. Dou, Y.; Zhang, Y.; Guo, F.; Shen, Y.; Chen, G.; Wei, Y.; Xie, Z.; Zhou, Z. Hierarchical Porous Carbon Nanotube Spheres for High-performance K-O2 Batteries. Chemical Research in Chinese Universities 2021, 37, 254–258. [Google Scholar] [CrossRef]
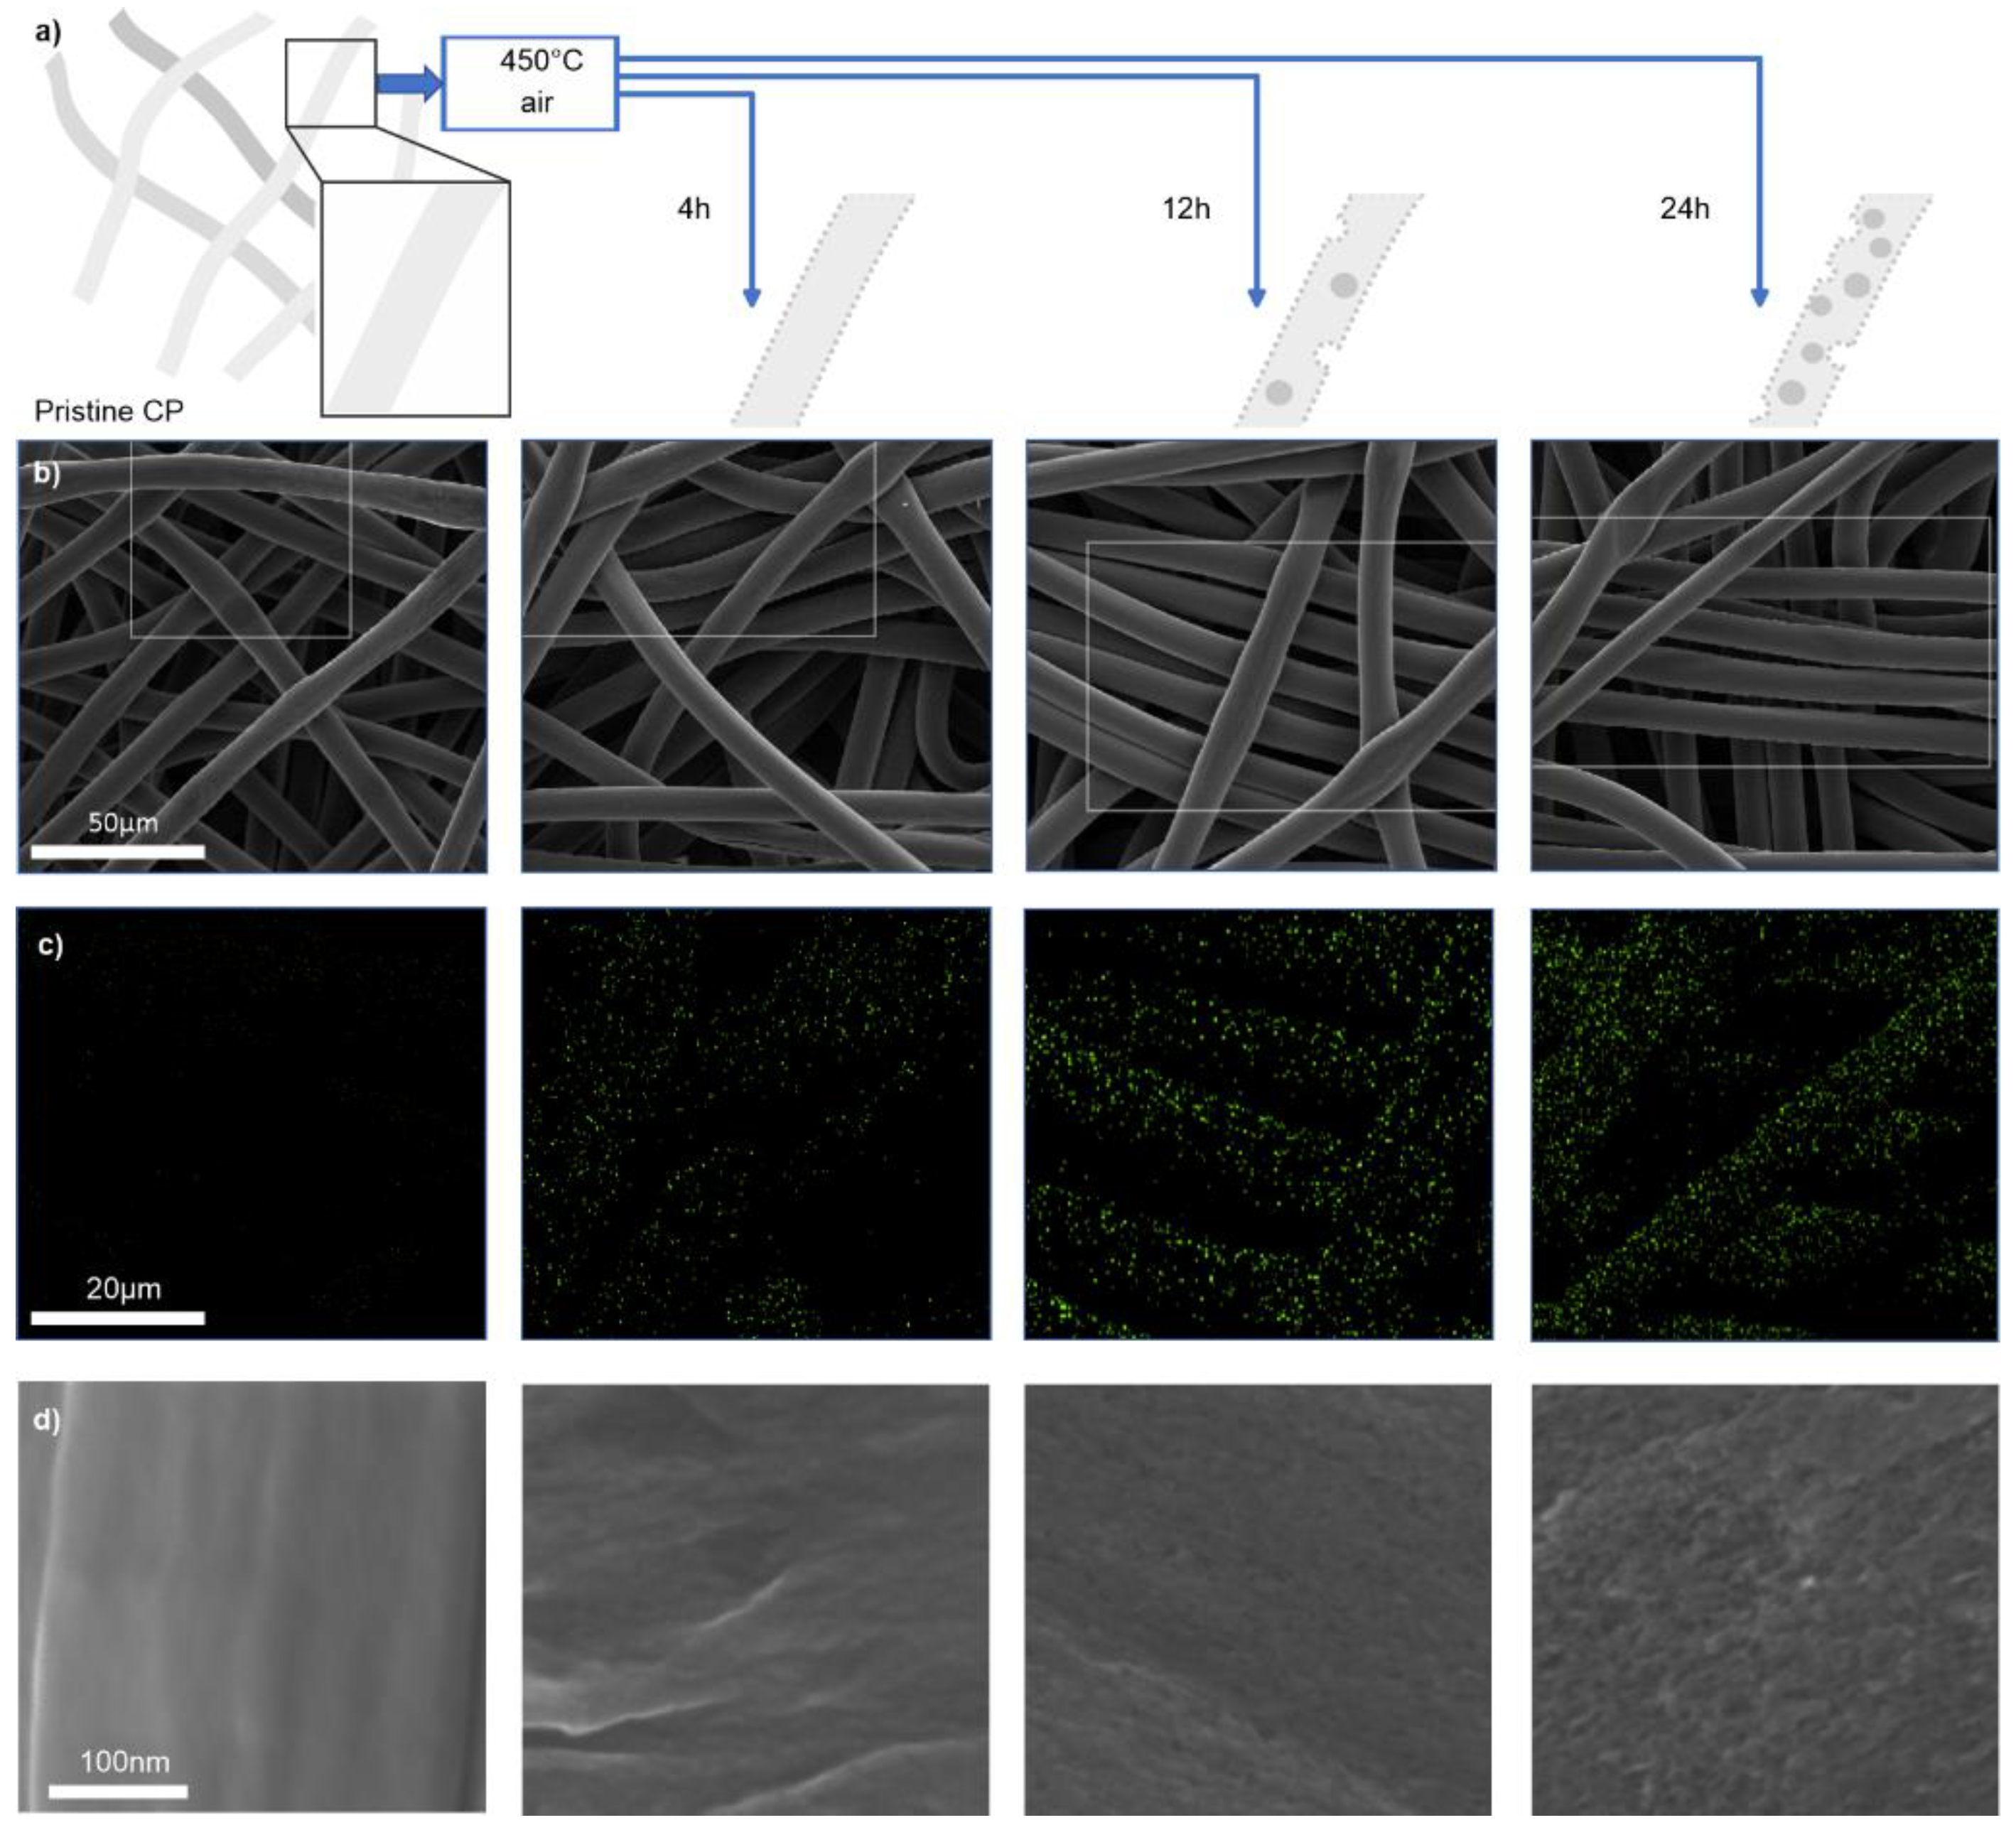
Figure 1. (a) Schematic drawing of the thermal oxidation of carbon paper. Pristine carbon paper consists of interwoven fibers, which show initially a smooth surface. By thermal treatment (4 h, 12 h and 24 h) their surface is intended to be modified in terms of roughness and oxygen containing functional groups. (b) SEM overview images of CP (from left to right: pristine, 4 h, 12 h and 24 h treatment) with (c) their respective EDS mappings of oxygen. (d) Higher magnified SEM images. Scale bars apply to each row. Full mappings and sum spectra of the investigated areas can be found in Figure S2.
Preprints 104760 g001
Figure 2. (a) Full survey spectra of CP, CP_4 h, CP_12 h, and CP_24 h. (b) O/C ratio calculated from integrals of O 1s and C 1s peaks of CP and CP_4 h, CP_12 h and CP_24 h.
Preprints 104760 g002
Figure 3. Discharge profiles for KOB cells with cathode samples (a) CP, (b) CP_4 h, (c) CP_12 h, and (d) CP_24 h for J = 0.1 mA/cm2 (pink), J = 0.5 mA/cm2 (blue), and J = 1.0 mA/cm2 (green). The dashed black line indicated the open circuit potential E°(KBp/O2) = 2.18 V.
Preprints 104760 g003
Figure 4. Bar plot of the specific double-layer capacitance Csp and the specific surface area of the samples CP, CP_4 h, CP_12 h and CP_24 h.
Preprints 104760 g004
Figure 5. (a) Discharge capacity, Q plotted versus the specific surface area determined by BET for CP, CP_4 h, CP_12 h and CP_24 h at J = 0.1 mA/cm2 (pink), J = 0.5 mA/cm2 (blue), and J = 1.0 mA/cm2 (green). Dashed lines serve as guidance for the eye. (b) Cross-sectional SEM images of cathode samples with overlaid K_K EDS maps (red dots). The rows show the micrographs for CP, CP_12 h and CP_24 h after discharge at J = 0.1 mA/cm2 (pink framed) and J = 1.0 mA/cm2 (green framed). (c) Discharge overpotentials, ηdis plotted versus the O/C-ratios of CP, CP_4 h, CP_12 h and CP_24 h at J = 0.1 mA/cm2 (pink), J = 0.5 mA/cm2 (blue), and J = 1.0 mA/cm2 (green). Dashed lines serve as guidance for the eye. The values of Q and ηdis are given in Table S1.
Preprints 104760 g005
Table 1. Summary of the micropore area, external surface area and specific surface area of all cathode samples.
Cathode sample Micropore area (m2/g) External surface area (m2/g) Specific surface area (m2/g)
CP - - 0.33
CP_4 h - - 1.2
CP_12 h 26 3 29
CP_24 h 75.7 18.2 90
Disclaimer/Publisher’s Note: The statements, opinions and data contained in all publications are solely those of the individual author(s) and contributor(s) and not of MDPI and/or the editor(s). MDPI and/or the editor(s) disclaim responsibility for any injury to people or property resulting from any ideas, methods, instructions or products referred to in the content.
Copyright: This open access article is published under a Creative Commons CC BY 4.0 license, which permit the free download, distribution, and reuse, provided that the author and preprint are cited in any reuse.
Prerpints.org logo

Preprints.org is a free preprint server supported by MDPI in Basel, Switzerland.

Subscribe

© 2024 MDPI (Basel, Switzerland) unless otherwise stated