Preprint
Article

Using a Combination of Novel Research Tools to Understand Social Interaction in the Drosophila melanogaster Model for Fragile X Syndrome

Altmetrics

Downloads

106

Views

84

Comments

0

A peer-reviewed article of this preprint also exists.

Submitted:

24 April 2024

Posted:

25 April 2024

You are already at the latest version

Alerts
Abstract
Fragile X syndrome (FXS), the most common monogenic cause of inherited intellectual disability and autism spectrum disorder, is caused by a full mutation (>200 CGG repeats) in the Fragile X Messenger Ribonucleoprotein 1 (FMR1) gene. Individuals with FXS experience a wide range of challenges related to social interaction (SI). Animal models, such as Drosophila melanogaster model for FXS where the only ortholog of human FMR1 (dFMR1) is mutated, have played a crucial role in understanding of FXS. The aim of this study was to investigate SI in the dFMR1B55 mutants using the novel Drosophila Shallow Chamber and a Python data processing pipeline based on social network analysis (SNA). In comparison with wild-type flies (w1118), SNA analysis in dFMR1B55 mutants revealed hypoactivity, fewer connections in their networks, a lower ability to efficiently transmit information, fewer alternative pathways for information transmission, a higher variability in the number of interactions they achieved, and tended to stay near the boundaries of the testing chamber. These observed alterations indicate the presence of characteristic strain-dependent social networks in dFMR1B55 flies, commonly referred to as the group phenotype. Finally, a combination of novel research tools is a valuable method for SI research in fruit flies.
Keywords: 
Subject: Biology and Life Sciences  -   Behavioral Sciences

1. Introduction

Social interactions (SIs) include a wide range of interactions among individuals and play a fundamental role in their lives. These interactions can be complex and diverse, often involving a range of behaviors, such as mating, aggression, dominance, vocalizations, body language, etc. [1]. Over time, as individuals within the group interact with each other, specific patterns and dynamics emerge. Disruption in normal social behavior and SI is a common feature of various human diseases and conditions, such as neurodevelopmental disorders [2]. An example of neurodevelopmental disorder which is characterized by impaired SI is fragile X syndrome (FXS).
FXS is caused by a full mutation (>200 CGG trinucleotide repeats) in the Fragile X Messenger Ribonucleoprotein 1 (FMR1) gene and is the most common monogenic cause of inherited intellectual disability and autism spectrum disorder [3]. Among other symptoms, individuals with FXS experience a wide range of challenges related to SI including challenges in maintaining eye contact, shyness, social anxiety, social withdrawal, and social avoidance [4,5]. Impairment of SI often causes daily struggles that significantly impact the ability of FXS individuals to engage in typical daily activities [6].
Animal models have played a crucial role in advancing the understanding of FXS. Commonly used animal models include Fmr1 knock-out (KO) mice, Fmr1 KO zebrafish, and the Drosophila melanogaster (D. melanogaster) model of FXS, where the only ortholog of human FMR1 (dFMR1) is mutated [7,8,9,10,11]. D. melanogaster, commonly known as the fruit fly, has a well-characterized nervous system and genetic manipulations can be performed to mimic the genetic mutations associated with FXS. D. melanogaster represents a valuable model for understanding the molecular and neurological aspects of the syndrome [9,10]. It is well known that phenotypes in dFMR1 mutants closely resemble the phenotypes in individuals with FXS. For example, dFMR1 mutants display arrhythmic circadian rhythm, abnormal locomotor activity and learning and memory deficits, similar to the symptoms of FXS [12,13,14]. Despite D. melanogaster being an excellent model for studying FXS, there are currently limited data on SI in this model. On the other hand, there are studies that described SI in other fruit fly models. For example, SI impairments were described in orco, lush, and or65a mutants [15,16,17]. Exploring and collecting more information on SI in the D. melanogaster model of FXS could significantly enhance FXS research and contribute to the preclinical evaluation of drug effects in this condition.
The aim of this study was to investigate, analyze and describe SI in the FXS model of D. melanogaster using the novel chamber and a Python data processing pipeline based on social network analysis (SNA).

2. Materials and Methods

2.1. Flies

The dFMR1B55 allele was generated by imprecise excision of the EP(3)3422 element that caused a 2.5 kb deletion of dFMR1 genomic DNA including the ATG and the first 59 codons [18]. Thus, B55 is a protein null allele. dFMR1B55 flies are homozygous viable and fertile. The wild-type w1118 flies were used as a control group in all experiments.
D. melanogaster stocks were reared on standard cornmeal/molasses/agar medium at 25°C and at a relative humidity of 60% under a 12 h light/12 h dark cycle [19]. At the time of eclosion, flies were collected under light anesthesia (CO2) and grouped by age. Each vial contained 30 flies (15 of each sex), which were kept in an incubator until they reached the age of 3-5 days after which, they were used in the experiment [19]. On the day of the experiment, the flies were transferred from the vials to the arena using an aspirator and left for 15 minutes to habituate [20]. To minimize performance variability linked to circadian rhythm, all experiments were done in the afternoon, between ZT5 and ZT9 [19].

2.2. Drosophila Shallow Chamber

The Drosophila Shallow Chamber (Maze Engineers, USA) is designed to restrict D. melanogaster flies to a shallow space to create a monolayer of individuals for behavioral analysis. The chamber is cylindrical and composed of clear acrylic with a diameter of 13 cm and a 3.5 mm high glass ceiling coated with silicone paint. The chamber is surrounded by translucent checkered black and white paper. The walls of the chamber slope at an 11-degree angle downwards, preventing the subjects from gathering on the ceiling of the chamber. Backlighting underneath the chamber features a 12x12 inch fluorescent light array of 850 nm LEDs.

2.3. Experimental Design

Video recording of 30 adult flies in each group was performed in Drosophila Shallow Chamber (described in 2.2). Movies were recorded for 15 minutes at 60 frames per second [17]. In total, 15 dFMR1B55 and 15 w1118 separate groups of flies were recorded and tested. The chamber and the cover were cleaned with 75% ethanol between each experiment to remove potential residues [21].

2.4. Data Analysis

2.4.1. Fly Tracking

Fly tracking was done using the open source software Caltech FlyTracker 1.1.2, developed using MATLAB. FlyTracker is a reliable tracking tool which provides the position and orientation data for multiple flies in each video frame and maintains their identities [22]. It outputs trajectories and features such as velocity, facing angles to other flies and wing angles [23,24]. Manual verification of identity swapping in trackings was performed in a randomly selected sample of 300 frames and no loss or swap of identities was recorded.

2.4.2. Construction of Social Interaction Networks (SINs) and Social Network Analysis (SNA)

A Python data processing pipeline was developed for the dual purposes of calculating activity levels, which encompass total distance walked and average velocity, and for the construction and analysis of Social Interaction Networks (SINs) [25].
SINs are depicted as weighted graphs G = (V, E), comprising two distinct sets. In V, nodes (vertices) represent individual files, while E consists of links (edges) with associated weights, quantifying interactions between flies. We have introduced two weight factors: (i) the count of interactions and (ii) the total interaction duration. Specifically, every interaction between files is represented by a single link, where the weight reflects both the count of different interactions and the cumulative interaction duration. This approach determines the weights of links within the network for each fly, accounting for the number of interactions and the total interaction duration during the 15-minute video [25]. Due to the large number of interactions, Social Network Analysis (SNA) was performed using a temporal network analysis in which each minute of the experiment is represented by a separate network snapshot [26]. Measurements were then taken across each representation of networks, which were summarized in the distribution for each group.
The criteria for SI were: (i) the distance between flies is within two and a half body lengths, (ii) the angle between flies is less than 160º, and (iii) previous conditions are met for a duration longer than 0.6 seconds [24].
SINs of the two investigated groups were analyzed using the following measures:
Total edges represent the overall number of edges (interactions) among nodes (flies). The measure represents total number of interactions during the experiment;
The Average degree refers to the number of edges (interactions) connected to a single node (fly). It measures the average number of interactions per fly in the network [25].
Average strength: In networks with weighted edges, strength is the sum of all edge (interaction) weights connected to node (fly). In-strength refers to the sum of all edge (interaction) weights a node (fly) receives, and out-strength refers to the sum of all edge (interaction) weights a node (fly) outputs [24].
Network density: The proportion of how many connections in a network exist compared to the number of theoretically possible connections. In other words, it indicates how closely interconnected the nodes (flies) are within a network [17].
Global efficiency: Distinguishes whether the overall network has shorter or longer paths between nodes (flies) and measures how efficiently information can be transferred across a network [24].
Degree heterogeneity: Measures the diversity in the node (fly) degrees and the diversity in the structure of the network [25].
Degree assortativity: Measures whether nodes (flies) with similar degrees are more likely to interact with each other, or there is a preference for nodes (flies) with a different degree. A positive assortativity indicates that nodes (flies) with similar degrees are more likely to interact, while a negative assortativity indicates that nodes (flies) with different degree are more likely to interact [27].
Transitivity: Refers to the tendency for nodes (flies) to form clusters or triangles within the network. It assesses the likelihood that if two nodes (flies) are connected to the same node (fly), they are also connected to each other [28].
Average clustering coefficient: Quantifies the degree to which nodes (flies) in a network tend to cluster together. It assesses how interconnected nodes are to one another [26].
Average betweenness centrality: Quantifies the importance of a node (fly) within a network. In other words, a fly with high betweenness centrality bridges information flow between different parts of the network [17].
Average closeness centrality: Measures how close a fly (node) is to other flies (nodes) in the network. High closeness centrality means that more flies are relatively close to other flies in the network [26].
Modularity: A measure used to assess the degree of community structure or clustering within a network. It evaluates how well a network can be divided into distinct groups of nodes (flies) that have more interactions within the same group than with nodes outside the group [17].

2.4.3. Localization of Social Interactions

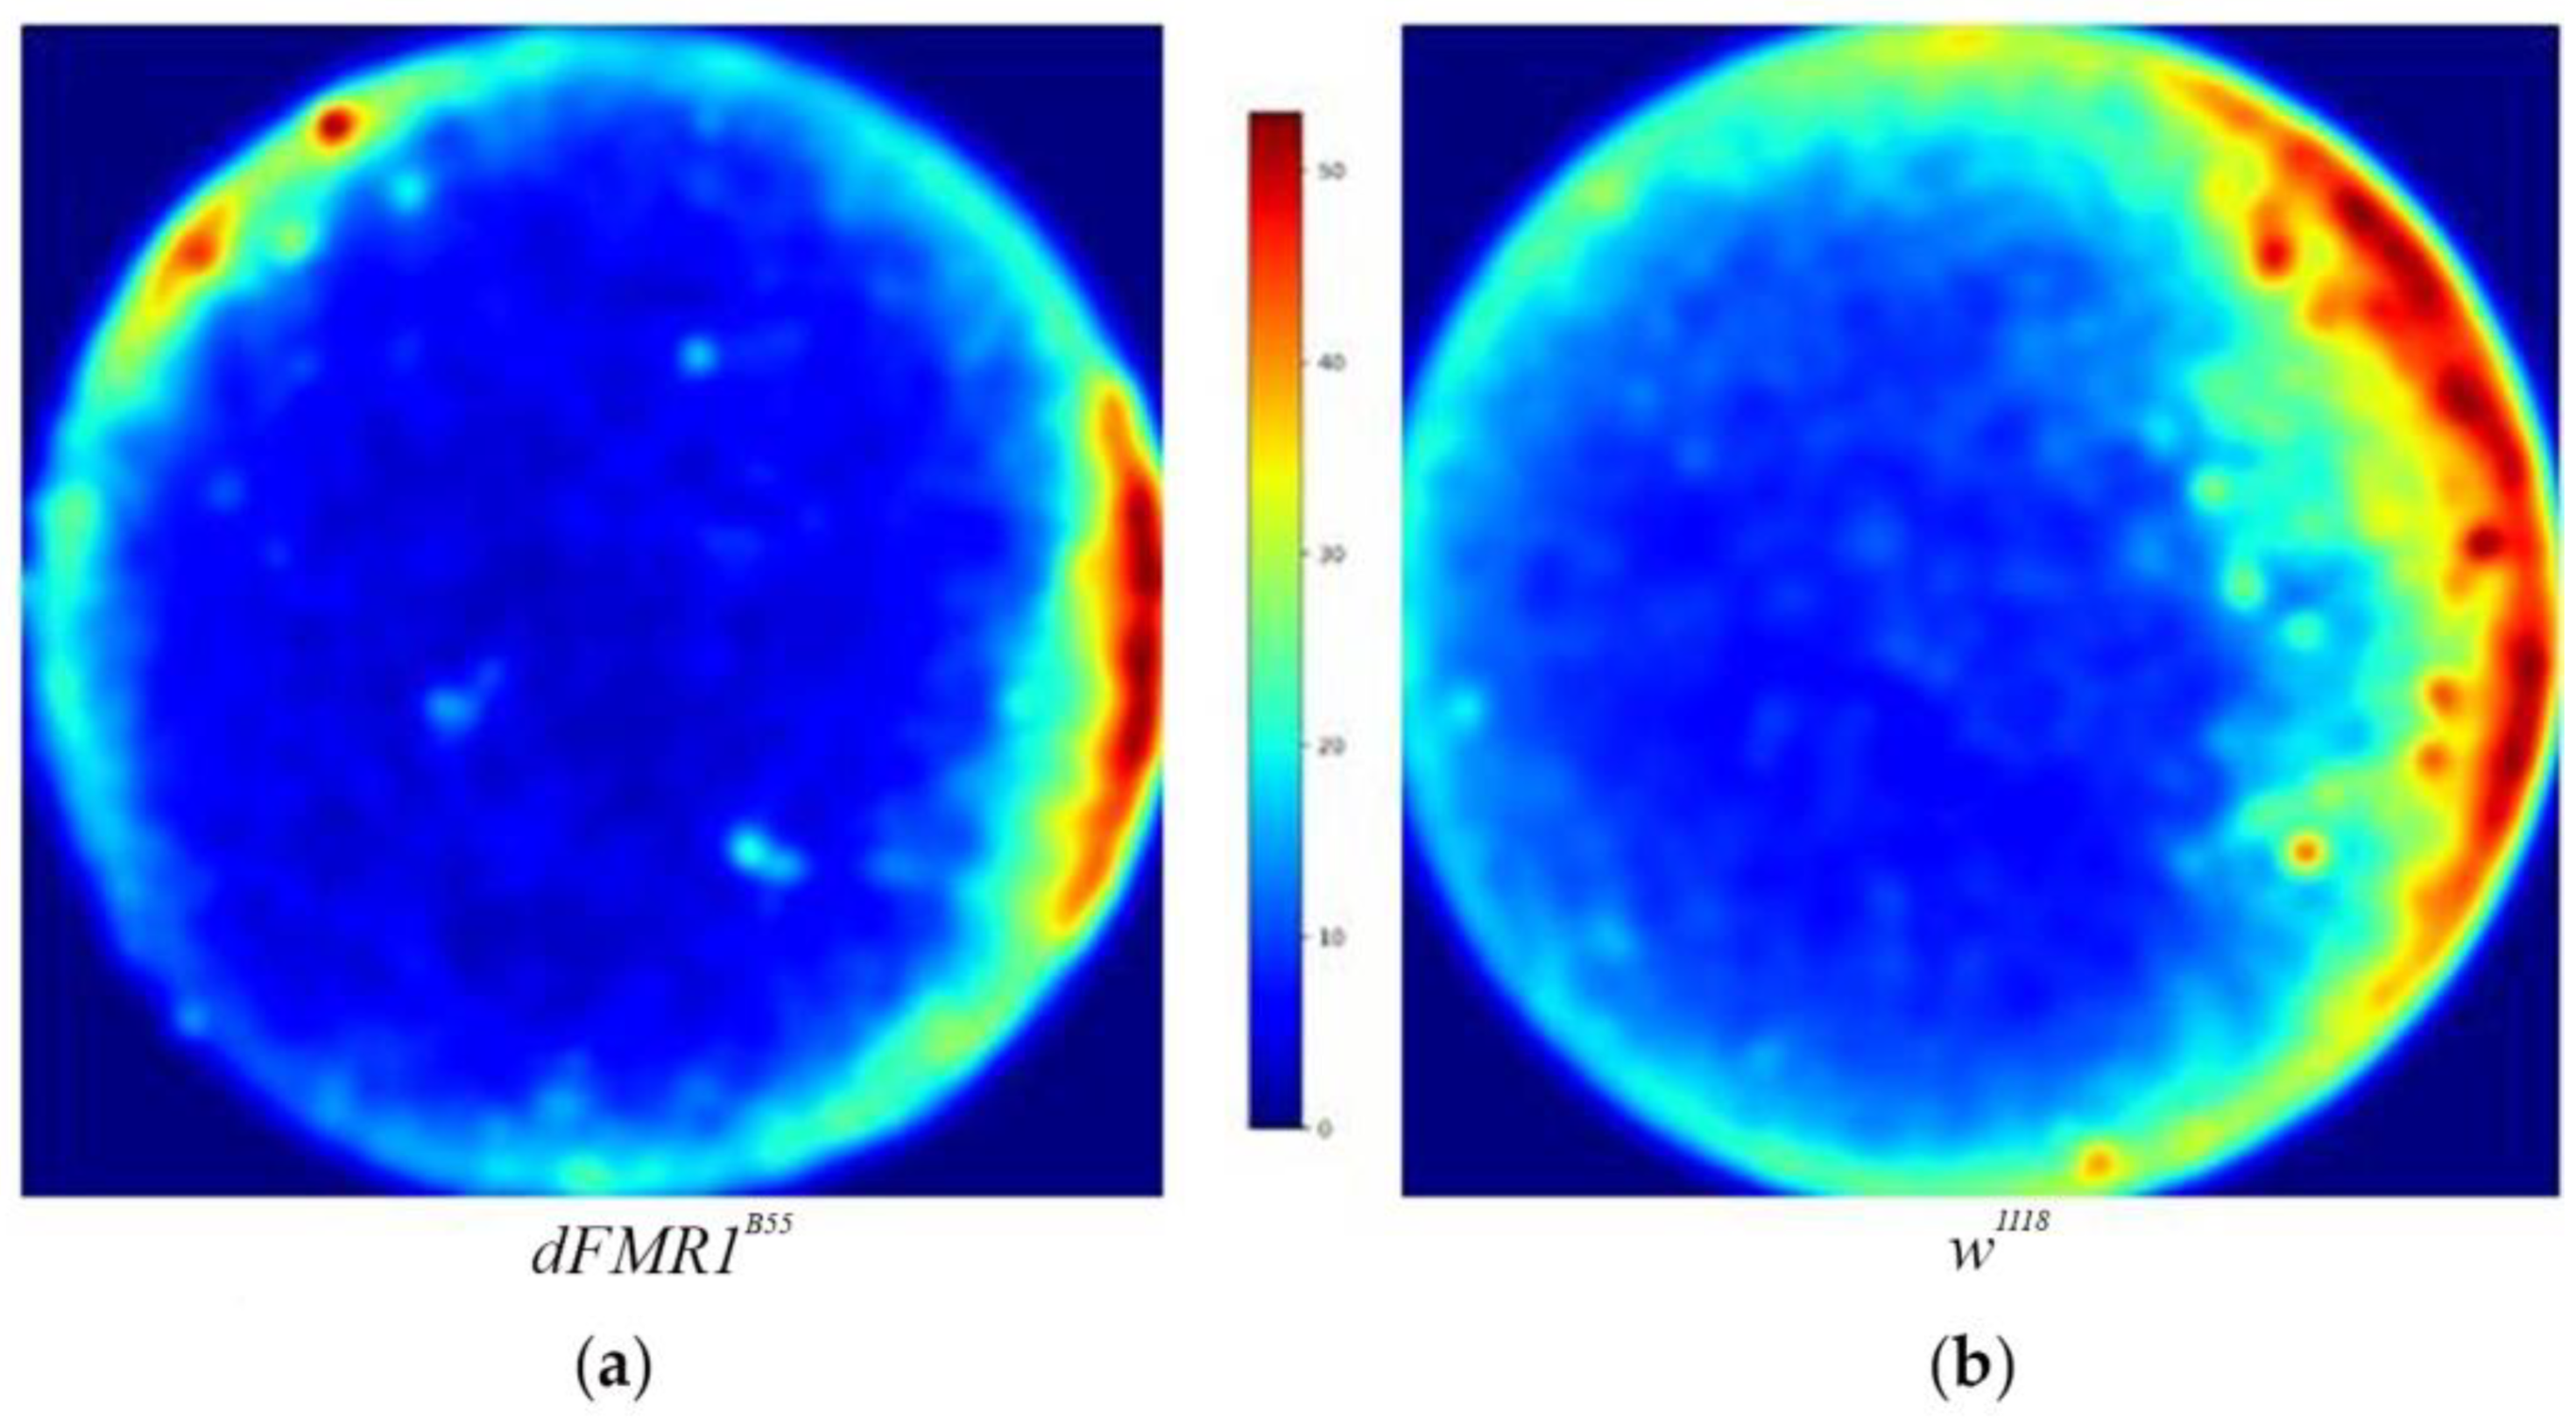
To determine the frequency of interactions in relation to the localization within the chamber, a heatmaps were generated using the Matplotlib library in Python [25].

2.4.4. Statistical Analysis

Statistical analysis was performed using GraphPad Prism 8.0 (GraphPad Software, Inc., San Diego, CA). Data were presented as the mean ± standard error (S. E.) of the mean. The differences between the groups were analyzed using an unpaired Student's t-test. p < 0.05 was considered statistically significant.

3. Results

The results of the activity and SNA are summarized and presented in Figure 1.

3.1. Activity Analysis

dFMR1B55 flies, compared to the control w1118 group, showed statistically significant decreased activity levels, manifested by lower total distance traveled (Figure 1a; 17,436.00 ± 1,688.00 mm vs. 30,642.00 ± 2,408.00 mm; p<0.0001, t = 4.54) and lower average velocity (Figure 1b; 4.65 ± 0.45 vs. 8.17 ± 0.64; p<0.0001, t = 4.54).

3.2. Social Network Analysis (SNA)

Total edges. The number of interactions (total edges) was statistically significantly lower in dFMR1B55 mutants (Figure 1c; 339.20 ± 4.57 vs. 231.00 ± 6.42; p<0.0001, t = 13.57).
Average degree. Likewise, the average number of interactions that the fly has participated in, presented as average degree, was statistically significantly lower in the dFMR1B55 than in the w1118 group (Figure 1d; 15.95 ± 0.44 vs. 22.75 ± 0.30; p<0.0001, t = 12.67).
Average strength. Analysis of average in-strength and average out-strength by number of interactions has demonstrated that the dFMR1B55 group had initiated and received statistically significantly fewer interactions (Figure 1e; 16.42 ± 0.75 vs. 19.23 ± 0.31; p<0.0001, t = 3.40; both). However, analysis of average in-strength and average out-strength by duration revealed statistically significantly higher values in the dFMR1B55 group (Figure 1f; average in-strength: 3,252.00 ± 181.00 vs. 1,663.00 ± 43.79; p<0.0001, t = 8.29; both).
Network density. Network density was statistically significantly reduced in dFMR1B55 mutants compared to w1118 flies (Figure 1g; 0.27 ± 0.01 vs. 0.40 ± 0.01; p<0.0001, t = 11.47).
Global efficiency. The global efficiency of dFMR1B55 was statistically significantly lower when compared to the w1118 networks (Figure 1h; 0.61 ± 0.01 vs. 0.71 ± 0.00; p<0.0001, t = 12.85).
Heterogeneity. There was a statistically significantly higher degree of heterogeneity in the dFMR1B55 group relative to the w1118 fly groups (Figure 1i; 0.44 ± 0.01 vs. 0.29 ± 0.01; p<0.0001, t = 16.80).
Assortativity. Additionally, assortativity was statistically significantly higher in the dFMR1B55 groups than in the w1118 groups (Figure 1j; 0.06 ± 0.01 vs. - 0.02 ± 0.01; p<0.0001, t = 6.87).
Transitivity. Transitivity did not show statistically significant differences between the dFMR1B55 and w1118 groups (Figure 1k; 0.47 ± 0.01 vs. 0.47 ± 0.01; p = 0.95, t = 0.46).
Average clustering coefficient. Similarly, the clustering coefficient showed no statistically significant difference between the two tested groups (Figure 1l; 0.47 ± 0.01 vs. 0.48 ± 0.00; p = 0.81, t = 0.24). However, analysis of the clustering coefficient weighted for the duration of interactions showed that dFMR1B55 flies have a higher clustering coefficient than w1118 (0.06 ± 0.00 vs. 0.05 ± 0.00; p<0.0001, t = 4.04).
Average betweenness centrality. dFMR1B55 flies showed statistically significantly higher betweenness centrality than w1118 (Figure 1m; 0.04 ± 0.00 vs. 0.02 ± 0.00; p<0.0001, t = 0.24). Similar results were obtained when weights for the count and duration were applied (weight = count: 0.05 ± 0.00 vs. 0.03 ± 0.00; p<0.0001, t = 20.22; weight = duration: 0.06 ± 0.00 vs. 0.04 ± 0.00; p<0.0001, t = 4.04).
Average closseness centrality. Average closeness centrality was statistically significantly lower for SINs in the dFMR1B55 groups than in the w1118 groups (Figure 1n; 0.56 ± 0.00 vs. 0.61 ± 0.00; p<0.0001, t = 10.31). Similar results were obtained when weight for count or duration were applied (weight = count: 0.48 ± 0.00 vs. 0.52 ± 0.00; p<0.0001, t = 9.17; weight = duration: 0.01 ± 0.00 vs. 0.01 ± 0.00; p<0.0001, t = 18.44).
Modularity. Modularity was statistically significantly higher in the dFMR1B55 than in w1118 groups (Figure 1o; 0.21 ± 0.00 vs. 0.17 ± 0.00; p<0.0001, t = 8.55). Similar results were obtained when weight for count or duration were applied (weight = count: 0.24 ± 0.00 vs. 0.19 ± 0.00; p<0.0001, t = 8.09; weight = duration: 0.26 ± 0.01 vs. 0.21 ± 0.01; p<0.0001, t = 5.92).

3.3. Localization of Social Interactions

Using a heatmaps we were able to better visualize the location of interactions. Both groups of flies show a preference for the arena boundaries, a phenomenon known as thigmotaxis [29]. Although we did not perform additional statistical analysis, it appears that dFMR1B55 have a lower number of interactions and they tended to aggregate closer to the arena edges (Figure 2).

4. Discussion

The current study is among the first studies that describe in detail impaired SI in the FXS model of D. melanogaster. According to our results, dFMR1B55 flies demonstrated hypoactivity, fewer connections in their networks, a lower ability to efficiently transmit information due to fewer alternative pathways for information transmission, a higher variability in the number of interactions they achieved among themselves, and tended to stay near the boundaries of the testing chamber. However, they mostly interacted with individuals who had a similar number of interactions. In addition, the distances among them were longer and the spread of information was slower. Interestingly, our results suggested that there were individual dFMR1B55 flies in the network that played important roles as intermediaries connecting different parts of the network and higher modularity suggests that a dFMR1B55 network can be divided into distinct communities with more connections within the community than outside of it. On the other hand, two groups of flies (wild-type and dFMR1B55) exhibited similar local connectivity patterns. Briefly, dFMR1B55 flies achieved a lower total and average number of SIs, and exhibited alterations in various SIN measures compared to wild-type flies. These alterations suggest changes in mobility, connectivity, and overall network organization in dFMR1B55 flies.
In contrast to previous studies that researched SI in dFMR1 mutants, all presented results obtained in the current study were based on SNA as a powerful statistical tool. SNA has been used in the last 20 years to analyze the collective animal behaviors and to identify patterns of SI in groups (reviewed in: [30]). There has also been a growing interest in utilizing SNA to examine the social behavior of D. melanogaster [15,21,24,26,30,31,32,33,34]. In addition, our study, for the first time, provides results of SI in the FXS model of fruit flies obtained using a combination of novel tools: the Drosophila Shallow Chamber and the open-source Python data processing pipeline for analysis of SI in D. melanogaster. Specifically, a validation of SNA in research with fruit flies, as a method that was chosen and used in the current study, was recently published [25].
Only a few studies focused on SI in the D. melanogaster model of FXS (reviewed in: [9]). Dockendorf et al. (2002) showed that dFMR1B55 mutants exhibit altered courtship and mating behavior [12]. Male flies failed to advance to more intricate phases of courtship beyond following and tapping, resulting in shorter time spent in courtship activities [12,35]. These findings may resemble the loss of interest to engage in SI, which is frequently present in humans with FXS [12,36]. In addition, Bolduc et al. (2010) used a different methodology to study SI in dFMR1B55 and dFMR13 mutants [37]. Specifically, they used two chambers separated by a plastic mesh to research parameters related to SI and demonstrated that both dFMR1 mutants and control groups tended to stay near the boundaries of the testing chamber. This behavior, known as thigmotaxis, has been well-documented and observed in fruit flies [37,38]. Our results are in accordance with previous observations and confirmed the presence of thigmotaxis in dFMR1B55 using a novel Shallow Chamber. The Shallow Chamber was developed by Maze Engineers to study groups of flies using a design to avoid the flies from obscuring one another. In addition, Bolduc et al. (2010) showed hypoactivity in both dFMR1 mutants, which is consistent with our data [37]. Hypoactivity was also previously found in dFMR1 larvae [39]. Furthermore, the likelihood of SI, measured by the interfly distance, was lower in dFMR1B55 than in wild-type flies [37]. This is in line with our findings: dFMR1B55 flies had a lower number of interactions with greater interfly distance, shown through lower closeness centrality. Moreover, it was shown that dFMR1 mutants and wild-type flies display different spatial distributions within the chamber. Wild-type flies were uniformly distributed, while dFMR1B55 flies preferred the chamber interior [37]. Interestingly, dFMR13 mutants showed a phenotype with shared characteristics of both dFMR1B55 and wild-type flies. Our results also indicate a uniform distribution of wild-type flies in the social network. Lower betweenness centrality and lower modularity primarily mean that each fly is equally important in the information transmission process and that wild-type SINs are more uniform than dFMR1B55 SINs. Additionally, researchers previously noticed that dFMR1B55 flies made frequent, irregular stops. Such a behavior was described as an arrhythmic phenotype by Dockendorff and colleagues in 2002 and Bolduc and colleagues in 2010 [12,37]. This behavior, described as a basic form of dyspraxia, agrees with a decreased receptive response observed in dFMR1B55 flies [12,37]. While the SNA that was used in our study does not provide information regarding the regularity and duration of individual stops out of SI, other results in our study are consistent with limited data of SI in the FXS model of D. melanogaster. However, our results provide more data about their mutual interactions, as well as their role in the social network over time.
The importance of the current research on SI in the Drosophila FXS model is based on the fact that the social network structure is highly influenced by genotype [15,24,31,32]. Different D. melanogaster strains exhibit differences in SINs, indicating the potential influence of genes on SIN structure [31]. Wice and Saltz (2021) analyzed five commonly studied SIN measures (in-strength, out-strength, clustering coefficient, and betweenness centrality) in 40 randomly chosen inbred lines of flies [24]. They confirmed that individual’s genotype was a significant indicator for all network measures examined [24]. The authors calculated broad-sense heritability, a genetic parameter used to estimate the proportion of phenotypic variation due to genetic factors [40]. Betweenness centrality displayed the highest broad-sense heritability, with genotype accounting for about 17% of the variation in this network measure [24]. Additionally, Wice and Saltz (2023) demonstrated that SIN measures depend on the individual’s genotype and also on the genotypes of other individuals within the network [24,32]. Furthermore, Alwash et al. (2021) investigated the characteristics of SI in flies mutated in for, a pleiotropic gene regulating several metabolic, physiological and behavioral phenotypes [31]. They demonstrated that the positions within the group are inherited and that the flies form SINs are robust over time [31]. These SINs are characteristic strain-dependent social networks and are known as group phenotype [31]. Here, we described in details that the genotype that was in our focus (dFMR1 mutants) plays a crucial role in SI and suggest that dFMR1 models could be used in various biomedical and pharmacological studies which are based on SI impairment.
Apart from genetic factors, variation in SINs could be due to other factors, such as social experience. Jezovitz et al. (2021) compared the results of studies that focused on social networks in D. melanogaster, and observed that, despite methodological differences, studies agree that isolated flies exhibit distinctly altered SINs [30]. Isolated flies form SINs with increased global efficiency and lower betweenness centrality and these characteristics are recorded regardless of fly age [15,23,30,33]. Moreover, significant variability across all SIN measures in isolated flies could suggest that a lack of social experience results in less predictable networks [30]. Although, in the current study, dFMR1 mutants were not isolated, variability of a few SIN measures was also observed in these mutants. These findings suggested that variability of some SIN measures is influenced by other factors in addition to isolation. Thus, further behavioral and molecular studies are needed to identify more details in SI impairments in dFMR1 mutants, as an excellent model for pharmacological screening studies.

5. Conclusions

We can conclude that a combination of Drosophila Shallow Chamber and SNA is a valuable method for SI research in fruit flies. Using this method, we demonstrated that dFMR1B55 mutants are characterized by SI impairment and established a group phenotype of this model. These findings could enable a better understanding of SI in dFMR1B55 and the potential development of pharmacological research and rapid pharmacological screening in the field of FXS. There is no approved targeted treatment for FXS, and the validation of the dFMR1B55 model would contribute to targeted treatment development in the field of FXS.

Author Contributions

M.S.: data curation, formal analyses, investigation, visualization, writing – original draft preparation; M.P.: formal analyses, methodology and software; M.C.: writing-review & editing; S.M. and V.M. writing – original draft, D.B. - writing-review & editing; L.C. and S.H. methodology and writing-review & editing; D.P.: conceptualization, funding acquisition, methodology, project administration, supervision; writing-review & editing. All authors have read and agreed to the published version of the manuscript.

Funding

This research was funded by the Science Fund of the Republic of Serbia, Program IDEA, GRANT No. 7673781. The authors of the publication are responsible for the content of this publication and this content does not express the attitudes of the Science Fund of the Republic of Serbia. The research is also supported by project No. 451-03-66/2024-03/200110, The Ministry of Science, Technological Development and Innovation of the Republic of Serbia.

Institutional Review Board Statement

No institutional ethical approval is required for experiments with Drosophila melanogaster.

Data Availability Statement

Data will be made available upon request.

Acknowledgments

We would like to thank Mrs. Nevena Pejovic Strahinja from Department of Pharmacology, Clinical Pharmacology and Toxicology, Faculty of Medicine University of Belgrade (www.polyfrax.com) for technical support during this study.

Conflicts of Interest

L.C. employment: Maze Engineers and ConductScience. S.H. Employment: Mass General Physician Organization. Mass General Institute of Health Professions; unrelated: Research Funding: Foundation for Opioid Response Efforts (FORE). Consulting Fees: Maze Engineers, ConductScience Inc, VIO Med Spa New England, Sci Sprout LLC. No other disclosures are reported. SH is a volunteer at Emojination, Health Tech Without Borders. All other authors declare no conflict of interest.

References

  1. Young, S.N. The neurobiology of human social behaviour: an important but neglected topic. J Psychiatry Neurosci 2008, 33, 391–2. [Google Scholar]
  2. Porcelli, S.; Van Der Wee, N.; van der Werff, S.; Aghajani, M.; Glennon, J.C.; van Heukelum, S.; et al. Social brain, social dysfunction and social withdrawal. Neuroscience & Biobehavioral Reviews 2019, 97, 10–33. [Google Scholar] [CrossRef]
  3. Santoro, M.R.; Bray, S.M.; Warren, S.T. Molecular mechanisms of fragile X syndrome: a twenty-year perspective. Annu Rev Pathol 2012, 7, 219–45. [Google Scholar] [CrossRef] [PubMed]
  4. Kaufmann, W.E.; Cortell, R.; Kau, A.S.; Bukelis, I.; Tierney, E.; Gray, R.M. , et al. Autism spectrum disorder in fragile X syndrome: communication, social interaction, and specific behaviors. Am J Med Genet A 2004, 129a, 225–34. [Google Scholar] [CrossRef]
  5. Cregenzán-Royo, O.; Brun-Gasca, C.; Fornieles-Deu, A. Behavior Problems and Social Competence in Fragile X Syndrome: A Systematic Review. Genes (Basel) 2022, 13. [Google Scholar] [CrossRef] [PubMed]
  6. Jones, A.; Kang, S.; Shaffer, R.C.; Erickson, C.A.; Schmitt, L.M. Behavioral inflexibility in fragile X syndrome: Accounts from caregivers and self-advocates. Front Psychol 2023, 14, 1118652. [Google Scholar] [CrossRef] [PubMed]
  7. Dahlhaus, R. Of Men and Mice: Modeling the Fragile X Syndrome. Frontiers in Molecular Neuroscience 2018, 11. [Google Scholar] [CrossRef] [PubMed]
  8. Willemsen, R.; Kooy, R.F. Mouse models of fragile X-related disorders. Dis Model Mech 2023, 16. [Google Scholar] [CrossRef] [PubMed]
  9. Drozd, M.; Bardoni, B.; Capovilla, M. Modeling Fragile X Syndrome in Drosophila. Frontiers in Molecular Neuroscience 2018, 11. [Google Scholar] [CrossRef]
  10. Trajković, J.; Makevic, V.; Pesic, M.; Pavković-Lučić, S.; Milojevic, S.; Cvjetkovic, S. , et al. Drosophila melanogaster as a Model to Study Fragile X-Associated Disorders. Genes (Basel) 2022, 14. [Google Scholar] [CrossRef]
  11. den Broeder, M.J.; van der Linde, H.; Brouwer, J.R.; Oostra, B.A.; Willemsen, R.; Ketting, R.F. Generation and characterization of FMR1 knockout zebrafish. PLoS One 2009, 4, e7910. [Google Scholar] [CrossRef]
  12. Dockendorff, T.C.; Su, H.S.; McBride, S.M.; Yang, Z.; Choi, C.H.; Siwicki, K.K. , et al. Drosophila lacking dfmr1 activity show defects in circadian output and fail to maintain courtship interest. Neuron 2002, 34, 973–84. [Google Scholar] [CrossRef]
  13. Banerjee, P.; Schoenfeld, B.P.; Bell, A.J.; Choi, C.H.; Bradley, M.P.; Hinchey, P. , et al. Short- and long-term memory are modulated by multiple isoforms of the fragile X mental retardation protein. J Neurosci 2010, 30, 6782–92. [Google Scholar] [CrossRef] [PubMed]
  14. Kashima, R.; Redmond, P.L.; Ghatpande, P.; Roy, S.; Kornberg, T.B.; Hanke, T. , et al. Hyperactive locomotion in a Drosophila model is a functional readout for the synaptic abnormalities underlying fragile X syndrome. Sci Signal 2017, 10. [Google Scholar] [CrossRef] [PubMed]
  15. Schneider, J.; Dickinson, M.H.; Levine, J.D. Social structures depend on innate determinants and chemosensory processing in Drosophila. Proc Natl Acad Sci U S A 2012, 109 Suppl 2, 17174–9. [Google Scholar] [CrossRef]
  16. Jiang, L.; Cheng, Y.; Gao, S.; Zhong, Y.; Ma, C.; Wang, T. , et al. Emergence of social cluster by collective pairwise encounters in Drosophila. Elife 2020, 9. [Google Scholar] [CrossRef]
  17. Bentzur, A.; Ben-Shaanan, S.; Benichou, J.I.C.; Costi, E.; Levi, M.; Ilany, A. , et al. Early Life Experience Shapes Male Behavior and Social Networks in Drosophila. Current Biology 2021, 31, 486–501. [Google Scholar] [CrossRef] [PubMed]
  18. Inoue, S.; Shimoda, M.; Nishinokubi, I.; Siomi, M.C.; Okamura, M.; Nakamura, A. , et al. A role for the Drosophila fragile X-related gene in circadian output. Curr Biol 2002, 12, 1331–5. [Google Scholar] [CrossRef]
  19. Simon, A.F.; Chou, M.T.; Salazar, E.D.; Nicholson, T.; Saini, N.; Metchev, S. , et al. A simple assay to study social behavior in Drosophila: measurement of social space within a group. Genes Brain Behav 2012, 11, 243–52. [Google Scholar] [CrossRef]
  20. Soibam, B.; Shah, S.; Gunaratne, G.H.; Roman, G.W. Modeling novelty habituation during exploratory activity in Drosophila. Behav Processes 2013, 97, 63–75. [Google Scholar] [CrossRef]
  21. Liu, G.; Nath, T.; Linneweber, G.A.; Claeys, A.; Guo, Z.; Li, J. , et al. A simple computer vision pipeline reveals the effects of isolation on social interaction dynamics in Drosophila. PLoS computational biology 2018, 14, e1006410. [Google Scholar] [CrossRef] [PubMed]
  22. Eyjolfsdottir, E.; Branson, S.; Burgos-Artizzu, X.; Hoopfer, E.; Schor, J.; Anderson, D. , et al. Detecting Social Actions of Fruit Flies. 2014, 8690. [Google Scholar] [CrossRef] [PubMed]
  23. Liu, G.; Nath, T.; Linneweber, G.A.; Claeys, A.; Guo, Z.; Li, J. , et al. A simple computer vision pipeline reveals the effects of isolation on social interaction dynamics in Drosophila. PLoS Comput Biol 2018, 14, e1006410. [Google Scholar] [CrossRef] [PubMed]
  24. Wice, E.W.; Saltz, J.B. Selection on heritable social network positions is context-dependent in Drosophila melanogaster. Nature Communications 2021, 12, 3357. [Google Scholar] [CrossRef] [PubMed]
  25. Petrović, M.; Meštrović, A.; Andretić Waldowski, R.; Filošević Vujnović, A. A network-based analysis detects cocaine-induced changes in social interactions in Drosophila melanogaster. PLOS ONE 2023, 18, e0275795. [Google Scholar] [CrossRef]
  26. Pasquaretta, C.; Battesti, M.; Klenschi, E.; Bousquet, C.A.; Sueur, C.; Mery, F. How social network structure affects decision-making in Drosophila melanogaster. Proc Biol Sci 2016, 283, 20152954. [Google Scholar] [CrossRef] [PubMed]
  27. Allen-Perkins, A.; Pastor, J.M.; Estrada, E. Two-walks degree assortativity in graphs and networks. Applied Mathematics and Computation 2017, 311, 262–71. [Google Scholar] [CrossRef]
  28. Snijders, T.A. Transitivity and Triads. University of Oxford. 2012. Available online: https://www.stats.ox.ac.uk/~snijders/Trans_Triads_ha.pdf (accessed on 22 April 2024).
  29. Soibam, B.; Mann, M.; Liu, L.; Tran, J.; Lobaina, M.; Kang, Y.Y. , et al. Open-field arena boundary is a primary object of exploration for Drosophila. Brain and Behavior 2012, 2, 97–108. [Google Scholar] [CrossRef] [PubMed]
  30. Jezovit, J.A.; Alwash, N.; Levine, J.D. Using Flies to Understand Social Networks. Front Neural Circuits 2021, 15, 755093. [Google Scholar] [CrossRef]
  31. Alwash, N.; Allen, A.M.; Sokolowski, M.B.; Levine, J.D. The Drosophila melanogaster foraging gene affects social networks. J Neurogenet 2021, 35, 249–61. [Google Scholar] [CrossRef]
  32. Wice, E.W.; Saltz, J.B. Indirect genetic effects for social network structure in Drosophila melanogaster. Philos Trans R Soc Lond B Biol Sci 2023, 378, 20220075. [Google Scholar] [CrossRef] [PubMed]
  33. Bentzur, A.; Ben-Shaanan, S.; Benichou, J.I.C.; Costi, E.; Levi, M.; Ilany, A. , et al. Early Life Experience Shapes Male Behavior and Social Networks in Drosophila. Curr Biol 2021, 31, 486–501.e3. [Google Scholar] [CrossRef] [PubMed]
  34. Rooke, R.; Rasool, A.; Schneider, J.; Levine, J.D. Drosophila melanogaster behaviour changes in different social environments based on group size and density. Commun Biol 2020, 3, 304. [Google Scholar] [CrossRef] [PubMed]
  35. Choi, C.H.; McBride, S.M.; Schoenfeld, B.P.; Liebelt, D.A.; Ferreiro, D.; Ferrick, N.J. , et al. Age-dependent cognitive impairment in a Drosophila fragile X model and its pharmacological rescue. Biogerontology 2010, 11, 347–62. [Google Scholar] [CrossRef] [PubMed]
  36. Santos, A.R.; Kanellopoulos, A.K.; Bagni, C. Learning and behavioral deficits associated with the absence of the fragile X mental retardation protein: what a fly and mouse model can teach us. Learn Mem 2014, 21, 543–55. [Google Scholar] [CrossRef]
  37. Bolduc, F.V.; Valente, D.; Nguyen, A.T.; Mitra, P.P.; Tully, T. An assay for social interaction in Drosophila fragile X mutants. Fly 2010, 4, 216–25. [Google Scholar] [CrossRef] [PubMed]
  38. Besson, M.; Martin, J.R. Centrophobism/thigmotaxis, a new role for the mushroom bodies in Drosophila. J Neurobiol 2005, 62, 386–96. [Google Scholar] [CrossRef] [PubMed]
  39. Xu, K.; Bogert, B.A.; Li, W.; Su, K.; Lee, A.; Gao, F.B. The fragile X-related gene affects the crawling behavior of Drosophila larvae by regulating the mRNA level of the DEG/ENaC protein pickpocket1. Curr Biol 2004, 14, 1025–34. [Google Scholar] [CrossRef]
  40. Mayhew, A.J.; Meyre, D. Assessing the Heritability of Complex Traits in Humans: Methodological Challenges and Opportunities. Curr Genomics 2017, 18, 332–40. [Google Scholar] [CrossRef]
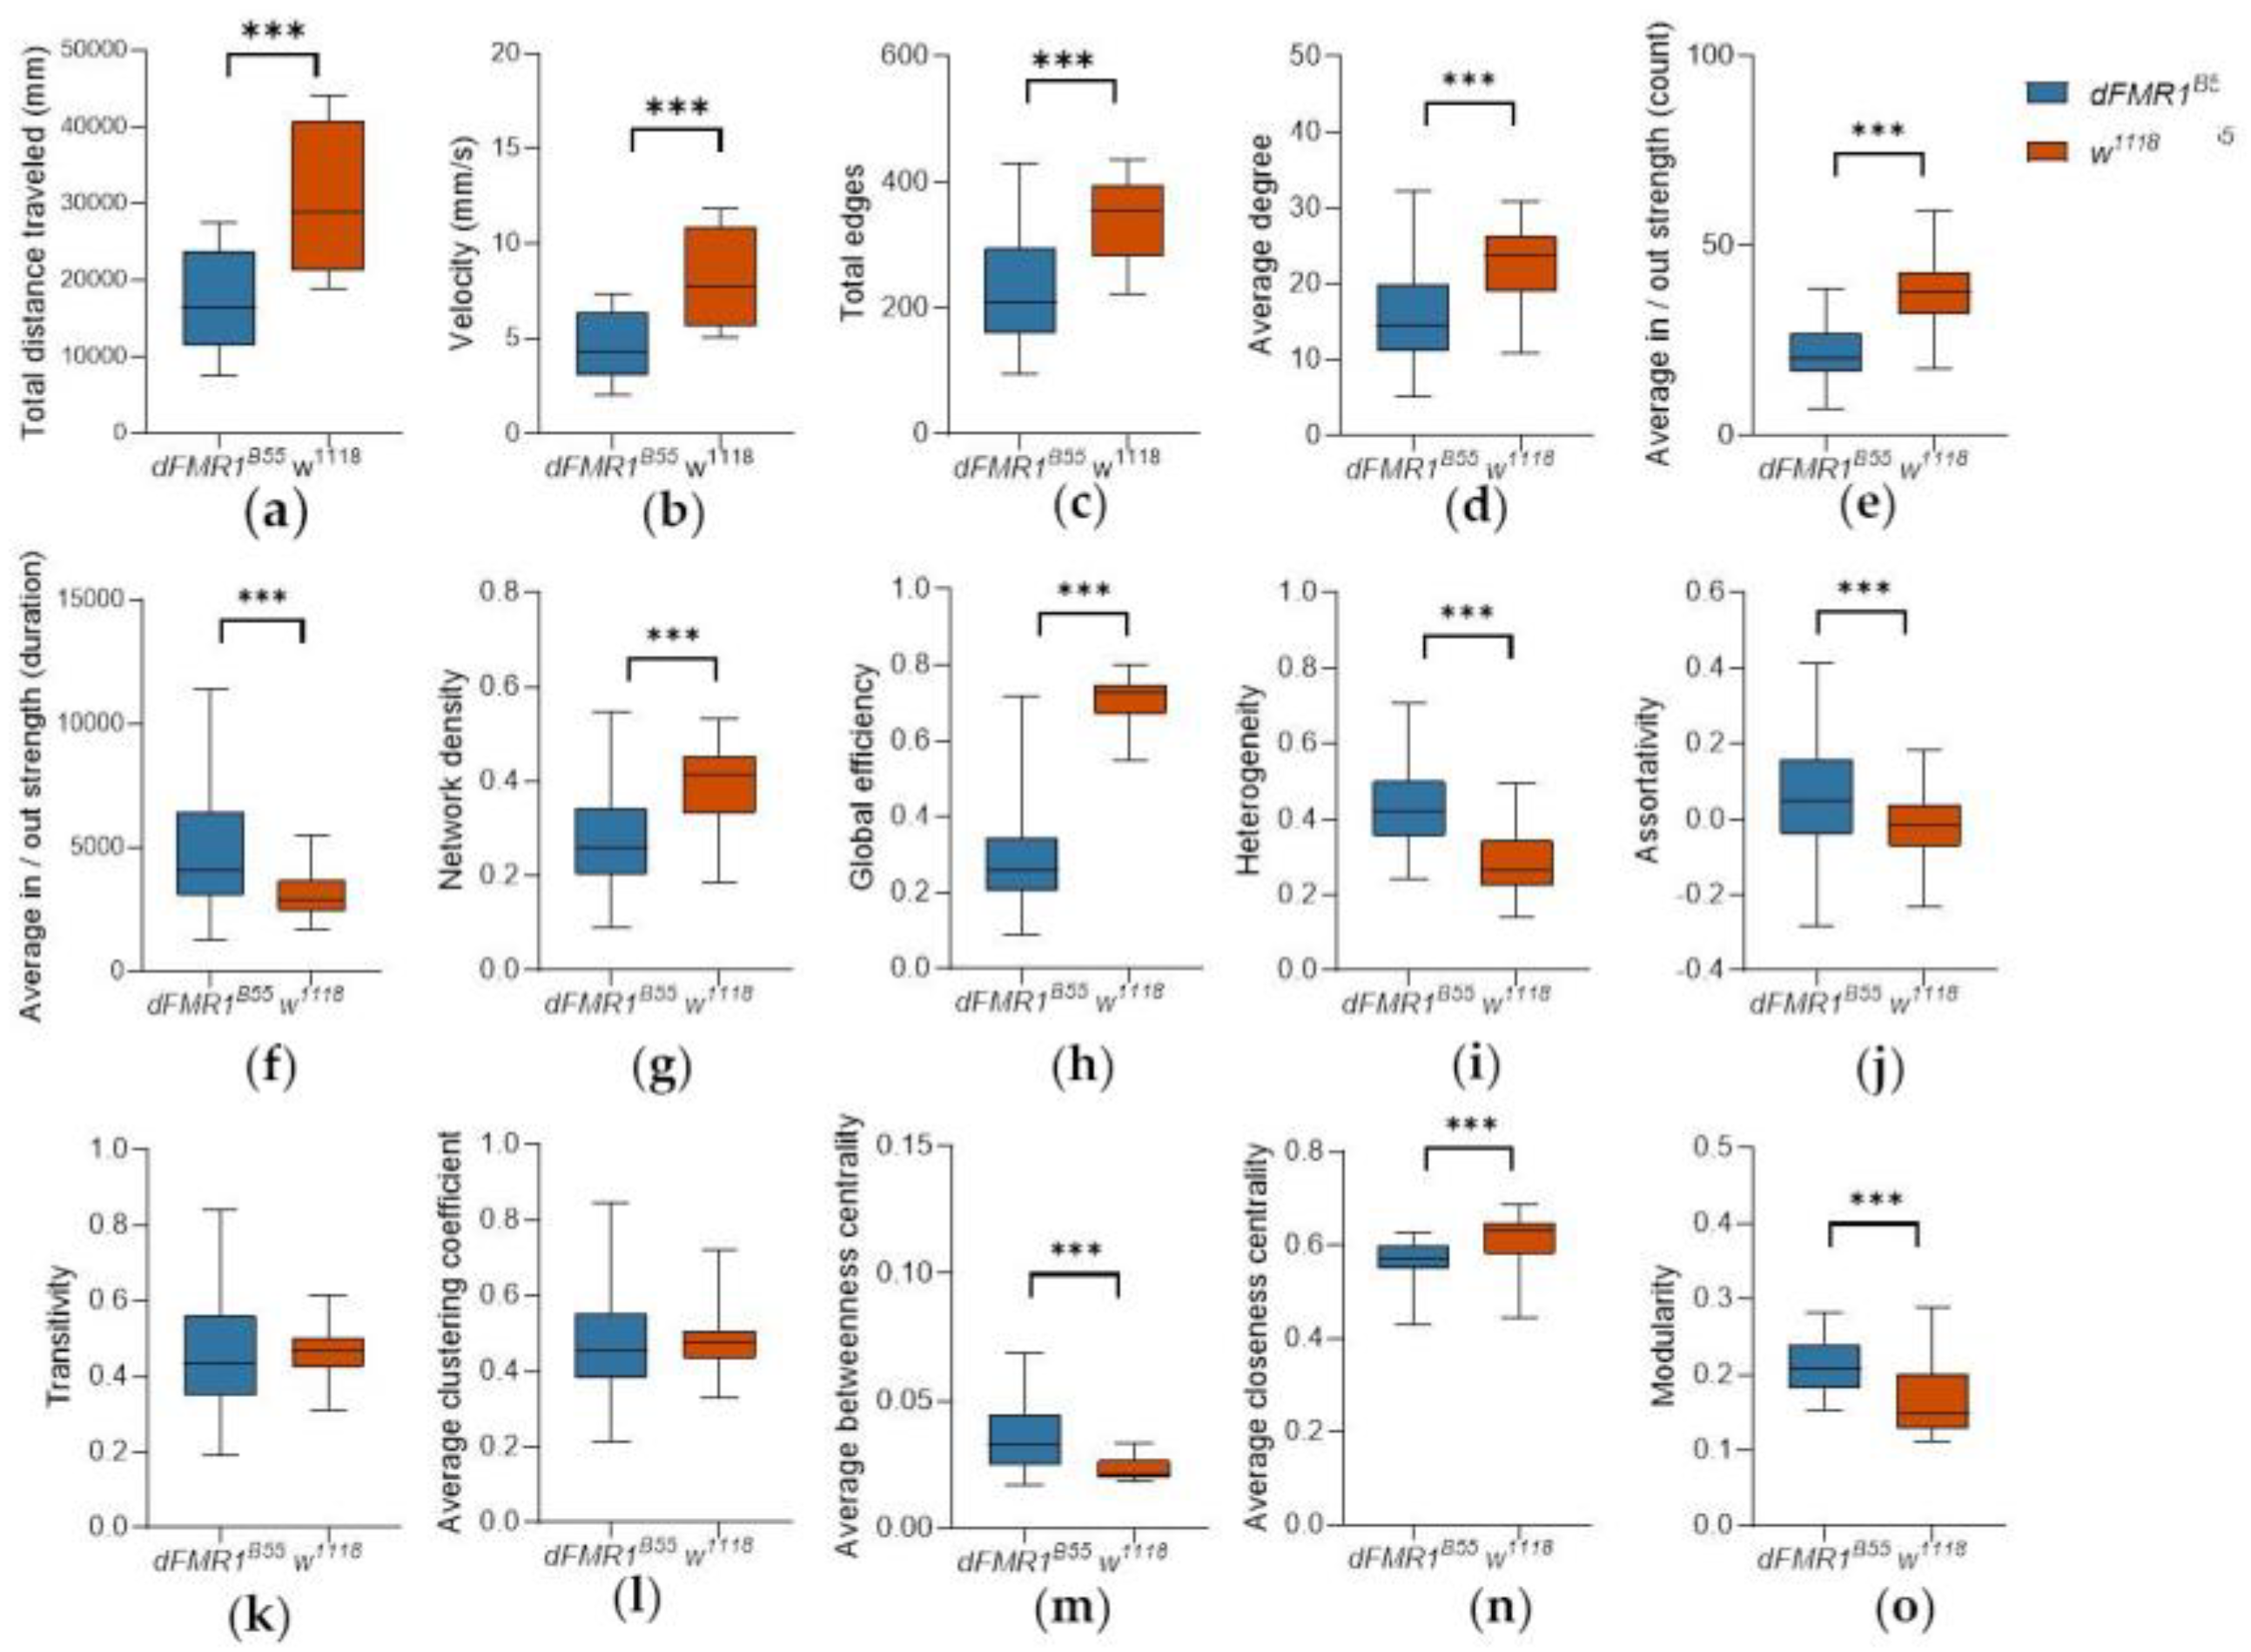
Figure 1. Differences between dFMR1B55 and w1118 in activity and Social Interaction Network (SIN) measures. Box plot of median values for 15 dFMR1B55 (n = 450 flies) and 15 w1118 groups (n = 450 flies), for the following measures: (a) total distance traveled expressed in mm; (b) velocity expressed in mm/s; (c) total edges; (d) average degree; (e) average in/out strength weighted for count; (f) average in / out strength weighted for duration; (g) network density; (h) global efficiency; (i) heterogeneity; (j) assortativity; (k) transitivity; (l) average clustering coefficient; (m) average betweenness centrality; (n) average closeness centrality; and (o) modularity. Data are extracted from 15-minute videos using FlyTracker and analyzed using the Python data processing pipeline. P-values less than 0.05 are taken as significant. Abbreviations: ***p<0.0001; dFMR1B55-Drosophila melanogaster model of fragile X syndrome; w1118 – wild type, Drosophila melanogaster.
Preprints 104778 g001
Figure 2. dFMR1B55 and w1118 heatmaps of localization of Social Interactions (SIs). Visualization shows that both groups have preference for the arena boundaries, and it appears that dFMR1B55 have fewer interactions. The visualization was made for groups in total for the dFMR1B55 group (a) and w1118 group (b). Abbreviations: dFMR1B55-Drosophila melanogaster model of fragile X syndrome; w1118Drosophila melanogaster wild-type.
Preprints 104778 g002
Disclaimer/Publisher’s Note: The statements, opinions and data contained in all publications are solely those of the individual author(s) and contributor(s) and not of MDPI and/or the editor(s). MDPI and/or the editor(s) disclaim responsibility for any injury to people or property resulting from any ideas, methods, instructions or products referred to in the content.
Copyright: This open access article is published under a Creative Commons CC BY 4.0 license, which permit the free download, distribution, and reuse, provided that the author and preprint are cited in any reuse.
Prerpints.org logo

Preprints.org is a free preprint server supported by MDPI in Basel, Switzerland.

Subscribe

© 2024 MDPI (Basel, Switzerland) unless otherwise stated