3.1. Thermodynamic Analysis of the Effect of H2S Concentration on DRM Reactions
Thermodynamic equilibrium analysis of the reactions involving CO
2, CH
4 and H
2S as feedstock was conducted firstly by Aspen Plus simulation to ascertain the theoretical basis for the participation of H
2S in reactions. Considering that the reaction system involves polar gases reacting at high temperature and low pressure, the NRTL property equation was chosen and a Gibbs isobaric and isothermal reactor was used. The reaction conditions for simulation were assumed as 20% CO
2, 20% CH
4 and H
2S of 0-15% all in volume balanced with N
2 at the temperature of 400-1000 °C and pressure of 0.1 MPa in a Gibbs isobaric and isothermal reactor. Nine possible products including H
2, H
2O, C, C
2H
6, CO, COS, CS
2, S
2, and SO
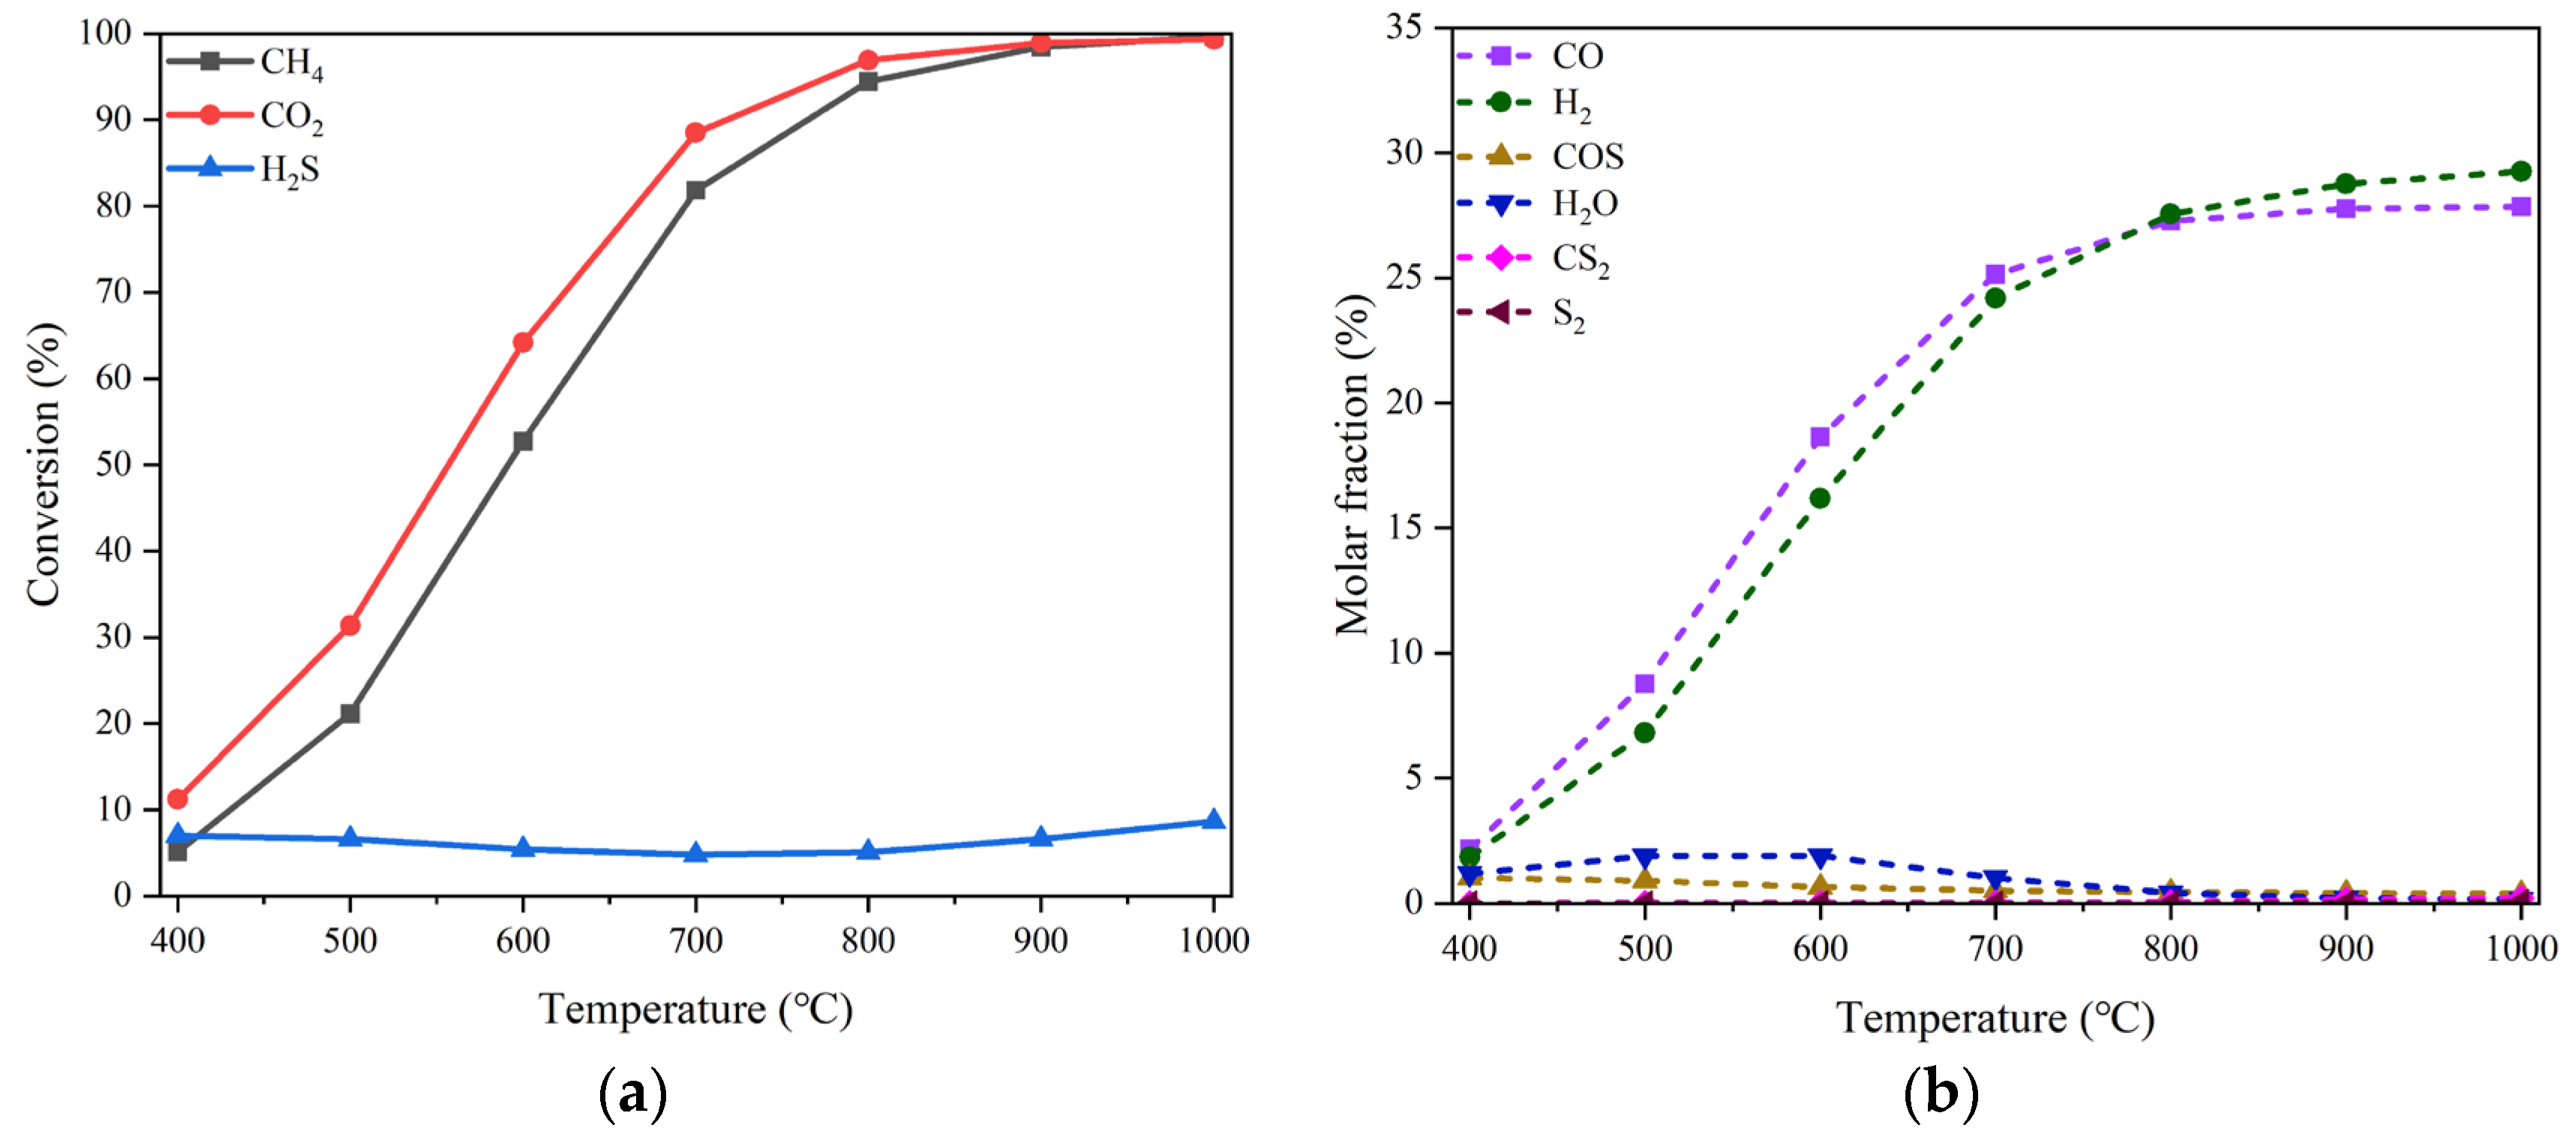
2 all in gas state excepting solid C were supposed to form in the reaction system. The results are shown in
Figure 1, where (a) and (b) display the changes in the equilibrium conversions of three reactants and the molar fractions of the products with reaction temperature, respectively. Because the molar fractions of C, C
2H
6 and SO
2 are all below the order of 10
-6, these three products will not be taken into account thereafter.
As can be seen, there is a slight fluctuation for the equilibrium conversion of H2S, which varies between 4.8% - 8.7% in the temperature range of 400-1000 °C, although that of either CO2 or CH4 increases significantly from ca. 5% to nearly 100% with temperature rising. Meanwhile, the molar fractions of both CO and H2 overwhelm other products in the whole temperature range especially when higher than 800 °C. The byproduct COS and H2O each accounts for a small proportion. Their individual maximum fraction does not exceed 1.1% and 1.9%, appearing around 400 °C and 600 °C, respectively. The quantity of CS2 and S2 is even more trivial.
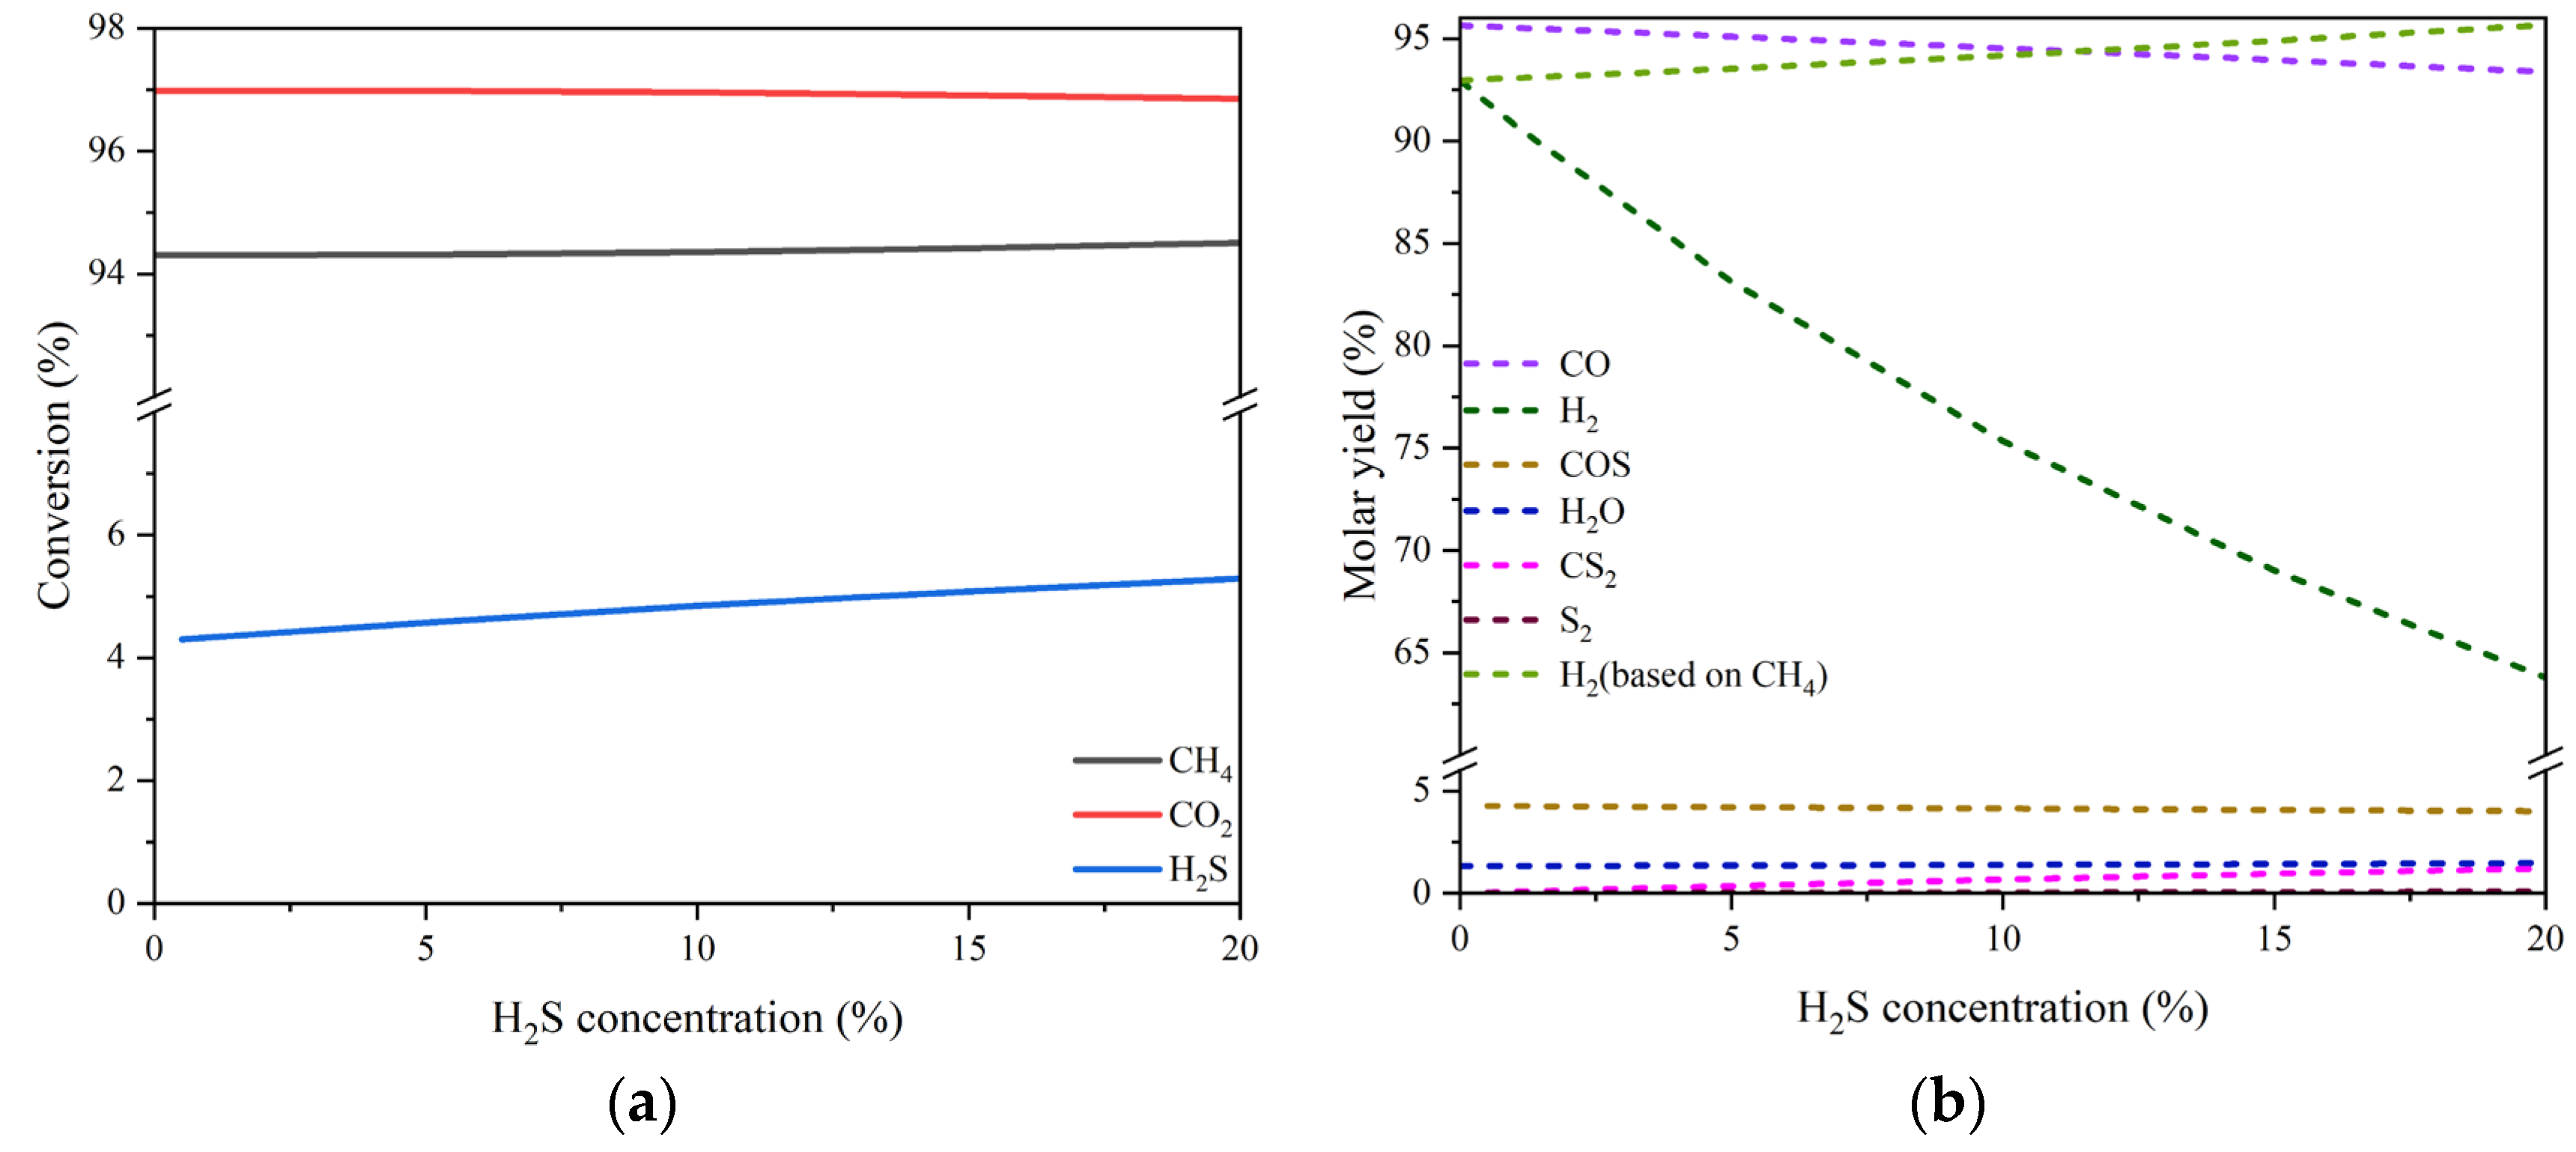
The equilibrium conversions of the three reactants and the molar yields of the products changing with H
2S concentration (0-20 vol%) at the temperature of 800 °C are drawn in Figs. 2 (a) and (b), respectively. There is a marginal growth of the H
2S conversion with the increase of H
2S concentration. Nevertheless, for the conversions of both CO
2 and CH
4, almost no impacts of H
2S concentration can be perceived. On the other hand, the molar yield of CO, one of the dominant products, declines from 95.65% to 93.38%, and the molar yield of H
2, the other dominant product, drops sharply from 92.97% to 63.78%. It should be noted, however, that the yield of H
2 could increase linearly from 92.97% to 95.67% as presented in
Figure 2(b) if it is calculated on the basis of feed CH
4 only just like when there is no H
2S present. This suggests that there would be a potential promotion effect of H
2S concentration on H
2 production. With respect to the other products, the molar yields of COS and H
2O are scarcely affected by the wave of H
2S concentration with their values maintained separately around 4.25% and 2.33%. The byproduct CS
2 seems to have an obvious increase, but in fact, its maximal molar yield is still very low. For S
2, the effect of H
2S concentration is not worth mentioning either. The results of thermodynamic analysis tell that high concentrations of H
2S couldn’t inhibit the conversions of both CO
2 and CH
4; instead, they are able to increase the production of H
2.
Figure 2.
Simulation results of the equilibrium conversion of reactant (a) and the molar yield of product changing with H2S concentration (b). Reaction conditions: feed gas composed of 20% CO2, 20% CH4 and H2S (0-20%) in volume balanced with N2, at the temperature of 800 °C and pressure of 0.1 MPa, in a Gibbs isobaric and isothermal reactor. Note: the starting point of H2S concentration for the curve of S-containing substance is greater than zero. .
3.2. Effect of H2S Concentration on DRM over Different Catalysts
(1) MgO catalyst
Different catalytic materials were tested to judge whether the effect of H
2S concentration on DRM is distinguishable from one another. MgO, an alkaline earth oxide, generally has a good adsorption ability towards acidic gases such as H
2S and CO
2. Furthermore, MgO can be used as a support to disperse various active phases, which can not only promote activation of acidic reactants but also prevent coke formation from hydrocarbon cracking. As Hu et al. claimed in their early research [
14], Ni/MgO solid solution catalysts could display excellent dry reforming performance without coke formation and metal sintering. The latest work reported by Feng et al. [
15] believed that the addition of MgO in Ni/Al
2O
3 catalysts could improve the alkalinity of the support and enhance the metal-support interaction, both of which are beneficial to the reaction of DRM.
In view of the MgO properties, we firstly examined the performance of MgO during DRM reactions in the absence and in the presence of H
2S with different concentration.
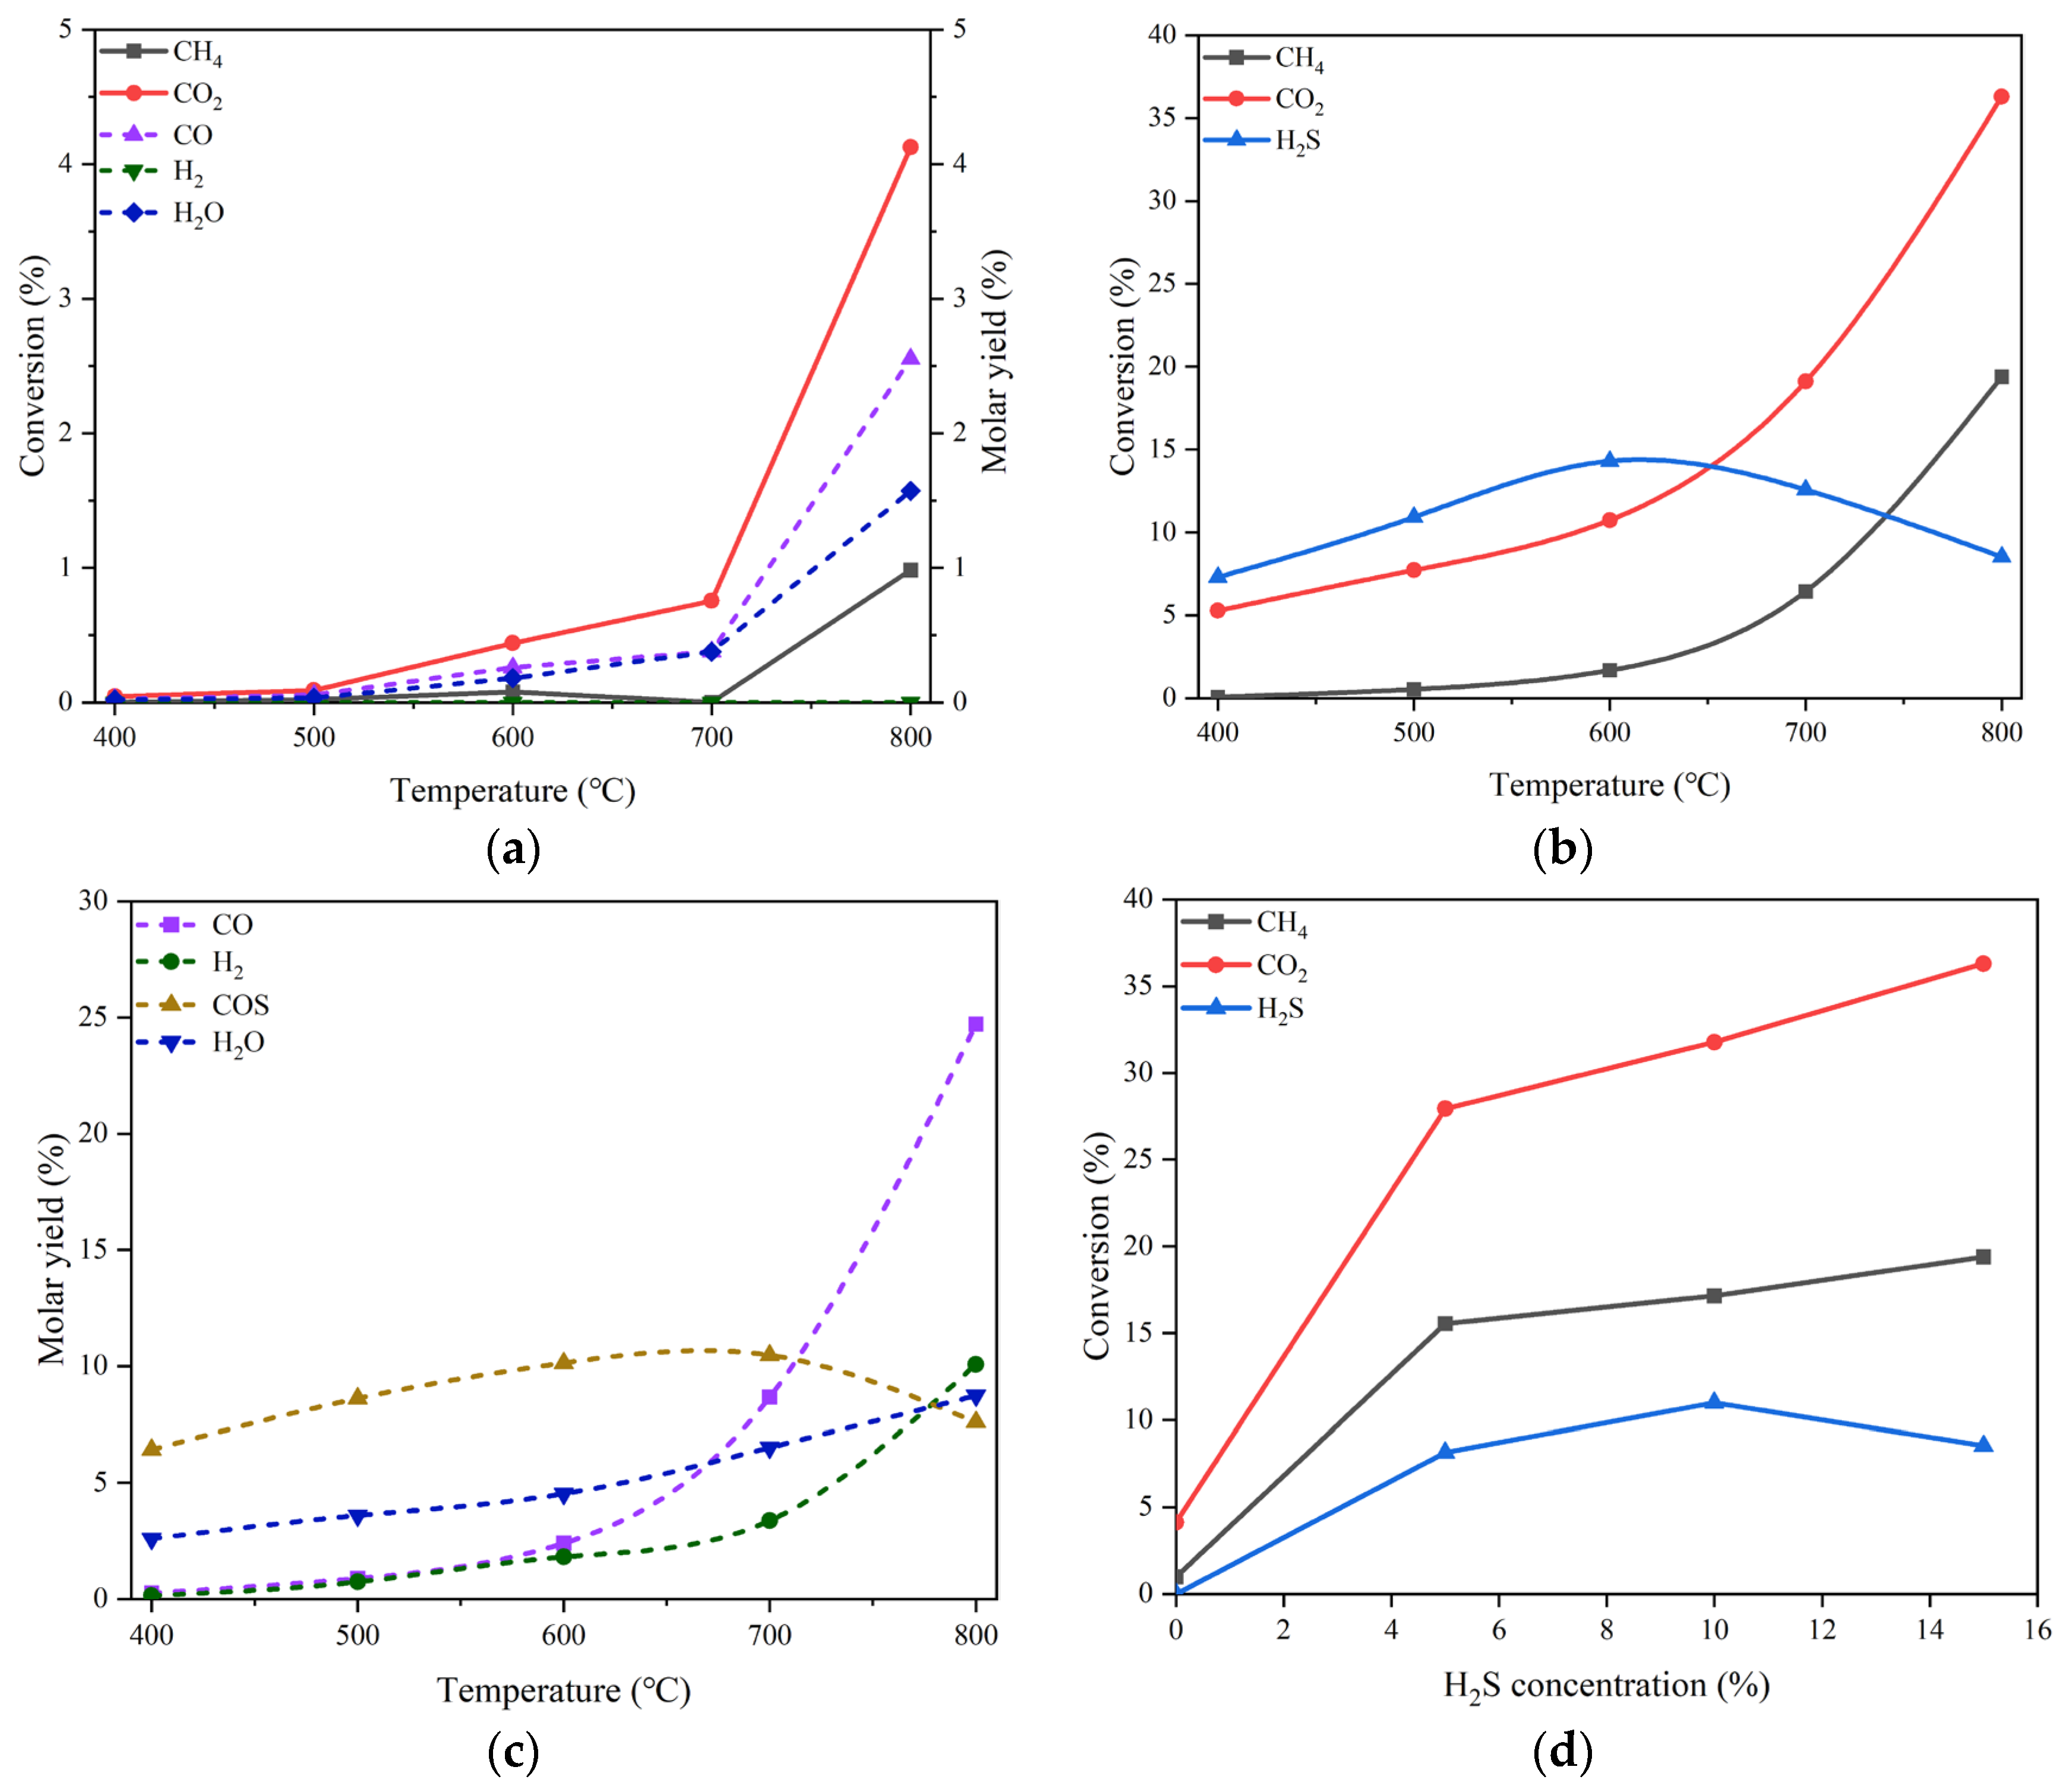
Figure 3(a) shows the conversions of CO
2 and CH
4 and the molar yields of CO, H
2 and H
2O in the temperature range of 400-800 °C in the absence of H
2S. The reactant mixture gas is composed of 20% CO
2 and 20% CH
4 in volume balanced with N
2 at the pressure of 0.1 MPa and the GHSV of 10000 h
-1. It can be inspected that the conversions of CO
2 and CH
4 are merely 4.09% and 0.92%, respectively, even at the temperature as high as 800 °C, indicating the poor catalytic performance of MgO for DRM. The main products are H
2O and CO, despite the fact that their productions are very low. In the meantime, the formation of H
2 can hardly be observed in the whole temperature range.
For the DRM proceeding in the presence of 15 vol% H
2S in addition to 20 vol% CO
2 and 20 vol% CH
4, the variations in the conversions of CO
2 and CH
4 and H
2S as well are displayed in
Figure 3(b). Surprisingly, the conversions of both CO
2 and CH
4 increase significantly in comparison with those obtained at the same temperatures but in the absence of H
2S. At 800 °C, the conversion of CO
2 can reach 36.30% and that of CH
4 is 19.36%, which are about 9 and 21 times the corresponding conversions under the reaction conditions without H
2S, respectively. The comparison between the reactant conversions under the conditions without and with H
2S discloses apparently the promotion effect of H
2S addition. Unlike the monotonic increases in CO
2 and CH
4 conversions, the conversion of H
2S exhibits a change like volcanic curve with the rise of reaction temperature. The summit of H
2S conversion is 14.30%, appearing at 600 °C.
Figure 3.
On the MgO catalyst, (a) conversions of CO2 and CH4 and molar yields of CO, H2 and H2O changing with temperature in the absence of H2S, (b) conversions of CO2, CH4 and H2S changing with temperature in the presence of 15 vol% H2S, (c) molar yields of CO, H2, H2O and COS changing with temperature in the presence of 15 vol% H2S, (d) conversions of CO2, CH4 and H2S changing with H2S concentration at 800 °C. Reaction conditions: feed gas composed of 20% CO2, 20% CH4 and H2S (0 - 15%) in volume balanced with N2, at the temperature of 400 - 800 °C, the pressure of 0.1 MPa and the gas hourly space velocity of 10000 h-1. The dotted line in (a) refers to the molar yield of product.
The effect of H
2S addition can be further evidenced by the boost in product molar yield. As illustrated in
Figure 3(c), the molar yields of the products such as CO, H
2, and H
2O at 800 °C are all growing remarkably as compared with the counterpart results shown in
Figure 3(a). In particular, the production of H
2 can achieve the molar yield of 10.07%, being second only to that of CO; the latter is 24.7%. Additionally, a new product, COS was observed, which has a maximal molar yield of 10.47% at 700 °C. The influence of H
2S concentration on the conversion of each reactant can be ascertained from the curve trend shown in
Figure 3(d). For CO
2 and CH
4, there are unequivocally positive effects of H
2S concentration on their conversions. Regarding H
2S transformation, there appears to be an optimal concentration of about 10 vol% H
2S to achieve the largest conversion of 10.99%.
(2) NiO/MgO catalyst in pristine and reduced form
As mentioned early, the catalysts based on Ni/MgO are frequently used in the processes of DRM due to their outstanding catalytic performances. Herein, we prepared the NiO/MgO catalyst for DRM and used it in either pristine or reduced form to explore the sensitivity of the chemical state of active metal on the H
2S-induced effect. The catalytic performances of the pristine NiO/MgO catalyst in the absence of H
2S and in the presence of 15 vol% H
2S at different temperatures are depicted in
Figure 4(a, b). By comparing between the results of NiO/MgO in
Figure 4(a, b) and those of MgO in
Figure 3(a, b), one can be aware of that the variation trends with temperature rising of either reactant conversions or product molar yields are very similar for the two catalyst types, whatever in the absence or in the presence of H
2S. Nonetheless, on the NiO/MgO catalyst, there are perceptible increments of both reactant conversions and product molar yields. This proves the superior behaviors of NiO/MgO to the simple MgO catalyst. Furthermore, at 800 °C, the conversion of CO
2 and the molar yield of CO are 42.10% and 33.10% respectively on the NiO/MgO catalyst in the presence of H
2S, which are not only higher than the results recorded in the same conditions on the simple MgO catalyst but also much higher than the corresponding values gained in the absence of H
2S. Obviously, the promotion effect of H
2S has also been confirmed on the pristine NiO/MgO catalyst.
Figure 4.
(a) Conversion of CO2 and CH4 and molar yield of CO, H2 and H2O changing with temperature in the absence of H2S on the pristine NiO/MgO catalyst, (b) conversion of CO2, CH4 and H2S and molar yield of CO, H2, H2O and COS changing with temperature in the presence of 15 vol% H2S on the pristine NiO/MgO catalyst, (c) conversion of CO2 and CH4 and molar yield of CO, H2 and H2O changing with temperature in the absence of H2S on the reduced NiO/MgO catalyst, (d) conversion of CO2, CH4 and H2S and molar yield of CO, H2, H2O and COS changing with temperature in the presence of 15 vol% H2S on the reduced NiO/MgO catalyst, (e) comparison in conversion of CO2, CH4 and H2S changing with H2S concentration at 800 °C between the pristine and the reduced NiO/MgO catalysts, (f) comparison in molar yield of CO, H2, H2O and COS changing with H2S concentration at 800 °C between the pristine and the reduced NiO/MgO catalysts. Reaction conditions: feed gas composed of 20% CO2, 20% CH4 and 0-15% H2S in volume balanced with N2, at the temperature of 400-800 °C, the pressure of 0.1 MPa and the GHSV of 10000 h-1. The dotted line in (a-d) refers to the molar yield of product.
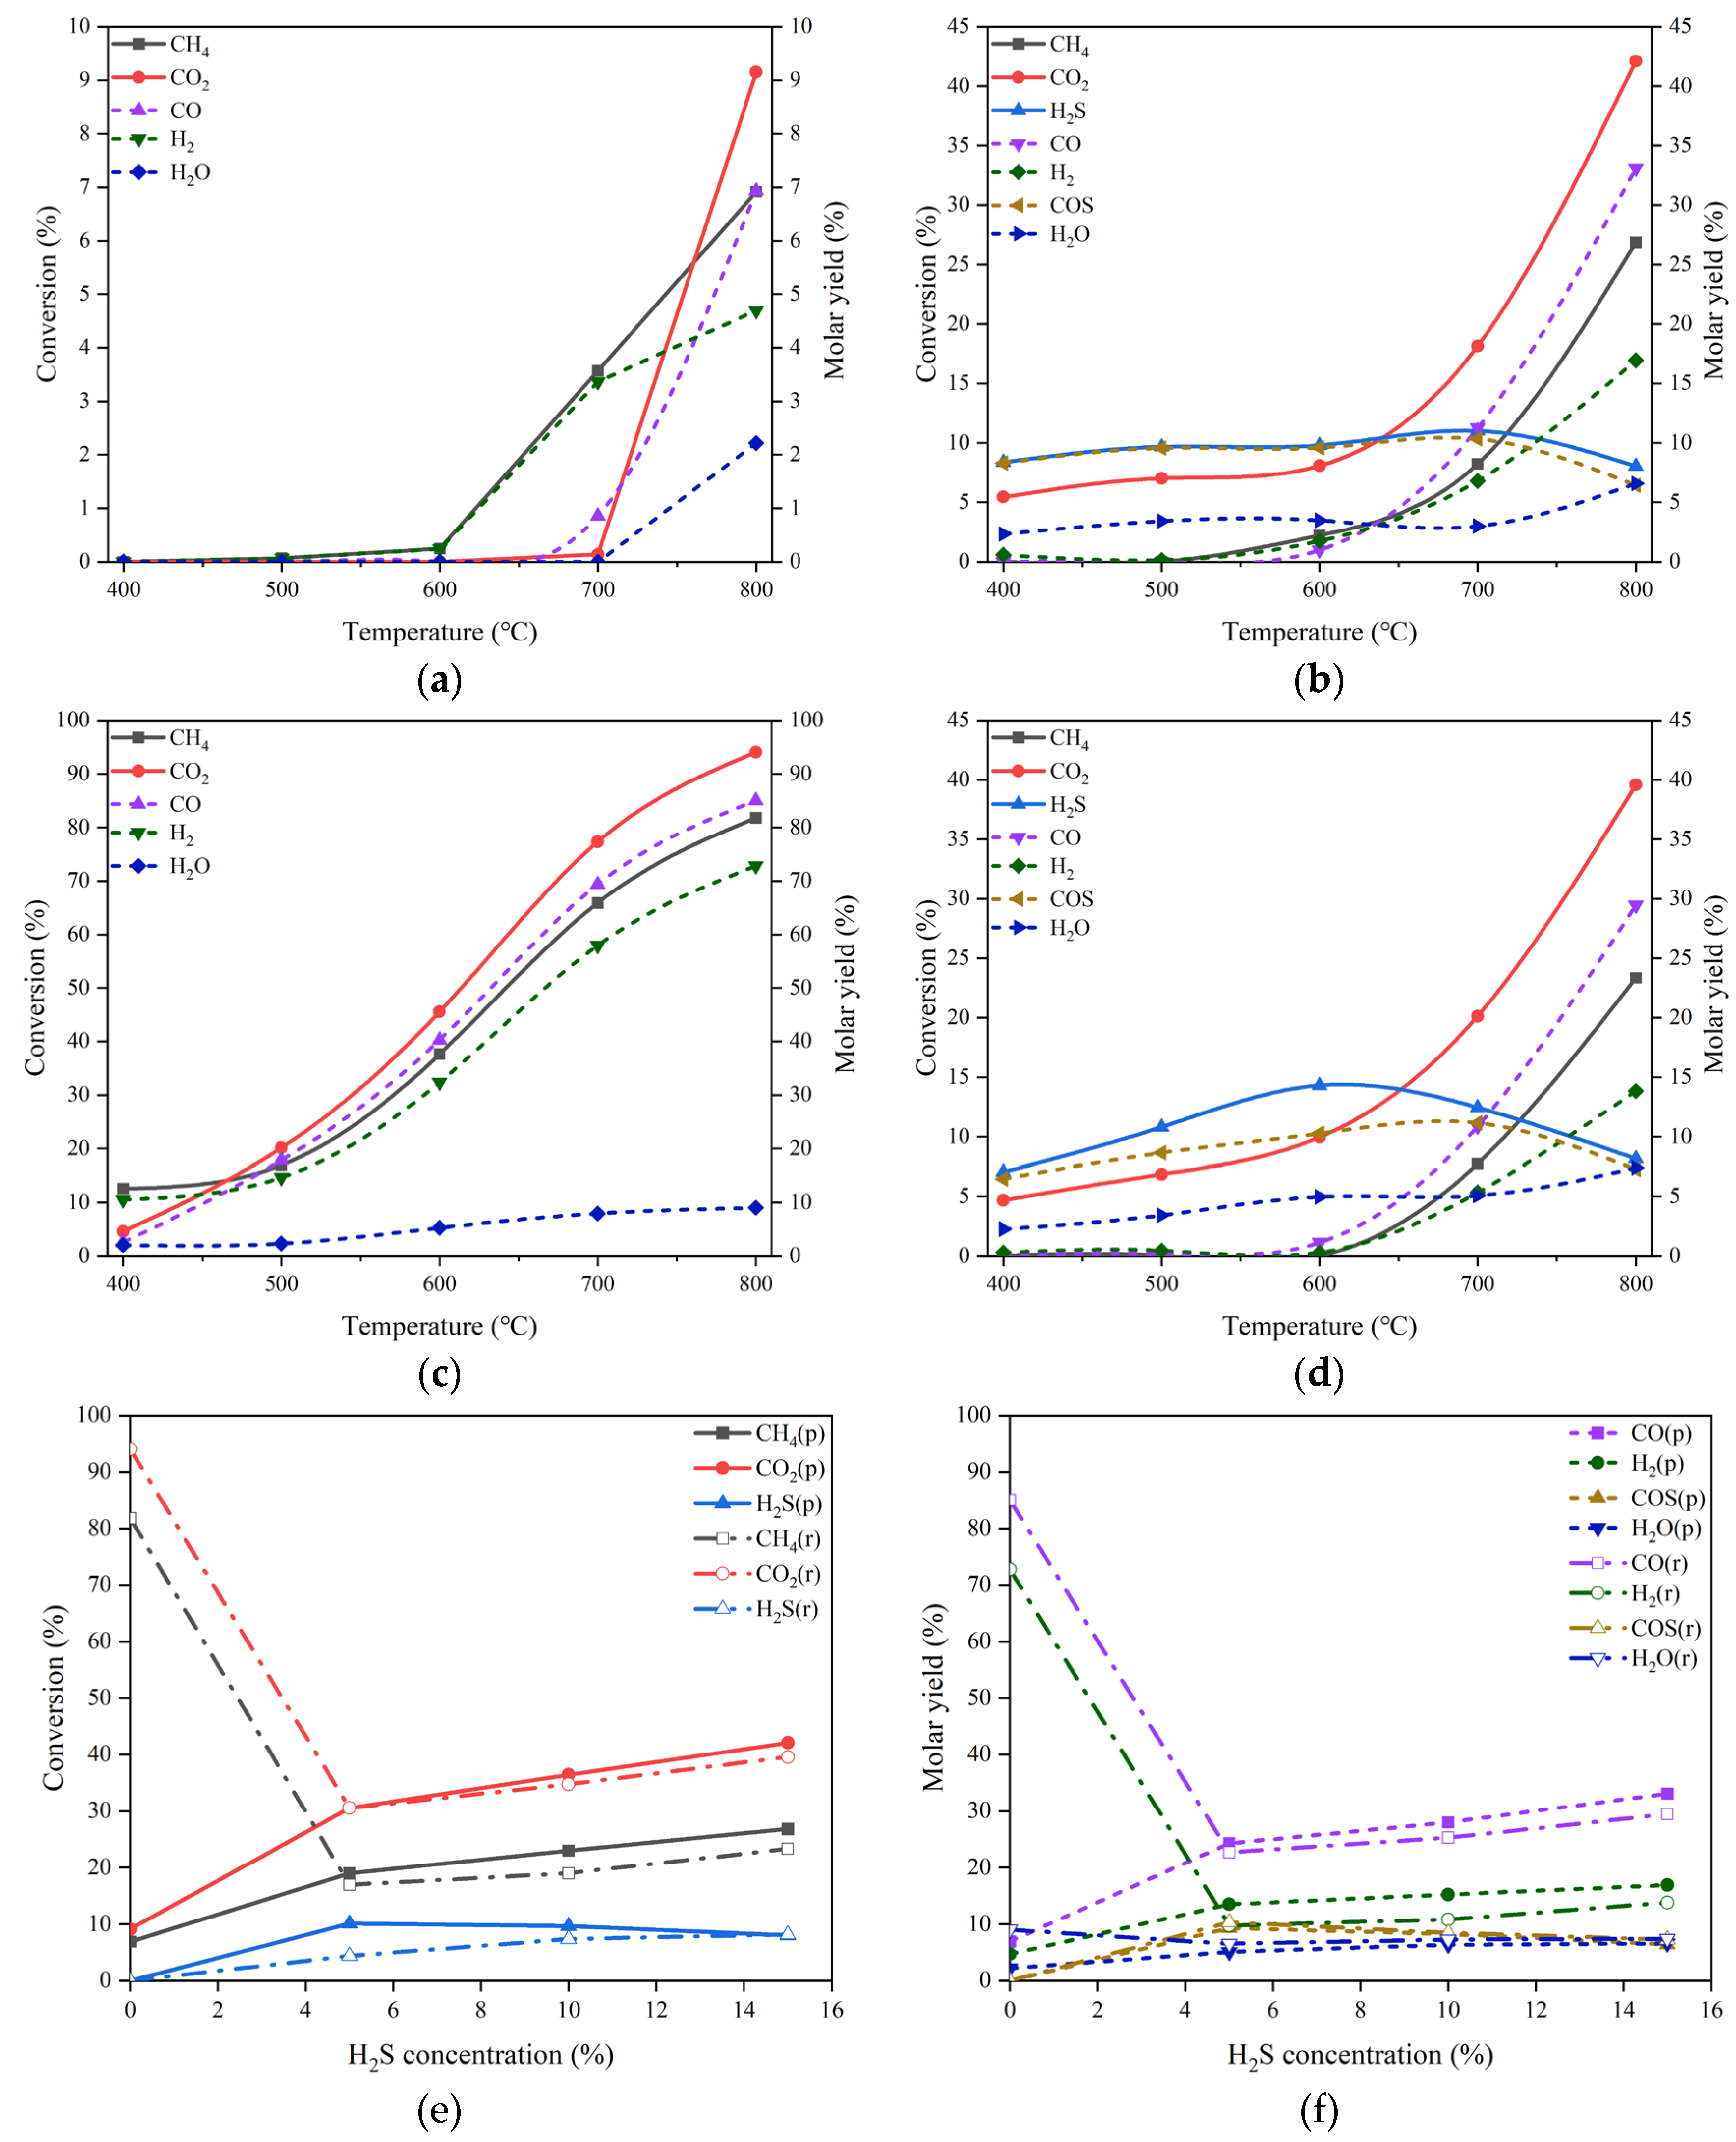
For the reduced NiO/MgO catalyst, the catalytic performances in the reaction conditions without and with 15 vol% H
2S at different temperatures are demonstrated in Figs. 4 (c) and (d), respectively. It is interesting that the conversions of both CO
2 and CH
4 and the molar yields of both CO and H
2 are improved greatly on the catalyst of NiO/MgO after reduction as shown in
Figure 4(c) by comparing with the corresponding results on the pristine catalyst in
Figure 3(a). At 800 °C, the conversion of CO
2 and the molar yield of CO are 94.05% and 85.04% respectively, which are comparable to the data reported in the literatures [
14,
16]. The results manifest the importance of the chemically reduced state of the active metal phase in the NiO/MgO catalyst for the reaction of DRM. In the condition of 15 vol% H
2S presence, the changes of reactant conversions and product molar yields with the temperature in
Figure 4(d) are virtually identical to those presented on the pristine NiO/MgO catalyst in
Figure 4(b). However, in comparison with the results gained in the absence of H
2S in
Figure 4(c), noticeable drops in the conversions of CO
2 and CH
4 and the molar yields of CO and H
2 can be found, suggesting an inhibition effect of H
2S on the catalytic activity of the reduced NiO/MgO catalyst for DRM.
The differentiation in the H
2S concentration influence on the catalytic performances between the pristine and the reduced NiO/MgO catalysts can be surveyed in
Figure 4(e, f). On the reduced NiO/MgO catalyst, as displayed in
Figure 4(e), the trends of the reactant conversions with H
2S concentration are basically the same for the two catalyst forms, excepting that there are sharp declines in the CO
2 and CH
4 conversions when the reaction atmosphere is altered from none of H
2S to containing H
2S. Further increasing H
2S concentration can benefit the conversions of CO
2 and CH
4 over both of the NiO/MgO catalysts, resembling the circumstance occurring over the MgO catalyst. The changes of the product molar yields with H
2S concentration shown in
Figure 4(f) are consistent with the paces of reactant conversions. Additionally, the pristine NiO/MgO catalyst performs to some extent better than the reduced one in the reaction system containing H
2S, inferring that the catalytic performance may be sensitive to subtle variation in the surface of catalyst.
(3) LaNiO3 derived catalyst
LaNiO
3 is the most widespread Ni-based perovskite oxide used as a precursor for DRM, due to the stable performance of its derived catalyst during reaction, in contrast with conventional Ni-based catalysts [
17,
18,
19]. We also prepared the material of LaNiO
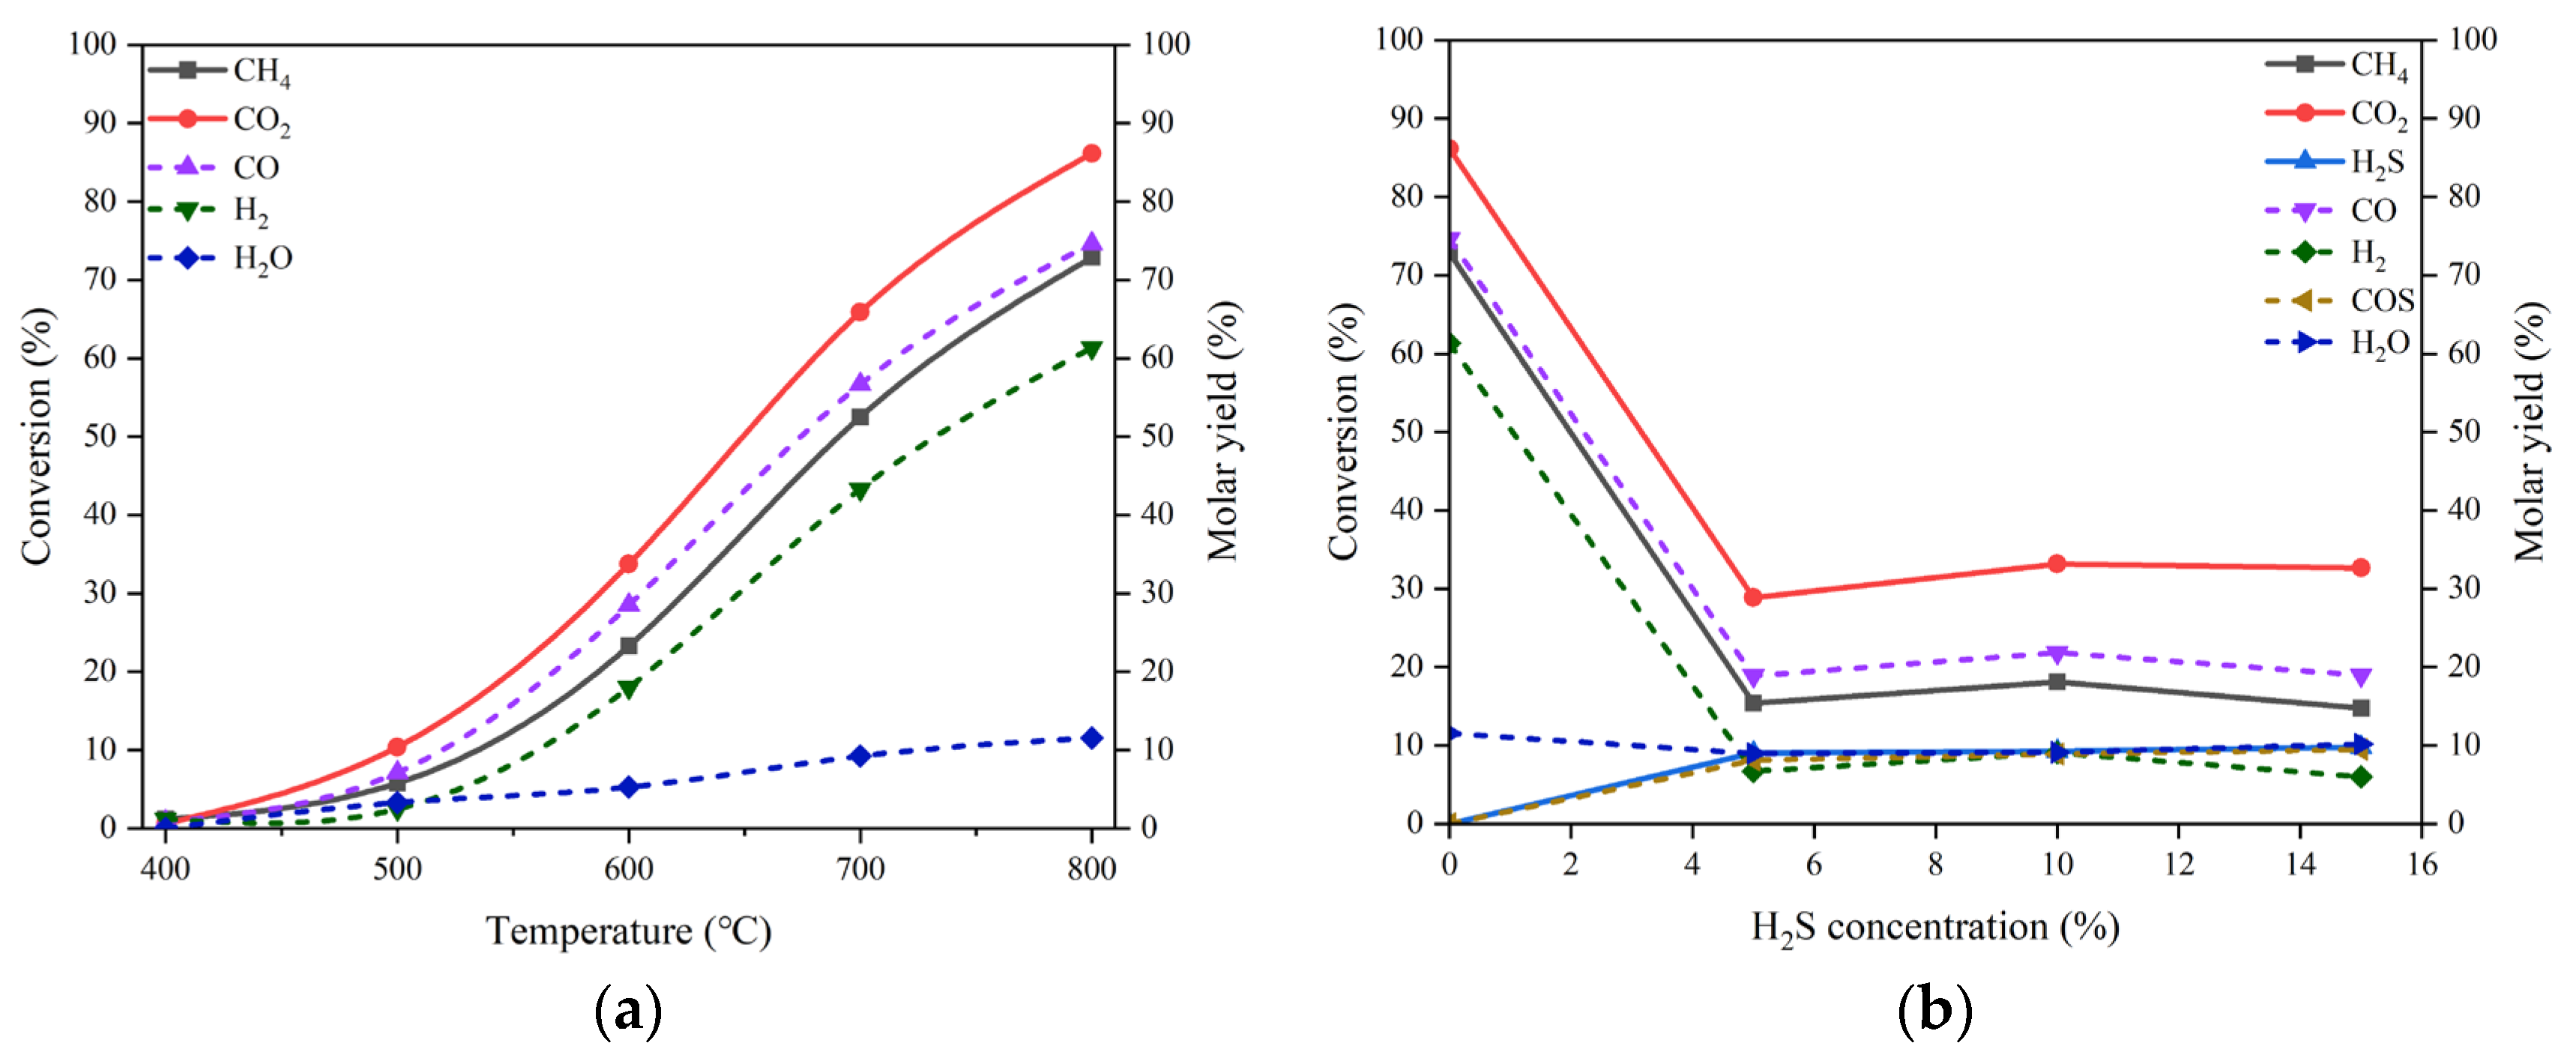
3 and reduced it to form Ni-based active phase before running the process of DRM. The results of CO
2 and CH
4 conversions and the molar yields of CO and H
2 at different temperatures in the condition of no H
2S addition are curved in
Figure 5(a). High activity of LaNiO
3-derived catalyst is achieved as expected. In the presence of H
2S, as shown in
Figure 5(b), the changes in the conversions of CO
2 and CH
4 as well as H
2S with the H
2S concentration are somewhat analogous to those appearing over the reduced NiO/MgO catalyst. The addition of H
2S suppresses to a certain extent the activity of the LaNiO
3-derived catalyst for CO
2 and CH
4 transformation; however, a partial revival of catalytic performance can be effectuated by increasing the H
2S concentration.
Figure 5.
(a) Conversion of CO2 and CH4 and molar yield of CO, H2 and H2O changing with temperature in the absence of H2S on the reduced LaNiO3 catalyst, (b) conversion of CO2, CH4 and H2S and molar yield of CO, H2, H2O and COS changing with H2S concentration at 800 °C. Reaction conditions: feed gas composed of 20% CO2, 20% CH4 and H2S (0 - 15%) in volume balanced with N2, at the temperature of 400 - 800 °C, the pressure of 0.1 MPa and the GHSV of 10000 h-1. The dotted line refers to the molar yield of product.
3.3. Discussion
As revealed above, the promotion effect on catalytic performance arising from the addition of high concentration H
2S can be observed on all of the materials investigated including the MgO, the NiO/MgO reduced or not, and the reduced LaNiO
3 catalysts, implying that there must be a similar reason behind. After comprehensive deliberation of the product composition detected and their possible formation routes through consulting our previous study and other researches published [
20,
21,
22,
23], five independent reactions and their thermodynamic functions have been figured out, as listed in
Table 2 below.
It is apparent that the pathway through which H
2S participates in the reaction may not only embody in the Eq. (10), but also in the Eqs. (12) and (13) probably. As a matter of fact, traces of CS
2 and S
2 had been searched out occasionally during reaction test in the collected liquid samples and on the reactor outlet wall, respectively, affirming the possibility of the occurrence of the Eqs. (12) and (13). According to the thermodynamic analysis results relevant to CS
2 and S
2 formation given in
Figure 2(b), the yields of CS
2 and S
2 are exactly very low in theory. Therefore, it is reasonable for the negligible amount of CS
2 and S
2 gathered. In contrast, COS is one of critical products formed on all the catalysts, which much likely arises from H
2S transformation with CO
2. Moreover, the molar yield of COS in practical is generally higher than the theoretical value. The consequence hints that the reaction between H
2S and CO
2 may take priority in virtue of selective catalysis over other CO
2 reactions, especially that proceeding following the Eq. (9), while the latter is thermodynamically more favorable. The fall-off in conversions of CO
2 and CH
4 after adding H
2S to the systems of the reduced NiO/MgO and LaNiO
3 catalysts points to the alteration of catalytic active phases, thus causing a decrease in activity of the two catalysts for the direct reaction between CO
2 and CH
4. On the other hand, the happening of diverse reactions of H
2S with CO
2 and CH
4 can multiple the transformation pathways of both CO
2 and CH
4, and high H
2S concentration is definitely promotive to the conversion of CO
2 and CH
4. This should be the principal reason for the promotion effect of high concentration H
2S in the catalytic DRM reaction system.
The reaction results of the reactant mixture of 20 vol% CO
2, 20 vol% CH
4, and 15 vol% H
2S on different catalysts tested at 800 °C are summarized in
Table 3. The pristine NiO/MgO catalyst performs prominently among all in terms of reactant conversion and product yield. The conversions of CO
2 and CH
4 in the presence of H
2S can sustain at a meaningful level that can be applicable to industry, in spite of being somewhat lower than those obtained over the reduced NiO/MgO and LaNiO
3 catalysts in the absence of H
2S. In particular, the catalysts can at least partially overcome the impact of activity reduction caused by H
2S addition.
It is worthy of mentioning that there was no detectable decline in catalytic activity of any catalyst with reaction time on stream throughout the entire testing period in the condition of H2S presence. As a matter of fact, we measured the stability of reduced NiO/MgO catalyst for longer than 60 h in feed gas of 20 vol% CO2, 20 vol% CH4 and 15 vol% H2S at 700 °C. The conversions of the three reactants changing with time on stream are supplied in Figure S4 of Supporting Information. The conversion curves are considerably flat, implying that the deactivation typically resulting from coke formation or H2S poisoning in such kind of reaction system may slightly happen to the catalyst.
In order to understand the distinctive role of each catalyst played in the reactions, a series of characterization of the catalysts was implemented by use of BET, XRD and XPS techniques, etc. The sample labelled as “used” refers to the catalyst having undergone the DRM reactions at 800 °C for 1 h in the presence of 15 vol% H
2S. The BET measurement results of the catalyst samples before and after the reactions are listed in
Table 4, and the corresponding cryogenic N
2 adsorption-desorption isotherms and pore size distribution profiles are displayed in Figs. S5 and S6 respectively. The catalysts of the MgO, the pristine and reduced NiO/MgO, and the reduced LaNiO
3 differ greatly from one another in their specific surface area, pore volume and average pore diameter. After completing the reactions at 800 °C for 1 h in the presence of H
2S, almost all the catalysts alter few with respect to their textural features in comparison with their fresh states, reflecting the high tolerance of the catalyst structures to the H
2S-containing reactive atmosphere at high temperature. For LaNiO
3, there are obvious changes in N
2 adsorption-desorption isotherm and pore size distribution profile shown in Figs. S5 and S6 respectively. It must be originated from the transformation of the crystal structure of LaNiO
3 in the process of reaction, as will be revealed in the discussion of XRD results in the following text. Nevertheless, probably due to its inherently small specific surface area, the surface area of LaNiO
3 becomes more trivial after experiencing reactions. Associating with the catalytic performance of these catalysts in H
2S atmosphere as supplied in
Table 3, the texture property of catalyst seems to give an impact on the catalytic reactions to some extent. High specific surface area of catalyst might be helpful to the conversion of the reactants.
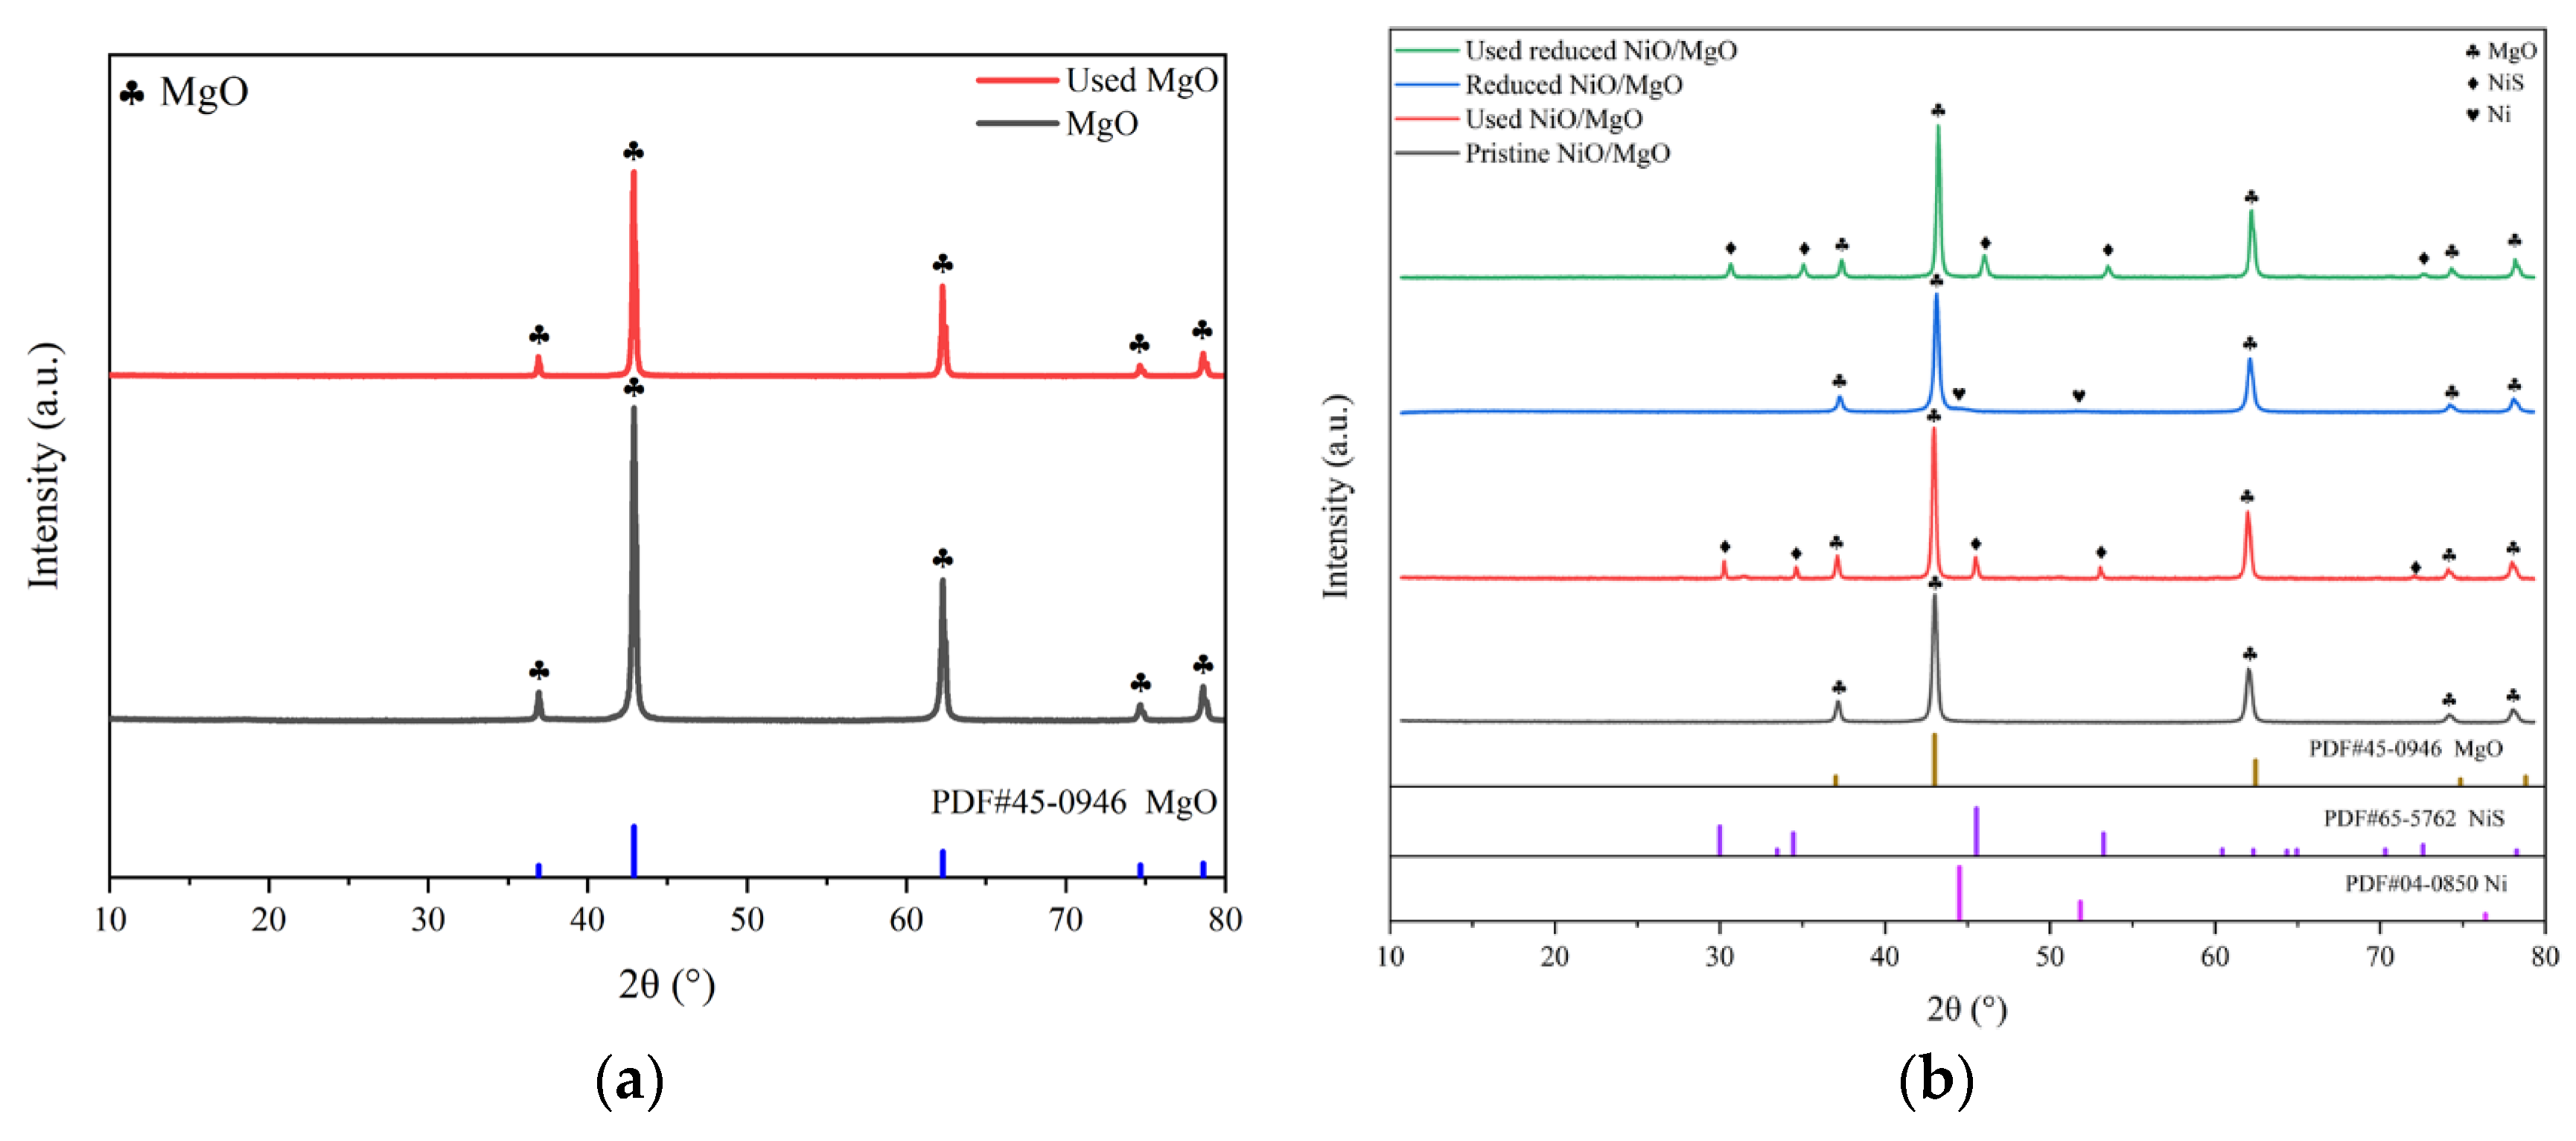
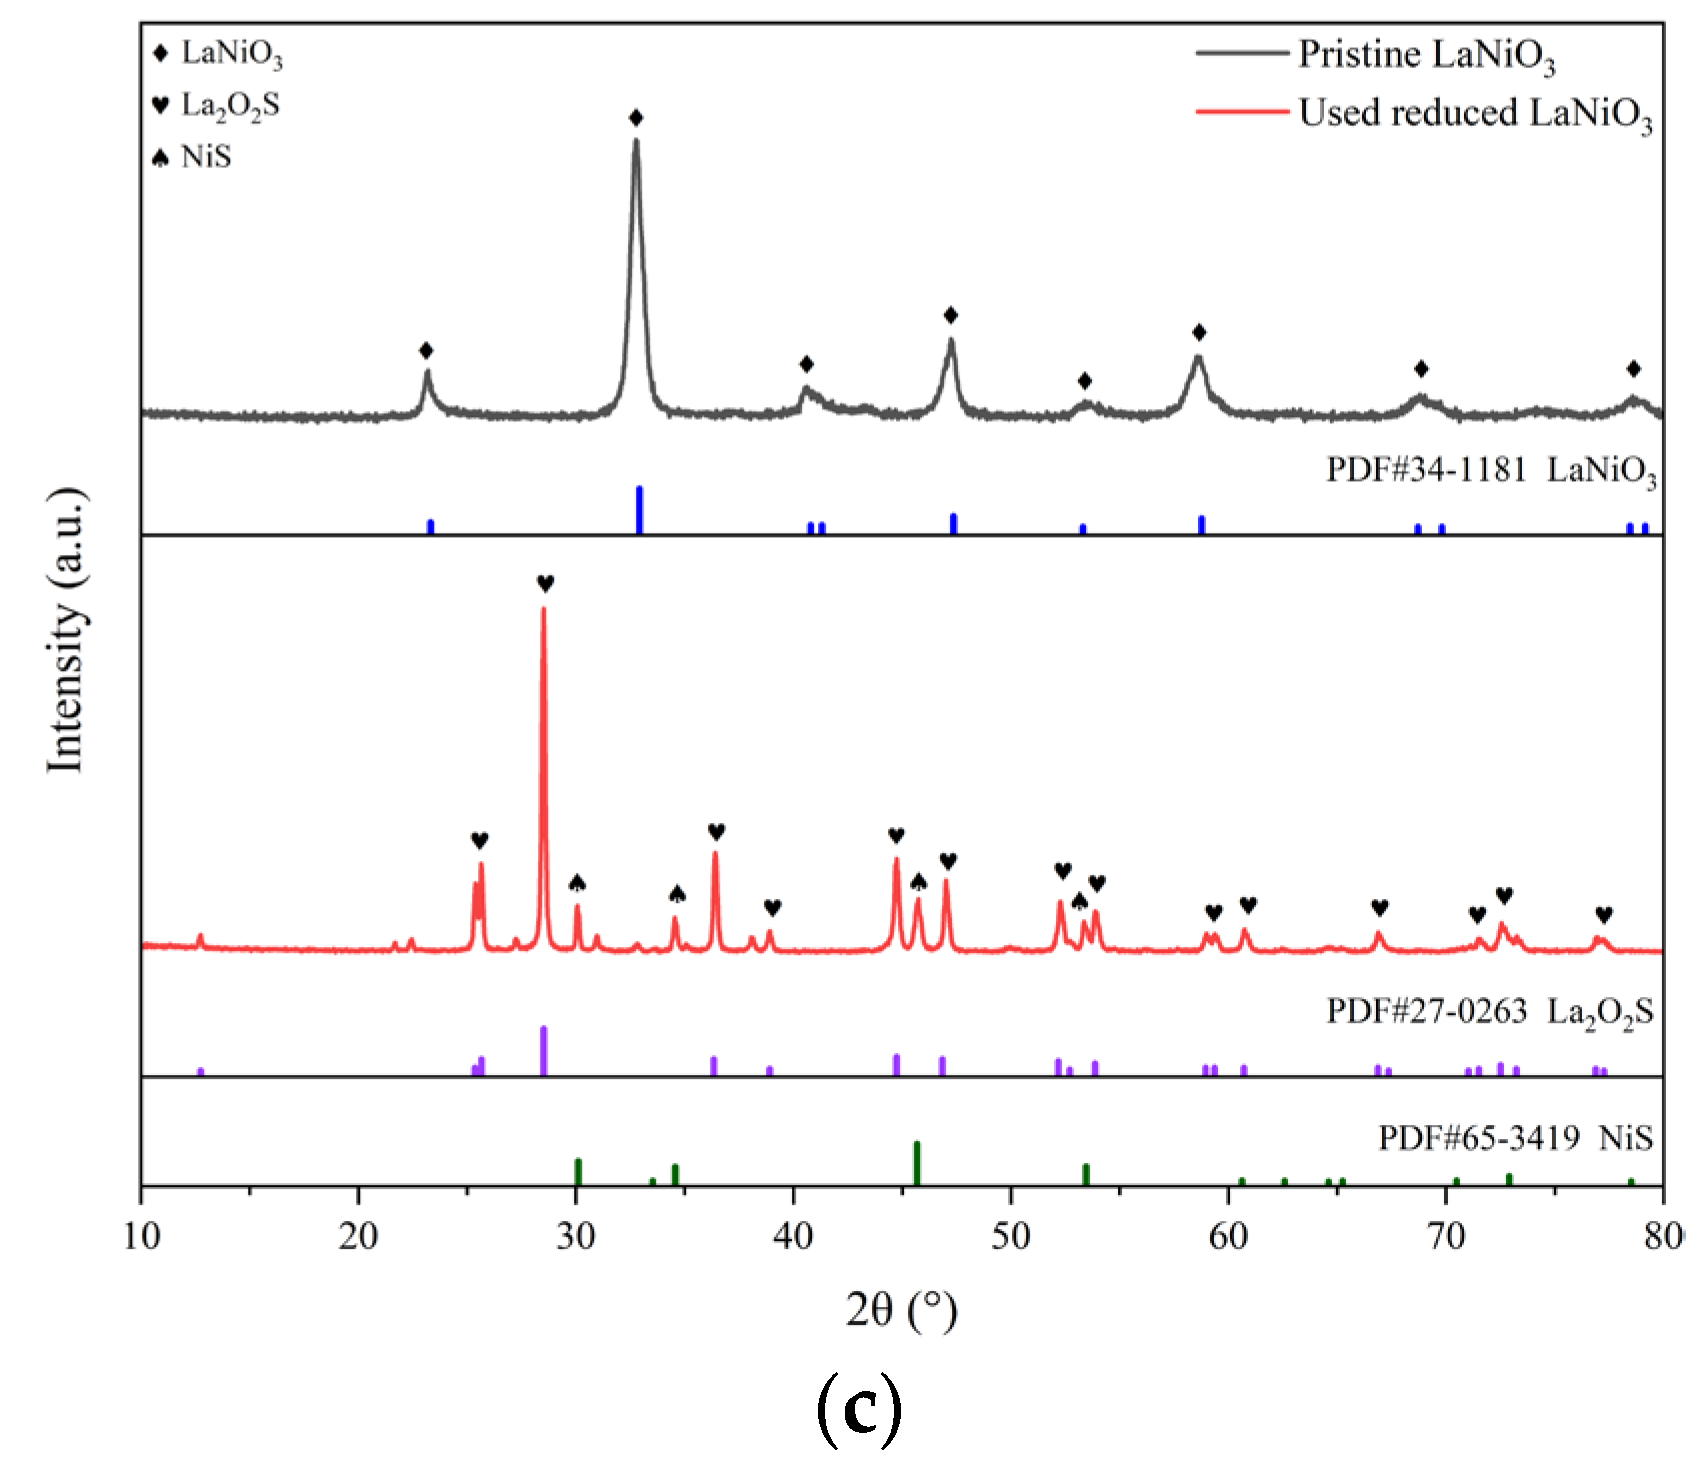
The XRD spectra of the three types of the catalysts in various states are spread out in
Figure 6(a-c). As shown in
Figure 6(a), the two samples of the MgO before and after the reactions involving H
2S are virtually identical in the appearance of characteristic peaks of crystal phases. Both of them can be assigned to the standard MgO of PDF #45-0946, indicating that there is little influence of H
2S on the crystal structure of MgO. For the pristine NiO/MgO, its characteristic peaks on XRD spectrum in
Figure 6(b) also look to be the same as those of MgO. This situation should be associated with the formation of solid solution of NiO and MgO. As revealed in the literatures, pure phase solid solution of brucite can be easily formed from mixture of NiO and MgO by isomorphous substitution, resulting in almost identical XRD pattern of NiO/MgO to that of MgO, due to the fact that bivalent cations of Ni
2+(0.62 Å) and Mg
2+(0.69 Å) have close ion radius [
24,
25,
26]. The formation of solid solution can favor the homogeneous Ni distribution in the NiO/MgO catalyst, despite of a NiO loading as high as 20 wt%. Incidentally, such a high NiO loading is fairly profitable to achieve better catalytic performance in dry reforming process, as already evidenced by a few researchers [
24,
27]. On the spectrum of the reduced NiO/MgO sample, there appears a small protrusion at the foot of the chief peak of MgO at 2
θ of 42.916°, which position is basically in concordance with the dominant peak at 44.507°of metallic Ni belong to PDF #04-0850. Making a comparison between the pristine and reduced NiO/MgO, one can notice the approximately consistent XRD spectra for the two catalysts both after the reactions involving H
2S. A few of characteristic peaks of NiS emerge beside those of MgO, manifesting that the sulfidation of Ni and/or NiO to NiS occurred during the reactions. The sulfidation phenomenon also exists on the catalyst of reduced LaNiO
3 as shown in
Figure 6(c), where the phases of NiS and La
2O
2S were transformed from the reduced LaNiO
3 after the reactions in the presence of H
2S. In consideration of the relatively close reaction results over different catalysts, it can be deduced that the catalytic performance does not depend greatly on the crystal phase of catalyst whether it is MgO, or NiS or La
2O
2S yet.
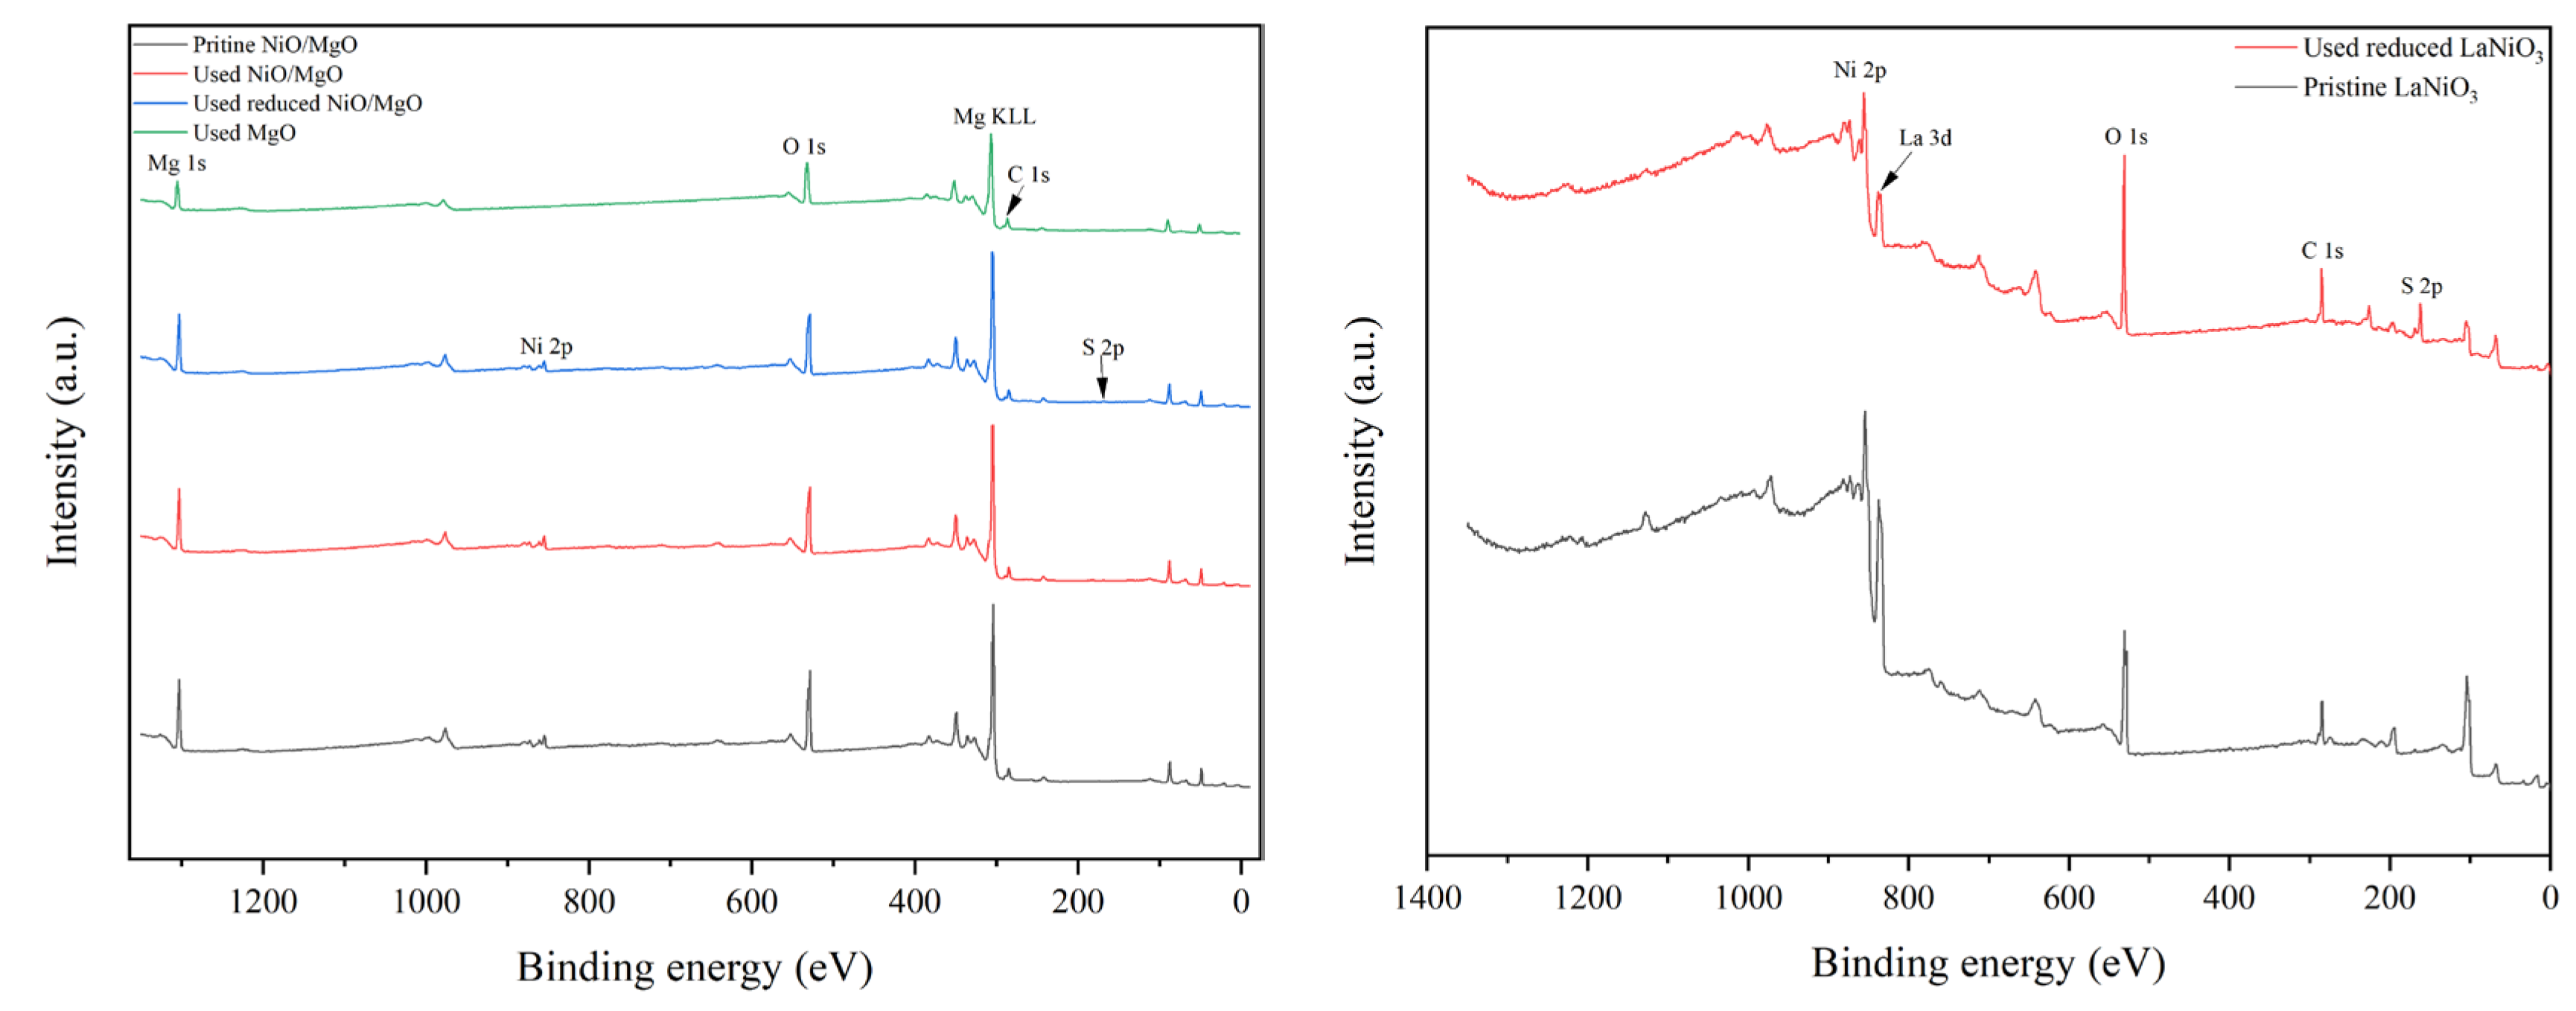
To deeply explore the active phase or sites on catalyst surface for the reactions, XPS investigation was carried out. The full-range spectra of various catalysts in different states are exhibited in
Figure 7(a, b). The characteristic peaks of the elements belong to the catalyst composition of MgO and NiO/MgO such as Mg, Ni and O can be easily discovered in
Figure 7(a). However, the signal of S 2p within 160-170 eV, which usually represents the existence of S element on catalyst, can hardly be probed on the surface of MgO used. The S 2p signal is also very faint for the used NiO/MgO catalyst, regardless of NiO/MgO was whether reduced or not before the reactions. In contrast, on the used LaNiO
3-reduced catalyst the peak of S 2p can be distinctly observed in addition to the peaks of La, Ni and O, etc. Taking into account more S-containing crystal species as La
2O
2S and NiS in the used LaNiO
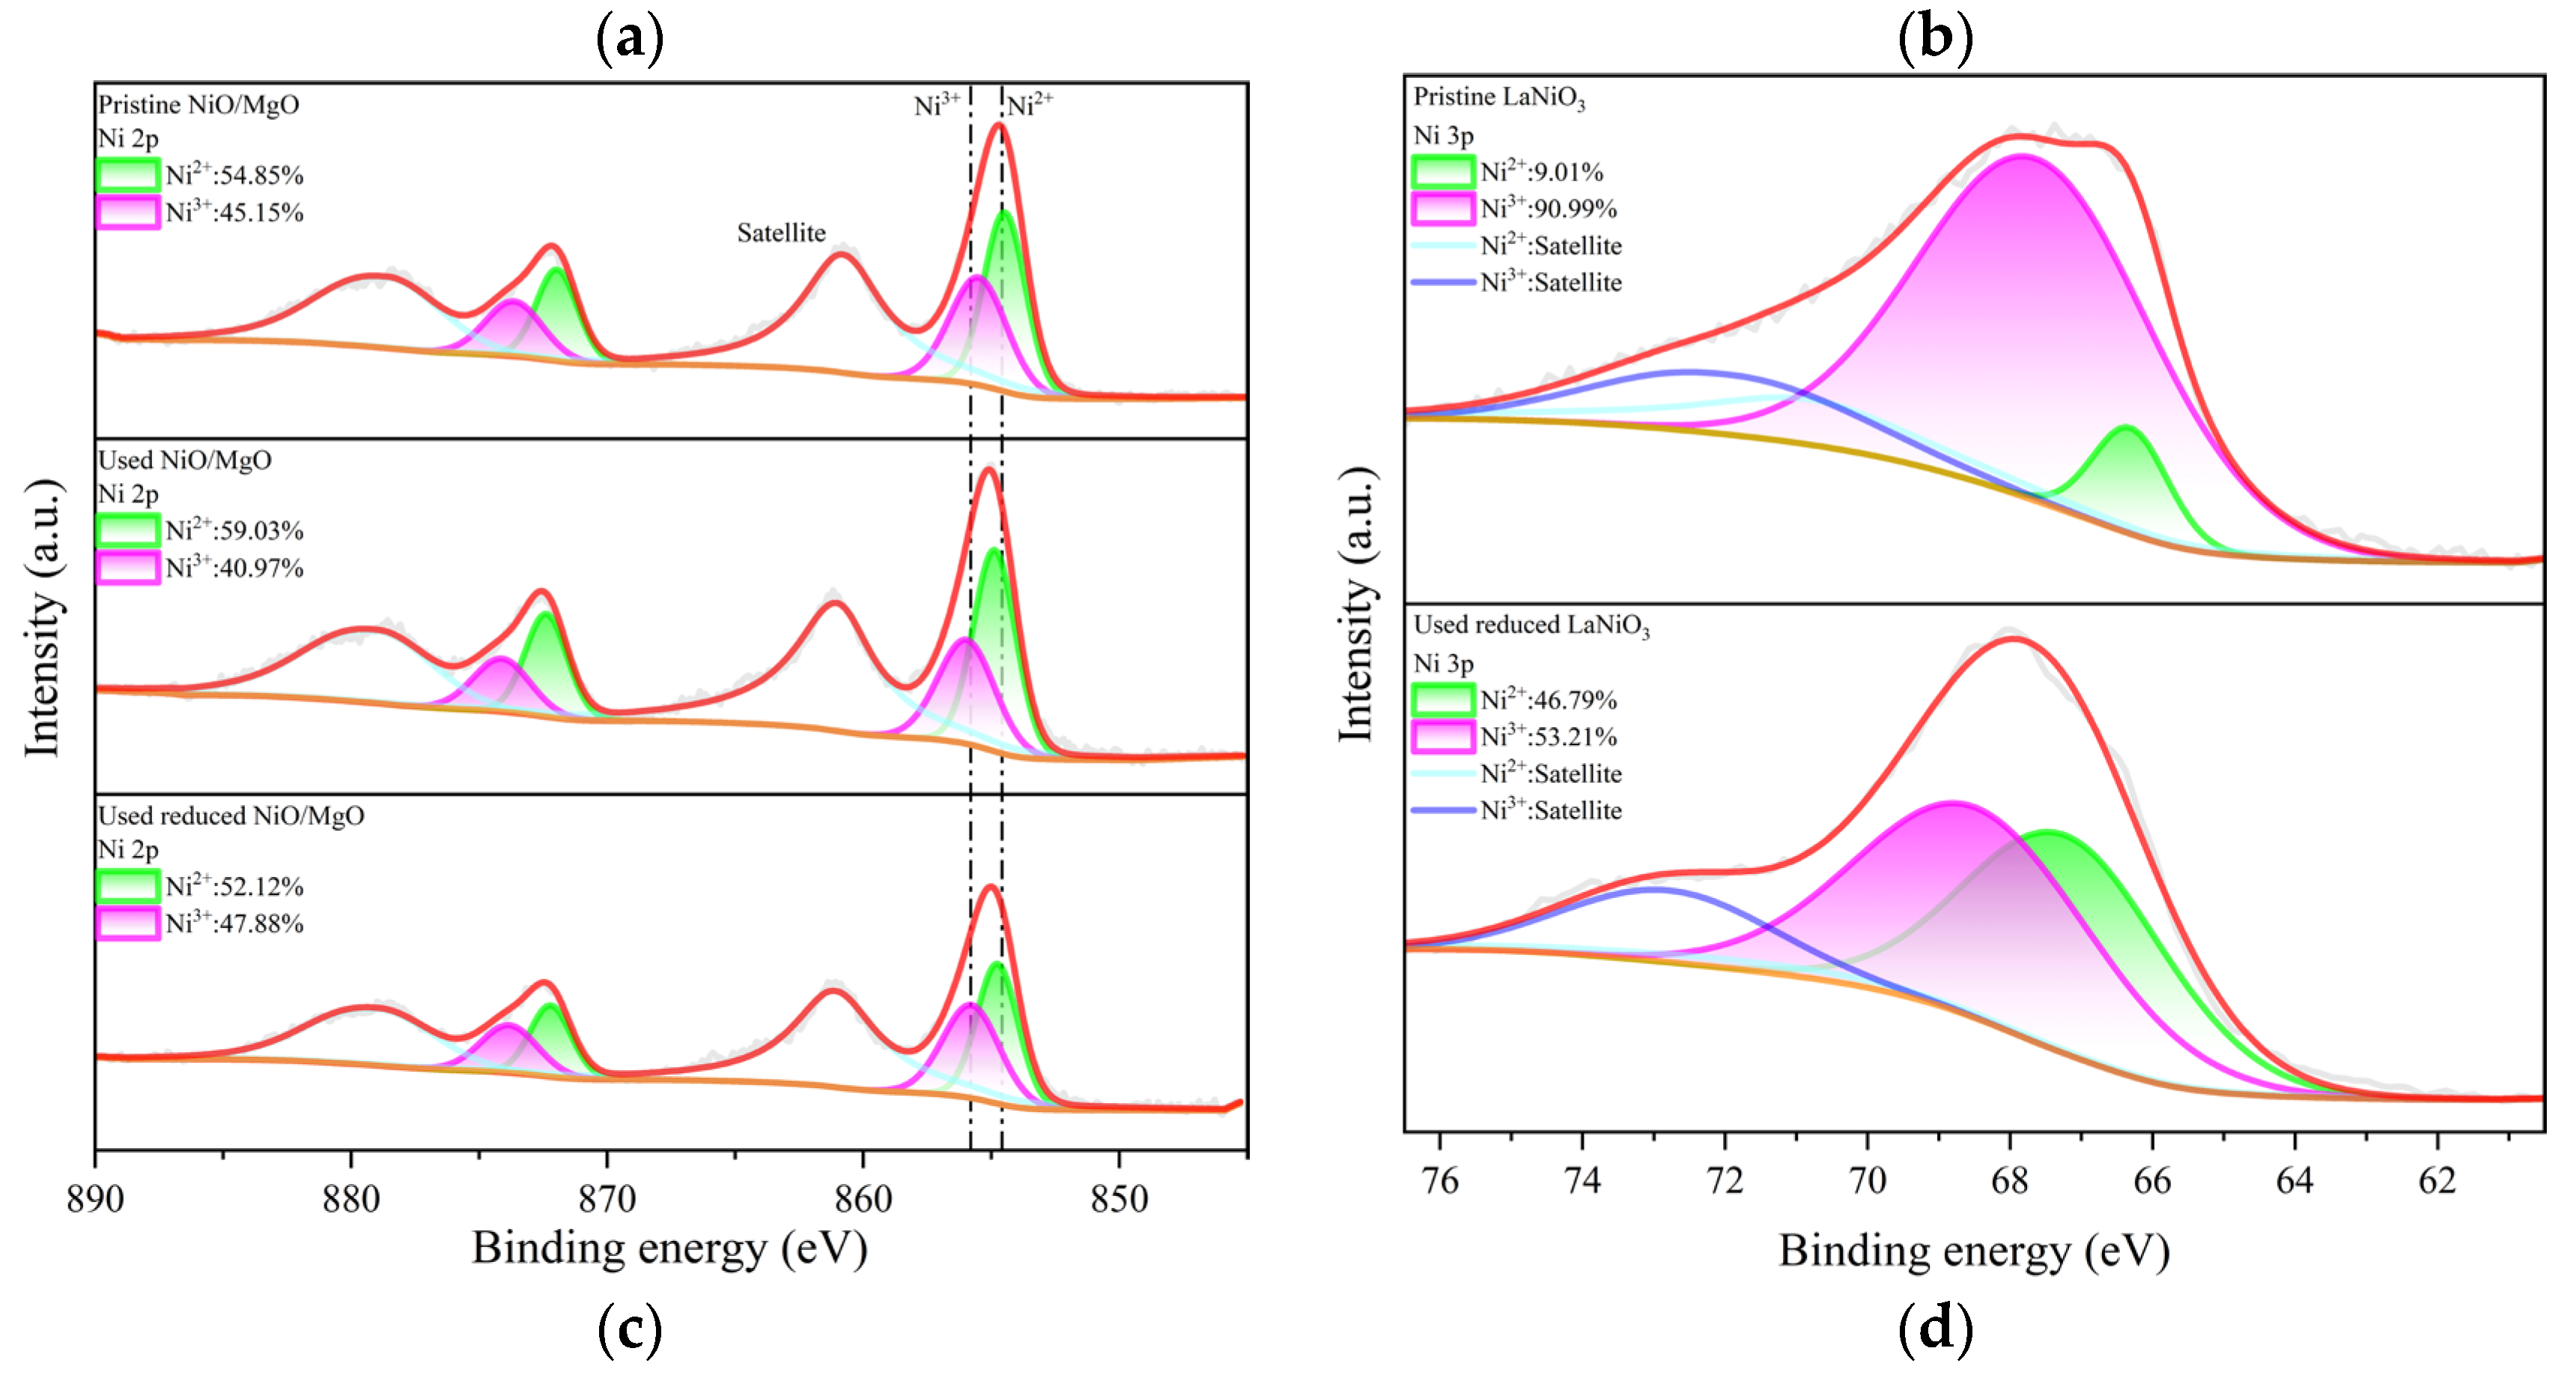
3-reduced catalyst than that in the used NiO/MgO catalyst, which owns NiS only, it is thus explainable for the higher peak intensity of S 2p of the former catalyst on XPS spectrum. Since the active sites for DRM reactions over Ni-based catalysts are generally associated with metallic Ni species, the chemical states of Ni involved in related NiO/MgO and LaNiO
3 catalysts were accordingly resolved, respectively, through deconvolution of the peaks of Ni 2p and 3p on fine-range spectra. The deconvolution results of Ni 2p
1/2 at 854.68 eV and Ni 2p
3/2 at 872.18 eV for NiO/MgO catalyst in different states are illustrated in
Figure 7(c), showing that there is a slight variation of the proportions of Ni
2+ and Ni
3+ after the catalysts experienced the reactions. This is not a surprise because the Ni valence in NiS phase should be approximate to that in NiO. Nevertheless, the deconvolution results of Ni
2+ at 66.38 eV and Ni
3+ at 67.88 eV both assigned to Ni 3p of LaNiO
3 catalyst in
Figure 7(d) unveil a significant difference in Ni chemical valance between the catalysts in pristine and in used states. The species of Ni
3+ was overwhelming in the pristine LaNiO
3, which evolved partially to Ni
2+ when the LaNiO
3 was subjected to the reactions in the presence of H
2S. The ratio of Ni
2+ to Ni
3+ in the used LaNiO
3-reduced catalyst is considerably comparable to that in the used NiO/MgO catalyst, in concert with the common formation of NiS in both catalysts. Therefore, the chemical state of Ni in the two types of catalysts during the reactions may be much the same.
It should be emphasized that there is no any active Ni species on the MgO catalyst. As discussed hereinabove, the catalytic performance of the MgO catalyst in the condition of H
2S presence is in no sense inferior to the two types of catalysts containing Ni species. This raises a question of what is the active center on the MgO catalyst for the reactions. In our early study, the catalytic activity of MgO catalyst was also found to be competitive to that of NiO/MgO and NiO/γ-Al
2O
3 catalysts during the reactions between CO
2 and H
2S at 800 °C, and consequentially free radicals initiated on the catalyst surface were supposed to dominate the reactions [
20]. In recent research of Wang et al., the key active sites were identified as sulfur species (S*) that are dynamically bound to metal cations during the reactions between CH
4 and H
2S at high temperatures, which was believed to be common for all the catalysts tested covering a wide range of oxides such as MgO, γ-Al
2O
3 and IUPAC group 4-6 metal-oxide-derived materials [
28,
29]. Being inspired by these viewpoints, we speculate that the adsorbed S species, which are formed ineluctably through H
2S dissociation on the surface of catalyst regardless of catalyst type [
28,
29,
30], may be the key to initiate the activation of CO
2 and CH
4 in the presence of H
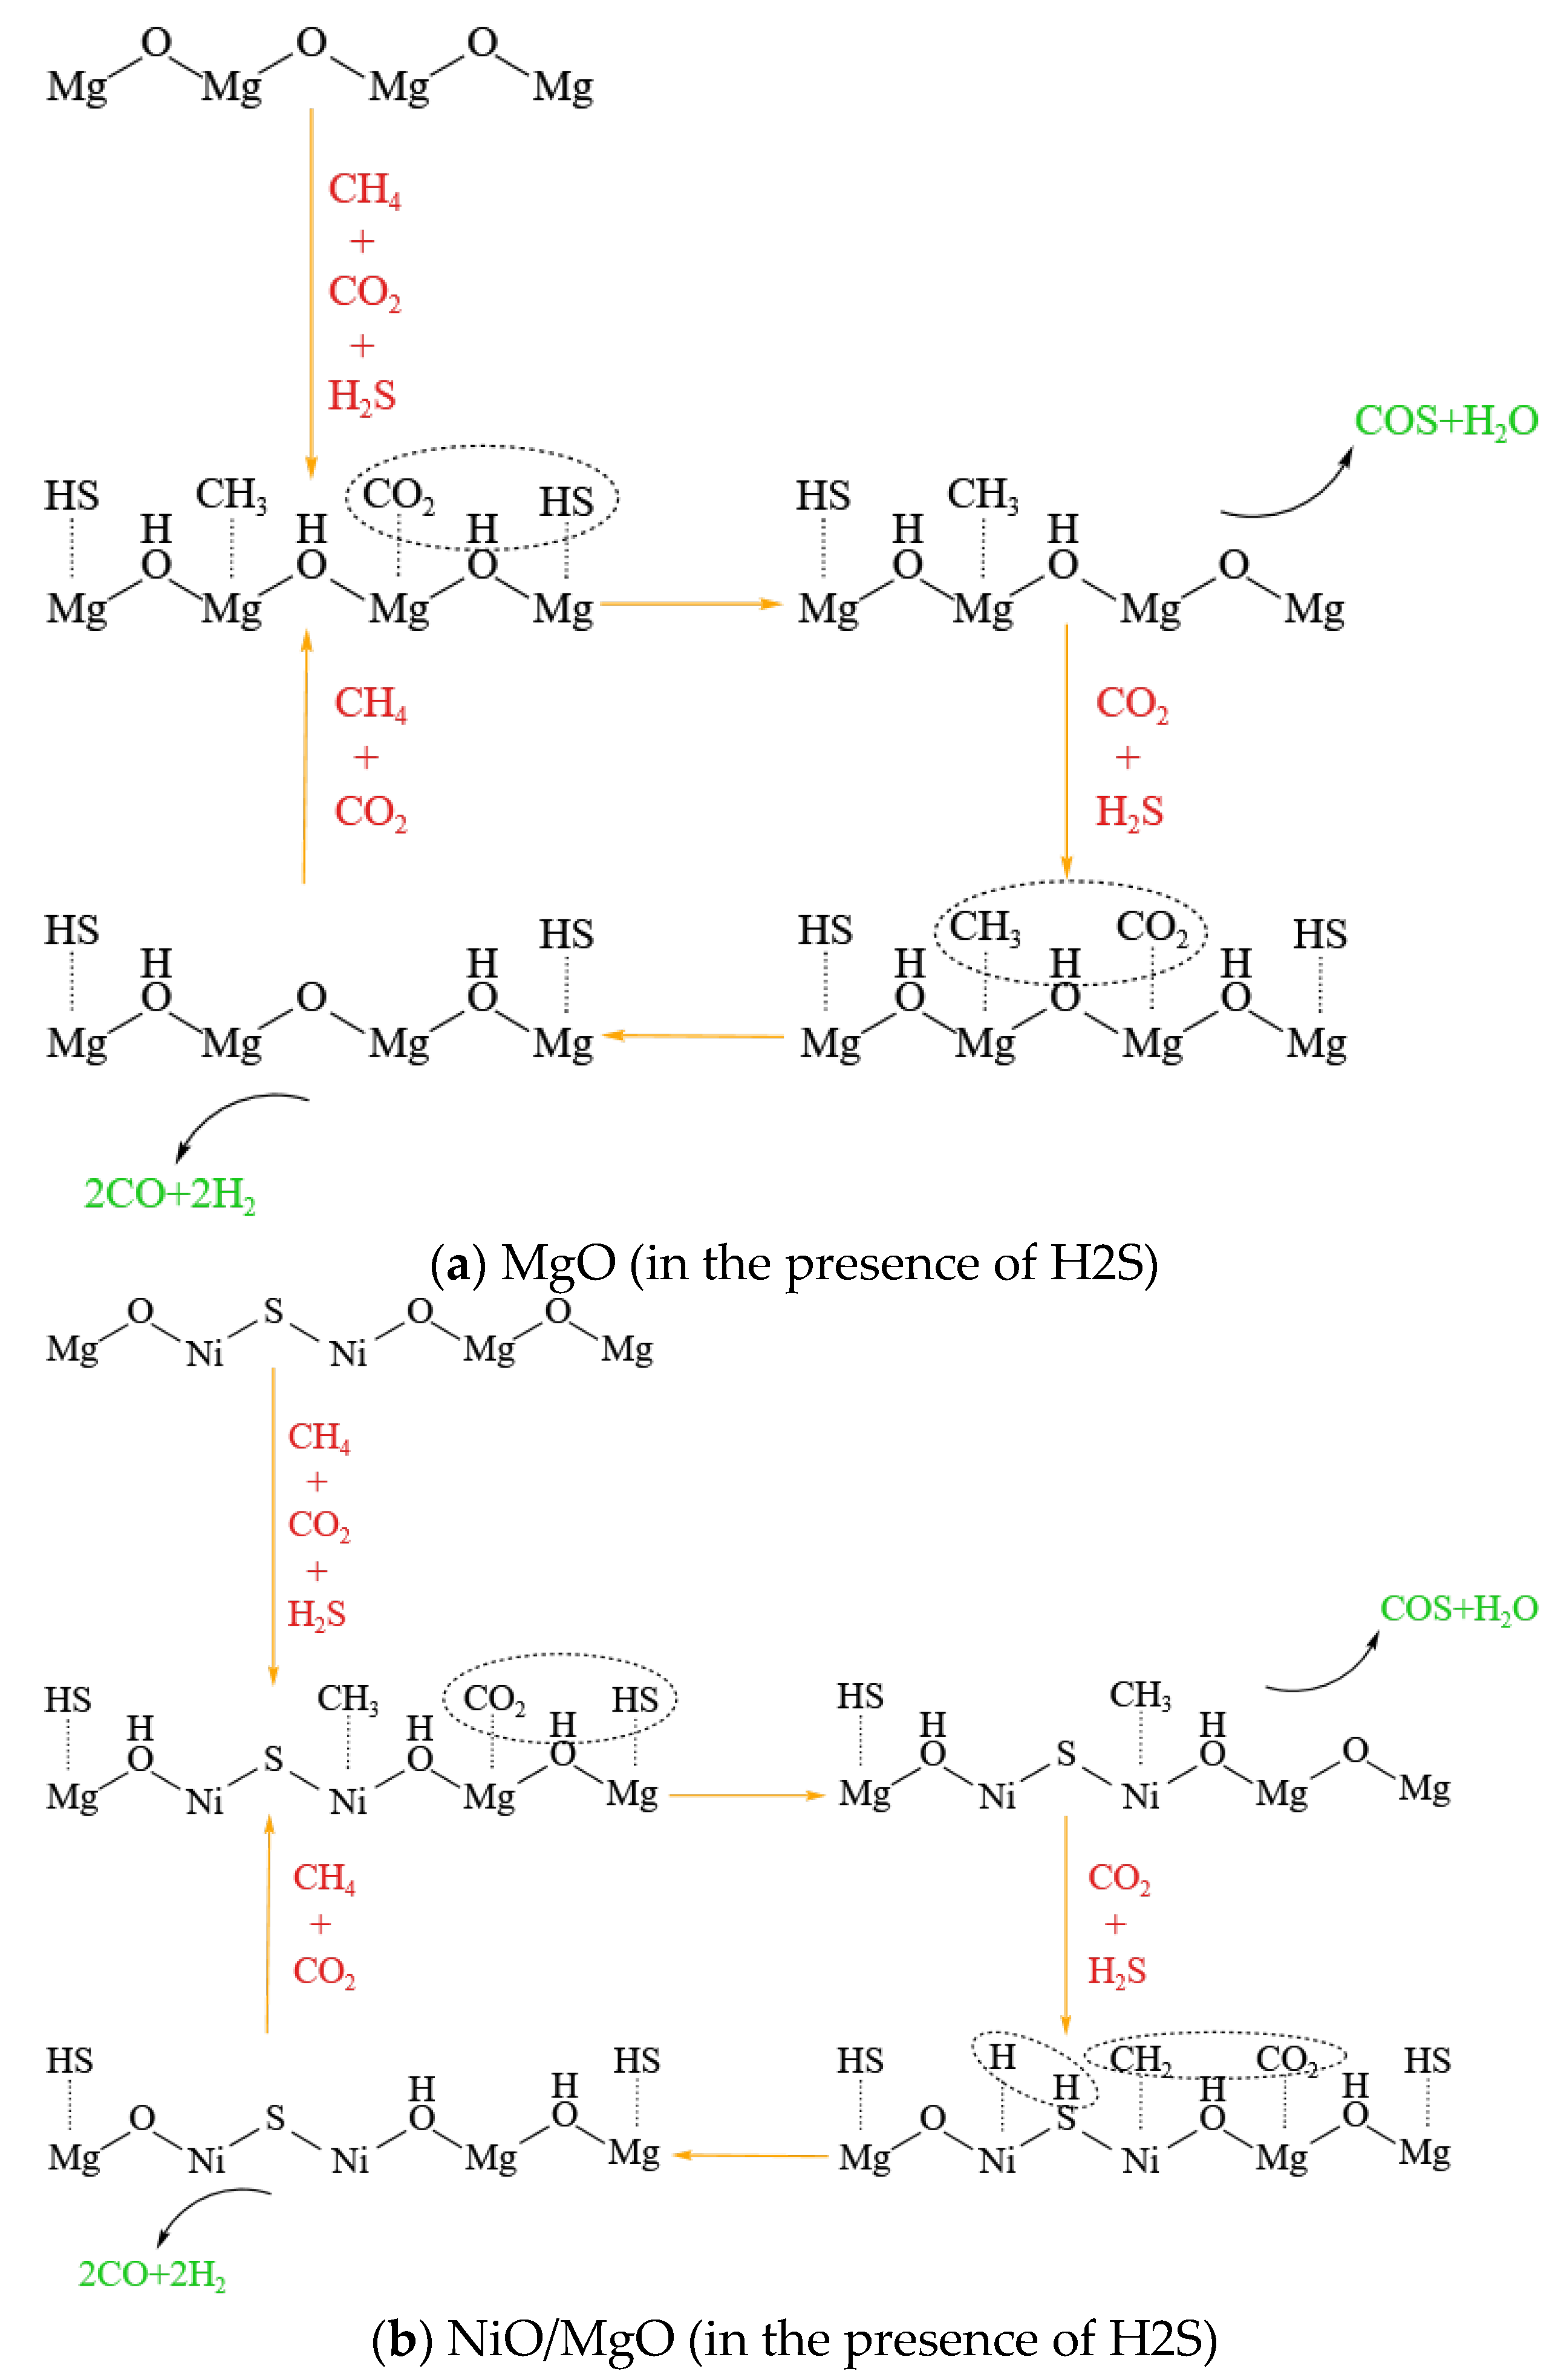
2S. A schematic diagram of the possible reaction mechanisms that may occur separately on MgO and NiO/MgO catalysts in the presence of H
2S is drawn as the examples and illustrated in
Figure 8(a, b). Regardless of whether MgO is loaded with Ni, its cations are supposed to be able to dissociate H
2S, thus promoting the conversion of CO
2 and CH
4.
Comparing with the high catalytic activity of metallic Ni active sites for DRM reactions, however, the catalytic capability of S-adsorbed species may fall into a disadvantage. Due to the inferior activity of S-adsorbed species along with the vanishment of metallic Ni active sites, the reduction in CO2 and CH4 conversions is inevitable in the presence of H2S. Despite all this, the addition of H2S with high concentration can undoubtedly promote the conversions by means of H2S participating the reactions with both CO2 and CH4. Moreover, the deviation in catalytic performance among the three types of catalysts, although weak, still could provide us with clues to improve catalyst. Developing a catalyst having large specific surface area, which can persist at high temperature to afford abundant active S-adsorbed species, may be beneficial to the DRM reactions in the presence of H2S.
