Preprint
Review

Philosophy and Practice of Flood Risk Communication and Education Informed by Critical Complexity

Altmetrics

Downloads

90

Views

34

Comments

0

This version is not peer-reviewed

Submitted:

24 April 2024

Posted:

26 April 2024

You are already at the latest version

Alerts
Abstract
Throughout its history Western science has tended to treat complexity as a problem to be avoided or solved. A philosophy of simplification achieved significant improvements in human life and prevails as a model for achieving societal good. However, misplaced efforts to control complexity worsen our sustainability challenges. Effective responses to modern day dilemmas such as floods and climate change require ways of thinking that are more congruent with the complexity of the world. Further, governmental programs to reduce flood risk depend on the support of an informed and engaged public. It has proven difficult to communicate risk in ways that align scientific and technical expertise based on an objective worldview, with communal and individual under-standings of risk based on subjective experiences and perspectives. I introduce Paul Cilliers’ philosophy of critical complexity as the basis of a new conceptual framework that values and balances complexity and simplicity. This paper shows how objective strategies that rely on analytic and probabilistic thinking can be integrated with subjective approaches that draw on the experiential and possibilistic. An example depicts how the problematic framing of the “100-year flood” can be replaced by a model of the data that covers a range of possibilities within an experiential time frame. Cilliers’ work opens an ethical dimension in which we make more intentional choices and acknowledge our limitations. Complexability – understanding how to live with complexity rather than aiming to simplify it – is a vital component of sustainability communication and education.
Keywords: 
Subject: Environmental and Earth Sciences  -   Water Science and Technology

1. Introduction

Hazardous flooding affects people in every region of the world.  According to FloodList [1] at least 2.3 billion people were affected by floods and as many as 157,000 people died as a result of flooding between 1995 and 2015.  Wealthy and technologically advanced countries with scientific and governmental apparatus to study flood risk and to prepare for flooding are not immune: since 2021 floods devastated parts of the U.S., Canada, Germany, Italy, Spain, and Australia among others [1].  Furthermore, some U.S. policies intended to reduce risk created additional, unintended risk (e.g., the levee effect) [2,3].  To face the emerging risks of climate change it is essential that we bring new ideas to bear to reduce the societal burden of flooding.
There is increasing awareness that relying on simplification and control-oriented thinking to address the nonlinear and emergent behaviors of complex systems, such as flooding, need to be balanced by approaches attuned to complexity [4–7].  When simplified solutions interact with the inherent complexity of the world the results can contradict the intentions of the experts [6].  For example, the application of a mechanistic paradigm to airline safety [8] can create a focus on finding a single cause for accidents (the broken part) rather than on understanding the systemic relationships that are involved.  The use of simplified models to engineer coastal protection can lead to outcomes that perversely endanger coasts they were meant to protect [9,10].  [ilkey,YoungandCooper[10] explain that “the simplifications and assumptions involved in reducing this complexity to equations and numerical models cause a deviation from reality such that models are unable to provide realistic predictions of coastal behavior.”  Overreliance on such models has made them “a standard weapon in society’s assault on the world’s coasts” ([10], p. 135).
A preference for simplified solutions is characteristic of the fundamental conceptual frameworks that underlie many aspects of societally acceptable practices.  Therefore different philosophical methods that seek to balance complexity and simplification are needed to critique and improve widely accepted and entrenched ways of thinking [11,12].  Rather than confining such methods to any single domain of society, all our thinking should be more coherent with the complexity of the world we live in to better address flooding and other sustainability challenges, which often appear as wicked problems [13].
Edgar Morin’s work [14,15] suggests a starting point for dealing with complexity: we have to acknowledge that complex systems are intractable and that some simplification is necessary to model them.  On the other hand, the more we simplify, the more we increase the chance that our vision and models will exclude aspects of complexity that are vital for success, as in the case of coastal modeling [10].  The philosophy of critical complexity, inspired by the work of Paul Cilliers [16], recognizes the importance of balancing the challenges of complexity and the attractiveness of simplification but also accepts that we inevitably have to make decisions without full knowledge of their implications.  This adds an ethical dimension to our decision-making: we are not taking responsibility for the choices we make if we routinely aim for simplification without being mindful of its pitfalls and the possibilities for creative engagement with complexity [4,17]. 
Section 2 offers a brief review of the conceptual issues around society’s approach to flooding in the U.S. that has led me to a new conceptual framework based on critical complexity.  Section 3. reviews how traditional frameworks operate in current flood risk communication strategies and includes an example of how the new conceptual framework could more fully engage people through risk communication and educational experiences.  The Section 4., Discussion, summarizes the new approaches and suggests how critical complexity could be useful to address other hazards such as climate change. 

2. Conceptual Issues and a New Framework

2.1. The Traditional Objective Framework

Early humans recognized patterns in their environment on temporal and spatial scales useful to survival, such as when and where animals were likely to move and when and where to plant crops.  Today we say that they dealt with complex systems by recognizing their simplexity: patterns of complex behaviors linear enough and persistent enough to be useful [18,19].  During the last millennium, rules of observation, quantification, and analysis were developed, largely in the sciences, to formalize the advantages of simplexity.  Simplifying the highly interconnected, open systems in nature by isolating their parts made it possible to formulate basic scientific laws, and expressing these laws in mathematical form made it feasible to predict and control the world in ways that were previously unimaginable.  Nature came to be seen as an adjunct to new machines that vastly improved human life: a warehouse of resources and a dumping ground for wastes.  The early success of simplexity, derived from actually living with complexity, was replaced by simplification, in which complexity became a problem to be solved or avoided.  The old intuition that nature was powerful and inexplicable was replaced by the idea that the world could be purposefully remade to suit human purposes [20].   
Strategies of simplification pervade societal decision-making today.  During the Scientific-Industrial Revolution highly complicated machines, such as looms, required specialized personnel who could design, build and repair them.  An analogous idea, deeply embedded in our present-day worldview, is that society needs to depend on scientific and technical experts, such as hydrologists and risk analysts.  For experts to be societally credible they need to share an objective basis for knowing the world.  As a result, experts generally share the fundamental knowledge and methods in their field while possibly differing on specific applications.
It has long been advocated that the public generally needs to be better informed and engaged rather than giving experts the chief responsibility of recognizing and responding to flood risk.  “Identifying sound, credible, and effective risk reduction priorities and solutions depends greatly on a well-informed public.  The public should be knowledgeable about risk issues and should be given opportunities to express opinions and become involved in risk assessment and risk management activities” [21]; and this theme is underscored in more recent publications [22–25].
An important question is whether the public can gain an understanding of risk sufficient to make informed decisions based on objectively constructed ideas communicated by experts.  Despite a stated desire to engage the public, it is proving difficult to find alternatives to expert-oriented communication that would more nearly match the complexity of both flooding and the psychosocial diversity of the general population [26,27].  For example, the U.S. Federal Emergency Management Agency’s webpage for home owners, renters, and business owners (as of January 2024) portrays flood zones as “areas with a 1% annual chance of flooding and a 26% chance of flooding over the life of a 30-year mortgage.”  As Lutz [26] discusses, the meaning of a small probability (1% per year) playing out over time is difficult for people to comprehend, and not everyone will gauge their exposure based on a 30-year mortgage.  Probabilities and flood zone maps inform people where experts have designated hazard zones but they don’t provide opportunities for non-experts to become more knowledgeable about risk or to think broadly about their futures in relation to flooding.
A related consequence of a philosophy of simplification is that it encourages solutionism: the expectation that experts can find solutions for all problems.  In this way of thinking, society comes to see science as a process of fact generation that supports expert-generated solutions rather than an open-ended process of discovery [28,29].  Solutionist policies “have an immense appeal in a political system that is geared to invoking science, not as a process of adaptive inquiry, but as a source of expert authority for claims that problems are being solved” [30].  Solutionist thinking perpetuates the comforting but unrealistic idea that hazards of all kinds can be eliminated if we just “follow the science.”  However well simplification and solutionism might work to provide answers for society’s immediate problems they do not engage the complexity of the systems on which long-term sustainability depends.

2.2. A Framework for Critical Complexity

The philosophy of critical complexity calls attention to the freedom and responsibility we have to shape our conceptual systems to be coherent with the complexity of the world in which we live.  Our dilemma is that there are no a priori rules for how such coherence is to be attained.  I draw on Cillier’s work on the nature of boundaries in complex systems [31,32] to suggest a strategy to balance the ontological complexity of natural and psycho-social systems and epistemologically valuable restrictions of complexity in our conceptual frameworks and communications.  I refer to the ability to recognize and change conceptual boundaries to respect complexity as complexability, a skill necessary for sustainable living.  Kagan ([5], p. 463) states this elegantly as “A culture of sustainability would be a culture of complexity.”
Complex systems are intrinsically open but develop boundaries that both restrict and maintain possibilities for interaction [6,16,31].  For example, our lives depend on our skin simultaneously separating us and connecting us with our environment.  We also develop conceptual boundaries that limit some and encourage other modes of thought.  Academic disciplines and areas of expertise are “skins” that can restrict the interplay of knowledge and ideas as well as guide syntheses (e.g., “biology” becomes part of “biogeochemistry”).
Societal dependence on expert knowledge reflects a highly restrictive, one-way boundary taught in our academic systems.  Teachers and professors transmit knowledge but are not expected to be meaningfully educated by their students.  This type of education, which conditions non-experts (i.e., the public) to accept what experts say, is based on a high valuation of objective knowledge.  For example, academic courses are defined solely by their content.  The ability of students to transfer course credits from one institution to another depends only on establishing the equivalency of content.  Risk communication commonly is based on analogous attributes of one-way communication of objective knowledge framed by experts.  For example, the lines on a flood insurance risk map (FIRM) are examples of restricted communication, meant to control land use and encourage purchase of flood insurance, not to inspire deeper learning or discussion.
In contrast to objective knowledge used by experts, the public is more attuned to subjective knowledge conditioned by individual and social experiences.  If we take seriously the idea that the public should be knowledgeable about risk issues, use opportunities to express opinions, and become involved in risk assessment [21], then we need to find ways to connect and balance subjective and objective ways of understanding risk.  Opening up the restrictive, objective boundary will include people without technical training, who will respond to the threat of floods partly based on their individual, subjective experiences, contexts, and concerns [33].  We already grasp the objective “end” of complementary objective-subjective binaries and we must find the other.  [ennett,Solan[34] posit in their work on “Seeds of Good Anthropocenes” that the understandings needed to live sustainably don’t need to be discovered de novo; they are already present in overlooked or neglected philosophies, scholarship, and practices.
A first step is to use critical complexity as a lens for a literature review to find instances in which the objective approach is usefully critiqued and the value of incorporating subjective approaches is emphasized.  Figure 1 summarizes my review for flooding as a conceptual space that incorporates complexability.  The central core, bounded by a solid line, contains objective concepts valuable to experts as they search for technical solutions to flooding: disciplinary research, quantification, the rationalist paradigm of probabilistic and analytic thinking, and top-down management.  Each concept in the core (Figure 1) is linked (double-headed arrows) with a partner outside the blue ring that is more attuned to subjective understanding.  The arrows represent complexability: the adjustment of the boundary of responsibility. 
Concept pairs were selected from references (Figure 1) in the literature that has developed around hazard risk management.  These pairs suggest “axes” along which to balance objective and subjective ways of knowing.  These include (Figure 1): 
  • Bringing the long-established prevalence of top-down management and communication (from experts to the public) into constructive tension with participatory governance to allow a diversity of stakeholders to contribute to decisions [24,38,40].
  • Applying transdisciplinary thinking [41,42,43] to guide flood scholarship. Conventional disciplines become barriers to investigating multi-level interactions and the study of sustainability in a multi-level world [44]. Transdisciplinarity opens up possibilities for societal understanding of hazards and options for mitigation that are currently obscured by disciplinary perspectives [35].
  • Utilizing constructivist approaches that see “risk as socially constructed and shaped and constrained by social environments” [23] to help people move beyond the rationalist paradigm that hazard protection has to be based entirely on decisions made by experts.
  • Balancing the expert-oriented task of quantifying the risks with an understanding of what society needs and the systemic change required to improve a community’s life – which may extend well beyond the need for flood safety [36,45].
These authors don’t indicate that they were motivated by a philosophy of complexity.  An advantage of critical complexity is that it alerts us to the possibilities for creative tension between complementary objective and subjective ideas, and motivates us to be more intentional about finding objective-subjective balance.
In this paper I work with two objective-subjective concept pairs that offer further improvements in engaging and educating the public about the risks of flooding.  Analytic thinking aligned with the objective worldview has been “placed on a pedestal and portrayed as the epitome of rationality” [37].  As a result, the value of subjective understanding has been minimized and analysis-based rationality has come to dominate contemporary discussion of hazards.  But lovic,Finucane [37] note that analytic thinking is actually incomplete unless guided by experiential thinking, which recognizes a subjective aspect to hazards: individuals and groups develop their own differing images, metaphors, and narratives.  From a critical complexity perspective (Figure 1), we should adjust the boundary of responsibility for risk management so that analytic and experiential thinking are both constantly in play and draw on one another.  In this way the human desire for order and authority is balanced against the emergence, nonlinearity, and incompleteness of complex experience [46]. 
Clarke [39] directs a similar critique toward probabilistic thinking, a core aspect of hazard planning and forecasting.  “Scholars… take for granted that a probabilistic approach to the future prescribes a set of rational principles that should drive decisions, actions, and policies.  Probabilistic thinking is clearly the chief rhetoric of rationality in the modern day” [39].  Clarke suggests possibilistic thinking (Figure 1) as a counterbalance to probabilism.  A possibilistic perspective foregrounds the consequences of events that dominate the public’s concerns about flooding. 
The analytic and probabilistic modes are essential to inform planning and engineering related to managing flood risk.  Bringing them into conversation with the experiential and possibilistic perspectives is also essential to communicate risk to the public and to educate them about planning and engineering proposals that will affect them.

3. Bringing the Conceptual Frameworks to Practice

3.1. Traditional Analytic and Probabilistic Framework in Practice

Beginning in the 18th century, engineered structures such as levees were built to control runoff and streamflow [47].  In the 20th Century, policy shifted from controlling water toward regulating human development [28].  The National Flood Insurance Program (NFIP) mandated the designation of regulatory floodplains and provided for means to limit or prevent floodplain uses that could lead to destruction of property or loss of life.  Levees and regulatory floodplains, based on probability concepts, are used to seek a societally acceptable level of risk.  For example, the heights of levees and the boundaries of floodplains are designed to achieve a given probability of failure, usually 1%/year, meaning that the height of a levee or the limits of a floodplain will be exceeded with that probability.
Overreliance on structures and mapped boundaries to mitigate flooding can lead to a misleading understanding of risk based on the unrealistic belief that analytic methods can ultimately control nature [11,48,49].  For example, the “levee effect” refers to the belief of those living behind levees that they are entirely “safe” from flood waters [2,50].  The “thin grey lines” on flood insurance rate maps (FIRM) that demarcate flood plains convey the risk of flooding as definitive and therefore tend to discourage discourse [51].  As a result, awareness and concern about floods diminish; thinking and behaviors change to accept safety as the norm [2,50,52], exposing even more property and lives to risk.  When levees are overtopped, as they inevitably are, new solutions are sought in an attempt to achieve greater and more certain control. 
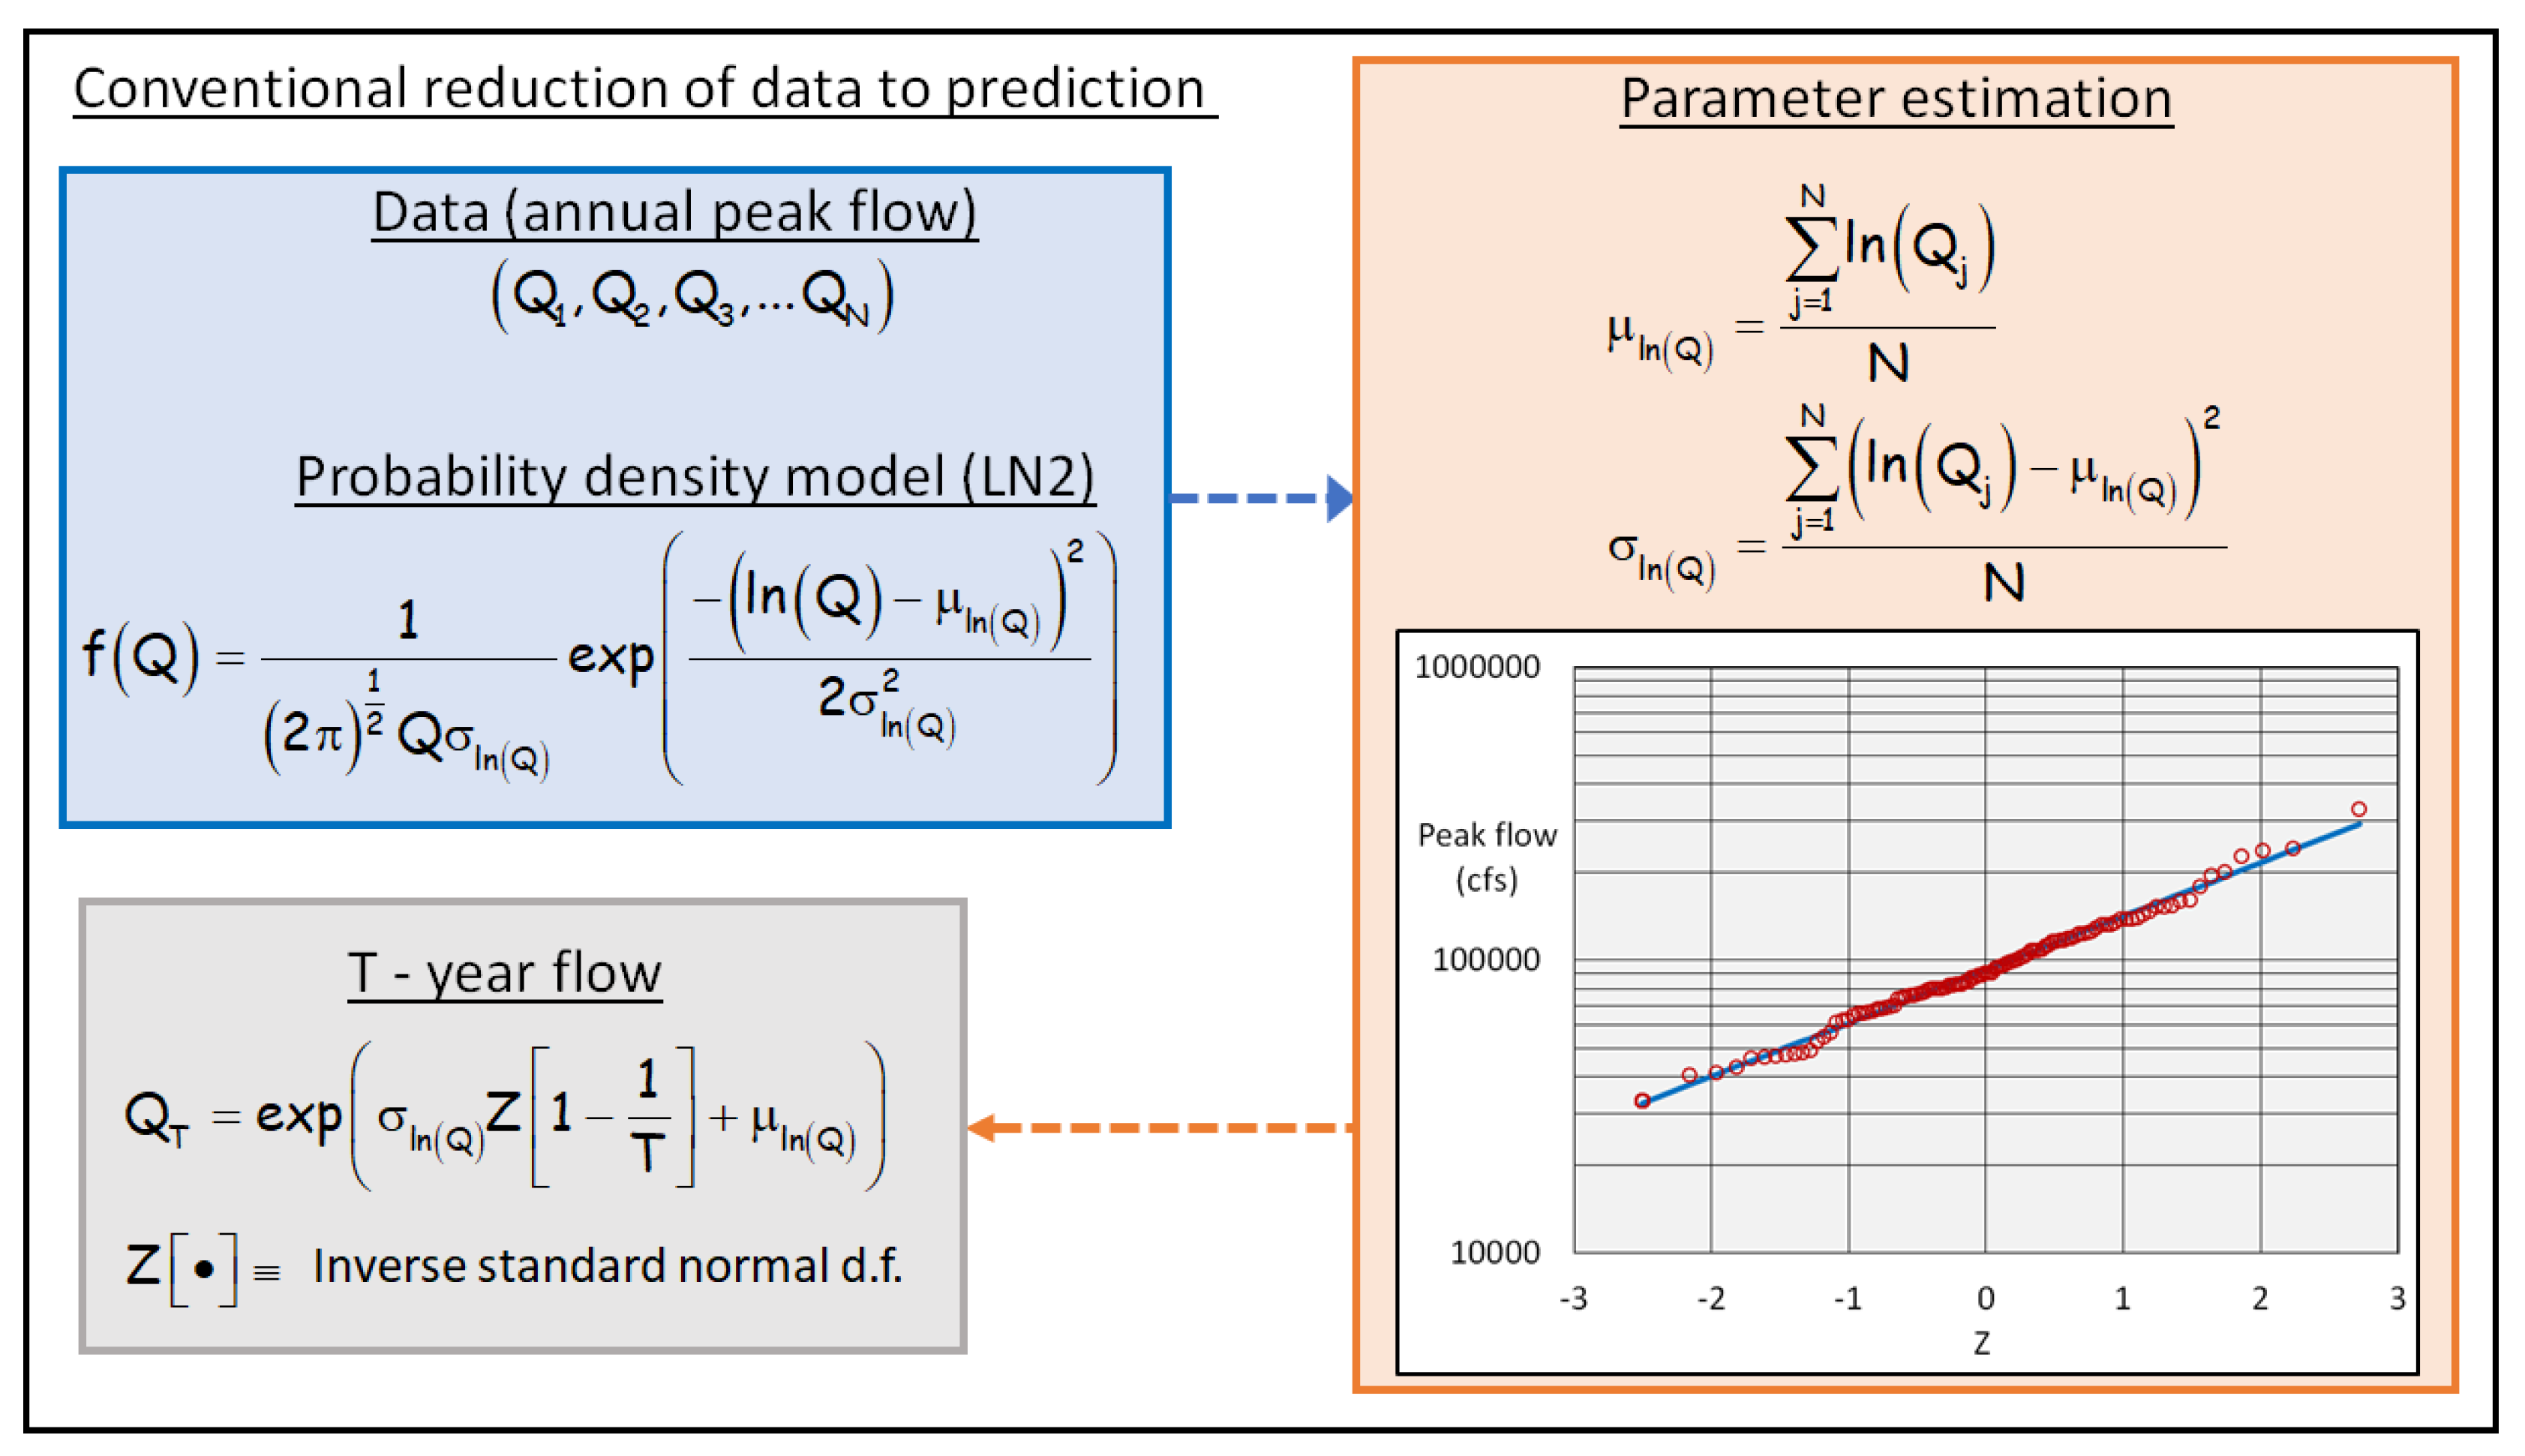
Procedurally, a historical record of a stream’s annual peak flows is analyzed to find a statistic: the flow (Qp) with a given annual probability, p, of being exceeded (e.g., “1%/year flood”), or equivalently the flow (QT) that will be exceeded every T years on average (e.g., “100-year flood”).  Figure 2 outlines how stream data and a probability model are combined to estimate parameters, from which the flow with average recurrence interval T (QT) is calculated.  The two-parameter log-normal distribution (LN2) ([53], p. 97, Eq. 5.2.1]) is used for illustrative purposes.  The public is not expected to understand the quantitative, statistical manipulations (Figure 2) or their application [28] but to accept QT as an authoritative aspect of floodplain regulation.
The analytic and probabilistic concepts used to design levees and floodplains have been widely inculcated into the communication the public receives about flooding.  For example, the “100-year flood,” is integrated into the vocabulary that the government, news media, and educators use to describe flooding and its risk.  Lutz [26,54] relates problems that arise from teaching flood risk to students in an introductory college course from this perspective.  The issues originate from a disconnect between the way ordinary people experience risk and probabilistic expressions of risk.
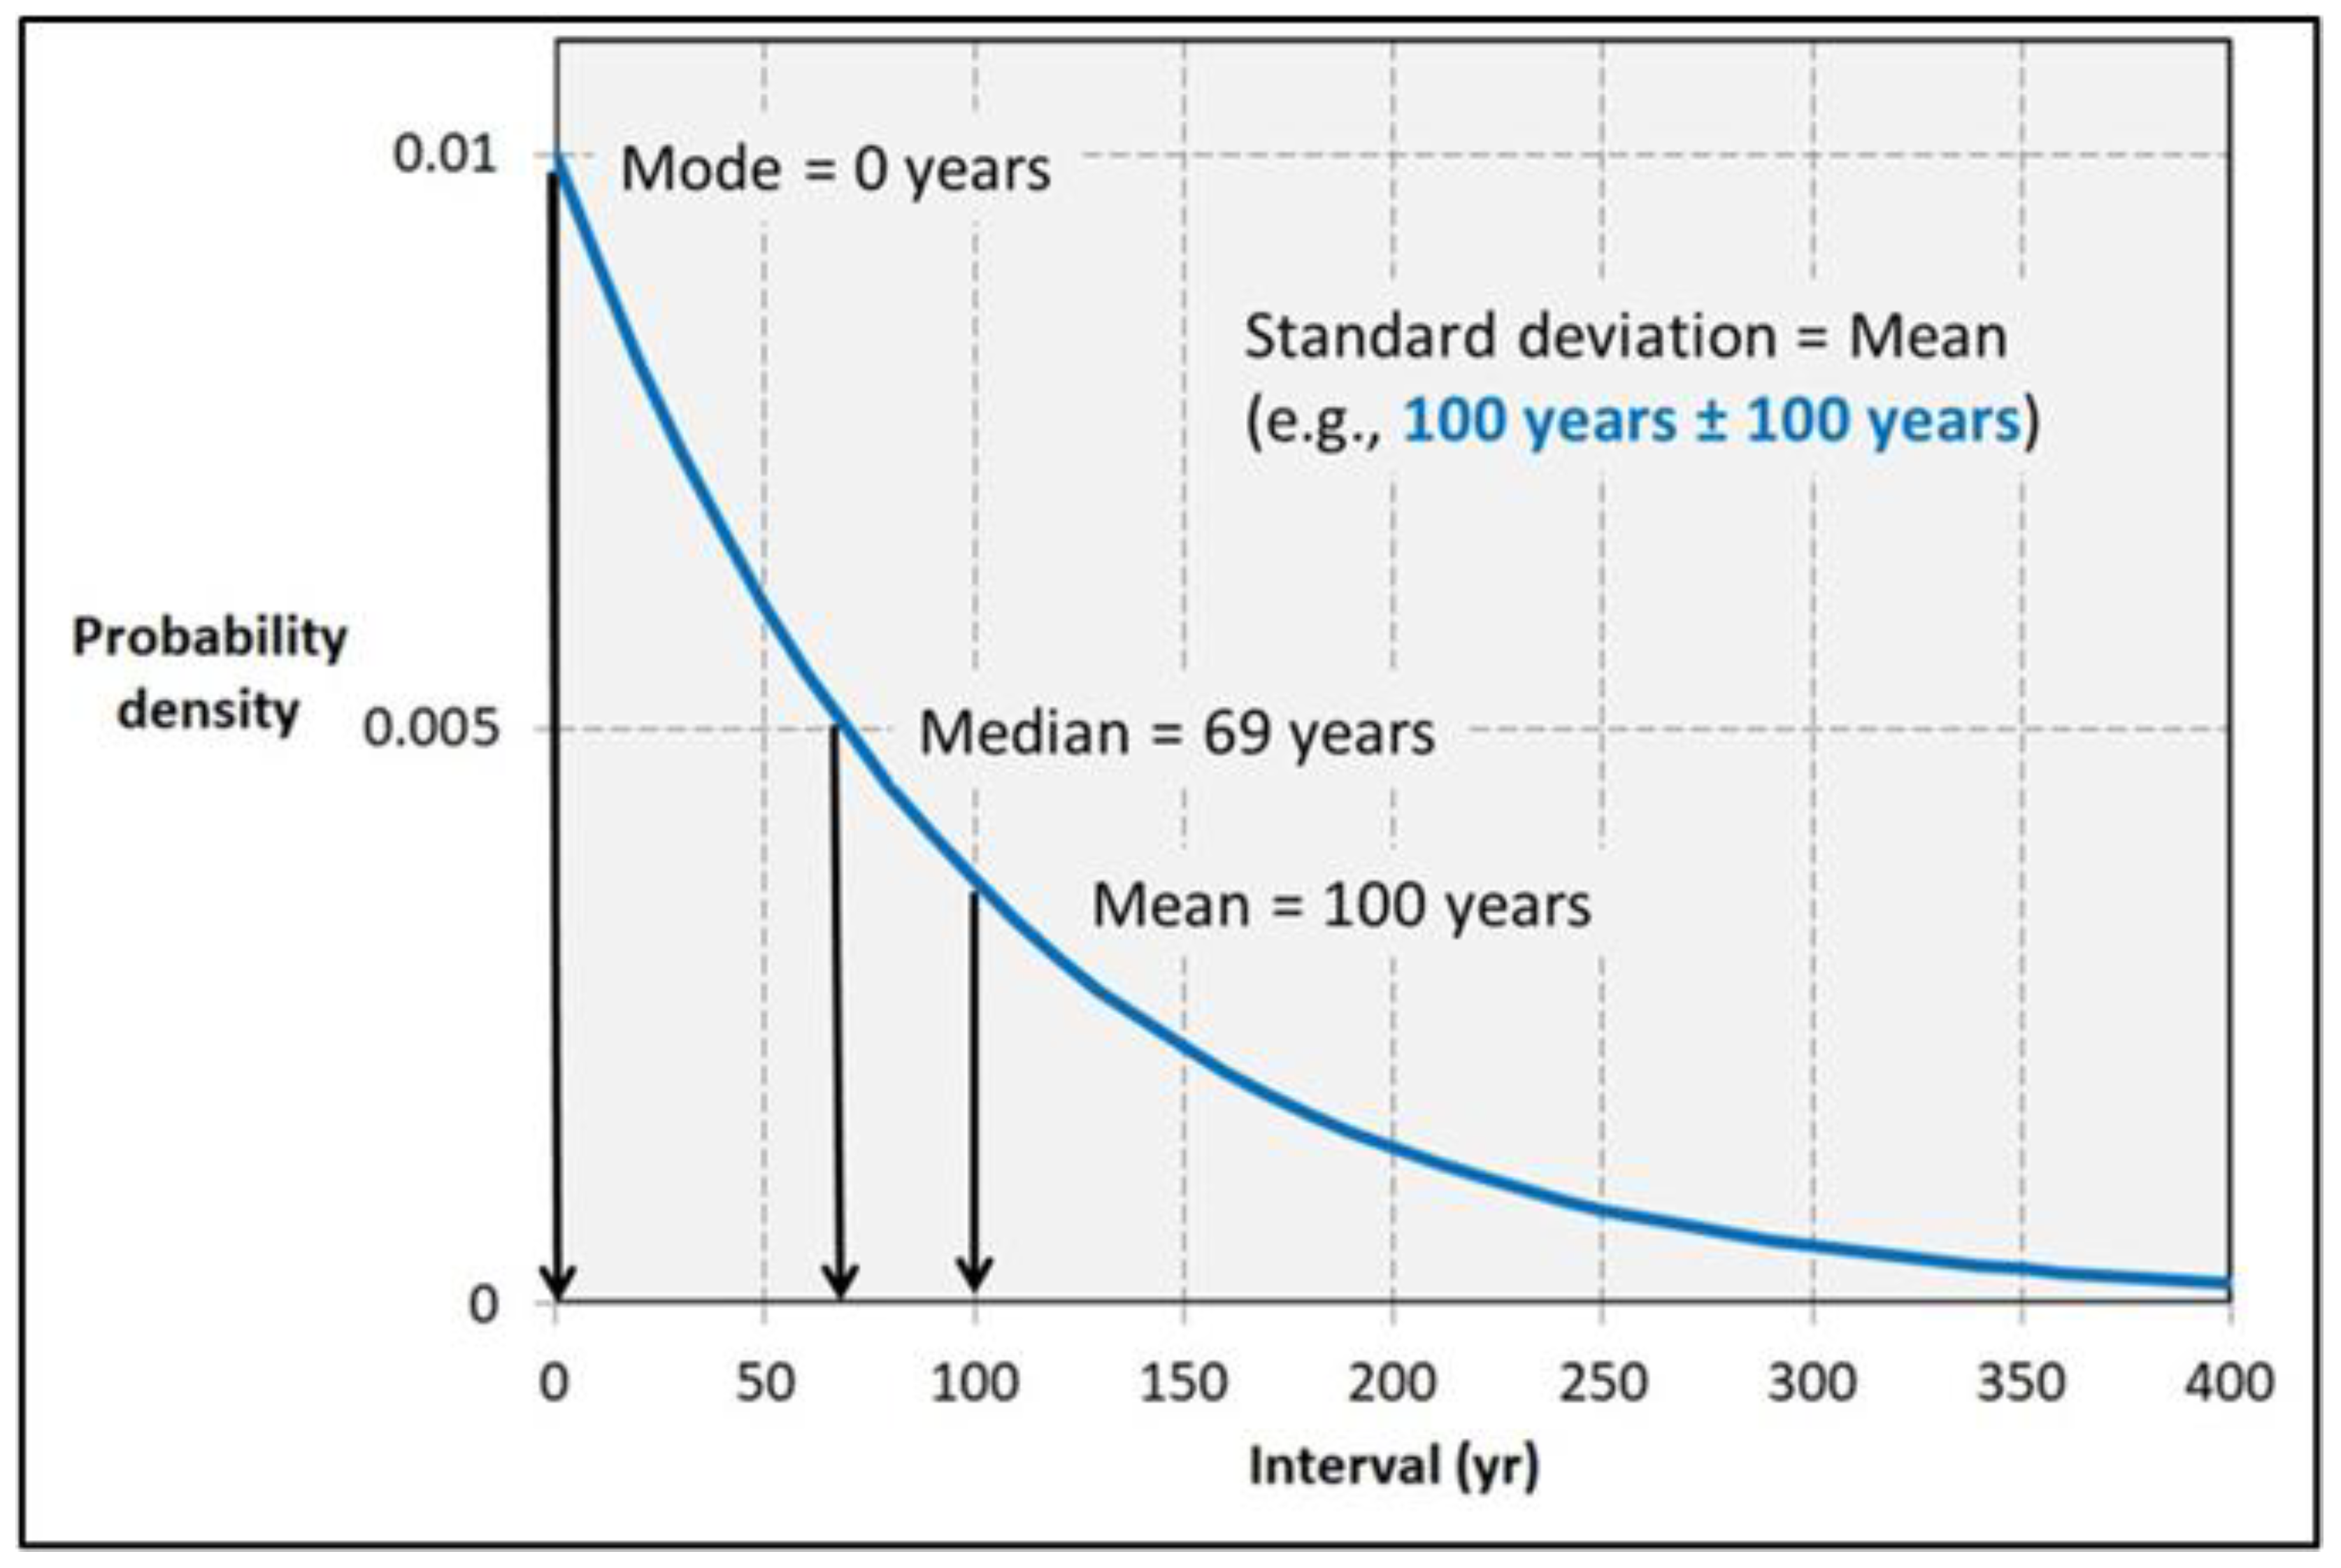
  • Recurrent events experienced in everyday life often occur at nearly fixed intervals, such as weekly, monthly, or annual meetings. We are conditioned to expect a small degree of irregularity (e.g., a monthly meeting might not recur on exactly the same day of the month). But experts model recurring hazards, such as floods, as random events. The public’s preconception does not match the probability distribution of recurrence intervals. For example, the distribution of intervals between “100-year floods” is broad, strongly skewed, and reaches its mode at zero (Figure 3). The standard deviation of recurrence intervals is equal to their average, so that Q100 could be stated as the “flow that is exceeded every 100 years ± 100 years, on average” (Figure 3). Because most people do not understand the technical nuances there is a strong tendency for them to revert to an incorrect understanding of Q100 as “a flood that happens every 100 years.”
  • The public typically associates probability with the chance of a single outcome. For example, the probability of a coin landing heads (p = 0.5), of rolling a particular point on a die (p = 0.167), or of winning top prize in a high-profile lottery game (p < 0.000001). In contrast, flood risk accumulates over time: Q100 has a probability of 0.01 each year: the longer the exposure to risk, the greater the chance of experiencing a 100-year flood. Most of the public lacks meaningful experience with this type of accumulative risk and incorrectly simplifies the risk of a 100-year flood to “p = 0.01” (not 0.01/year).
  • The public perceives flooding as a singular event associated with a particular flow, elevation of water, or inundation of land. Past floods are remembered by particular flood marks recorded on buildings or other structures. This view is reinforced by the “thin grey lines” on flood insurance rate maps (FIRM) that demarcate flood plains [51]. In contrast, a 100-year flood is not a single flow but any flow that exceeds Q100, with no upper limit. Without ways to understand the possibilities of flows that might greatly exceed Q100, people tend to think of the 100-year flood as exactly the flow of Q100, which is the smallest 100-year flood.
Simplification strategies, such as substituting alternative terminologies to eliminate explicitly quantitative and probabilistic language, sidestep the issues.  For example, Hagemeier-Klose and Wagner [55] proposed that flood zones could be designated by categories of risk such as high, medium, and low probability so that nontechnical users wouldn’t have to confront probabilities.  However, these categories have to be based on probabilities, so this approach only creates a new question for the public: what is meant by high/medium/low risk?
Advances in the scientific knowledge of flooding are important for society but cannot improve the ability of the public to benefit from experiential and possibilistic understandings of risk.  For example, finding better estimates of QT by supplementing peak flow measurements with historic and paleohydrologic information [56,57] does not resolve the disconnect between expert and nonexpert understandings of probability and risk.  Likewise, more effective ways of communicating flooding and risk through science education are not helpful if they reinforce analytic and probabilistic concepts (e.g., [58–60]).

3.2. Connecting Subjective Understanding with Objective Measures of Flood Risk

Critical complexity frames flood mitigation as a need to seek a workable integration of the objective and subjective worldviews (Figure 1).  Subjective understandings can arise from historical awareness of floods.  For example, memorializing the flood marks of past inundations may help people visualize what happened and what is possible [3,61], and might help to awaken a “watery sense of place” by tapping into knowledge held in narratives, histories, and folk memories embedded in local communities and culture [24,62].  Individual memories of floods are most likely of those that caused the most extreme damage.  For example, many older Pennsylvanians remember the severe and destructive flooding caused by Hurricane Agnes (1972), more than fifty years ago.  Media and teaching materials emphasize the eye-catching consequences of floods [26].  As important as these types of real-world experience are, the challenge for effective risk communication is to place extreme flooding in the context of recurrence. 
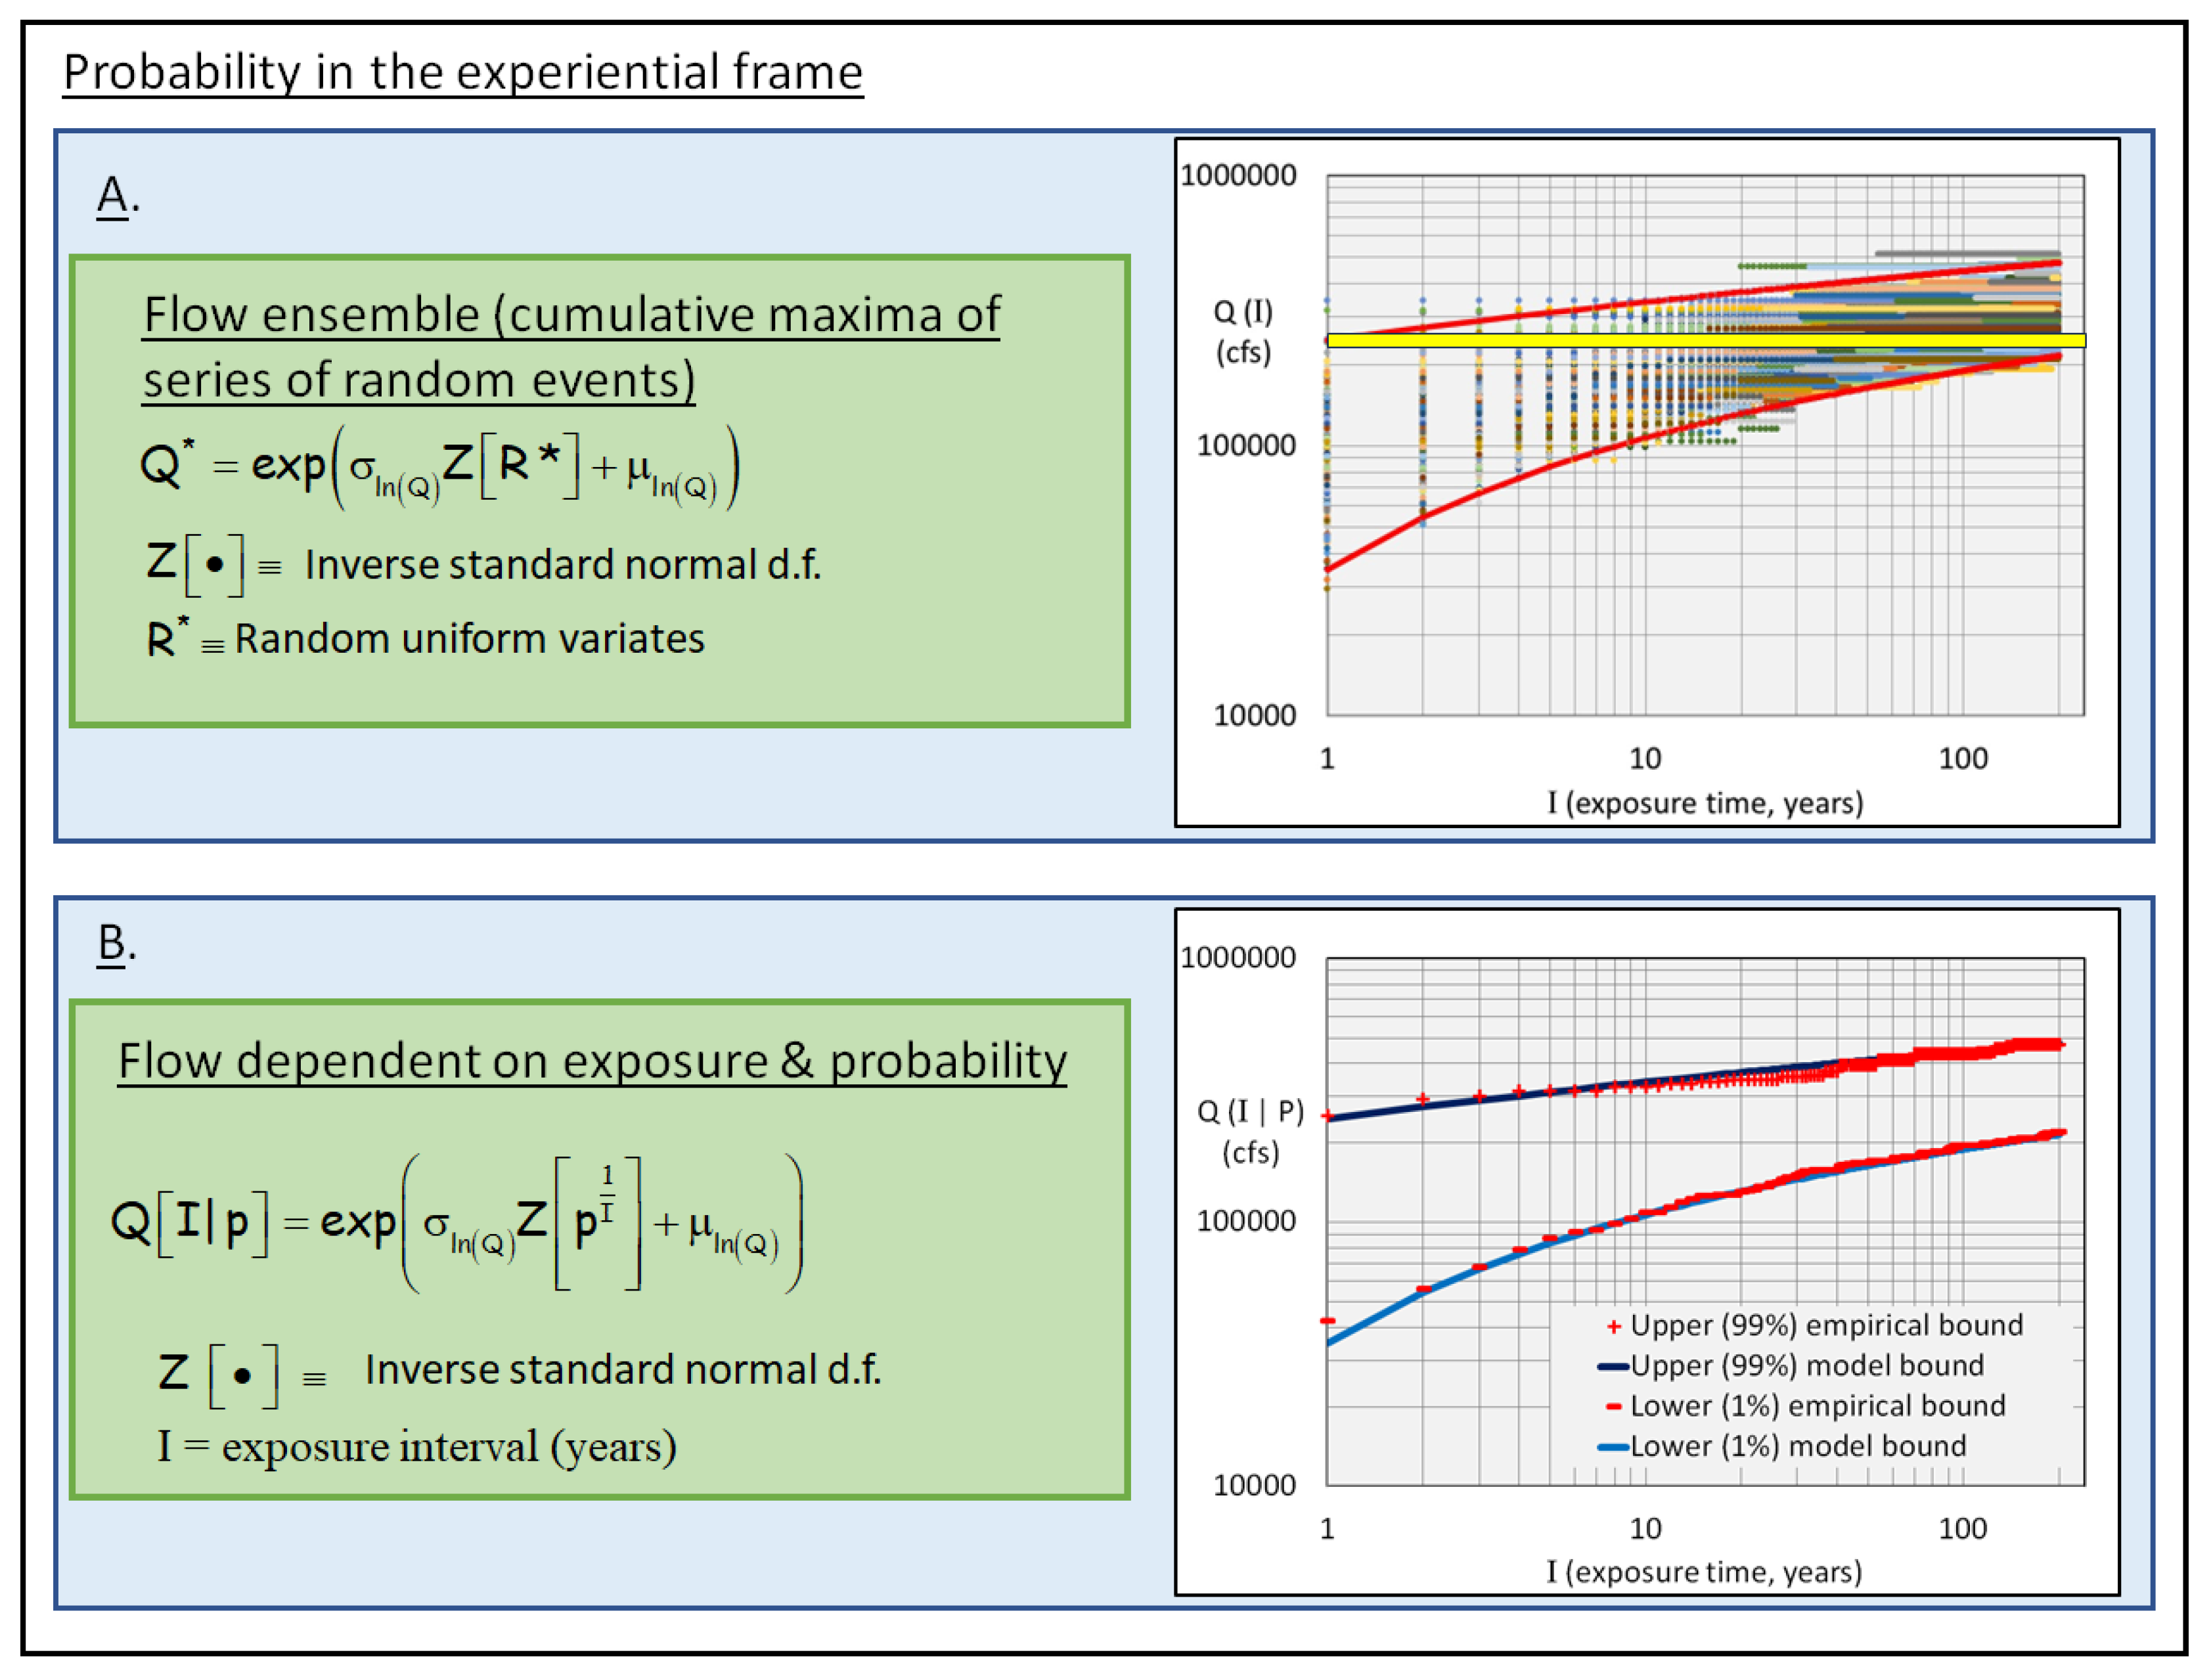
Lutz [26] discussed the importance of understanding recurrent risks experientially, as we understand playing a game of chance.  A game unfolds over time; the experience of playing and the possibility of rare outcomes is part of what makes a game of chance intriguing.  Similarly, living near a stream exposes people to risk and leads to the possibility of experiencing a range of outcomes from the ordinary to the extreme.  To capitalize on the interest in extreme events, Lutz [26] suggested repurposing objective measures of flooding to visualize the range of extreme floods most likely to be experienced after a given interval of exposure (Figure 4A).  The example diagrams in this section are intended as models to encourage thought about how the experiential and possibilistic can be integrated into flood education, not as complete, ready-to-use materials for education.
Annual floods can be simulated by making the probability model (e.g., LN2, as in Figure 2) a function of the random uniform variate, R* (i.e., random numbers between 0 and 1), as shown in Figure 4A [63]. Successive values of R* simulate a sequence of annual peak flows, Q*. A sequence of the largest, most memorable events is simulated by the cumulative maximum of Q* after an interval of I years, Q(I), as detailed in Lutz [26]. Repeatedly generating sequences of Q(I) forms an ensemble (Figure 4A) that visually portrays a range of possibilities for the most consequential floods after an interval of I years. For example, the ensemble chart in Figure 4A shows that after ten years of exposure the largest floods range from about 100,000 cfs to 350,000 cfs.
The ensemble illustrates some important conceptual improvements relative to QT.
  • Q(I) ensembles intrinsically incorporate the passage of time through successive simulations of annual peak flows. Like a game, Q(I) simulates the experience of exposure to a flood hazard. In contrast, an average recurrence interval (e.g., “100-year” flood) is a statistical parameter, not a time that can be related to experience [30].
  • The spread in the Q(I) ensembles indicates the range of the most severe outcomes likely to be experienced after I years; it is a visual representation of a range of outcomes that are possible. In contrast, an exceedance flow, QT, such as Q100 (Figure 4A) is a lower limit based on annual probability and has no upper limit.
  • The upward sloping Q(I) ensemble reveals an often unrecognized and uncommunicated aspect of flood risk: the longer one is exposed to risk, the more likely one is to experience severe consequences. Ensembles convey a sense that time matters in mitigating flood risk. In contrast, QT is predicated on a constant annual probability, often misinterpreted to mean that risk is constant, not accumulative.
  • The Q(I) ensemble (Figure 4A) shows that Q100 begins to be exceeded by a substantial proportion of simulations after as little as 10-20 years, and after 100 years of exposure most simulations exceed Q100. The perspective given by the simulations dispels the misconception that Q100 occurs once every 100 years.
  • The ensemble diagram encourages possibilistic thinking. Clarke [39] gives the example of airline travel: the probability of a crash is extremely low but experience provides many examples of airline disasters and how they can occur: mid-air collision, airplane system failure, terrorism, and so forth. Similarly, Q(I) gives insight into what might be experienced in terms of future flood magnitude.
Volumetric flow, Q, is not as informative for most of the public as the consequent effects of flooding such as the depth of inundation but volumetric streamflow, Q, is causally linked to inundation and other hazardous phenomena. The empirical envelope of flow probabilities Q(I) (Figure 4A) can be operationalized as an analytical expression (Figure 4B). The function Q(I | p) combines the formula for Q(I) with the geometric probability of interval length, I, to yield the flow that will be exceeded with probability p at each exposure time I. Figure 4B shows that Q(I | p) is consistent with the ensemble results for p = 1% and 99%.
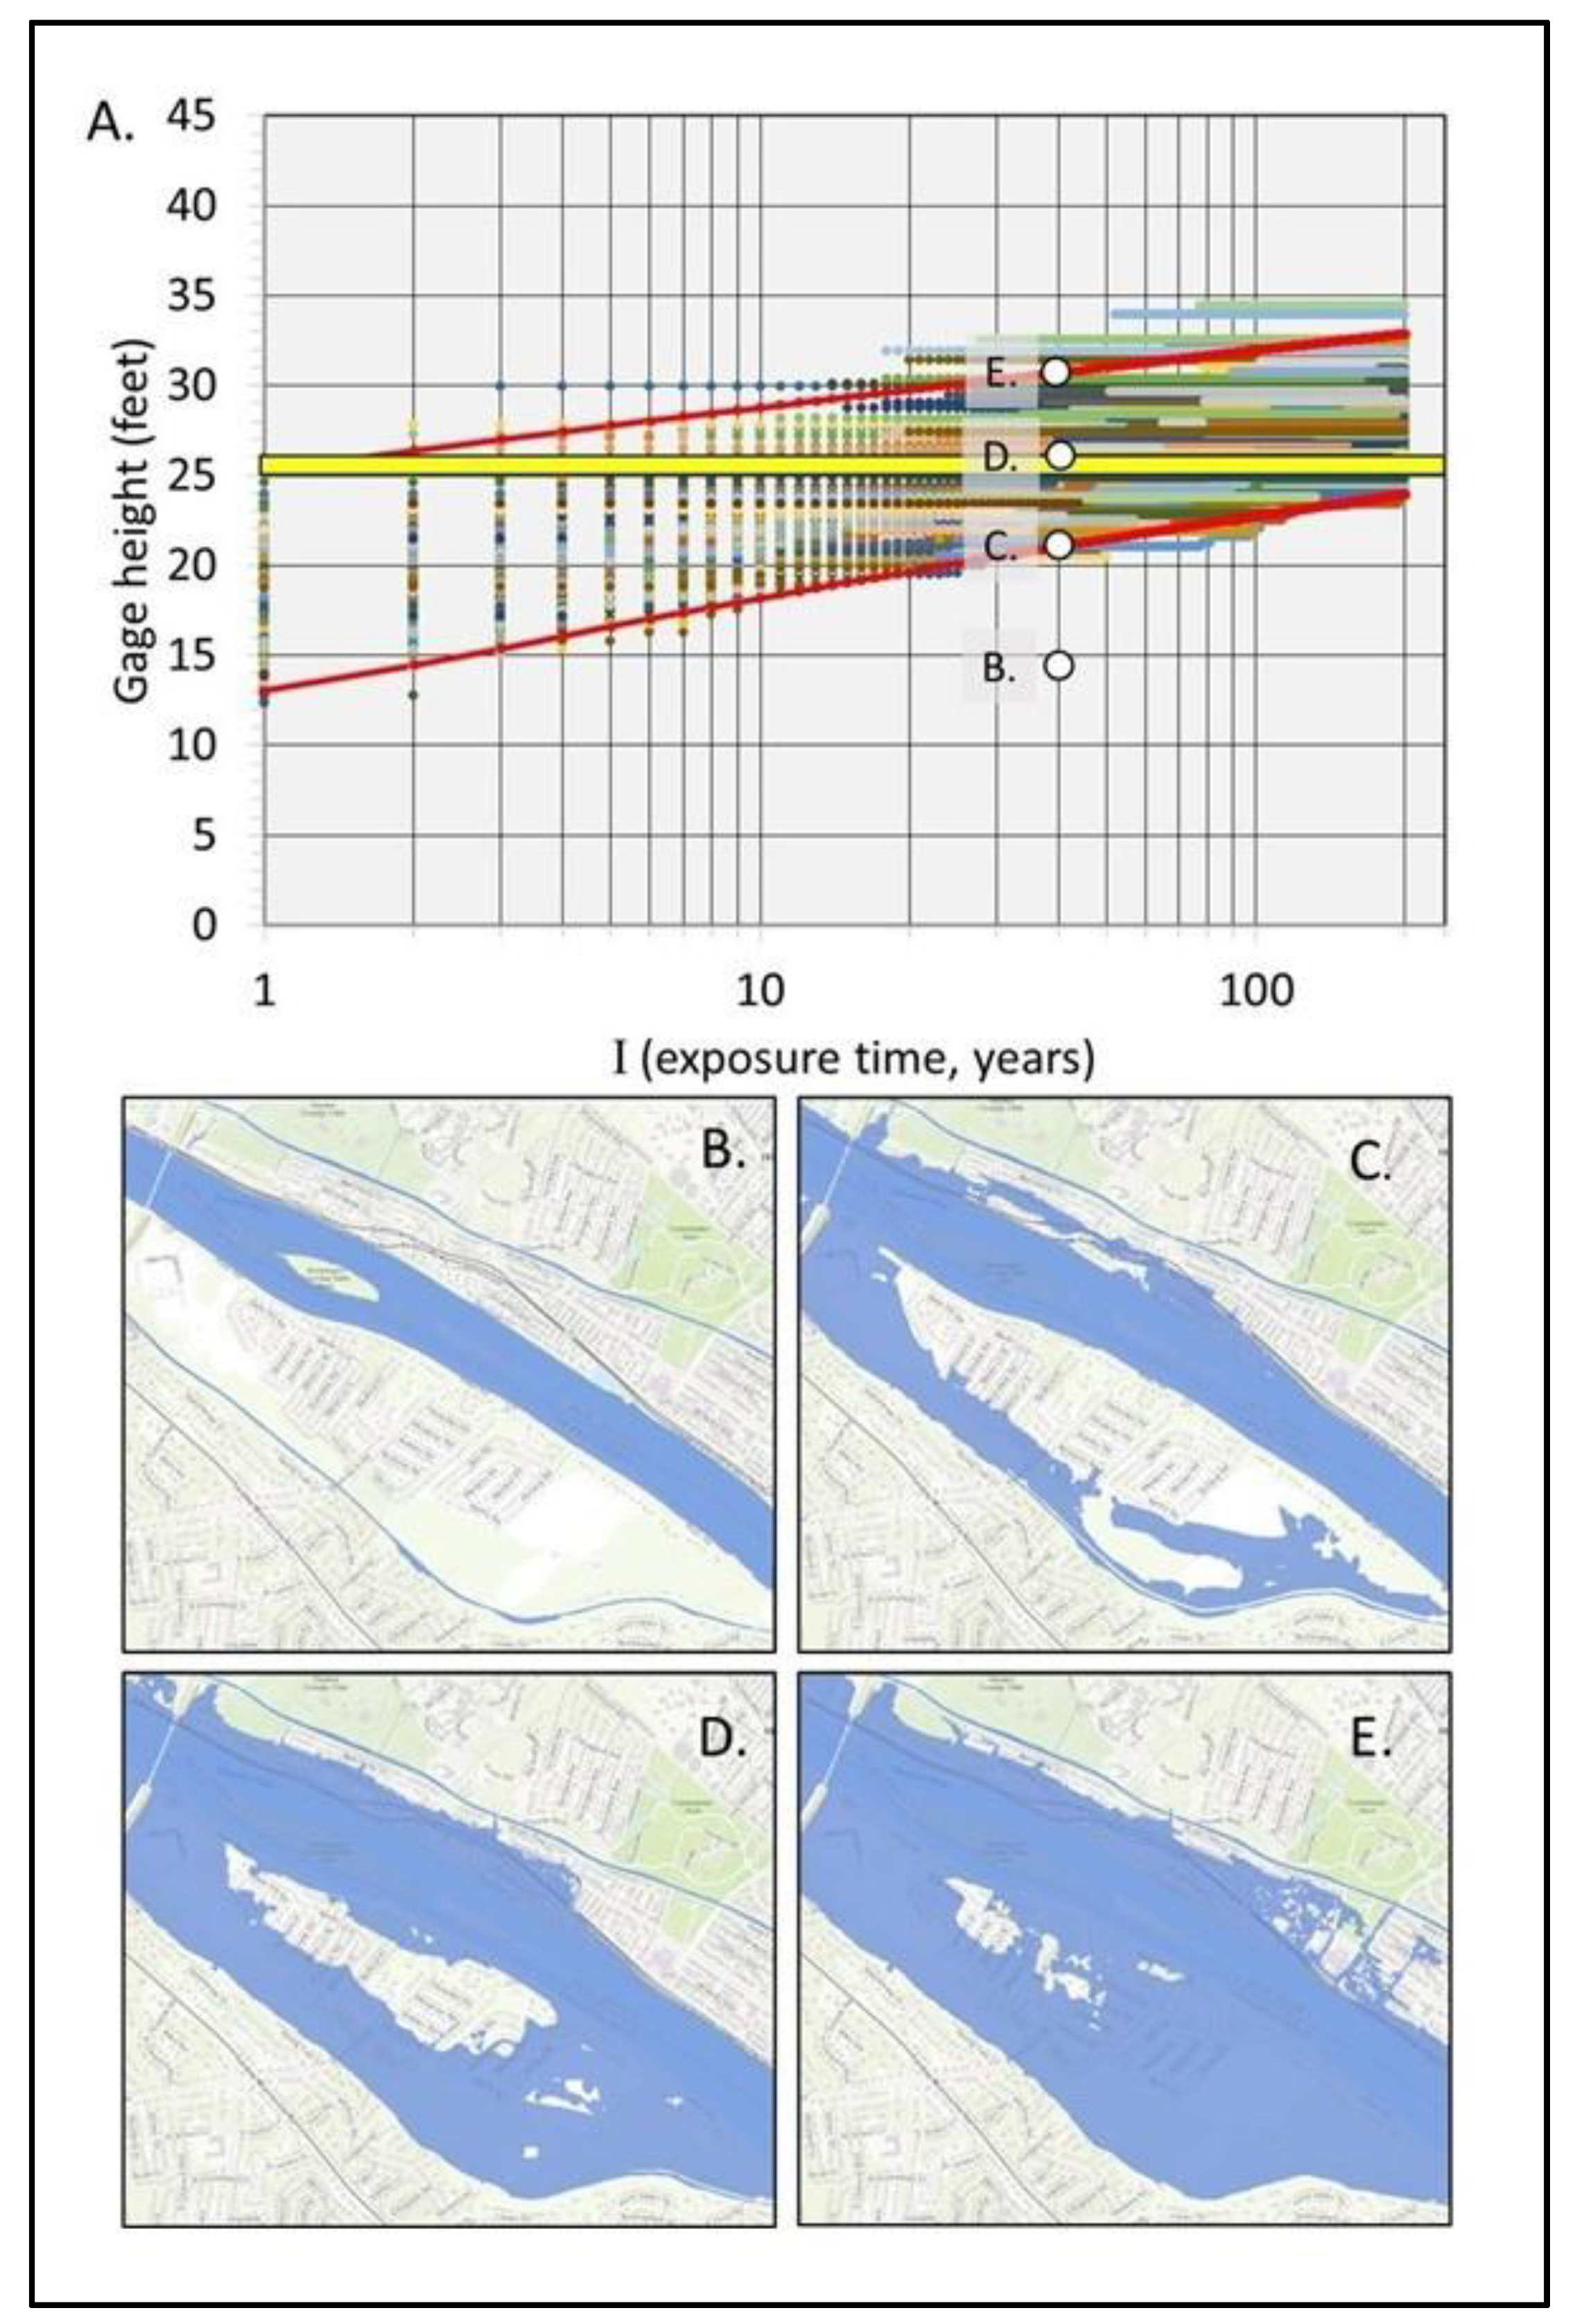
The relationship between stage (S) (or USGS gage height) and flow, S(Q), can be combined with Q[I | p] to calculate S[I | p]), the stage distribution after I years of exposure. The ensemble S[I | p]) provides a new way of using flood inundation maps [64] Flood Inundation Mapper to imagine a range of possible outcomes. Figure 5 is an example for the Delaware River in Lower Makefield Township, Bucks County, PA, near Trenton, NJ, based on a probability envelope for stage (gage height) with maps of land inundated. The “100 year flood” is in the middle of the range of possibilities after only 40 years of exposure (Figure 5A, D).
Instructions to learners could guide them toward the following questions:
  • How far in the future do I wish to consider the risk? How do age and socio-economic circumstances come into play? Young people or those committed to living or working near a flood zone might want to prepare for outcomes expected over longer exposure intervals than the elderly or those who have the economic potential to escape the flood plain.
  • How much of a risk-taker am I? The bottom of the risk envelope (e.g., point C in Figure 5A) is almost always exceeded, whereas the top (e.g., point E) is rarely reached. The risk averse will want mitigation measures that keep them safe at E; the risk tolerant might take a “bet” that less costly mitigation built for C will be sufficient.
  • How do different locations within a zone of possible inundation affect my understanding of risk? For example, flooding more extreme than 21 feet (Figure 5C) isolates all the properties on the island; but even at 30 feet (Figure 5E), properties on the highest ground do not flood. How does a property’s susceptibility to isolation and inundation play into an individual’s conception of risk?
Such questions open up a space for discussion among people with different concerns about time exposed to risk, levels of risk tolerance, and location. Subjective considerations of risk allow people to develop their own take on impending disasters and what they want to be done to protect their future. They are then more prepared to speak about specific proposals for action to mitigate flooding.
The flow ensemble (Figure 4) and the stage ensemble and inundation maps (Figure 5) are examples of how models of flooding rooted in analytic and probabilistic ways of thinking can be re-visioned and connected with their subjective counterparts, the experiential and possibilistic. They demonstrate how critical attention to unexamined conceptual boundaries can lead to new ways of communicating flood risk and educating the public.

4. Discussion

The Geological Society of America’s position statement on U.S. Flood Risk Management frankly states, “By most metrics, the U.S. is losing the fight to manage the nation’s flood risk” [65]. How can the efforts put into flood research, policy, and mitigation over a century have brought about this disheartening diagnosis? A root cause may be society’s philosophy of risk management, which has focused on objectivity, simplification of complexity, and control-oriented thinking. Experts have the authority and responsibility for managing flood risk (Figure 1), and a long-standing assertion that the non-expert public needs to be to engaged has not taken hold (e.g., [21]).
This paper makes the case that a philosophy of critical complexity [16] can help guide risk management to a balance between the objective approach of experts and the more subjective understandings of the public. An understandable concern with introducing subjective understanding into learning about hazards is that it brings hydrologic uncertainty and individual perspectives to the fore where authoritative knowledge has been valued. Control-oriented expertise may seem well-suited to taking decisive, objectively defensible action, and attending to the subjective might seem to be a step backward. But there are imaginative and creative aspects of complexity that can only be accessed when control is lost or ineffective. For example, Gregory Bateson’s “double bind” [66] expresses the idea that when our comfortable patterns of thinking fail, we need to jump to a new sense of reality: to gain some agency we must lose some control. Jackson [67] explores this idea in the context of research into human cognition and creativity: “uncertainty plays an essential role in higher-order thinking, propelling people in challenging times toward good judgment, flexibility, mutual understanding, and heights of creativity” ([67], p.xiii).
To be effective, experiential and possibilistic thinking should be fostered in appropriate educational formats. Building subjective understanding requires iteration over time [51] and the ability to “play” with options [6]. A static diagram, such as Figure 5, can be made into a dynamic display by linking user-made choices of exposure time (I) and probability (p) to an inundation map on a GIS platform at a spatial resolution that would reveal individual parcels, which may be essential to engage landowners [25,55]. People using such an application would be actively engaged in producing knowledge [68], not passively learning it, thereby creating a component of perceptual reality that can stimulate societal action [12]. Newer technologies (online platforms, apps, GIS maps, VR) could be more effective if they stimulate experiential and possibilistic thinking.
To create a flood-wise population it is not sufficient for individual understanding to be an end-point. Grappling with the experiential and possibilistic is a foundation for opening a conceptual space within which people can share their understandings, ideas, and concerns. For example, facilitated visioning processes can help shape the future by changing how people understand the world, what they expect from it, and what they deem possible [69,70,71]. When the public is better prepared to think about and express their flood risk they may be better able to partner with experts to improve flood mitigation.
In general, people need a component of experience and subjective understanding to give meaning to facts [37]. For example, climate change is not just “there” as an objective fact. If we say that the average temperature of the globe will increase by 1.5° C in the next century, we are talking about something no one can experience. People experience actual temperatures, not averages; we experience in hours and days, not centuries; we experience our places, not the globe; we experience the effects of climate change in ways that go far beyond the measure of degrees Celsius. Models that are currently presented in abstract, statistical, or factual terms need to be reframed to connect with people’s perceptual understanding.
Hazards such as flooding are one of many issues that make up sustainability concerns (e.g., climate change, biodiversity loss, diminishing resources, environmental justice, pollution). However, all these apparently separate concerns can be seen as manifold symptoms of a failing worldview, and in that case it is increasingly important to understand how to see the world differently [13,72]. From this perspective, sustainability moves from addressing problems toward changing the worldview that allows damaging practices to continue and grow over decades and centuries as “normal” outcomes of human activity. Critical complexity encourages us to practice complexability, which is the ability of humanity to work with, not against, the complexity of earth’s systems to sustain life; it leverages the tension between the simple and the complex and seeks ways to actively balance and integrate the two [73].

Funding

This research received no external funding.

Data Availability Statement

The data used to construct charts in Figure 2, Figure 4 & Figure 5 are freely available and can be found at: https://waterdata.usgs.gov/monitoring-location/01463500/.

Acknowledgments

Former WCU undergraduate Robert Cote helped to initiate this research; Dr. LeeAnn Srogi greatly improved the paper via discussion and editing; and West Chester University’s F.H. Green Library made the Weintraub Room available for research and writing.

Conflicts of Interest

The author declares no conflicts of interest.

References

  1. FloodList. 2023 [cited 2023 ]; Available from: floodlist.com. 22 June.
  2. Ludy, J.; Kondolf, G.M. Flood risk perception in lands “protected” by 100-year levees. Nat. Hazards 2012, 61, 829–842. [Google Scholar] [CrossRef]
  3. Bell, H.; Tobin, G. Efficient and effective? The 100-year flood in the communication and perception of flood risk. Environ. Hazards 2007, 7, 302–311. [Google Scholar] [CrossRef]
  4. Cilliers, P. , What can we learn from a theory of complexity? Emergence: a journal of complexity issues in organizations and management, 2000. 2(1): p. 23-33.
  5. Kagan, S. , Art and sustainability: Connecting patterns for a culture of complexity. 2nd emended edition ed. 2013: transcript Verlag.
  6. Lutz, T. ; West Chester University Adventuring into Complexity by Exploring Data: From Complicity to Sustainability. Northeast. J. Complex Syst. 2021, 3, 1. [Google Scholar] [CrossRef]
  7. Capra, F. and P.L. Luisi, The Systems View of Life: A Unifying Vision. 2014: Cambridge University Press. 498.
  8. Dekker, S.; Cilliers, P.; Hofmeyr, J.-H. The complexity of failure: Implications of complexity theory for safety investigations. Saf. Sci. 2011, 49, 939–945. [Google Scholar] [CrossRef]
  9. Pilkey, O.H. and L. Pilkey-Jarvis, Useless arithmetic: Why environmental scientists can't predict the future. 2007: Columbia University Press.
  10. Pilkey, O.H., R. Young, and A. Cooper, Quantitative modeling of coastal processes: A boom or a bust for society, in Rethinking the Fabric of Geology, V.R. Baker, Editor. 2013, Geological Society of America. p. 135-144.
  11. Baker, V. Modeling global change: Why geologists should not let "system" come between earth and science. GSA Today, 1996(May 1996): p. 8-11. 19 May.
  12. Baker, V. , Hydrological Understanding and Societal Action. Journal of the American Water Resources Association, 1998. 34(4): p. 819-825.
  13. Rittel, H.W.J.; Webber, M.M. Dilemmas in a general theory of planning. Policy Sci. 1973, 4, 155–169. [Google Scholar] [CrossRef]
  14. Morin, E. , On Complexity. Advances in Systems Theory, Complexity, and the Human Sciences, ed. A. Montuori. 2008: Hampton Press.
  15. Morin, E. , Restricted complexity, general complexity, in Worldviews, Science and Us: Philosophy and Complexity, C. Gershenson, Aerts, D., Edmonds, B., Editor. 2007, World Scientific Publishing. p. 5-29.
  16. Cilliers, P. , Critical Complexity: Collected Essays. Categories, ed. P. Roberto. 2016, Berlin: Walter de Gruyter GmbH. 283.
  17. Woermann, M.; Cilliers, P. The ethics of complexity and the complexity of ethics. South Afr. J. Philos. 2012, 31, 447–463. [Google Scholar] [CrossRef]
  18. Davis, B. and D. Sumara, Complexity and education: Inquiries into learning, teaching, and research. 2006: Lawrence Erlbaum Associates.
  19. Stewart, I. , Complicity and simplexity. Complicity: An international journal of complexity and education, 2007. 4(1): p. 105-106.
  20. Berman, M. , The reenchantment of the world. 1981: Cornell University Press.
  21. NRC, Risk Analysis and Uncertainty in Flood Damage Reduction Studies. 2000, National Research Council, National Academy of Sciences. 2000.
  22. Schelfaut, K.; Pannemans, B.; van der Craats, I.; Krywkow, J.; Mysiak, J.; Cools, J. Bringing flood resilience into practice: the FREEMAN project. Environ. Sci. Policy 2011, 14, 825–833. [Google Scholar] [CrossRef]
  23. Birkholz, S.; Muro, M.; Jeffrey, P.; Smith, H. Rethinking the relationship between flood risk perception and flood management. Sci. Total. Environ. 2014, 478, 12–20. [Google Scholar] [CrossRef]
  24. McEwen, L.J.; Krause, F.; Jones, O.; Hansen, J.G. Sustainable flood memories, informal knowledge and the development of community resilience to future flood risk. WIT Transactions on Ecology and The Environment, 2012. 159: p. 253-264.
  25. Henstra, D.; Minano, A.; Thistlethwaite, J. Communicating disaster risk? An evaluation of the availability and quality of flood maps. Nat. Hazards Earth Syst. Sci. 2019, 19, 313–323. [Google Scholar] [CrossRef]
  26. Lutz, T. Toward a New Conceptual Framework for Teaching About Flood Risk in Introductory Geoscience Courses. J. Geosci. Educ. 2011, 59, 5–12. [Google Scholar] [CrossRef]
  27. Dufty, N. , A new approach to community flood education. The Australian Journal of Emergency Management, 2008. 23(2): p. 4-8.
  28. Baker, V.R. Flood hazard science, policy, and values: A pragmatist stance. Technol. Soc. 2007, 29, 161–168. [Google Scholar] [CrossRef]
  29. Baker, V.R. Debates—Hypothesis testing in hydrology: Pursuing certainty versus pursuing uberty. Water Resour. Res. 2017, 53, 1770–1778. [Google Scholar] [CrossRef]
  30. Baker, V. , Interdisciplinarity and the earth sciences: transcending limitations of the knowledge paradigm, in The Oxford Handbook of Interdisciplinarity, R. Frodeman, J. Klein, and R. Pacheco, Editors. 2017, Oxford University Press. p. 88-100.
  31. Cilliers, P. , Boundaries, hierarchies and networks in complex systems. International Journal of Innovation Management, 2001. 5(2): p. 135-147.
  32. Cilliers, P. , Difference, identity and complexity. Philosophy Today, 2010. 54(1): p. 55-65.
  33. Bradford, R.A.; O'Sullivan, J.J.; van der Craats, I.M.; Krywkow, J.; Rotko, P.; Aaltonen, J.; Bonaiuto, M.; De Dominicis, S.; Waylen, K.; Schelfaut, K. Risk perception – issues for flood management in Europe. Nat. Hazards Earth Syst. Sci. 2012, 12, 2299–2309. [Google Scholar] [CrossRef]
  34. Bennett, E.M.; Solan, M.; Biggs, R.; McPhearson, T.; Norström, A.V.; Olsson, P.; Pereira, L.; Peterson, G.D.; Raudsepp-Hearne, C.; Biermann, F.; et al. Bright spots: seeds of a good Anthropocene. Front. Ecol. Environ. 2016, 14, 441–448. [Google Scholar] [CrossRef]
  35. Di Baldassarre, G.; Kooy, M.; Kemerink, J.S.; Brandimarte, L. Towards understanding the dynamic behaviour of floodplains as human-water systems. Hydrol. Earth Syst. Sci. 2013, 17, 3235–3244. [Google Scholar] [CrossRef]
  36. de Bruijn, K. Resilience. J. Flood Risk Manag. 2020, 13. [Google Scholar] [CrossRef]
  37. Slovic, P.; Finucane, M.L.; Peters, E.; MacGregor, D.G. Risk as Analysis and Risk as Feelings: Some Thoughts about Affect, Reason, Risk, and Rationality. Risk Anal. 2004, 24, 311–322. [Google Scholar] [CrossRef] [PubMed]
  38. Evers, M.; Jonoski, A.; Almoradie, A.; Lange, L. Collaborative decision making in sustainable flood risk management: A socio-technical approach and tools for participatory governance. Environ. Sci. Policy 2016, 55, 335–344. [Google Scholar] [CrossRef]
  39. Clarke, L. Possibilistic Thinking: A New Conceptual Tool for Thinking about Extreme Events. Soc. Res. Int. Q. 2008, 75, 669–690. [Google Scholar] [CrossRef]
  40. Piangiamore, G.L. and G. Musacchio, Participatory approach to natural hazard education for hydrological risk reduction, in Advancing culture of living with landslides, K. Sassa, M. Mikos, and Y. Yin, Editors. 2017, Springer International Publishing AG. p. 555-561.
  41. Nicolescu, B. , Transdisciplinarity - past, present and future, in Moving Worldviews - Reshaping Sciences, Policies, and Practices for Endogenous Sustainable Development, B. Haverkort and C. Reijntjes, Editors. 2006. p. 142-166.
  42. Montuori, A. , Creating Social Creativity: Integrative Transdisciplinarity and the Epistemology of Complexity, in The Palgrave Handbook of Social Creativity Research, I. Lebuda and V.P. Glaveanu, Editors. 2019. p. 407-430.
  43. Montuori, A. Integrative Transdisciplinarity:. Transdiscipl. J. Eng. Sci. 2022, 13. [Google Scholar] [CrossRef]
  44. Berkes, F.; Ross, H. Panarchy and community resilience: Sustainability science and policy implications. Environ. Sci. Policy 2016, 61, 185–193. [Google Scholar] [CrossRef]
  45. Burger, J. Trust and consequences: Role of community science, perceptions, values, and environmental justice in risk communication. Risk Anal. 2022, 42, 2362–2375. [Google Scholar] [CrossRef]
  46. Lima, M. A visual history of human knowledge. 2015; https://www.ted.com/talks/manuel_lima_a_visual_history_of_human_knowledge]. Available from: https://www.ted.com/talks/manuel_lima_a_visual_history_of_human_knowledge.
  47. FEMA. History of Levees. 2020 ]; 3 page pdf document]. Available from: https://www.fema.gov/sites/default/files/2020-08/fema_history-of-levees_fact-sheet_0512.pdf. 28 August.
  48. Cockerill, K. , When "Solutions" Are the Problem. Water Resources IMPACT, 2022. 24(1): p. 17-18.
  49. Poli, R. , A note on the difference between complicated and complex social systems. Cadmus, 2013. 2(1): p. 6.
  50. Tobin, G.A. THE LEVEE LOVE AFFAIR: A STORMY RELATIONSHIP?1. JAWRA J. Am. Water Resour. Assoc. 1995, 31, 359–367. [Google Scholar] [CrossRef]
  51. Luke, A.; Sanders, B.F.; Goodrich, K.A.; Feldman, D.L.; Boudreau, D.; Eguiarte, A.; Serrano, K.; Reyes, A.; Schubert, J.E.; AghaKouchak, A.; et al. Going beyond the flood insurance rate map: insights from flood hazard map co-production. Nat. Hazards Earth Syst. Sci. 2018, 18, 1097–1120. [Google Scholar] [CrossRef]
  52. Merz, B.; Vorogushyn, S.; Lall, U.; Viglione, A.; Blöschl, G. Charting unknown waters—On the role of surprise in flood risk assessment and management. Water Resour. Res. 2015, 51, 6399–6416. [Google Scholar] [CrossRef]
  53. Rao, A.R. and K.H. Hamed, Flood Frequency Analysis. New Directions in Civil Engineering, ed. W.F. Chen. 2000: CRC Press.
  54. Lutz, T.M. Enhancing Students' Understanding of Risk and Geologic Hazards Using a Dartboard Model. J. Geosci. Educ. 2001, 49, 339–345. [Google Scholar] [CrossRef]
  55. Hagemeier-Klose, M.; Wagner, K. Evaluation of flood hazard maps in print and web mapping services as information tools in flood risk communication. Nat. Hazards Earth Syst. Sci. 2009, 9, 563–574. [Google Scholar] [CrossRef]
  56. Baker, V. , Learning from the past. Nature, 1993. 361: p. 402-403.
  57. Wilhelm, B.; Cánovas, J.A.B.; Macdonald, N.; Toonen, W.H.; Baker, V.; Barriendos, M.; Benito, G.; Brauer, A.; Corella, J.P.; Denniston, R.; et al. Interpreting historical, botanical, and geological evidence to aid preparations for future floods. WIREs Water 2018, 6. [Google Scholar] [CrossRef]
  58. SERC. Search SERC. 2024 [cited 2024 3/5/2024]; Search results for "flooding"]. Available from: https://serc.carleton.edu/serc/search.html?search_text=Flooding.
  59. CRED, The psychology of climate change communication: a guide for scientists, journalists, educators, political aides, and the interested public, C.f.R.o.E. Decisions, Editor. N: 2009, 2009.
  60. Volpi, E. On return period and probability of failure in hydrology. WIREs Water 2019, 6. [Google Scholar] [CrossRef]
  61. Siegrist, M.; Gutscher, H. Flooding Risks: A Comparison of Lay People's Perceptions and Expert's Assessments in Switzerland. Risk Anal. 2006, 26, 971–979. [Google Scholar] [CrossRef]
  62. Garde-Hansen, J.; McEwen, L.; Holmes, A.; Jones, O. Sustainable flood memory: Remembering as resilience. Mem. Stud. 2016, 10, 384–405. [Google Scholar] [CrossRef]
  63. Hastings, N.A.J. and J.B. Peacock, Statistical Distributions: A handbook for students and practitioners. 1974, New York: Halsted Press. 130.
  64. USGS. Flood Inundation Mapper. [cited 2023; Version 2.5.2:[Available from: https://fim.wim.usgs.gov/fim/.
  65. GSA, U.S. flood risk management, GSA, Editor. 2020. [Google Scholar]
  66. Bateson, G. Mind and Nature: A Necessary Unity; Dutton: New York, NY, USA, 1979. [Google Scholar]
  67. Jackson, M. , Uncertain: the wisdom and wonder of being unsure. 2023: Prometheus Books. 344.
  68. Mujere, N. , An Innovative Water Risk Assessment Framework. Water Resources IMPACT, 2021. 23(6): p. 23-25.
  69. Pereira, L.M.; Karpouzoglou, T.; Frantzeskaki, N.; Olsson, P. Designing transformative spaces for sustainability in social-ecological systems. Ecol. Soc. 2018, 23. [Google Scholar] [CrossRef]
  70. Kagan, S.; Hauerwaas, A.; Helldorff, S.; Weisenfeld, U. Jamming sustainable futures: Assessing the potential of design thinking with the case study of a sustainability jam. J. Clean. Prod. 2020, 251. [Google Scholar] [CrossRef]
  71. Pereira, L.M.; Hichert, T.; Hamann, M.; Preiser, R.; Biggs, R. Using futures methods to create transformative spaces: visions of a good Anthropocene in southern Africa. Ecol. Soc. 2018, 23. [Google Scholar] [CrossRef]
  72. Backhaus, G. Automobility: Global Warming as Symptomatology. Sustainability 2009, 1, 187–208. [Google Scholar] [CrossRef]
  73. Woermann, M., O. Human, and R. Preiser, General complexity: A philosophical and critical perspective. Emergence: Complexity and Organization, 2018. [CrossRef]
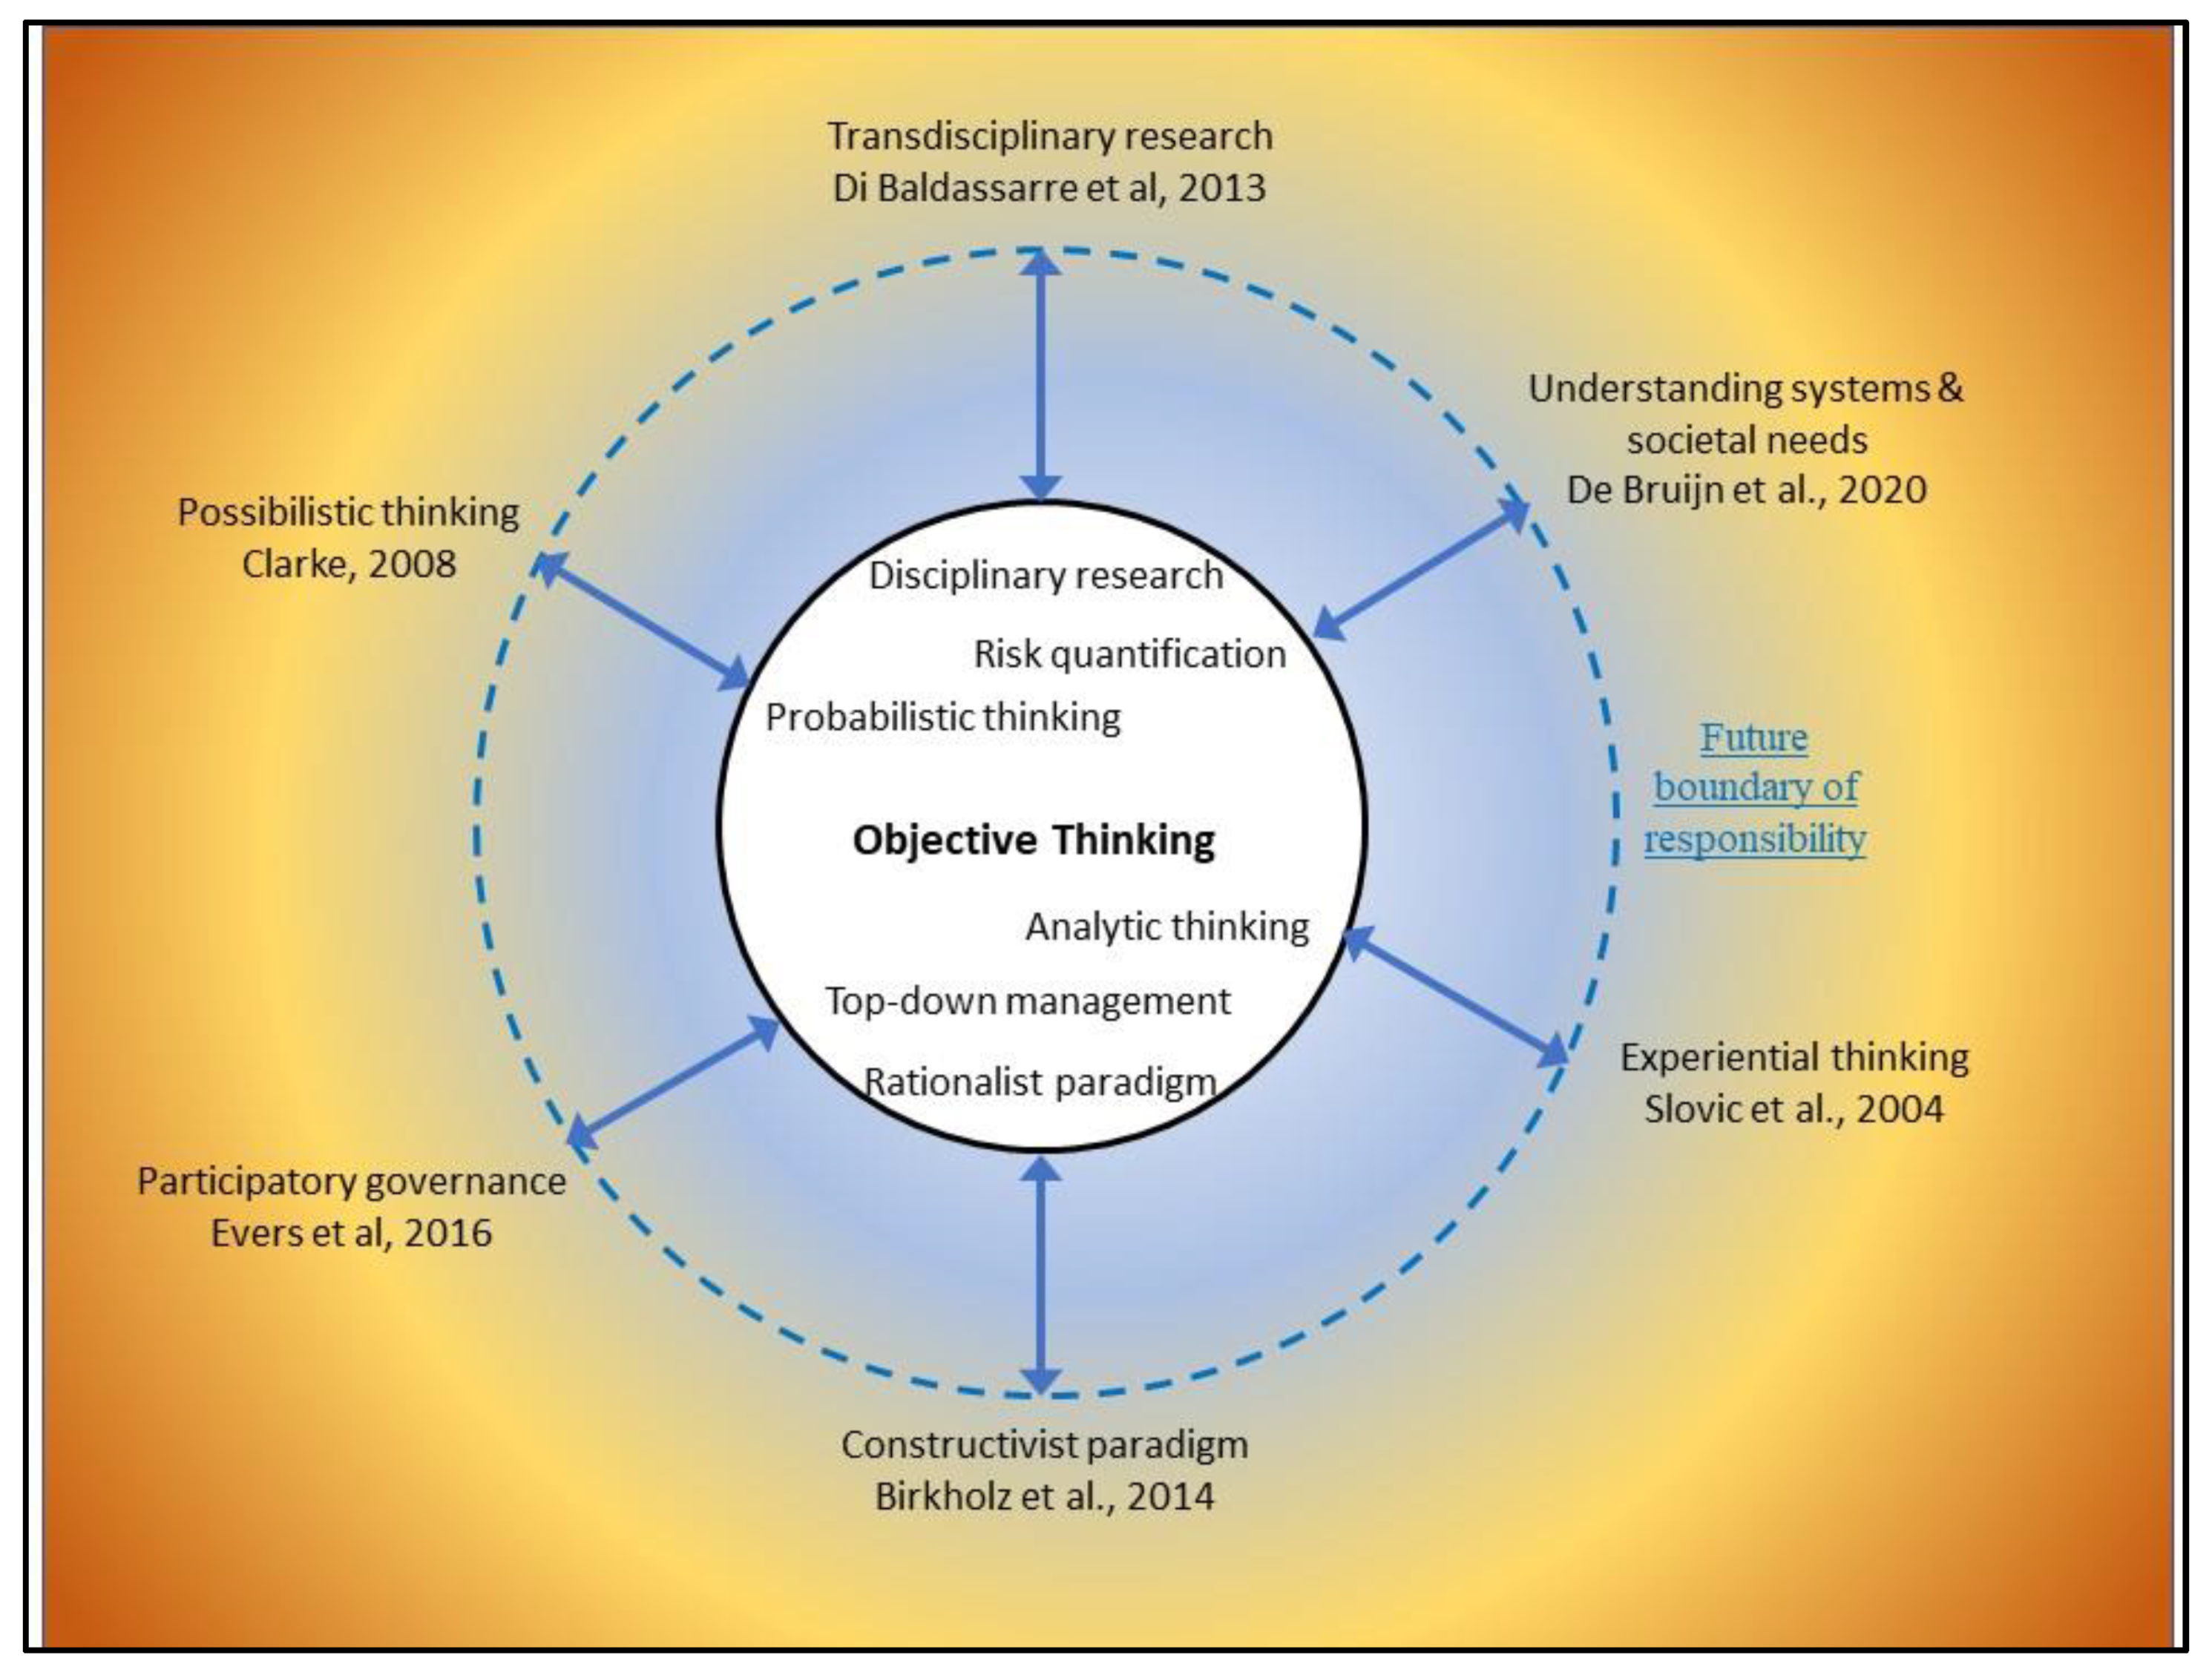
Figure 1. Model of a conceptual space showing complexability: balancing of complementary objective and subjective approaches (blue arrows). References: Di Baldassarre et al. [35], De Bruijn et al. [36], Slovic et al. [37], Birkholz et al. [23], Evers et al. [38], and Clarke [39].
Preprints 104742 g001
Figure 2. Schematic diagram indicating standard use of annual peak flow data to estimate parameters of a probability model (LN2) and T-year exceedance flow. Example chart data are from the Trenton, NJ, USGS gage (01463500).
Preprints 104742 g002
Figure 3. Strongly skewed exponential probability density for intervals between random events, shown here for 100-year floods (QT = 100 years).
Preprints 104742 g003
Figure 4. (A). Schematic diagram indicating how the cumulative maximum of random flow variates, Q*, are used to simulate the largest flow, Q[I], after an interval of I years. Example chart based on the Trenton, NJ, USGS gage (01463500). Simulated values are small, colored symbols; red lines are 1% (lower) and 99% (upper) empirical bounds; bright yellow line indicates Q100. (B) Chart shows close match of analytical model of Q[I|P] to empirical bounds in (A).
Preprints 104742 g004
Figure 5. (A). Ensemble of simulations of gage height, similar to Figure 4A. Example chart based on the Trenton, NJ, USGS gage (01463500). Simulated values are small, colored symbols; red lines are 1% (lower) and 99% (upper) empirical bounds; bright yellow line indicates gage height at Q100. Letters B-E indicate gage heights for an exposure interval of 40 years; B, normal flow; C, S[40years | 0.01]; D, S[40 years | 0.5]; E, S[40 years | 0.99]. (B-E) Inundation maps for flows indicated by B-E in (A).
Preprints 104742 g005
Disclaimer/Publisher’s Note: The statements, opinions and data contained in all publications are solely those of the individual author(s) and contributor(s) and not of MDPI and/or the editor(s). MDPI and/or the editor(s) disclaim responsibility for any injury to people or property resulting from any ideas, methods, instructions or products referred to in the content.
Copyright: This open access article is published under a Creative Commons CC BY 4.0 license, which permit the free download, distribution, and reuse, provided that the author and preprint are cited in any reuse.
Prerpints.org logo

Preprints.org is a free preprint server supported by MDPI in Basel, Switzerland.

Subscribe

© 2024 MDPI (Basel, Switzerland) unless otherwise stated