Submitted:
26 April 2024
Posted:
26 April 2024
You are already at the latest version
Abstract
Keywords:
1. Introduction
2. Mathematical Modeling of Distribution Power Flow
- The Micro-grid Real Generation ()
- Load node voltage, encompassing Distributed Generation (DG) units as PQ model, denoted as ().
- The DG output reactive power, structured as (NPV) PV nodes.
- Branch stream, denoted as .
- Base node voltage ().
- The DG real power units with non-RES ().
- PV () & ) WT terminal nodes.
- Transformer taps setting (t).
- Shunt Reactor Compensation outputs- VAR ().
2.1. The Four Cases Fitness Functions Considered in This Paper
- voltage magnitude Vi at load branch (i),
- voltage deviation weighting factor ,
- Resilience Index (RESI),
- RESI in SPF progression phase I and II as RESIOLEV,
- Total Cost (TCOLEV) in dollars,
- Annual CO2 emission for diesel DG (AEMISDDG) in kg/kWh/year,
- Grid Annual CO2 emission (AEMISGRID) in kg/kWh/year,
- Aggregate CO2 (AEMISOLEV) emission,
- Diesel DGs Annual Operations and Maintenance cost (AOMCDDG) in $/kWh/year,
- (sth) scenario event for the season (se),
- binary variable for load curtailment for bus (i) at time (t)
- Number of severe scenarios .
2.2. Equality and Inequality Constraints Considered in the Paper
- ith bus DG allocation .
- DG real power step size.
3. Modeling Distributed Generation Units for Optimal Power Flow Analysis
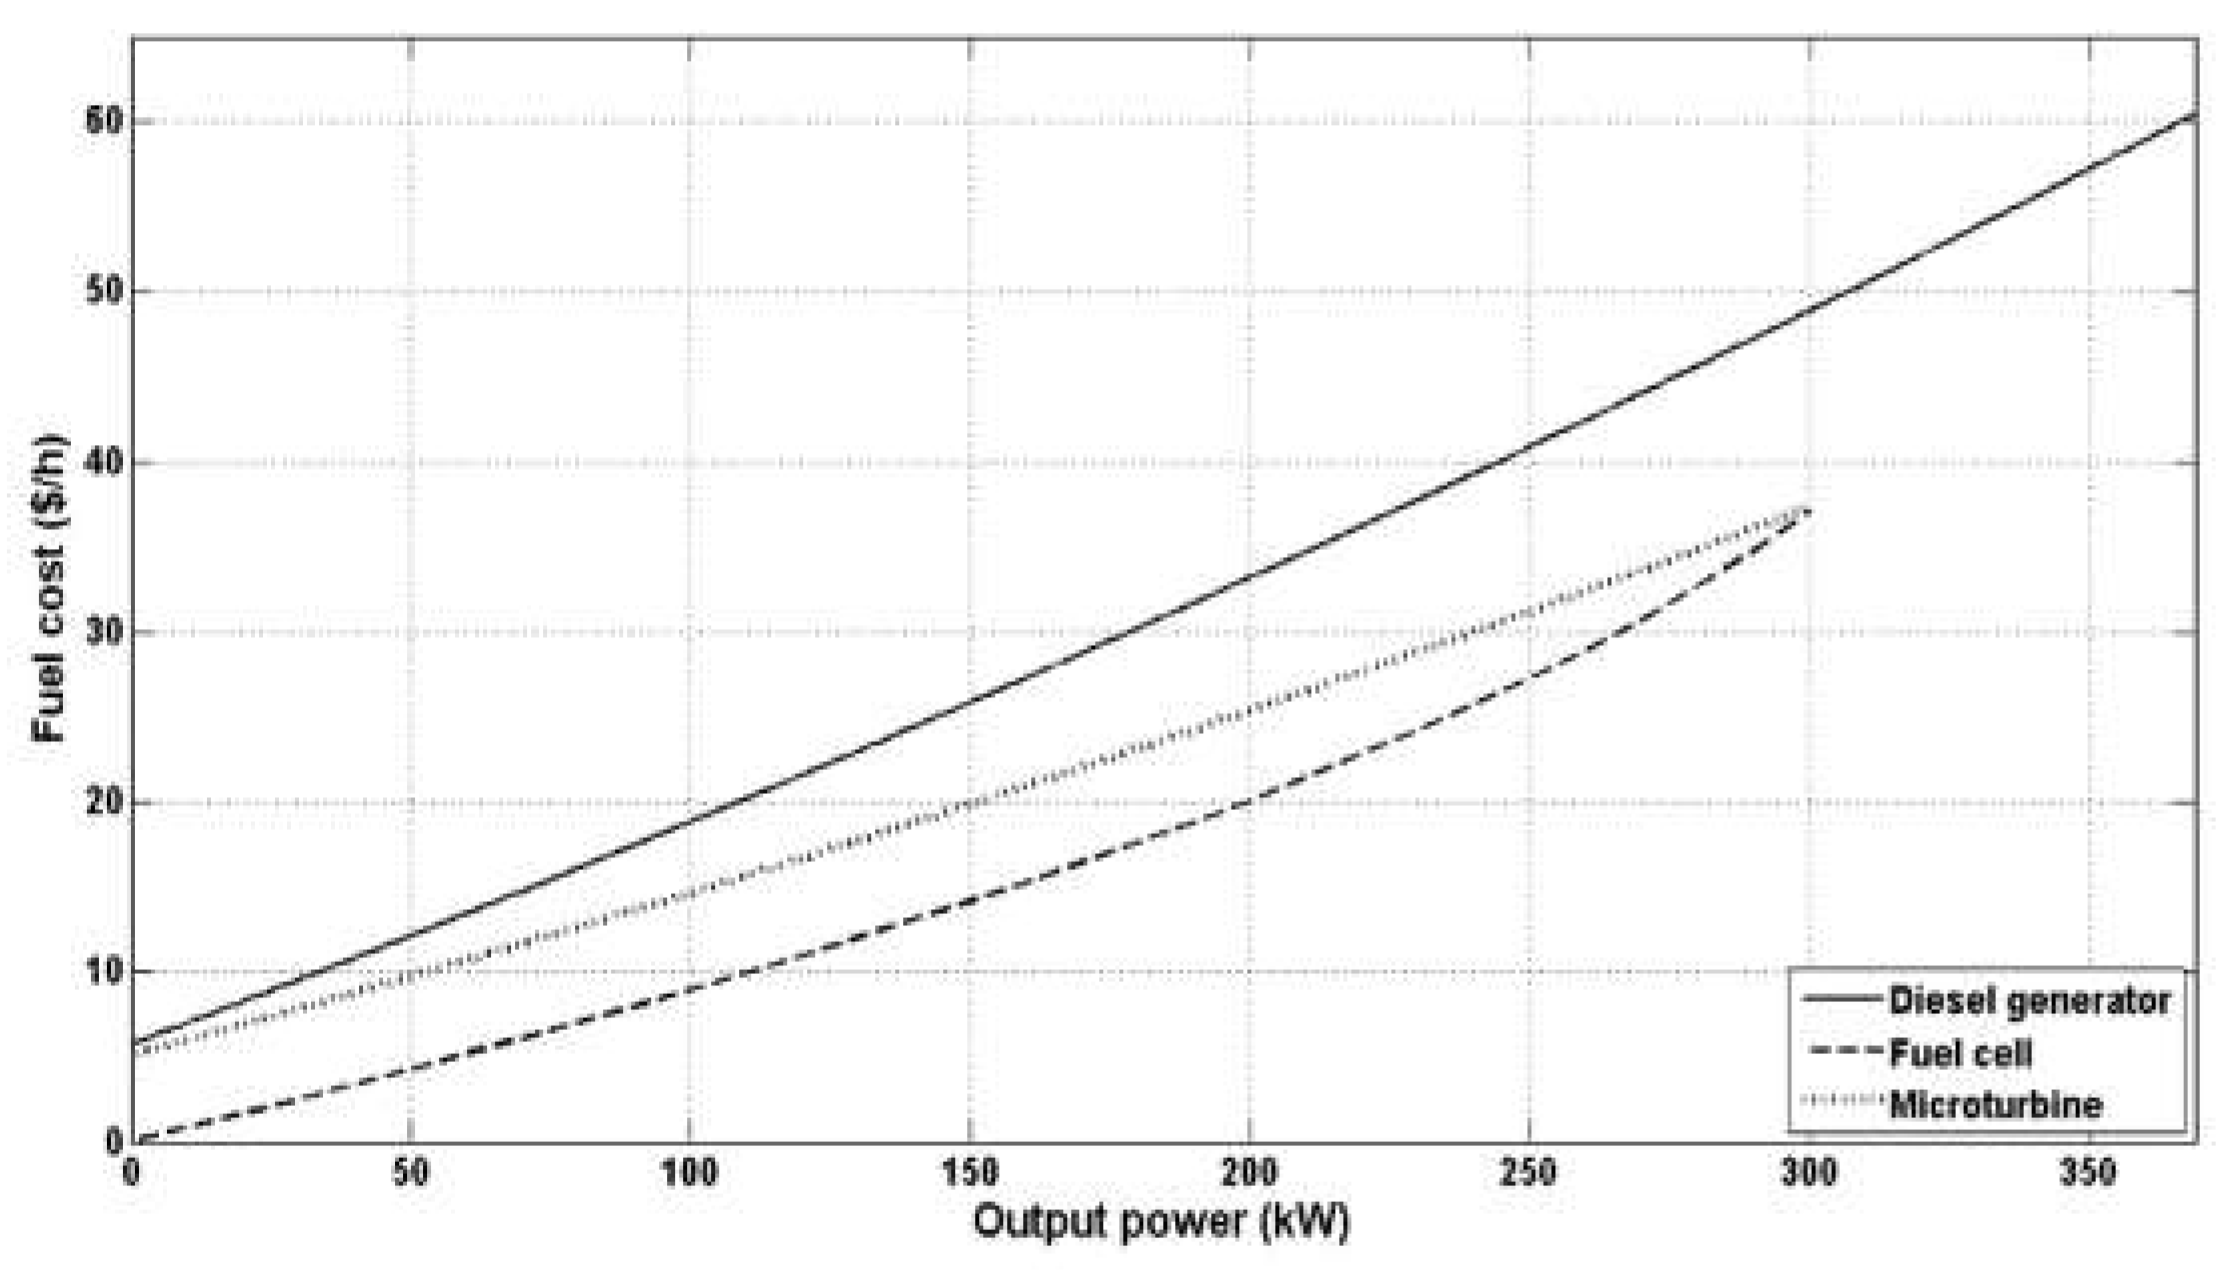
3.1. Modeling Diesel Generators in the Context of Distributed Generation for Optimal Power Flow
3.2. Fuel Cell Modeling in the Context of DG Units
3.3. Micro-Turbine Modeling and Analysis in the Context of Optimal Power Flow
3.4. Wind Turbine (WT) Modeling and Analysis in the Context of Optimal Power Flow
3.5. Photovoltaic (PV) Modeling and Analysis in the Context of Optimal Power Flow
3.6. Electric Grid Modeling and Analysis in the Context of Optimal Power Flow
4. DG RES and Diesel General OPF analysis with Met heuristic Methods
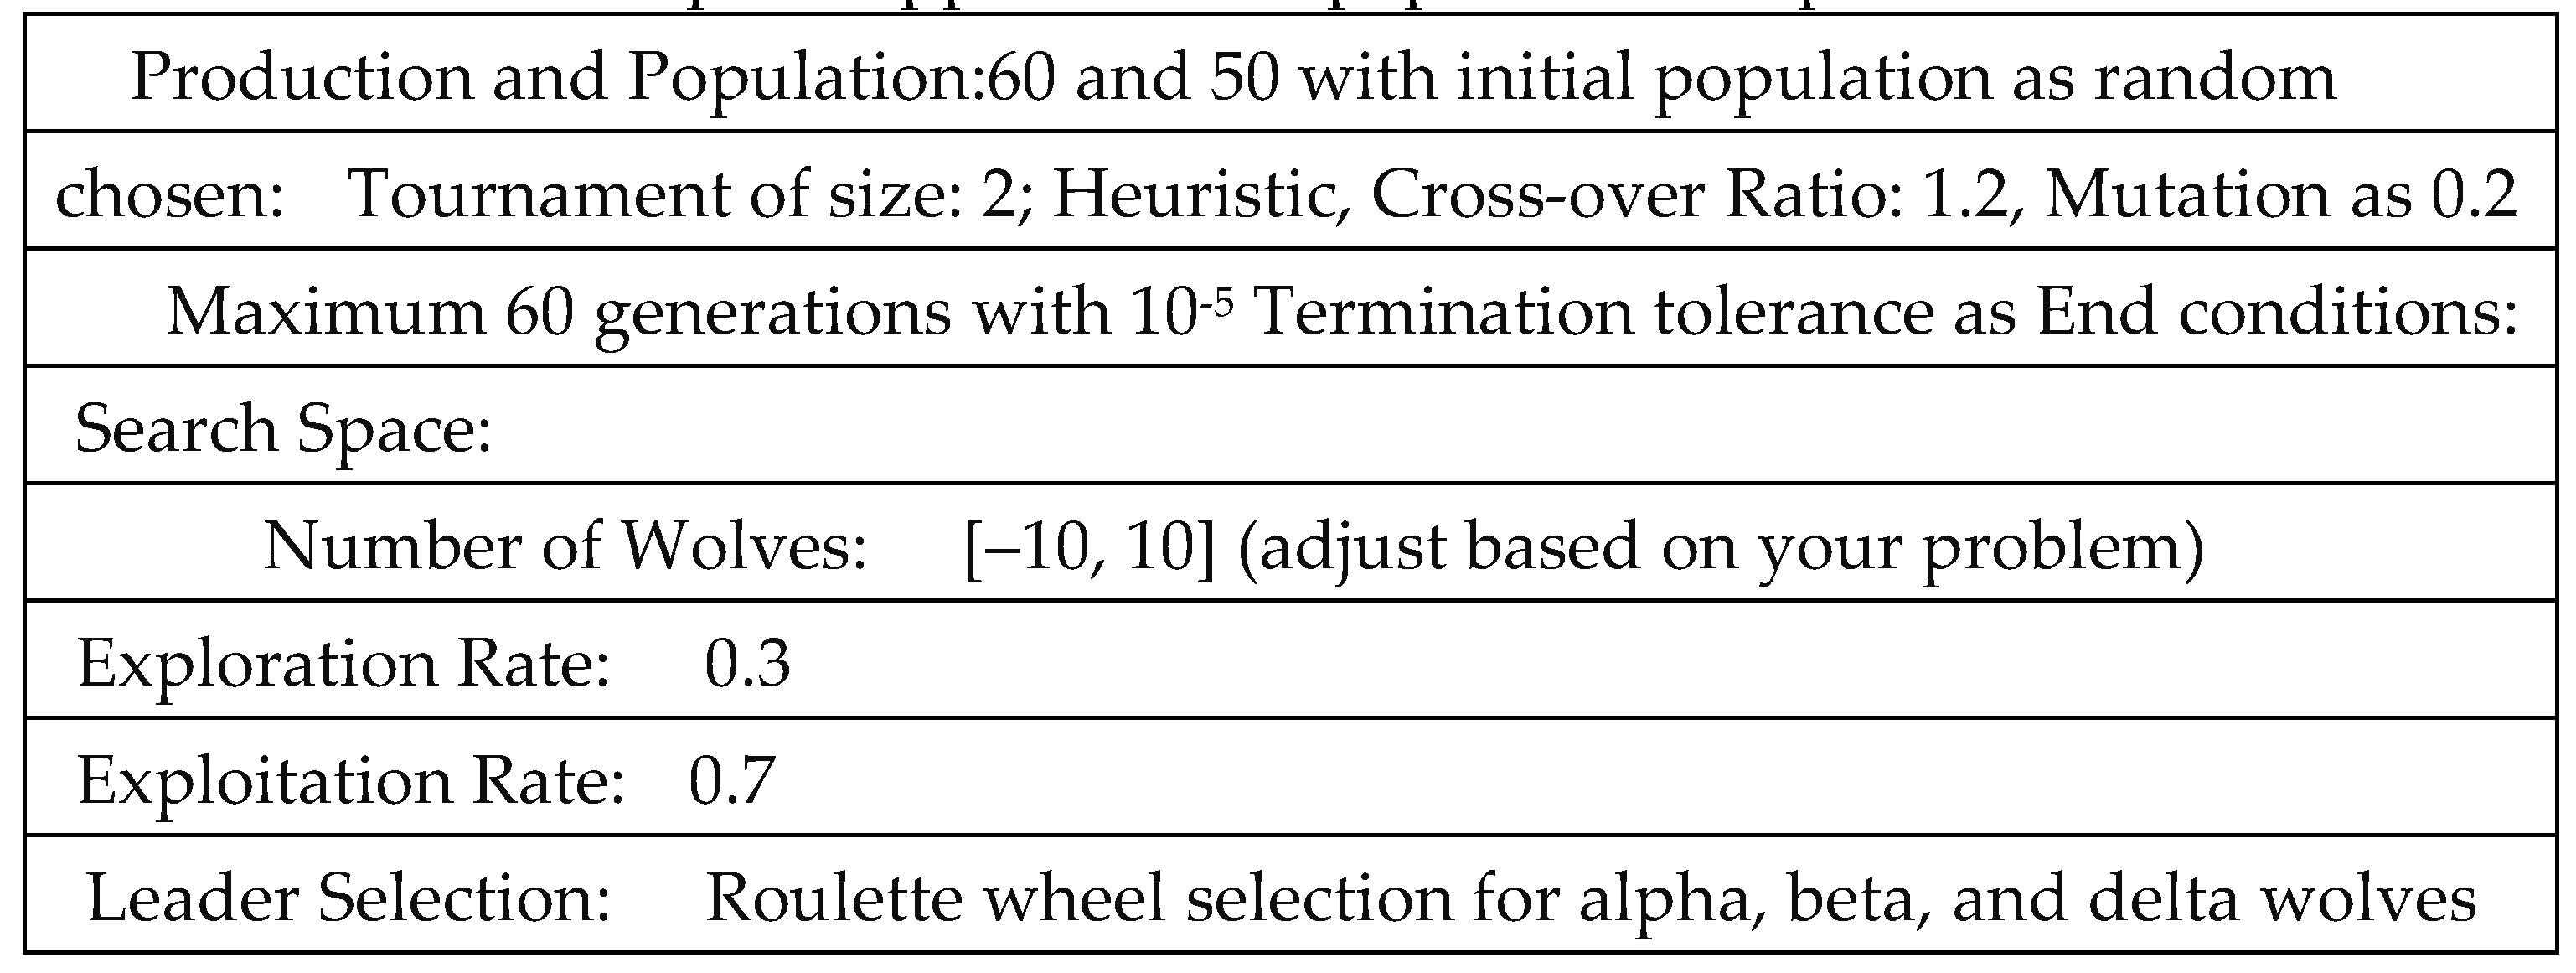
4.1. MOGA-GWO Implemented in this paper
5. Probabilistic Optimal Power Flow: Modeling and Analysis
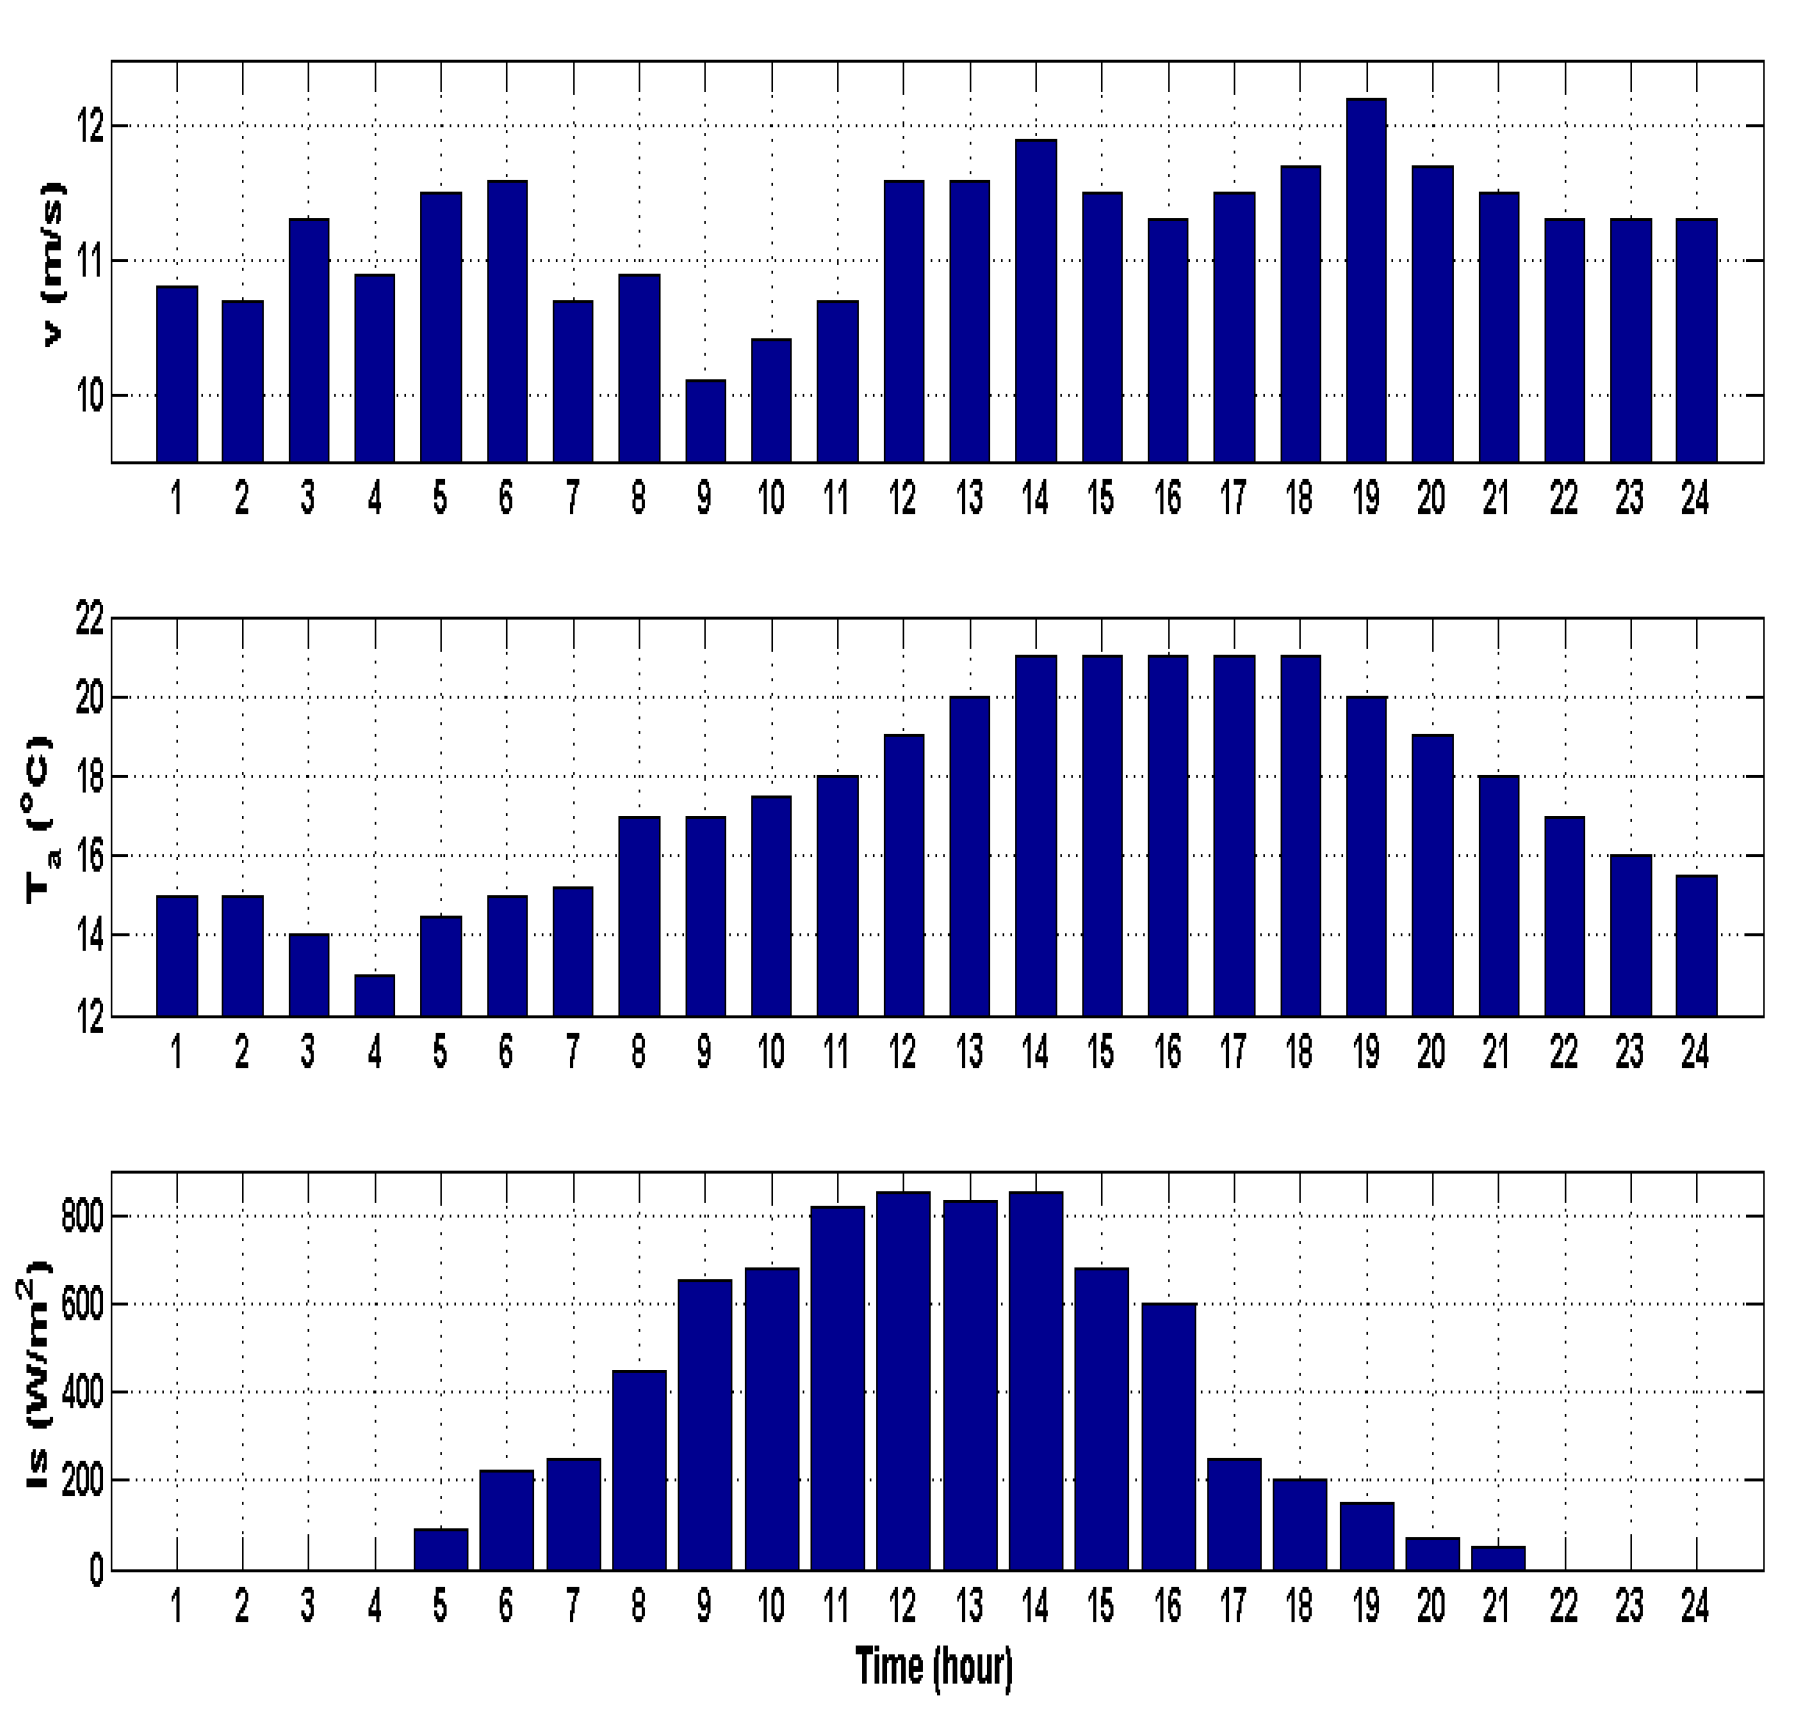
5.1. Modeling Wind Speed for Probabilistic Optimal Power Flow Analysis
5.2 Modeling Solar Irradiance for Probabilistic Optimal Power Flow Analysis
5.3. Probabilistic density function (PDF) Load Modeling for Optimal Power Flow Analysis
5.4. Statistical Evaluation in Probabilistic OPF
6. Simulation Results
6.1. Deterministic OPF (DOPF) Problem Solving for Wind Turbine (WT) and Solar Photovoltaic
6.2. Probabilistic Analysis of Optimal Power Flow (OPF)
7. Conclusions
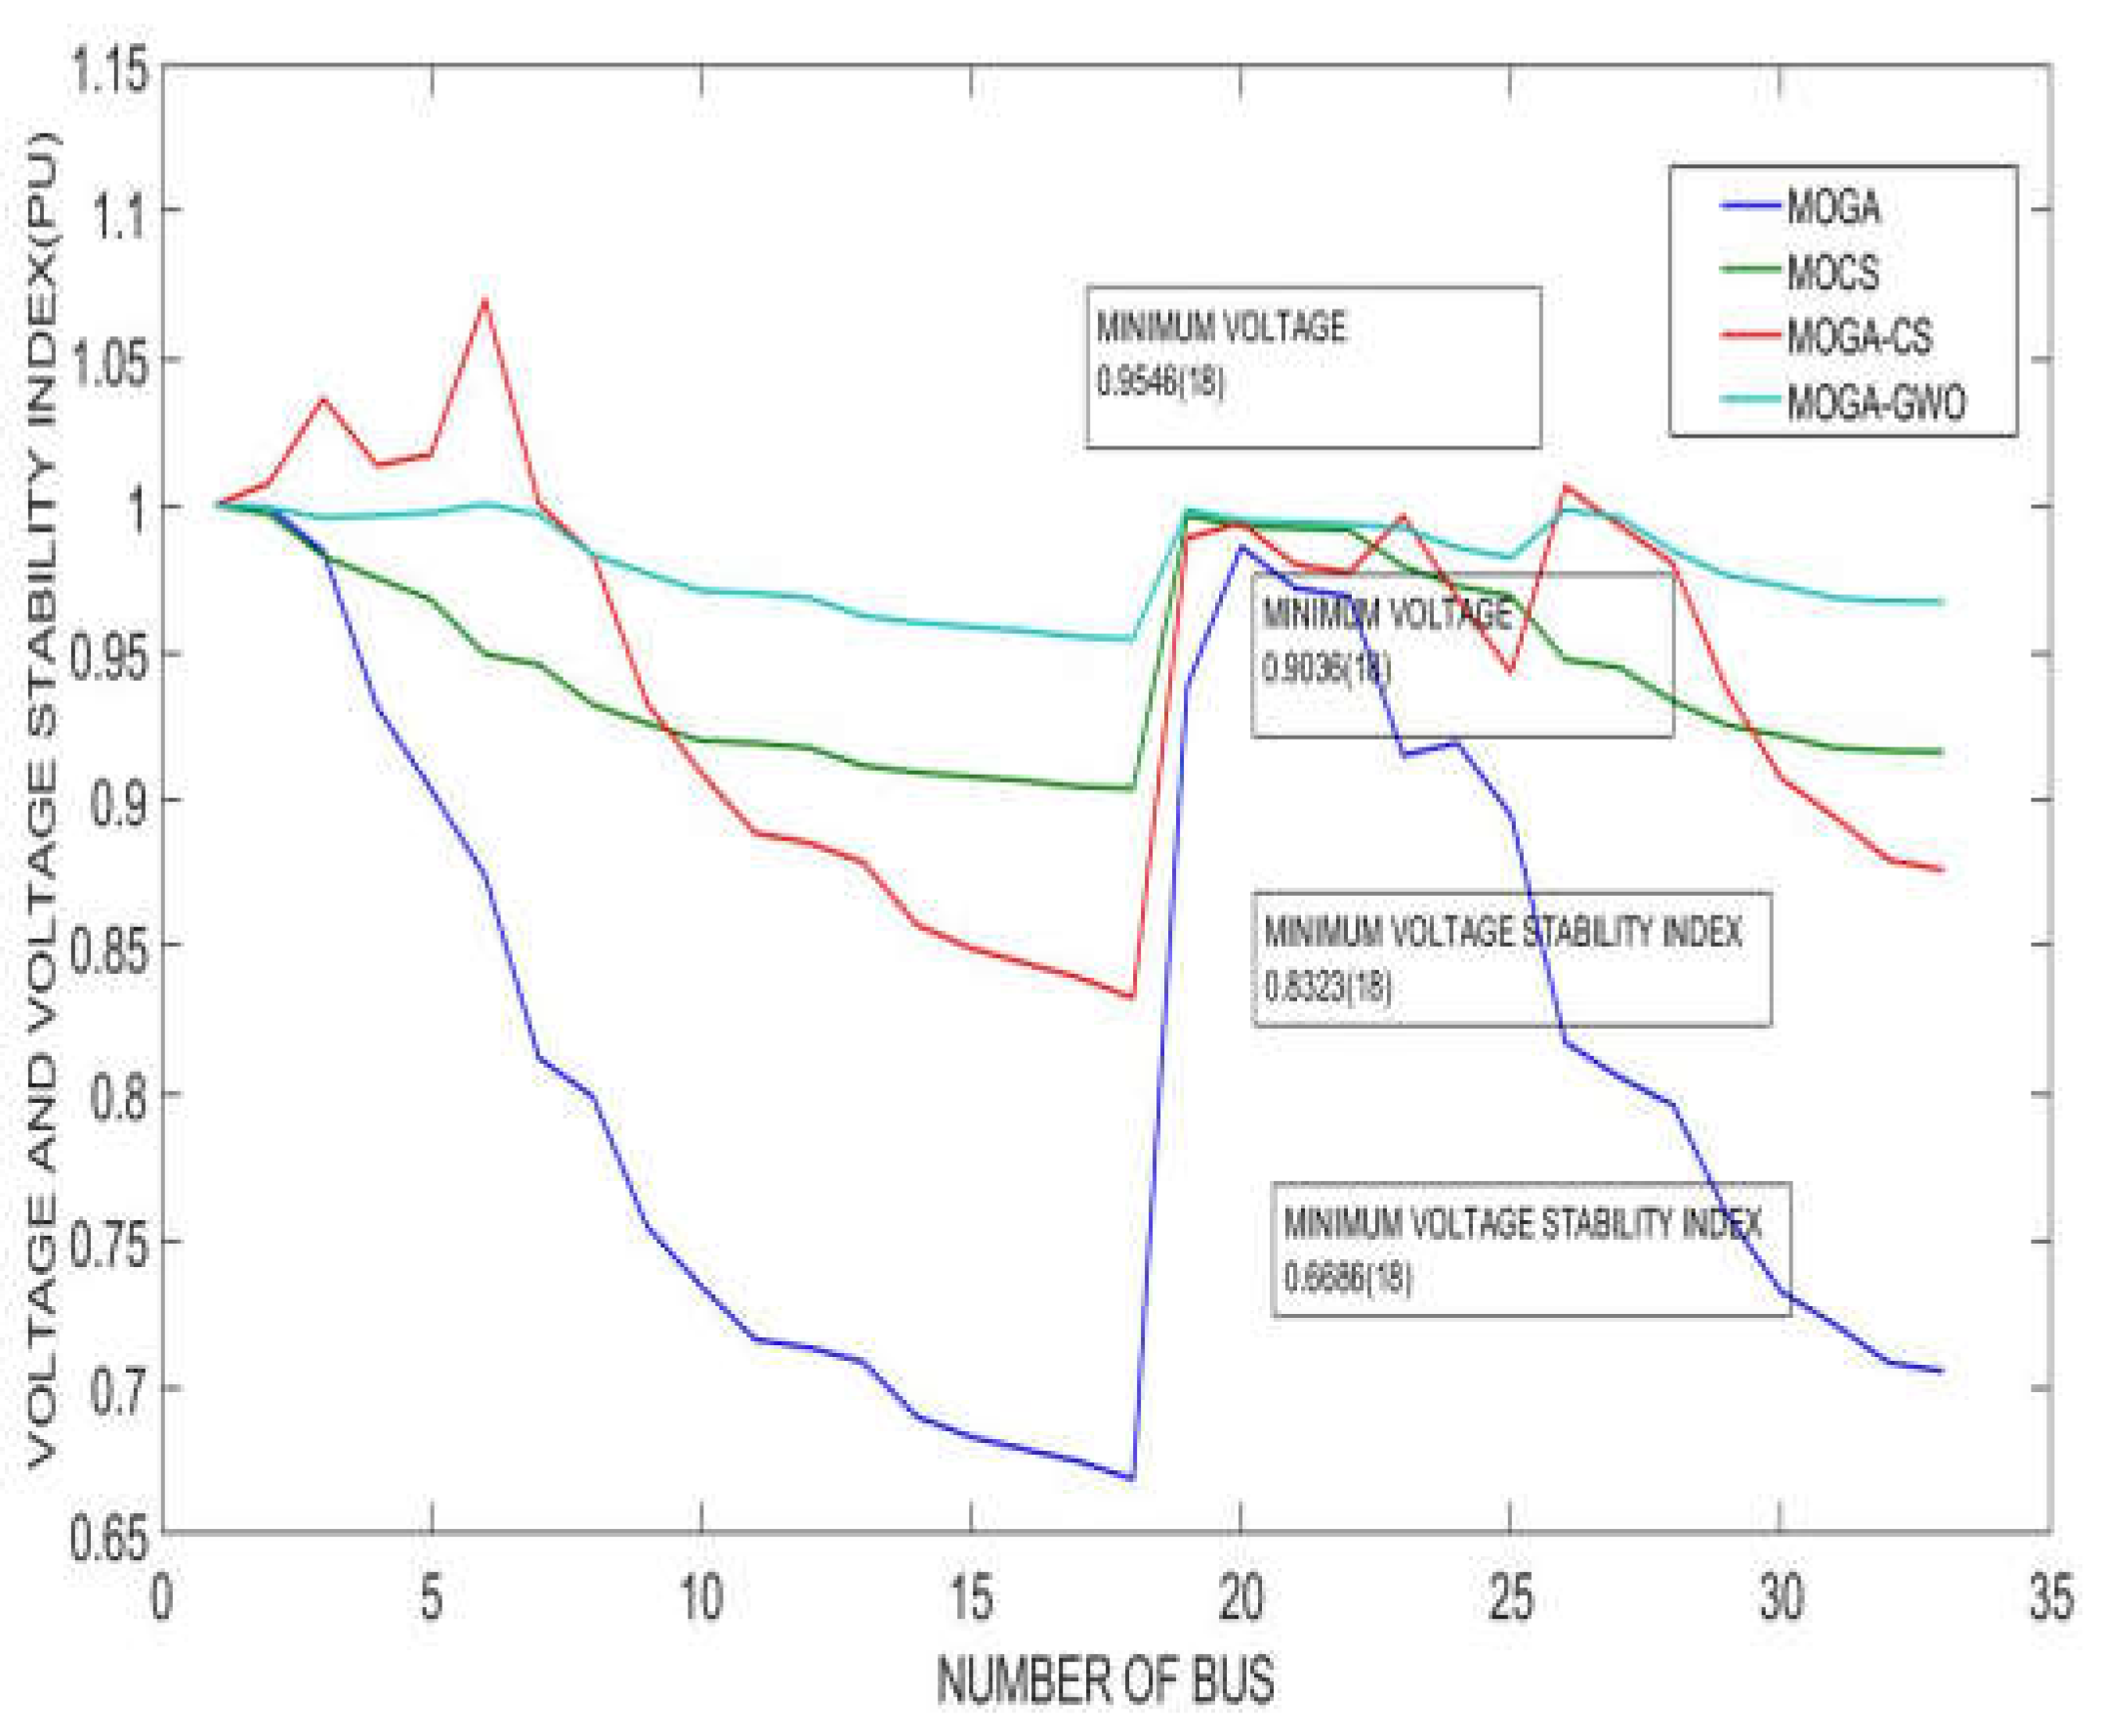
- MOGA-GWO outperformed Hybrid GWO-CS, MOGA, and MOCS in terms of power loss reduction, voltage profile improvement, resilience enhancement, and adherence to environmental constraints. The Multi-DGs reconfiguration placement using the MOGA-GWO algorithm led to a substantial reduction in system power losses, achieving a decrease of up to 41.9355 kW.
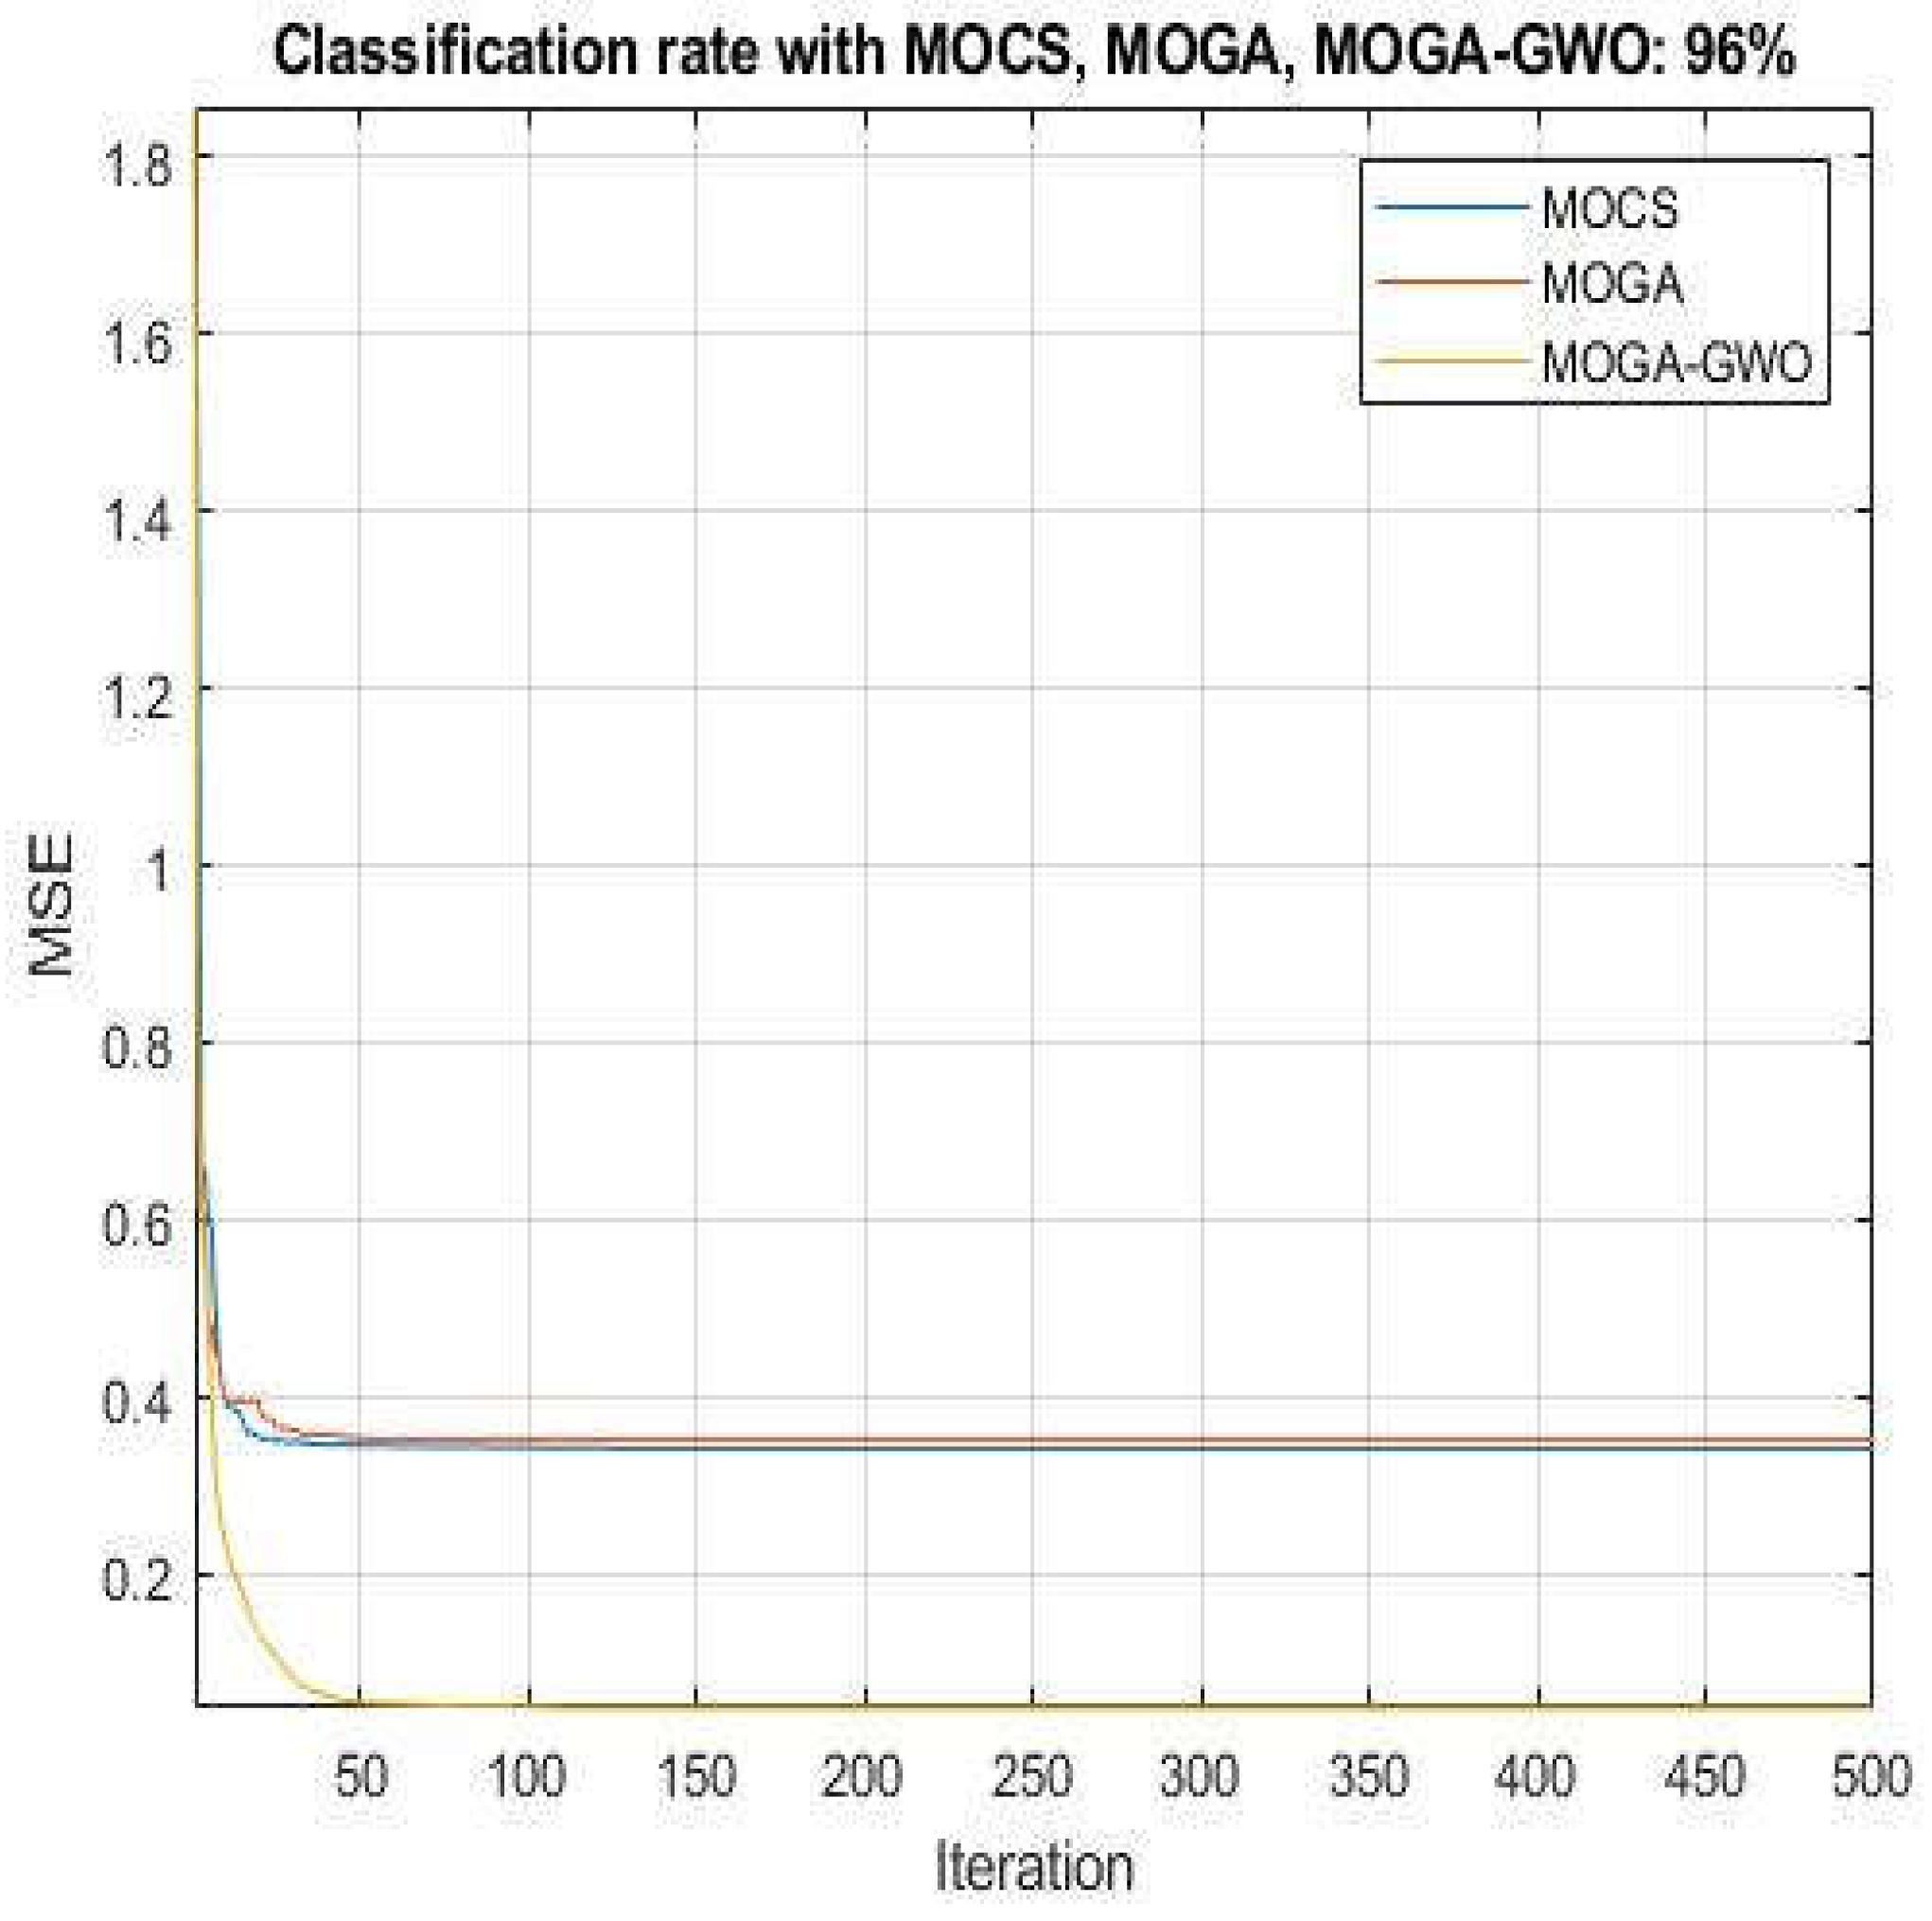
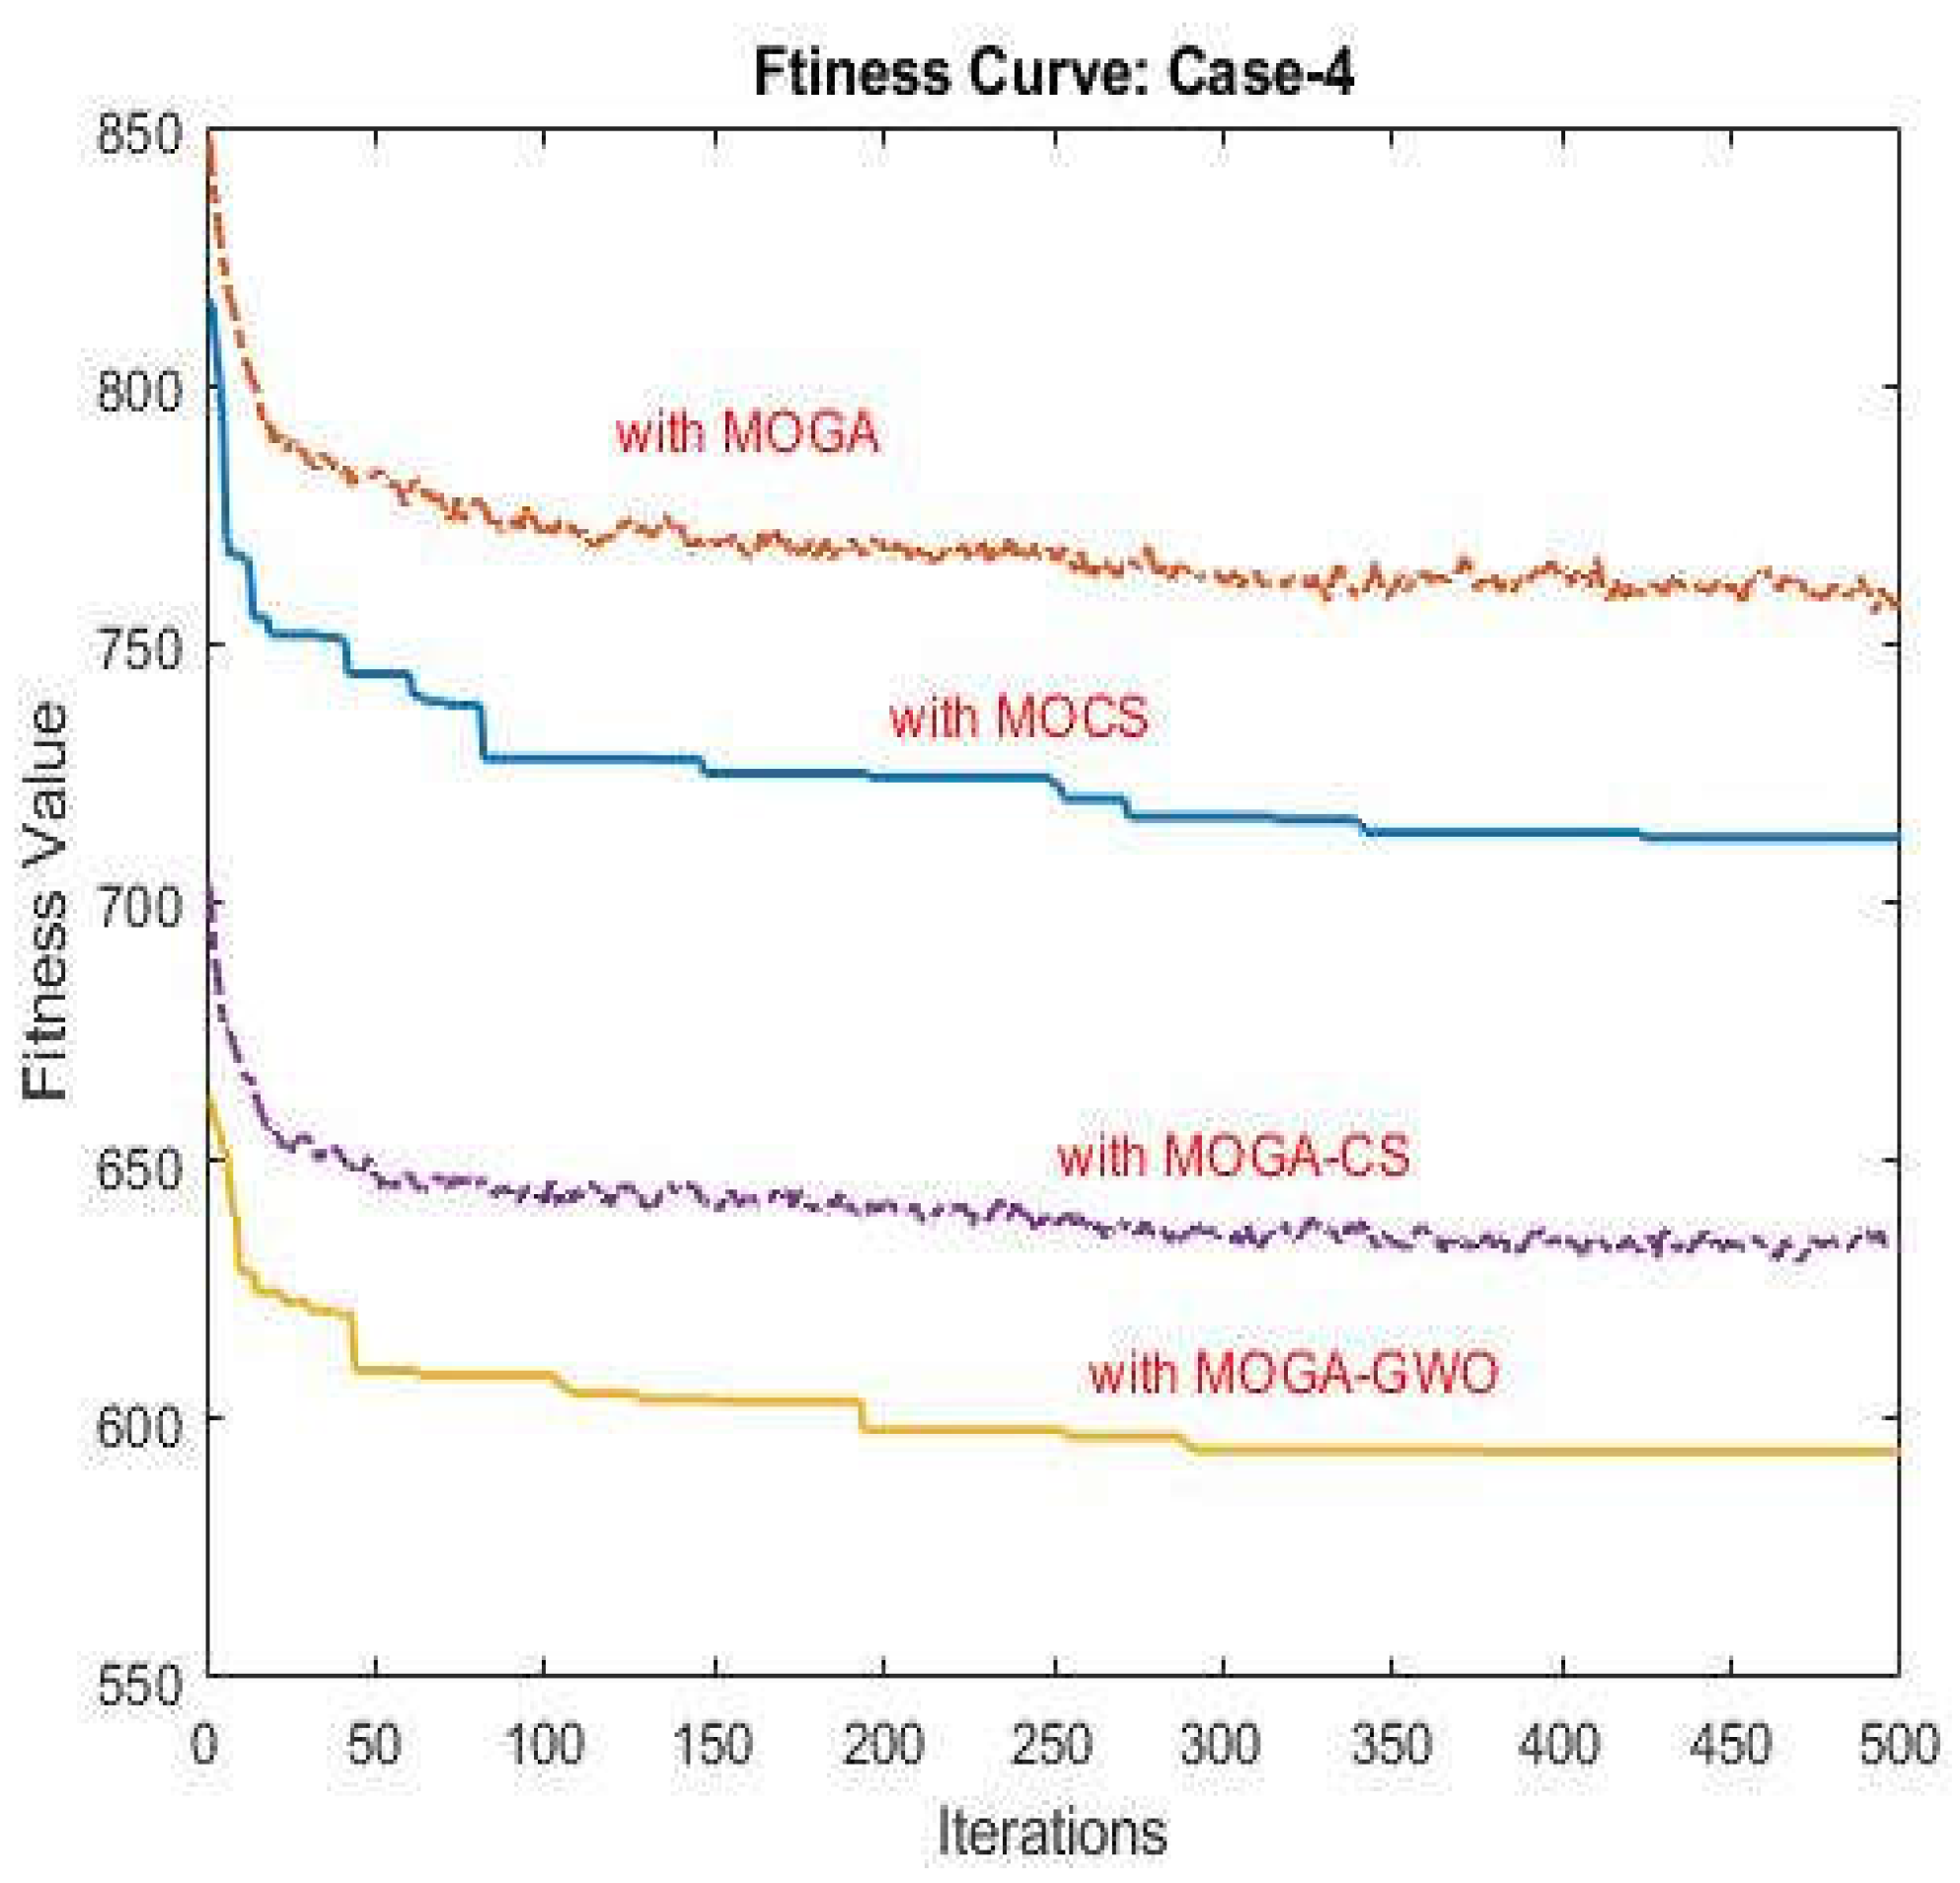
- Significant improvements in voltage profile and stability were achieved through controlled power loss mitigation facilitated by the reconfiguration and installation of multiple DG units. The proposed MOGA-GWO algorithm demonstrated quick convergence and strong global optimization capabilities, mitigating the risk of falling into local optima and thereby enhancing its overall performance.
- The study aimed at the comprehensive optimization of various indices, including economic benefits, voltage stability, deviation and maintenance, system resilience, real power losses minimization, and environmental impact. The MOGA-GWO algorithm effectively addressed these diverse objectives under different scenarios and constraints. The complexity of the planning model’s objective function was instrumental in considering multiple demands and improving the overall performance of the planning scheme.
- The integration of DG and RES in the planning process contributed to enhanced clean energy consumption and optimized power flow. This approach not only reduced network losses and voltage deviations but also improved system resiliency and environmental impact.
Author Contributions
Funding
Conflicts of Interest
References
- Carley, Sanya. “Distributed generation: An empirical analysis of primary motivators.” Energy policy 37, no. 5 (2009): 1648-1659.
- Botan, Antonio CB, Ramiro G. R Camacho, Geraldo Lucio Tiago Filho, and Maria Claudia CO Botan. “Comparative analysis for distributed generation using ultra--low head hydro, solar and wind energies.” International Journal of Energy Research 45, no. 11 (2021): 16310-16328.
- El-Bidairi, K. S. N. “Fuzzy-grey wolf optimization for energy storage sizing and power management in microgrids.” PhD diss., University Of Tasmania, 2019.
- Adetunji, Kayode E., Ivan W. Hofsajer, Adnan M. Abu-Mahfouz, and Ling Cheng. “A review of metaheuristic techniques for optimal integration of electrical units in distribution networks.” IEEE Access 9 (2020): 5046-5068.
- Barnwal, Akhilesh Kumar, Lokesh Kumar Yadav, and Mitresh Kumar Verma. “A multi-objective approach for voltage stability enhancement and loss reduction under PQV and P buses through reconfiguration and distributed generation allocation.” IEEE Access 10 (2022): 16609-16623.
- Sultana, U. , Azhar B. Khairuddin, M. M. Aman, A. S. Mokhtar, and N. Zareen. “A review of optimum DG placement based on minimization of power losses and voltage stability enhancement of distribution system.” Renewable and Sustainable Energy Reviews 63 (2016): 363-378.
- Paliwal, Priyanka, N. P. Patidar, and R. K. Nema. “Planning of grid integrated distributed generators: A review of technology, objectives and techniques.” Renewable and sustainable energy reviews 40 (2014): 557-570.
- Li, Chendan, Federico De Bosio, Fang Chen, Sanjay K. Chaudhary, Juan C. Vasquez, and Josep M. Guerrero. “Economic dispatch for operating cost minimization under real-time pricing in droop-controlled DC microgrid.” IEEE Journal of emerging and selected topics in power electronics 5, no. 1 (2016): 587-595.
- Gabash, Aouss, and Pu Li. “Active-reactive optimal power flow in distribution networks with embedded generation and battery storage.” IEEE Transactions on Power Systems 27, no. 4 (2012): 2026-2035.
- Shen, Zhijun, Mingbo Liu, Lixin Xu, and Wentian Lu. “Bi-level mixed-integer linear programming algorithm for evaluating the impact of load-redistribution attacks on Volt-VAR optimization in high-and medium-voltage distribution systems.” International Journal of Electrical Power & Energy Systems 128 (2021): 106683.
- Kumar, K. Prakash, and B. Saravanan. “Recent techniques to model uncertainties in power generation from renewable energy sources and loads in microgrids–A review.” Renewable and Sustainable Energy Reviews 71 (2017): 348-358.
- Faria, Pedro, João Soares, Zita Vale, Hugo Morais, and Tiago Sousa. “Modified particle swarm optimization applied to integrated demand response and DG resources scheduling.” IEEE Transactions on smart grid 4, no. 1 (2013): 606-616.
- Almabsout, Emad Ali, Ragab A. El-Sehiemy, Osman Nuri Uc An, and Oguz Bayat. “A hybrid local search-genetic algorithm for simultaneous placement of DG units and shunt capacitors in radial distribution systems.” IEEE Access 8 (2020): 54465-54481.
- Ogunsina, Adeseye Amos, Moses Omolayo Petinrin, Olutomilayo Olayemi Petinrin, Emeka Nelson Offornedo, Joseph Olawole Petinrin, and Gideon Olusola Asaolu. “Optimal distributed generation location and sizing for loss minimization and voltage profile optimization using ant colony algorithm.” SN Applied Sciences 3 (2021): 1-10.
- Hafez, Ahmed A., Almoataz Y. Abdelaziz, Mohamed A. Hendy, and Alaa FM Ali. “Optimal sizing of off-line micro-grid via hybrid multi-objective simulated annealing particle swarm optimizer.” Computers & Electrical Engineering 94 (2021): 107294.
- Kayalvizhi, S. , and Vinod Kumar DM. “Optimal planning of active distribution networks with hybrid distributed energy resources using grid-based multi-objective harmony search algorithm.” Applied Soft Computing 67 (2018): 387-398.
- Kumar, Sajjan, Kamal K. Mandal, and Niladri Chakraborty. “Optimal DG placement by multi-objective opposition based chaotic differential evolution for techno-economic analysis.” Applied Soft Computing 78 (2019): 70-83.
- Vijaya Kumar, N. M., S. Charles Raja, S. Arun Mozhi, and J. Jeslin Drusila Nesamalar. “Effective Power Loss Management in the Distribution System by the Hybrid Cuckoo Search Grey Wolf Optimizer.” IETE Journal of Research (2023): 1-13.
- Shaik, Aarif, and Suresh Kumar Sudabattula. “Optimal PV Distributed Generators Allocation Using Firefly Algorithm to Enhance Voltage Profile.” SN Computer Science 4, no. 5 (2023): 510.
- Pujari, Harish Kumar, and Mageshvaran Rudramoorthy. “Grey wolf optimization algorithm for solving distribution network reconfiguration considering distributed generators simultaneously.” International Journal of Sustainable Energy 41, no. 11 (2022): 2121-2149.
- Aman, M. M., G. B. Jasmon, Ab Halim Abu Bakar, and Hazlie Mokhlis. “A new approach for optimum simultaneous multi-DG distributed generation Units placement and sizing based on maximization of system load ability using HPSO (hybrid particle swarm optimization) algorithm.” Energy 66 (2014): 202-215.
- Poonam, Singh, Pandit Manjaree, and Srivastava Laxmi. “Comparison of traditional and swarm intelligence based techniques for optimization of hybrid renewable energy system.” Renewable Energy Focus 35 (2020): 1-9.
- Llerena-Pizarro, Omar, Nestor Proenza-Perez, Celso Eduardo Tuna, and Jose Luz Silveira. “A PSO-BPSO technique for hybrid power generation system sizing.” IEEE Latin America Transactions 18, no. 08 (2020): 1362-1370.
- Ananth, D. V. N. , and K. S. T. Vineela. “A review of different optimization techniques for solving single and multi-objective optimization problem in power system and mostly unit commitment problem.” International Journal of Ambient Energy 42, no. 14 (2021): 1676-1698.
- Picioroaga, Irina, Madalina Luca, Andrei Tudose, Dorian Sidea, Mircea Eremia, and Constantin Bulac. “Resilience-Driven Optimal Sizing of Energy Storage Systems in Remote Microgrids.” Sustainability 15, no. 22 (2023): 16002.
- Vilaisarn, Youthanalack, Yuri R. Rodrigues, Morad Mohamed Abdelmageed Abdelaziz, and Jérôme Cros. “A deep learning based multiobjective optimization for the planning of resilience oriented micro-grids in active distribution system.” IEEE Access 10 (2022): 84330-84364.
- S. Campanari, E. Macchi, Technical and Tariff Scenarios Effect on Micro-turbine Tri-generative Applications, J. Eng. Gas Turb. Power 126 (2004) 581-589.
- http://www.windturbines.ca/vestas_v44.htm, 11.12.2012.
- Alaswad, Abed, Abdelnasir Omran, Jose Ricardo Sodre, Tabbi Wilberforce, Gianmichelle Pignatelli, Michele Dassisti, Ahmad Baroutaji, and Abdul Ghani Olabi. “Technical and commercial challenges of proton-exchange membrane (PEM) fuel cells.” Energies 14, no. 1 (2020): 144.
- Gianto, Rudy. “Steadystate model of DFIG--based wind power plant for load flow analysis.” IET Renewable Power Generation 15, no. 8 (2021): 1724-1735.
- Ullah, Zia, Shaorong Wang, Jordan Radosavljević, and Jinmu Lai. “A solution to the optimal power flow problem considering WT and PV generation.” IEEE Access 7 (2019): 46763-46772.
- Kazmi, Syed Ali Abbas, Muhammad Khuram Shahzad, and Dong Ryeol Shin. “Multi-objective planning techniques in distribution networks: A composite review.” Energies 10, no. 2 (2017): 208.
- Nallolla, Chinna Alluraiah, Vijayapriya P, Dhanamjayulu Chittathuru, and Sanjeevi kumar Padmanaban. “Multi-Objective Optimization Algorithms for a Hybrid AC/DC Micro-grid Using RES: A Comprehensive Review.” Electronics 12, no. 4 (2023): 1062.
- Ming, Mengjun, Rui Wang, Yabing Zha, and Tao Zhang. “Multi-objective optimization of hybrid renewable energy system using an enhanced multi-objective evolutionary algorithm.” Energies 10, no. 5 (2017): 674.
- Atwa, Y. M. , Ehab F. El-Saadany, M. M. A. Salama, R. Seethapathy, M. Assam, and S. Conti. “Adequacy evaluation of distribution system including wind/solar DG during different modes of operation.” IEEE Transactions on Power systems 26, no. 4 (2011): 1945-1952.
- Mukhopadhyay, Bineeta, and Debapriya Das. “Optimal multi-objective expansion planning of a droop-regulated islanded micro-grid.” Energy 218 (2021): 119415.
- Shaaban, Mostafa F., and E. F. El-Saadany. “Accommodating high penetrations of PEVs and renewable DG considering uncertainties in distribution systems.” IEEE transactions on power systems 29, no. 1 (2013): 259-270.
- Mellouk, Lamyae, Abdessadek Aaroud, Mohamed Boulmalf, Khalid Zine-Dine, and Driss Benhaddou. “Development and performance validation of new parallel hybrid cuckoo search–genetic algorithm.” Energy Systems 11 (2020): 729-751.
- Hemeida, Mahmoud G., Salem Alkhalaf, Tomonobu Senjyu, Abdalla Ibrahim, Mahrous Ahmed, and Ayman M. Bahaa-Eldin. “Optimal probabilistic location of DGs using Monte Carlo simulation based different bio-inspired algorithms.” Ain Shams Engineering Journal 12, no. 3 (2021): 2735-2762.
- Duarte, Yorlandys Salgado, Janusz Szpytko, and Alfredo M. del Castillo Serpa. “Monte Carlo simulation model to coordinate the preventive maintenance scheduling of generating units in isolated distributed Power Systems.” Electric Power Systems Research 182 (2020): 106237.
- Khan, Arbaz, Manil T. Mohan, and Ricardo Ruiz-Baier. “Conforming, nonconforming and DG methods for the stationary generalized Burgers-Huxley equation.” Journal of Scientific Computing 88 (2021): 1-26.
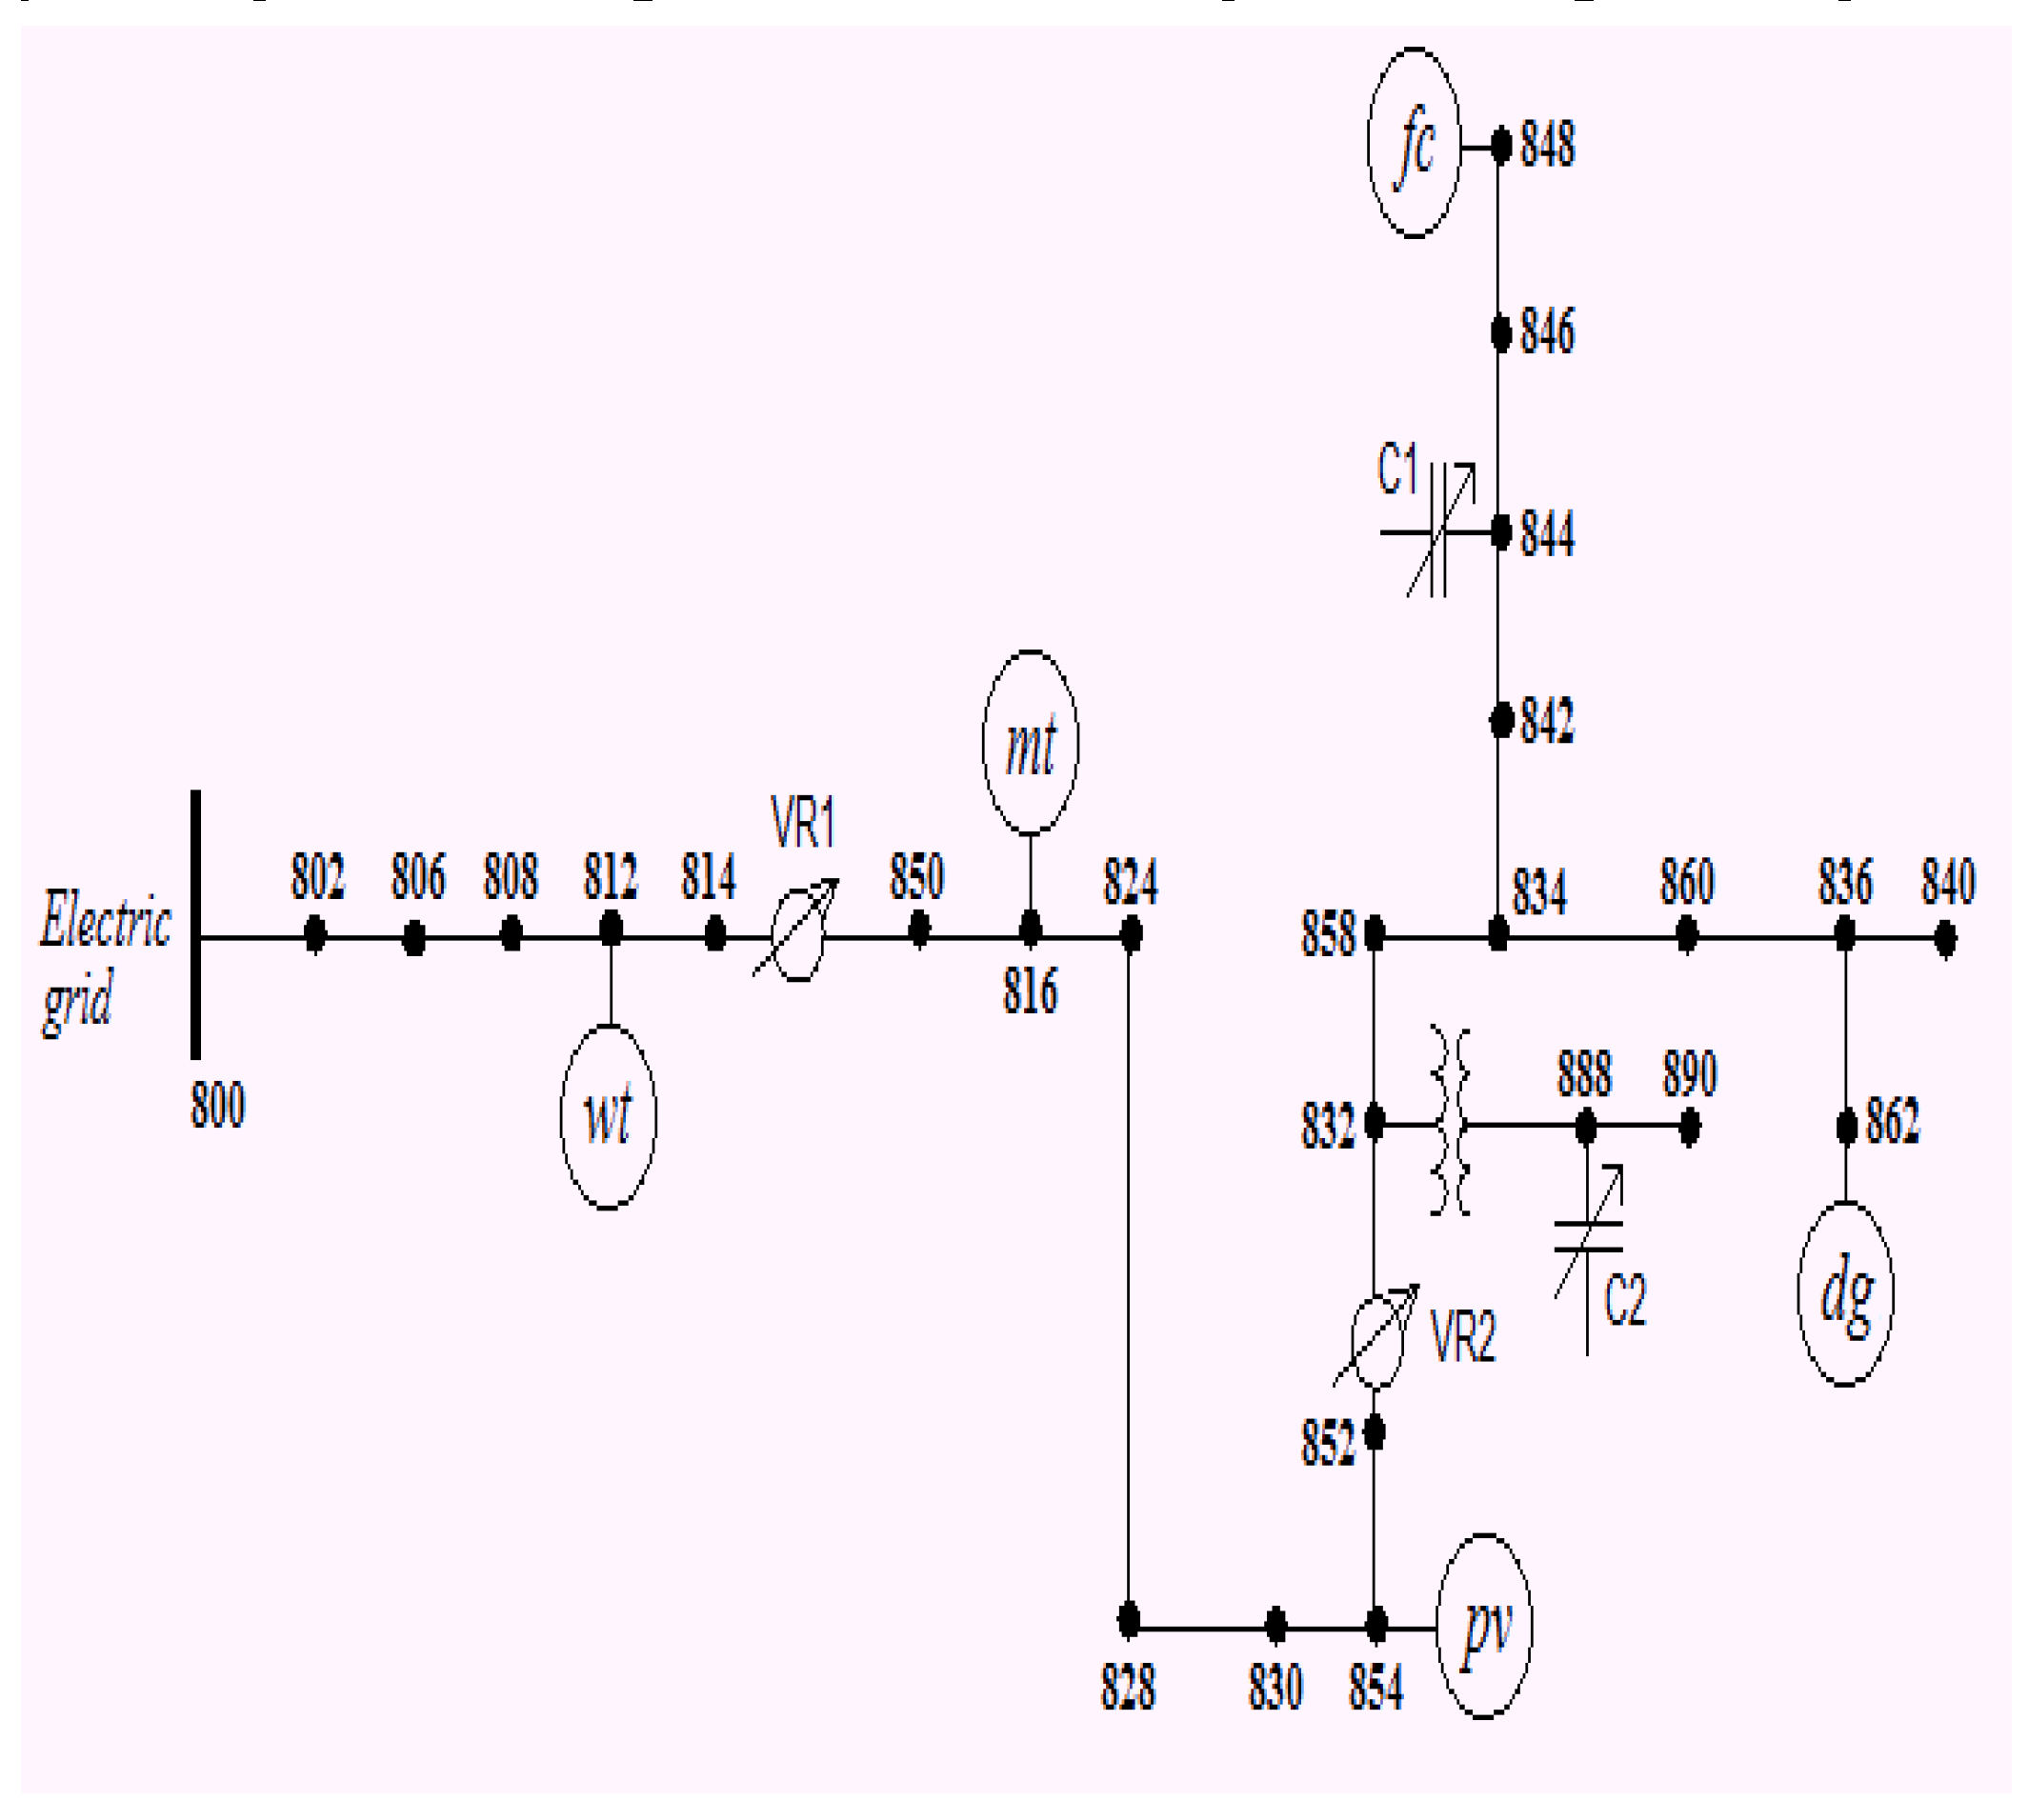
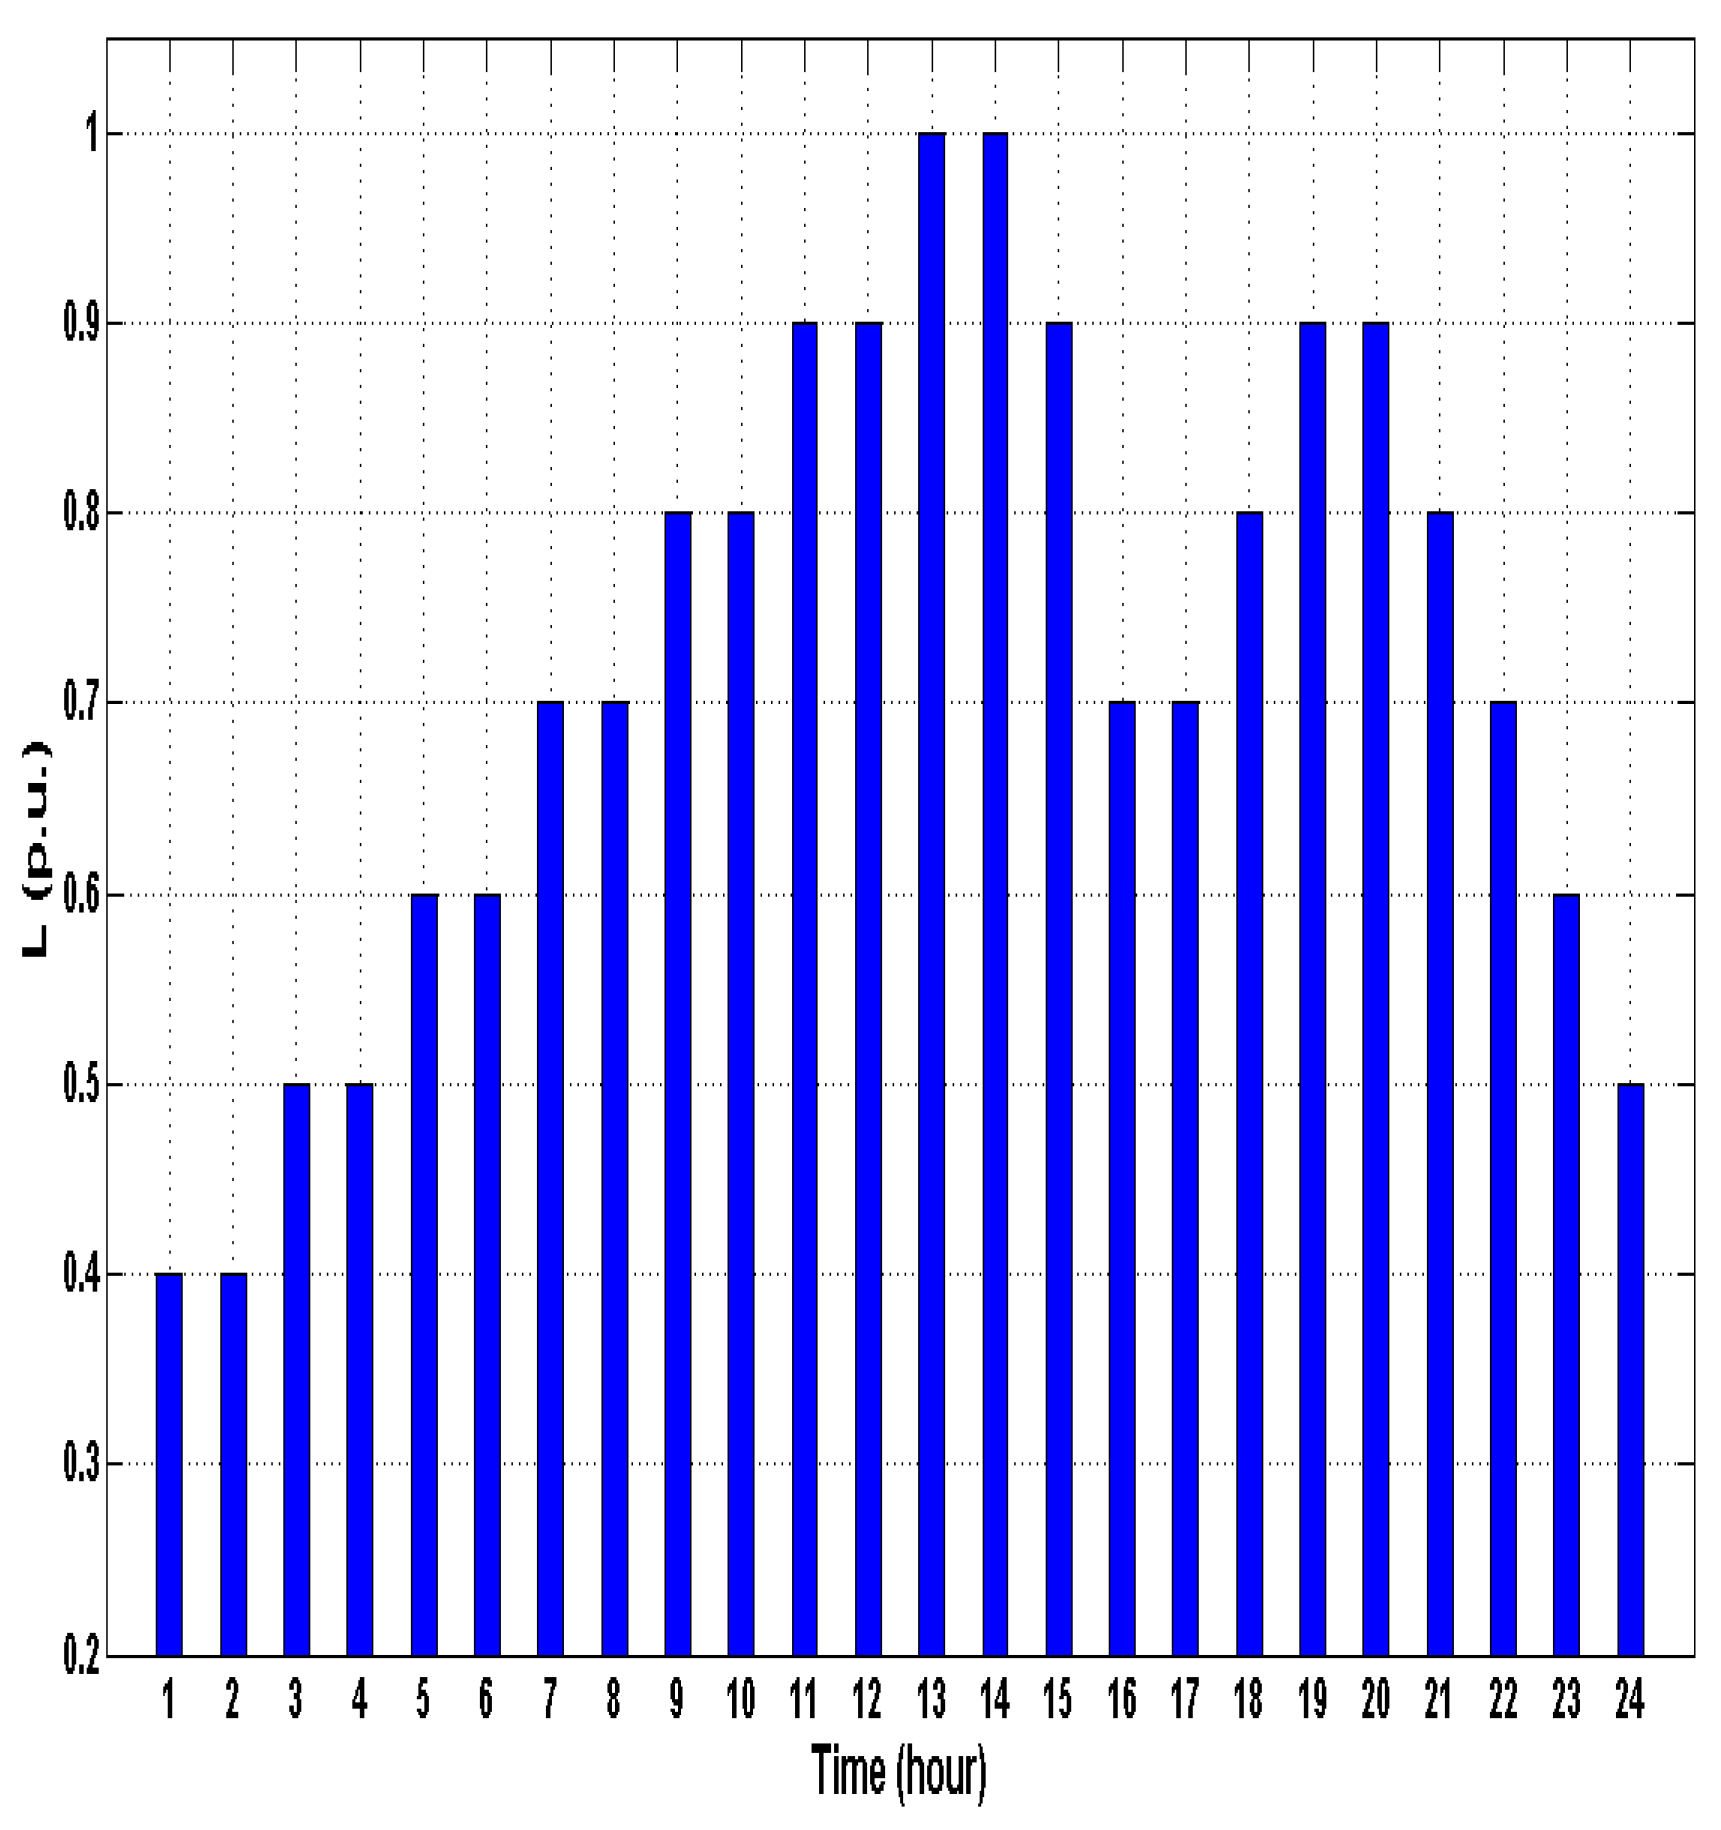
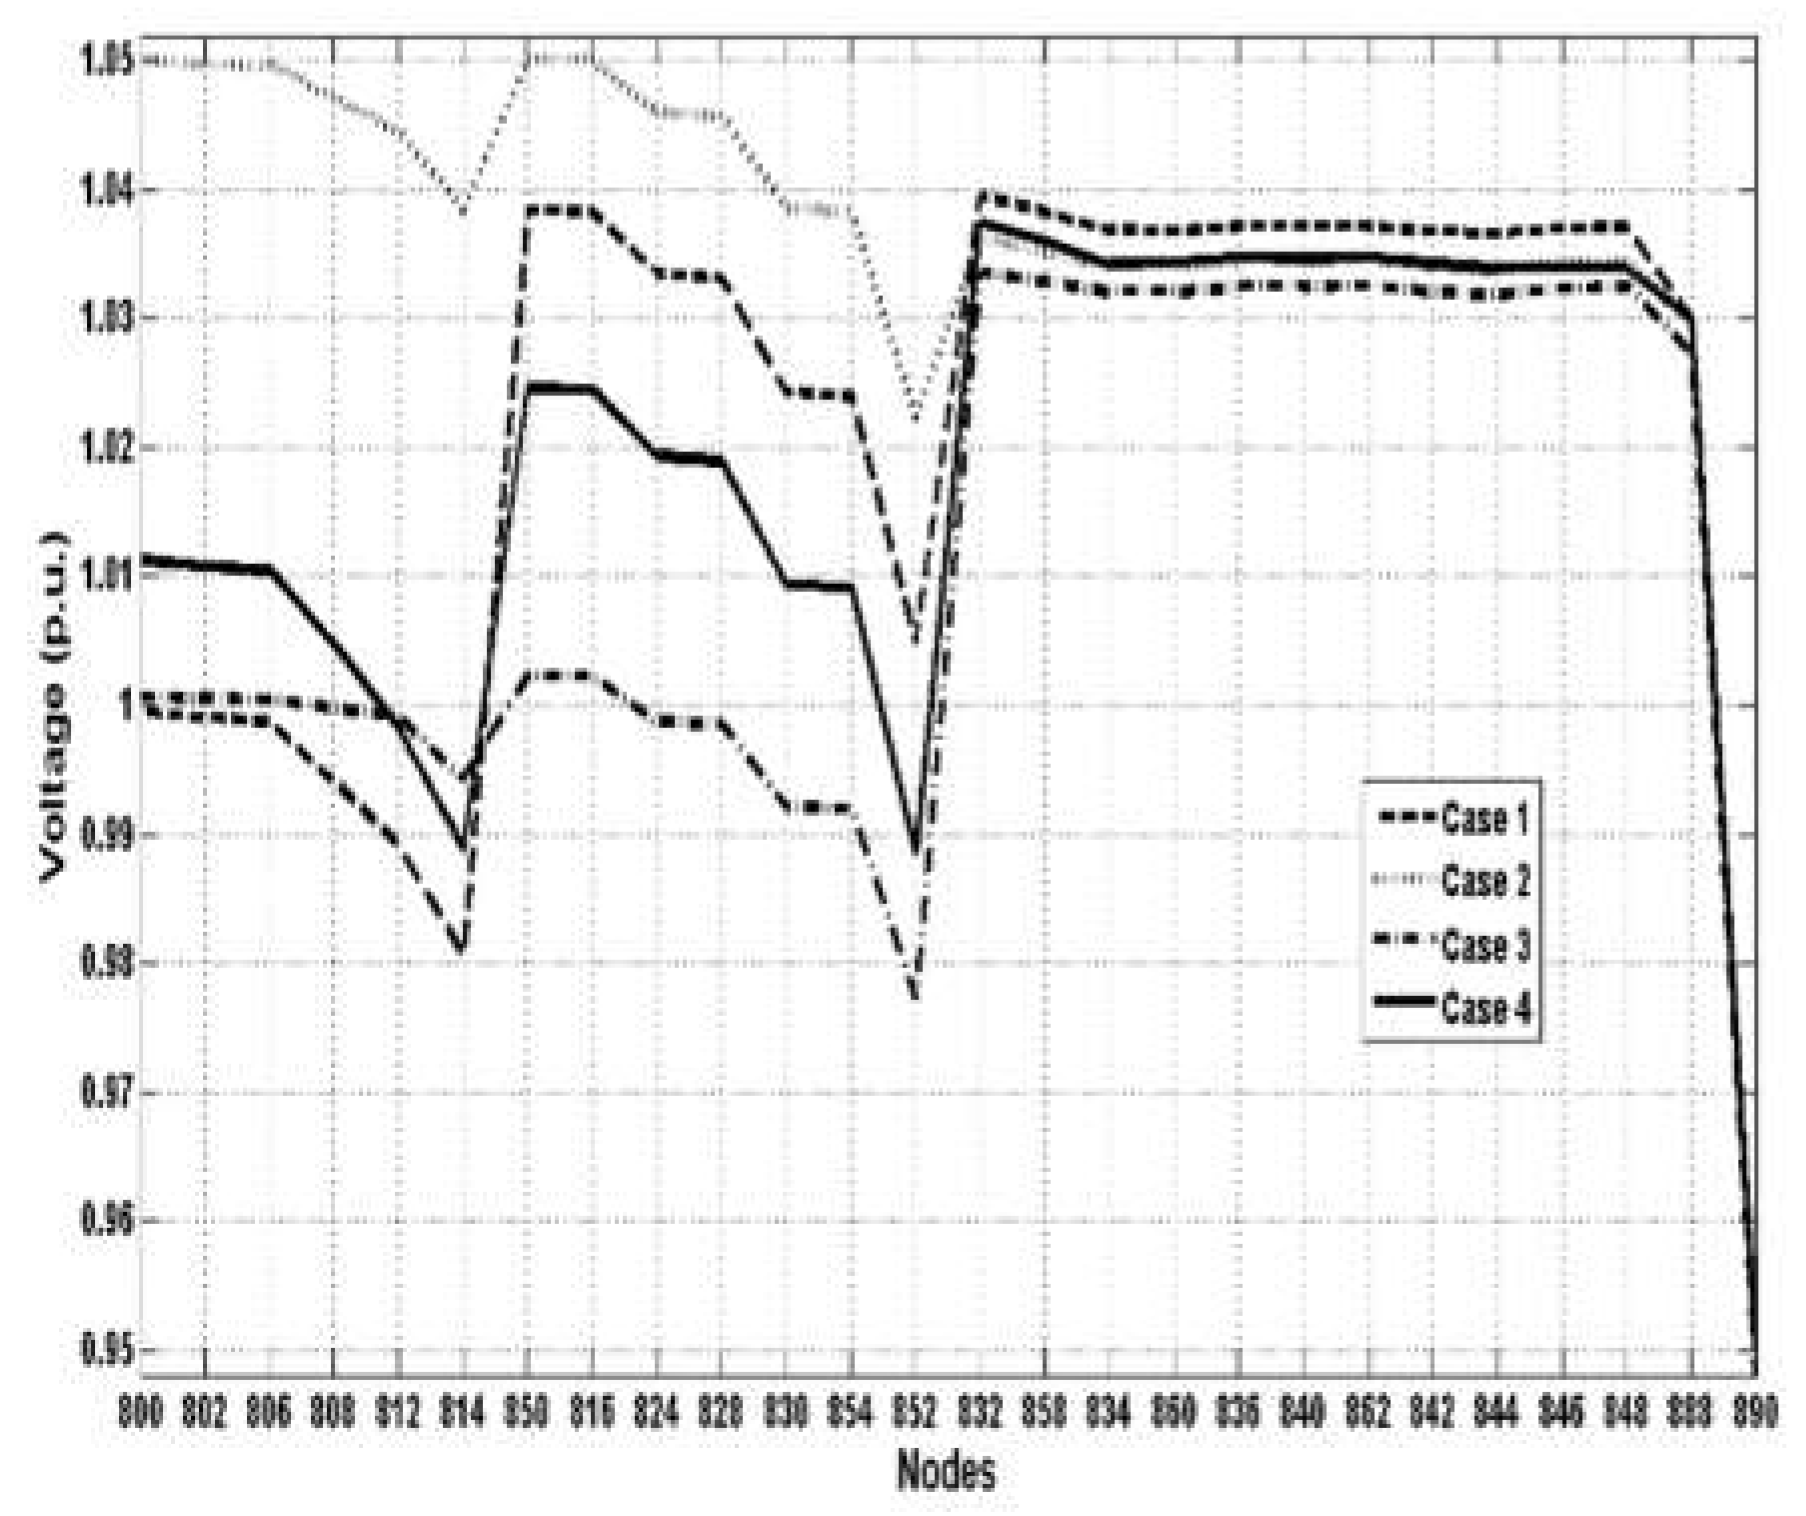
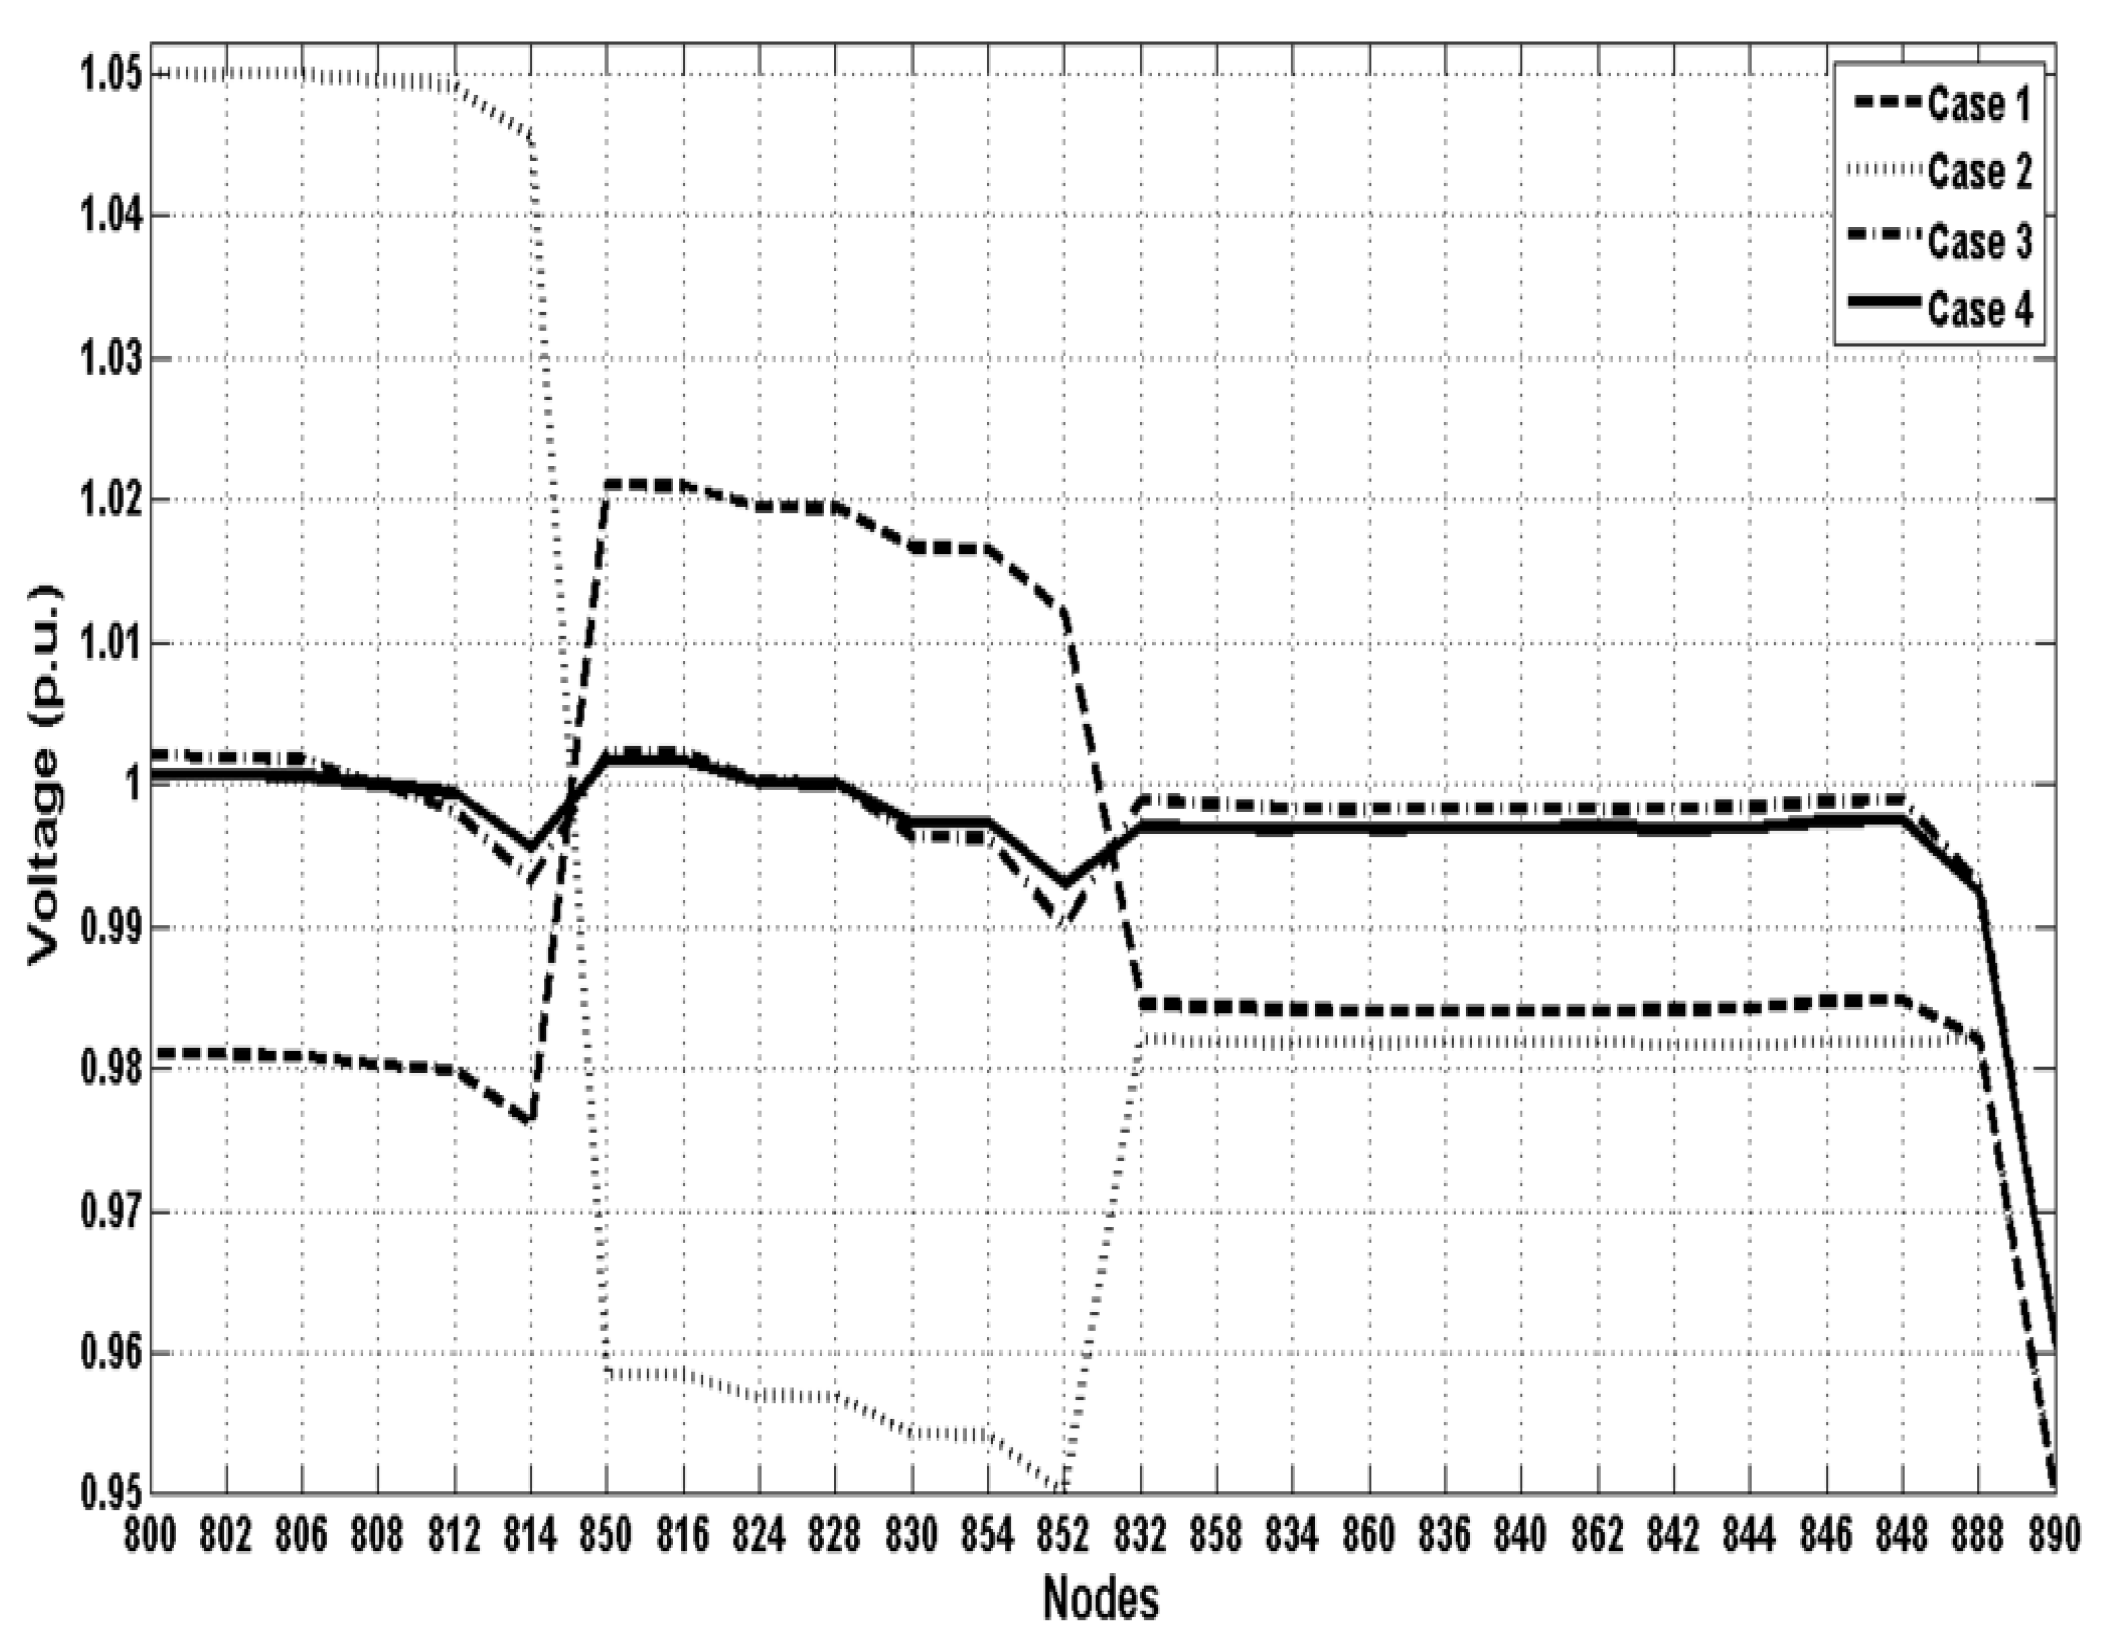
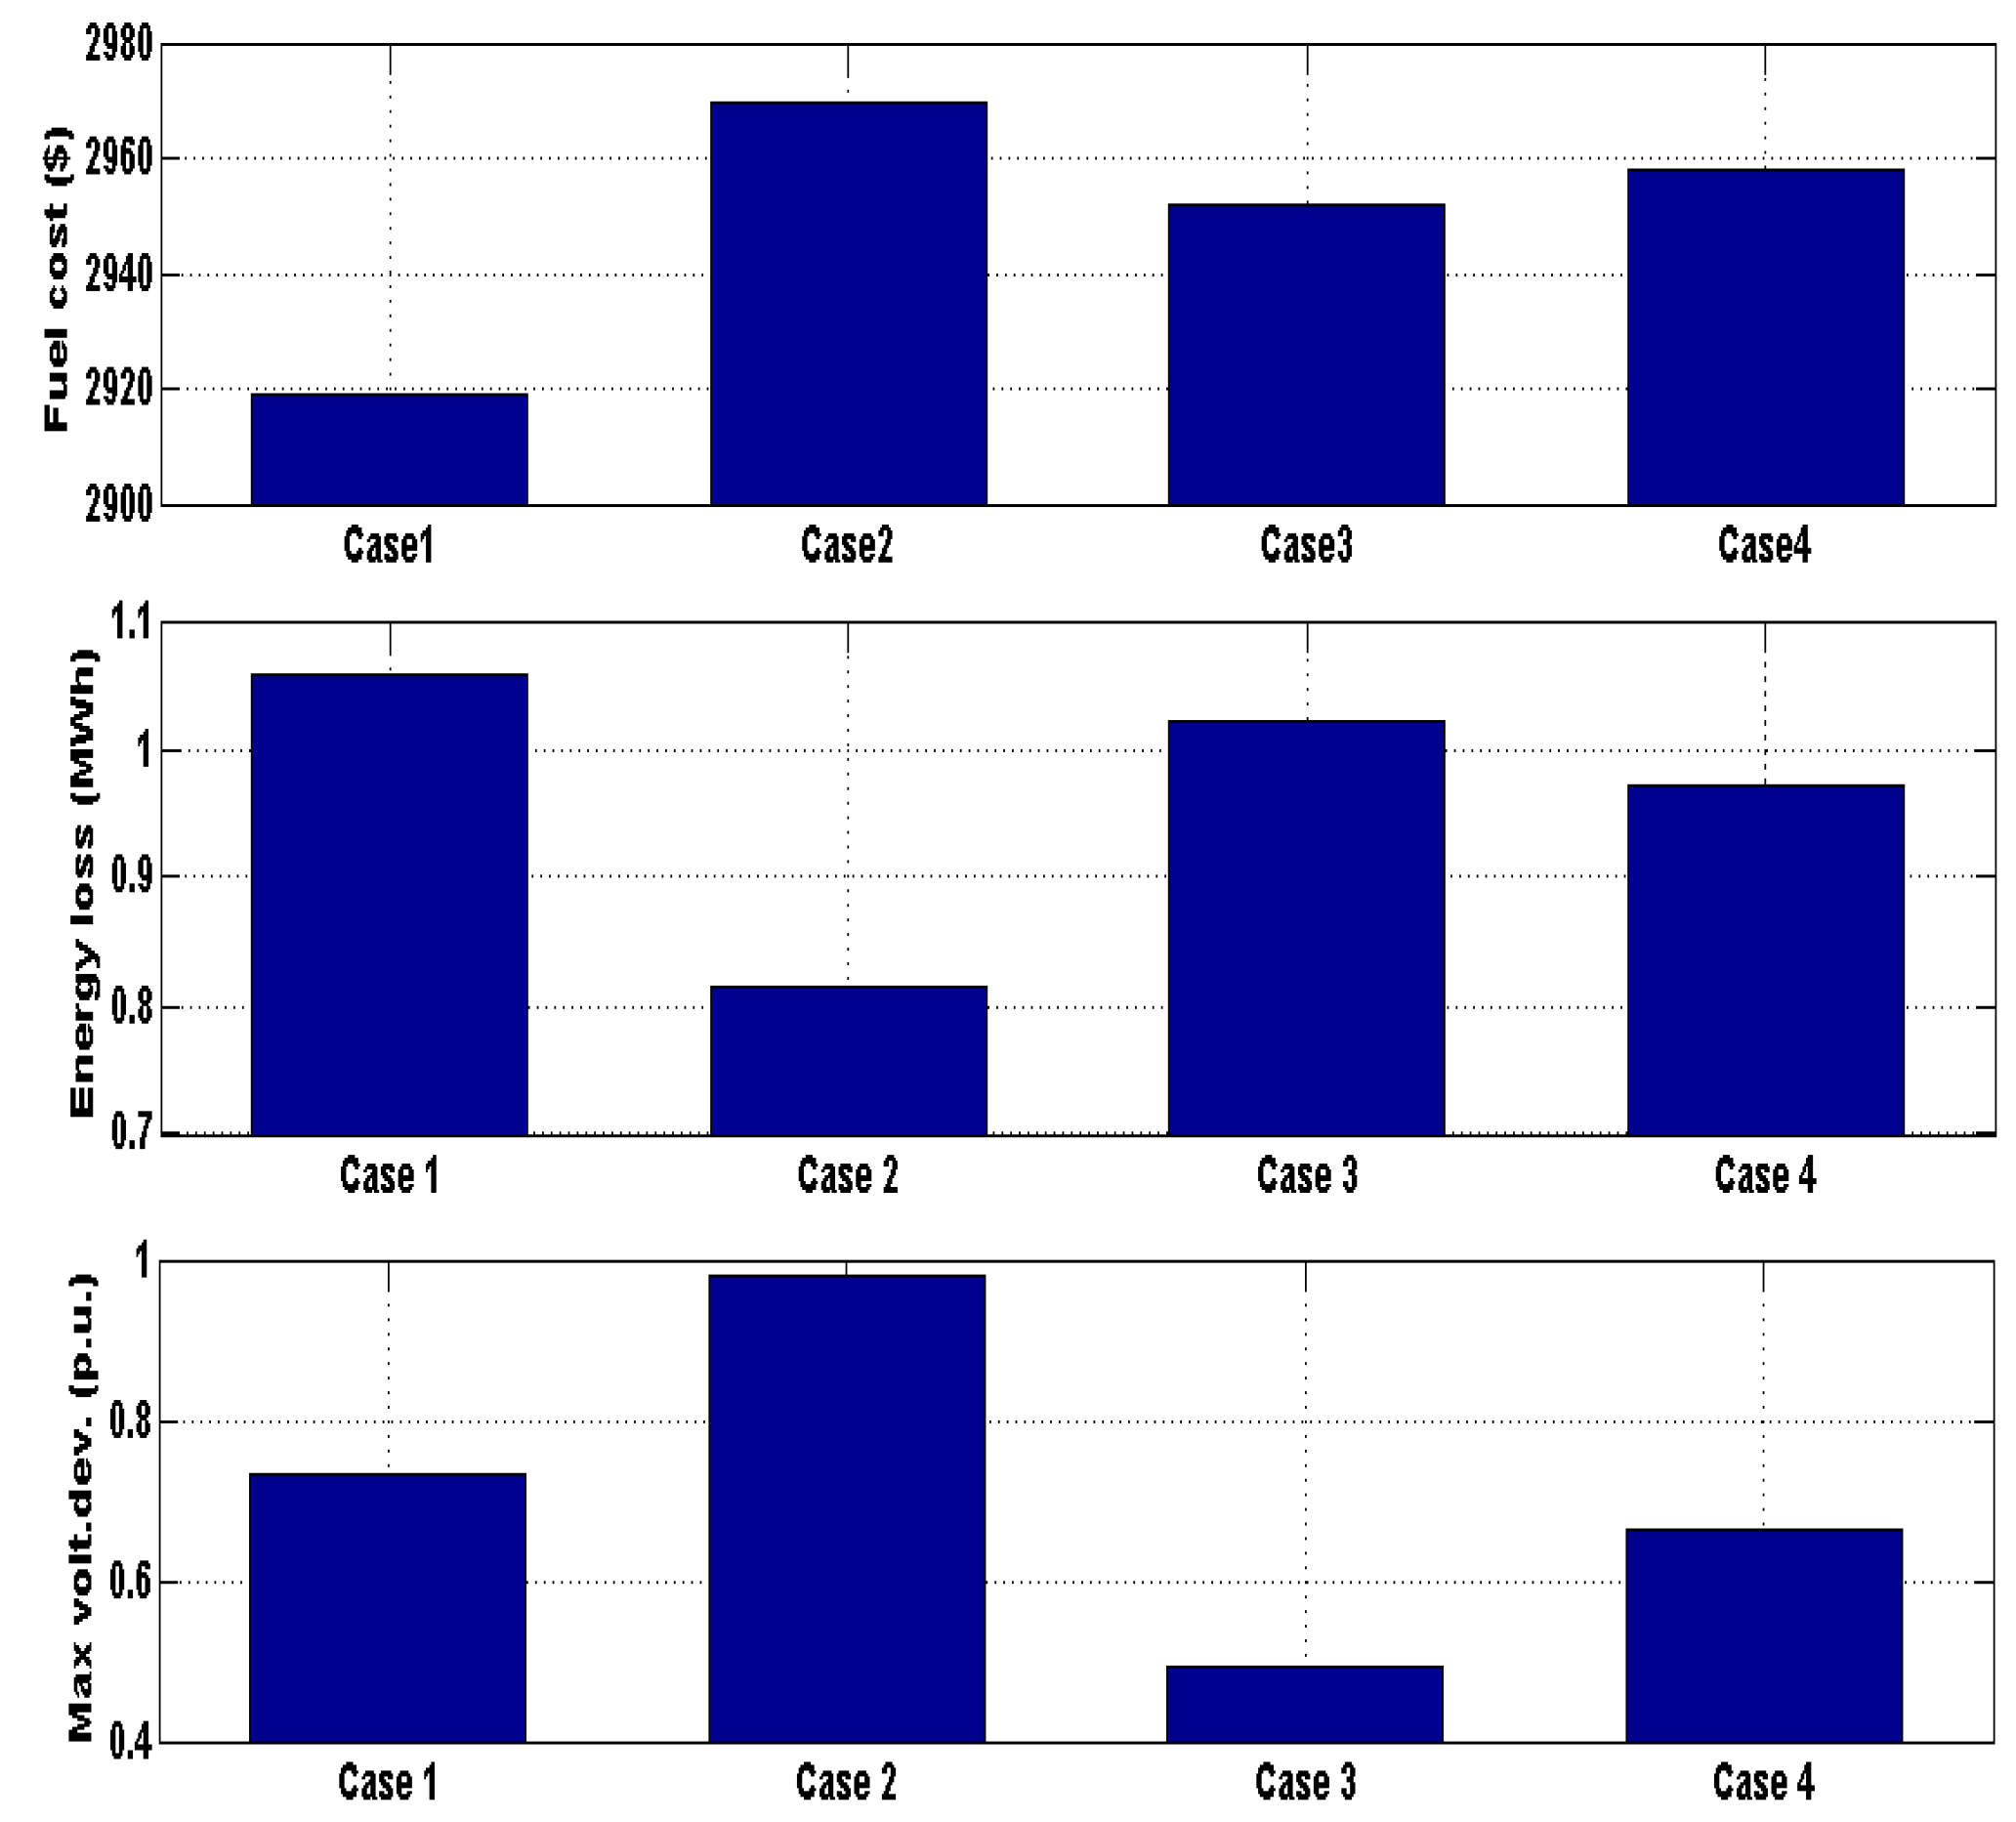

| Location | Type | Mode | PDgnom(kW) | QDG (kVAr) |
| 800 | Electric grid | Slack node | - | - |
| 812.5 | WT | PQ | 600 | cosφ=0.9 |
| 816.5 | MT | PQ | 300 | cosφ=0.9 |
| 848 | FC | PV | 300 | -0.888888889 |
| 854.5 | PV | PQ | 250 | cosφ=0.9 |
| 861.5 | DG | PQ | 369 | cosφ=0.9 |
| Control variables | Min | Max |
| Pfc (kW) | 0 | 300 |
| Pmt | 0 | 300 |
| Pdg | 0 | 369 |
| QC1(kVAr) | 0 | 300 |
| QC2(kVAr) | 0 | 300 |
| V800(p.u.) | 0.97 | 1.05 |
| V848(p.u.) | 0.98 | 1.05 |
| tVR1 (p.u.) | 0.9 | 1.1 |
| tVR2 (p.u.) | 0.9 | 1.1 |
| Max load (Time=14 hour) | Min load (Time=2 hour) | ||||||||
| Case 1 | Case 2 | Case 3 | Case 4 | Case 1 | Case 2 | Case 3 | Case 4 | ||
| Pmt (kW) | 310 | 310 | 310 | 293.2 | 0 | 0 | 0 | 0 | |
| Pfc (kW) | 261.19 | 291.81 | 300 | 220.7 | 207 | 221 | 201 | 221 | |
| Pdg (kW) | 297.2 | 370 | 369 | 368 | 54.49 | 135.09 | 39.798 | 121.09 | |
| V800 (p.u.) | 0.9996 | 1.05 | 1.0006 | 1.0114 | 0.9811 | 1.05 | 1.012 | 1.0017 | |
| V848 (p.u.) | 1.0497 | 1.0497 | 1.0036 | 0.9981 | 1.0194 | 0.9801 | 1.0049 | 1.0027 | |
| tVR1 (p.u.) | 0.9445 | 0.9889 | 0.9921 | 0.9651 | 0.9569 | 1.0909 | 0.992 | 0.9941 | |
| tVR2 (p.u.) | 0.9668 | 0.9866 | 0.9455 | 0.9529 | 1.029 | 0.9675 | 0.9912 | 0.9961 | |
| QC1 (kVAr) | 148.51 | 115.09 | 305 | 297 | 104.49 | 305 | 84.5 | 0 | |
| QC2 (kVAr) | 215.5 | 305 | 305 | 268 | 112.5 | 171.5 | 29.9 | 64 | |
| F. cost ($/h) | 178.35453 | 179.75784 | 179.65361 | 179.15631 | 55.54921 | 56.6276 | 56.24219 | 57.42896 | |
| Ploss (kW) | 76.359 | 64.349 | 68.89 | 79.15 | 13.575 | 9.2305 | 13.6689 | 9.6479 | |
| Vol. dev. (p.u.) | 0.72621 | 0.98021 | 0.49215 | 0.61904 | 0.46971 | 0.82321 | 0.09769 | 0.10267 | |
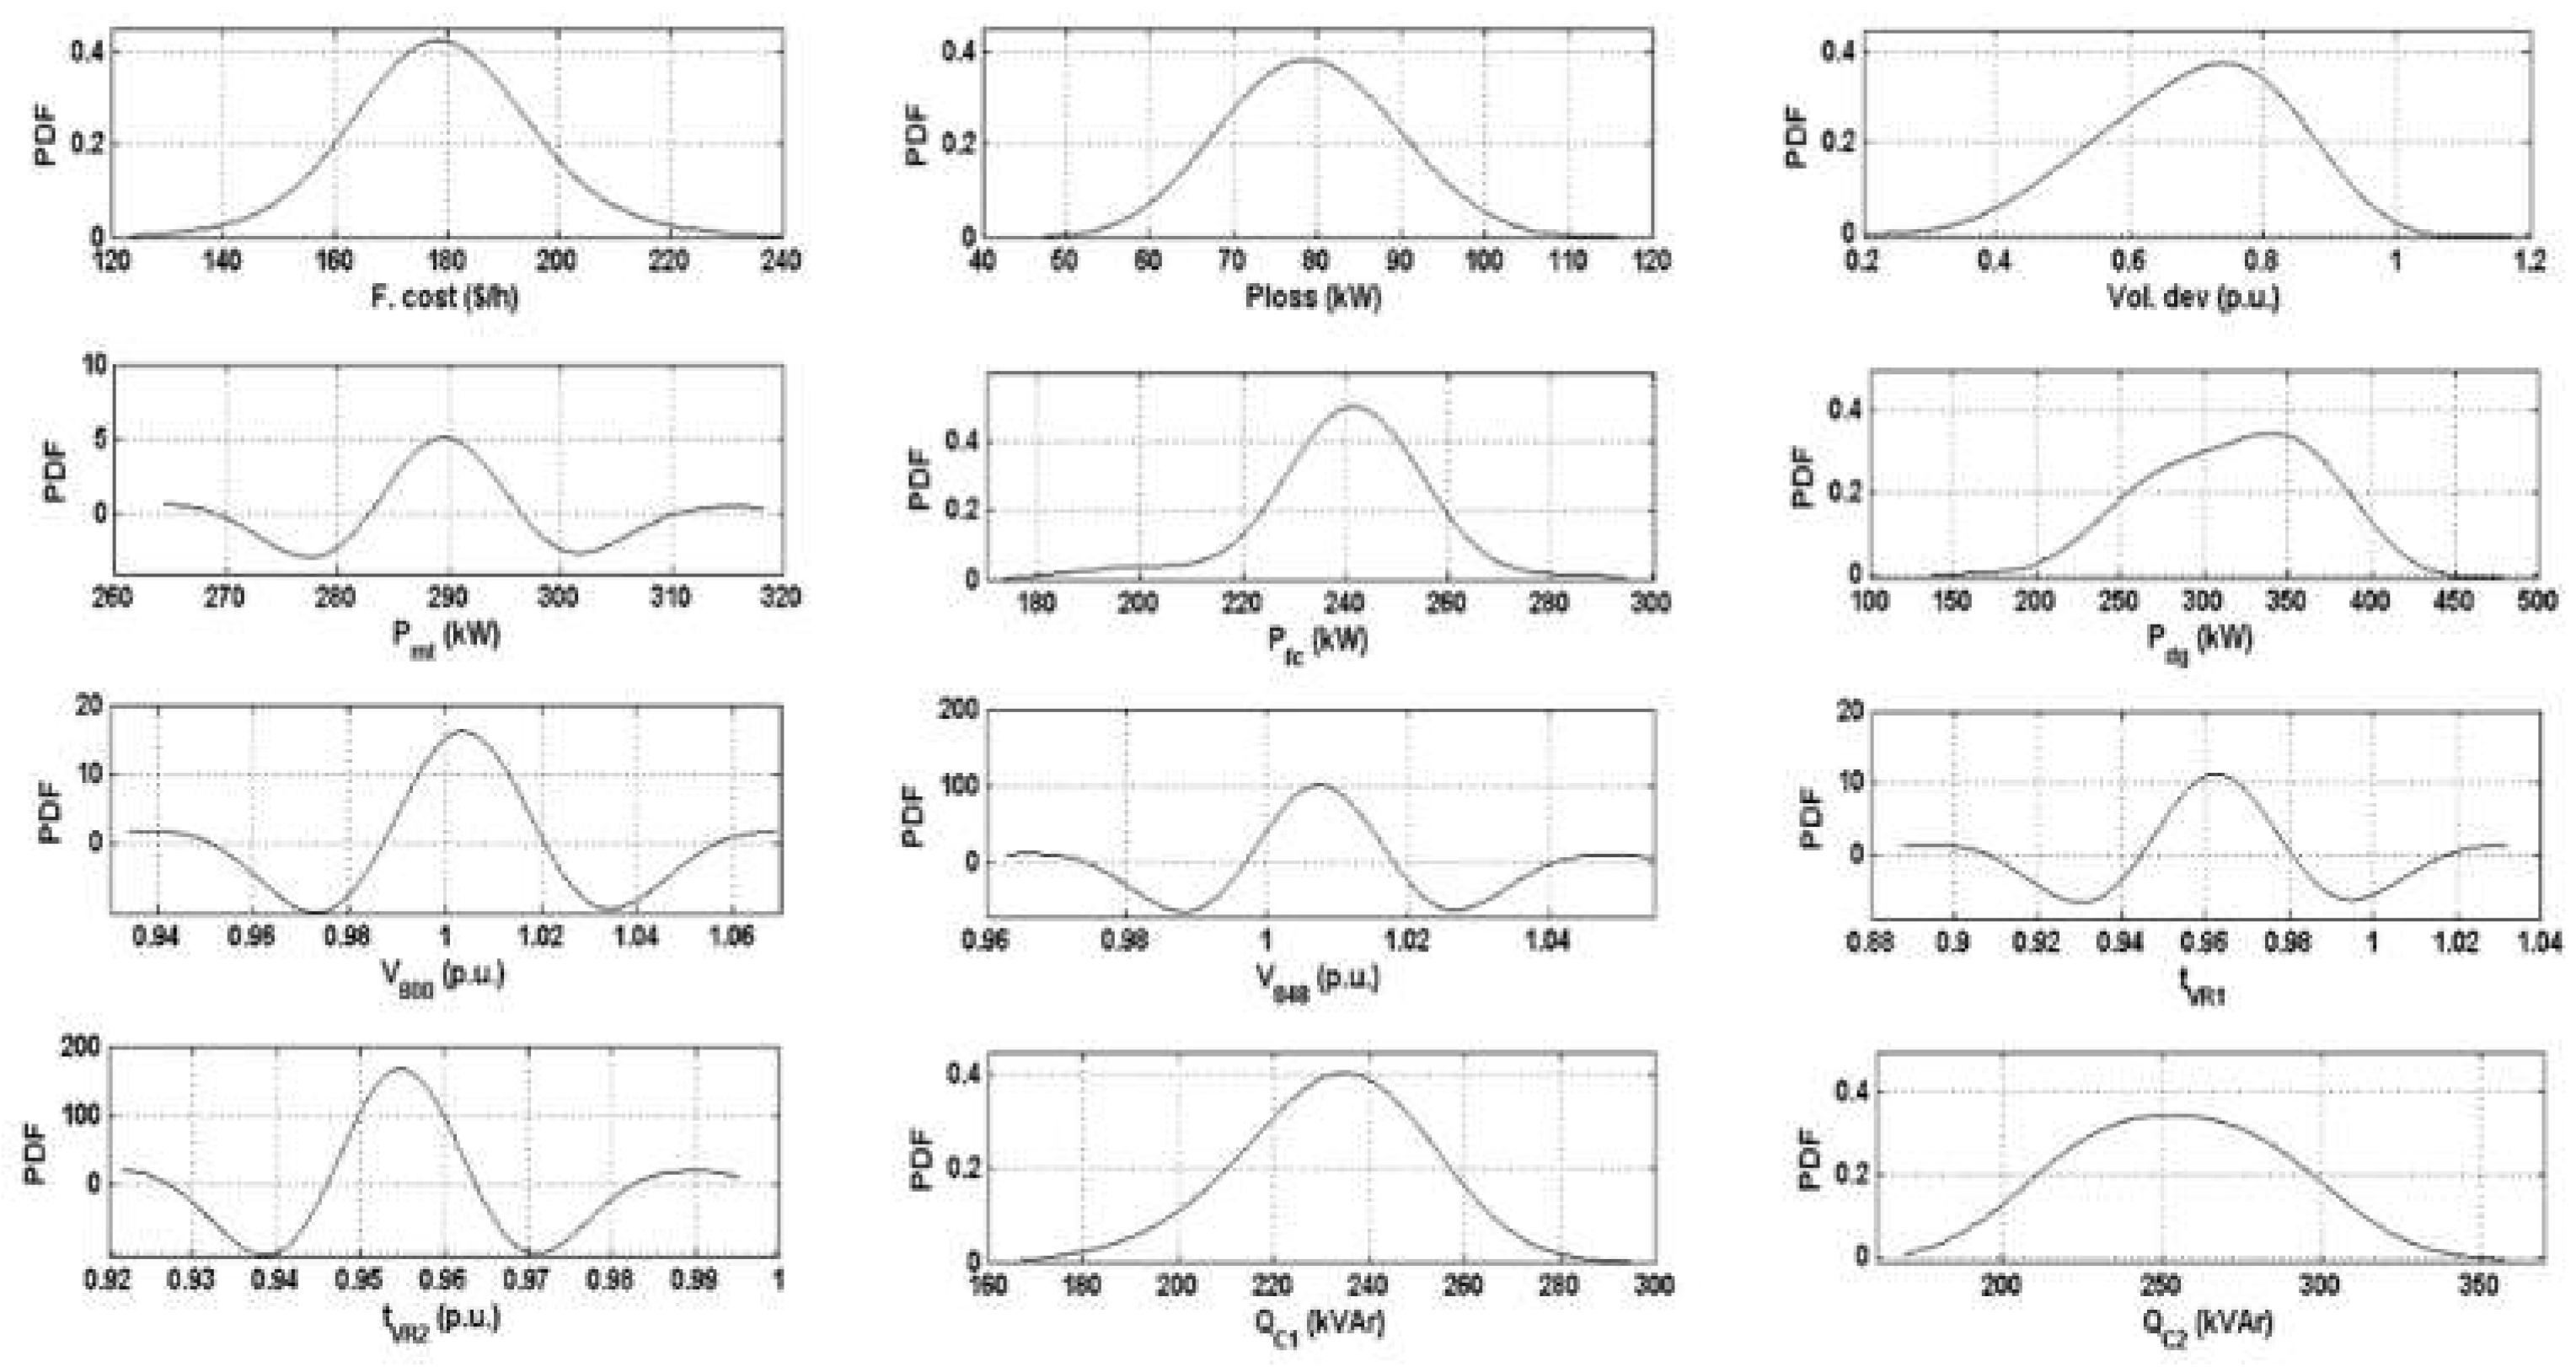
| Time=14 h | Time=8 h | Time=2 h | |||||||
| Case 1 | Case 4 | Case 1 | Case 4 | Case 1 | Case 4 | ||||
| µ | 296.5 | 289.9 | 272.36 | 244.69 | 58.69 | 38.69 | |||
| Pmt (kW) | σ | 4.1997 | 8.779 | 11.57 | 60.49 | 96.11 | 48.82 | ||
| µ | 250.349 | 240.015 | 209.29 | 184.57 | 199.72 | 183.91 | |||
| Pfc (kW) | σ | 19.923 | 17.793 | 20.47 | 47.76 | 16.05 | 20.73 | ||
| µ | 318.875 | 317.653 | 159.49 | 145.57 | 49.24 | 101.56 | |||
| Pdg (kW) | σ | 32.6 | 48.2 | 51.05 | 71.29 | 26.93 | 52.17 | ||
| µ | 1.0082 | 1.0034 | 1.0049 | 0.997 | 0.9941 | 0.9998 | |||
| V800 (p.u.) | σ | 0.027 | 0.0229 | 0.0179 | 0.0116 | 0.0133 | 0.0034 | ||
| µ | 1.0187 | 1.0074 | 1.0067 | 0.999 | 0.998 | 1.0047 | |||
| V848 (p.u.) | σ | 0.0167 | 0.0146 | 0.0164 | 0.0143 | 0.0037 | 0.0089 | ||
| µ | 0.9646 | 0.9622 | 0.9954 | 0.9676 | 1.0093 | 0.9979 | |||
| tVR1 (p.u.) | σ | 0.0274 | 0.0239 | 0.0278 | 0.0144 | 0.0113 | 0.00497 | ||
| µ | 0.9555 | 0.9544 | 0.9697 | 0.9781 | 0.9824 | 0.9953 | |||
| tVR2 (p.u.) | σ | 0.0151 | 0.0118 | 0.01951 | 0.0234 | 0.0117 | 0.0029 | ||
| µ | 197.7 | 231.6 | 216.2 | 196.4 | 247.49 | 178.75 | |||
| QC1 (kVAr) | σ | 81.36 | 20.26 | 33.29 | 30.91 | 53.13 | 70.29 | ||
| µ | 236.79 | 254.21 | 209.91 | 209.89 | 197.26 | 181.51 | |||
| QC2 (kVAr) | σ | 66.17 | 33.08 | 76.42 | 39.36 | 62.27 | 23.19 | ||
| µ | 178.9172 | 179.1982 | 111.9689 | 115.0571 | 55.4712 | 59.2727 | |||
| F. cost ($/h) | σ | 16.5973 | 17.1371 | 9.7496 | 10.6031 | 5.5934 | 5.5939 | ||
| µ | 77.69 | 79.198 | 38.11 | 45.43 | 13.59 | 17.49 | |||
| Ploss (kW) | σ | 9.39 | 10.297 | 4.11 | 12.71 | 2.612 | 4.179 | ||
| µ | 0.7305 | 0.6937 | 0.3606 | 0.329 | 0.556 | 0.0577 | |||
| Vol. dev. (p.u.) | σ | 0.1403 | 0.1372 | 0.0581 | 0.1151 | 0.0524 | 0.0076 | ||

Disclaimer/Publisher’s Note: The statements, opinions and data contained in all publications are solely those of the individual author(s) and contributor(s) and not of MDPI and/or the editor(s). MDPI and/or the editor(s) disclaim responsibility for any injury to people or property resulting from any ideas, methods, instructions or products referred to in the content. |
© 2024 by the authors. Licensee MDPI, Basel, Switzerland. This article is an open access article distributed under the terms and conditions of the Creative Commons Attribution (CC BY) license (http://creativecommons.org/licenses/by/4.0/).


