Preprint
Article

A Transcriptomics Analysis of the Regulation of Lens Fiber Cell Differentiation in the Absence of FGFRs and PTEN

Altmetrics

Downloads

108

Views

79

Comments

0

A peer-reviewed article of this preprint also exists.

Submitted:

25 April 2024

Posted:

26 April 2024

You are already at the latest version

Alerts
Abstract
The addition of 50% vitreous humor to the media bathing lens explants results in the induction of both fiber cell differentiation and a significant immune/inflammatory response. Although Fgfr loss blocks differentiation in lens epithelial explants, this loss is partially rescued by deleting Pten. To investigate the functions of the Fgfrs and Pten during lens fiber cell differentiation, we utilized a lens epithelial explant system and conducted RNA sequencing on vitreous humor-exposed explants lacking Fgfrs, or Pten or both Fgfrs and Pten. We found that Fgfr loss impairs both vitreous-induced differentiation and inflammation while the additional loss of Pten restores these responses. Furthermore, transcriptomic analysis suggested that PDGFR-signaling in FGFR-deficient explants is required to mediate the rescue of vitreous-induced fiber differentiation in explants lacking both Fgfrs and Pten. The blockage of β-crystallin induction in explants lacking both Fgfrs and Pten in the presence of a PDGFR-inhibitor supports this hypothesis. Our findings demonstrate that a wide array of genes associated with fiber cell differentiation are downstream of FGFR-signaling and that the vitreous-induced immune responses also depend on FGFR-signaling. Our data also demonstrates that many of the vitreous-induced gene expression changes Fgfr-deficient explants are rescued in explants lacking both Fgfrs and Pten.
Keywords: 
Subject: Biology and Life Sciences  -   Cell and Developmental Biology

1. Introduction

Multiple lines of evidence demonstrate that lens fiber cell differentiation requires the activation of both ERK and AKT signaling cascades that can be induced by multiple receptor tyrosine kinases (RTKs). Although FGF is the only growth factor capable of independently inducing lens fiber cell differentiation in lens epithelial explants, other RTK-activating growth factors, namely insulin-like growth factor 1 (IGF1), epidermal growth factor (EGF), vascular endothelial growth factor (VEGF), and platelet-derived growth factor (PDGF), contribute to lens development[1,2]. The lens epithelium expresses receptors for all of these growth factors. The mouse lens expresses Fgfr1, Fgfr2[3] and Fgfr3[4] in the lens, with the expression of Fgfr1 and Fgfr3 increasing significantly as fiber cell differentiation commences[5]. In contrast, the platelet derived growth factor receptor alpha (Pdgfra) is restricted to the lens epithelium, with expression levels falling sharply upon fiber cell differentiation[6].
The Overbeek lab created many different lines of transgenic mice that over-expressed RTK ligands in the lens, driven by the αA-crystallin promoter. The ligands included TGFα[7], EGF[8], IGF1[9], VEGF[10], PDGF-A[11] and multiple different FGFs. Of these transgenic mice, only FGFs were capable of inducing a fiber cell differentiation response in the lens epithelium in vivo[12,13,14]. The lens epithelium of transgenic mice overexpressing PDGF-A showed some early features of fiber cell differentiation, namely cell elongation and β-crystallin expression, but these lens cells failed to exit the cell cycle and express characteristics of mature fiber cells. Among the RTKs expressed in the lens epithelium, FGFRs are unique in their interaction with FRS2, a protein that docks with FGFRs and is thought to mediate a sustained activation of ERK1/2[15]. FRS2 also interacts with the TRK family of RTKs. Although TRKC is not normally expressed in lens epithelial cells, transgenic mice expressing Trkc in the lens epithelium undergo fiber cell differentiation in vivo in response to the TRKC ligand, NT-3[16].
Of the RTKs expressed in the lens, only the loss of FGFRs blocks lens fiber cell differentiation in vivo[17]. The loss of Fgfr1, Fgfr2 and Fgfr3 is required to block fiber cell differentiation, but this effect can only be observed if these receptors are removed after the lens vesicle stage, because loss of Fgfr1 and Fgfr2 alone at the lens placode stage causes such severe apoptosis that the lens degenerates prior to fiber cell formation[17,18]. Given the substantial increase in lens apoptosis caused by FGFR loss[5,17,18], we sought to determine if the loss of PTEN, known to be involved in signals promoting cell death[19], might counteract the apoptotic signals in FGFR-deficient lens cells. These experiments showed that the loss of Pten, although not eliminating apoptosis completely, substantially rescued it in Fgfr2-deficient lens cells[20]. The antagonistic relationship of FGFR-signaling and PTEN was also demonstrated in osteoprogenitor cells[21], and in the skin where the loss of Fgfr2 could block skin tumor formation in Pten-deficient keratocytes[22,23].
To investigate the relationship of FGFR-signaling and PTEN during lens fiber cell differentiation we adopted the use of the lens epithelial explant system. This system permits easy manipulation of culture conditions to study the regulation of fiber cell differentiation in vitro[1,24,25,26]. Using this system, we were able to employ adenoviral vectors to delete Fgfrs and/or Pten in the postnatal lens epithelium, thus avoiding their deletion at the earlier (embryonic) stages where FGFR-signaling is essential for lens epithelial cell survival. These experiments demonstrated that the loss of Fgfrs blocked the ability of vitreous humor to differentiate lens epithelial cells in vitro, as measured by cellular elongation, the accumulation of MIP and β- and γ-crystallins. However, the additional deletion of Pten in conjunction with Fgfr-loss restored the ability of vitreous humor to induce lens fiber cell differentiation[25]. Therefore, PTEN normally blocks the ability of non-Fgfr RTKs from inducing lens fiber cell differentiation.
We recently applied transcriptomic analysis to vitreous-induced lens fiber cell differentiation in wildtype lens epithelial explants from FVB strain mice[24]. Our analysis confirmed that the addition of vitreous humor resulted in the upregulation of many genes associated with lens fiber cell differentiation and a downregulation of many genes associated with lens epithelial cells. We also discovered that the addition of vitreous humor induces the expression of many genes associated with inflammation and epithelial to mesenchymal transition (EMT). However, the global changes underlying the deletion of Fgfrs and/or Pten in the vitreous-induced fiber differentiation in the lens epithelial explant system have never been addressed. Therefore, our purpose here is to provide a comprehensive transcriptomics view, rather than selective examination of a few differentiation markers, of vitreous humor-induced lens fiber cell differentiation and inflammation in the absence of Fgfrs or Pten or both Fgfrs and Pten.
Our analysis demonstrates that the loss of FGFR-signaling profoundly inhibits the ability of vitreous humor to induce fiber cell differentiation. Further, it reduces the expression of genes involved in the inflammatory response. We also found that, consistent with our previous report[25], the exposure of vitreous induced an improved differentiation response in explants lacking both Fgfrs and Pten than in explants lacking only Fgfrs. Thus, concomitant loss of Pten can rescue lens fiber differentiation defects resulting from loss of Fgfrs. Likewise, we found that the loss of Pten in Fgfr-deficient explants partially restored the vitreous induced inflammatory response and resulted in an EMT response even higher than that seen in wildtype explants. Bioinformatic analysis of the gene expression changes, induced by vitreous humor exposure, in explants lacking only Fgfrs or explants lacking both Fgfrs and Pten suggested the involvement of PDGFR-signaling in the restoration of differentiation in the explants deficient in both Fgfrs and Pten, thus identifying a mechanistic insight into the molecular basis of the rescue.

2. Materials and Methods

2.1. Animals

All procedures were approved by the Miami University Institutional Animal Care and Use Committee and complied with the ARVO Statement for the Use of Animals in Research, consistent with those published by the Institute for Laboratory Animal Research (Guide for the Care and Use of Laboratory Animals). FVB mice were euthanized at postnatal day 8 (P8) by CO2 asphyxiation followed by cervical dislocation.

2.2. Lens Epithelial Explant Generation and Culture

Lens epithelial explants were established from 8-day-old (P8) mouse pups from four different genotypes. These were: wild type FVB/N strain control (FVB), Fgfr1L/LFgfr2L/LFgfr3−/− (TKO), Fgfr1L/LFgfr2L/LFgfr3−/−/PtenL/L (QKO), and PtenL/L (PTEN), where the superscript “L” refers to a LoxP-flanked allele and superscript “-” refers to a null allele. Lens epithelial explants were established as previously described [24,25,26,27]. Briefly, lenses were removed from the eye and placed into a 35mm culture dish with pre-calibrated (37 °C and 5% CO2) M-199 media supplemented with 1% antibiotic-antimycotic solution (ThermoFisher Scientific cat. 15240062) and 0.1% bovine serum albumin (Sigma-Aldrich cat. A7906) henceforth referred to as “culture medium (CM)”. The lens capsule was torn at the posterior pole prior to removing the fiber cell mass. The remaining lens capsule with adherent epithelium was pinned flat to the base of the culture dish. Immediately after explant establishment (6 explants per dish), recombinant Cre/GFP adenoviral vectors (Ad-GFP-2A-iCre, Vector BioLabs 1772 at 1 ​× ​106 ​PFU per dish) were added to the TKO, QKO and PTEN explants to mediate gene deletion. Adenoviral transduction was evaluated after 24 ​hr by the appearance of GFP expression.
Fresh bovine vitreous humor (courtesy of Kaiser Meat Market, Cedar Grove, IN) was collected as previously described[28] and stored at -20 ⁰C. One day (24 hr) after the establishment of explants in CM, the medium was changed to vitreous humor, diluted 50% (v/v) with culture media, henceforth referred to as “differentiation medium” (DM). Following the addition of DM, explants were collected after 1, 5, or 10 days of culture.

2.3. RNA-seq Library Preparation and Sequencing

RNA-seq analyses were carried out for each condition with three biological replicates. Each replicate consisted of 12 explants. Explants were collected in 1.5 ml Eppendorf tubes. Total RNA was extracted using the RNEasy Mini Kit (Qiagen cat. 74104) following the manufacturer’s instructions. The RNA Integrity Number (RIN) was determined using an Agilent 2100 Bioanalyzer and samples with RIN >7 were used for sequencing. Samples ranged from 400 ng to 1 µg of total RNA. RNA libraries were constructed by Novogene (Sacramento, CA, USA) using a TruSeq (Illumina) library prep kit. The library was sequenced on the Illumina NovaSeq sequencer platform. Sequences consisted of paired-end reads to a minimum depth of 26 million reads per sample.

2.4. RNA seq Data Analysis

Raw reads were quality-analyzed using FastQC (Babraham Bioinformatics- FastQC A Quality Control tool for High Throughput Sequence Data)[29] (Babraham Bioinformatics-FastQC A Quality Control Tool for High Throughput Sequence Data. Available online: https://www.bioinformatics.babraham.ac.uk/projects/fastqc ) and MultiQC [30]. Low-quality bases and adapters were trimmed using Cutadapt 3.4 [31] and Trim Galore 0.6.5-1 with the parameters -q 20 --phred33 --length 20 Babraham Bioinformatics-Trim Galore! Available online: https://www.bioinformatics.babraham.ac.uk/projects/trim_galore. Mouse genome GRCm39 version: M27 was indexed using Hisat2 (2.1.0-4)[32], incorporating splice junctions from Gencode GTF gencode.vM27.annotation.gtf file[33]. Gene counts were generated using Stringtie 2.1.5 [34], and gencode GTF annotation gencode.vM27.annotation.gtf. Differential expression testing was performed with DESeq2[35]. Differentially expressed genes (DEGs) are defined throughout by an adj. p-value ≤ 0.005, and log2 fold change (LFC) ≥ 1.5 criteria were applied. In these cases, the p-value was adjusted using Benjamin-Hochberg correction individually for each pairwise comparison made. The sequence data for FVB explant at D1 and D5 was taken from GEO Series accession number GSE215953.

2.5. Clustering of DEGs

Clustering of DEGs was performed with K-means clustering using normalized RNA-seq counts[36]. Specifically, the kmeans function (part of the “stats” package in R) was used with the Hartigan-Wong algorithm[37]. Pathway enrichment analysis was performed with metascape[38]. All individual clusters obtained from K-mean clustering were used for GO term analysis. This analysis resulted in p-values associated with each cluster for each identified GO term, facilitating consideration of biological functions associated with each cluster. All figures were generated in the R environment.

2.6. Gene Set Enrichment Analysis (GSEA) and Protein Protein Interaction

Gene set enrichment analysis (GSEA) was performed on the normalized count matrix obtained from DESeq2, and murine genes were converted to human orthologs [39,40]. GSEA was performed using 1000 permutations and gene set permutations with gene set size filters: min = 15 and max = 500. Hallmark gene set and Reactome C2 gene set were used for analysis.
The online STRING database (version 12.0) was used for generation of protein interaction for the selected gene sets[41]. Following parameters were used for visualization network type = Full STRING network, Meaning of network edge = Confidence, Active interaction source = All selected, Minimum required interaction score = medium confidence (0.400).

2.7. Lens Explant Immunofluorescence

For cytoskeletal actin visualization, explants were fixed in 4% paraformaldehyde for 5 ​min before 3 washes in PBS and 3 washes for 5 ​min each in 0.1% PBST, followed by incubation with Alexa Fluor 488 conjugated phalloidin (ThermoFisher Scientific 12379) for 20 ​min at room temperature. For β-crystallin immunofluorescence, explants were fixed in methanol for 1 ​min and permeabilized before PBS washes and blocked in 10% normal goat serum in PBS at 37 ​°C for 30 ​min. Primary antibodies included: rabbit polyclonal anti β-crystallin (gifts from Samuel Zigler, Johns Hopkins University School of Medicine, Baltimore, MD, USA). Anti β-crystallin antibody was used at a 1:100 dilution and incubated at 4 ​°C overnight in 10% normal goat serum in 0.1% PBST. Primary antibodies were detected using fluorescent secondary antibodies (goat anti-mouse Alexa Fluor 594 or goat anti-rabbit Alexa Fluor 488, ThermoFisher Scientific A21125 and A1108). Slides were counterstained with DAPI (H-1200, Vector Labs). Fluorescent images were captured using the Zeiss 710 Laser Scanning Confocal System at the Center for Advanced Microscopy and Imaging at Miami University.
For inhibitor treatment, explants were pre-treated for two hours with either 25μM of the selective PI3K inhibitor LY294002 (Selleckchem S1105), 50μM of the selective MEK1/2 inhibitor U0126 (Selleckchem S1102), or 20 μM AG1296 of the selective PDGFR inhibitor and 5μm AG1024 (Selleckchem S1234) of IGF-1 inhibitor and remained present with the differentiation media for the duration of the culture period.

3. Results

3.1. Overall Transcriptomic Changes in Lens Epithelial Explants Correlated Both to Genotype and Duration of Exposure to Vitreous Humor

A comprehensive RNA-seq analysis was undertaken on lens epithelial explants from multiple genotypes: wild type (FVB), those lacking Fgfrs (TKO), those lacking Pten (PTEN) and those lacking both Fgfrs and Pten (QKO) at several different time points. These were (A) 24 hrs after the addition of DM, containing vitreous humor (D1), (B) 5 days after the addition of DM (D5) and 10 days after the addition of DM (D10) (Figure 1A). The D1 and D5 time points correspond to the induction of differentiation and the onset of differentiation gene expression (corresponding to our previous paper describing vitreous induced differentiation in FVB/N explants[24]) and D10 corresponds to late differentiation phase. The resultant data, consisting of approximately 26 million sequence reads per biological replicate, was represented by three-dimensional principal component analysis (3D-PCA) (Figure 1B). The first three components PC1, PC2 and PC3 were plotted as X, Y and Z axes to observe the major components shaping each dataset with three replicates per genotype and treatment. The replicates within each genotype and treatment consistently clustered together underscoring a high concordance between biological replicates. The overall similarity of the biological replicates and the effect of treatments was also visualized by a distance matrix heatmap of the RNA-seq data (Figure S1). The relative closeness of gene expression among the replicates within various treatment groups suggests that data were overall of robust quality.

3.2. Loss of Fgfrs, Pten or Both Fgfrs and Pten Induced Different Patterns of Differential Gene Expression Following Vitreous Exposure

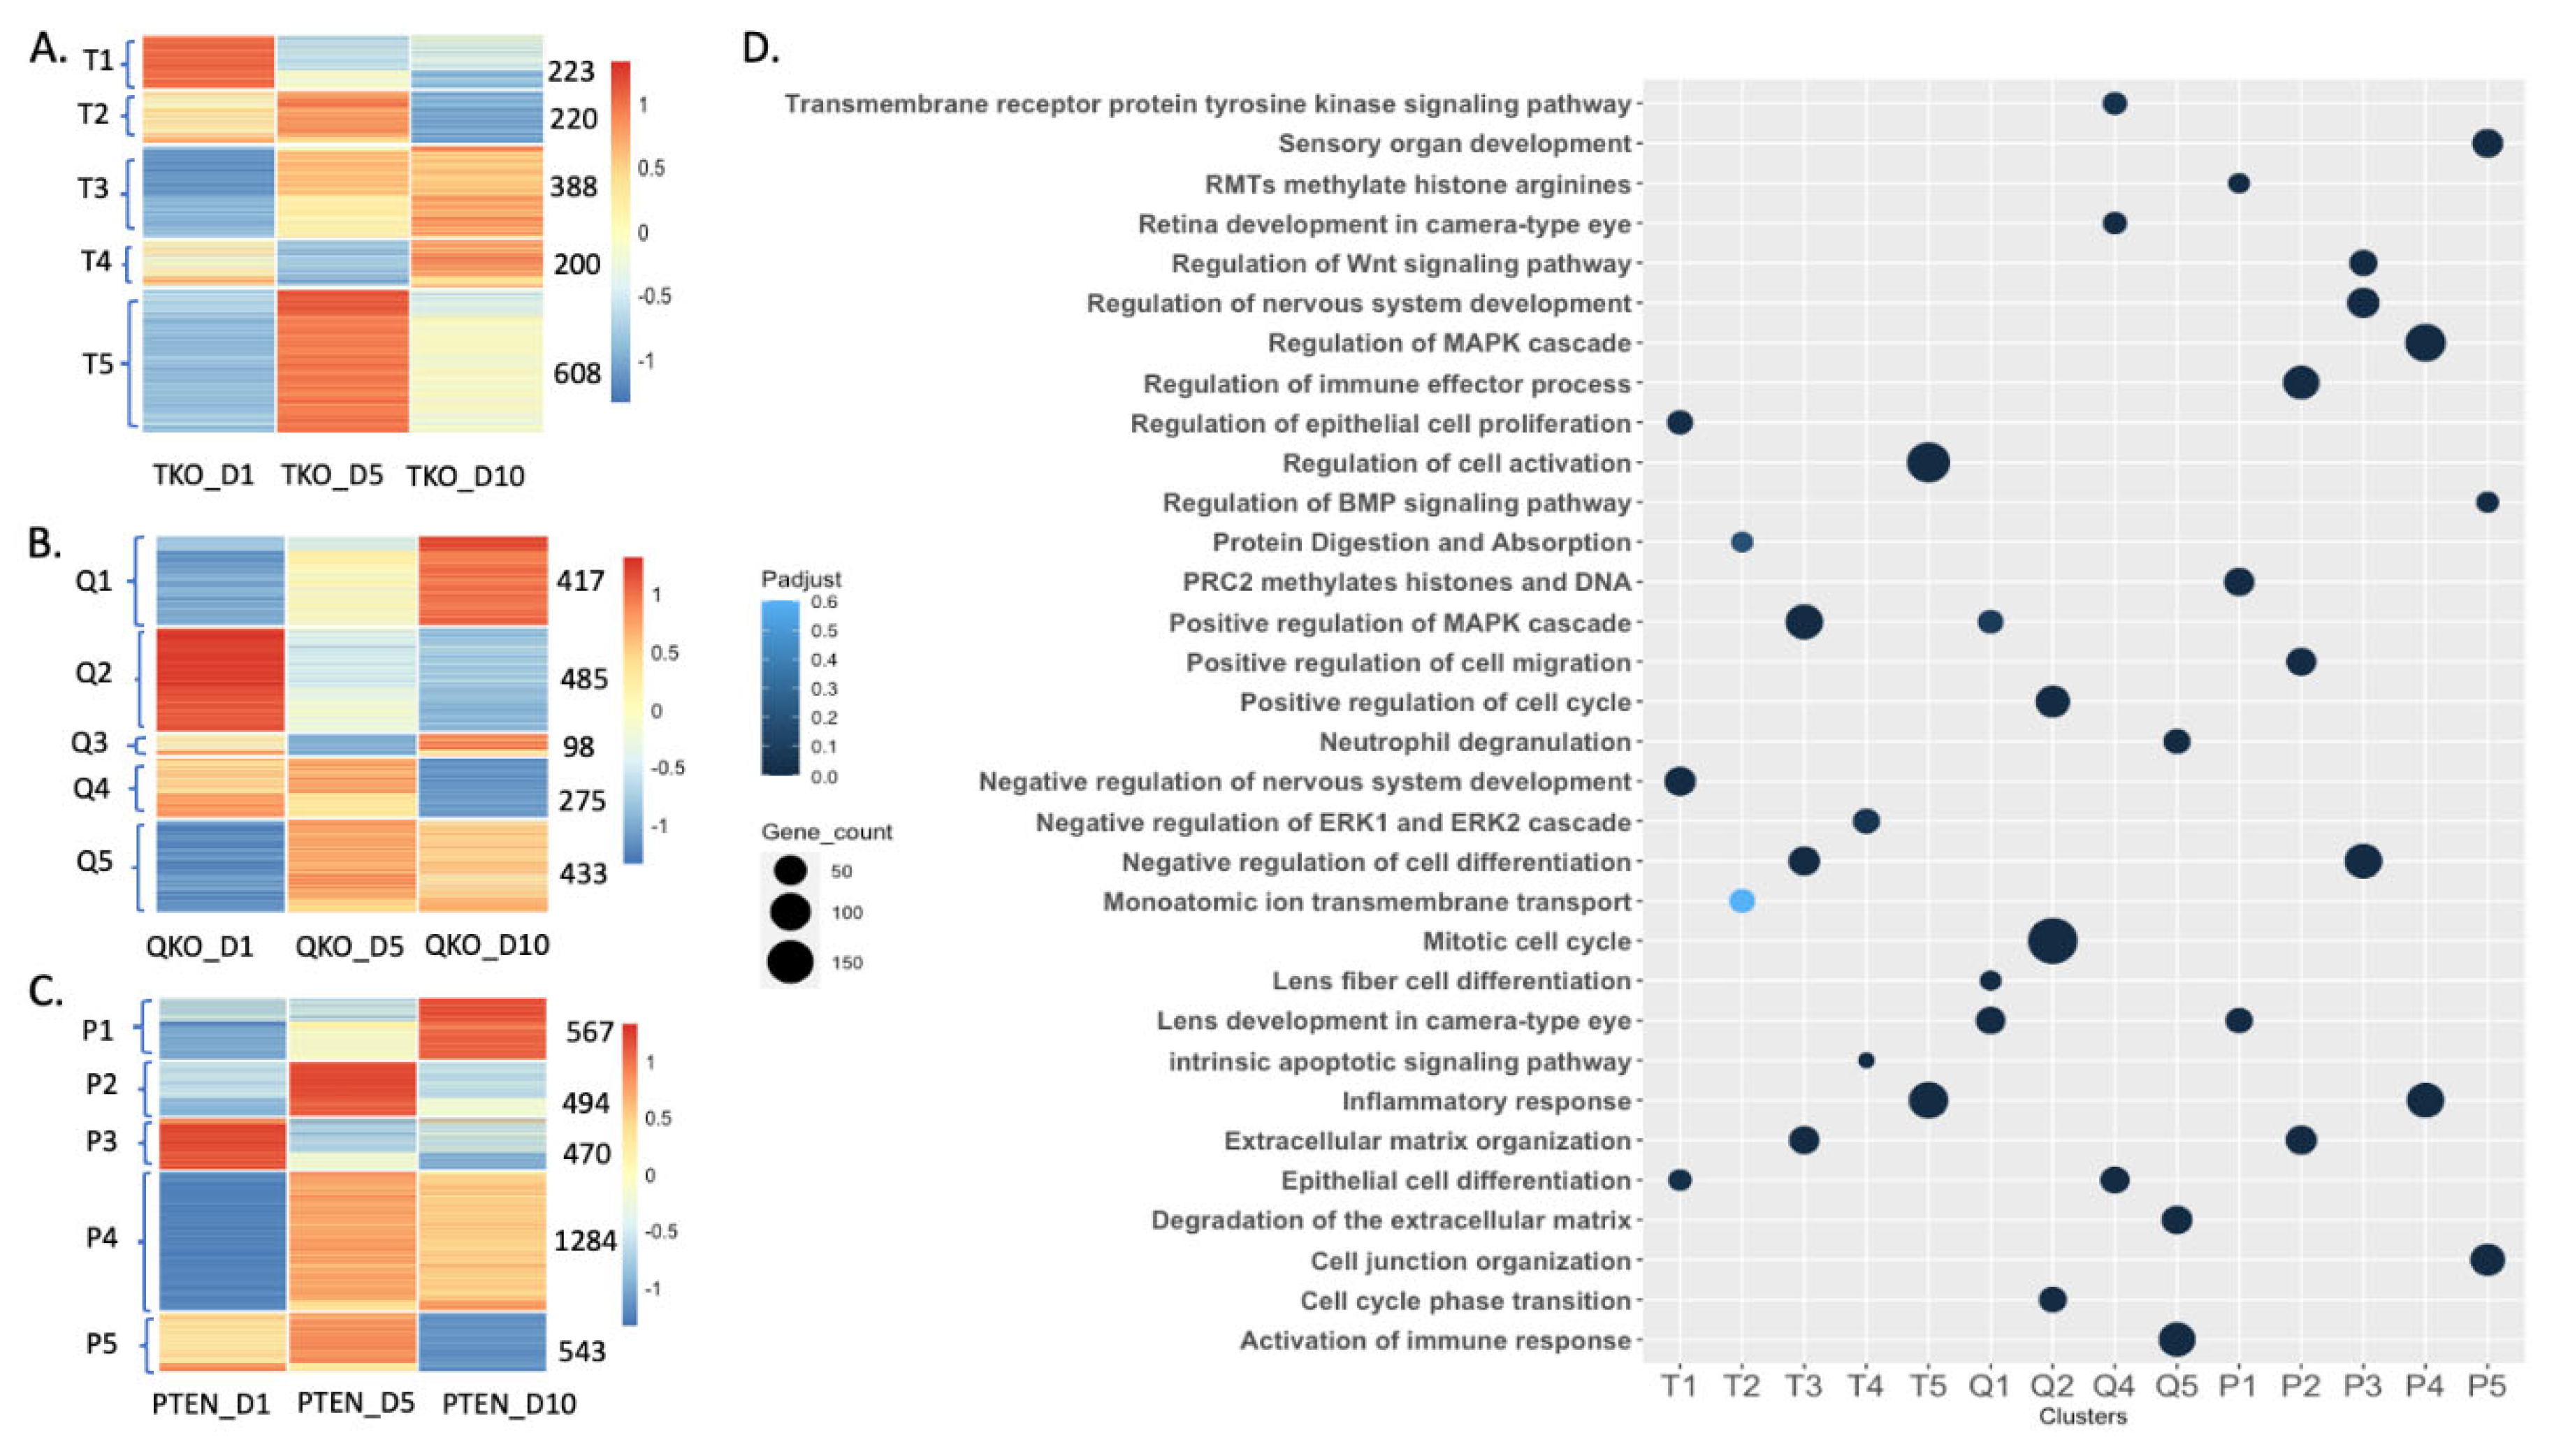
To visualize patterns of differential gene expression within each genotype based on different stages in fiber differentiation (as determined by the time since initiation of incubation in DM), we performed K-means clustering using a series of pairwise comparisons: Day 1 vs Day 5, Day 5 vs Day 10 and Day 1 vs Day 10 for TKO, QKO and PTEN, respectively. All the non-redundant differentially expressed genes (DEGs) with log2fold change ≥ 1.5 and p-adjust value ≤ 0.005 were analyzed using this approach to distinguish five patterns of gene expression within each genotype (Figure 2).
The K-means clustering of DEGs for explants lacking Fgfrs (TKO) revealed 5 clusters for a total of 1,639 DEGs (Figure 2A). Selected gene ontology (GO) terms for each cluster are shown in a bubble plot (Figure 2D) with a full list of GO terms associated with each cluster (T1-T5) in Tables S1-S5. On day 1, the genes in cluster T1 exhibited their peak level of expression. T1 consists of 223 genes that are enriched for GO terms including “Epithelial cell differentiation” (exemplified by Atf4, Bmp2, Cdh1). The genes in cluster T3 exhibited their lowest level of expression on day 1. T3 consists of 388 genes that are enriched for the GO terms ``Extracellular matrix organization” (exemplified by Bfsp1, Col12a1, Mmp12), “Regulation of Phosphatidylinositol 3-kinase/protein Kinase B signal transduction” (exemplified by Gas6, Ptk2b, Serpine2), and “Positive regulation of MAPK cascade” (exemplified by Igf1, Pdgfb, Pdgfc). On day 5, the genes represented by cluster T5 reached their expression peak. T5 consists of 608 genes that are enriched for GO terms including “Regulation of Inflammatory response” (exemplified by Alox5, C3, Csfr1) and “Positive regulation of immune response” (exemplified by Bkt, Fcgr3, Tlr7). The genes in cluster T4 exhibited their lowest expression level on day 5. T4 consists of 200 genes that are enriched for GO terms including “Apoptotic signaling pathway” (exemplified by Bdkrb2, Cdkn1a, Trib3). In contrast, genes in clusters T3 and T5 reached their expression peak on day 10 while genes in cluster T2 fell to their lowest expression level on day 10. T2 consists of 220 genes that are enriched for GO terms including “Protein digestion and Absorption” (exemplified by Egfl6, Fxyd2, Prss1), “Monoatomic ion transmembrane transport”(exemplified by Abcc3, Cacna1e, Muc5ac). This suggests that in the absence of FGFR-signaling, the lens epithelial explants reach a peak inflammatory response at D5 and undergo peak PI3-kinase and MAPK signaling responses at D10. However, we do not see the induction of gene-expression changes specific for lens fiber cell differentiation.
Similarly, clustering of DEGs for QKO revealed five clusters of DEGs for a total of 1,708 genes (Figure 2B). Selected GO terms for different clusters are shown in Figure 2D with a full list of GO terms associated with each cluster (Q1-Q5) in Tables S6-S10. On day 1, the genes in cluster Q2 reached their highest level of expression. Cluster Q2 consists of 485 genes enriched for GO terms including “Mitotic cell cycle” (exemplified by Bard1, Cdk1, Mcm2,), and “Positive regulation of cell cycle” (exemplified by Aurka, Bric5, E2f7). The genes in clusters Q1 and Q5 exhibited their lowest level of expression on day 1. Cluster Q1 consists of 417 genes enriched for GO terms including “Lens development in camera-type eye” (exemplified by Cryba1, Gja3, Mip), “Lens fiber cell differentiation” (exemplified by Bfsp1, Tdrd7, Tmod1), and “Positive regulation of MAPK cascade” (exemplified by Adra2a, Cd84, Fzd10). Cluster Q5 consists of 433 genes enriched in GO terms including “Activation of immune response” (exemplified by Casp1, C3ar1, Mef2c), “Degradation of extracellular matrix” (exemplified by Bcan, Col2a1, Eln), and “Neutrophil degranulation” (exemplified by Arg1, Cd33, Dock2). On day 5, genes in cluster Q5 reached their peak level of expression while genes in cluster Q3 exhibited their lowest expression level. Cluster Q3 consists of only 98 genes with no interesting GO term. Genes in clusters Q1 and Q3 exhibited their highest level of expression on day 10, while genes in clusters Q4 and Q2 exhibited their lowest level of expression on that day. Cluster Q4 consists of 275 genes enriched for GO terms including “Transmembrane receptor protein tyrosine signaling pathway” (exemplified by Efs, Flt4, Ret), “Retina development in camera type eye” (exemplified by Neurod4, Otx2, Vsx2), and “Epithelial cell differentiation” (exemplified by Dll1, Krt14, Neurod1). Overall, the QKO explants exhibit responses to DM expected in wildtype explants. Namely, and initial burst of proliferation (D1) with the maximal expression of genes related to fiber cell differentiation on D10.
Clustering of DEGs for PTEN revealed five clusters for a total of 3,358 genes (Figure 2C). Representative GO terms for different clusters are shown in Figure 2D with a full list of GO terms associated with each cluster (P1-P5) in Tables S11-S15. On day 1, the genes in cluster P3 reached their peak expression level. Cluster P3 consists of 470 genes enriched in GO terms including “Negative regulation of cell differentiation” (exemplified by Btg2, Cdh1, Map2), “Regulation of nervous system development” (exemplified by Dkk1, Map2, Mme), and “Regulation of Wnt signaling pathway” (exemplified by Folr1, Nog, Wnt6). In contrast, genes in clusters P1, P2 and P4 exhibited their lowest level of expression on day 1. Cluster P1 contains 567 genes that are associated with GO terms including” Lens development in camera-type eyes” (exemplified by Crybb3, Crygs, Lim2), and “PRC2 methylates histone and DNA” (exemplified by H2bc4, Shc2, Timeless). Cluster P2 contains 494 genes and is enriched for GO terms including “Extracellular matrix organization” (exemplified by Col11a1, Mmp10, Nr2e1), “Positive regulation of cell migration” (exemplified by Cxcr4, Nrp1, Pdgfd), and “Regulation of immune effector processes” (exemplified by Btk, Casp1, Cd84). Cluster P4 consists of 1284 genes that are enriched for GO terms including “Inflammatory response” (exemplified by Adora2, Ccr1, Fcgr3), and “Regulation of MAPK cascade” (exemplified by Cav2, Fn1, Fzd7). On day 5, genes in clusters P2, P4 and P5 reached their peak expression level. Cluster P5 consists of 543 genes that are associated with GO terms including “cell junction organization” (exemplified by Cacnb2, Cdh5, Wnt11), “Regulation of BMP signaling pathway” (exemplified by Bmp4, Cav1, Shisa2), and “Sensory organ development” (exemplified by Crx, Rax, Otx1). While genes in cluster P5 peaked at day 5, these genes reached their lowest level of expression on day 10. Day 10 also experienced a peak of gene expression in cluster P1. Overall, in the PTEN explants, there is an initial suppression of MAPK signaling and inhibition of differentiation at D1, followed by a peak of extracellular matrix organization, cell migration and immune response at D5 and a strong fiber cell differentiation response at D10.

3.3. Fgfrs and Pten Influence Gene Expression in Opposite Directions with Respect to Fiber Cell Differentiation and Chromatin Remodeling Following DM Exposure

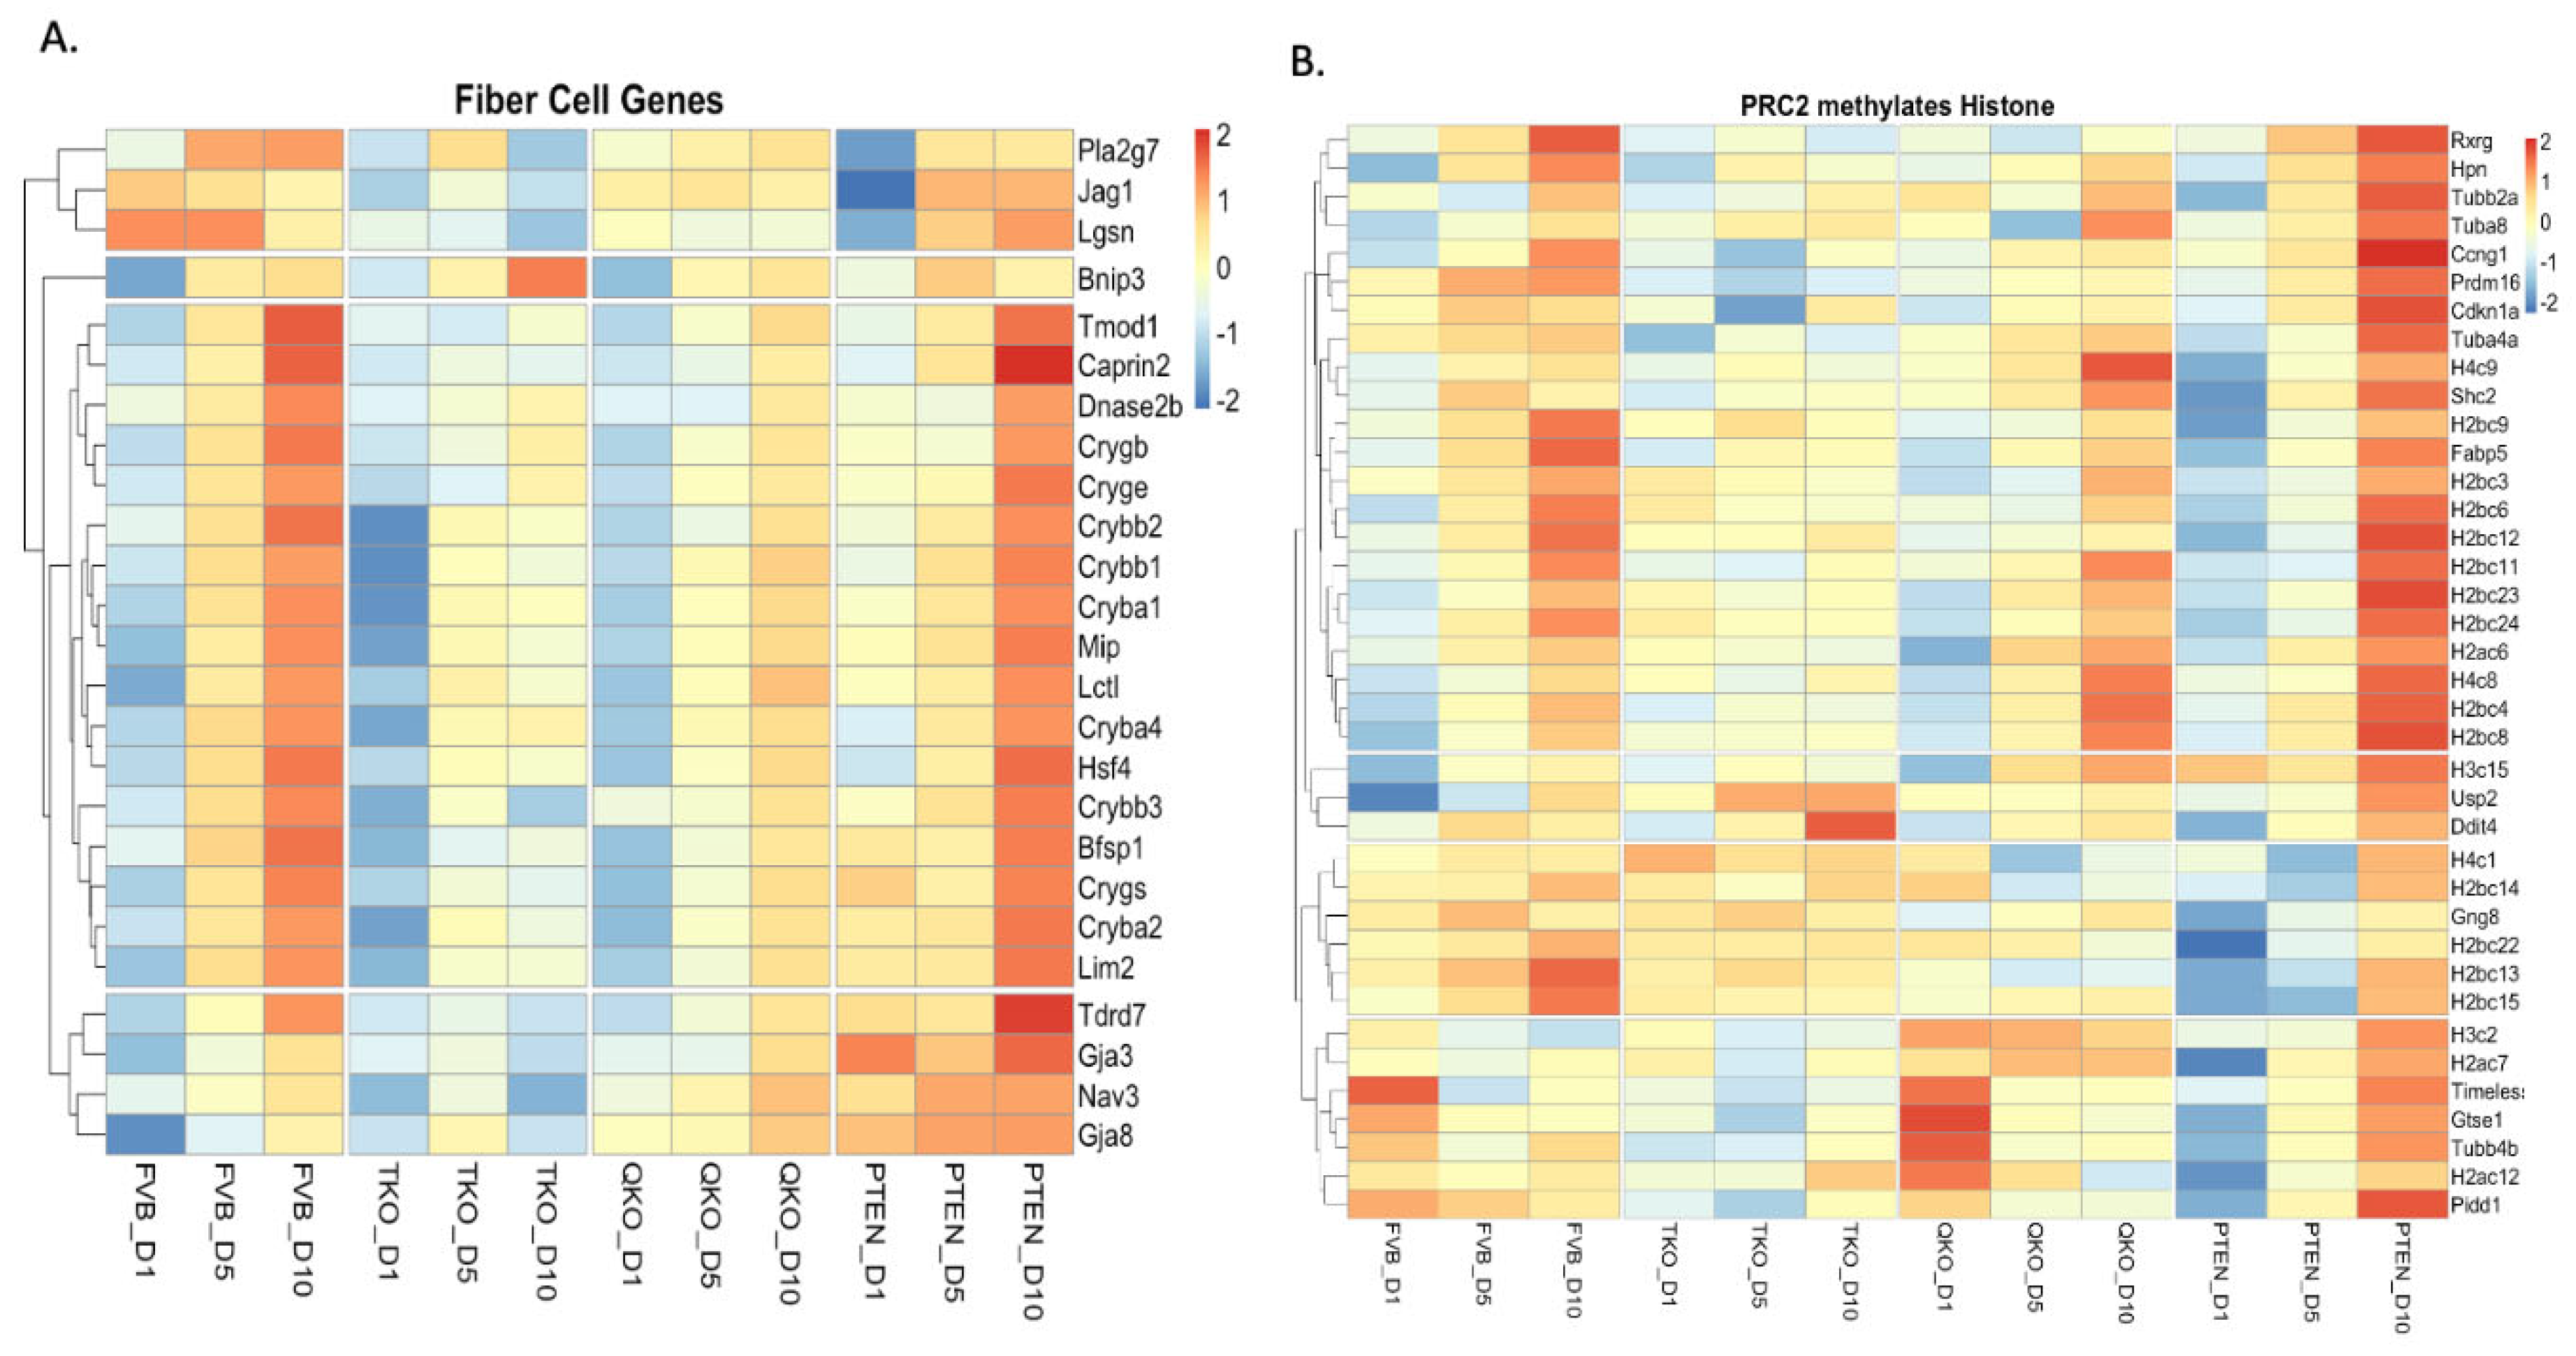
The lens epithelial explants system was originally developed to study lens fiber cell differentiation in vitro. To evaluate how the loss of FGFRs affect vitreous-induced lens fiber cell differentiation, we compared the expression of 25 genes (based on genes differentially expressed at a higher level in lens fiber cells than in lens epithelial cells[42,43]) characteristic of fiber cells in explants of each genotype over the 10-day culture period (Figure 3A). These genes encoded: nine crystallins, two gap junction proteins, major lens membrane proteins (MIP and LIM2), the transcription factor HSF4, and proteins involved in organelle degradation (DNASE2B and BNIP3) and other candidates. Nearly all of the 25 genes exhibit a progressive increase in gene expression in the control FVB explants following the addition of the vitreous containing DM media. This was true for all of the crystallins, Hsf4, Mip, Dnase2b, Lim2 and Bnip3. The loss of Fgfrs in the TKO samples dampened the expression of these genes considerably. Of particular note, is the dramatic loss of expression for Gja8, Gja3, Nav3, Crybb3, Lgsn, Jag1 and Pla2g7 10 days following DM addition. The expression of nearly all of these genes increased in the QKO samples relative to the TKO samples. In fact, the additional loss of Pten (in the QKO samples relative to the TKO samples) led to a level of expression of these fiber cell genes in DM-induced samples at day 10 to approximately the level seen in the control FVB explants on day 5.
This analysis reinforces the notion that PTEN counterbalances FGFR signaling during lens fiber cell differentiation. These data shows the loss of PTEN in explants lacking FGFRs is sufficient to rescue aspects of gene expression associated with a fiber cell differentiation response, which only increases with time in DM culture. Consistent with this idea, the loss of Pten alone led to an enhanced differentiation response in explants following DM exposure (as measured by fiber gene expression). This is particularly notable at day 1 where all other genotypes exhibited a relatively low level of expression for the majority of the fiber cell genes. An exception to this pattern were the levels of expression of Pla2g7, Slc2a3, Jag1 and Lgsn that were expressed at low levels at day one but increased during days 5 and 10. In all genotypes, with the exception of the TKO, the expression of the majority of the fiber cell genes was most robust at day 10 following DM exposure, suggesting that the differentiation response in culture is progressive.
The response to DM of lens epithelial explants, with respect to the expression of genes characteristic of lens epithelial cells [24], was also analyzed across the different genotypes (Figure S2). These genes were divided into three groups, group I (4 genes), group II (6 genes), and group III (10 genes), based on differential responses to DM. The genes in group I (Mki67, Cdk1, Notch4 and Flt1) were notable for their low expression at day 1 in the Pten knockout explants. The expression of all these genes, with the exception of Notch4, increased subsequent to this timepoint in the PTEN samples. The genes in group II (Kdr, Dll4, Rgs6, Dll1, Sulf1 and Gja1) were generally expressed at a higher level in the TKO explants at all timepoints (consistent with these explants being refractory to DM-induced differentiation) and the expression of these genes fell dramatically in the PTEN explants at day 10 (consistent with a very strong DM-induced differentiation response). The genes in group III (e.g., Foxe3, Cdh1, etc.) were expressed at a low level in the FVB explants irrespective of time, suggesting the DM exposure induced the wild type explants to lose epithelial gene expression from initial stages. In contrast, group III genes exhibited the highest expression level at day 1 in the PTEN explants. The PTEN explants exhibited a subsequent sharp reduction in the expression of the group III genes, with the exception of Foxe3 and Pdgfra where the expression remained moderately high on days 5 and 10. Group III genes maintain a moderate expression level in both the TKO and QKO explants throughout DM exposure. Interestingly, the genes Mme, Foxe3 and Pdgfra exhibit a dramatic expression decline at day 10 in TKO explants. Overall, the absence of Fgfrs helped epithelial cells to maintain the expression of genes consistent with lens epithelial identity. However, the loss of Foxe3 and Pdgfra might also suggest a progressive loss of lens cell identity in DM when Fgfrs are deleted.
Recently, a single nucleus (sn)-multiomics analysis of the developing chick lens suggested that the PRC2 complex may play an important role in lens fiber cell differentiation[44]. Gene ontology analysis on cluster 1 (P1) from the PTEN explants suggested a possible link between PTEN and genes associated with PRC2. Therefore, we surveyed all of the genes identified by the gene ontology program Metascape using the GO term PRC2 methylates histone. We analyzed the expression of all these 38 genes across all explant genotypes (FVB, TKO, QKO and PTEN) for all timepoints (Figure 3B). Thirty eight of the seventy-nine genes associated with this term (approximately 50%) were differentially expressed in the PTEN explants. In general, the expression of these genes was low across genotypes on day 1, with the expression being slightly more elevated in the TKO explants and markedly more depressed in the PTEN explants. Exceptions to this pattern were (Timeless, Gtse1, Tubb4b, H2ac12, and Pidd1) where the expression on day 1 was high in FVB, and QKO genotypes but low in the TKO genotype and very low in the PTEN genotype on day 1. The majority of these genes increased in expression with DM exposure, peaking on day 10 in the FVB, QKO and PTEN genotypes. However, most of these genes remained relatively unresponsive to DM exposure in the TKO genotype (with the exception of Ddit4 and Usp2 which increased with DM exposure in the TKO samples). Notably, the group of genes previously highlighted (Timeless, Gtse1, Tubb4b, H2ac12, and Pidd1) decreased in expression from day 1 to day 10 in the FVB and QKO genotypes while the expression of these genes increased slightly in the TKO genotype and increased markedly in the PTEN genotype through this time period. Overall, the most impressive feature among these genes was the dramatic increase in the expression of these genes from day 1 to day 10 in the PTEN explants. Further, removal of Pten (in the QKO) is sufficient to restore the expression of many of these genes to levels similar (or higher) to that in the FVB (control) explants. These observations are consistent with the notion that FGFR signaling increases and PTEN suppresses the expression of these genes in response to DM. Given that the peak responses for differentiation-related gene expression occurred at day 10 following DM exposure, we chose to focus on this time period for subsequent analyses.

3.4. Epistasis between FGFR-Signaling and PTEN in Lens Epithelial Explants in Response to DM

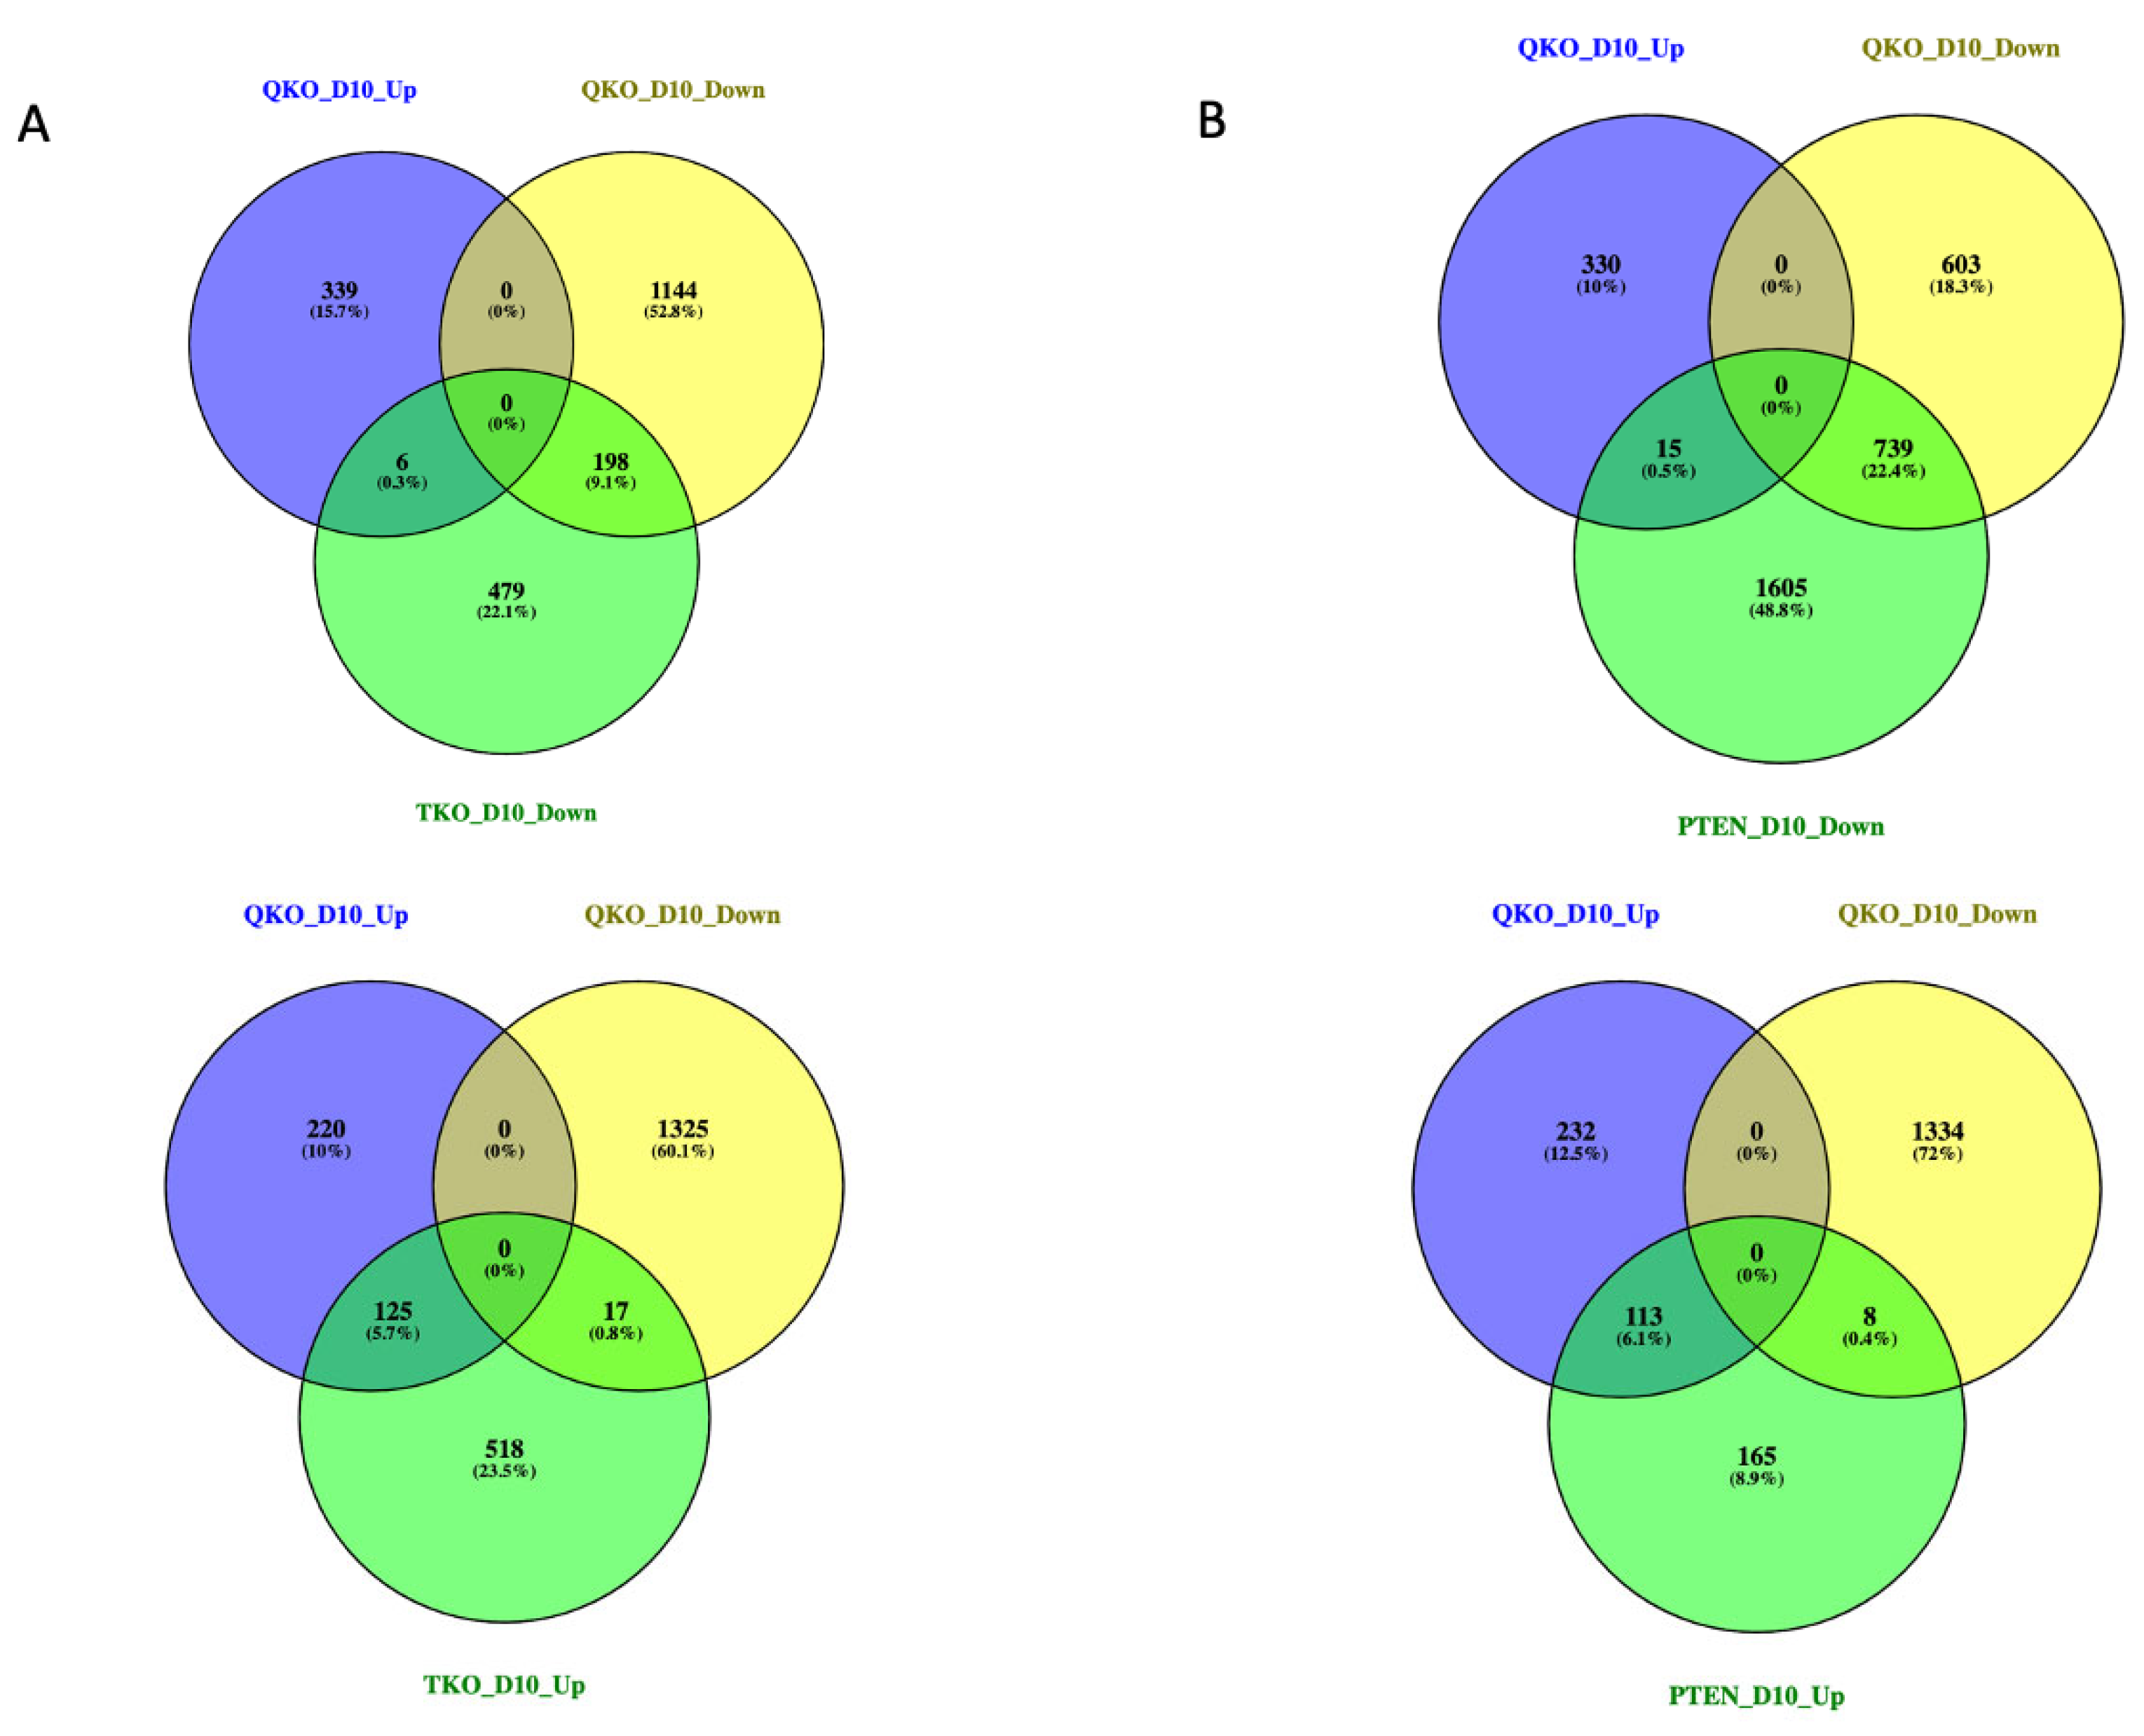
Our previous studies had demonstrated that 1) the loss of Pten could counter the apoptosis induced by the loss of Fgfr2 in the lens[20] and 2) the loss of Pten could restore the ability of vitreous to induce fiber cell differentiation in Fgfr-deficient lens epithelial explants[25]. These observations suggest that normally FGFR-signaling promotes, and in the absence of Fgfrs, PTEN inhibits lens fiber cell differentiation, consistent with the data shown in Figure 3A. Since the greatest fiber cell differentiation response in the FVB, QKO and PTEN explants was seen 10 days after DM treatment, we chose to focus on this time point for further analyses. To determine the overall epistatic relationship of Fgfrs and Pten with respect to DM, we analyzed how the expression of genes in the QKO genotype is modified relative to that in the TKO and PTEN genotypes at day 10. Relative to the wildtype FVB genotype at day 10, the TKO explants deregulate 1,343 genes, the QKO explants deregulate 1,687 genes and the PTEN explants deregulate 2,645 genes. To illustrate how Fgfrs and Pten interact genetically at day 10, we constructed Venn diagrams to demonstrate the restoration of normal gene expression in both the TKO and PTEN genotypes in the QKO genotype (Figure 4). Of the 683 genes downregulated in the TKO genotype, 479 (70%) of these were restored to normal regulation in the QKO genotype. Of the TKO downregulated genes that remained deregulated in the QKO genotype, 198 of these remained downregulated and 6 were upregulated. Likewise, of the 660 upregulated genes in the TKO genotype, 518 (78%) were regulated normally in the QKO genotype. Of the 142 TKO upregulated genes that remained deregulated in the QKO explants, 125 of these remained upregulated and 17 were downregulated (Figure 4A). Of the 2,359 genes that were downregulated at day 10 in the PTEN genotype, 1,605 (68%) of these were normalized in the QKO genotype. Of the PTEN downregulated genes that remained deregulated, 739 of these remained downregulated and 15 were upregulated in the QKO genotype. At day 10, the PTEN explants upregulated 286 genes. Of these, 165 (58%) were rescued to normal regulation in the QKO genotype. Of the 121 genes that remained deregulated in the QKO genotype, 113 remained downregulated and 8 were upregulated (Figure 4B). It is interesting to note that while the loss of Fgfrs resulted in almost an equal number of upregulated (49%) and downregulated (51%) genes at day 10, both the PTEN and QKO genotypes downregulated (89% and 80%, respectively) more genes than they upregulated (11% and 20%, respectively). All of the relevant genes described in Figure 4 are included in Table S16. The simultaneous deletion of Pten and Fgfrs in the QKO led to the restoration of normal expression in 70% and 78% of the genes downregulated or upregulated, respectively in the explants lacking only Fgfrs (TKO).
Since we were most interested in the moderation of the TKO gene expression changes by the additional loss of Pten, we normalized the PTEN and QKO genotypes with respect to the TKO genotype at day 10 and visualized deregulated gene expression with a Venn diagram (Figure S3). Most interesting were the intersections of the 862 genes that were upregulated in both the PTEN and QKO explants and the 1,107 genes that were downregulated in both the PTEN and QKO explants at day 10. GO analysis of the commonly upregulated genes (Figure S3B) revealed the term “lens development in camera type eye” as most significant (padj = 3.95 X10⁻¹⁵). Other notable terms from this category included “actin filament based process” (padj = 3.67x10⁻¹⁰), “regulation of epithelial cell proliferation” (padj = 3.13x10⁻⁸), “signaling by GPCR”(padj = 8.86x10⁻⁸), and “extracellular matrix organization ”(padj = 1.68x10⁻⁷),. The GO analysis of the 1,107 commonly downregulated genes (Figure S3C) revealed the terms ``regulation of tube size” (padj = 8.31x10⁻³), “neuronal system” (padj =1.69x10⁻²). This data also suggests that the commonly downregulated genes include those functioning in neurons, which is in agreement with reports suggesting that there are mechanisms that are at play for down regulating neuronal gene expression in lens fiber cells[44,45]. Here it appears that the 862 commonly upregulated genes in the QKO and PTEN genotypes are those most likely to participate in lens fiber cell differentiation. Of these commonly upregulated genes, 234 overlap with the 479 genes downregulated in the TKO genotype that are restored to normalcy in the QKO genotype. The top GO term for these 234 genes was “lens development in the camera type eye” (padj = 1.96 X 10⁻¹³) and the second highest GO term was “lens fiber cell differentiation” (padj =3.02X 10⁻⁶). It is likely that the genes most responsible for the phenotype in the TKO explants are contained in this list of 234 genes (Figure S4,Table S17).

3.5. The Effect of Fgfr/Pten Epistasis on the Expression of Genes Listed in iSyTE and Cat-Map

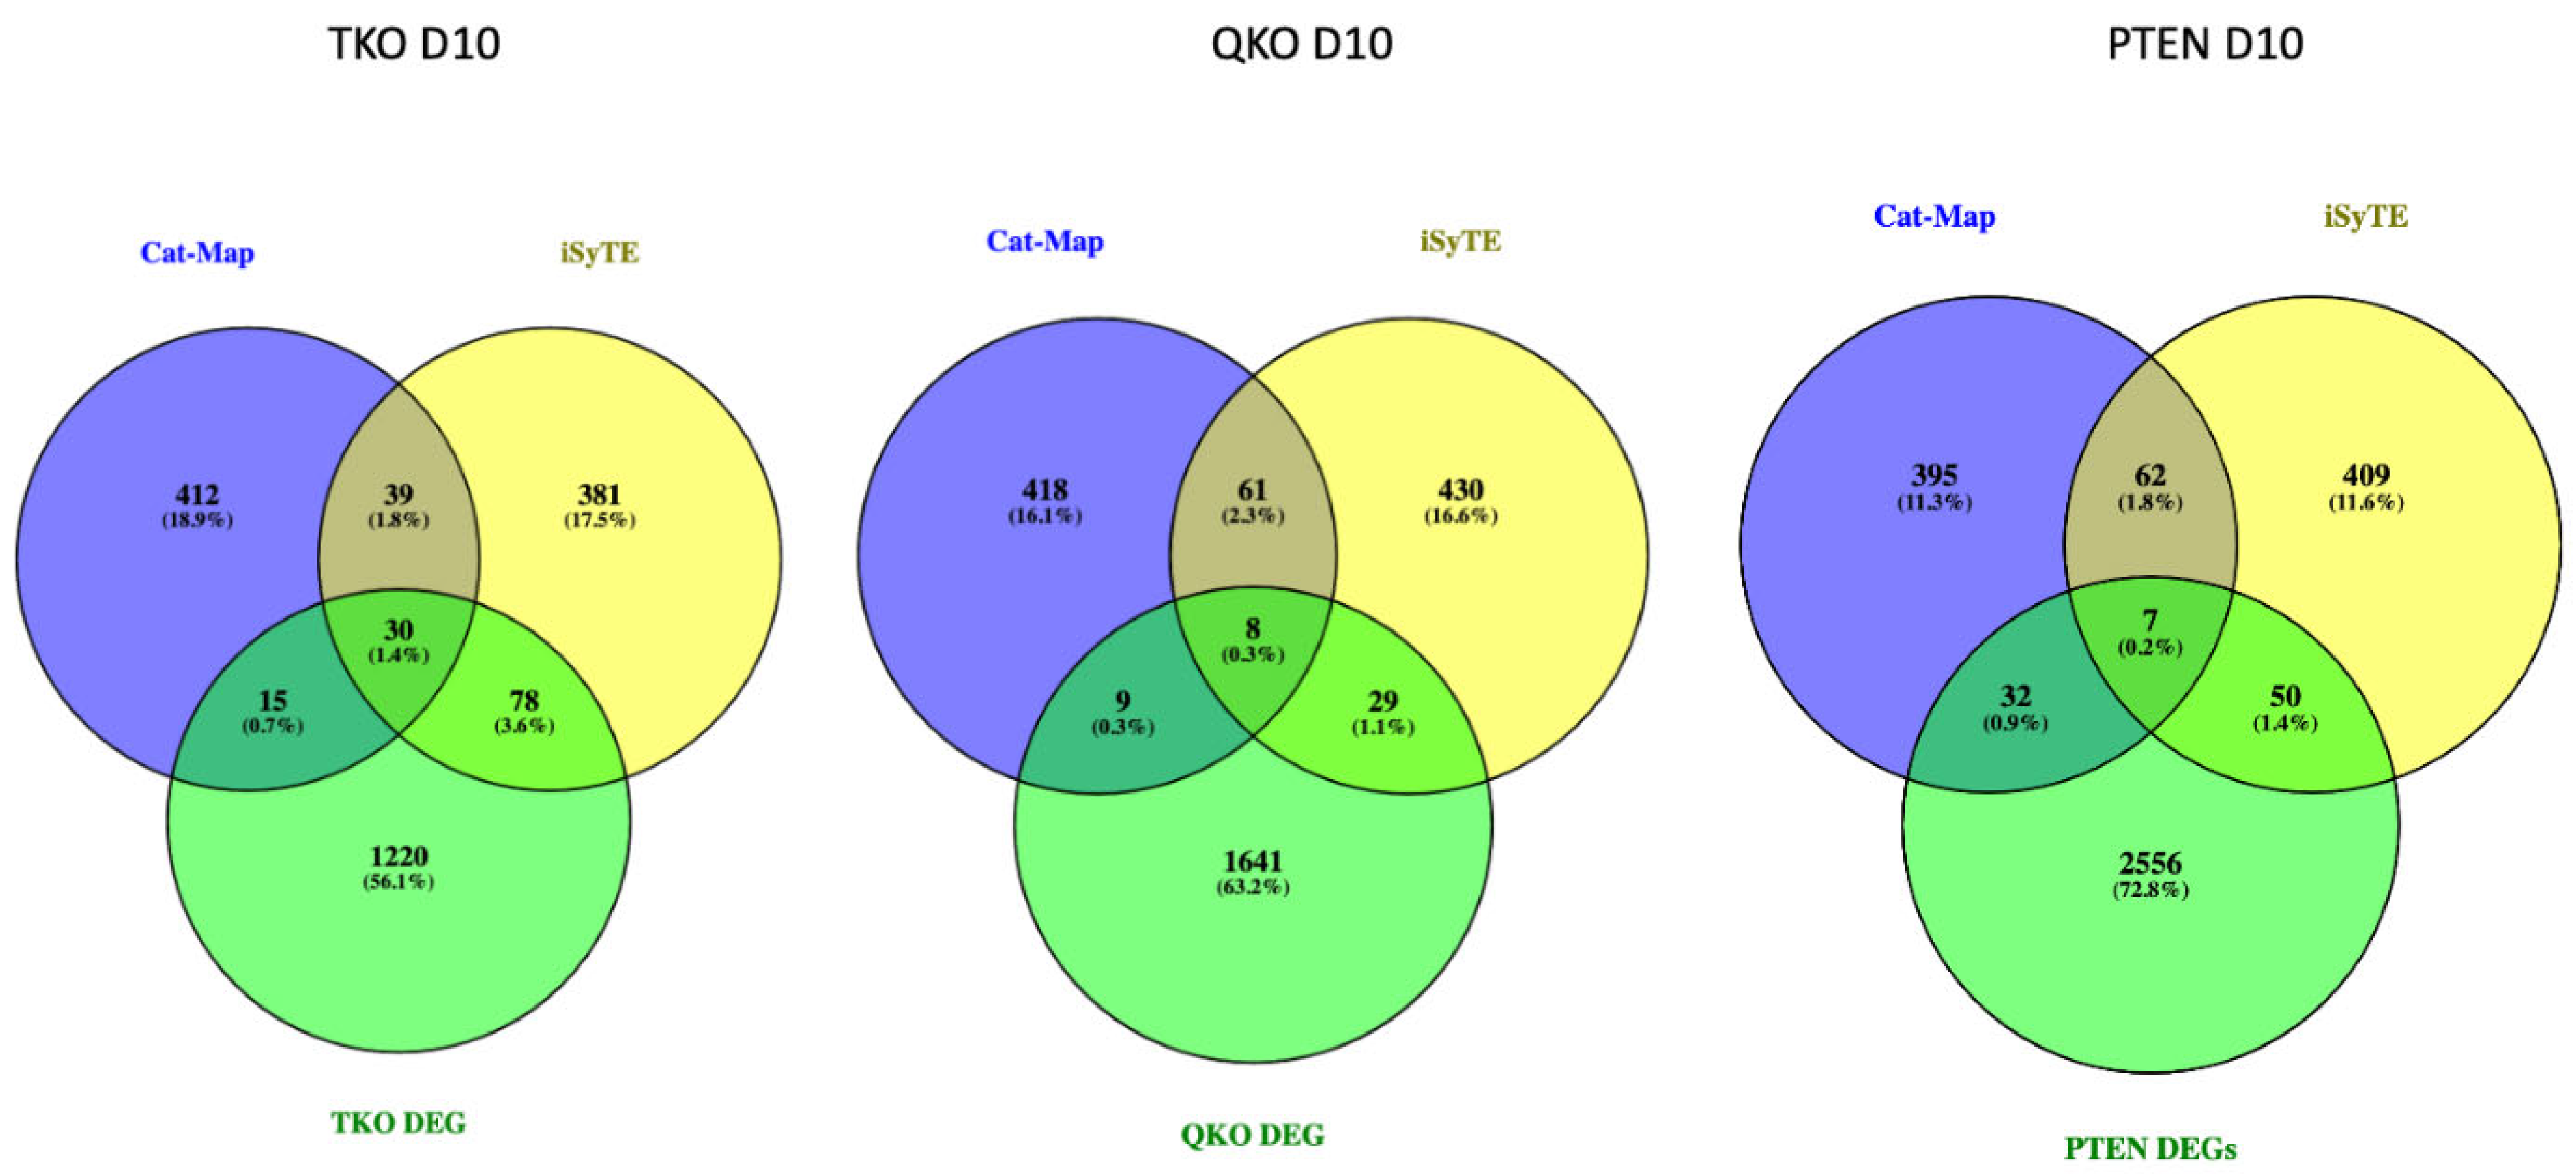
To gain a greater understanding of the effect of Fgfr and/or Pten loss on all aspects of lens development, we analyzed our day 10 transcriptomic data in light of the 528 lens-enriched genes listed in the iSyTE dabase[46] and the list of 496 cataract-associated genes maintained by the Cat-Map database[47]. A total of 69 genes are shared between the iSyTE and Cat-Map lists. Among the 1,343 deregulated genes in the TKO genotype (relative to the wildtype FVB genotype), 123 (9%) were shared with either or both the Cat-Map and iSyTE database (Figure 5A). In contrast, only 89 (3%) of the 2,645 deregulated genes from the PTEN genotype were shared with either or both of these database lists (Figure 5B). The QKO genotype deregulated 46 (3% of the total 1,687 deregulated genes) genes that were on either or both of the Cat-Map or iSyTE gene lists at day 10 (Figure 5C). If we combine the iSyTE and Cat-Map genes into a group that will hereafter be designated Lens Genes, five of these lens genes remain deregulated in all three genotypes (TKO, QKO and PTEN) relative to FVB. These are Mfrp, Car8, Cdh1, Myb and Cckbr. With respect to transcription factor genes, Foxe3 remains deregulated whenever Pten is deleted (PTEN and QKO) and Otx2 is deregulated whenever the Fgfrs are deleted (TKO and QKO). The only transcription factor gene that is commonly deregulated in the TKO and PTEN genotypes is Sox1, and the expression of this gene normalizes in the QKO genotype. Three genes (Aldh1a7, Sox1 and Gabrg3) were both downregulated in the TKO genotype and upregulated in the PTEN genotype). Likewise, four genes (Cckbr, Alpl, Sned1 and Slc4a50 are both upregulated in the TKO and downregulated in the PTEN genotypes. Interestingly, no iSyTE genes were commonly downregulated in the TKO genotype and upregulated in the QKO genotype or upregulated in the TKO genotype and downregulated in the QKO genotype. These data suggest that QKO showed the restoration of the majority of the iSyTE/Cat-Map genes found to be deregulated in TKO.

3.6. PDGFRa: A Potential Alternative Pathway for Fiber Cell Differentiation in Absence of FGFRs and PTEN

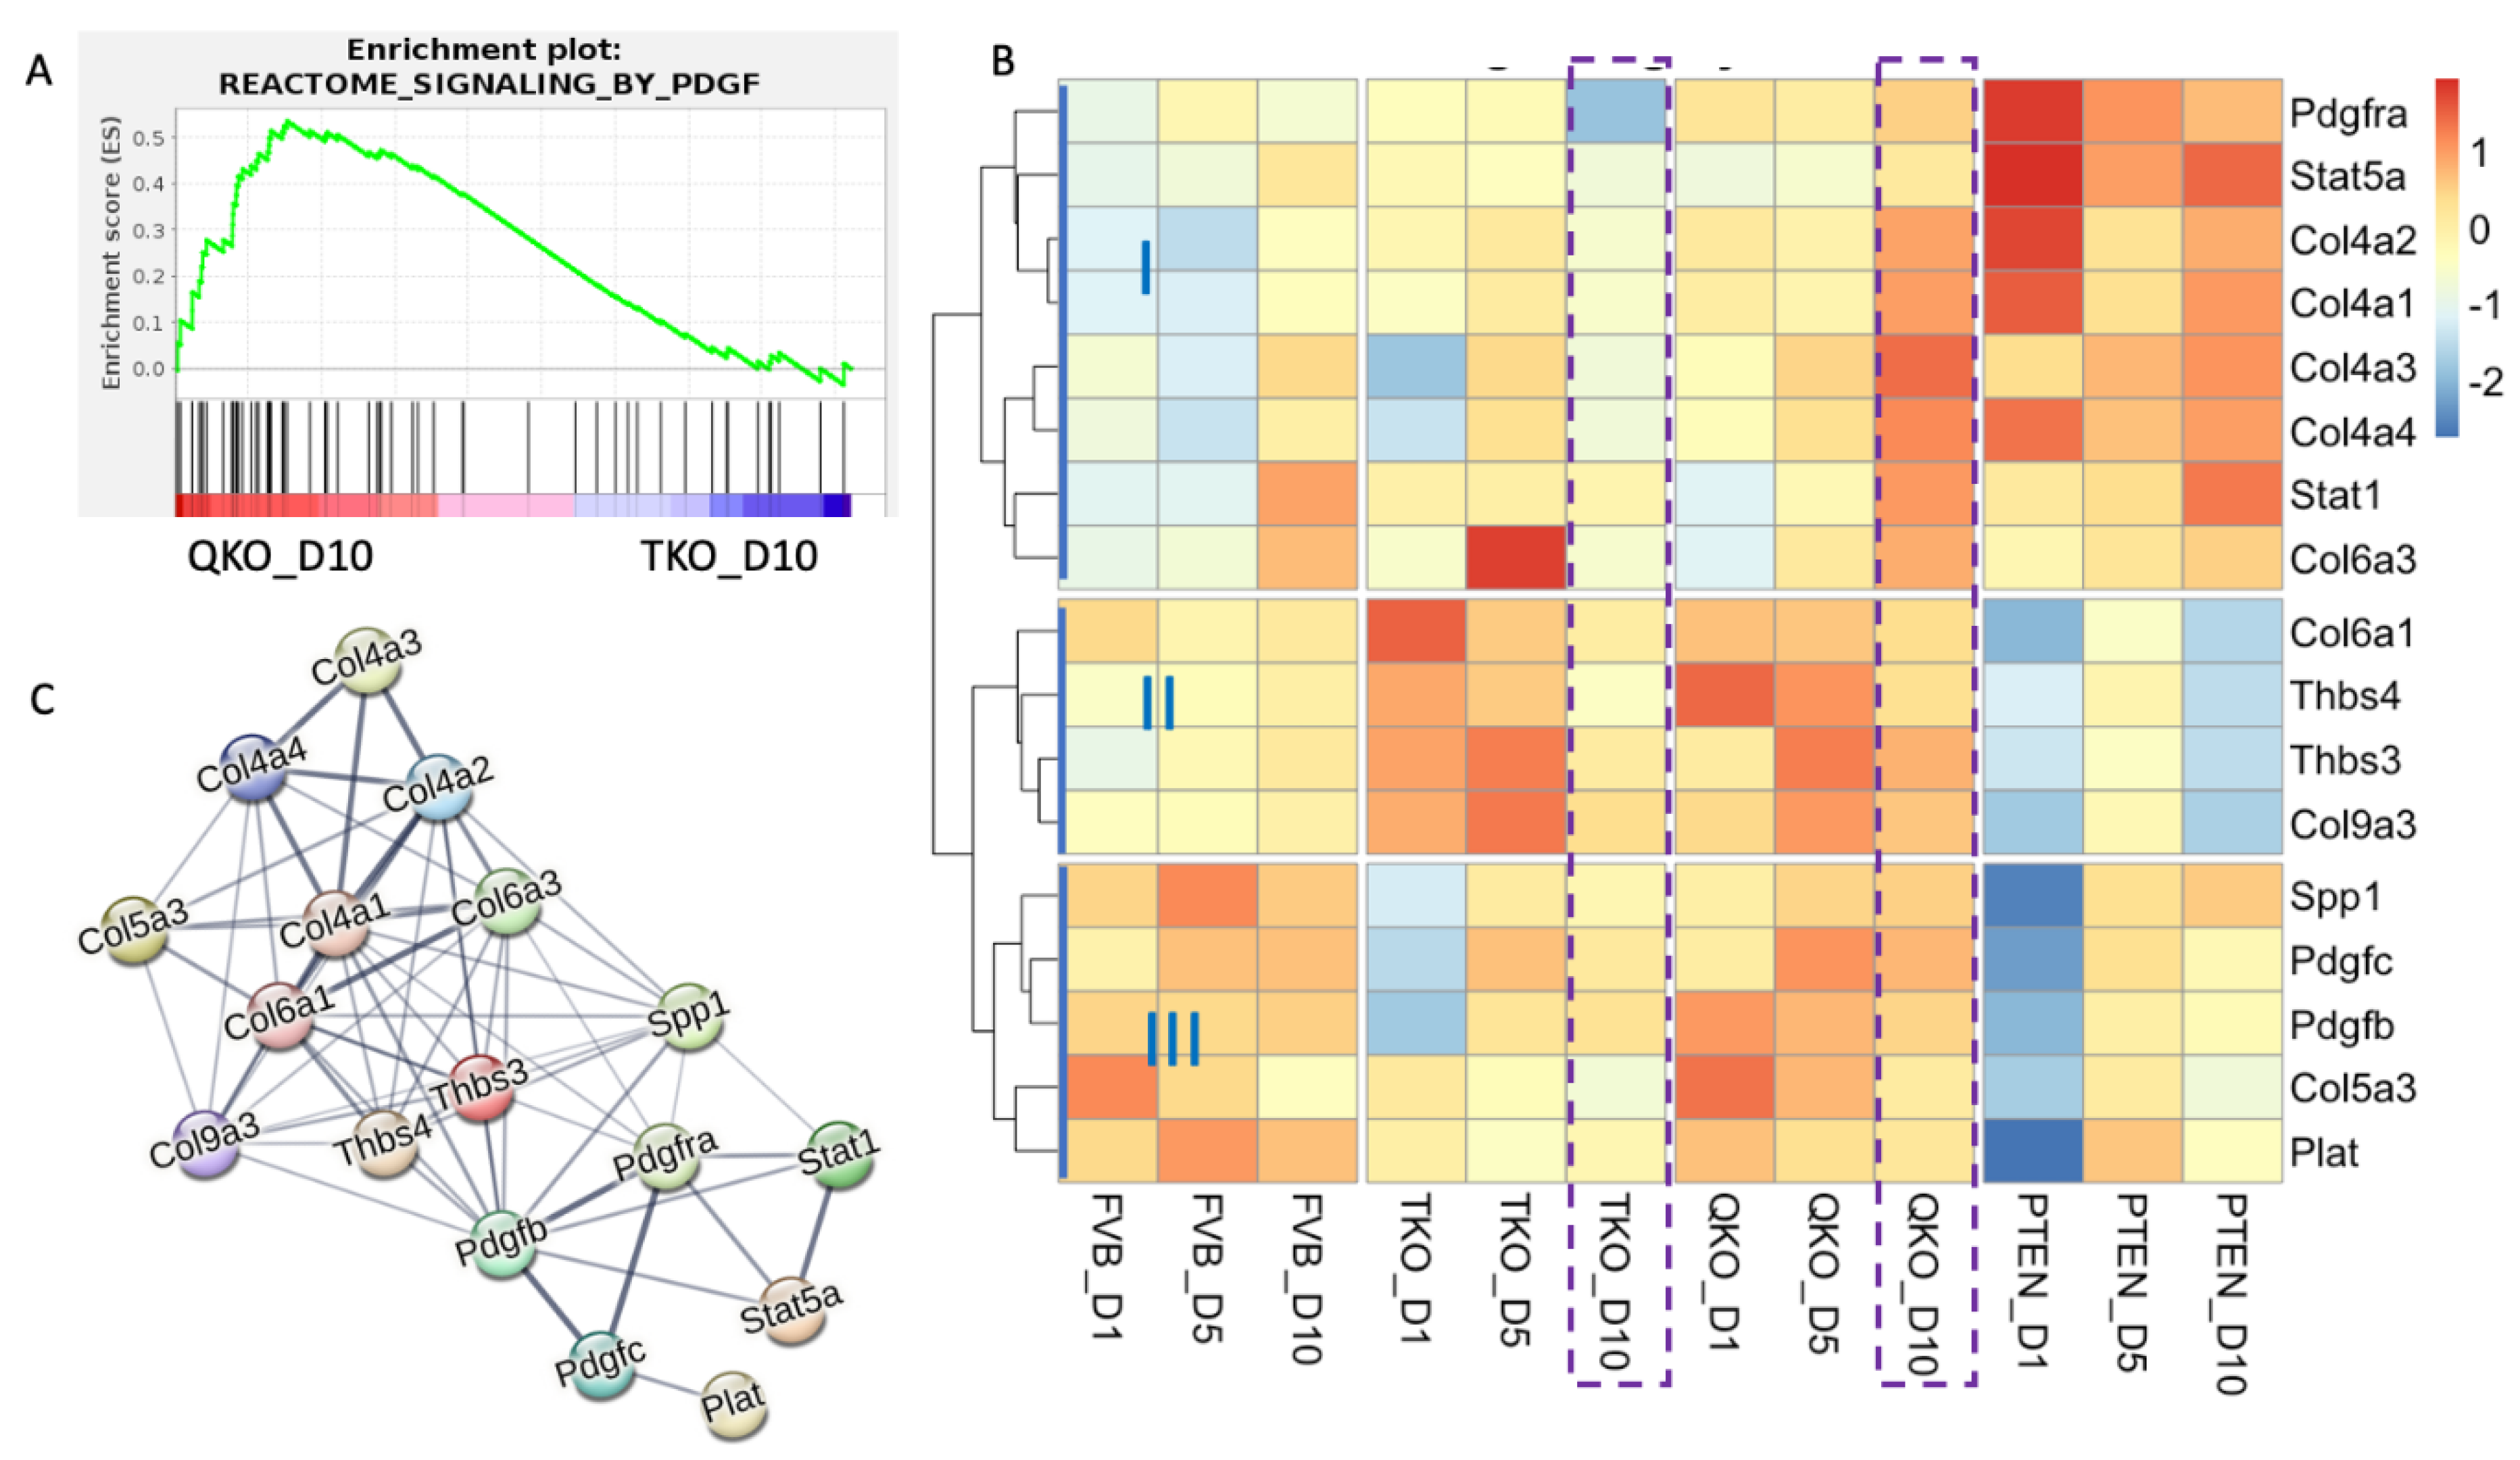
We previously showed that the removal of Pten can restore the ability of vitreous humor to elicit lens epithelial cell elongation and the expression of both β-crystallin and MIP in lens epithelial cells lacking Fgfrs[25]. Our current gene expression analysis also supports the ability of DM to induce gene expression changes – including the restoration of β-crystallin and Mip genes, among others – consistent with fiber cell differentiation in the absence of Fgfrs when Pten is deleted. To determine if our transcriptomics data might provide evidence as to the mechanism by with Fgfr-indepent differentiation occurs, we employed gene set enrichment analysis (GSEA) to conduct a comprehensive pairwise comparison to predict possible pathways driving fiber cell differentiation in absence of both Fgfrs and Pten. Gene Set Enrichment Analysis (GSEA) is a computational method used in bioinformatics to determine whether predefined sets of genes exhibit statistically significant differences in expression between two biological states[39,40]. Since gene expression suggesting fiber cell differentiation was most prominent in D10 explants, we compared the TKO and QKO gene expression data at this stage using the GSEA C2 reactome dataset to identify differential enrichment for well-defined biological pathways. Among the highest ranking pathways enriched in the QKO explants relative to the TKO explants were those involved in the cholesterol and extracellular matrix, such as “Anchoring fibril formation”, “Cross linking of collagen fibrils”, “Cholesterol biosynthesis”, “Laminin interactions”, “Assembly of collagen fibrils and other multimeric structures”, “Metabolism of steroid hormones”, “Regulation of cholesterol biosynthesis and activation of gene expression by SREBP/SREBF”, and “Non-integrin membrane ECM interactions” (Table S18). However, an interesting pathway that appeared in the QKO and TKO GSEA analysis was “signaling by PDGF” with an enrichment score of 0.5357 (Figure 6A) based on the enrichment of 27 genes. This was the only enriched term that pointed to a receptor tyrosine kinase pathway related to FGFR-signaling. This led to the speculation that in the absence of Pten, DM-induced PDGF receptor (PDGFR)-signaling might rescue fiber cell differentiation in Fgfr-deficient lens epithelial explants.
To investigate the possibility that PDGFR-signaling contributes toward rescuing aspects of fiber cell differentiation in Fgfr-deficient explants, we analyzed the genes enriched in QKO, relative to TKO explants, with respect to all the genes listed under the reactome pathway term “signaling by PDGF”, and with respect to differential expression in all other genotypes at all time points. Of the 58 total genes in the “signaling by PDGF '' pathway, 27 (~47%) were enriched in the QKO explants relative to the TKO explants at D10. Of these 27 genes, 17 (~63%) were differentially expressed (log2fold >1.5, padjust <0.005), relative to the wildtype explants, in at least one genotype or time point following DM exposure (Figure 6B). By definition, all 27 of these genes were expressed at a higher level in the QKO explants than the TKO explants at D10 but not all of these genes had to meet the criteria we set for DEGs. For example, a QKO enriched gene in GSEA analysis might not have met the log2 > 1.5, padjust < 0.005 threshold for DEG. The 17 genes that did meet the DEG criteria were further divided into three categories (I, II, III) based on similar gene expression patterns in the different genotypes.
The first category (I) contains eight genes (Pdgfra, Stat5a, Col4a2, Col4a1, Col4a3, Col4a4, Stat1 and Col6a3). All of the genes in this category, with the exception of Pdgfra, increase from D1 to D10 in the wildtype FVB explants. Within the D10 samples, all of these genes are expressed at the lowest levels in the TKO explants. Also, at D10 all of these genes, with the exception of Col4a3 and Col6a3 are expressed at the highest level in the PTEN explants, with the two exceptions being expressed higher in the QKO explants. At D1, all of these genes are expressed at a higher level in the PTEN explants than in any other genotype.
The second category (II) contains four genes (Col6a1, Thbs4, Thbs3, and Col9a3). At D1, all of these genes are expressed at the lowest level in the PTEN explants and at the highest level in the TKO explants, with the exception of Thbs4 which is expressed at the highest level in the QKO explants at D1. At D10 the expression level of these genes is similar in the FVB and TKO explants, with relatively higher expression in the QKO and lower expression in the PTEN explants.
The third category (III) includes five genes (Spp1, Pdgfc, Pdgfb, Col5a3, and Plat). These genes are expressed relatively lower in the PTEN explants at D1. Otherwise, the pattern of expression through time for these genes is more similar in the FVB and QKO samples and relatively lower in the PTEN and TKO samples. It is interesting to note that two of these genes in this category (Pdgfc and Pdgfb) are PDGF ligands.
Given that D10 is when the vitreous-induced differentiation in lens epithelial explants is most pronounced in the FVB (wildtype) condition, we examined the expression of these PDGF-related genes in the TKO and QKO explants at this stage (indicated by the dashed purple boxes in Figure 6B. All of these genes are expressed more highly in the QKO explants than the TKO explants at D10. The genes in categories I and II are expressed at a higher level in the QKO samples than in the FVB samples at D10 while the genes in category III are expressed at a similar or higher level in the FVB explants than the QKO explants. PDGFRa, presumably upstream of these PDGF-related genes, normally exhibits elevated expression in lens epithelial cells and relatively lower expression in fiber cells. Consistent with this, the expression of Pdgfra is lower in the FVB explants at D10 (when the differentiation response to vitreous is strongest) than it is at D5. Interestingly, despite the overall lack of differentiation response in the TKO explants to vitreous, the level of Pdgfra expression is even lower at D10 in the TKO explants than in the FVB explants, and this expression decline at D10 is largely prevented in the absence of PTEN (both in the QKO and PTEN explants).
To illustrate the relationship of these 17 genes, we utilized STRING, a web-based database tool that helps identify known or predicted protein-protein interactions based on a provided gene list (Figure 6C). The thickness of the lines in the network diagram represents the confidence in interaction between proteins. PDGFRa occupies a central position in the network, with strong interactions with the ligands PDGFB and PDGFC as well as signaling molecules, STAT1 and STAT5a and the SPP1 transcription factor. The extracellular matrix proteins, (THBS3, THBS4 and all of the collagens) form an interacting network downstream of PDGFRa. To illustrate the connections of PDGFR-signaling, FGFR-signaling and PTEN with lens fiber cell differentiation, we used STRING to construct a protein-protein interaction network with the Fgfr genes, the Pdgfr genes, genes involved in ERK and AKT signaling pathway, and all the genes associated with lens epithelium (Figure S2) or lens fibers (Figure 3A) that are differentially expressed in our dataset (Figure S5). Although Pax6 was not differentially expressed in our dataset, given its known connection to FGFR-signaling[48,49], and its central place in establishing lens cell fate[50,51], we included PAX6 as well. As illustrated in the figure, FGFR-signaling is more strongly connected to both ERK (Mapk1 and Mapk3) and Akt than is PDGFR-signaling, but both are strongly connected to PTEN. The connections tying both FGFR- and PDGFR-signaling to the genes in the lens node are through PAX6 and GJA1. Indeed, Pax6 conditional knockout (Pax6cKO) exhibits significant reduction of Pdgfra transcripts in the lens tissue at E9.5 and E10.5 (Table 1). Further, mouse conditional knockout models for E2F1/E2F2/E2F3 (three gene deletion) or Notch2, which exhibit lens defects, also show significant reduction of Pdgfra transcripts in the lens at later embryonic or newborn stages (Table 1). These data suggest that lens defects are associated with reduced expression of Pdgfra. These connections provide a possible explanation for why PDGFR-signaling could facilitate fiber cell differentiation in lens epithelial explants when removed from repression by PTEN.
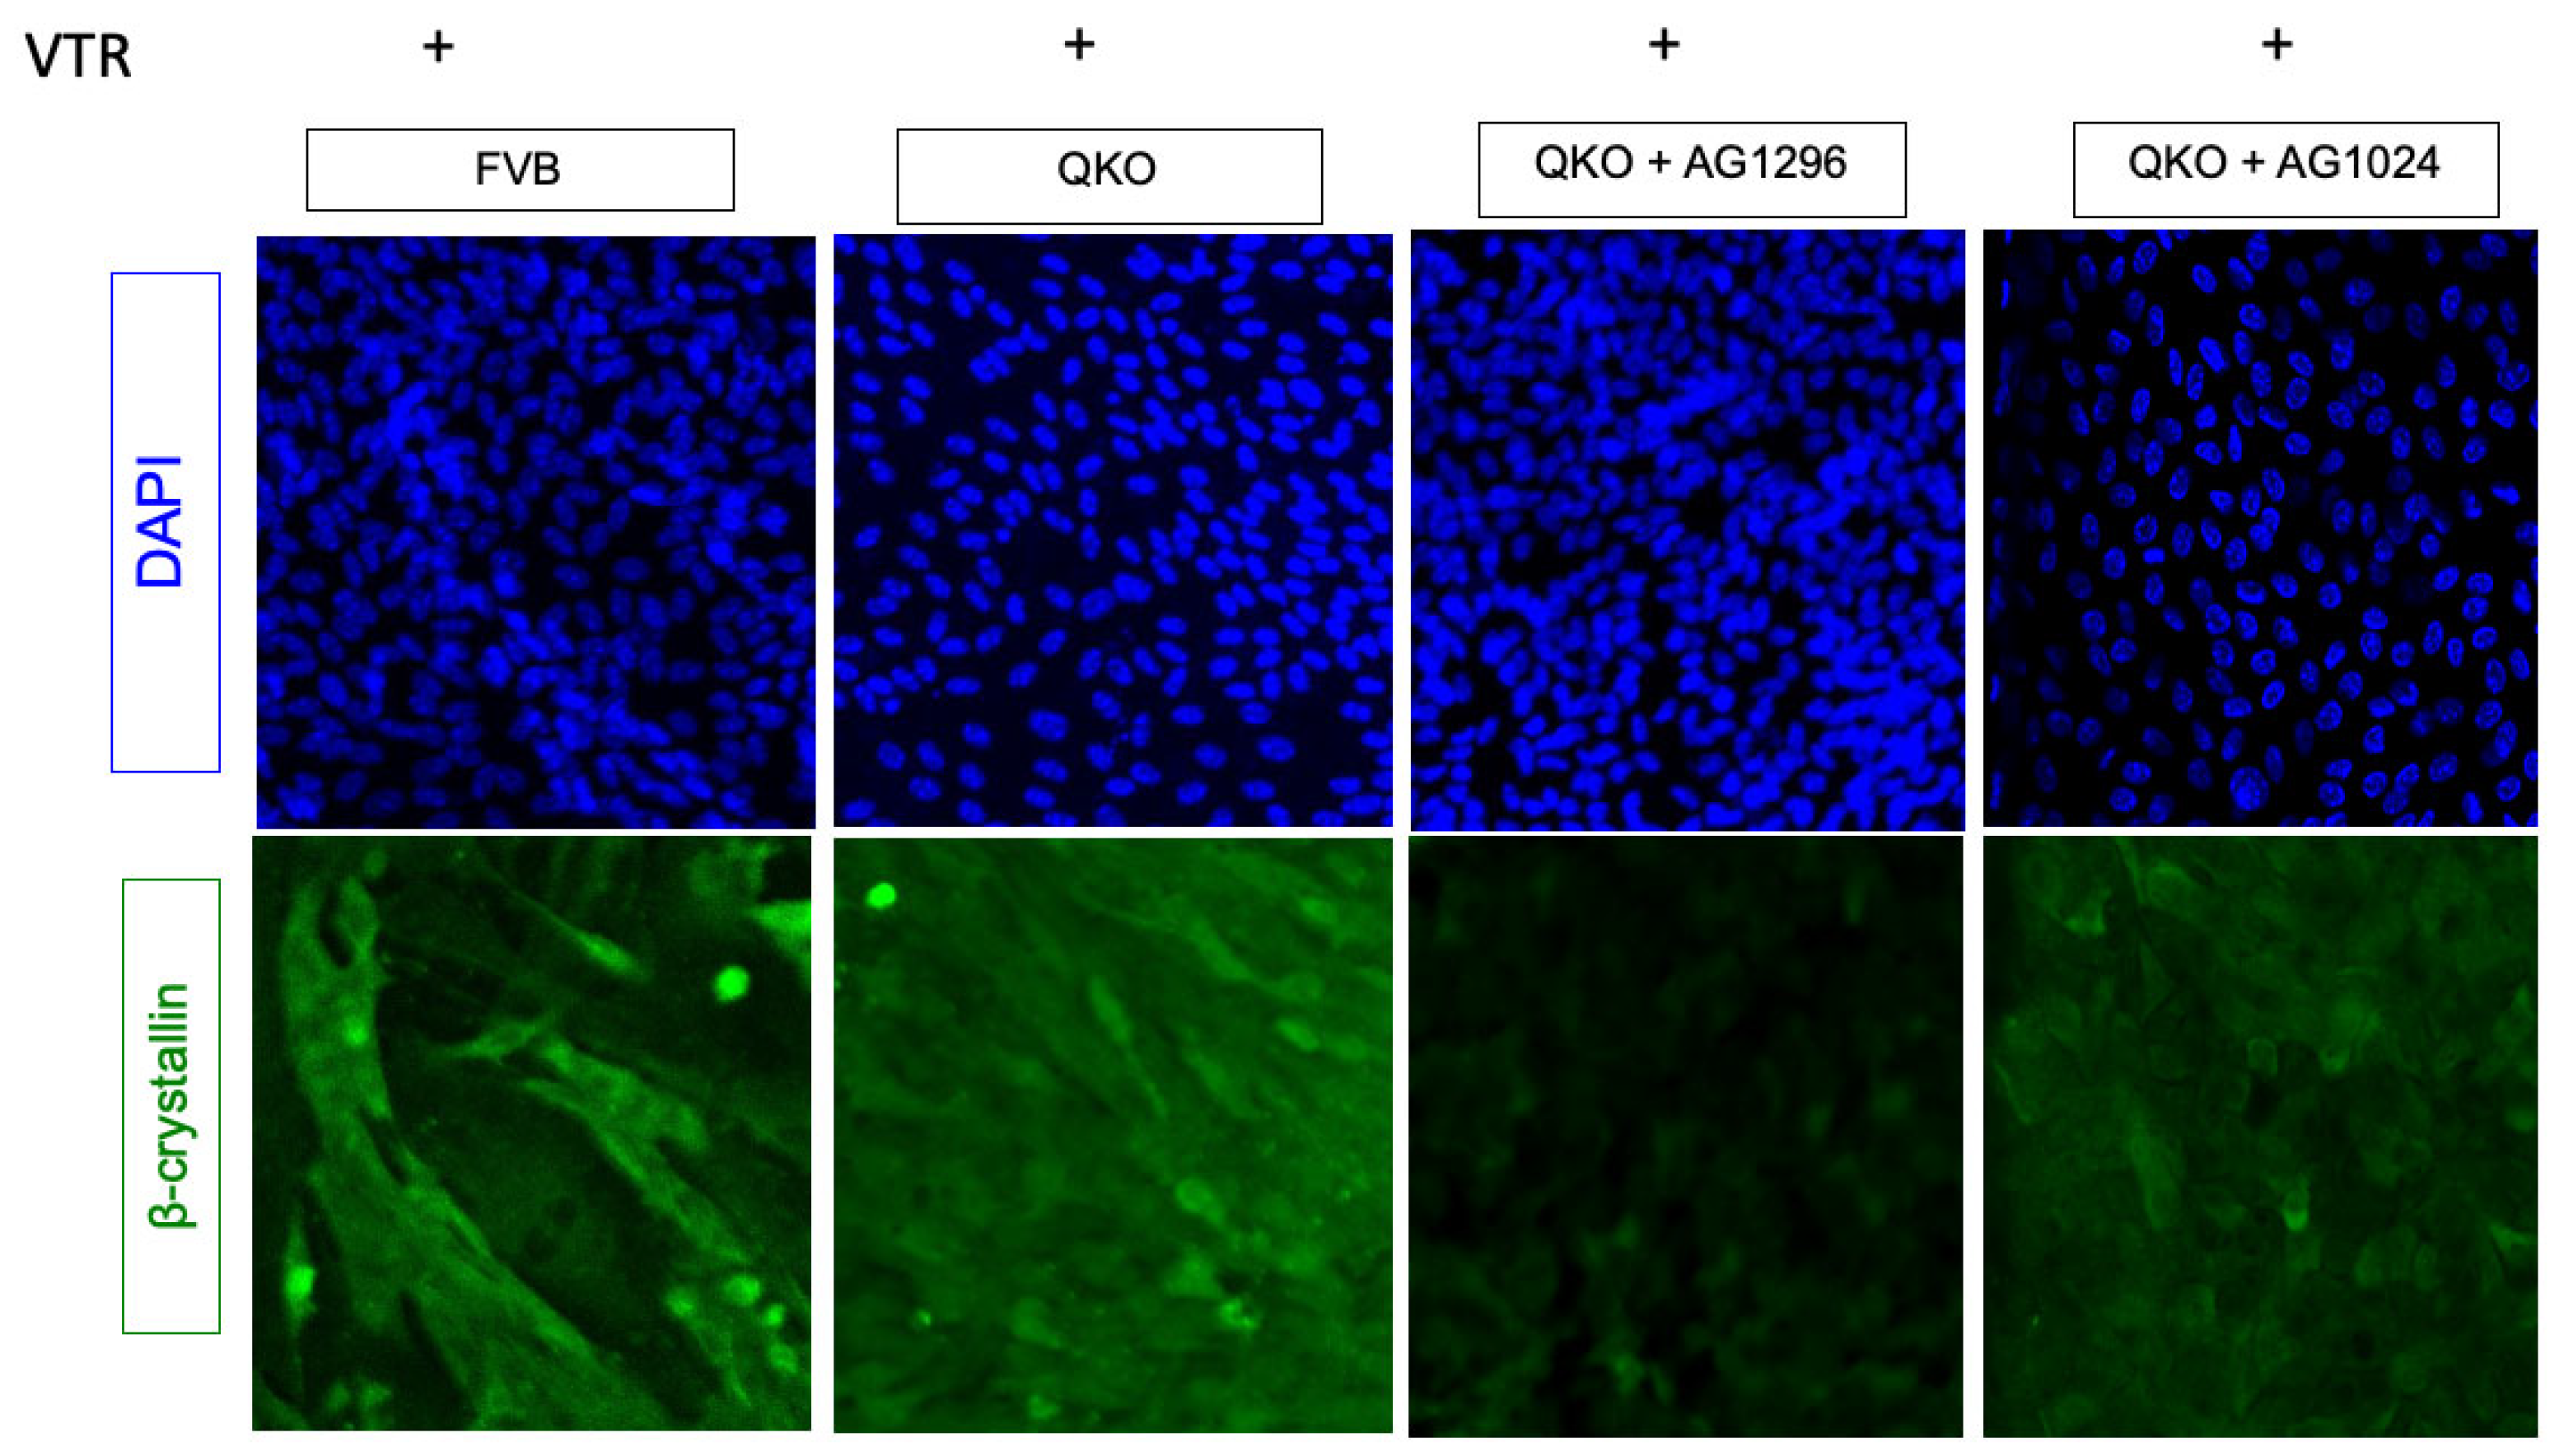
To functionally test whether inhibition of PDGF signaling could block the vitreous-based differentiation response in QKO explants, we set up an experiment to determine if β-crystallin expression (a read-out marker for differentiation) is impacted by the PDGFR-inhibitor, AG1296. As we have shown before, the DM media, containing 50% bovine vitreous humor, elicits β-crystallin expression after 5 days in both FVB and QKO explants (Figure 7). The addition of 20 μM AG1296 consistently (N=15 explants) blocked the expression of β-crystallin in QKO explants. This effect was not generalized for the inhibition of non-FGFR receptor tyrosine kinases, because the inhibition of the IGF receptor (IGF-1R) with AG1024 failed to block the induction of β-crystallin in QKO explants. These findings provide a novel mechanistic basis (via PDGFR) of how Pten deletion results in the rescue of the fiber differentiation defects resulting from the absence of Fgfrs.

3.7. ERK Signaling is Essential for Fiber Cell Differentiation in Absence of FGFRs and PTEN

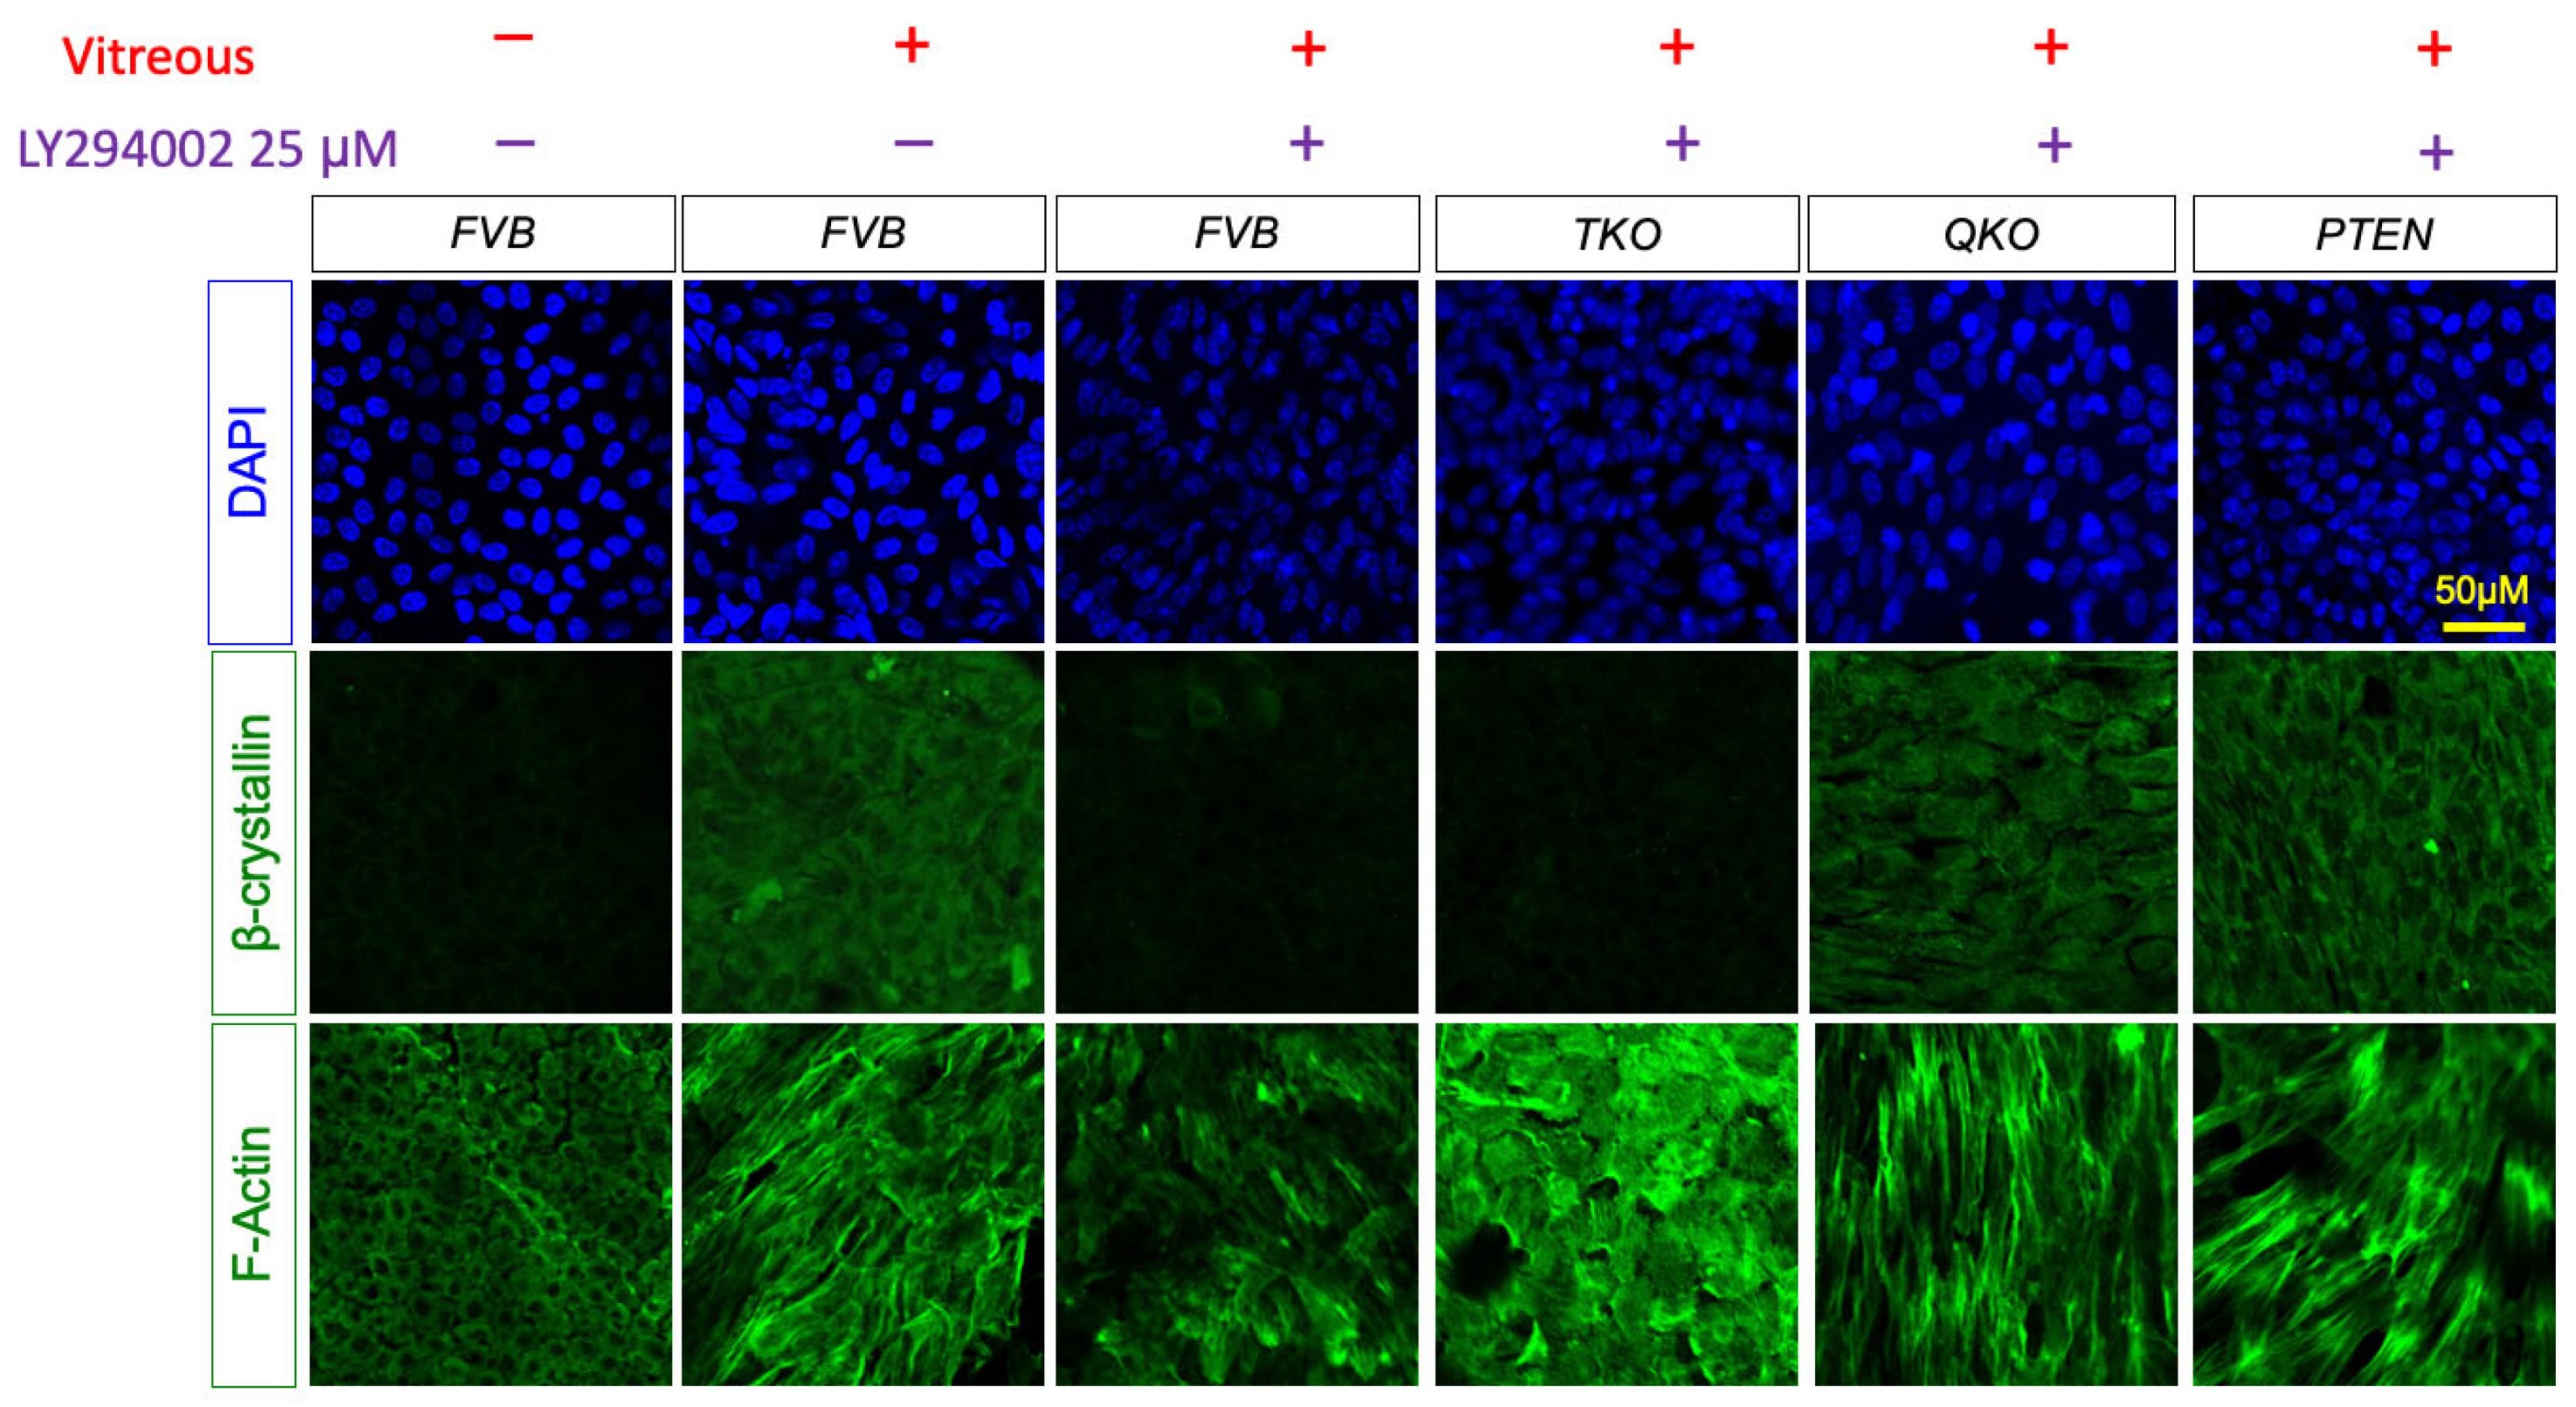
Since the removal of PTEN lifts the inhibition of vitreous-induced fiber cell differentiation in FGFR-deficient lens epithelial explants, we sought to determine the dependence of this rescue on ERK-signaling and/or AKT-signaling. To isolate the effect of activated AKT in the differentiation response, we treated explants with 25μM of the selective PI3K inhibitor LY294002 for two hours prior to vitreous treatment in explants (Figure 8). LY294002 blocked the induction of β-crystallin accumulation in wildtype explants but did not affect β-crystallin accumulation in PTEN or QKO explants. In contrast, lens epithelial cell elongation, measured by phalloidin staining, was not blocked in wildtype, QKO or PTEN explants in the presence of LY294002.
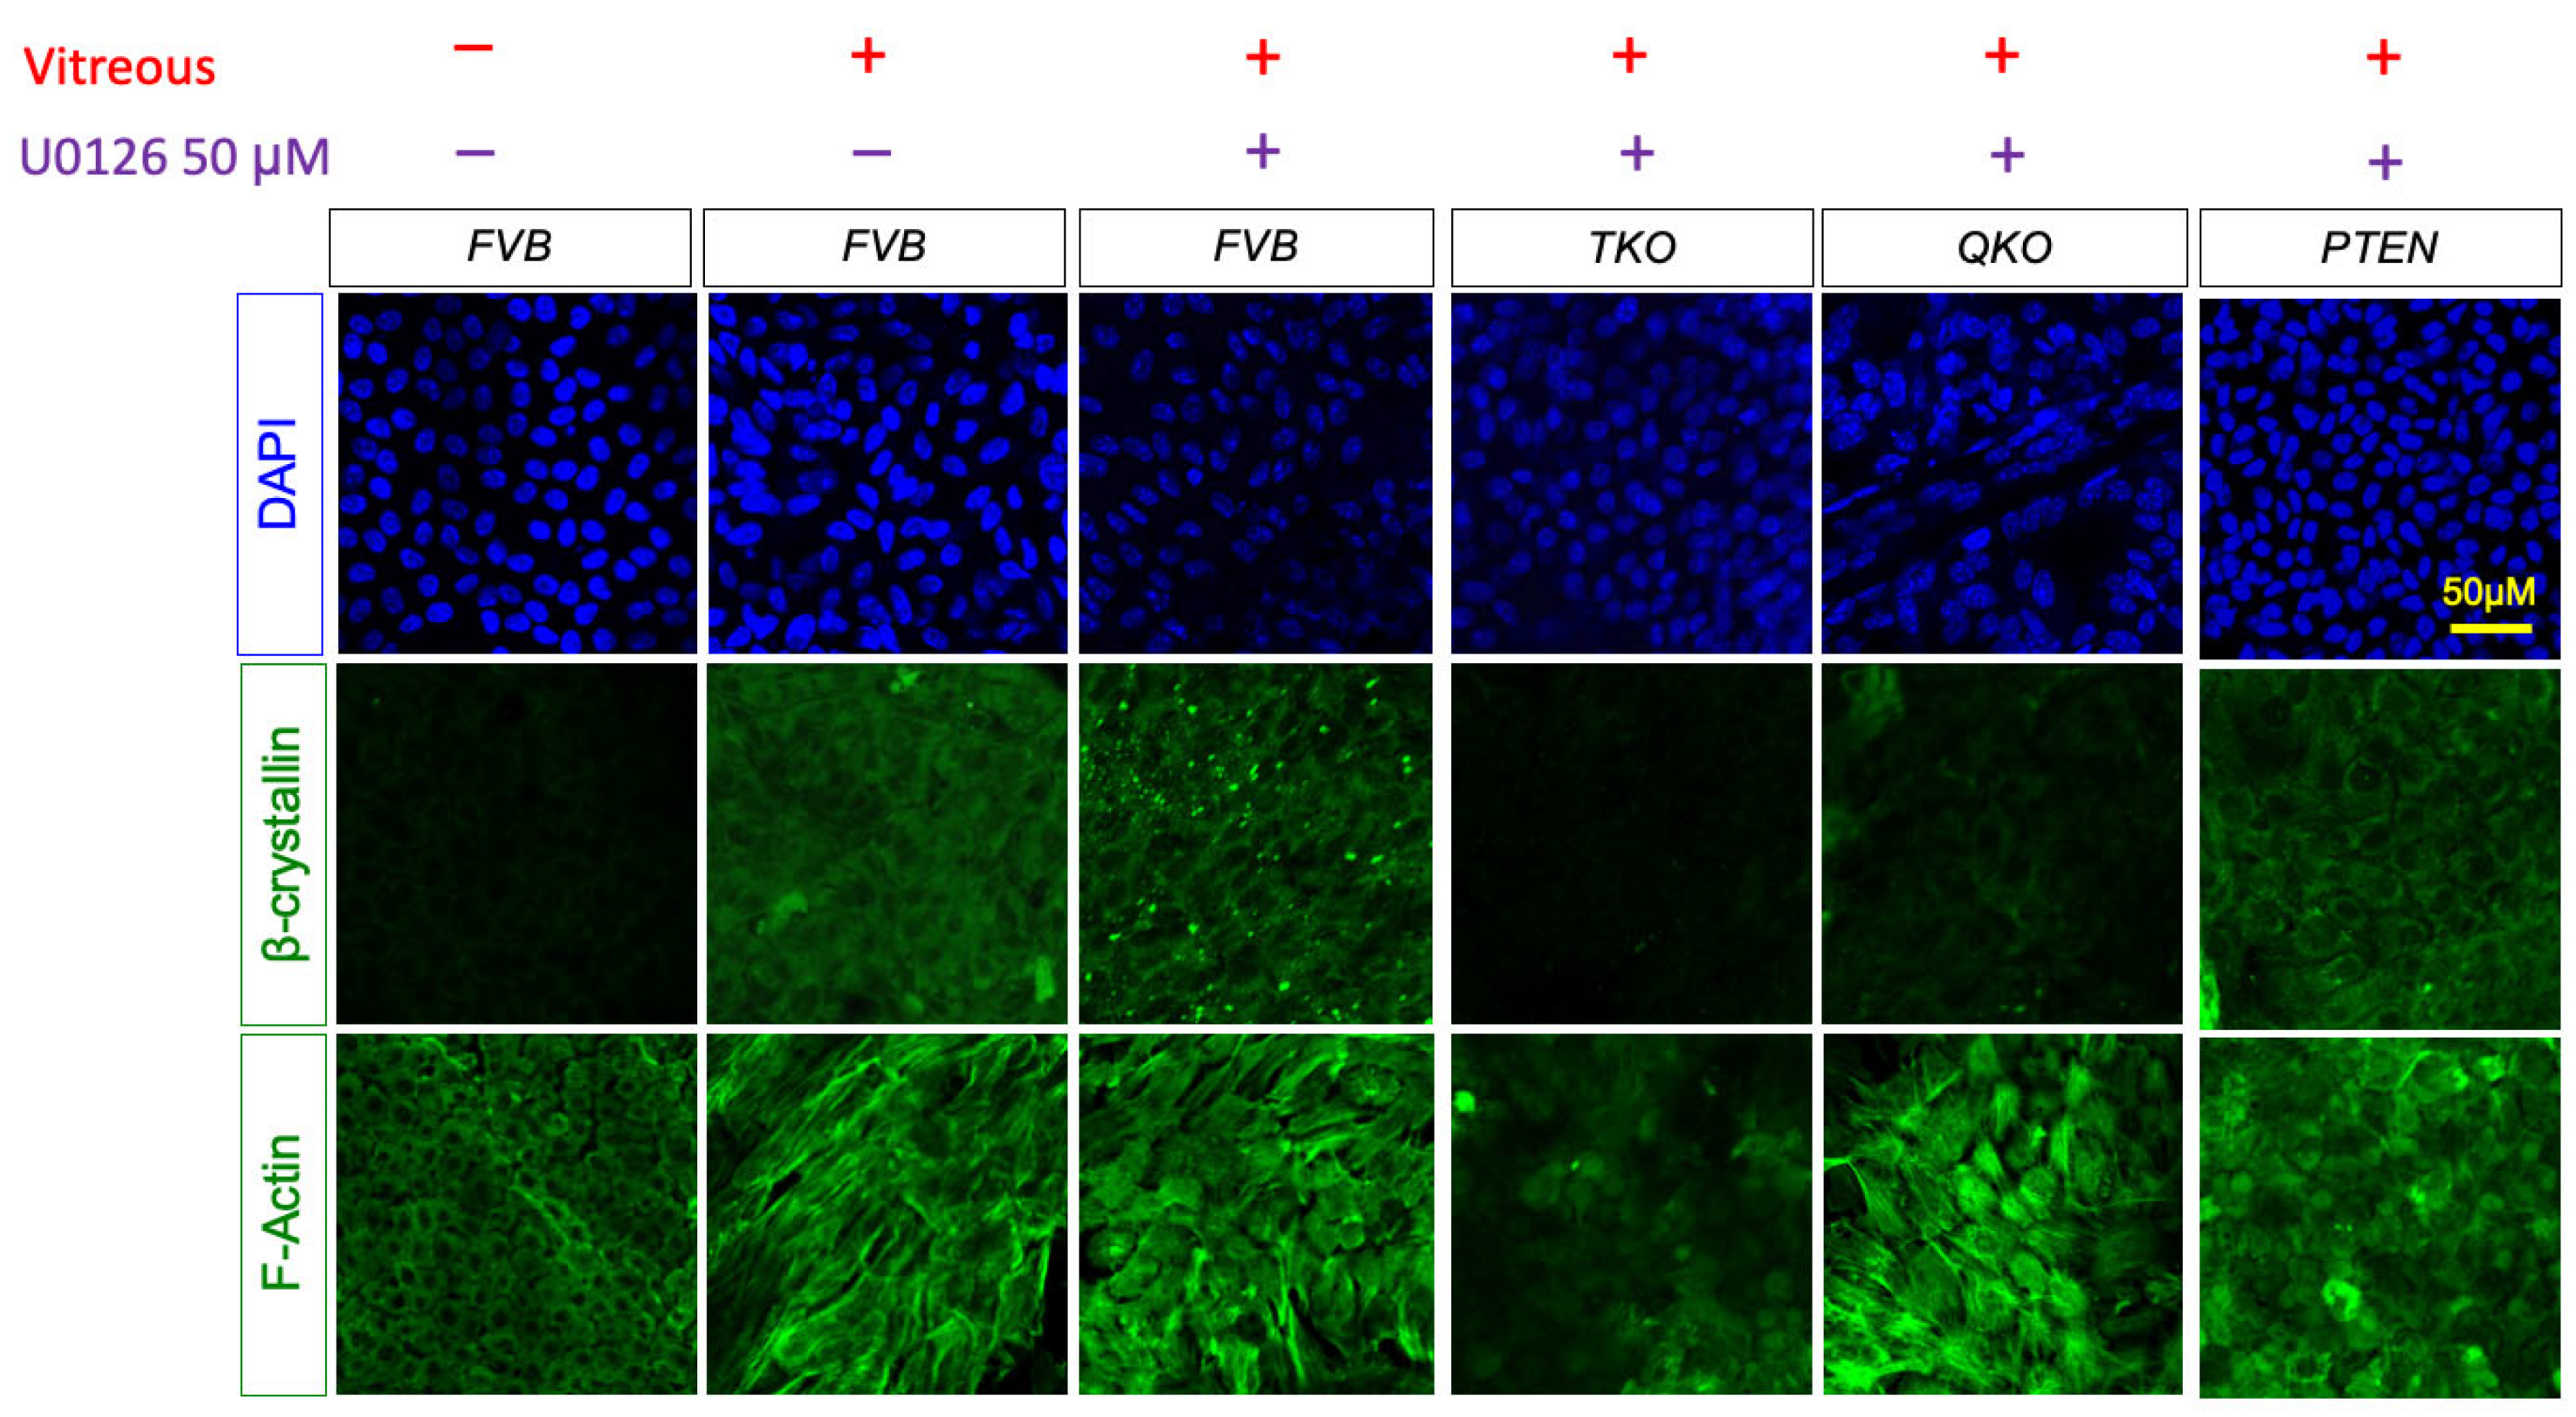
Likewise, to isolate the effect of activated ERK1/2 on fiber cell differentiation, we treated explants with 50μM of the selective MEK1/2 inhibitor U0126 for two hours prior to vitreous treatment (Figure 9). MEK inhibition failed to block β-crystallin accumulation in wildtype or PTEN explants but did block β-crystallin accumulation in QKO explants. MEK inhibition prevented the vitreous-induced elongation in wildtype, PTEN, and QKO explants. TKO explants do not accumulate β-crystallin or rearrange their cytoskeleton under any treatment. Therefore, neither β-crystallin accumulation nor elongation occurred in the QKO explants following MEK inhibition. Together, these findings show that signaling via ERK, rather than AKT, is necessary for the Pten deletion-based rescue of fiber differentiation defects in the absence of Fgfrs.

3.8. The Removal of Pten Increased the Expression of Genes Related to Immune Response and Epithelial to Mesenchymal Transition in Explants Lacking Fgfrs

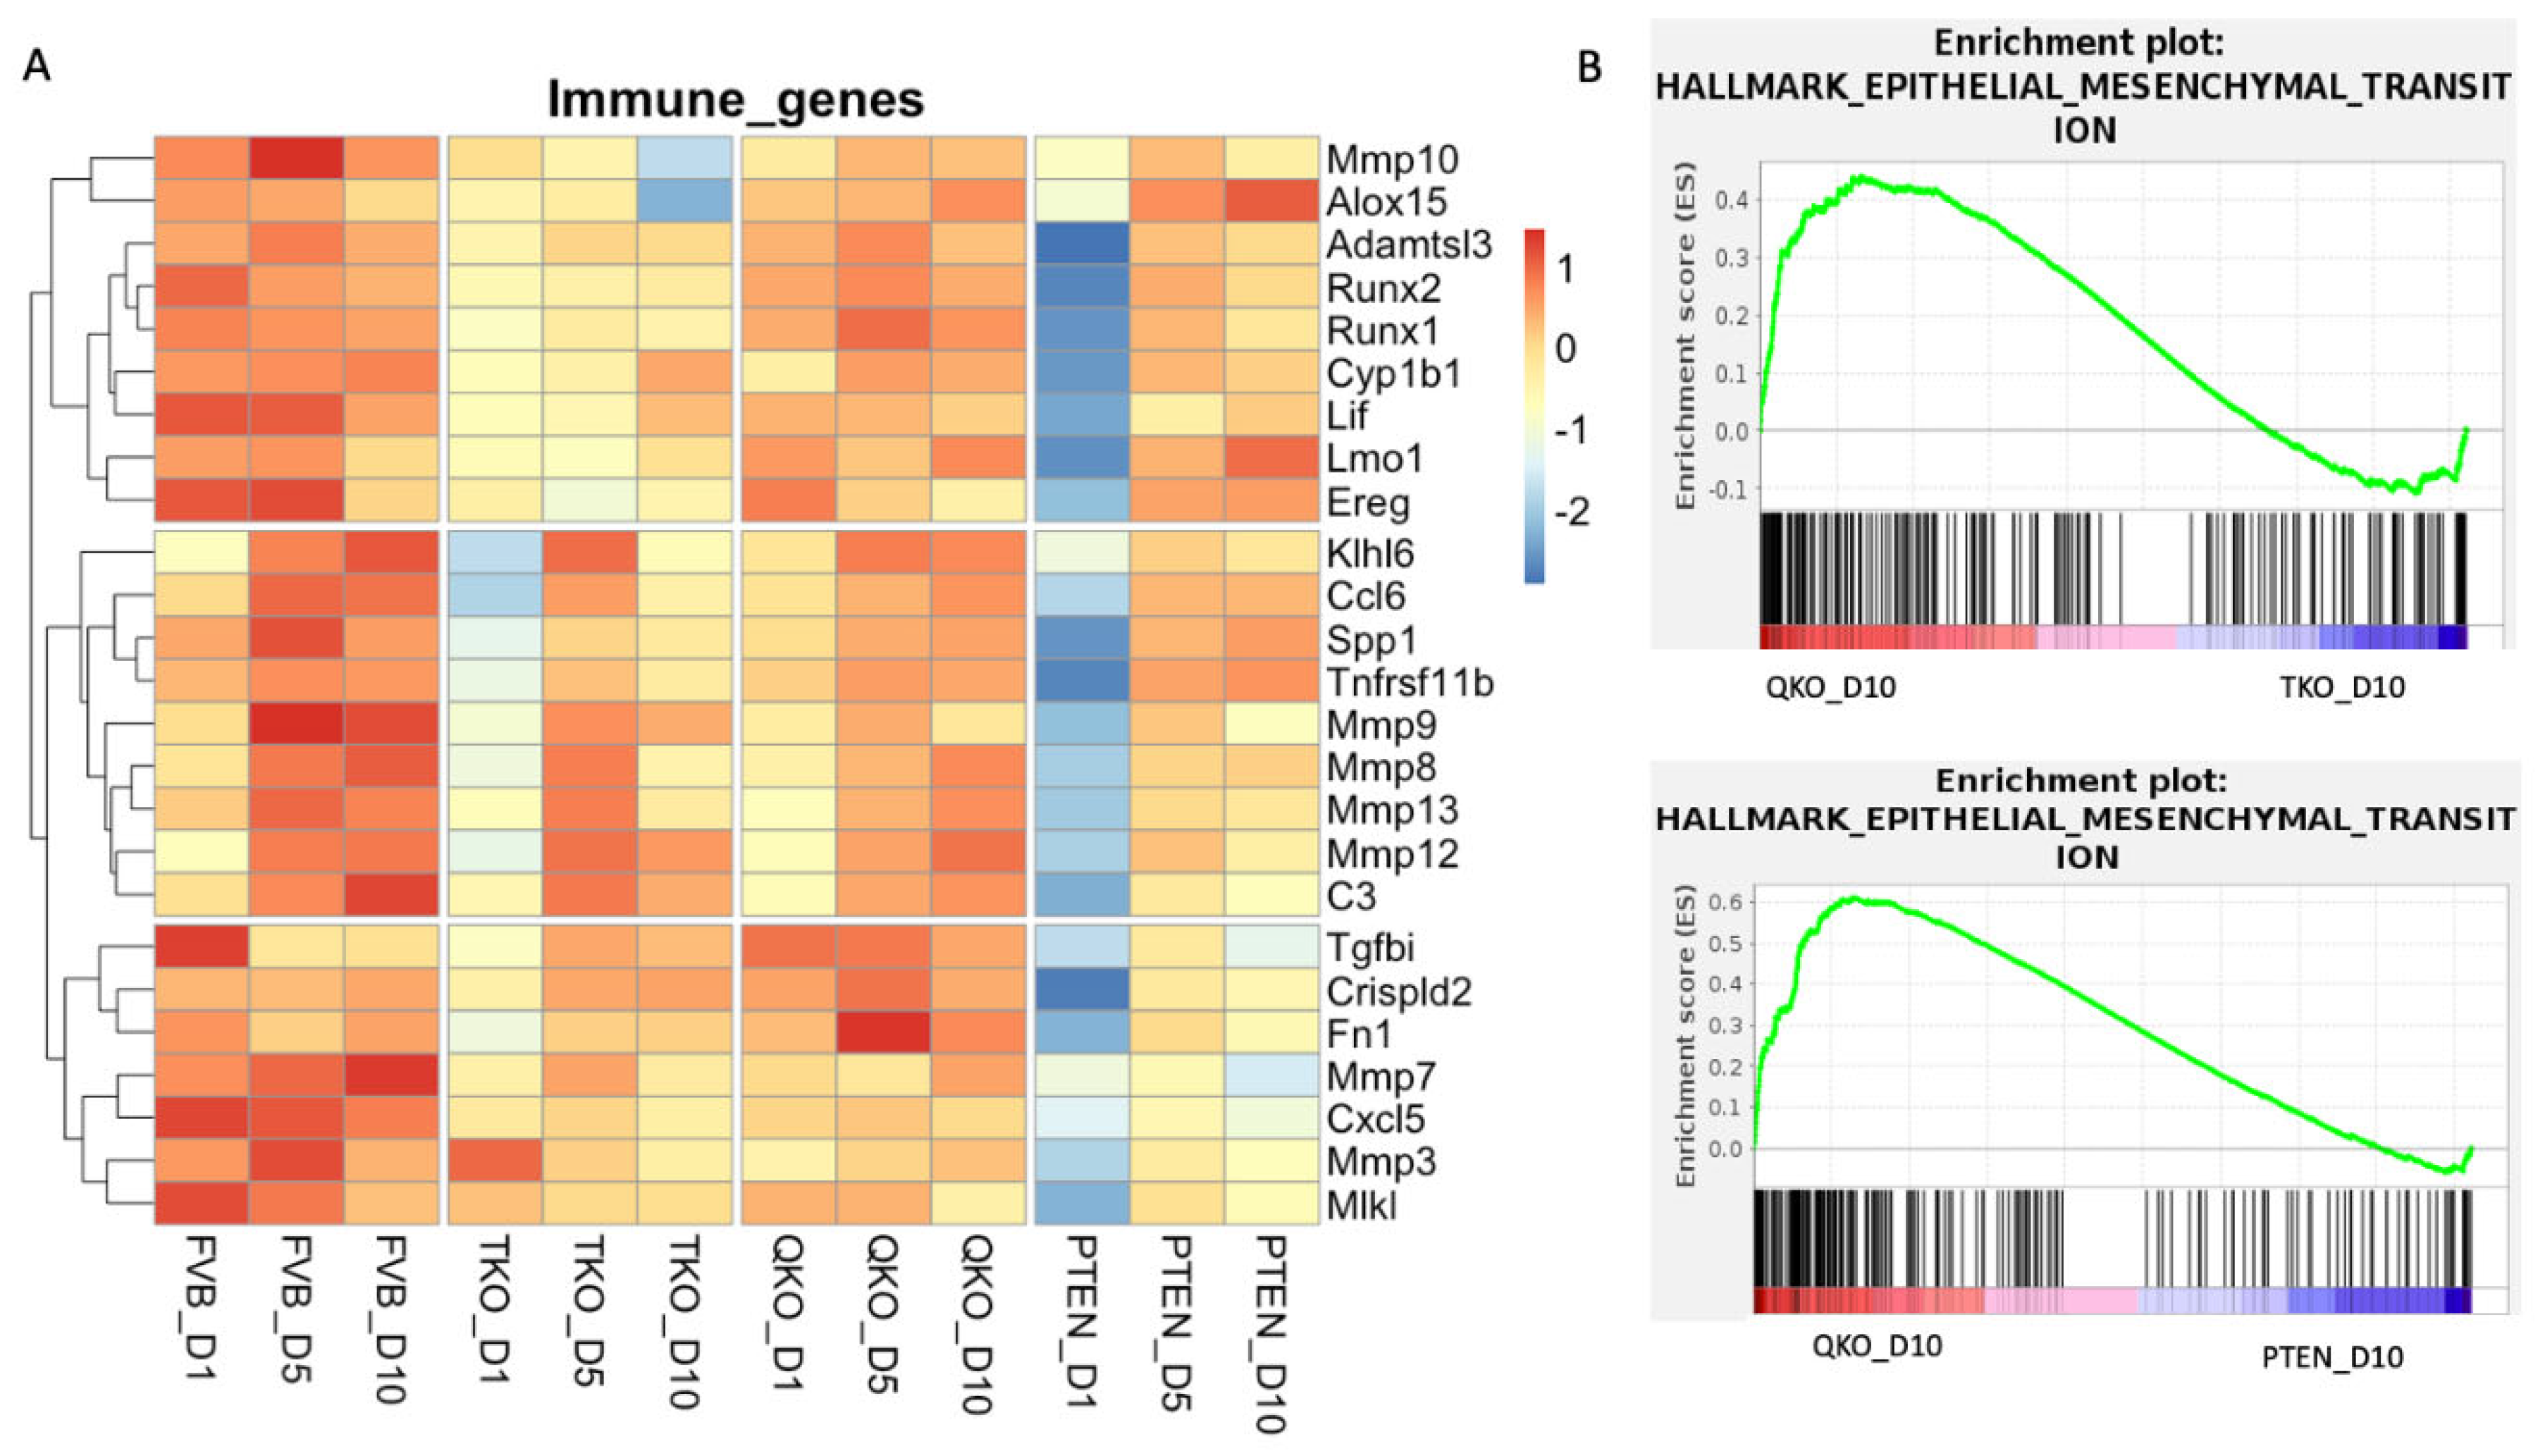
Since several forms of cataract are associated with inflammation and epithelial to mesenchymal transition (EMT), we wished to analyze our data in light of these two important drivers of lens pathology. Given our previous discovery that vitreous exposure elicits a strong innate immune response in wildtype lens epithelial explants, we investigated this response in TKO, QKO and PTEN explants through the course of 10 days of vitreous exposure using the same set of immune genes that we previously showed [24] were induced by vitreous in the wildtype explants (Figure 10 A). Wildtype explants samples showed a robust increase in immune response genes through D10, consistent with the earlier finding. QKO samples were closer to wildtype gene expression patterns for immune genes. At D1, PTEN samples exhibited a significant downregulation of immune genes, with the expression of these genes increasing somewhat at D5 and/or D10. Likewise, at D1, with the exception of Mmp3, the immune response genes examined demonstrated only weak expression in the TKO explants, though not as low as in the PTEN explants at D1. The expression of several of these immune genes (Klhl6, Ccl6, Spp1, Tnfrs11b, Mmp9, Mmp8, Mmp13, Mmp12, C3, Tgfbi, Crispld2, Fn1 and Mmp7) increased in the TKO explants at D5 where they reached their peak expression within this genotype. Overall, the expression of the immune-related genes was suppressed in the TKO relative to the wildtype explants. The QKO explants demonstrated an overall higher expression of immune related genes than the TKO explants, but lower expression than in the wildtype explants.
To comprehensively explore the expression of genes related to EMT in either the QKO versus the TKO or in the QKO versus the PTEN explants in response to vitreous containing DM, we again utilized GSEA, this time relying on the Hallmark dataset with the D10 transcriptomic data. Although EMT is often associated with pathology, when we compared wildtype FVB explants with TKO explants at D10, the wildtype explants showed an EMT enrichment score of 0.38, demonstrating that the loss of FGFRs lowered the EMT response. However, this same analysis comparing the QKO to the TKO or FVB explants resulted in an enrichment score of 0.44 and 0.30 for the QKO sample, respectively. The highest EMT enrichment score was obtained by comparing the QKO to PTEN explants where the enrichment score for the QKO sample was 0.61. This analysis demonstrated that the QKO explants exhibited the highest expression of EMT genes, surpassing the FVB, TKO, and PTEN explants (Figure 10 B).

4. Discussion

The first demonstration that fiber cell differentiation could be influenced by the ocular media came from the classic experiments by Columbre and Columbre where the reversal of the polarity of the embryonic chick lens within the eye caused the posterior-facing lens epithelial cells to elongate while the peripheral lens epithelium migrated to the anterior to form a new epithelium[55]. Later, McAvoy discovered that the active fiber-differentiation activity within the vitreous could largely be attributed to FGF[56]. However, studies have demonstrated that vitreous humor promotes a stronger differentiation response than purified FGF[57]. Although FGF and vitreous both induce a sustained ERK activation in lens epithelial explants, vitreous induces a stronger activation of AKT than does FGF[1,58].
We previously showed in lens epithelial explants that the loss of Fgfrs blocked the ability of vitreous humor to induce lens cell elongation and the accumulation of MIP, β-crystallin and γ-crystallin, but that these features were induced by vitreous in explants lacking both Fgfrs and Pten[25]. These results demonstrated in the absence of PTEN, other factors present in vitreous humor can induce lens fiber cell differentiation. We also recently conducted a transcriptomic analysis of vitreous humor-induced fiber cell differentiation in wildtype lens epithelial explants[24] showing that vitreous humor results in a progressive increase in the expression of many genes associated with fiber cell differentiation and corresponding decrease in the expression of genes associated with lens epithelial cells through five days of culture. We also showed that vitreous induced gene expression changes consistent with inflammation and EMT in lens epithelial explants. Here we did a similar study through ten days of culture to determine how the loss of Fgfrs, Pten or both Fgfrs and Pten affects vitreous-induced differentiation, inflammation and EMT response. We also sought to determine if a comparison of gene expression in explants lacking all three Fgfrs (TKO) with that in explants lacking Fgfrs and Pten (QKO) could provide insights into which RTK signals were required for vitreous-induced fiber cell differentiation in the absence of FGFR-signaling.
Although the expression of genes associated with lens fiber differentiation (for example: Hsf4, Mip, Lim2, Gja8, Gja3, Dnase2b, Crybb2, Crygs and Caprin2) increased progressively throughout the entire 10-day culture in vitreous humor-containing differentiation media (DM) in wildtype explants, this increase was largely blocked in explants lacking Fgfrs. The explants lacking only Pten exhibited a pattern of increase in the expression of genes associated with fiber cell differentiation that largely matched that of the wildtype explants, consistent with the relatively mild effect on fiber cell differentiation in vivo in mice lacking Pten in the lens[20,59]. Although the pattern of fiber cell associated gene expression in the QKO explants was lower than that of the wildtype and PTEN explants, these genes were expressed at a significantly higher level than in the TKO explants.
Vitreous-induced gene expression changes in wildtype explants results in significant alterations of chromatin structure[24]. The PRC2 repressive complex represents an important epigenetic modifier of gene expression through its ability to induce H3K27 trimethylation (H3K27me3)[60]. Within the lens, the PRC2 component EZH2 has been associated with EMT[61,62] and the prevention of cellular senescence[63]. However, recent studies have suggested that PRC2 may play an important role for suppressing the expression of genes associated with retinal development in the embryonic lens[44]. Our transcriptomic data showed an increase in the expression of many genes associated with PRC2 histone methylation through the course of DM exposure in both the wildtype and PTEN explants. This pattern of PRC2-related gene expression was blocked in the TKO explants and largely restored in the QKO explants. Many of the PRC2-related genes identified in our dataset were also reported in the lens fiber cells from the cell atlas of the human ocular anterior segment (Figure S6) confirming that these genes are normal components of the lens transcriptome[43].
With respect to genes associated with fiber cell differentiation and PRC2 histone methylation, the pattern of gene expression is most similar in the wildtype and PTEN explants, weakest in the TKO explants and intermediate in the QKO explants. It is possible that FGFR-signaling acts to open the chromatin in the relevant regions to facilitate the expression of these genes while PTEN normally acts to keep these regions in a more closed state. Histone H1 binds to the nucleosome to facilitate higher order chromatin structure associated with transcriptional repression. The C2 domain of PTEN is known to interact with the C-terminal domain of histone H1 to stabilize the association of histone H1 to the nucleosome[64,65]. The loss of PTEN also results in the hyperacetylation of histone H4 and the dissociation of heterochromatin proteins[66]. Therefore, in addition to counteracting FGFR-signaling in the cytoplasm via the dephosphorylation of PIP3 to suppress AKT activation, PTEN can act directly in the nucleus to regulate global gene transcription. FGFRs are also known to go to the nucleus, but what they do there has largely remained a mystery[67]. Furthermore, FGFR2 has been shown to directly phosphorylate PTEN on tyrosine 240 in glioma cells which affects PTEN-chromatin interactions independent of PTEN’s phosphatase activity[68]. Although further experimental evidence will be required to demonstrate direct antagonism between FGFR-signaling and PTEN with respect to chromatin structure, our data suggests this relationship.
While the lens epithelium expresses both FGFRs and PDGFRα, FGFR-signaling has been associated with fiber cell differentiation and PDGFR-signaling associated with lens maintenance of the progenitor pool of cells in lens epithelium [69]. Within the lens, PDGF-signaling induces a stronger AKT activation than does FGF-signaling, while FGFR-signaling induces a stronger and more sustained activation of ERK than is achieved by PDGFR-signaling[1,69]. This difference between signaling outputs from PDGF and FGF might also be explained by the receptor expression. While FGFR expression increases, the expression of PDGFRα declines as fiber cells begin to differentiate[5,6]. While PTEN’s inhibition of AKT activation is well known PTEN also antagonizes ERK activation as well[70,71]. During embryonic development, the ERK signaling induced by RTKs other than FGFR may be too weak to overcome the suppression by PTEN (as observed in the absence of Fgfrs in which Pten is still present). However, in the absence of PTEN-based suppression, the ERK activation by the non-FGFR RTKs is sufficient to induce a fiber cell differentiation response in the absence of Fgfrs. Although multiple RTKs may contribute to fiber cell differentiation in the absence of FGFR-signaling, our data suggests that PDGFR signaling plays a relatively more important role than IGF-1R-signaling. This is supported both by GSEA and the increase in PDGFRα expression in lens epithelial explants when Pten is deleted.
The addition of vitreous humor to wildtype lens epithelial explants induces the expression of many genes associated with immune response throughout the 10-day culture period. These same genes are expressed at significantly lower levels, particularly at day 1, in both the TKO and PTEN explants. Although the expression of these genes in the QKO explants does not reach the level seen in the wildtype explants, this genotype gives a response much closer to the wildtype than either the TKO or PTEN explants.
The induction of EMT in lens epithelial cells is strongly associated with cataract and posterior capsular opacification. In pairwise GSEA comparisons of all four genotypes (FVB, TKO, QKO and PTEN), vitreous exposure induced the lowest EMT response in the PTEN explants and highest response in the QKO explants. Wildtype lens epithelial explants (explants with Fgfrs and Pten intact) underwent an epithelial-mesenchymal transition (EMT) response when treated with vitreous[24]. Intriguingly, when both Fgfrs and Pten were absent, the EMT response was notably higher, potentially due to the upregulation of PDGFRα and the lack of PTEN-mediated inhibition. Multiple reports suggest a PDGFR-mediated EMT response[72]. However, lens explants lacking Pten surprisingly exhibited a low level of EMT. Although further experiments will be necessary to explain this discrepancy, it is possible that the loss of Pten in the lens upregulates microRNAs known to inhibit EMT, such as miR-200[73,74].

5. Conclusion

Previously, we conducted a transcriptomic analysis of lenses lacking Fgfr2, Pten or both Fgfr2 and Pten[23]. However, the cells of the embryonic lens depend on FGFR-signaling for survival[5,17,18,25], making it nearly impossible to study the interplay of FGFR-signaling and PTEN with respect to lens fiber cell differentiation in vivo. Therefore, we adopted the model of lens fiber cell differentiation in vitro using lens epithelial explants induced to differentiate with vitreous humor. This well-established model of lens fiber cell differentiation has been used with explants from chick[75,76], rat[1,28,57,77,78] and mouse[24,25]. In contrast to cells of the embryonic lens, postnatal lens cells do not require FGFR-signaling for survival making it possible to study the effects of FGFR- and PTEN-loss on the fiber differentiation process without the induction of apoptosis. We previously demonstrated that while loss of FGFR-signaling blocked vitreous-induced lens fiber cell differentiation (as measured by elongation, and the expression of MIP, β-crystallin and γ-crystallin proteins) the loss of both Fgfrs and Pten restored the ability of vitreous to induce a differentiation response[25]. Here, for the first time, we have conducted a detailed transcriptomic analysis of lens cells induced to differentiate in the absence of Fgfrs-, Pten, or both Fgfrs and Pten. Our findings support that in an Fgfr-deficient genetic background, PTEN plays a major role in preventing vitreous-induced fiber cell differentiation. Furthermore, we suggest that signaling from PDGFRα plays an important role in lens fiber cell differentiation when both Fgfrs and Pten are deleted. Furthermore, we demonstrate that intact FGFR-signaling is required for the initiation of an innate immune response induced by vitreous humor on lens epithelial explants[24]. Finally, we demonstrate that in lens epithelial explants, the loss of either Pten or Fgfrs reduced features of EMT (relative to wildtype explants) but when both Pten and Fgfrs are deleted the EMT response surpassed that of wildtype explants. These findings should provide a solid foundation for future investigations on these signaling pathways and their roles in both lens pathology and posterior capsular opacification.

Supplementary Materials

The following supporting information can be downloaded at the website of this paper posted on Preprints.org. Figure S1. Heatmap displays blind hierarchical clustering for each sample and normalized RNA-seq signal. Figure S2. Heatmap indicates z-score adjusted expression values to reveal the expression pattern of epithelial cell genes on all conditions and all time points. FVB_D1, FVB_D5 and FVB_D10 samples represent the wildtype lens epithelium culture in differentiation media for one day, five day and ten days respectively after 24 hours in culture media. TKO _D1, TKO_D5 and TKO_D10 represent the (Fgfr1-3) knockout samples cultured in differentiation media for one day, five day and ten days respectively after 24 hours in culture media. QKO _D1, QKO_D5 and QKO_D10 represent the (Fgfr1-3 and Pten) knockout samples cultured in differentiation media for one day, five day and ten days respectively after 24 hours in culture media. PTEN _D1, PTEN _D5 and PTEN _D10 represent the (Pten) knockout samples cultured in differentiation media for one day, five day and ten days respectively after 24 hours in culture media. Figure S3. Venn diagram representing common genes differentially regulated between QKO and PTEN at D10. Gene ontology terms for genes upregulated in QKO (B) and PTEN (C). Figure S4. Gene Ontology terms for 234 overlapping genes between TKO D10 down (Compared to FVB) and QKO D10 and PTEN D10 Up (Compared to TKO). Figure S5. STRING network visualizing functional interactions (edges) between proteins (nodes) between lens genes, FGFRs, Pten, PDFGRs, ERK and MAPK genes. The thickness of the edges corresponds to their score, and the default STRING clustering confidence score cutoff of 0.4 was used to determine whether two nodes were functionally related. Figure S6. The genes expressed for the genes listed in Figure 3B in human lens cells. This analysis was done using Broad Institute’s Single cell portal (reference). (A) The dot blot represents the percentage of the cell expressing the transcript in each stage. The row means value represents the expression (high red vs. low blue). Table S1. Gene Ontology analysis for Cluster T1. Table S2. Gene Ontology analysis for Cluster T2. Table S3. Gene Ontology analysis for Cluster T3. Table S4. Gene Ontology analysis for Cluster T4. Table S5. Gene Ontology analysis for Cluster T5. Table S6. Gene Ontology analysis for Cluster Q1. Table S7. Gene Ontology analysis for Cluster Q2. Table S8. Gene Ontology analysis for Cluster Q3. Table S9. Gene Ontology analysis for Cluster Q4. Table S10. Gene Ontology analysis for Cluster Q5. Table S11. Gene Ontology analysis for Cluster P1. Table S12. Gene Ontology analysis for Cluster P2. Table S13. Gene Ontology analysis for Cluster P3. Table S14. Gene Ontology analysis for Cluster P4. Table S15. Gene Ontology analysis for Cluster P5. Table S16. Table representing the detailed list of genes described in Figure 4. Table S17. Table representing the common set of genes present in TKO D10 down samples when intersected with QKO and PTEN D10 Up samples.Table S18. Table summarizing GSEA analysis for QKO_D10_vs_TKO_D10.

Author Contributions

Conceptualization, A.U. and M.L.R.; methodology, A.U., J.W., S.L.P. A.M.K, B.W..; software, A.U., A.P.; validation, A.U., M.L.R., J.W. and S.L.P.; formal analysis, A.U., A.P..; investigation, A.U.,J.W.; resources, M.L.R..; data curation, A.U., J.W. and A.P.; writing—original draft preparation, A.U., and M.L.R.; writing—review and editing, A.U., M.L.R., S.L.P., J.W. S.A.L; visualization, J.W., and S.L.P.; supervision, M.L.R.; project administration, M.L.R.; funding acquisition, M.L.R., A.U., and A.M.K. All authors have read and agreed to the published version of the manuscript.

Funding

This work was supported by National Eye Institute grants R01 EY012995 and R21 EY031092 to M.L.R. In addition, the Miami University Graduate School, Department of Biology, as well as the Miami University Doctoral-Undergraduate Opportunity Scholarship to A.K. and A.U., supported this work.

Institutional Review Board Statement

The animal study protocol was approved by the Institutional Review Board of Miami University (protocol code: 997_2024_Jun and approval date: June 4, 2021).

Informed Consent Statement

Not applicable.

Data Availability Statement

The data discussed in this publication have been deposited in NCBI's Gene Expression Omnibus (Edgar et al., 2002: https://doi.org/10.1093/nar/30.1.207) and are accessible through GEO Series accession number GSE264405. All code will be made available upon reasonable request to the authors.

Acknowledgments

We acknowledge and thank the staff (Andor Kiss and Xiaoyun Deng) of the Center for Bioinformatics and Functional Genomics (CBFG) at Miami University for instrumentation and computational support. We also acknowledge and thank Zachery Oestreicher of Center for Advanced Microscopy and Imaging for the technical support and guidance.

Conflicts of Interest

The authors declare no conflict of interest. The funders had no role in the design of the study; in the collection, analyses, or interpretation of data; in the writing of the manuscript, or in the decision to publish the results.

References

  1. Wang, Q.; McAvoy, J.W.; Lovicu, F.J. Growth Factor Signaling in Vitreous Humor-Induced Lens Fiber Differentiation. Invest. Ophthalmol. Vis. Sci. 2010, 51, 3599–3610. [CrossRef]
  2. Garcia, C.M.; Shui, Y.-B.; Kamath, M.; DeVillar, J.; Johnson, R.S.; Gerber, H.-P.; Ferrara, N.; Robinson, M.L.; Beebe, D.C. The Function of VEGF-A in Lens Development: Formation of the Hyaloid Capillary Network and Protection against Transient Nuclear Cataracts. Exp. Eye Res. 2009, 88, 270–276. [CrossRef]
  3. Orr-Urtreger, A.; Givol, D.; Yayon, A.; Yarden, Y.; Lonai, P. Developmental Expression of Two Murine Fibroblast Growth Factor Receptors, Flg and Bek. Development 1991, 113, 1419–1434. [CrossRef]
  4. Peters, K.; Ornitz, D.; Werner, S.; Williams, L. Unique Expression Pattern of the FGF Receptor 3 Gene during Mouse Organogenesis. Dev. Biol. 1993, 155, 423–430. [CrossRef]
  5. Garcia, C.M.; Yu, K.; Zhao, H.; Ashery-Padan, R.; Ornitz, D.M.; Robinson, M.L.; Beebe, D.C. Signaling through FGF Receptor-2 Is Required for Lens Cell Survival and for Withdrawal from the Cell Cycle during Lens Fiber Cell Differentiation. Dev. Dyn. 2005, 233, 516–527. [CrossRef]
  6. Potts, J.D.; Bassnett, S.; Kornacker, S.; Beebe, D.C. Expression of Platelet-Derived Growth Factor Receptors in the Developing Chicken Lens. Invest. Ophthalmol. Vis. Sci. 1994, 35, 3413–3421.
  7. Reneker, L.W.; Silversides, D.W.; Patel, K.; Overbeek, P.A. TGF Alpha Can Act as a Chemoattractant to Perioptic Mesenchymal Cells in Developing Mouse Eyes. Development 1995, 121, 1669–1680. [CrossRef]
  8. Reneker, L.W.; Silversides, D.W.; Xu, L.; Overbeek, P.A. Formation of Corneal Endothelium Is Essential for Anterior Segment Development - a Transgenic Mouse Model of Anterior Segment Dysgenesis. Development 2000, 127, 533–542. [CrossRef]
  9. Shirke, S.; Faber, S.C.; Hallem, E.; Makarenkova, H.P.; Robinson, M.L.; Overbeek, P.A.; Lang, R.A. Misexpression of IGF-I in the Mouse Lens Expands the Transitional Zone and Perturbs Lens Polarization. Mech. Dev. 2001, 101, 167–174. [CrossRef]
  10. Ash, J.D.; Overbeek, P.A. Lens-Specific VEGF-A Expression Induces Angioblast Migration and Proliferation and Stimulates Angiogenic Remodeling. Dev. Biol. 2000, 223, 383–398. [CrossRef]
  11. Reneker, L.W.; Overbeek, P.A. Lens-Specific Expression of PDGF-A Alters Lens Growth and Development. Dev. Biol. 1996, 180, 554–565. [CrossRef]
  12. Robinson, M.L.; Overbeek, P.A.; Verran, D.J.; Grizzle, W.E.; Stockard, C.R.; Friesel, R.; Maciag, T.; Thompson, J.A. Extracellular FGF-1 Acts as a Lens Differentiation Factor in Transgenic Mice. Development 1995, 121, 505–514. [CrossRef]
  13. Robinson, M.L.; Ohtaka-Maruyama, C.; Chan, C.C.; Jamieson, S.; Dickson, C.; Overbeek, P.A.; Chepelinsky, A.B. Disregulation of Ocular Morphogenesis by Lens-Specific Expression of FGF-3/int-2 in Transgenic Mice. Dev. Biol. 1998, 198, 13–31. [CrossRef]
  14. Lovicu, F.J.; Overbeek, P.A. Overlapping Effects of Different Members of the FGF Family on Lens Fiber Differentiation in Transgenic Mice. Development 1998, 125, 3365–3377. [CrossRef]
  15. Gotoh, N. Regulation of Growth Factor Signaling by FRS2 Family Docking/scaffold Adaptor Proteins. Cancer Sci. 2008, 99, 1319–1325. [CrossRef]
  16. Madakashira, B.P.; Kobrinski, D.A.; Hancher, A.D.; Arneman, E.C.; Wagner, B.D.; Wang, F.; Shin, H.; Lovicu, F.J.; Reneker, L.W.; Robinson, M.L. Frs2α Enhances Fibroblast Growth Factor-Mediated Survival and Differentiation in Lens Development. Development 2012, 139, 4601–4612. [CrossRef]
  17. Zhao, H.; Yang, T.; Madakashira, B.P.; Thiels, C.A.; Bechtle, C.A.; Garcia, C.M.; Zhang, H.; Yu, K.; Ornitz, D.M.; Beebe, D.C.; et al. Fibroblast Growth Factor Receptor Signaling Is Essential for Lens Fiber Cell Differentiation. Dev. Biol. 2008, 318, 276–288. [CrossRef]
  18. Garcia, C.M.; Huang, J.; Madakashira, B.P.; Liu, Y.; Rajagopal, R.; Dattilo, L.; Robinson, M.L.; Beebe, D.C. The Function of FGF Signaling in the Lens Placode. Dev. Biol. 2011, 351, 176–185. [CrossRef]
  19. Jerde, T.J. Phosphatase and Tensin Homologue: Novel Regulation by Developmental Signaling. J. Signal Transduct. 2015, 2015, 282567. [CrossRef]
  20. Chaffee, B.R.; Hoang, T.V.; Leonard, M.R.; Bruney, D.G.; Wagner, B.D.; Dowd, J.R.; Leone, G.; Ostrowski, M.C.; Robinson, M.L. FGFR and PTEN Signaling Interact during Lens Development to Regulate Cell Survival. Dev. Biol. 2016, 410, 150–163. [CrossRef]
  21. Guntur, A.R.; Reinhold, M.I.; Cuellar, J., Jr; Naski, M.C. Conditional Ablation of Pten in Osteoprogenitors Stimulates FGF Signaling. Development 2011, 138, 1433–1444. [CrossRef]
  22. Hertzler-Schaefer, K.; Mathew, G.; Somani, A.-K.; Tholpady, S.; Kadakia, M.P.; Chen, Y.; Spandau, D.F.; Zhang, X. Pten Loss Induces Autocrine FGF Signaling to Promote Skin Tumorigenesis. Cell Rep. 2014, 6, 818–826. [CrossRef]
  23. Padula, S.L.; Anand, D.; Hoang, T.V.; Chaffee, B.R.; Liu, L.; Liang, C.; Lachke, S.A.; Robinson, M.L. High-Throughput Transcriptome Analysis Reveals That the Loss of Pten Activates a Novel NKX6-1/RASGRP1 Regulatory Module to Rescue Microphthalmia Caused by Fgfr2-Deficient Lenses. Hum. Genet. 2019, 138, 1391–1407. [CrossRef]
  24. Upreti, A.; Padula, S.L.; Tangeman, J.A.; Wagner, B.D.; O’Connell, M.J.; Jaquish, T.J.; Palko, R.K.; Mantz, C.J.; Anand, D.; Lovicu, F.J.; et al. Lens Epithelial Explants Treated with Vitreous Humor Undergo Alterations in Chromatin Landscape with Concurrent Activation of Genes Associated with Fiber Cell Differentiation and Innate Immune Response. Cells 2023, 12. [CrossRef]
  25. Padula, S.L.; Sidler, E.P.; Wagner, B.D.; Manz, C.J.; Lovicu, F.J.; Robinson, M.L. Lens Fiber Cell Differentiation Occurs Independently of Fibroblast Growth Factor Receptor Signaling in the Absence of Pten. Dev. Biol. 2020, 467, 1–13. [CrossRef]
  26. West-Mays, J.A.; Pino, G.; Lovicu, F.J. Development and Use of the Lens Epithelial Explant System to Study Lens Differentiation and Cataractogenesis. Prog. Retin. Eye Res. 2010, 29, 135–143. [CrossRef]
  27. Zelenka, P.S.; Gao, C.Y.; Saravanamuthu, S.S. Preparation and Culture of Rat Lens Epithelial Explants for Studying Terminal Differentiation. J. Vis. Exp. 2009, doi:10.3791/1519. [CrossRef]
  28. Schulz, M.W.; Chamberlain, C.G.; de Iongh, R.U.; McAvoy, J.W. Acidic and Basic FGF in Ocular Media and Lens: Implications for Lens Polarity and Growth Patterns. Development 1993, 118, 117–126. [CrossRef]
  29. Davis, M.P.; van Dongen, S.; Abreu-Goodger, C.; Bartonicek, N.; Enright, A.J. Kraken: A Set of Tools for Quality Control and Analysis of High-Throughput Sequence Data☆. Methods 2013, 63, 41–49. [CrossRef]
  30. Ewels, P.; Magnusson, M.; Lundin, S.; Käller, M. MultiQC: Summarize Analysis Results for Multiple Tools and Samples in a Single Report. Bioinformatics 2016, 32, 3047–3048. [CrossRef]
  31. Martin, M. Cutadapt Removes Adapter Sequences from High-Throughput Sequencing Reads. EMBnet.journal 2011, 17, 10–12. [CrossRef]
  32. Kim, D.; Paggi, J.M.; Park, C.; Bennett, C.; Salzberg, S.L. Graph-Based Genome Alignment and Genotyping with HISAT2 and HISAT-Genotype. Nat. Biotechnol. 2019, 37, 907–915. [CrossRef]
  33. Frankish, A.; Diekhans, M.; Jungreis, I.; Lagarde, J.; Loveland, J.E.; Mudge, J.M.; Sisu, C.; Wright, J.C.; Armstrong, J.; Barnes, I.; et al. GENCODE 2021. Nucleic Acids Res. 2021, 49, D916–D923. [CrossRef]
  34. Pertea, M.; Pertea, G.M.; Antonescu, C.M.; Chang, T.-C.; Mendell, J.T.; Salzberg, S.L. StringTie Enables Improved Reconstruction of a Transcriptome from RNA-Seq Reads. Nat. Biotechnol. 2015, 33, 290–295. [CrossRef]
  35. Love, M.I.; Huber, W.; Anders, S. Moderated Estimation of Fold Change and Dispersion for RNA-Seq Data with DESeq2. Genome Biol. 2014, 15, 550. [CrossRef]
  36. Adams, R.P. K-Means Clustering and Related Algorithms. Princeton University 2018.
  37. Website Available online: Hartigan, J.A.; Wong, M.A. Algorithm AS 136: A K-Means Clustering Algorithm. J. R. Stat. Soc. Ser. C. Appl. Stat. 1979, 28, 100 R Core Team R: A Language and Envirronment for Statistical Computing. Available online: https//www.R-project.org/.
  38. Zhou, Y.; Zhou, B.; Pache, L.; Chang, M.; Khodabakhshi, A.H.; Tanaseichuk, O.; Benner, C.; Chanda, S.K. Metascape Provides a Biologist-Oriented Resource for the Analysis of Systems-Level Datasets. Nat. Commun. 2019, 10, 1523. [CrossRef]
  39. Subramanian, A.; Tamayo, P.; Mootha, V.K.; Mukherjee, S.; Ebert, B.L.; Gillette, M.A.; Paulovich, A.; Pomeroy, S.L.; Golub, T.R.; Lander, E.S.; et al. Gene Set Enrichment Analysis: A Knowledge-Based Approach for Interpreting Genome-Wide Expression Profiles. Proc. Natl. Acad. Sci. U. S. A. 2005, 102, 15545–15550. [CrossRef]
  40. Mootha, V.K.; Lindgren, C.M.; Eriksson, K.-F.; Subramanian, A.; Sihag, S.; Lehar, J.; Puigserver, P.; Carlsson, E.; Ridderstråle, M.; Laurila, E.; et al. PGC-1alpha-Responsive Genes Involved in Oxidative Phosphorylation Are Coordinately Downregulated in Human Diabetes. Nat. Genet. 2003, 34, 267–273. [CrossRef]
  41. Szklarczyk, D.; Gable, A.L.; Nastou, K.C.; Lyon, D.; Kirsch, R.; Pyysalo, S.; Doncheva, N.T.; Legeay, M.; Fang, T.; Bork, P.; et al. The STRING Database in 2021: Customizable Protein-Protein Networks, and Functional Characterization of User-Uploaded Gene/measurement Sets. Nucleic Acids Res. 2021, 49, D605–D612. [CrossRef]
  42. Hoang, T.V.; Kumar, P.K.R.; Sutharzan, S.; Tsonis, P.A.; Liang, C.; Robinson, M.L. Comparative Transcriptome Analysis of Epithelial and Fiber Cells in Newborn Mouse Lenses with RNA Sequencing. Mol. Vis. 2014, 20, 1491–1517.
  43. van Zyl, T.; Yan, W.; McAdams, A.M.; Monavarfeshani, A.; Hageman, G.S.; Sanes, J.R. Cell Atlas of the Human Ocular Anterior Segment: Tissue-Specific and Shared Cell Types. Proc. Natl. Acad. Sci. U. S. A. 2022, 119, e2200914119. [CrossRef]
  44. Tangeman, J.A.; Rebull, S.M.; Grajales-Esquivel, E.; Weaver, J.M.; Bendezu-Sayas, S.; Robinson, M.L.; Lachke, S.A.; Del Rio-Tsonis, K. Integrated Single-Cell Multiomics Uncovers Foundational Regulatory Mechanisms of Lens Development and Pathology. Development 2024, 151. [CrossRef]
  45. Maddala, R.; Gao, J.; Mathias, R.T.; Lewis, T.R.; Arshavsky, V.Y.; Levine, A.; Backer, J.M.; Bresnick, A.R.; Rao, P.V. Absence of S100A4 in the Mouse Lens Induces an Aberrant Retina-Specific Differentiation Program and Cataract. Sci. Rep. 2021, 11, 2203. [CrossRef]
  46. Kakrana, A.; Yang, A.; Anand, D.; Djordjevic, D.; Ramachandruni, D.; Singh, A.; Huang, H.; Ho, J.W.K.; Lachke, S.A. iSyTE 2.0: A Database for Expression-Based Gene Discovery in the Eye. Nucleic Acids Res. 2018, 46, D875–D885. [CrossRef]
  47. Shiels, A.; Bennett, T.M.; Hejtmancik, J.F. Cat-Map: Putting Cataract on the Map. Mol. Vis. 2010, 16, 2007–2015.
  48. Faber, S.C.; Dimanlig, P.; Makarenkova, H.P.; Shirke, S.; Ko, K.; Lang, R.A. Fgf Receptor Signaling Plays a Role in Lens Induction. Development 2001, 128, 4425–4438. [CrossRef]
  49. Kim, Y.-J.; Bahn, M.; Kim, Y.H.; Shin, J.-Y.; Cheong, S.-W.; Ju, B.-G.; Kim, W.-S.; Yeo, C.-Y. Xenopus Laevis FGF Receptor Substrate 3 (XFrs3) Is Important for Eye Development and Mediates Pax6 Expression in Lens Placode through Its Shp2-Binding Sites. Dev. Biol. 2015, 397, 129–139. [CrossRef]
  50. Anchan, R.M.; Lachke, S.A.; Gerami-Naini, B.; Lindsey, J.; Ng, N.; Naber, C.; Nickerson, M.; Cavallesco, R.; Rowan, S.; Eaton, J.L.; et al. Pax6- and Six3-Mediated Induction of Lens Cell Fate in Mouse and Human ES Cells. PLoS One 2014, 9, e115106. [CrossRef]
  51. Sun, J.; Rockowitz, S.; Xie, Q.; Ashery-Padan, R.; Zheng, D.; Cvekl, A. Identification of in Vivo DNA-Binding Mechanisms of Pax6 and Reconstruction of Pax6-Dependent Gene Regulatory Networks during Forebrain and Lens Development. Nucleic Acids Res. 2015, 43, 6827–6846. [CrossRef]
  52. Huang, J.; Rajagopal, R.; Liu, Y.; Dattilo, L.K.; Shaham, O.; Ashery-Padan, R.; Beebe, D.C. The Mechanism of Lens Placode Formation: A Case of Matrix-Mediated Morphogenesis. Dev. Biol. 2011, 355, 32–42. [CrossRef]
  53. Wenzel, P.L.; Chong, J.-L.; Sáenz-Robles, M.T.; Ferrey, A.; Hagan, J.P.; Gomez, Y.M.; Rajmohan, R.; Sharma, N.; Chen, H.-Z.; Pipas, J.M.; et al. Cell Proliferation in the Absence of E2F1-3. Dev. Biol. 2011, 351, 35–45. [CrossRef]
  54. Saravanamuthu, S.S.; Le, T.T.; Gao, C.Y.; Cojocaru, R.I.; Pandiyan, P.; Liu, C.; Zhang, J.; Zelenka, P.S.; Brown, N.L. Conditional Ablation of the Notch2 Receptor in the Ocular Lens. Dev. Biol. 2012, 362, 219–229. [CrossRef]
  55. Coulombre, J.L.; Coulombre, A.J. LENS DEVELOPMENT: FIBER ELONGATION AND LENS ORIENTATION. Science 1963, 142, 1489–1490. [CrossRef]
  56. Chamberlain, C.G.; McAvoy, J.W. Induction of Lens Fibre Differentiation by Acidic and Basic Fibroblast Growth Factor (FGF). Growth Factors 1989, 1, 125–134. [CrossRef]
  57. O’Connor, M.D.; Wederell, E.D.; de Iongh, R.; Lovicu, F.J.; McAvoy, J.W. Generation of Transparency and Cellular Organization in Lens Explants. Exp. Eye Res. 2008, 86, 734–745. [CrossRef]
  58. Iyengar, L.; Wang, Q.; Rasko, J.E.J.; McAvoy, J.W.; Lovicu, F.J. Duration of ERK1/2 Phosphorylation Induced by FGF or Ocular Media Determines Lens Cell Fate. Differentiation 2007, 75, 662–668. [CrossRef]
  59. Sellitto, C.; Li, L.; Gao, J.; Robinson, M.L.; Lin, R.Z.; Mathias, R.T.; White, T.W. AKT Activation Promotes PTEN Hamartoma Tumor Syndrome-Associated Cataract Development. J. Clin. Invest. 2013, 123, 5401–5409. [CrossRef]
  60. Ito, S.; Umehara, T.; Koseki, H. Polycomb-Mediated Histone Modifications and Gene Regulation. Biochem. Soc. Trans. 2024, 52, 151–161. [CrossRef]
  61. Dong, N.; Xu, B.; Xu, J. EGF-Mediated Overexpression of Myc Attenuates miR-26b by Recruiting HDAC3 to Induce Epithelial-Mesenchymal Transition of Lens Epithelial Cells. Biomed Res. Int. 2018, 2018, 7148023. [CrossRef]
  62. Zhang, L.; Wang, L.; Hu, X.-B.; Hou, M.; Xiao, Y.; Xiang, J.-W.; Xie, J.; Chen, Z.-G.; Yang, T.-H.; Nie, Q.; et al. MYPT1/PP1-Mediated EZH2 Dephosphorylation at S21 Promotes Epithelial-Mesenchymal Transition in Fibrosis through Control of Multiple Families of Genes. Adv. Sci. 2022, 9, e2105539. [CrossRef]
  63. Cui, X.; Du, C.; Wan, S.; Wu, D.; Yan, L.; Zhang, J.; Li, J.; Li, H.; Yang, Z.; Zhang, H.; et al. Deficiency of Heat Shock Factor 4 Promotes Lens Epithelial Cell Senescence through Upregulating p21 Expression. Biochim. Biophys. Acta Mol. Basis Dis. 2021, 1867, 166233. [CrossRef]
  64. Yang, J.; Yin, Y. PTEN in Chromatin Remodeling. Cold Spring Harb. Perspect. Med. 2020, 10. [CrossRef]
  65. Chen, Z.H.; Zhu, M.; Yang, J.; Liang, H.; He, J.; He, S.; Wang, P.; Kang, X.; McNutt, M.A.; Yin, Y.; et al. PTEN Interacts with Histone H1 and Controls Chromatin Condensation. Cell Rep. 2014, 8, 2003–2014. [CrossRef]
  66. Fan, X.; Kraynak, J.; Knisely, J.P.S.; Formenti, S.C.; Shen, W.H. PTEN as a Guardian of the Genome: Pathways and Targets. Cold Spring Harb. Perspect. Med. 2020, 10. [CrossRef]
  67. Tuzon, C.T.; Rigueur, D.; Merrill, A.E. Nuclear Fibroblast Growth Factor Receptor Signaling in Skeletal Development and Disease. Curr. Osteoporos. Rep. 2019, 17, 138–146. [CrossRef]
  68. Ma, J.; Benitez, J.A.; Li, J.; Miki, S.; Ponte de Albuquerque, C.; Galatro, T.; Orellana, L.; Zanca, C.; Reed, R.; Boyer, A.; et al. Inhibition of Nuclear PTEN Tyrosine Phosphorylation Enhances Glioma Radiation Sensitivity through Attenuated DNA Repair. Cancer Cell 2019, 35, 504–518.e7. [CrossRef]
  69. Li, H.; Mao, Y.; Bouaziz, M.; Yu, H.; Qu, X.; Wang, F.; Feng, G.-S.; Shawber, C.; Zhang, X. Lens Differentiation Is Controlled by the Balance between PDGF and FGF Signaling. PLoS Biol. 2019, 17, e3000133. [CrossRef]
  70. Li, Q.; Li, Z.; Luo, T.; Shi, H. Targeting the PI3K/AKT/mTOR and RAF/MEK/ERK Pathways for Cancer Therapy. Mol Biomed 2022, 3, 47. [CrossRef]
  71. Gu, J.; Tamura, M.; Yamada, K.M. Tumor Suppressor PTEN Inhibits Integrin- and Growth Factor-Mediated Mitogen-Activated Protein (MAP) Kinase Signaling Pathways. J. Cell Biol. 1998, 143, 1375–1383. [CrossRef]
  72. Jechlinger, M.; Sommer, A.; Moriggl, R.; Seither, P.; Kraut, N.; Capodiecci, P.; Donovan, M.; Cordon-Cardo, C.; Beug, H.; Grünert, S. Autocrine PDGFR Signaling Promotes Mammary Cancer Metastasis. J. Clin. Invest. 2006, 116, 1561–1570. [CrossRef]
  73. Zheng, H.; Kang, Y. Multilayer Control of the EMT Master Regulators. Oncogene 2014, 33, 1755–1763. [CrossRef]
  74. Mongroo, P.S.; Rustgi, A.K. The Role of the miR-200 Family in Epithelial-Mesenchymal Transition. Cancer Biol. Ther. 2010, 10, 219–222. [CrossRef]
  75. Vu, N.D.; Chepko, G.; Zelenka, P. Decreased Turnover of Phosphatidylinositol Accompanies in Vitro Differentiation of Embryonic Chicken Lens Epithelial Cells into Lens Fibers. Biochim. Biophys. Acta 1983, 750, 105–111. [CrossRef]
  76. Nath, P.; Getzenberg, R.; Beebe, D.; Pallansch, L.; Zelenka, P. C-Myc mRNA Is Elevated as Differentiating Lens Cells Withdraw from the Cell Cycle. Exp. Cell Res. 1987, 169, 215–222. [CrossRef]
  77. Lovicu, F.J.; Chamberlain, C.G.; McAvoy, J.W. Differential Effects of Aqueous and Vitreous on Fiber Differentiation and Extracellular Matrix Accumulation in Lens Epithelial Explants. Invest. Ophthalmol. Vis. Sci. 1995, 36, 1459–1469.
  78. Wang, Q.; Stump, R.; McAvoy, J.W.; Lovicu, F.J. MAPK/ERK1/2 and PI3-Kinase Signalling Pathways Are Required for Vitreous-Induced Lens Fibre Cell Differentiation. Exp. Eye Res. 2009, 88, 293–306. [CrossRef]
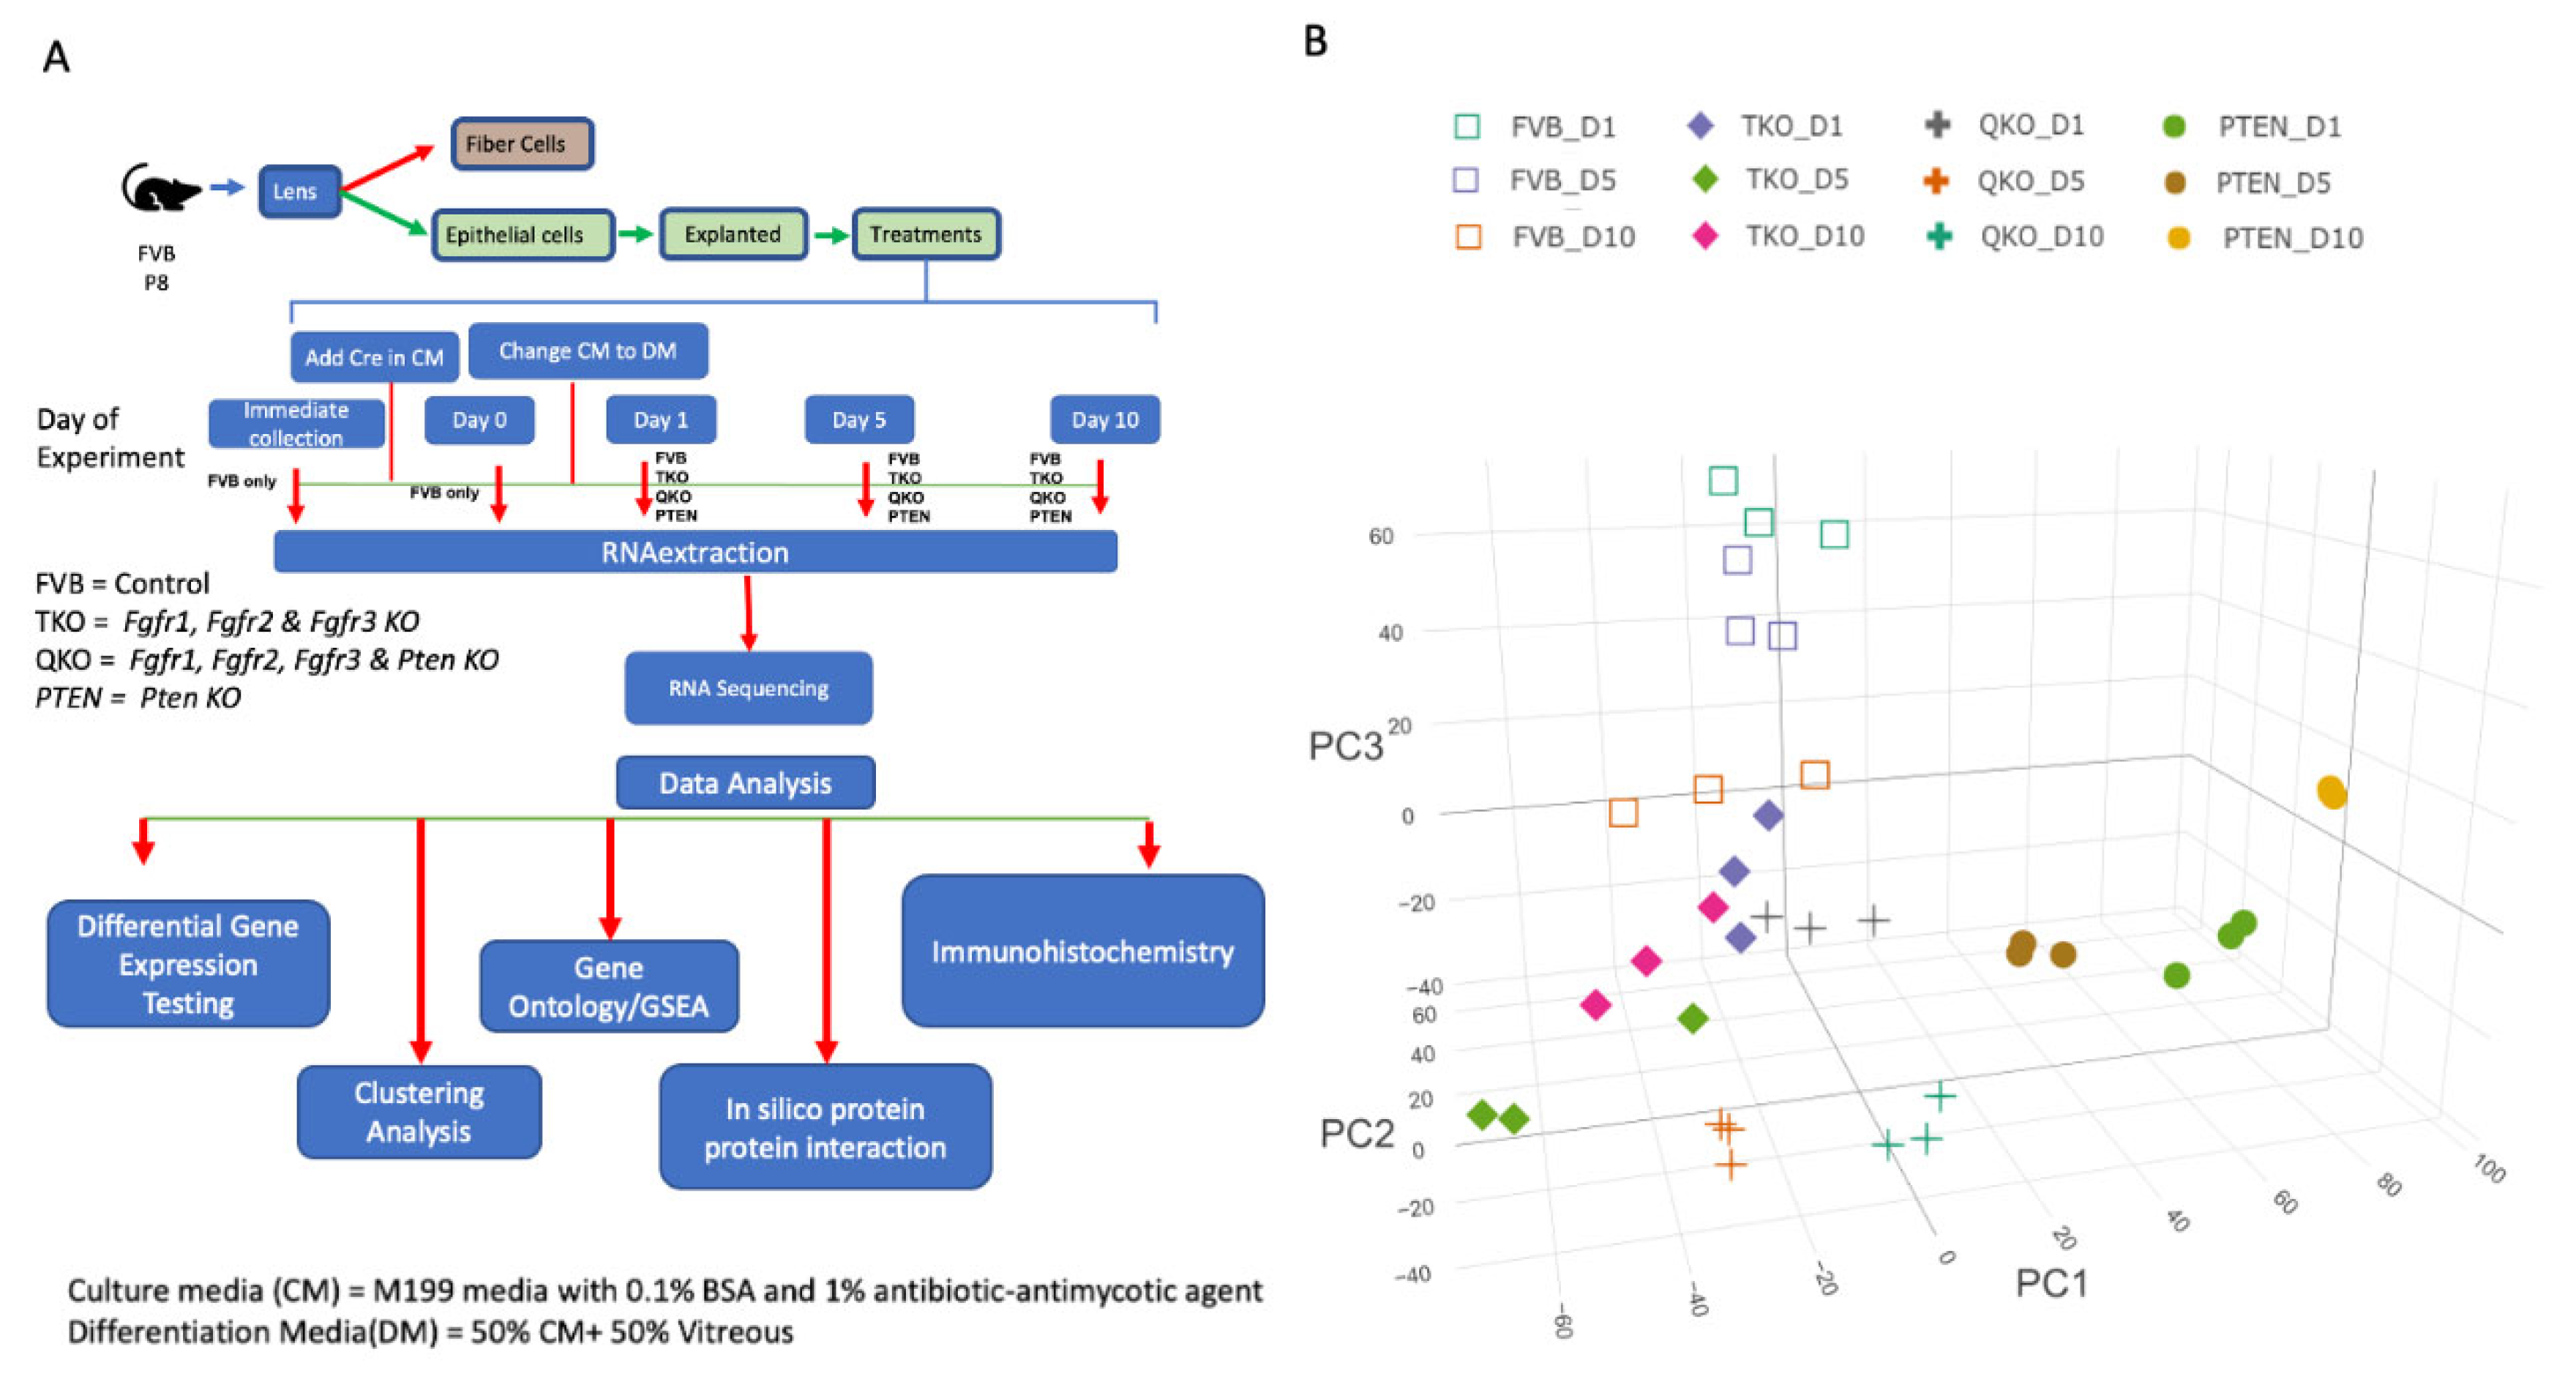
Figure 1. Profiling gene expression in lens epithelial explants. (A) Overall experimental procedure. (B) A three-dimensional principal component analysis plot shows tight clustering of the three replicates within each group. All FVB (wildtype) samples are represented by diamonds, TKO samples are represented by squares, QKO are represented by crosses and PTEN samples are represented by circles.
Preprints 104865 g001
Figure 2. Clustering of differentially expressed genes reveals a distinct signature of the transcriptome as a function of time in differentiation media (DM) within each mutant genotype. K-mean clustering was performed on all DEGs within each genotype across D1 vs D5, D1 vs D10 and D5 vs D10 comparisons by the criteria log2 fold change ≥ 1.5 and adjusted p-value (p-adjust) of ≤ 0.005, resulting in five clusters for each genotype. (A). TKO n= 1,639 DEGs, (B) QKO n= 1,708 DEGs, (C) PTEN n= 3,358 DEGs. (D) Bubble plot represents select gene ontology terms for the clusters identified for all culture conditions. The significance is plotted for each GO term representing the p-adjust value.
Preprints 104865 g002
Figure 3. The loss of Pten in Fgfr-deficient explants partially restored vitreous-induced fiber cell differentiation and induction of PRC2-related mediators of chromatin structure. (A) Heatmap indicates z-score adjusted expression values to reveal the expression pattern of fiber cell genes on all conditions and all time points. FVB_D1, FVB_D5 and FVB_D10 samples represent the wildtype lens epithelium explant culture in differentiation media for one day, five days and ten days respectively after 24 hours in culture media. TKO _D1, TKO_D5 and TKO_D10 represent the (Fgfr1-3) knockout samples cultured in differentiation media for one day, five days and ten days respectively after 24 hours in culture media. QKO _D1, QKO_D5 and QKO_D10 represent the (Fgfr1-3 and Pten) knockout samples cultured in differentiation media for one day, five days and ten days respectively after 24 hours in culture media. PTEN _D1, PTEN _D5 and PTEN _D10 represent the (Pten) knockout samples cultured in differentiation media for one day, five days and ten days respectively after 24 hours in culture media. (B) Heatmap indicates z-score adjusted expression values to reveal expression patterns of genes listed as ‘PRC2 methylates histone’ from gene ontology analysis.
Preprints 104865 g003
Figure 4. Analysis of differentially expressed genes on the D10 stage for TKO, QKO, and PTEN to identify epistatic relationships. (A) Venn diagram displays the genes differentially expressed in TKO and QKO at D10 stage. (B) Venn diagram displays the genes differentially expressed in PTEN and QKO at D10 stage.
Preprints 104865 g004
Figure 5. Venn diagram displays the differentially expressed genes in TKO, QKO and PTEN at D10 stage intersected with iSyTE database and Cat-Map database.
Preprints 104865 g005
Figure 6. QKO_D10 samples showed enrichment for PDGF signaling. (A) Gene set enrichment analysis (GSEA) was performed on normalized RNA-seq expression values from QKO_D10 and TKO_D10 samples. Genes are ordered along the x-axis based on expression rank between the two conditions. Black bars indicate genes associated with a given term. The green line indicates the enrichment score determined by GSEA. (B) Heatmap indicates z-score adjusted expression values to reveal the expression pattern of PDGF signaling genes on all conditions and all time points. Purple box represents the expression for D10 samples in TKO and QKO. (C) STRING network visualizing functional interactions (edges) between proteins (nodes) significantly enriched in the explant samples. The thickness of the edges corresponds to their score, and the default STRING clustering confidence score cutoff of 0.4 was used to determine whether two nodes were functionally related.
Preprints 104865 g006
Figure 7. PDGFRa inhibitors block the β - crystallin expression in QKO explants. Immunohistochemistry analysis of FVB and QKO explants for 5 days in DM shows the β - crystalline expression. Addition of 20 μM AG1296 (PDGFRa inhibitor) 2 hrs before the media change and in DM for 5 days blocks the robust β -crystalline expression in QKO however addition of IGF receptor (IGF-1R) inhibitor (AG1024) 5 uM failed to block the induction of β-crystallin in QKO explants.
Preprints 104865 g007
Figure 8. Immunohistochemistry analysis for vitreous induced fiber cell differentiation response in FVB, TKO (Fgfrs 1-3 knocked out), QKO (Fgfrs 1-3 and Pten knocked out samples), PTEN (Pten knocked out samples) explants in presence of PI3K inhibitor LY294002. Immunohistological stain for the fiber cell marker β-crystallin and phalloidin stain to indicate F-actin arrangement on FVB, TKO, QKO and PTEN explants following 5 days in vitreous and the selective PI3K inhibitor LY294002.
Preprints 104865 g008
Figure 9. Immunohistochemistry analysis for vitreous induced fiber cell differentiation response in FVB, TKO (Fgfrs 1-3 knocked out), QKO (Fgfrs 1-3 and Pten knocked out samples), PTEN (Pten knocked out samples) explants in presence of MEK inhibitor U0126. Immunohistological stain for the fiber cell marker β- crystallin and phalloidin stain to indicate F-actin arrangement on FVB, TKO, QKO and PTEN explants following 5 days in vitreous and the selective MEK inhibitor U0126.
Preprints 104865 g009
Figure 10. Immune response and epithelial to mesenchymal transition were significantly enriched in QKO samples. (A) Heatmap indicates z-score adjusted expression values to reveal expression patterns of immune related genes identified from our previously published manuscript for all conditions and all time points. (B) Gene set enrichment analysis (GSEA) was performed on normalized RNA-seq expression values from QKO_D10, TKO_D10 and PTEN_D10 samples. Genes are ordered along the x-axis based on expression rank between the two conditions. Black bars indicate genes associated with a given term. The green line indicates the enrichment score determined by GSEA.
Preprints 104865 g010
Table 1. Pdgfra is reduced in several gene-knockout mouse models with lens defects. The iSyTE database[46] was examined for Pdgfra expression in several gene-specific knockout mouse models that exhibit lens defects. iSyTE contains meta-analysis of microarray datasets isolated from lens tissue of Pax6cKO (Le-Cre:Pax6loxP:loxP lens conditional KO; stages embryonic day (E) 9.5, E10.5[52]), E2F1/2/3cKO (MLR10-Cre:E2F1-/-:E2F2-/-:E2F3fl/fl lens conditional KO; E17.5 and postnatal day (P) 0 (newborn)[53], Notch2cKO (Le-Cre:Notch2loxP:loxP lens conditional KO; E19.5[54]). Lens conditional knockout of Pax6 E2F1/E2F2/E2F3 and Notch2 result in significant reduction (p<0.05) of Pdgfra transcripts in lens tissue.
Mouse Model Pax6cKO Pax6cKO E2F1:2:3cKO E2F1:2:3cKO Notch2cKO
Stage E9.5 E10.5 E17.5 P0 E19.5
Pdgfra (f.c.) -1.6 6.6 -1.9 -6.4 -4.2
Disclaimer/Publisher’s Note: The statements, opinions and data contained in all publications are solely those of the individual author(s) and contributor(s) and not of MDPI and/or the editor(s). MDPI and/or the editor(s) disclaim responsibility for any injury to people or property resulting from any ideas, methods, instructions or products referred to in the content.
Copyright: This open access article is published under a Creative Commons CC BY 4.0 license, which permit the free download, distribution, and reuse, provided that the author and preprint are cited in any reuse.
Prerpints.org logo

Preprints.org is a free preprint server supported by MDPI in Basel, Switzerland.

Subscribe

© 2024 MDPI (Basel, Switzerland) unless otherwise stated