Preprint
Article

Epigenetic Reprogramming by Decitabine in Retinoblastoma

Altmetrics

Downloads

130

Views

71

Comments

0

Submitted:

26 April 2024

Posted:

26 April 2024

You are already at the latest version

Alerts
Abstract
Retinoblastoma (Rb) is a rare cancer that nonetheless represents the most common ocular malignancy in children. Rb exists as familiar and sporadic cancer and the increasing incidence of the sporadic one and its pathogenesis is mostly unknown. To date the management of retinoblastoma requires intensive chemotherapy and sometimes invasive surgery in order to preserve vision and quality of life in Rb patients. The discovery of the epigenetic nature of non-hereditable/sporadic Rb led to the development of high-throughput precision investigation strategies for the study of its epigenetic landscape. Here we investigated the effect of the demethylating 5-Aza-2’- deoxycytidine (Decitabine; DAC) agent on preclinical models to assess its possible use as anti-cancer drug in the treatment of Rb patients. We found that DAC treatment induced cell cycle arrest and apoptosis in Weri-Rb-1 cells. We investigated the variation of differential gene expression profile in Rb cells in relation to time of exposure to DAC with respect to controls. Network map analysis evidences 15 hub/driver genes, which share pathways of regulation of TNF-, FAS-, p53-dependent apoptotic signaling and NF-kB pro-survival pathways. Furthermore, a computing expression profile analysis of publicly available datasets of patients’ primary tumors and normal retina cell-derived organoids vs WeriWeri-Rb-1 DEGs depicted the relevancy of these 15 hub genes on retinoblastoma genesis. The antiproliferative effect of DAC treatment on Rb was confirmed in vivo, both in subcutaneous xenograft and orthotopic models also showing the changes the gene methylation status in treated Weri-Rb-1, shedding a new light on the reprogramming antiproliferative dynamics induced by the epigenetic therapy and on the role of this therapeutic approach to spare children sight and life.
Keywords: 
Subject: Biology and Life Sciences  -   Life Sciences

1. Introduction

Retinoblastoma is a rare aggressive pediatric ocular cancer that represents the most common ocular malignancy in children. Therapies and management of retinoblastoma require intensive chemotherapy and sometimes surgery. Survivors are often challenged with long-term morbidity and poor eye related quality of life [1]. Retinoblastoma rapidly develops in retinal immature cells initiated after biallelic loss of RB1 gene leading to RB1 inactivation in more than 95% of cases. Subsequent mutations of other RB gene family members and/or epigenetic modifications seem to play an important role in retinoblastoma tumorigenesis [2,3]. In this view, integrated analysis of genomic and epigenetic modification can help to identify new therapeutic approach in the attempt to spare children sight and life.
Epigenetic mechanisms concur at shaping cell phenotype without modifying DNA sequence and contribute to regulate tissue-specific gene expression. DNA methylation represents a sort of gene-silencing mechanism, as dense methylation of DNA promoter regions has been associated with transcriptional repression of chromatin [4]. This epigenetic mechanism enables a cellular response to environment, which is transient and allows for a functional re-organization of genome preserving DNA integrity. Recent advances in epigenomics have identified methylation as one of the key mechanisms by which epigenetic regulation contribute to cancer progression and has become a target mechanism to interfere with cancer development and progression [5]. Therefore, targeting epigenetic mechanisms in cancer therapy can be expected, by leveraging on the reversible nature of the epigenetically induced changes in gene expression.
Epigenetic modulating drugs are a reality in hematological malignancies and deserve adequate attention in solid tumors [6,7,8,9]. Demethylating agents, such as the DNA methyltransferase inhibitor decitabine (5-aza-2’-deoxycytidine), act towards the correction of epigenetic defects, inducing the re-expression of silenced genes, mainly tumor suppressor genes, involved in controlling apoptosis and those biological processes leading to the genesis of cancer [10,11,12]. Recent studies point at several pathways to be regulated by methylation in retinoblastoma [13,14,15,16], however little is known about the role of timing for the action of demethylating agents for reverting the transcriptional inhibition of tumor suppressor genes inactivated in this tumor. Previously we demonstrated the contribution of aberrant hypermethylation in human sporadic retinoblastoma [3], suggesting that treatment with the demethylating agent Decitabine (DAC) could represent a successful therapy. As well, the efficacy of this epigenetic therapy was analyzed through integrative network approaches and those evidences were validated as potential targets for new therapeutic strategies [17].
Here we describe how Decitabine induces an antiproliferative effect in retinoblastoma cells by influencing the up or down regulation of expression of key retinoblastoma related genes either by inducing a direct switch on of epigenetically locked genes or by an indirect regulation of other linked ones, in retinoblastoma cells. We show the network and interactome maps of selected differentially expressed key hub genes in DAC treated retinoblastoma cells to describe their pivotal role in the genesis of retinoblastoma. We verified their relevance through a computing expression profile analysis of publicly available datasets of patients’ primary tumors and normal retina cell-derived organoids. Finally, we describe the anti-proliferative effect of DAC treatment in subcutaneous and orthotopic xenograft retinoblastoma mice models confirming the expression patterns of DEG genes in vivo.

2. Results

2.1. In Vitro Anti-Proliferative Effect of DAC on Weri-Rb-1 Cells

The in vitro efficacy of 2.5 µM DAC treatment was tested on retinoblastoma Weri-Rb-1 cell line. The cell cycle profile observed from 24 up to 72 h, indicated that DAC induced an increase of percentage of sub G1 phase at 72 hours in treated cells (32.8 ±2.2) compared to controls (9.2 ± 2.2),) showing a significant interaction between time of exposure and treatment (*p<0.05). Conversely, the percentage of G0-G1 phase was significantly reduced in treated cells (43.03 ±2.5) with respect to controls (63.9 ±1.69) (**p<0.005) [18,19]) (Figure 1a). To assess if the treatment induced the activation of apoptotic response and to quantify the number of cells undergoing apoptosis, Annexin V and PI staining was used and measured by flow cytometry. We observed that DAC causes an activation of programmed cell death in Weri-Rb-1 cells at 72 hour of treatment, when the interaction between treatment and time induced a significant increase in the percentage of early apoptotic (14.5 ±0.9) and late apoptotic cells in treated samples (56.1±3.2%) with respect to control ones (2.3 ± 0.3 and 7.3 ±0.9% respectively) (Figure 1b)

2.1.1. Gene Expression Profile after DAC Treatment in Weri-Rb-1 Cells

In order to better characterize the effect of Decitabine (DAC) on Weri-Rb-1 cells and to identify which pathways are influenced by the demethylating treatment, PIQORTM Cell Death Human Sense Microarrays were used to screen gene expression time-related profile of cells exposed to DAC.
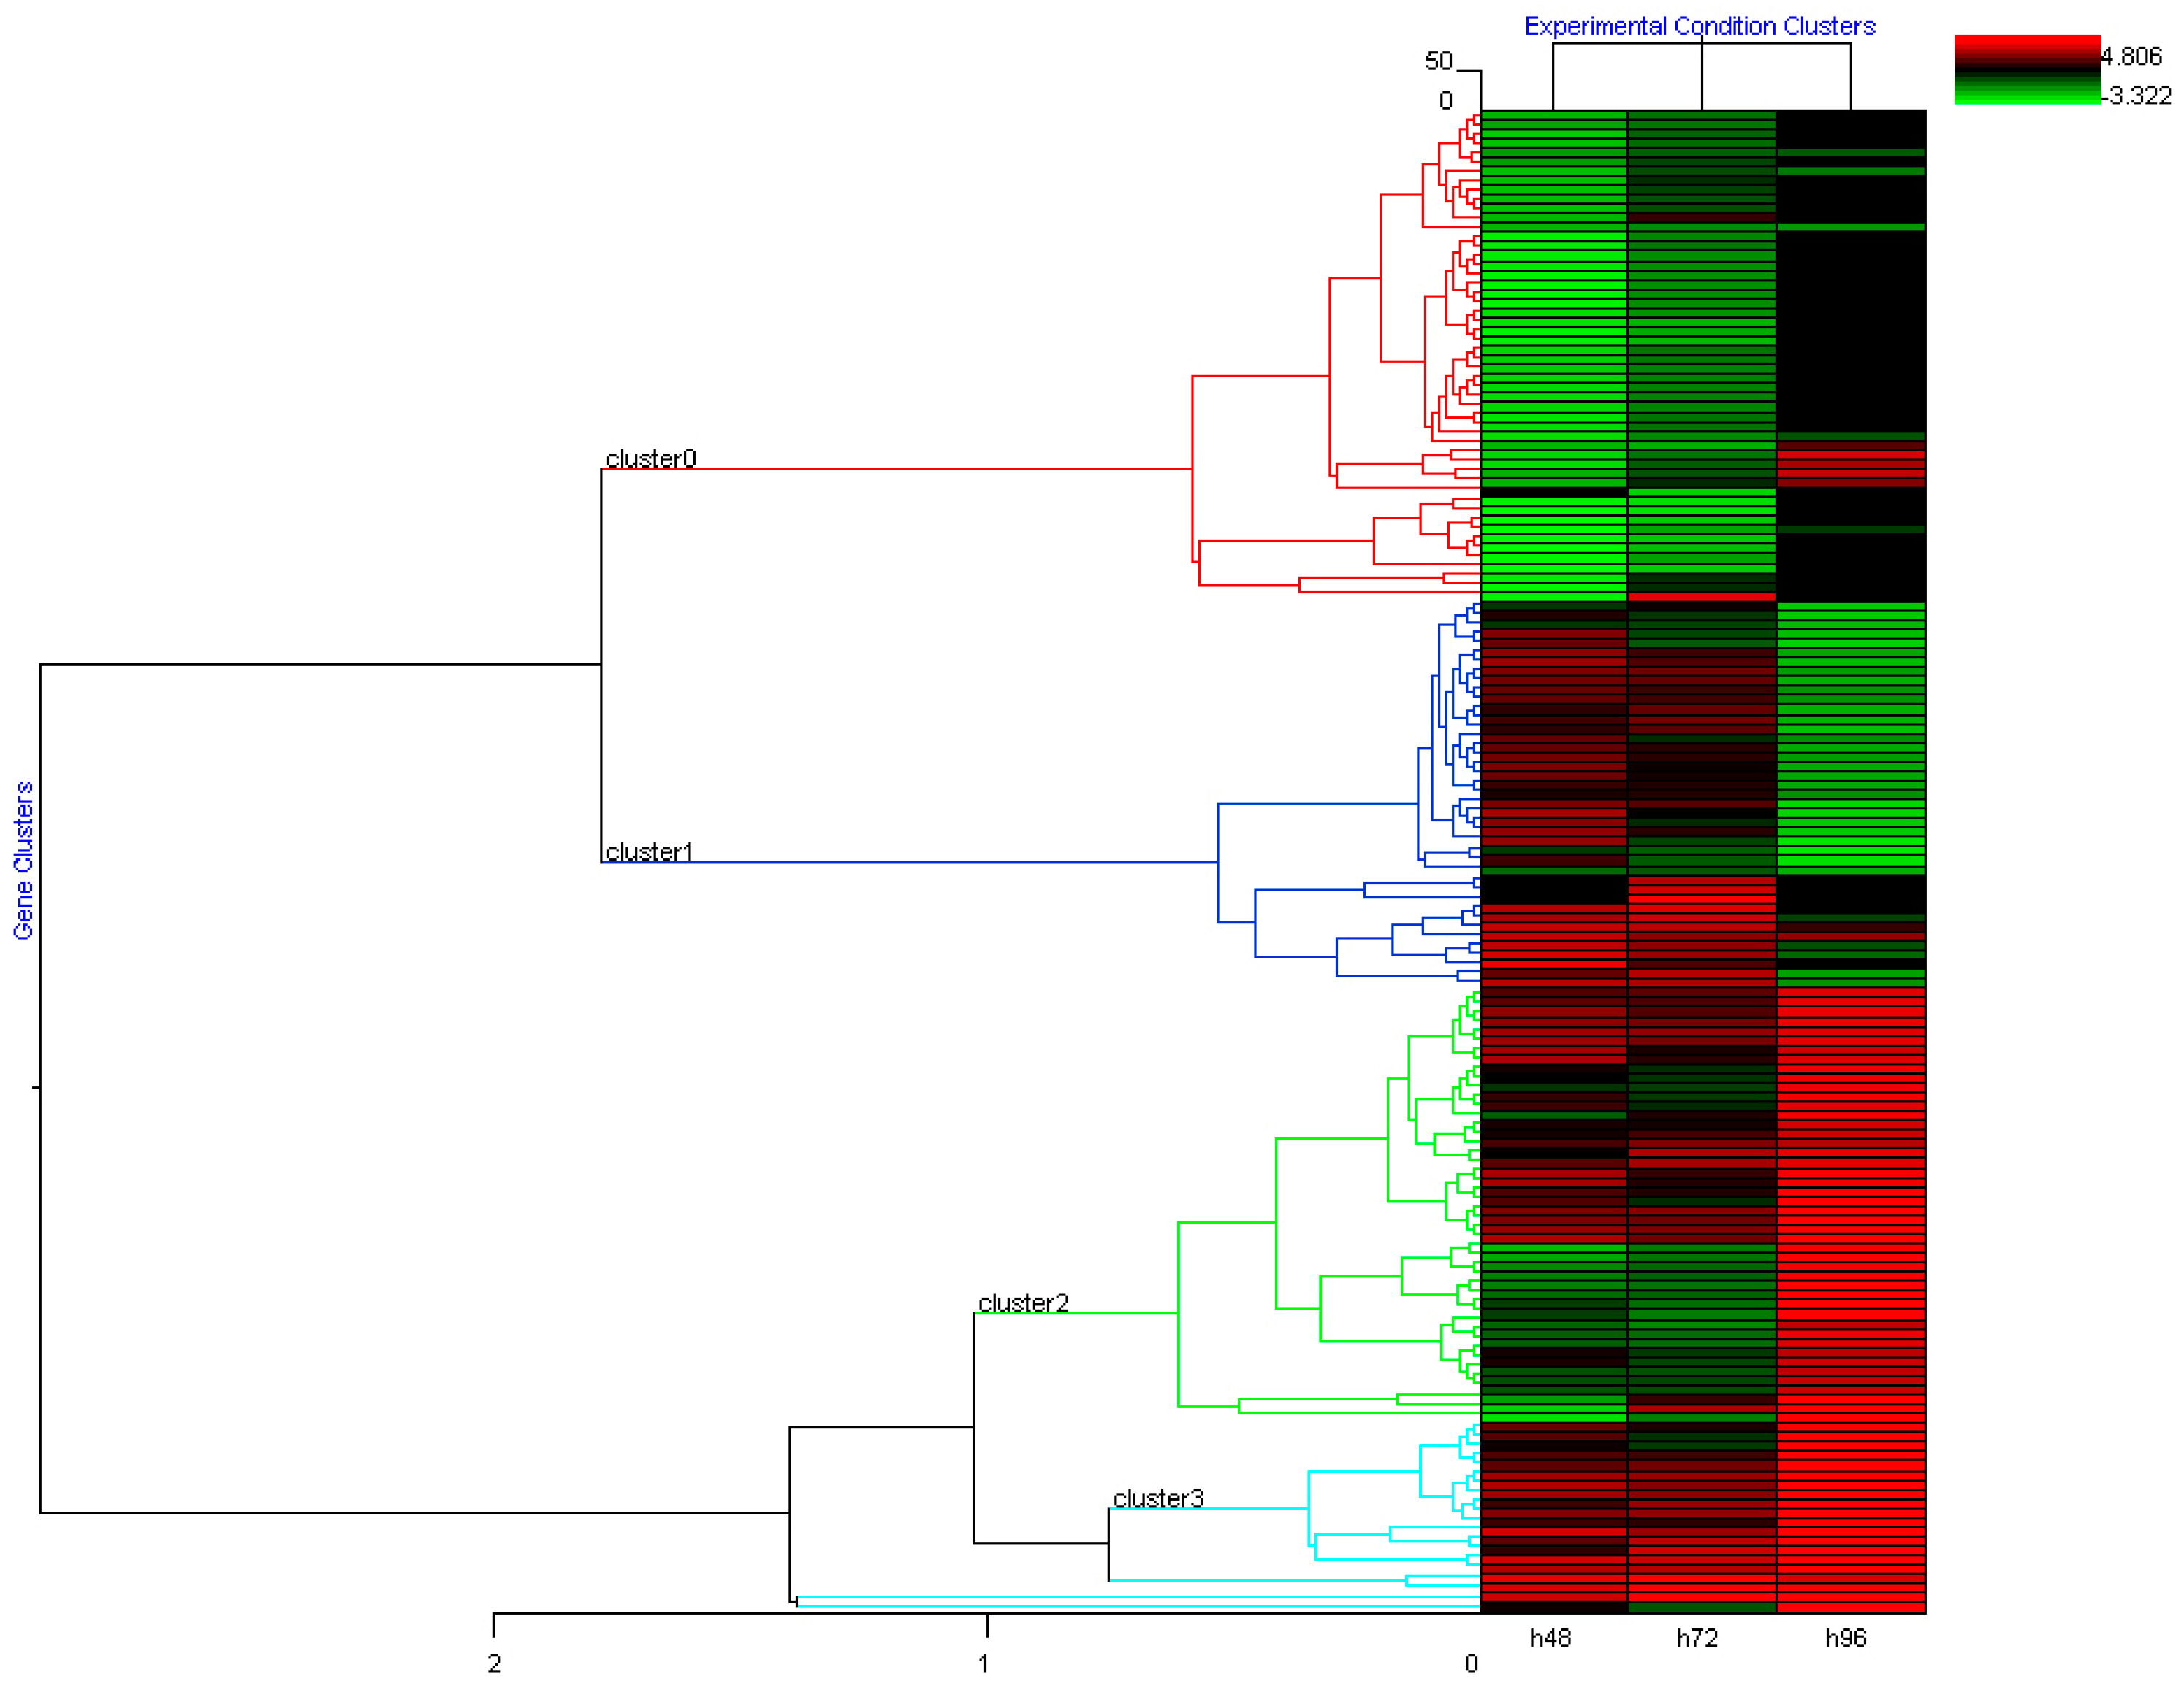
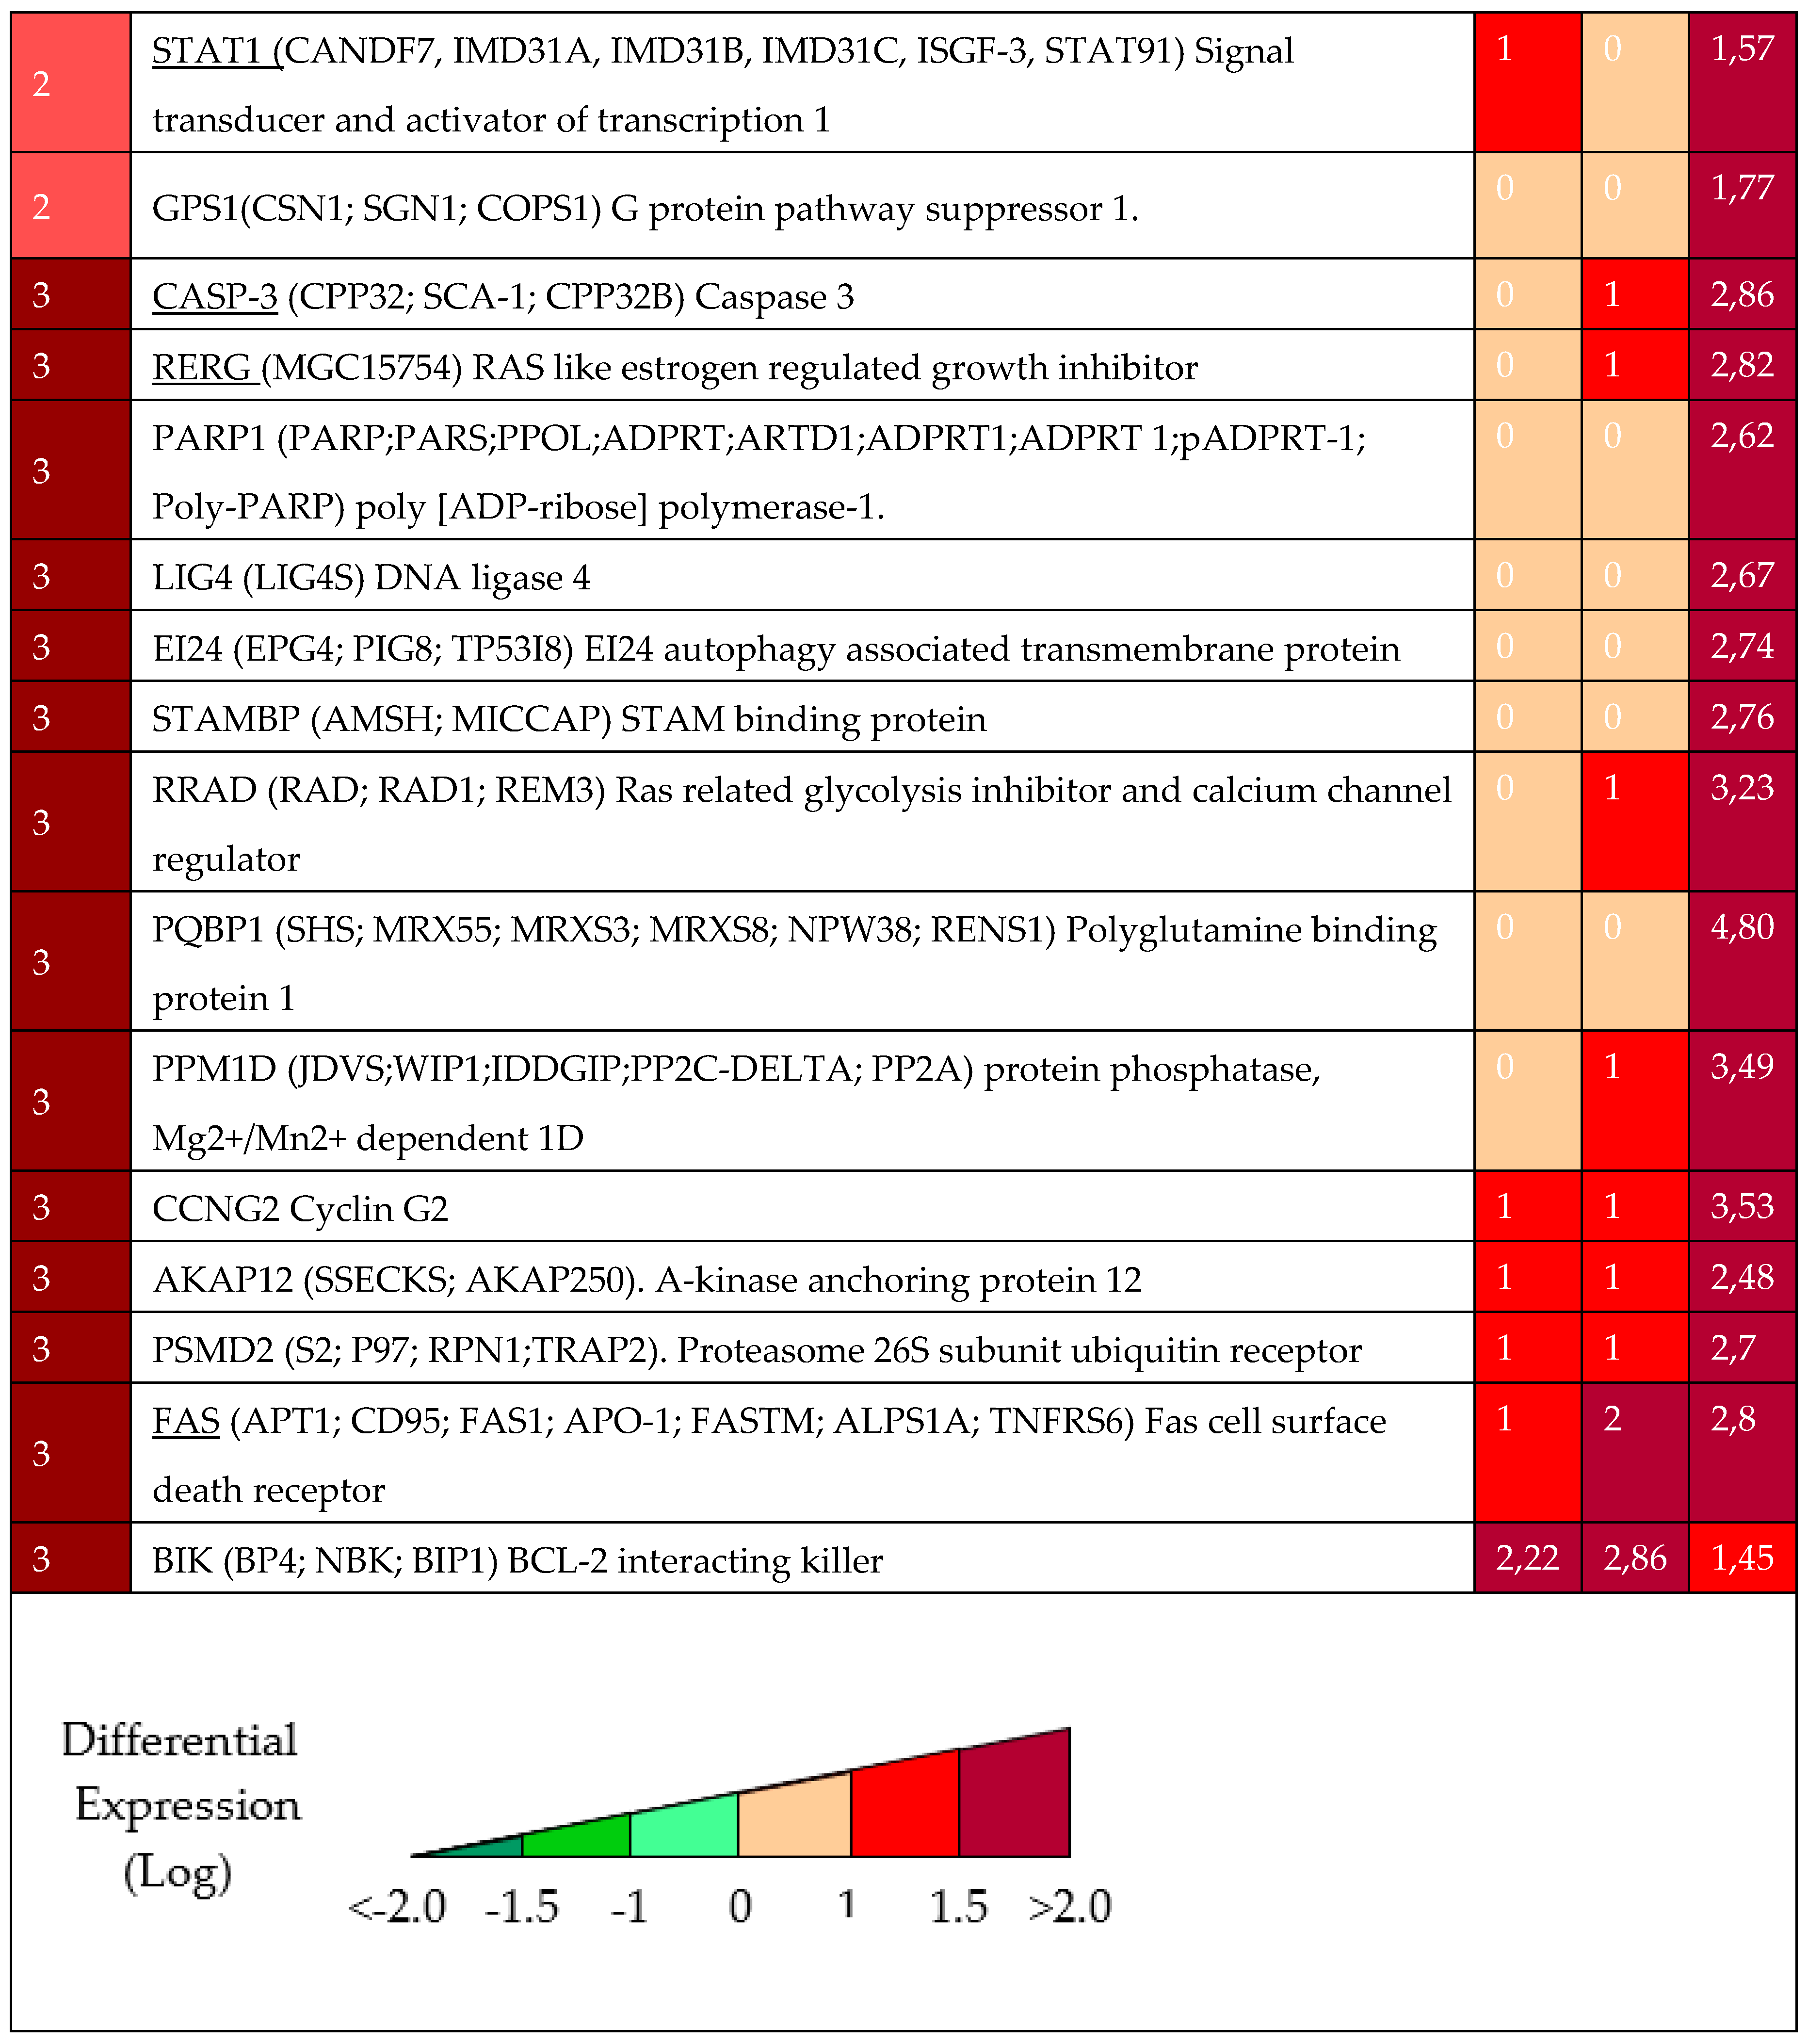
To interpret the data derived from c-DNA-microarray we applied the hierarchical clustering algorithm, which groups the differential expression values emphasizing the presence of co-regulated clusters of genes. During the analysis, the hierarchical clustering algorithm was able to identify 4 different clusters as reported in Figure 2. Cluster 0 grouped all genes whose expression is downregulated after treatment with DAC. The differential expression values of most of these genes are significant at 48 hours with log (FC) value spanning from -2 to -3.30. Cluster 1 includes the up-regulated genes which showed differential logarithmic expression values ≥ 2 at early stages (48 hours) and whose transcript level did not exceed 2-fold threshold afterwards (96 hours). On the other hand, genes whose expression is activated at 96 hours after DAC exposure, with a differential log (FC) value spanning from +1.7 to +2.0 are pooled in Cluster 2. Finally, Cluster 3 grouped genes whose expression is mostly activated at the late stage with log (FC) value spanning from +2.7 to +4.8 at 96 hours. Table 1 reports the list of the most representative identified genes. In particular, exposure to DAC induced up-regulation of genes involved in two main pro-apoptotic pathways acting in parallel and in the suppression of genes involved in pro-survival. The first pathway includes the early over-expression of several apoptotic mediating surface antigens (including TNFRS6/FAS, DAP3 and TRAMP receptors), the activation of intracellular pro-apoptotic signaling (i.e. PSMD2 alias TRAP2 signal transducer, ALG2 and GAPD) and it ultimately results in the activation of the Caspases cascade (e.g Caspases 8, 3 and 6). At the same time, the p53-dependent pathway (which includes P21/WAF1, CDC10, PIG8 and BAX transactivation) is active and triggers, in combination with other mechanisms (e.g BIK, a p73-dependent repression of BCL-XL), the cytochrome C release. Moreover, also genes involved in cell cycle arrest, like GADD34 alias PPP1R15A, STAT1 and p21/Waf1 are overexpressed starting from 48hr after treatment. On the other hand, a strong down-regulation of pro-survival signals at short latency after treatment (48hr) has been evidenced. These signals include several pro-mitogenic mediating surface molecules (RASL10B, TOLLIP and TRAF2), intracellular MAPK signals (MAPK8IP2-1, MAPK12, IRAK1, IKKB and NFKB3) and intracellular anti-apoptotic mediators (BCL2L1, MKL1, JUNB, BIRC5 alias Survivin and c-FOS). The concomitant activation and de-activation of all these pathways could explain the effective anticancer activity of DAC in Rb.
A significant overexpression of genes involved in DNA repair signaling (e.g PARP-1 and DNA LIGASE IV) together with tissue-specific genes, PPM1D (photoreceptor-related gene) and AKAP12 (hemato-retinal barrier related gene) occurs later (96hr) suggesting a possible reprogramming activity of DAC in remained alive cells.
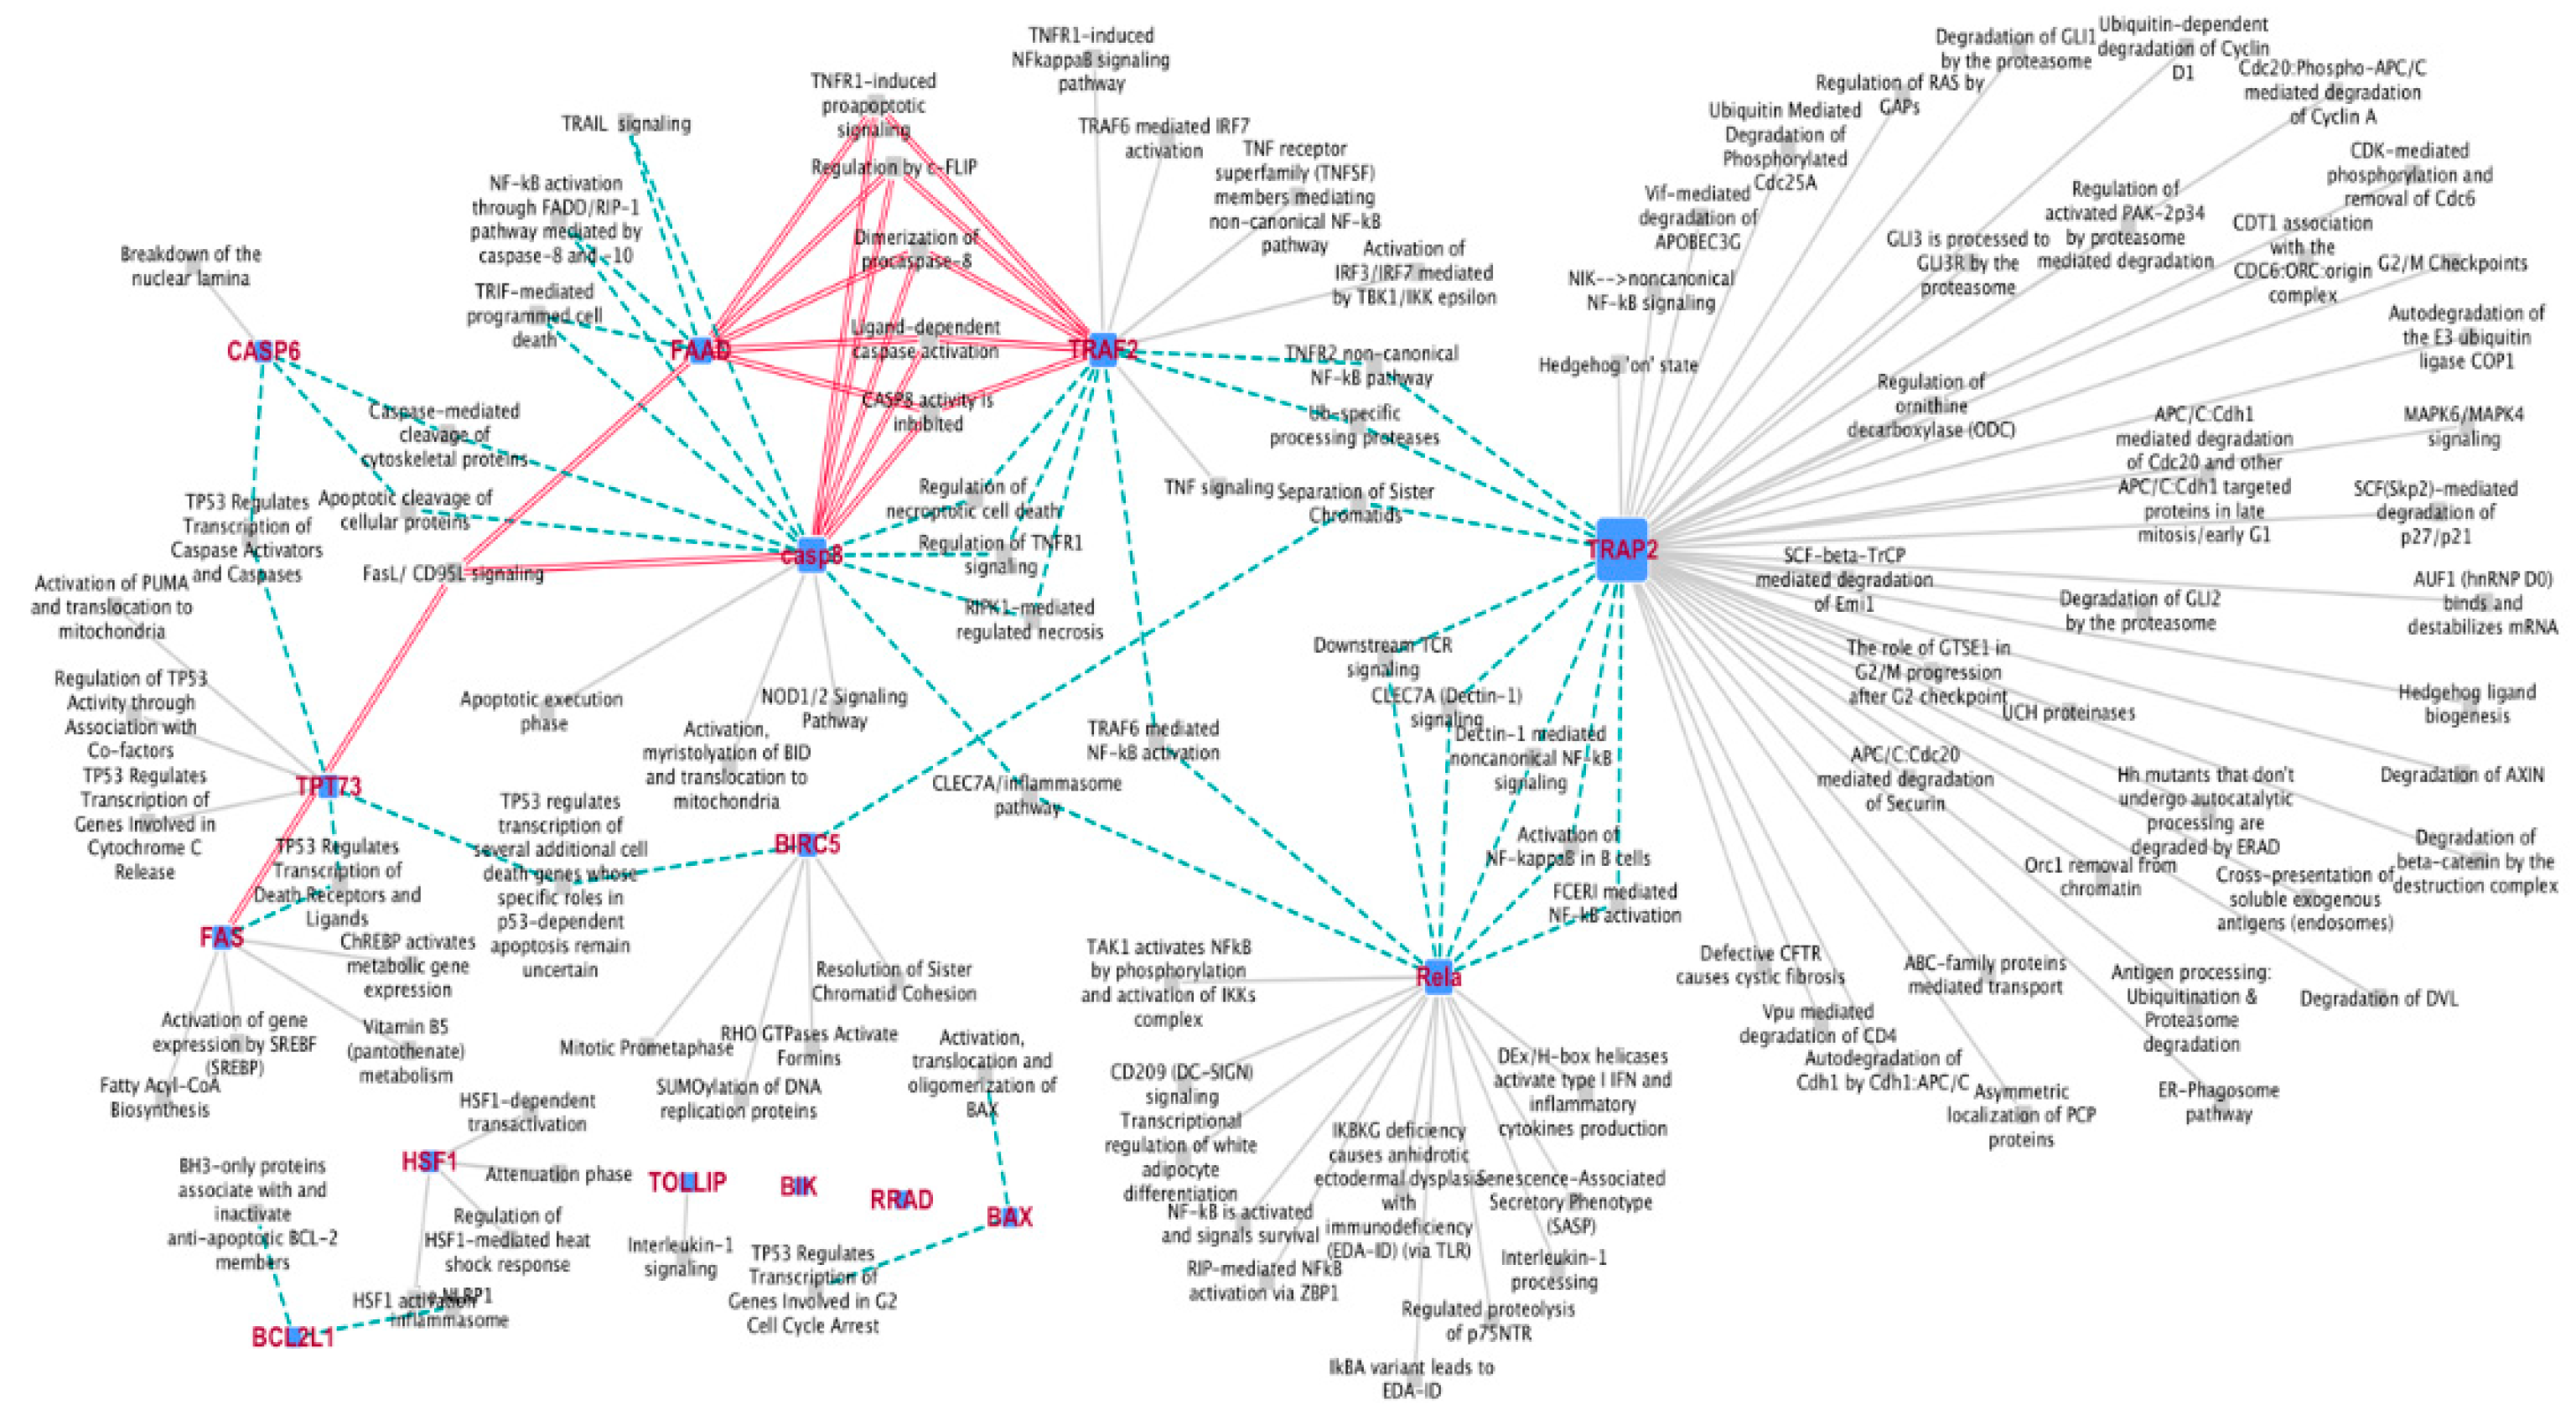
Network map analysis evidenced 15 hub/driver genes strictly interconnected, which share a high number of pathways mostly related to regulation of TNF-, FAS-, p53-dependent apoptotic signaling and NF-kB pro-survival pathways (Figure 3). Furthermore, the interactome analysis of these 15 hub genes highlights their central role in regulating numerous proteins/factors (Figure S3). In particular, the oncogene TRAF2, RELA alias NFKB3 and BIRC5 alias Survivin, which exert pivotal roles in pro-survival activities and result early down regulated after DAC treatment, show a large number of interactions among their neighbors. Similarly FAS and CASP8, involved in extrinsic apoptosis regulating pathways, as well as BAX, BCL2L1, HSF and CASP6, which have relevant role in the intrinsic apoptosis, show a high number of interactions with proteins/factors regulating the cell fate.

2.1.2. Validation of 15 Hub Genes Expression by qPCR Analysis

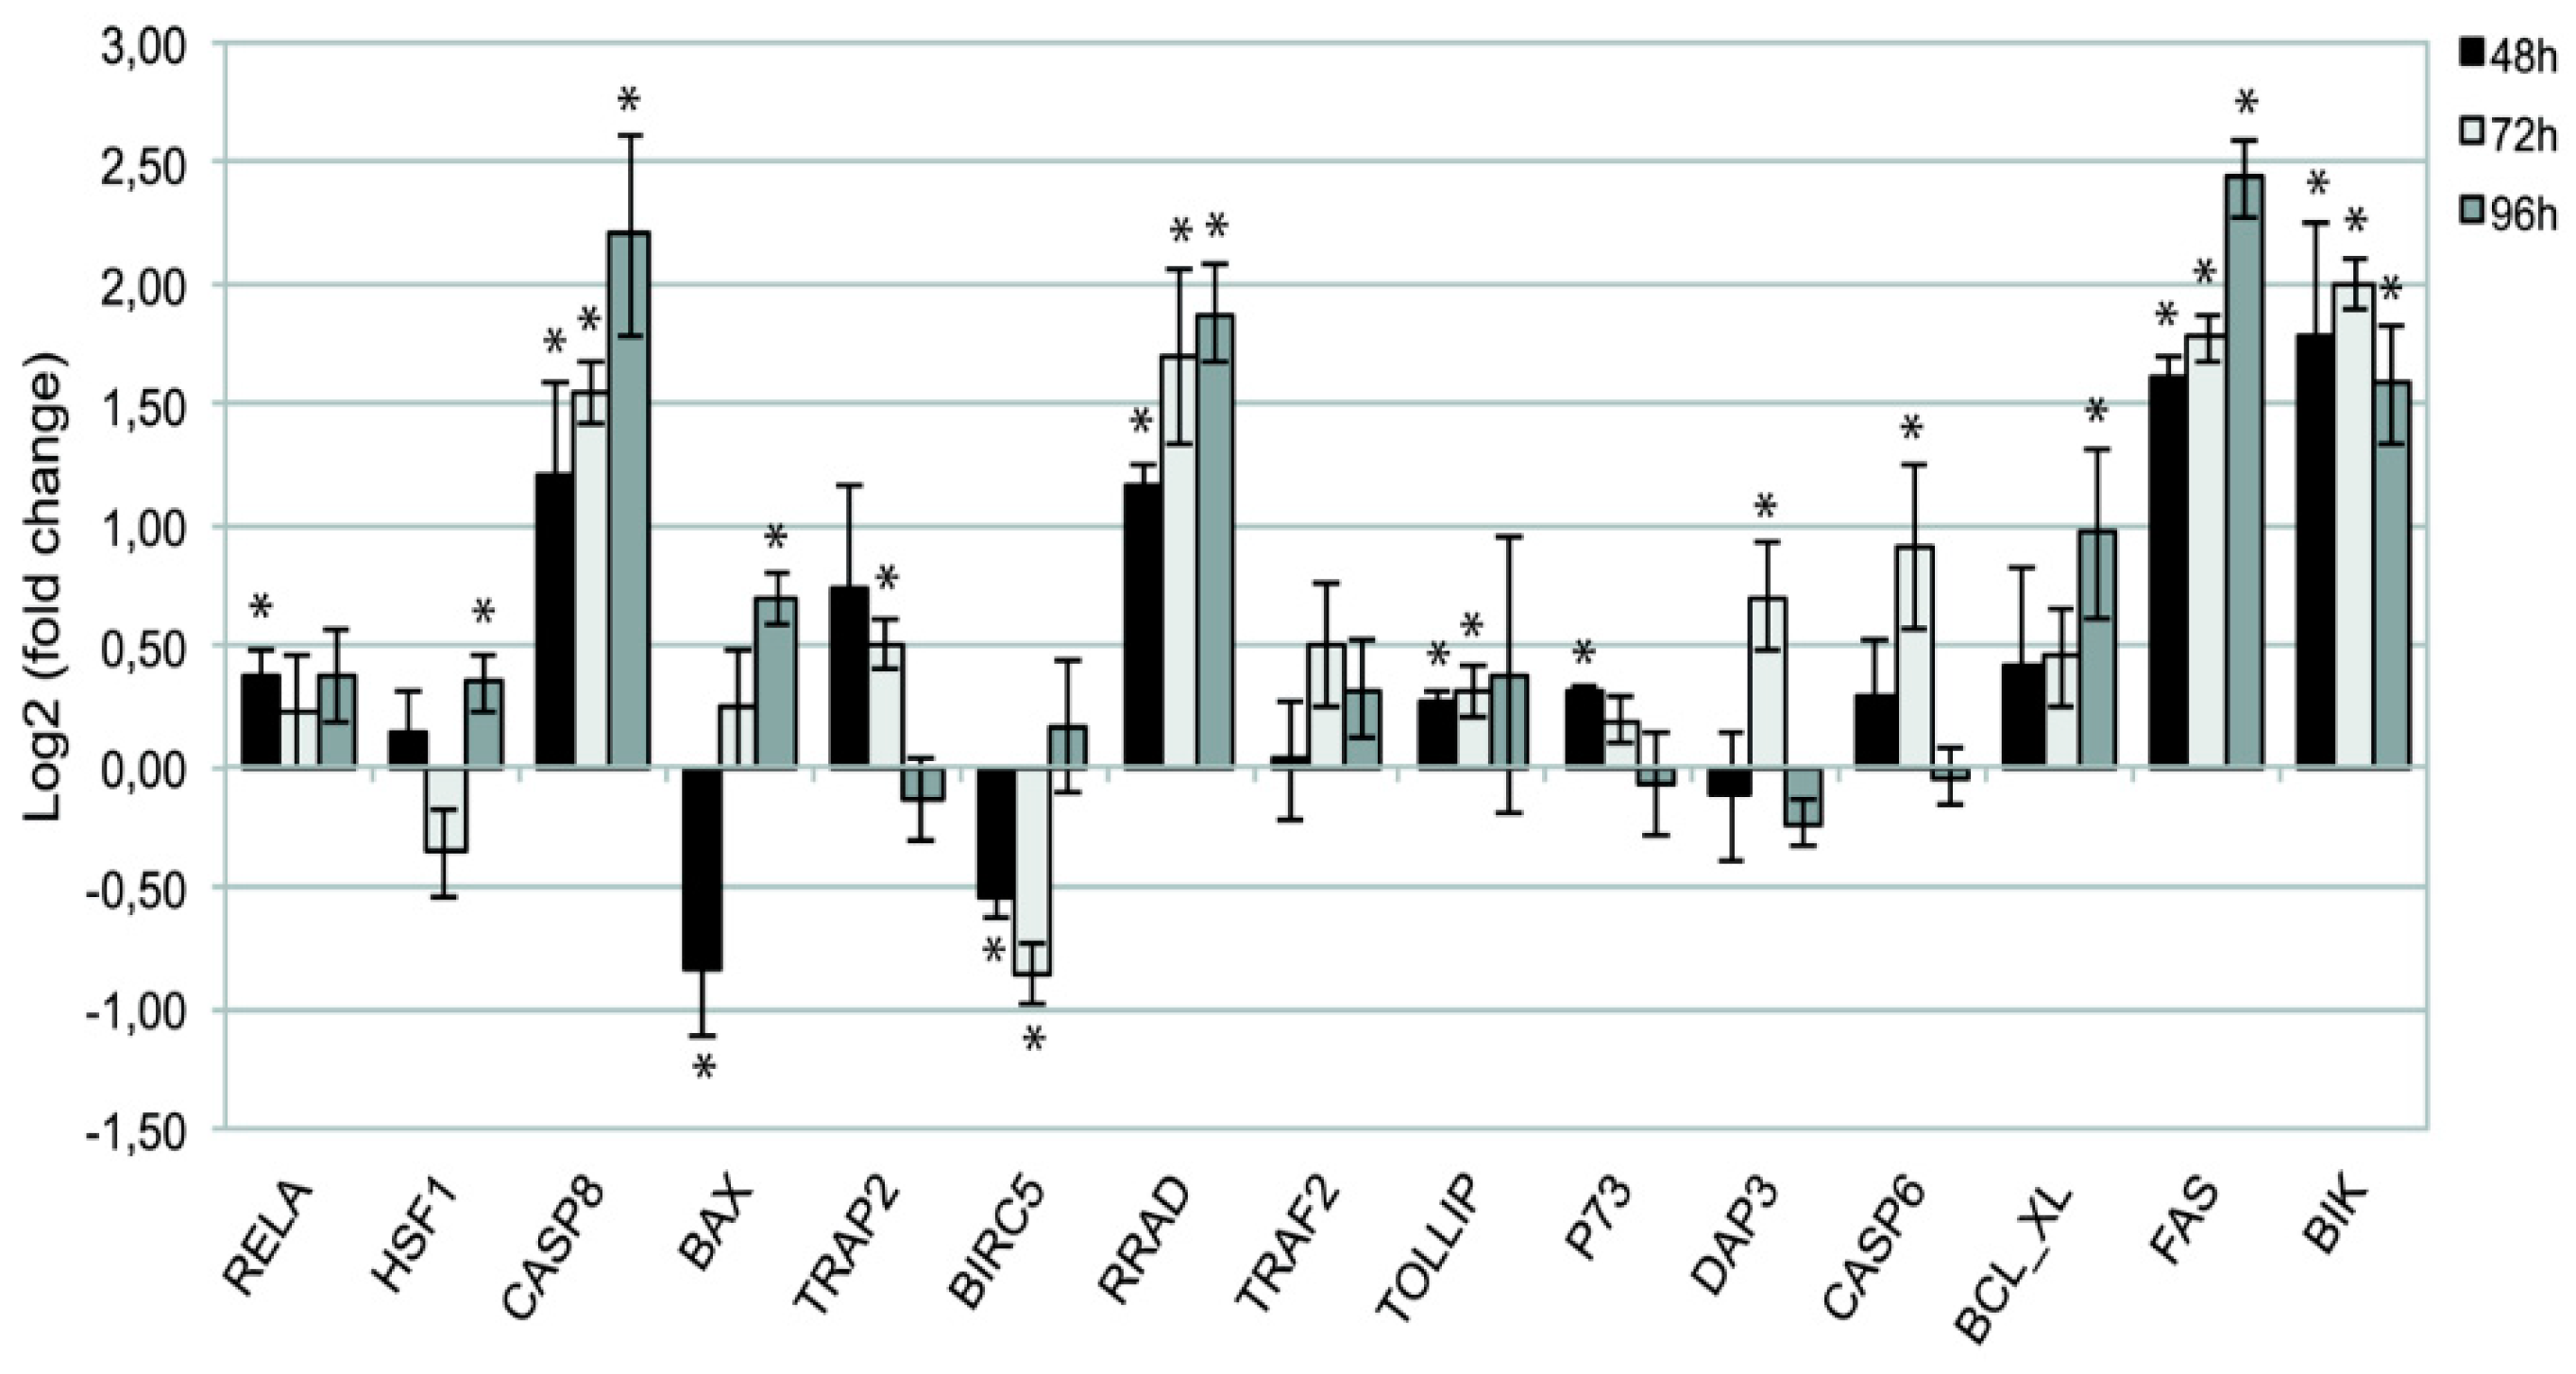
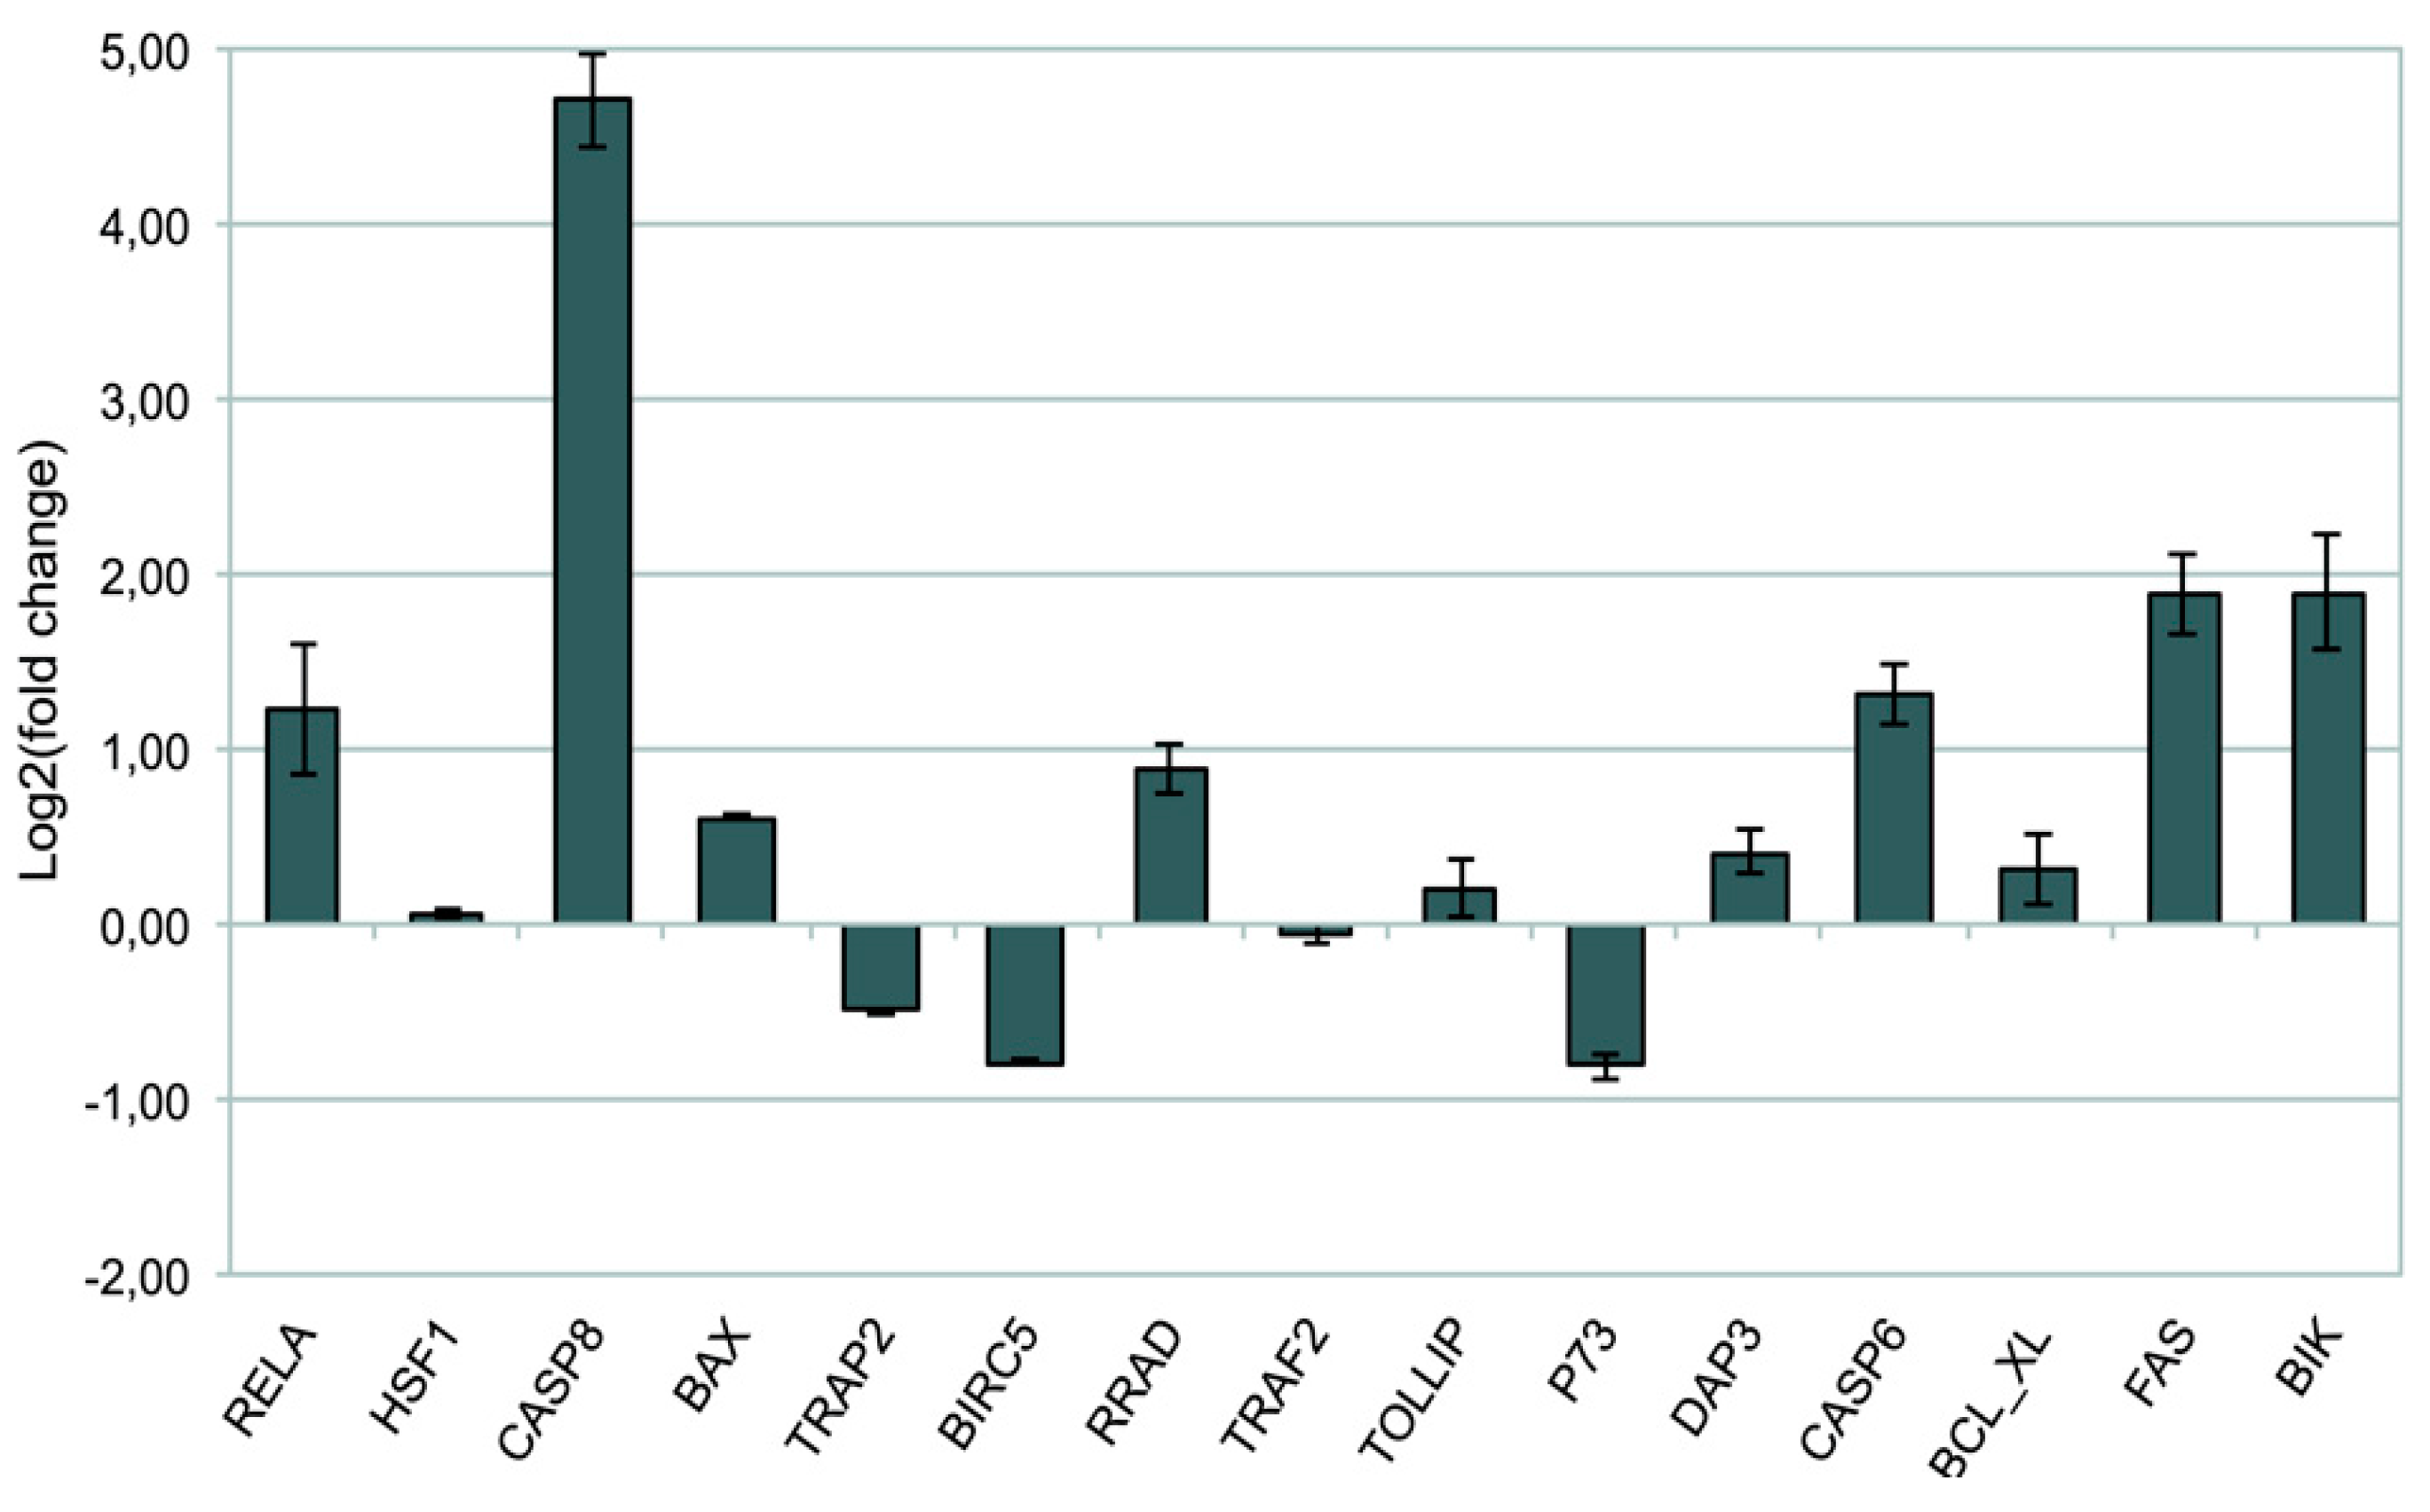
To test the robustness of the Computational data analysis, quantitative PCR was performed on the set of 15 hub genes, highly differentially expressed after DAC epigenetic treatment, at different time points compared to controls. Data are shown as a ratio between treated (DAC) and untreated cells and normalized to β-actin (Figure 4). T-test analysis was performed to evaluate the significance of gene expression variation (*P<0.05).
Notably, a significant up-regulation of the pro-apoptotic genes FAS, CASP8, BIK and of the tumor suppressor gene RRAD, was detected at each time point (P<0.05 at 48, 72 and 96 hours). Gene expression fluctuations were detected for other pro-apoptotic genes such as HSF1 (p<0.05 at 72 hrs), DAP3, p73, PSMD2 alias TRAP2 and CASP6 (P< 0.05 at 48 and 72 hours). Interestingly, the expression of other pro-apoptotic genes involved on the intracellular signaling at mitochondrial level, such as BAX and BCL_XL (also known as BCL2L1), were significantly up regulated only at the latest time point (P< 0.05 at 96 hours). On the other hand, BIRC5 oncogene, also known as Survivin, underwent an early significant down-regulation that was maintained for long time (P<0.05 at 48 and 72 hours), favoring cell apoptotic response. The overall picture of time-related mRNA expression confirms the data from cDNA microarray analysis (Table 1)

2.1.3. Methylation Status of Selected Genes after DAC on Weri-Rb-1

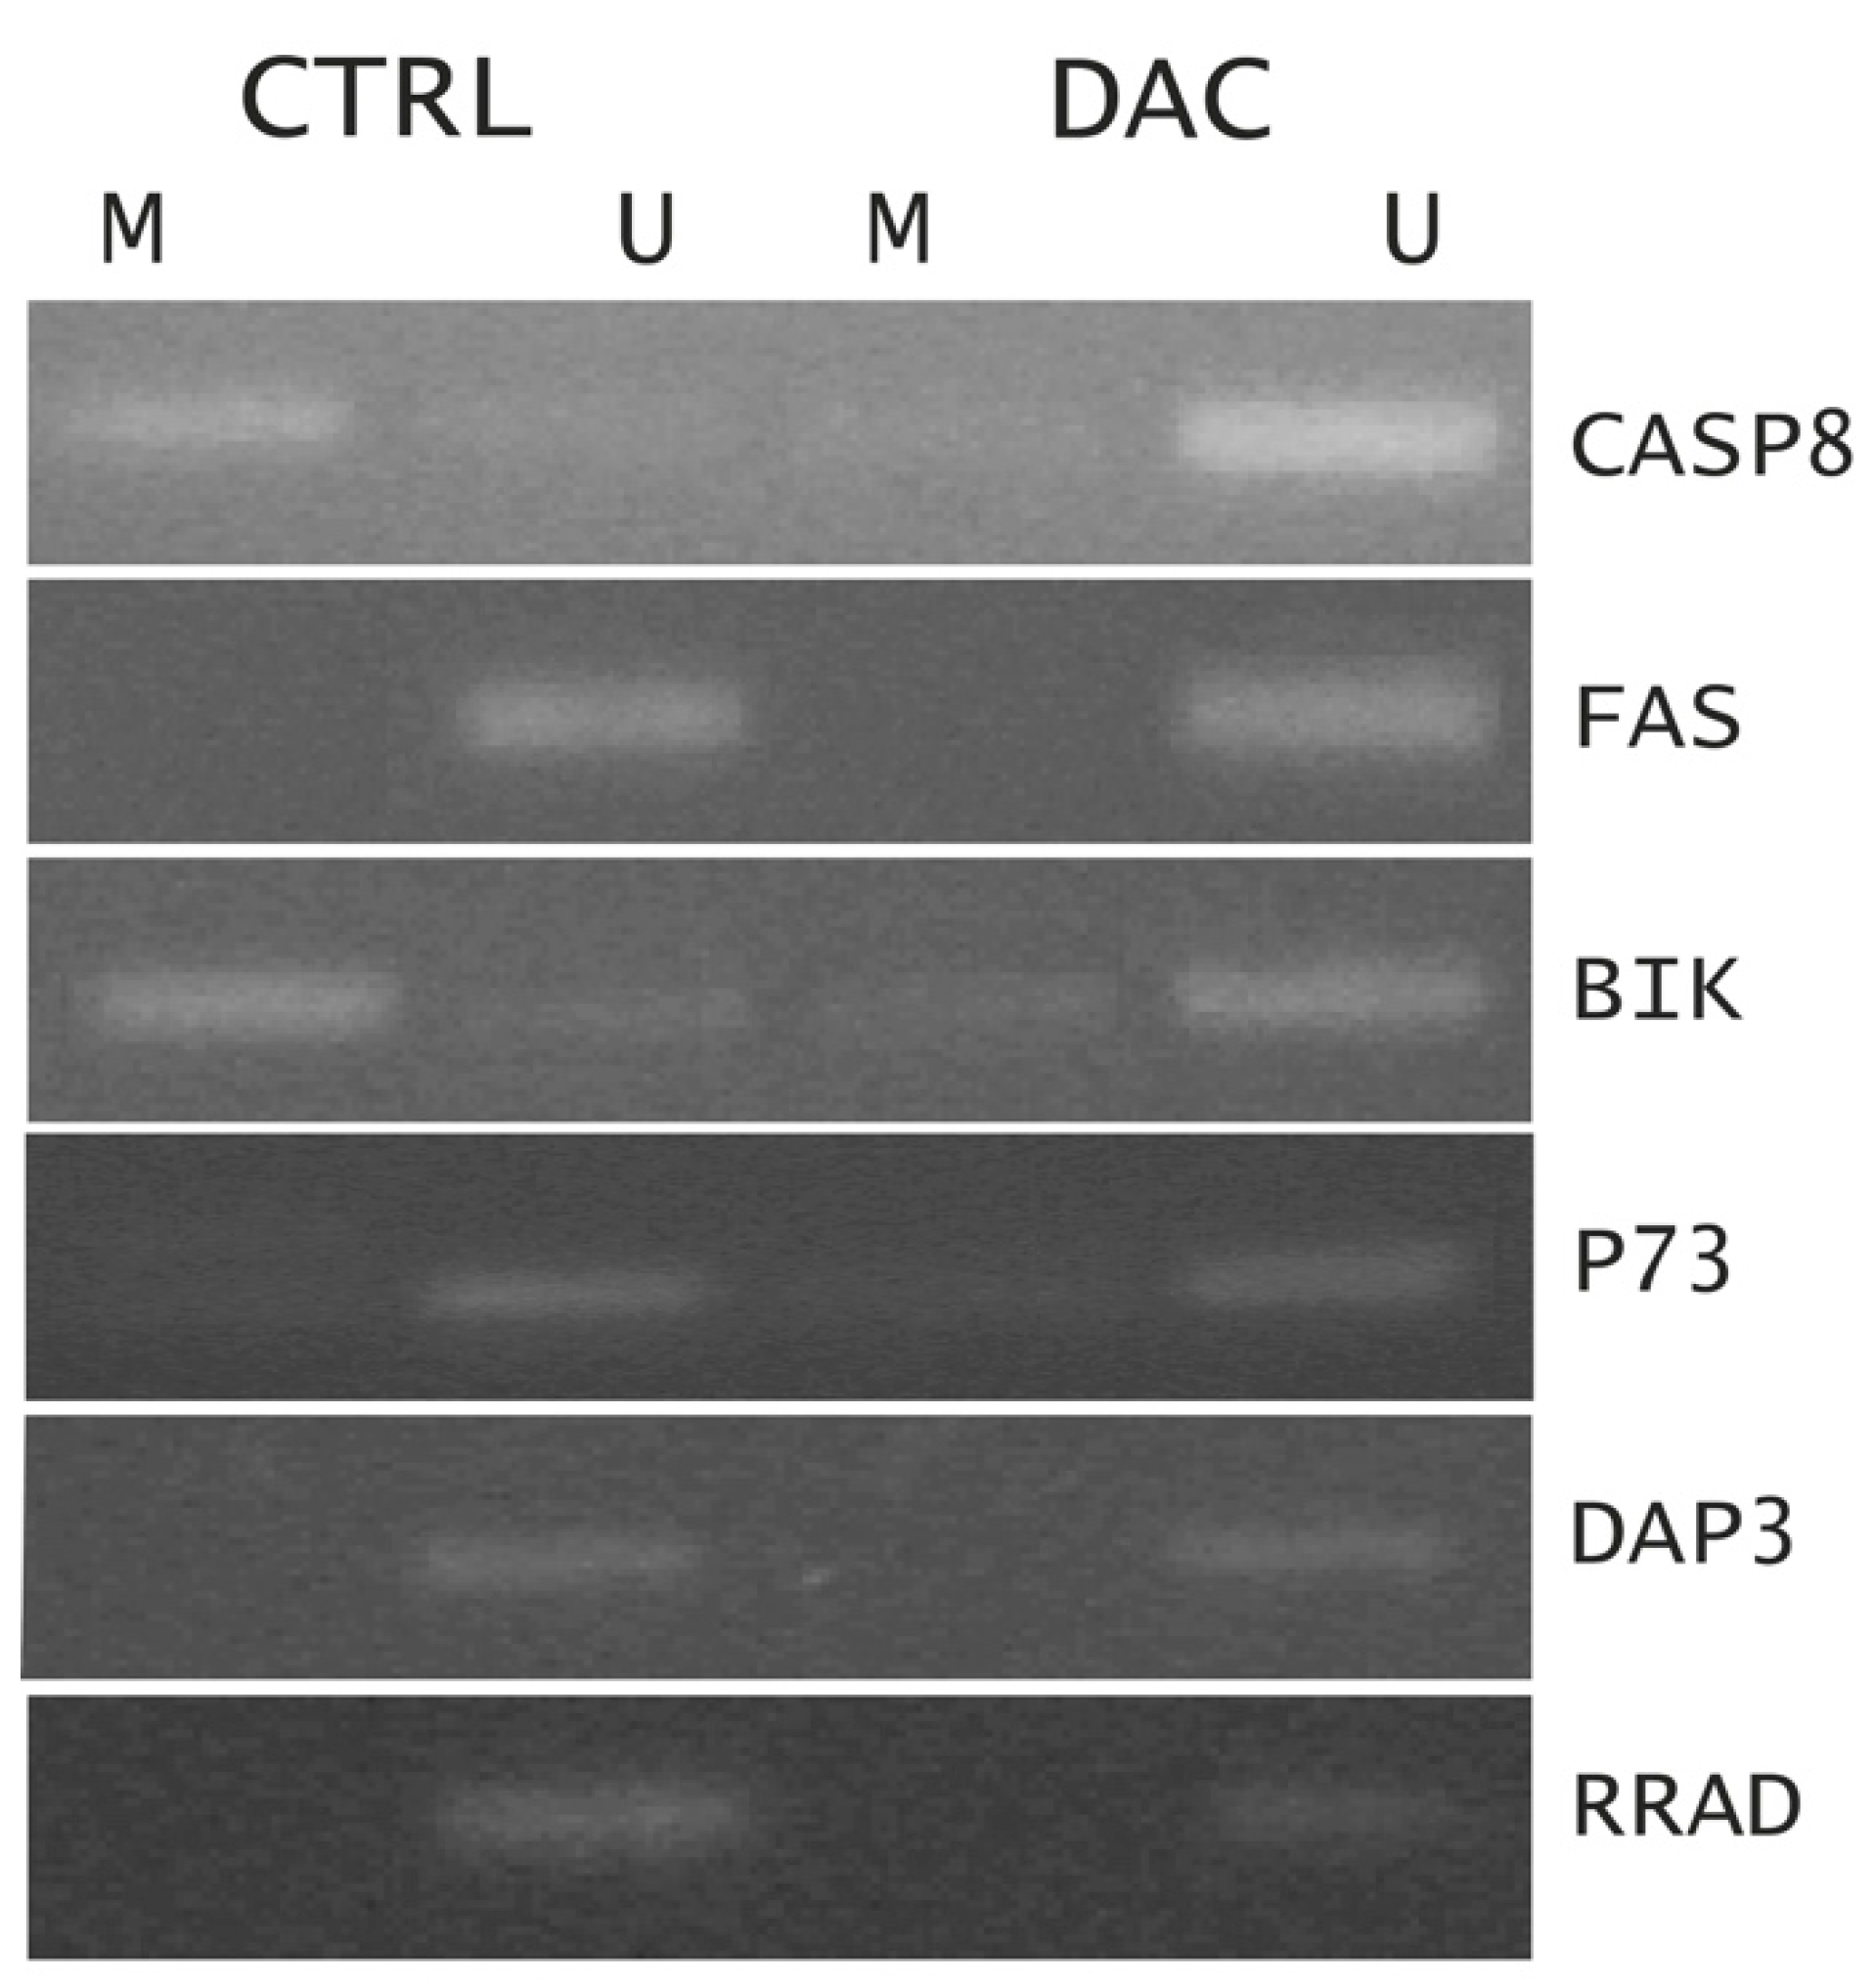
To assess the effect of DAC in modulating the expression of target genes by rewriting epigenetic marks, a Methylation-specific PCR (MSP) was performed on some up-regulated genes, often found epigenetically silenced in cancer. As shown in Figure 5, changing in DNA CpG island methylation status was found for CASP8 and BIK genes while no changes were observed for FAS, p73, DAP 3 and RRAD genes, suggesting that a dual mechanism of action of DAC has occurred to modulate the gene expression in Weri-Rb-1 cells: a direct effect by changing the methylation status and thus the expression level of some genes, and an indirect effect by a subsequent activation of downstream effectors, without changes in their methylation status as previously suggested in literature. [20].

2.2. Comparison of Differential Expressed Genes in Primary Tumors vs Normal Retinal Cells with Weri-Rb-1 DEGs

In order to assess if the co-regulated clusters of genes identified in Weri-Rb-1 cells could represent candidate markers for primary retinoblastoma tumors, a comparative analysis of differential expressed genes in primary tumors vs normal retinal with respect to treated vs untreated Weri-Rb-1cells has been performed. From the analysis performed by Kooi et al [21] in tumor cone photoreceptor lineage vs normal retinal cells, both derived from frozen tissue samples collected after primary enucleation in patients with retinoblastoma, it has been evidenced 463 genes up-regulated with LogFC greater than 2 and 282 down regulated genes with Log2FC ≤ 2.
Among those 463 up-regulated genes, 136 of them are manly associated with biological processes related to cell proliferation including RELA and TRAF2. Interestingly we found that RELA and TRAF2, that are genes related to cell proliferation, are highly down regulated in Weri-Rb-1 cells after DAC treatment. Among the up regulated genes, 24 are positive regulators of DNA damage and repair signal like PARP-1 and DNA LIGASE IV also found up-regulated in Weri-Rb-1 cells after 96 hours of treatment. Moreover, the top up-regulated genes in primary tumors cone photoreceptor lineage showing a Log2FC ≥ 4 included genes playing a key role in tumor cell proliferation like BIRC5/Survivin oncogene that we also found early highly down-regulated in WeriWeri-Rb-1 cells after DAC treatment at early time points.
Regarding the 282 down-regulated genes in primary tumors, 27 of them are involved in the retina development and physiological visual signals. The top down-regulated genes with a Log2FC ≤ 4 are functionally related to visual perception and rhodopsin mediated signaling pathways. Interestingly, among these down-regulated genes we found PPM1D photoreceptor-related gene [20,22] and AKAP12 hemato-retinal barrier related gene significantly up-regulated in Weri-Rb-1 cells after DAC treated suggesting that this epi-drug could concur to restore the function of retina by removing the epigenetic silencing of these key factors involved in retina development.
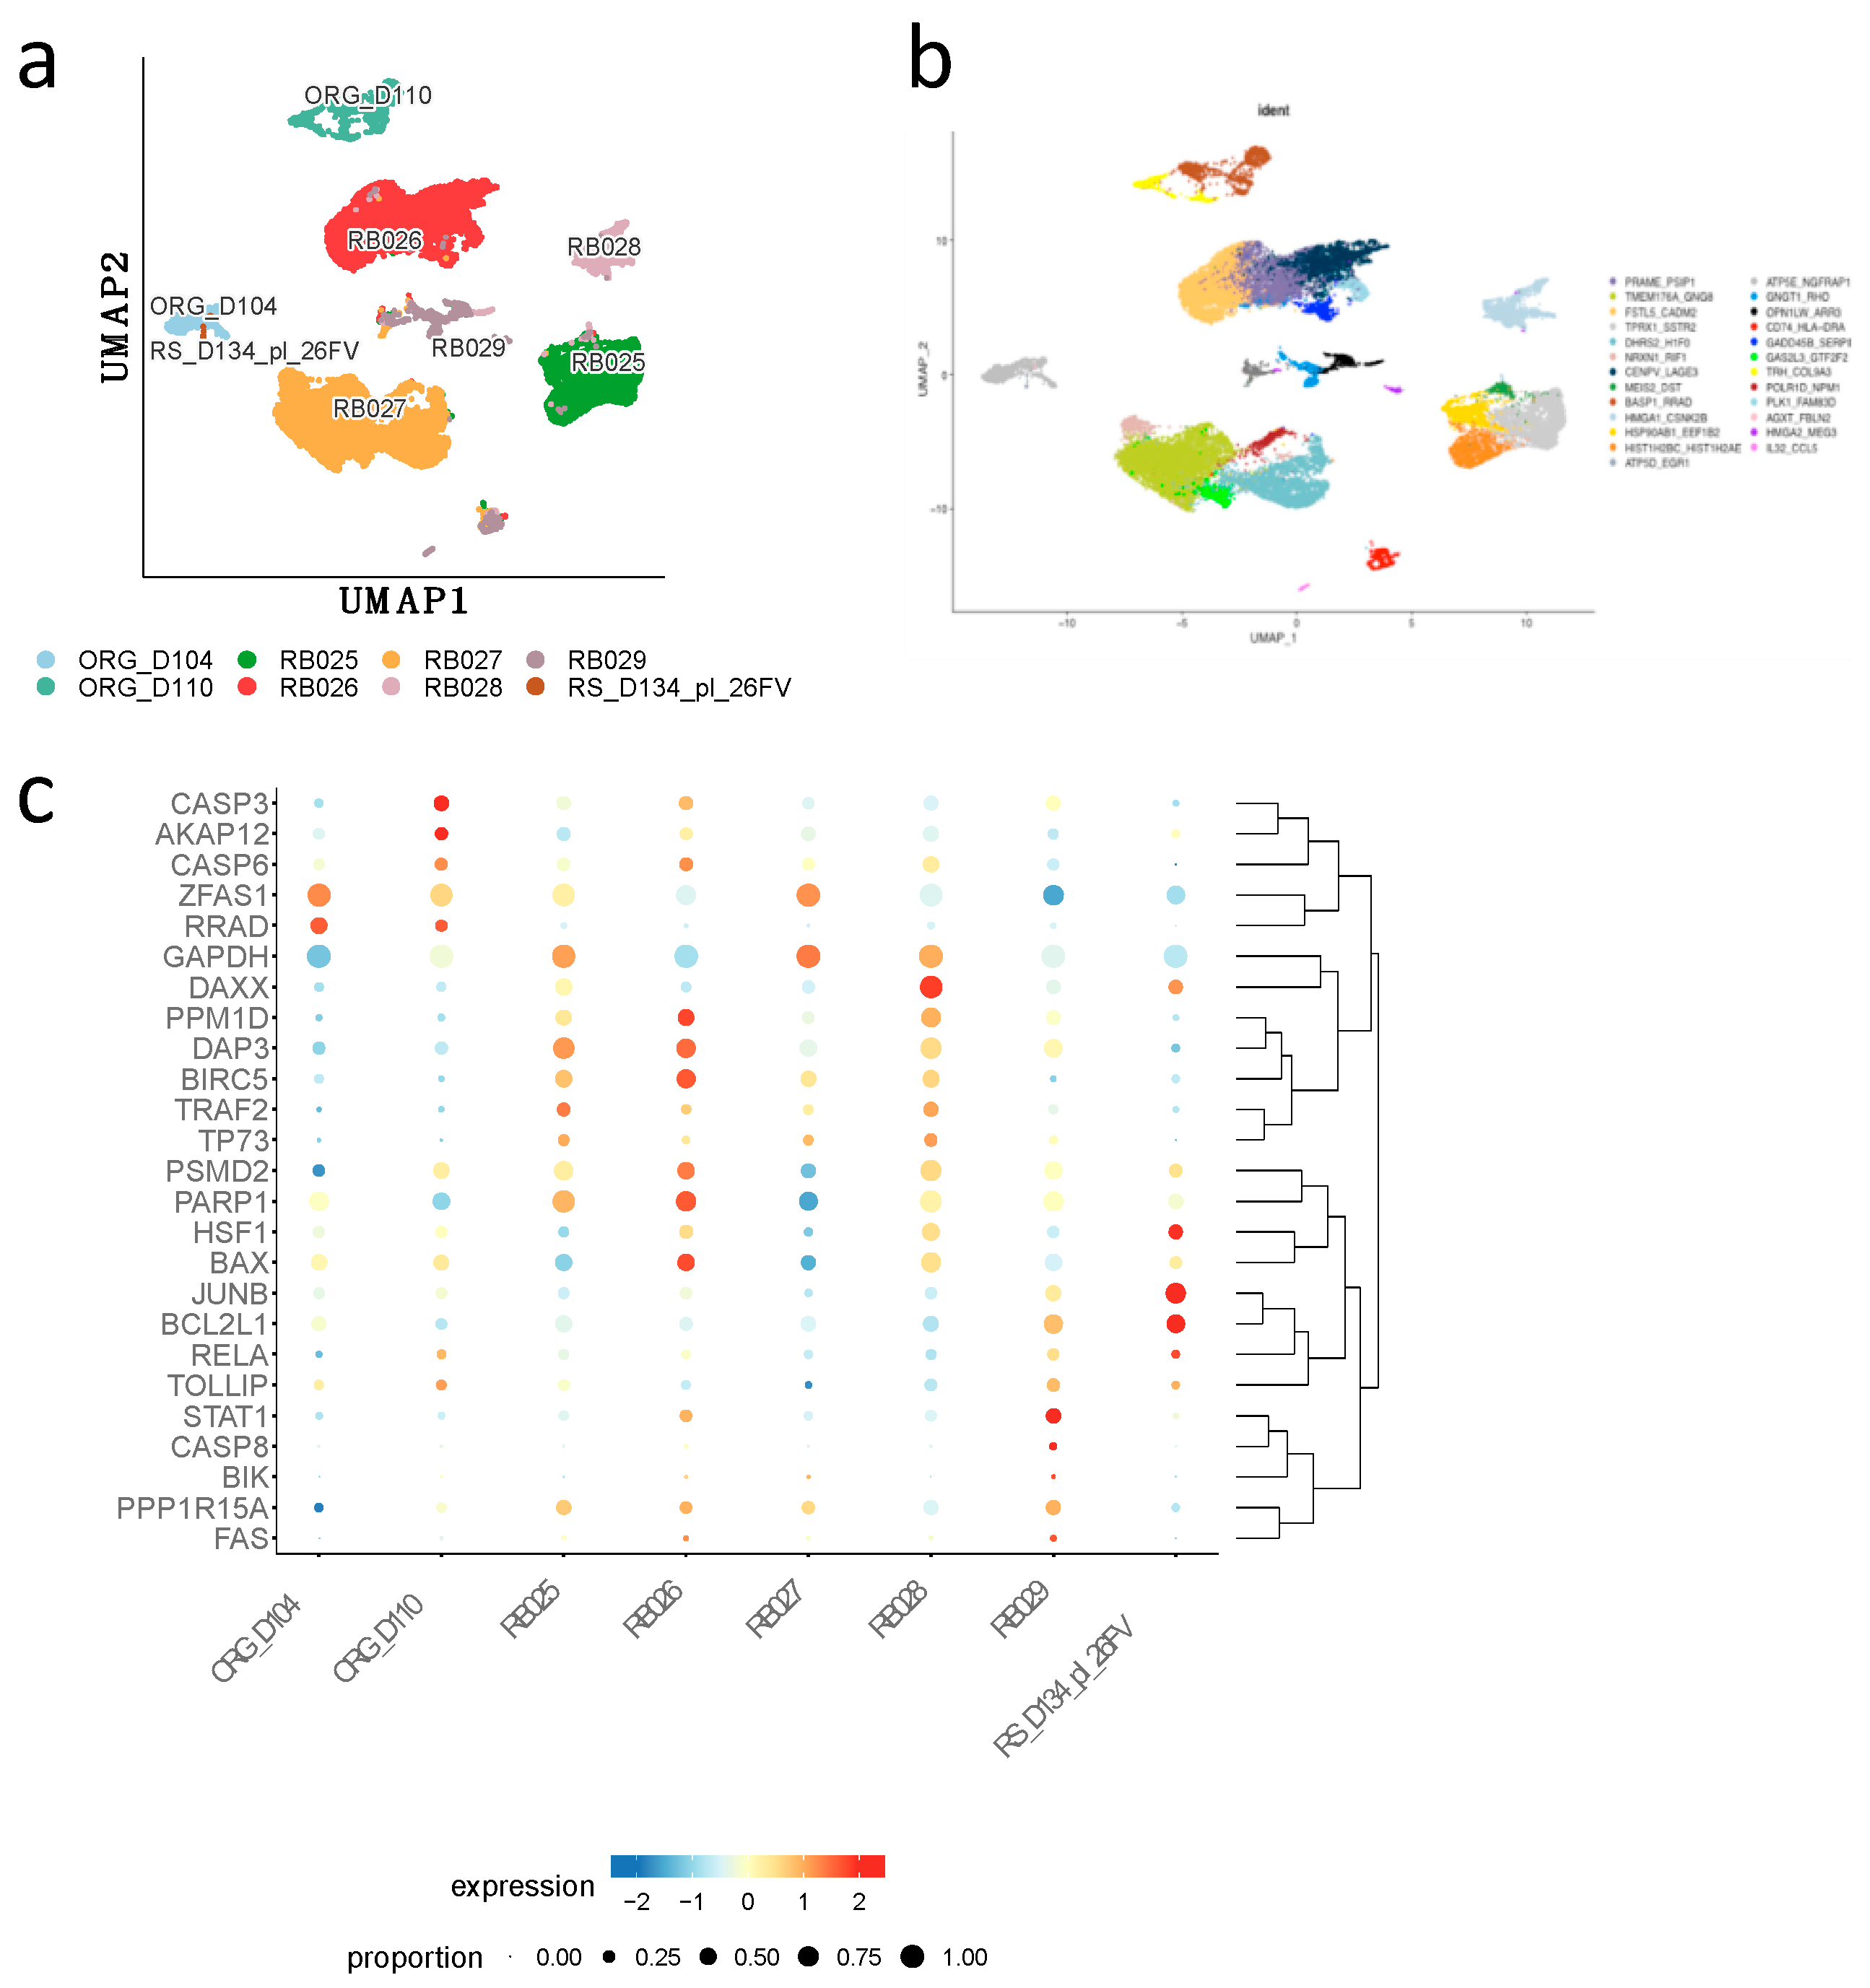
Moreover, we interrogated two publicly available single cell RNASeq datasets of human normal retina cells (organoids and retinospheres) and patient-derived retinoblastoma cells at different intraocular retinoblastoma classification (IIRC) (Supplementary Table S1) in order to identify the differential expression of genes at a single cell level and compare them with Weri-Rb-1 DEGs. 25 subclusters annotated with highly expressed genes were obtained (Figure 6a-b). For each set of normal cells (ORG_D104; ORG_D1110; and RS_D134_pl_26FV) and primary retinoblastoma cells (RB025, RB026; RB027; RB028; RB029) we described the expression of the key genes which are compared with those identified in Weri-Rb-1. Most of the key genes found up- or down-regulated in Weri-Rb-1 after DAC treatment, and listed in Table 1, are found inversely correlated in terms of expression with those identified in subclusters of primary patient-derived cells. In particular among the 15 hub genes of Weri-Rb-1, BIRC 5, TRAF2, DAXX and HSF1 are overexpressed in primary tumor cells and highly down-regulated in Weri-Rb-1 treated cells. At the same time, PPP1R15A alias GADD34, RRAD, FAS, CASP8, CASP 6, CASP 3, BAX and the expression of BIK, mainly involved in cell growth arrest and apoptotic signaling, was found to be downregulated in primary tumor cells but significant overexpressed in DAC treated Weri-Rb-1 (Figure 6c) suggesting an efficient antitumor effect of Decitabine through an active and targeted modulation of gene expression.

2.3. DAC Anti-Cancer Effect in Preclinical Model

2.3.1. The Effect of DAC on the Rb Xenograft Model

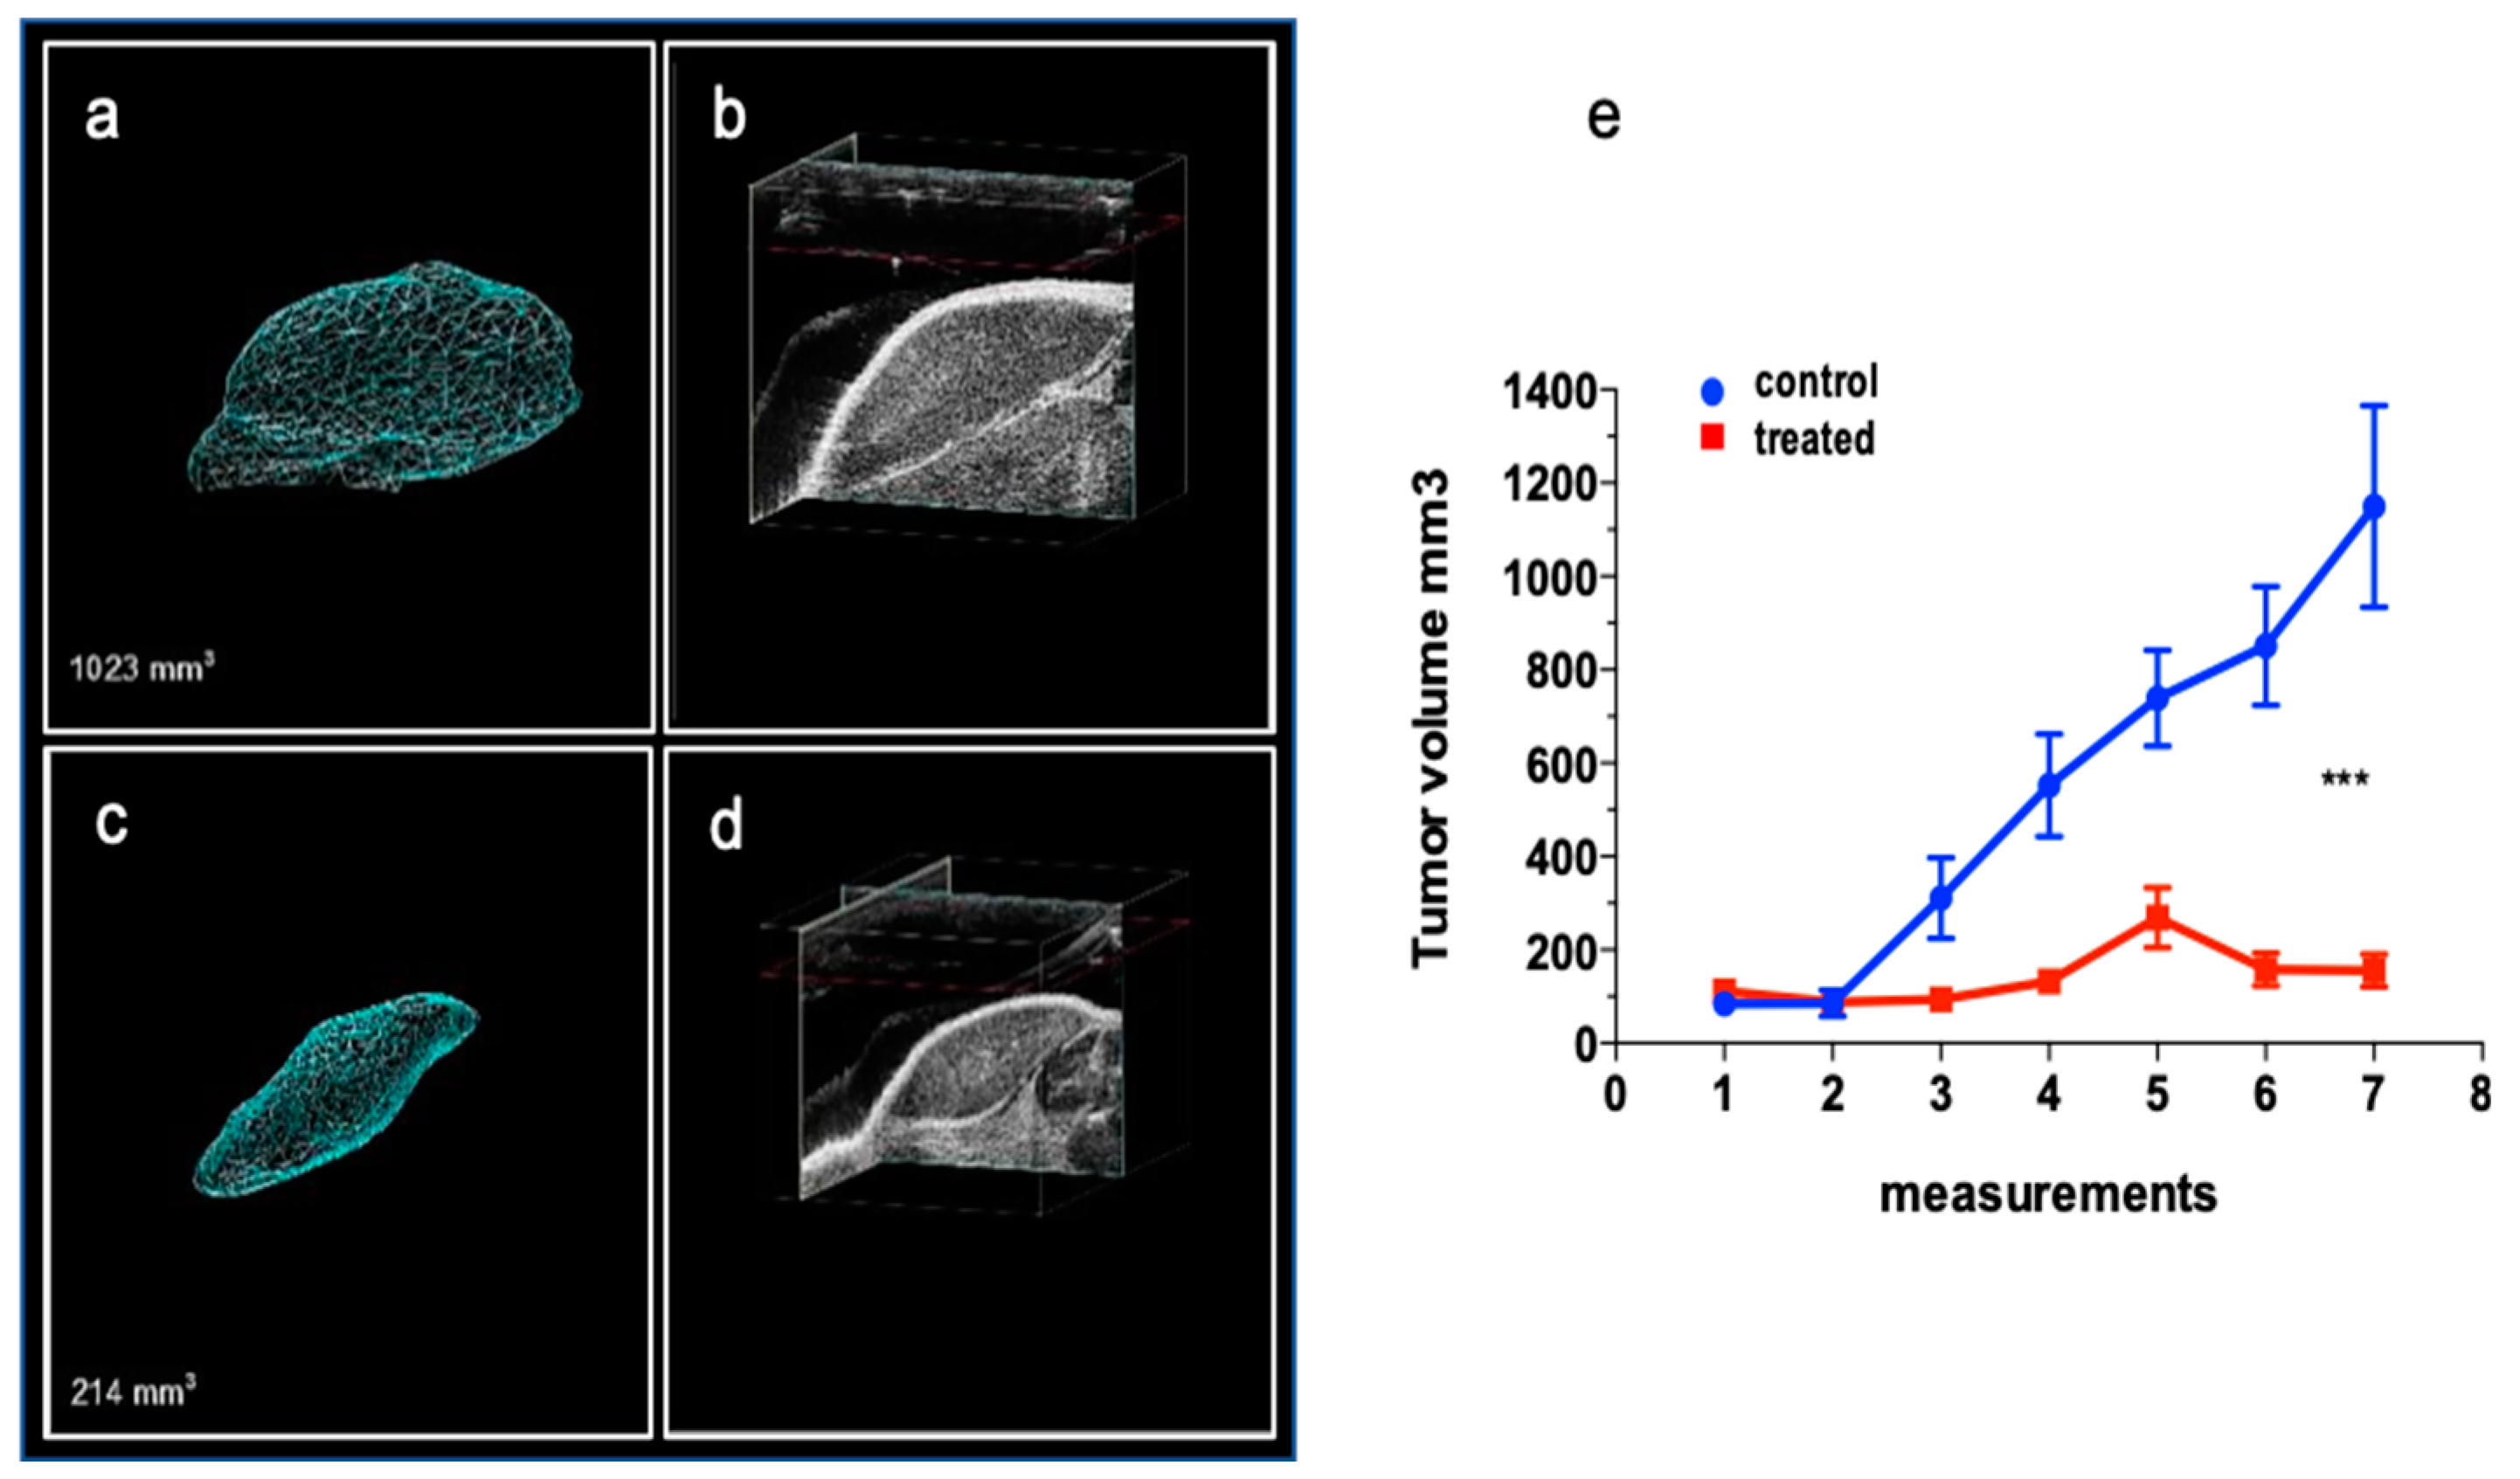
To better mirror the pathology and clinical therapeutic response, we first evaluated the biological anticancer performance of DAC drug in vivo in xenograft mouse model (Figure 7). DAC was systemic (i.p.) administered to Weri-Rb-1 xenografted immunosuppressed mice twice a week for 3 weeks. At the end of the three weeks treatment, a significant reduction in the tumor volume was measured in treated (155.90 ± 32.44 mm3) compared to untreated (1115,01 ± 215 mm3) mice (TW ANOVA RM ***P<0.0001). Ex vivo validation of gene expression profile on the 15 hub genes, performed on collected tumor specimens, correlates with previous in vitro results, by RT-qPCR (Figure 5). This analysis confirmed the pivotal role of the pro-apoptotic CASP8, FAS and BIK genes in inducing tumor growth arrest in vivo, as they appeared highly over-expressed following the administration of the DNA demethylating agent. Similarly to in vitro results, also the pro-survival oncogene BIRC5 (Survivin) expression was notably reduced at the end of the treatment (Figure 8) confirming the DAC regulatory activity on the expression of genes.

2.3.2. The Effect of DAC on the Intraocular Rb Model

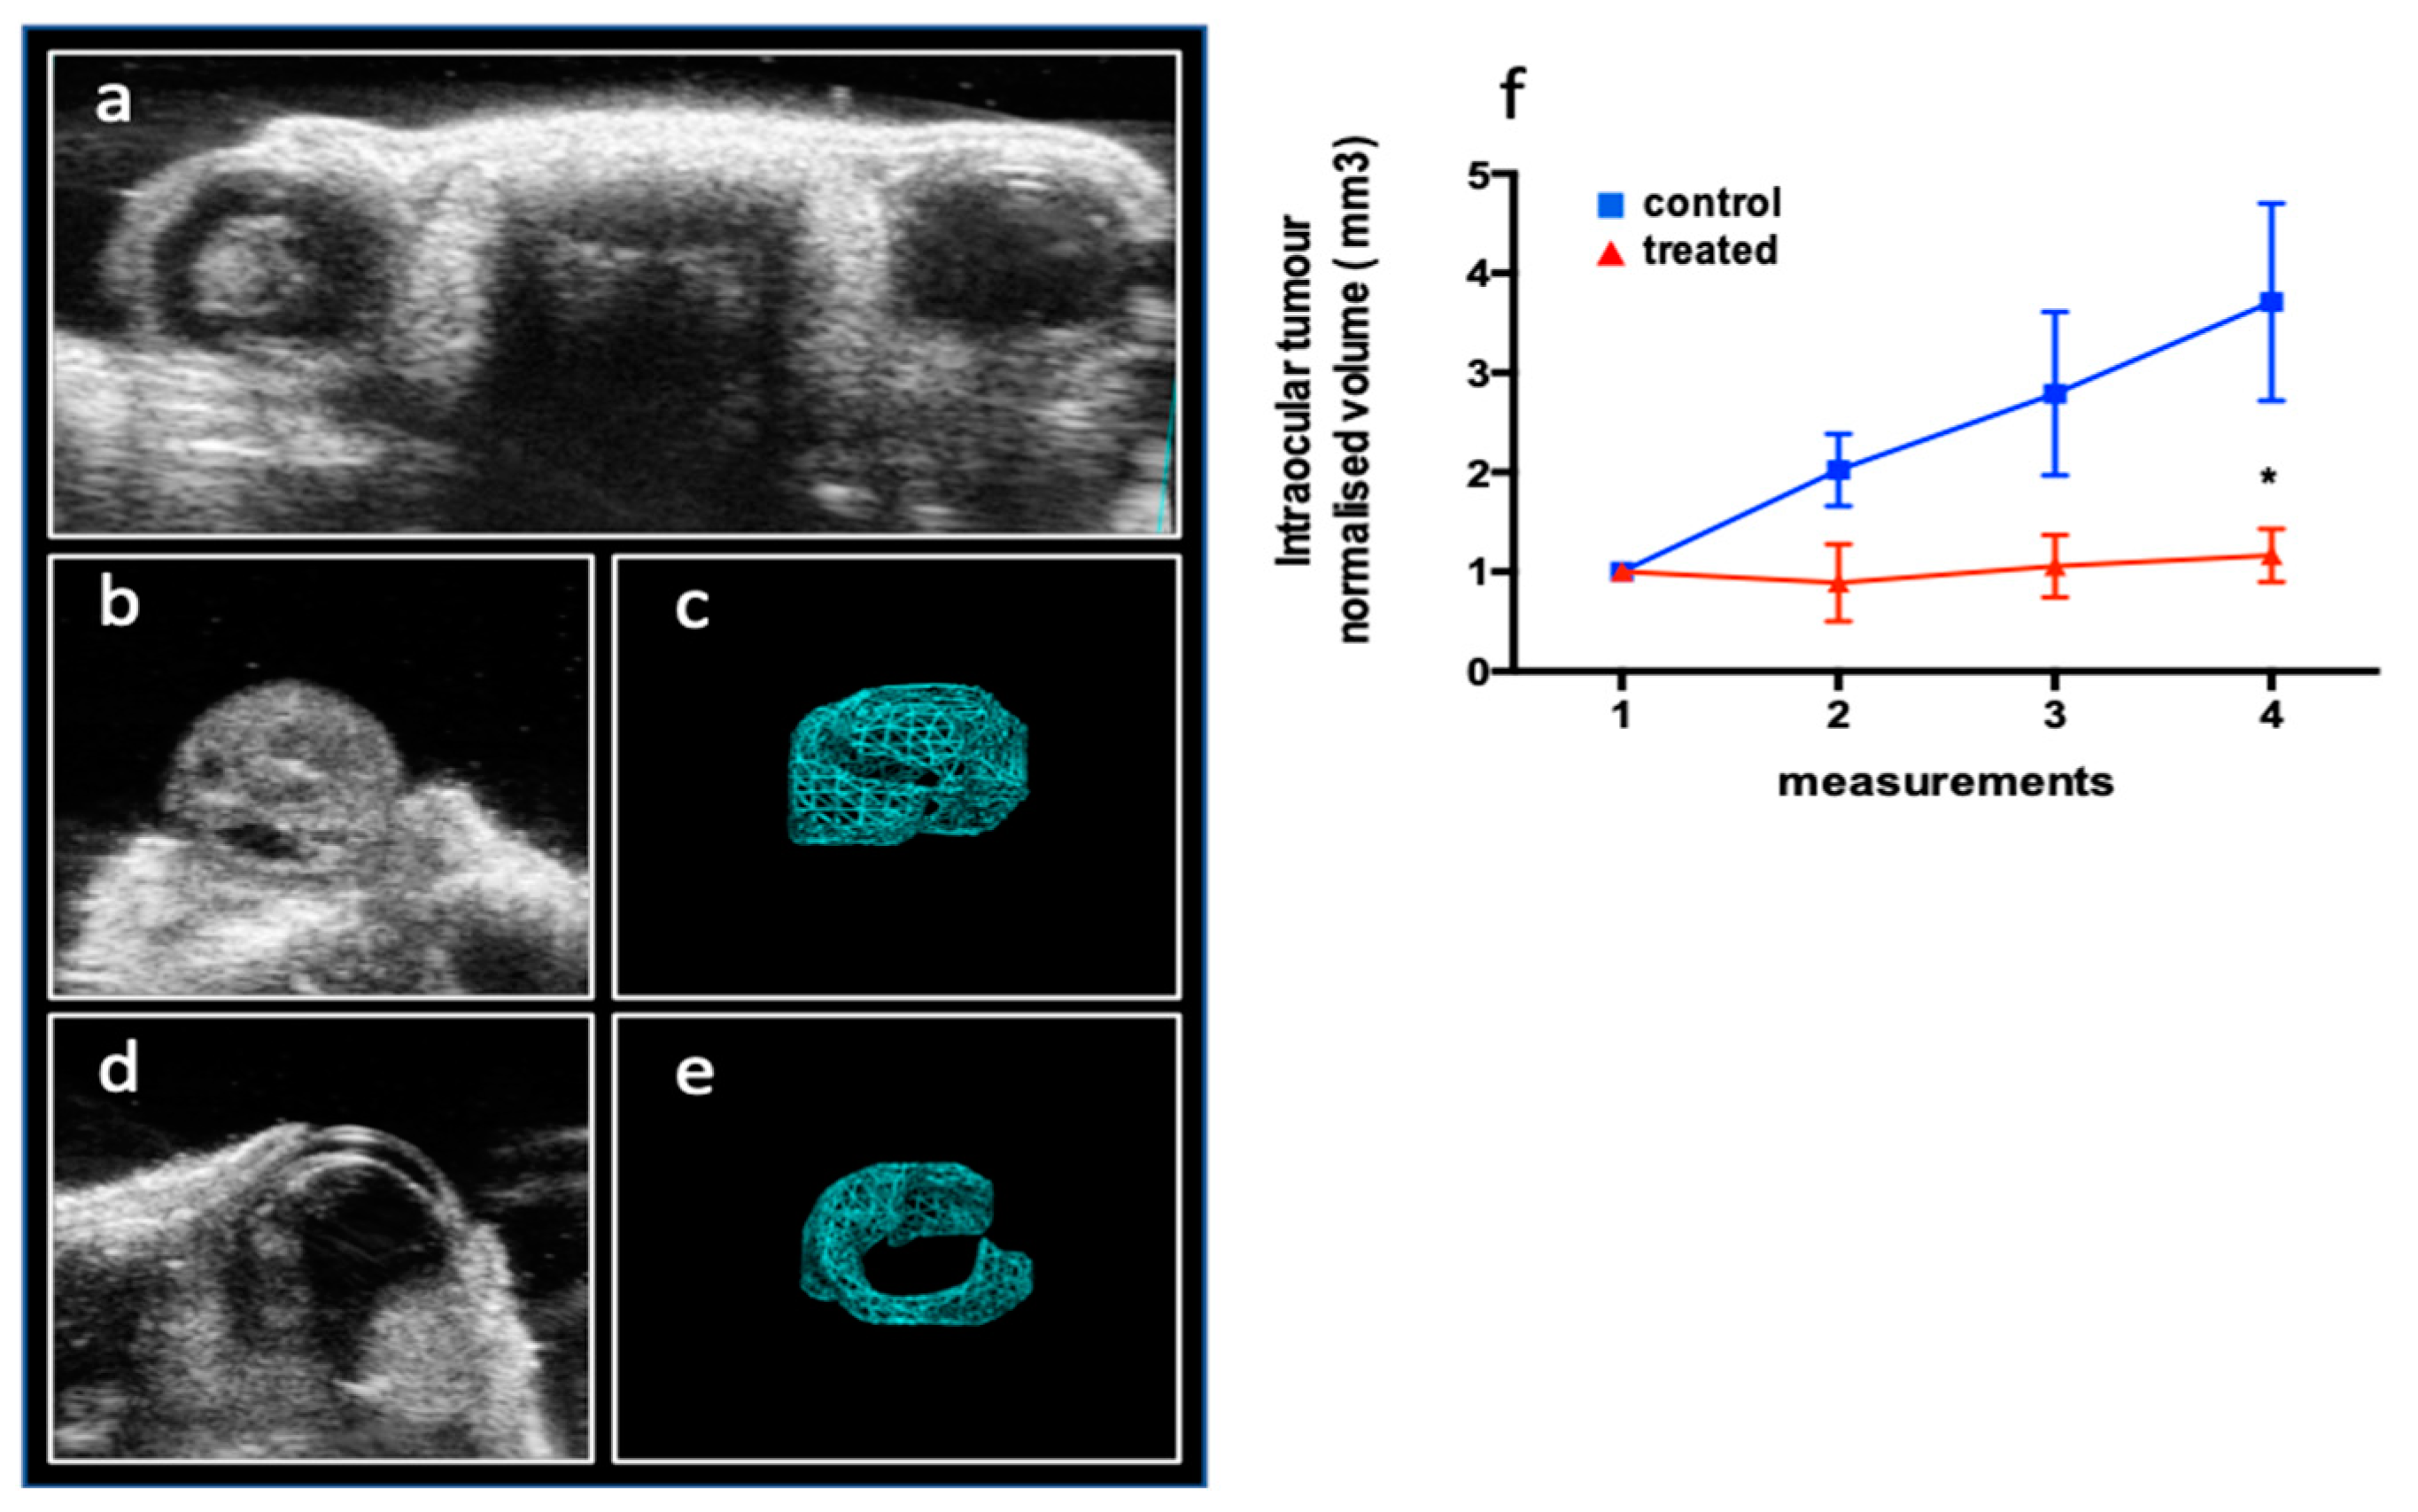
To better recapitulate the feature of retinoblastoma tumor and mimic the native tumor microenvironment, including stromal cell components and local nutrient supply [23] a mono-ocular orthotopic retinoblastoma model was created to study the effect of DAC systemic treatment on cancer growth. Internal controls (contralateral not effected eye) were also examined to exclude unwanted secondary effects of treatments (Figure 9 a). The echo-graphic 3D reconstruction imaging of the tumor mass inside the ocular bulb of control (Figure 9 b-c) and treated eyes (Figure 9 d-e) allowed for the longitudinal analysis of the tumor development during the three weeks of treatment. We measured a reduced fold increase of the growth of intra eye tumor in treated animals (1.16±0.2) with respect to controls that showed a significantly higher growth (3.7 ± 0.9) (**p<0.005) demonstrating that the biological variables do not affect the delivery of drug and its activity (Figure 9 f)

3. Discussion

The study of the genome molecular landscape underlying the eye cancer development is still a hot topic in the fight against children tumors [22,24,25,26]. In this contest, growing evidences indicate that retinoblastoma is generated by epigenetic changes and genetic mutations [27] and that reprogramming strategies, able to restore the expression of some epigenetically silenced genes, have been suggested as novel and efficient anti-tumor therapeutic approach [28,29,30]. It is known that epi-drugs can change gene expression by direct or indirect targeting epigenetic editors [31]. In this regard, it has been shown that Decitabine has a dual mechanism of action. Its incorporation into newly synthesized DNA causes the covalent trapping of the DNA methyltransferase I enzyme and consequent depletion of cytosine methylation. However, DAC can also induce a rapid and substantial remodeling of the heterochromatic domains of genes locus by increasing the acetylation and H3-K4 methylation at the unmethylated promoters of oncogenes independently of its effects on cytosine methylation [20]. DAC has been already used to unravel the impact of promoter hypermethylation in the expression levels of relevant genes [32]. Here we present a coherent picture in which this demethylating agent induces a significant reduction of tumor growth both in vitro and in vivo in retinoblastoma models. We specifically analyzed DAC activity regarding modulating the expression of many pro-apoptotic and pro-survival genes together with genes involved in DNA damage and repair signaling by rewriting epigenetic marks. DAC treatment also significantly induces the re-expression of the tissue-specific genes involved in hemato-retinal barrier development and photoreceptor signature [21,33] highlighting the potentiality of this epi-drug in restoring retina function. Through methylation study, here we have shown that DAC re-established the expression of pro-apoptotic CASP8 and BIK genes by directly affecting their cytosines methylation. Conversely for other genes no changes in the methylation status has been observed suggesting an indirect regulatory mechanism of DAC, probably throughout the alteration of multiple targets in heterochromatin domains such as reversing the silenced histone code, at least in the promoter region we focused in[20,34,35]. Computational analysis of gene expression profile in Weri-Rb-1 cells after DAC treatment has provided a list of co-regulated clusters of genes which may be seen as potential fingerprints of retinoblastoma phenotype or of DAC treatment effect. Most of these genes have been found as differentially expressed in clusters obtained by the comparative analysis of publicly available datasets of patient-derived tumor samples vs normal retina [21,36,37,38] validating the hypothesis that they may represent reference markers/candidate drivers of retinoblastoma genesis and progression. Furthermore, the network and interactome maps of 696,5 Weri-Rb-1 DEGs highlighted 15 highly interconnected genes that have a central role in regulating numerous proteins/factors and share a high number of pathways. The co-regulated expression of these 15 hub genes induced by DAC treatment seems to be not influenced in in vivo contest by the complex interplay known to exist between tumor cell-intrinsic, cell-extrinsic, and systemic mediators [39,40,41] This suggests that, differently from other hypermethylated genes associated with protein signal transduction and perception to external stimuli [32] the intracellular reprogramming dynamics of these genes induced by DAC epigenetic therapy may be independent from tumor microenvironment. In the subcutaneous and orthotopic xenograft models the tumor behavior in response to DAC treatment is that of a substantial growth arrest laying the foundations for a rational development of effective anti-cancer treatments for patients with retinoblastoma

4. Materials and Methods

Culture cell line, 5-Aza-2′-deoxycytidine (Decitabine, DAC) treatment and FACS analysis.
Weri-Rb-1 cells (ATCC, Rockinville, MD) were maintained in RPMI1640 medium supplemented with 10% fetal bovine serum and 2 mM L-glutamine, at split ratio of twice a week. For treatments, cells were seeded at a density of 1×10⁵ cells in 6-well plates. After 24 hours incubation, 2.5 μM 5-Aza-2′-deoxycytidine (Decitabine, DAC) (Sigma-Aldrich) was added to the culture medium of treated cells, where DMSO was added to control cells. For FACS analysis, treated and control cells were incubated for 24, 48 and 72 hours and analysed by flow cytometry at each time point. For assessment of cell cycle phases, nuclei were stained with 10 mg/ml propidium iodide (PI) in hypotonic solution (1X PBS containing 0.1% sodium citrate and 0.1% Triton X-100) for 30 minutes at 4°C in the dark. Apoptotic cells were detected by Annexin V test (BioVision), following manufacturer’s instructions. Flow-cytometry was carried out using a Becton–Dickinson FACSCanto II and data were analyzed by FlowJo software.
cDNA microarray experiments and analyses.
For cDNA microarray experiments, total RNA samples were isolated from treated and untreated Weri-Rb-1 cells after 48, 72 and 96 hours using TRIZOL reagent (Invitrogen, CA, USA) according to the manufacturer’s instructions. Concentration of purified RNA samples were determined by A260 measurement, and the quality was checked by Lab-on-a-chip analysis (total RNA nanobiosizing assay, Agilent) with the Agilent 2100 Bioanalyzer. RNAs samples were transcribed in cDNAs and used to carry out the expression gene analysis using PIQORTM Cell Death Human Sense Microarrays (Miltenyi Biotech) which contain 200-mer oligo-probes covering almost 500 human genes. Hybridization, scanning and data analysis were performed according to the PIQORTM Instruction Manual (Miltenyi Biotech). Briefly, image capture of hybridized PIQORTM microarrays were done with the laser scanner ScanArrayTM Lite (PerkinElmer Life Sciences); mean signal and mean local background intensities were obtained for each spot of the microarray images using the ImaGeneTM software (Biodiscovery). Spots flagged as low quality were excluded from further analysis.
Detection of the expression levels of transcripts in the 3 time’s profiles was achieved by using a Cy5/Cy3 custom platform designed PIQOR from Miltenyi Biotech and containing almost 500 genes related to apoptosis, cell death and inflammation. Local background was subtracted from the signal to obtain the net signal intensity and the ratio of Cy5/Cy3 was calculated. Subsequently, the mean of the ratios of the four corresponding spots representing the same cDNA was computed. The ratios were normalized using the Median and the Lowess methods. As an additional quality filtering step, only spots/genes were considered for the calculation of the Cy5/Cy3 ratio that have at least in one channel a signal intensity that was at least 2-fold higher than the mean background. We considered the selection of down-regulated based on genes with an expression ratio below 0.58, while up-regulated genes have values over 1.70. The microarray chip from Miltenyi contained 4 technical replicates and a quality control implemented in the analysis considering the coefficient of variation (CV = σ/μ) as a parameter referring to the quality of replicated spots, expressed as a percentage and complementing the information from expression ratios.
Computational analysis of differential expressed genes and interaction network maps in Weri-Rb-1 cells.
The microarray data were analyzed as previously described [18]. GeneMania was used to generate the networks of Weri-Rb-1′s differential expression genes (DEGs) to show co-expression among the connected genes. Functional enrichment analysis was obtained by the DAVID [42]. The networks were exported on Cytoscape for mapping the DEG and for proper visualization of highlighted DEGs and their relationship. Gene ontological analysis for functional annotations on differentially expressed genes was carried out using BiNGO [43]and DAVID tools. Correction of false positive occurrences in GO terms were corrected using Benjamin and Hochberg False discovery rate.
Computational gene expression profile in primary retinoblastoma and Co-expression Network Analysis.
The values of expression of treated Weri-Rb-1 DEGs were compared with those found in Kooi et al [21] where authors analyzed primary tumors cone photoreceptor lineage vs normal retinal derived from frozen patient tissue samples. The DEGs in Weri-Rb-1 cells were also compared at single cell level with public available datasets of normal retina cells (human retinal organoids ORG_D104; ORG_D110 and retino-spheres derived from human fetal retina RS_D134_pl_26FV) from Gene Expression Omnibus (GEO) database GSE142526 [38] and patient-derived non familiar retinoblastoma cells classified as E and D, according to intraocular retinoblastoma classification (IIRC) (wRB6, RB006, RB010, RB015, RB016, RB018, RB020, and RB021) from GEO database GSE196420 [36] (supplementary Table 1). We analyzed the single cell data using Seurat package and cells were filtered with defined criteria when genes expressed in cell>200 and number of RNA read counts were within 300 and100000 with mitochondrial percentage in cells<10. We also regressed cell cycle scores [44]. Clustering is performed using the Louvain algorithm and UMAP visualization is generated [22]. Differential expression was computed using R package GEOquery [45]). The Weighted Gene Co-expression Network Analysis package (WGCNA) [46,47] was used to reconstruct weighted gene co-expression networks for the differentially expressed genes in primary tumor and normal retinal cells. Edge weights computed based on topology overlap measure assigns co-expression correlation between 0 and 1 to two connected genes (GEOquery). The sub networks of 15 retinoblastoma hub genes were extracted from the co-expression networks of primary tumors built with threshold cutoff of 0.05 on edge weight among co-expressing genes. Cytoscape version 3.3 was used to visualize, and topological parameters were computed using Centiscape.
RT-qPCR analysis.
Total RNA was extracted from Weri-Rb-1 cells using NucleoSpin RNA isolation kit (Macherey-Nagel) according to manufacturer’s instructions. RNA concentration and purity were determined by NanoDrop spectrophotometer. For each sample, 1 μg of total RNA was reversely transcribed using the Maxima H Minus First Strand cDNA Synthesis Kit (Thermo Scientific Inc., Italy). Gene expression was determined by DyNAmo Flash SYBR Green qPCR Kit (Thermo Scientific Inc., Italy), using the PikoReal Real-Time PCR System (Thermo Scientific Inc., Italy). Amplification conditions were: 7 minutes at 95°C, followed by 40 cycles of 10 seconds at 95°C, 20 seconds at 60°C and 20 seconds at 72°C. All samples were analysed in triplicate.
Methylation-specific PCR (MSP).
DNA methylation patterns in the CpG islands of CASP8, FAS, BIK, p73, DAP3 and RRAD genes, generally found methylated in many cancers, were assessed by MSP, based on the sequence differences between methylated and unmethylated DNA after sodium bisulfite modification. Genomic DNA was extracted from Weri-Rb-1 cells and subjected to bisulfite modification by the Thermo Scientific EpiJET Bisulfite Conversion Kit. Successively, the modified DNA was used for MSP reactions. The primer pairs specific for methylated (M) and un-methylated (U) sequences are reported in supplementary Table S2. PCR products were separated on a 2.2% agarose gel containing ethidium bromide and visualized under ultraviolet illumination.
Preclinical in vivo effect of DAC epigenetic treatment.
Experiments were conducted on opportunistic pathogen-free NMRI six to seven weeks old male athymic BALB/c Nude mice (Harlan Laboratories, Udine, Italy), in accordance with EU Directive 2010/63/EU and Italian Ministry of Heath rules (Ethics Committees of the Toscana Life Sciences and the Istituto Superiore di Sanità (ISS) on behalf of Italian Minister of Health (Permit Number: # CNR-030314 and # CNR-101013) and ethical ICLAS ad ARRIVE [48] guidelines. Mice were maintained on standard laboratory food and water ad libitum, with a 12 h artificial light/dark cycle.
Retinoblastoma xenograft model
For the subcutaneous implants, animals were anesthetized by 2.5% isoflurane during manipulation. Weri-Rb-1 cells at a concentration of 3.6 X10 7 in 100ul 1X PBS were injected subcutaneously 1:1 with Matrigel TM basement membrane matrix (BD Biosciences, Franklin Lakes, NJ) into the left flank of each mouse (total volume 200 µl). Once grafts become palpable, their volume was measured with digital caliper (length x width2/2) and animals were assigned to experimental groups by minimization [48] (ARRIVE) to start the treatments. Tumor volume (mm3) was measured biweekly and confirmed by ultrasound imaging (VEVO) in the last session of measurement.
Retinoblastoma orthotopic model
The orthotopic retinoblastoma model was established mono-laterally in one eye with an injection of 1x10⁴ Weri-Rb-1 cells in 10 µl of PBS. Briefly, under the field of an operating microscope and by means of a Hamilton syringe (32G needle), the right eye globe of anesthetized animals was pierced laterally, through the conjunctiva and sclera, to reach vitreous cavity. Ultrasound Imaging (VEVO 2100, Visualsonics) was used to establish the tumor appearance. Treatment begun before visible leukocoria (white reflex in the eye pupil) appeared in the affected eye. Volume measurements were performed for group assignment (baseline) and then once a week to minimize animal distress due to repeated anesthesia.
The epigenetic therapy in vivo.
In each experimental setting (xenograft and orthotopic retinoblastoma models), the treated groups received biweekly I.V. injections of 300μl of 75μg DAC in PBS suspension (corresponding to the therapeutic dose of 2.5 mg/kg) and the control groups received PBS. At the end of each measuring and treatment session, animals were monitored for signs of distress and let recovering in the original cages. After 3 weeks of treatment, mice were sacrificed by CO2 inhalation. No sign of distress was detected [48] and no animal died during treatments. Resected tumor masses from subcutaneous xenografts were processed using TRIAZOL and stored for further analysis (qPCR).
Ultrasound Live imaging in orthotopic mouse model.
The Vevo 2100 (VisualSonics, Toronto, Canada) imaging system was used to measure retinoblastoma growth inside the eye. Animals were anesthetized with 5% isoflurane at an oxygen flow rate of 2 L/min (maintained at 2.5%isoflurane at an oxygen flow rate of 2 L/min) and placed on the warming pad in a prone position to favor signal acquisition and to monitor temperature, respiratory and heart rate. B mode images were acquired using the MS-550 Blue transducer (central frequency, 40 MHz) connected to a 3-dimensional motor collecting frames 0.5-mm apart, of the eye district. In the orthotopic model, for off-line analysis, a field of interest (FOI) outlining the tumor boundaries in the eye was drawn for the reconstruction in 3D B-mode. These results are normalised to baseline (volume at tumor appearance) and expressed as fold increase (V=Vtx/Vt0)  sem.
Statistical analysis.
For the in vitro experiments the results represent the mean ± sem of at least three independent experiments. Two-Way ANOVA was applied to compare the effect of the DAC treatments on cell cycle phases (sub G1, G0-G1, S, G2-M) at each of the time points (24, 48 and 72 hours). Similarly, Two-Way ANOVA was used to describe the significance of longitudinal effect of the treatment on the number of apoptotic cells (mean ± sem). For the significance of gene expression values in qPCR validation, the statistical analysis of ΔCt values was based on One-sample T-Test and expressed as mean ± sd.
 Two-Way ANOVA RM was applied to analyze the growth from subcutaneous and orthotopic Rb xenograft models (mean ± sed).

Supplementary Materials

The following supporting information can be downloaded at: Preprints.org, Figure S3: interaction of 15 key hub genes with other genes; Table S1: IIRC of primary retinoblastoma included in our study; Table S2: List of Primers for RT-qPCR analysis and for Methylation-specific PCR (MSP).

Author Contributions

Conceptualization, CC..; methodology, LG. AS. MT.; software, AS.; validation, AS. MT.; formal analysis, LG. CC. MT. AK.; investigation, LG; MT.AS.; resources, CC.; data curation, LG. CC. AS.; writing—original draft preparation, CC. LG .; visualization, LG. AS .; writing—review and editing, CC. LG .; supervision, CC; project administration, CC.; funding acquisition, CC. All authors have read and agreed to the published version of the manuscript.

Funding

This research was funded by Consiglio Nazionale delle Ricerche (CNR) of Italy

Institutional Review Board Statement

The animal study protocol was approved by the Italian Ministry of Health. The project was under the supervision of the Ethics Committee of Toscana life Sciences (Permit Number: # CNR-030314 and # CNR-101013).” for studies involving animals. Ethical review and approval were waived for patients samples analysis due to usage of existing datasets and the study does not involve experiments related to human subjects

Informed Consent Statement

Patient consent was waived due to usage of existing datasets and the study does not involve experiments related to human subjects.

Data Availability Statement

Publicly available datasets were analyzed in this study.

Acknowledgments

We sincerely thanks Dr Ilaria Naldi for her invaluable help in performing some of the in vitro experiments.

Conflicts of Interest

The authors declare no conflicts of interest.

References

  1. J. Wise et al., “Eye-related quality of life and activities of daily living in pediatric retinoblastoma patients: A single-center, non-controlled, cross-sectional analysis.,” Pediatr Blood Cancer, vol. 70, no. 8, pp. e30479, 2023.
  2. H. Dimaras et al., “Retinoblastoma.,” Nat Rev Dis Primers, vol. 1, pp. 15021, 2015.
  3. Singh, U.; Malik, M.A.; Goswami, S.; Shukla, S.; Kaur, J. Epigenetic regulation of human retinoblastoma. Tumor Biol. 2016, 37, 14427–14441, . [CrossRef]
  4. G. M. Tosi et al., “Genetic and epigenetic alterations of RB2/p130 tumor suppressor gene in human sporadic retinoblastoma: implications for pathogenesis and therapeutic approach.,” Oncogene, vol. 24, no. 38, pp. 5827-5836, 2005.
  5. Poeta, L.; Drongitis, D.; Verrillo, L.; Miano, M.G. DNA Hypermethylation and Unstable Repeat Diseases: A Paradigm of Transcriptional Silencing to Decipher the Basis of Pathogenic Mechanisms. Genes 2020, 11, 684, . [CrossRef]
  6. Costa, P.M.d.S.; Sales, S.L.A.; Pinheiro, D.P.; Pontes, L.Q.; Maranhão, S.S.; Pessoa, C.D..; Furtado, G.P.; Furtado, C.L.M. Epigenetic reprogramming in cancer: From diagnosis to treatment. Front. Cell Dev. Biol. 2023, 11, 1116805, . [CrossRef]
  7. U. Chianese et al., “Epigenomic machinery regulating pediatric AML: Clonal expansion mechanisms, therapies, and future perspectives.,” Semin Cancer Biol, vol. 92, pp. 84-101, 2023.
  8. Gherardini, L.; Sharma, A.; Capobianco, E.; Cinti, C. Targeting cancer with epi-drugs: a precision medicine perspective.. Curr. Pharm. Biotechnol. 2016, 17, 1–1, . [CrossRef]
  9. Katarzyna, R.; Lucyna, B. Epigenetic therapies in patients with solid tumors: Focus on monotherapy with deoxyribonucleic acid methyltransferase inhibitors and histone deacetylase inhibitors. J. Cancer Res. Ther. 2019, 15, 961–970, . [CrossRef]
  10. Song, Y.; Yang, G.; Ma, D.; Wang, W.; Leung, C. The role and prospect of lysine-specific demethylases in cancer chemoresistance. Med. Res. Rev. 2023, 43, 1438–1469, . [CrossRef]
  11. Li, F.; Xia, Q.; Ren, L.; Nie, Y.; Ren, H.; Guo, X.; Yu, J.; Xing, Y.; Chen, Z. GSDME Increases Chemotherapeutic Drug Sensitivity by Inducing Pyroptosis in Retinoblastoma Cells. Oxidative Med. Cell. Longev. 2022, 2022, 1–29, . [CrossRef]
  12. Salahuddin, A.; Ghanem, H.; Omran, G.A.; Helmy, M.W. Epigenetic restoration and activation of ERβ: an inspiring approach for treatment of triple-negative breast cancer. Med Oncol. 2022, 39, 1–11, . [CrossRef]
  13. Z. Zheng et al., “5-Aza-2′-deoxycytidine reactivates gene expression via degradation of pRb pocket proteins.,” FASEB J, vol. 26, no. 1, pp. 449-459, 2012.
  14. Greger, V.; Passarge, E.; Messmer, E.; Horsthemke, B.; Höpping, W. Epigenetic changes may contribute to the formation and spontaneous regression of retinoblastoma. Hum. Genet. 1989, 83, 155–158, . [CrossRef]
  15. Karmakar, A.; Khan, M.A.; Kumari, N.; Devarajan, N.; Ganesan, S.K. Identification of Epigenetically Modified Hub Genes and Altered Pathways Associated With Retinoblastoma. Front. Cell Dev. Biol. 2022, 10, 743224, . [CrossRef]
  16. Li, H.-T.; Xu, L.; Weisenberger, D.J.; Li, M.; Zhou, W.; Peng, C.-C.; Stachelek, K.; Cobrinik, D.; Liang, G.; Berry, J.L. Characterizing DNA methylation signatures of retinoblastoma using aqueous humor liquid biopsy. Nat. Commun. 2022, 13, 1–14, . [CrossRef]
  17. Livide, G.; Epistolato, M.C.; Amenduni, M.; Disciglio, V.; Marozza, A.; Mencarelli, M.A.; Toti, P.; Lazzi, S.; Hadjistilianou, T.; De Francesco, S.; et al. Epigenetic and Copy Number Variation Analysis in Retinoblastoma by MS-MLPA. Pathol. Oncol. Res. 2012, 18, 703–712, . [CrossRef]
  18. Malusa, F.; Taranta, M.; Zaki, N.; Cinti, C.; Capobianco, E. Time-course gene profiling and networks in demethylated retinoblastoma cell line. Oncotarget 2015, 6, 23688–23707, . [CrossRef]
  19. Song, J.; VanBuskirk, J.A.; Merbs, S.L. Regulation of Opsin Gene Expression by DNA Methylation and Histone Acetylation. Int. J. Mol. Sci. 2022, 23, 1408, . [CrossRef]
  20. Nguyen, C.T.; Weisenberger, D.J.; Velicescu, M.; A Gonzales, F.; Lin, J.C.Y.; Liang, G.; A Jones, P. Histone H3-lysine 9 methylation is associated with aberrant gene silencing in cancer cells and is rapidly reversed by 5-aza-2'-deoxycytidine.. 2002, 62, 6456–61.
  21. Kooi, I.E.; Mol, B.M.; Moll, A.C.; van der Valk, P.; de Jong, M.C.; de Graaf, P.; van Mil, S.E.; Schouten-van Meeteren, A.Y.; Meijers-Heijboer, H.; Kaspers, G.L.; et al. Loss of photoreceptorness and gain of genomic alterations in retinoblastoma reveal tumor progression. eBioMedicine 2015, 2, 660–670, . [CrossRef]
  22. Milošević, D.; Medeiros, A.S.; Piperac, M.S.; Cvijanović, D.; Soininen, J.; Milosavljević, A.; Predić, B. The application of Uniform Manifold Approximation and Projection (UMAP) for unconstrained ordination and classification of biological indicators in aquatic ecology. Sci. Total. Environ. 2021, 815, 152365, . [CrossRef]
  23. W. Zhang et al., “Comparative Study of Subcutaneous and Orthotopic Mouse Models of Prostate Cancer: Vascular Perfusion, Vasculature Density, Hypoxic Burden and BB2r-Targeting Efficacy.,” Sci Rep, vol. 9, no. 1, pp. 11117, 2019.
  24. Hazazi, A.; A AlShehah, A.; Khan, F.R.; Hakami, M.A.; Almarshadi, F.; Abalkhail, A.; Nassar, S.A.; Almasoudi, H.H.; Al Ali, A.; Abu-Alghayth, M.H.; et al. From Diagnosis to Therapy: The Transformative Role of lncRNAs in Eye Cancer Management. Pathol. - Res. Pr. 2024, 254, 155081, . [CrossRef]
  25. Al-Ghazzawi, K.; Wessolly, M.; Dalbah, S.; Ketteler, P.; Kiefer, T.; Bechrakis, N.; Leyla, J.; Ting, S.; Biewald, E.; Mairinger, F.D. PDGF, NGF, and EGF as main contributors to tumorigenesis in high-risk retinoblastoma. Front. Oncol. 2023, 13, 1144951, . [CrossRef]
  26. Rathore, S.; Verma, A.; Ratna, R.; Marwa, N.; Ghiya, Y.; Honavar, S.G.; Tiwari, A.; Das, S.; Varshney, A. Retinoblastoma: A review of the molecular basis of tumor development and its clinical correlation in shaping future targeted treatment strategies. Indian J. Ophthalmol. 2023, 71, 2662–2676, . [CrossRef]
  27. Zhang, X.; Jiang, Y.; Cai, Y.; Fu, Q.; Chen, Y. Epigenetics research in eye diseases: a bibliometric analysis from 2000 to 2023. Clin. Exp. Optom. 2023, 1–8, . [CrossRef]
  28. M. Kulis and M. Esteller, “DNA methylation and cancer.,” Adv Genet, vol. 70, pp. 27-56, 2010.
  29. Feinberg, A.P.; Koldobskiy, M.A.; Göndör, A. Epigenetic modulators, modifiers and mediators in cancer aetiology and progression. Nat. Rev. Genet. 2016, 17, 284–299, . [CrossRef]
  30. Jiang, Y.; Zheng, G.; Sun, X. PRMT5 promotes retinoblastoma development. Hum. Cell 2022, 36, 1–13, . [CrossRef]
  31. M. L. de Groote et al., “Epigenetic Editing: targeted rewriting of epigenetic marks to modulate expression of selected target genes.,” Nucleic Acids Res, vol. 40, no. 21, pp. 10596-10613, 2012.
  32. M. Berdasco et al., “DNA Methylomes Reveal Biological Networks Involved in Human Eye Development, Functions and Associated Disorders.,” Sci Rep, vol. 7, no. 1, pp. 11762, 2017.
  33. Choi, Y.K.; Kim, J.H.; Kim, W.J.; Lee, H.Y.; Park, J.A.; Lee, S.-W.; Yoon, D.-K.; Kim, H.H.; Chung, H.; Yu, Y.S.; et al. AKAP12 Regulates Human Blood–Retinal Barrier Formation by Downregulation of Hypoxia-Inducible Factor-1α. J. Neurosci. 2007, 27, 4472–4481, . [CrossRef]
  34. E. Jabbour et al., “Evolution of decitabine development: accomplishments, ongoing investigations, and future strategies.,” Cancer, vol. 112, no. 11, pp. 2341-2351, 2008.
  35. Yang, D.; Torres, C.M.; Bardhan, K.; Zimmerman, M.; McGaha, T.L.; Liu, K. Decitabine and Vorinostat Cooperate To Sensitize Colon Carcinoma Cells to Fas Ligand-Induced Apoptosis In Vitro and Tumor Suppression In Vivo. J. Immunol. 2012, 188, 4441–4449, . [CrossRef]
  36. Field, M.G.; Kuznetsoff, J.N.; Zhang, M.G.; Dollar, J.J.; Durante, M.A.; Sayegh, Y.; Decatur, C.L.; Kurtenbach, S.; Pelaez, D.; Harbour, J.W. RB1 loss triggers dependence on ESRRG in retinoblastoma. Sci. Adv. 2022, 8, eabm8466, . [CrossRef]
  37. Kolesnikov, A.V.; Luu, J.; Jin, H.; Palczewski, K.; Kefalov, V.J. Deletion of Protein Phosphatase 2A Accelerates Retinal Degeneration in GRK1- and Arr1-Deficient Mice. Investig. Opthalmology Vis. Sci. 2022, 63, 18–18, . [CrossRef]
  38. A. Sridhar et al., “Single-Cell Transcriptomic Comparison of Human Fetal Retina, hPSC-Derived Retinal Organoids, and Long-Term Retinal Cultures.,” Cell Rep, vol. 30, no. 5, pp. 1644-1659.e4, 2020.
  39. Almet, A.A.; Cang, Z.; Jin, S.; Nie, Q. The landscape of cell–cell communication through single-cell transcriptomics. Curr. Opin. Syst. Biol. 2021, 26, 12–23, . [CrossRef]
  40. Armingol, E.; Officer, A.; Harismendy, O.; Lewis, N.E. Deciphering cell–cell interactions and communication from gene expression. Nat. Rev. Genet. 2020, 22, 71–88, . [CrossRef]
  41. Arnol, D.; Schapiro, D.; Bodenmiller, B.; Saez-Rodriguez, J.; Stegle, O. Modeling Cell-Cell Interactions from Spatial Molecular Data with Spatial Variance Component Analysis., . [CrossRef]
  42. G. Dennis et al., “DAVID: Database for Annotation, Visualization, and Integrated Discovery.,” Genome Biol, vol. 4, no. 5, pp. P3, 2003.
  43. Maere, S.; Heymans, K.; Kuiper, M. BiNGO: a Cytoscape plugin to assess overrepresentation of Gene Ontology categories in Biological Networks. Bioinformatics 2005, 21, 3448–3449, . [CrossRef]
  44. Tirosh, I.; Izar, B.; Prakadan, S.M.; Wadsworth, M.H., II; Treacy, D.; Trombetta, J.J.; Rotem, A.; Rodman, C.; Lian, C.; Murphy, G.; et al. Dissecting the multicellular ecosystem of metastatic melanoma by single-cell RNA-seq. Science 2016, 352, 189–196, doi:10.1126/science.aad0501.
  45. Davis, S.; Meltzer, P.S. GEOquery: a bridge between the Gene Expression Omnibus (GEO) and BioConductor. Bioinformatics 2007, 23, 1846–1847, doi:10.1093/bioinformatics/btm254.
  46. Zhang, B.; Horvath, S. A General Framework for Weighted Gene Co-Expression Network Analysis. Stat. Appl. Genet. Mol. Biol. 2005, 4, Article17–Article17, . [CrossRef]
  47. Langfelder, P.; Horvath, S. WGCNA: an R package for weighted correlation network analysis. BMC Bioinform. 2008, 9, 559, . [CrossRef]
  48. N. Percie du Sert et al., “Reporting animal research: Explanation and elaboration for the ARRIVE guidelines 2.0.,” PLoS Biol, vol. 18, no. 7, pp. e3000411, 2020.
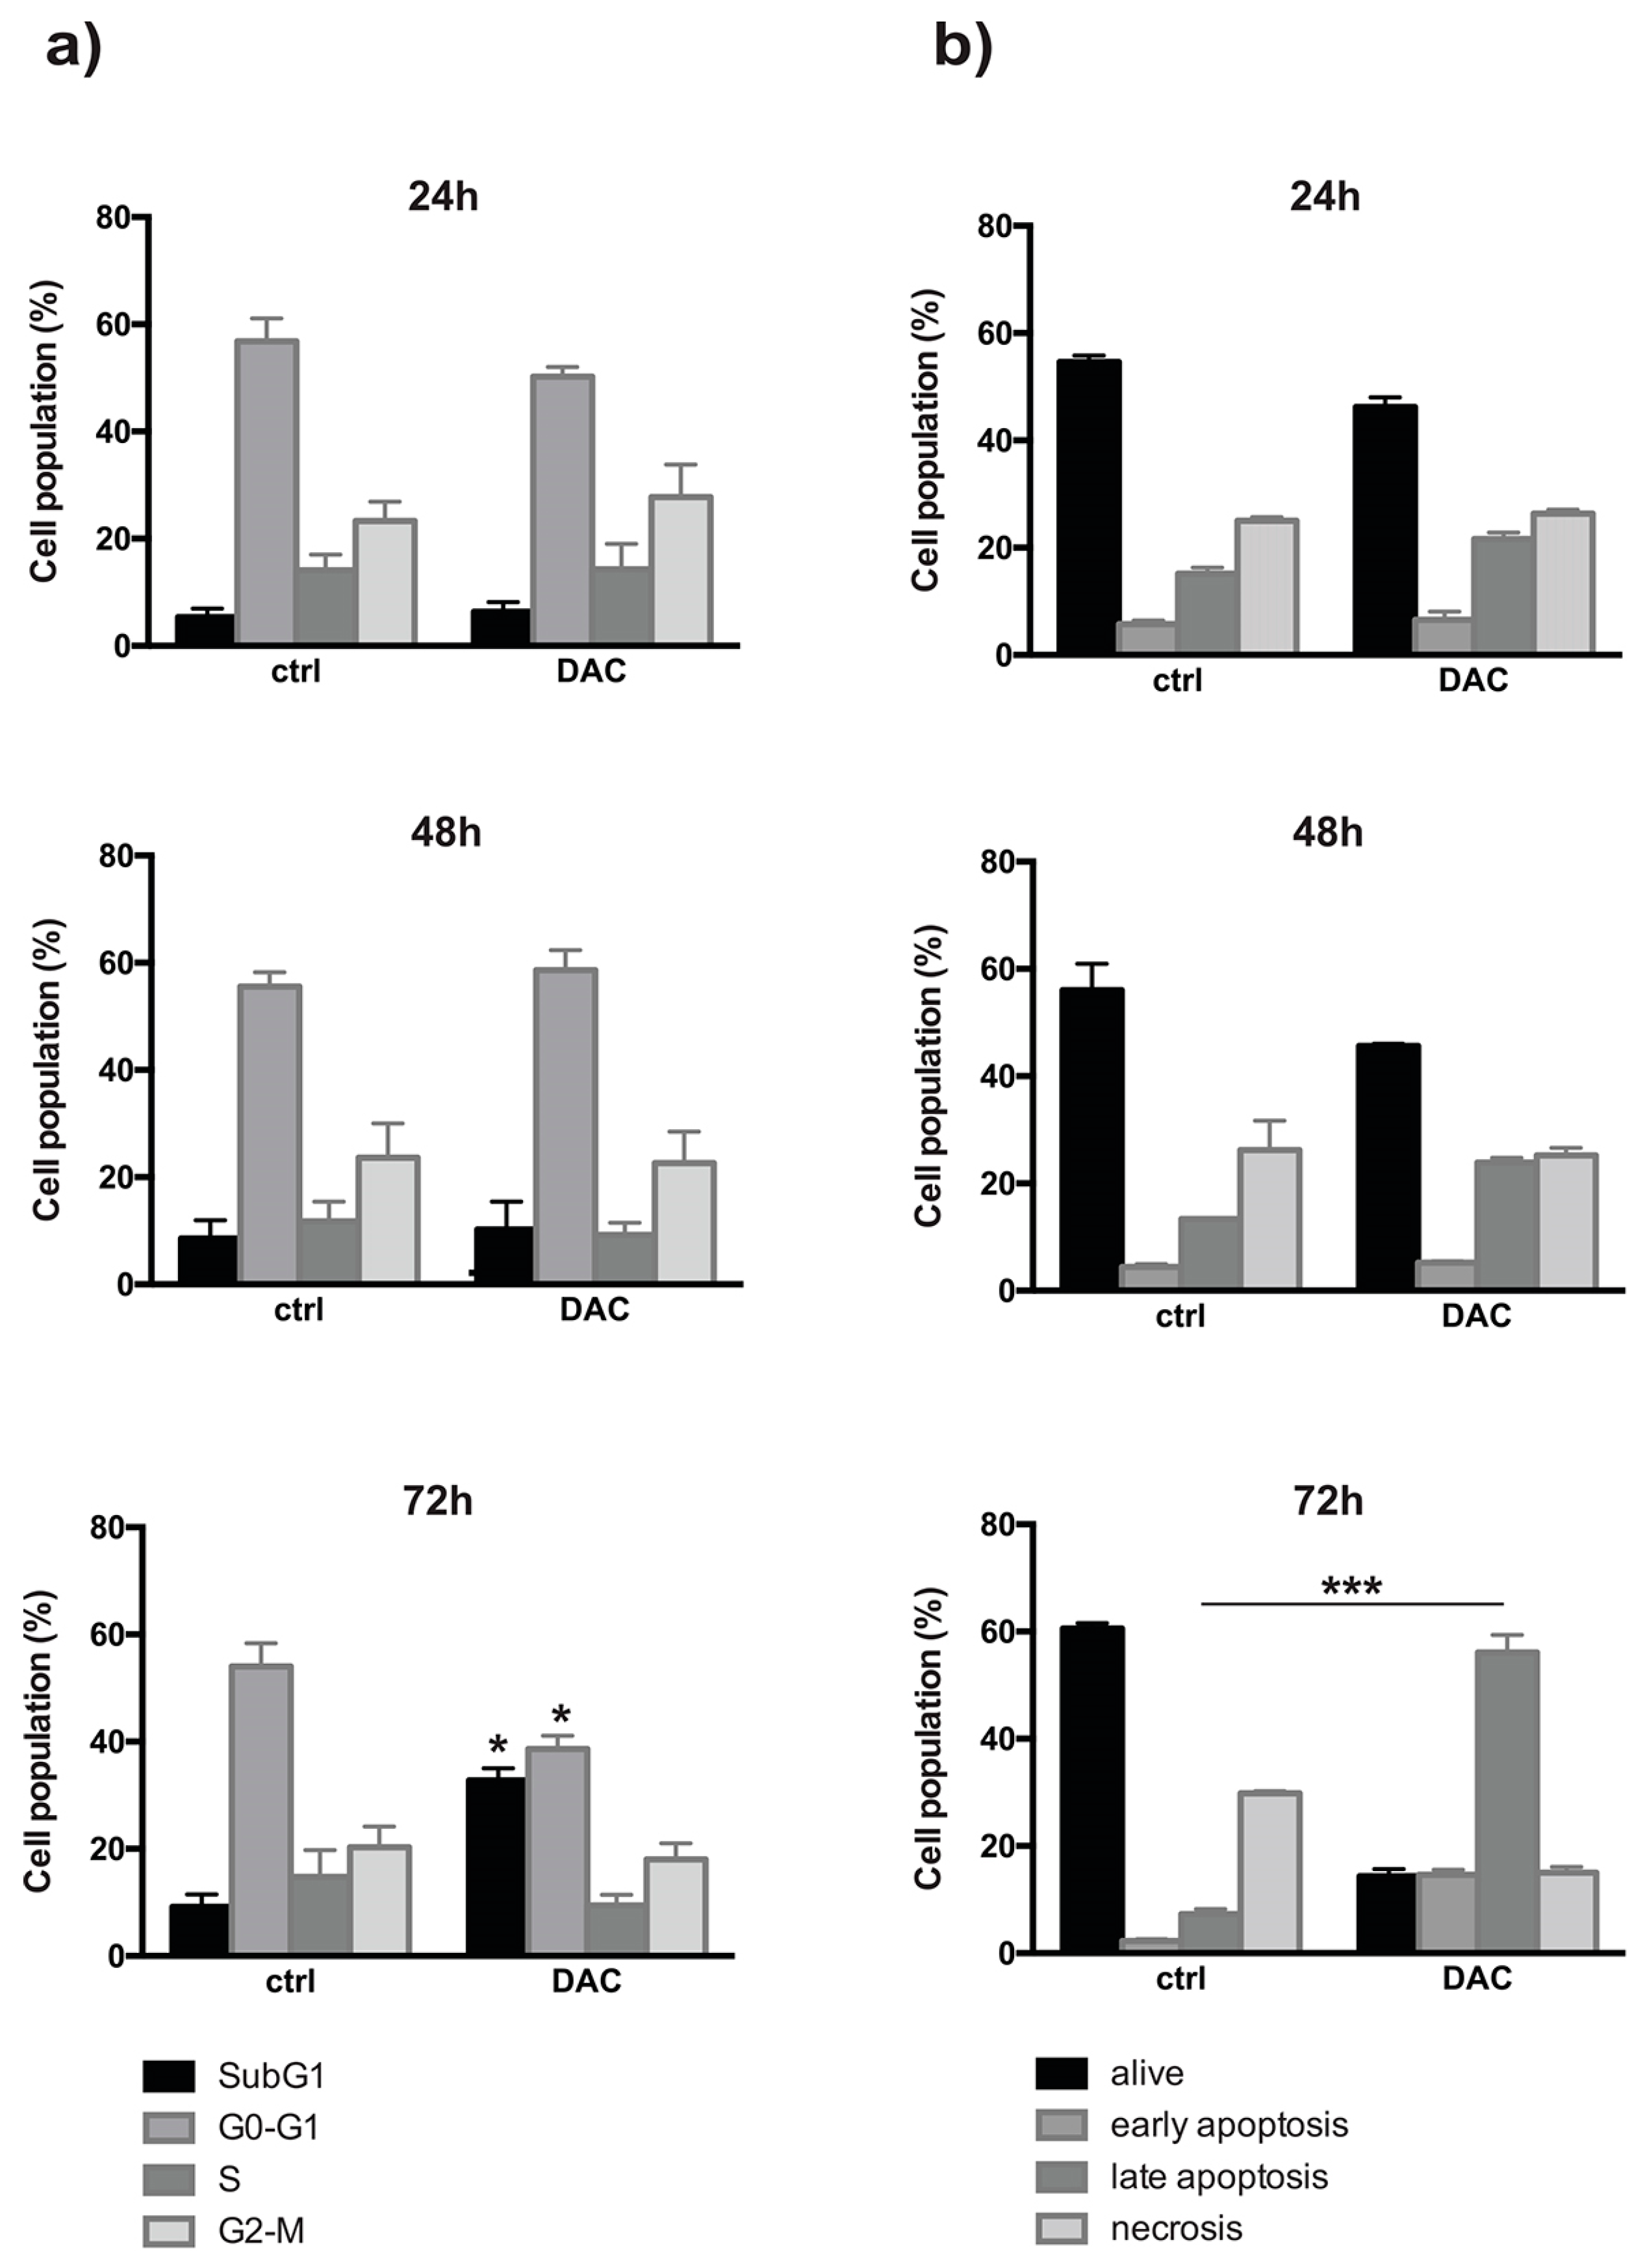
Figure 1. a) The effect of DAC on the cell cycle in Weri-Rb1 after 24, 48 and 72 hours of treatment shows significant increase of the cells in sub-G1 and G0-G1 phases (Mean ± SD. *P<0.05). b) Coherently, DAC affects the different state of Weri-Rb1 after 72 hours of treatment (***P<0.001) causing a noticeable increment of late apoptosis (Mean ± SD).
Preprints 104918 g001
Figure 2. Clustering of time related gene expression of treated Weri-Rb1 after 48, 72, and 96 hours exposure of DAC, with respect to control cells.
Preprints 104918 g002
Figure 3. Interaction network maps: related pathways referend to 15 hub genes. The 15 genes are represented as squared nodes. The size grows with their “connectedness” accordingly to the number of pathways they interact with.
Preprints 104918 g003
Figure 4. RT-qPCR analysis. Fold change (log2 transformed) of gene expression in DAC-treated Wery-Rb1 samples referred to the controls at 48, 72 and 96 hrs., reported as Mean ± SD (T-Test *P<0.05).
Preprints 104918 g004
Figure 5. Methylation-specific PCR analysis of the promoter region of indicated genes in untreated (CTRL) and DAC-treated (DAC) samples. M = methylated PCR products, U = unmethylated PCR products.
Preprints 104918 g005
Figure 6. a) Gene Mapping of selected Patient-derived retinoblastoma samples (RB025; RB026; RB027; RB028; RB029). Human retina organoids (ORG_D104; ORG_D110) and single cells of fetal retinas (RS_D134_pl_26FV). b) restricted clusters (cells cut SCT-snn-res.0.35) Identified by representative gene expression. c ) Bubble plot of showing the expression some of the genes (listed in Table 1) in Rb patient’s samples and normal retina cells by Single cell RNA seq. The radium of the bubble indicates prevalence of expression, the color represents the log value of up and down gene expression.
Preprints 104918 g006
Figure 7. The effect of DAC treatment on cancer growth in Weri-Rb1 xenografts: Representative 3D reconstruction images of control (a, b) and treated (c, d) xenograft tumors collected during the last in vivo confirmatory session of acquisition with VEVO 2100 imaging system (frame acquisition by length, 0,11mm frame step for 3D reconstruction measurement. e) Tumor growth curve in control (circles) and treated (tringles) experimental group. Volumes (mm3) were collected by manual caliper throughout the experiment and expressed as mean values ± SEM. ***P<0.0001 (TW-ANOVA RM *P<0.05).
Preprints 104918 g007
Figure 8. RT-qPCR analysis. Fold change (log2 transformed) of gene expression in DAC-treated xenografts relative to the controls after sample collection, reported as Mean ± SD.
Preprints 104918 g008
Figure 9. The effect of systemic DAC treatment on the growth of intraocular retinoblastoma in a orthotopic mouse model. a) Ocular district of a mono-ocular established model where retinoblastoma tumor mass is growing in the left eye while the right eye is not affected. Representative images of affected eye in control (saline injected) (b) and treated (d) animals and the relative off-line 3D reconstruction used for volume measurement (c; e). Echography acquisition was performed to ensure baseline values (no treatment) and once a week during the three weeks of treatments. f) Normalized intraocular tumor volumes (mean values ± SEM) of DAC (treated) or saline (controls) are reported (TW-ANOVA RM *P<0.05).
Preprints 104918 g009
Table 1. Selected Differential Expressed genes from cluster 0, 1, 2 and 3 in Figure 2 at the different time points (48, 72, 96 hours) after DAC treatments.
Preprints 104918 i001
Preprints 104918 i002
Disclaimer/Publisher’s Note: The statements, opinions and data contained in all publications are solely those of the individual author(s) and contributor(s) and not of MDPI and/or the editor(s). MDPI and/or the editor(s) disclaim responsibility for any injury to people or property resulting from any ideas, methods, instructions or products referred to in the content.
Copyright: This open access article is published under a Creative Commons CC BY 4.0 license, which permit the free download, distribution, and reuse, provided that the author and preprint are cited in any reuse.
Prerpints.org logo

Preprints.org is a free preprint server supported by MDPI in Basel, Switzerland.

Subscribe

© 2024 MDPI (Basel, Switzerland) unless otherwise stated