Preprint
Article

Design, Synthesis and In Vitro Analysis of New Vemurafenib Analogs

Altmetrics

Downloads

117

Views

65

Comments

0

Submitted:

25 April 2024

Posted:

26 April 2024

You are already at the latest version

Alerts
Abstract
Metastatic melanoma patients have a poor prognosis with poor responsiveness to chemotherapy. BRAF V600E mutations have been detected in ~40% of melanoma patients. Vemurafenib is an oral agent licensed for patients with BRAF V600E mutation-positive inoperable and metastatic melanoma, which already presents resistance that leads to patient relapse and the serious side effects. In our study, we synthesized 5 new vemurafenib analogs, RF-86A, RF-87A, RF-94A, RF-94B and RF-96B, with structural improve-ments, in order to increase the anti-proliferative and anti-metastatic effect on human melanoma. We showed that the analogs were efficient in inducing cell death and reducing the migration of A375 cells, by inhibition of MMP-2 and MMP-9 activity, indicating that this action may be longer lasting comparing to the action of Vemurafenib.
Keywords: 
Subject: Biology and Life Sciences  -   Biochemistry and Molecular Biology

1. Introduction

Metastatic melanoma patients have a poor prognosis with poor responsiveness to chemotherapy. Metastasis is the major cause of death for patients with cancer and this complex multistep process involves cell adhesion, motility, proteolysis degradation of ECM, angiogenesis, and invasion [1]. About 50% of melanomas harbor activating BRAF mutations (over 90 % V600E). The BRAF V600 mutated gene product is translated to a constitutively activated BRAF protein that dysregulates the downstream mitogen-activated protein kinase (MAPK) signaling transduction [2]. This pathway activation is required in melanoma proliferation, apoptosis inhibition, and progression.
Vemurafenib is an oral agent licensed for patients with BRAF V600E mutation-positive inoperable and metastatic melanoma. Exhibits dose-dependent anti-proliferative and apoptotic effects in melanoma cells via downstream inactivation of the MAPK signaling cascade [3]. Vemurafenib provides substantial benefits for melanoma patients, but a major challenge in melanoma treatment with mitogen-activated protein kinase (MAPK)-targeted therapy is an almost universal emergence of resistance that leads to patient relapse and the serious side effects like fatigue, arthralgia, headache, cutaneous toxicities and growth of secondary skin neoplasms [4]. So, finding new molecules, inhibitors of BRAF V600E, as a starting point the compound vemurafenib, that can present good activity and less side effects, may represent a big step for the treatment of metastatic melanoma.
Our group synthesized 5 new vemurafenib analogs, 2a (RF-86A), 2d (RF-87A), 2c (RF-94A), 2b (RF-94B) and 2e (RF-96B), with structural improvements, to increase the anti-proliferative and anti-metastatic effect on human melanoma. In this work, we describe the structural design, synthesis, and in vitro pharmacological profile of an unheard class of Vemurafenib analogs, against human melanoma cells, presenting evidence for cytotoxicity, anti-invasive and anti-metastatic effects.

2. Results

2.1. Analogs Synthesis

The synthetic methodology for obtaining the molecules in this work is a convergent synthesis of 5 steps and is presented in Scheme 1 and Scheme 2. Initially, the carboxylic acids (3a-e) were converted to their respective methyl esters (4a-e) through the Fischer esterification reaction in methanol, toluene in acid catalysis promoted by sulfuric acid and refluxing at 100°C with varying yields [5]. Then, the methyl esters (4a-e) were added to 1M ethanolic solution of hydrazine (NH2NH2) at reflux for 48 hours to obtain the corresponding hydrazides (5a-e) in yields of 50 to 63% (Scheme 1) [6,7].
In parallel, the commercial reagent 5-bromo-7-azaindole (6) was regioselectively formylated at position 3 through the Duff reaction by adding hexamethylenetetramine (HMTA) in acetic acid (HOAc) and water at reflux for 16 hours to obtain 5-bromo-3-carboxyaldehyde-7-azaindole (7) in 66% yield [8]. Finally, the synthesized aldehyde (7) was added, separately, to the different hydrazides (5a-e) obtained in Scheme 1 in the presence of ethanol and hydrochloric acid catalysis at room temperature for 6 hours to form the respective N-acylhydrazones (2a-e) in good yields [7].
For the final products, it was possible to state that N-acylhydrazone (NAH) was formed through the presence of two characteristic signals in the 1H-NMR spectrum: amidic hydrogen (RCONH-CH=) as a broad signal with integral 1 by around 12 ppm, and the imine hydrogen (RCONH-CH=) as a simplet with integral 1 at approximately 8.5 ppm. In the 13C-NMR spectra, the two carbons of the NAH group were visualized at approximately 160 ppm (RCONH-CH=) and around 144 ppm (RCONH-CH=), confirming the obtaining of the molecules. In this scenario, it is worth highlighting that despite NAH being able to present two different diastereoisomers: the E-diastereoisomer and the Z-diastereoisomer [9], only E-diastereoisomer was formed in four molecules (2a-d) in this series. We can strongly suggest the stereoselective formation of the reaction due to the absence of duplication of signals in all 1H-NMR spectra of the molecules in this series. This fact is already well described in the literature by our research group and other researchers [10,11,12].
However, molecule 2e (RF-96B) was formed as a mixture of E/Z diastereoisomers since some specific signals close to the double bond were seen duplicated in NMR-1H. These signals were the imine hydrogen (8.27 and 8.11 ppm, integral = 1) and amidic hydrogen (11.17 and 11.05 ppm, integral = 1) and the methylene group (2.83 and 2.26 ppm, integral = 2) neighboring the carbonyl of the NAH fragment. In NMR-13C all signals referring to methylene carbons are duplicated. The formation of this mixture of diastereoisomers in NAH is due to the large conformational degree of freedom in hydrazide (5e). It has already been reported in the literature that hydrazides containing hybridized carbons such as sp3 near the carbonyl will form diastereoisomeric mixtures in NAH [11]. However, it should be noted that the 1H-NMR and 13C spectra of the methyl ester (4e) and hydrazide (5e) (supplementary material) do not present duplicate signals, since there is no possibility of forming diastereoisomers.
Reagents and solvents were purchased from suppliers and were used without prior treatment. NMR spectra were obtained on Bruker AVIII500 (11.7 T) operating at 500 MHz and on Bruker AVHD400 (9,4 T) operating at 400 MHz. Chemical shifts (δ) were given in parts per million (ppm) from tetramethylsilane (TMS) as internal standard, and values of coupling constant (J) were given in Hertz (Hz). The deuterated solvent used to obtain the spectra was dimethyl sulfoxide-d6 (DMSO-d6) using specific NMR glass tubes. The peak areas of the NMR spectra were obtained by electronic integration and the multiplicities were described as follows: s (simple); d (doublet); t (triplet), m (multiplet) and dd (double doublet). The spectra of the Infrared region were generated on the Varian FT-IR 660 Spectrometer.
Purity of the final products was quantified through the analysis of chromatograms obtained by High Performance Liquid Chromatography (HPLC) on the Shimadzu LC-20AD device, with a Kromasil 100-5 C18 column (4.6 mm x 250 mm) and SPD-M20A detector (Diode Array). Quantification of purity was performed at a wavelength of 300 nm, and the mobile phase used was acetonitrile and water (80%) with running time of 20 minutes.
Synthetic methodologies used to prepare methyl esters (4a-e) have been carefully described in a published paper [12,13,14,15,16]. In a similar way, hydrazides (5a-e) were synthesized using methods described in the literature [12,13,15,16,17]. And 5-bromo-1H-pyrrolo[2,3-b]pyridine-3-carbaldehyde (7) was synthesized as described by [8].

2.2. General mechanism for obtaining N-acylhydrazones (2a-e)

To the 100 mL round bottom flask was added picolinohydrazide (5d, 0.18g, 1.3 mmol, 1 equivalent) and 5-bromo-1H-pyrrolo[2,3-b]pyridine-3-carbaldehyde (7, 0,35 g, 1.6 mmol, 1.2 equivalents) and 30 mL of ethanol. After turning on the magnetic stirring, 5 drops of hydrochloric acid were added to the reaction mixture. The reaction was then stirred for 6 hours at room temperature, with precipitates forming during the first minutes of the reaction. After this time, the volume of ethanol was reduced under reduced pressure, and the solid was isolated through filtration using a porcelain funnel to obtain the desired final product (2d).
  • (E)-N-((5-bromo-1H-pyrrolo[2,3-b]pyridin-3-yl)methylene)-5,6,7,8-tetrahydronaphthalene-2-carbohydrazide (2a or RF-86B)
Pinkish amorphous solid; 70%; mp 260-261 °C. Purity (HPLC): 97.1%
IR (cm-1): 626 (ʋ C-Br), 1613 (ʋ C=C), 1651 (ʋ C=O), 3102 (ʋ N-H). 1H-NMR (500 MHz, DMSO) δ 12.34 (s, 1H, H7), 11.58 (s, 1H, H13), 8.74 (d, J = 2.2 Hz, 1H, H2), 8.56 (s, 1H, H11), 8.39 (d, J = 2.3 Hz, 1H, H6), 8.04 (d, J = 2.7 Hz, 1H, H17), 7.64 (d, J = 4.2 Hz, 2H, H8, H21), 7.21-7.17 (m, 1H, H18), 2.81-2.76 (m, 4H, H22, H25), 1.79-1.74 (m, 4H, H23, H24). 13C-NMR (126 MHz, DMSO) δ 162.6 (C14), 147.7 (C4), 144.0 (C11), 143.3 (C2), 140.6 (C20), 136.7 (C19), 131.9 (C8), 131.8 (C6), 130.8 (C16), 128.9 (C21), 128.0 (C18), 124.6 (C17), 118.3 (C5), 112.0 (C9), 110.4 (C1), 28.83 (C25) 28.81 (C22) 22.4 (C23), 22.5 (C24).
  • (E)-N-((5-bromo-1H-pyrrolo[2,3-b]pyridin-3-yl)methylene)picolinohydrazide (2b or RF-87A)
Light yellow amorphous solid; 91%; mp 245-246 °C. Purity (HPLC): 98.6%
IR (cm-1): 619 (ʋ C-Br), 1615 (ʋ C=C), 1671 (ʋ C=O), 3099 (ʋ N-H). 1H-NMR (500 MHz, DMSO) δ 12.36 (s, 1H, H7), 12.04 (s, 1H, H13), 8.76 (d, J = 2.2 Hz, 1H, H20), 8.74 (s, 1H, H11), 8.71 (d, J = 4.6 Hz, 1H, H2), 8.40 (d, J = 2.3 Hz, 1H, H17), 8.13 (d, J = 7.8 Hz, 1H, 6H), 8.06 (t, J = 7.7 Hz, 1H, H18), 8.02 (d, J = 2.7 Hz, 1H, H8), 7.68-7.64 (m, 1H, H19). 13C-NMR (126 MHz, DMSO) δ 160.0 (C14), 149.9 (C16), 148.4 (C20), 147.7 (C4), 144.9 (C2), 144.1 (C11), 138.01 (C18), 132.0 (C8), 131.9 (C6) 126.8 (C19), 122.5 (C17), 118.4 (C5), 112.1 (C9), 110.3 (C1).
  • (E)-N-((5-bromo-1H-pyrrolo[2,3-b]pyridin-3-yl)methylene)pyrazine-2-carbohydrazide (2c or RF-94A)
Pinkish amorphous solid; 88%; mp 304 - 306 °C. Purity (HPLC): 98.2%
IR (cm-1): 673 (ʋ C-Br), 1611 (ʋ C=C), 1643 (ʋ C=O), 3085 (ʋ N-H). 1H-NMR (500 MHz, DMSO) δ 12.39 (s, 1H), 12.20 (s, 1H), 9.27 (d, J = 1.3 Hz, 1H), 8.92 (d, J = 2.4 Hz, 1H), 8.79 (dd, J = 2.3, 1.5 Hz, 1H), 8.76 (d, J = 2.2 Hz, 1H), 8.74 (s, 1H), 8.40 (d, J = 2.3 Hz, 1H), 8.06 (d, J = 2.8 Hz, 1H). 13C-NMR (126 MHz, DMSO) δ 159.1 (C14), 147.7 (C4), 147.6 (C20), 145.6 (C19), 144.9 (C16), 144.1 (C11), 144.0 (C17), 143.3 (C2), 132.4 (C8), 131.9 (C6), 118.4 (C5), 112.2 (C9), 110.2 (C1).
  • (E)-N-((5-bromo-1H-pyrrolo[2,3-b]pyridin-3-yl)methylene)quinoxaline-2-carbohydrazide (2d or RF-94B)
Yellow amorphous solid; 84%; mp 286 - 288°C. Purity (HPLC): 98.5%
IR (cm-1): 628 (ʋ C-Br), 1610 (ʋ C=O), 1668 (ʋ C=C), 3099 (ʋ N-H). 1H-NMR (500 MHz, DMSO) δ 12.41 (s, 1H, H7), 12.27 (s, 1H, H13), 9.53 (s, 1H, H17), 8.80 (s, 1H, H11), 8.78 (d, J = 2.3 Hz, 1H, H2), 8.41 (d, J = 2.3 Hz, 1H, H6), 8.27 (dd, J = 6.1, 3.7 Hz, 1H, H22), 8.21 (dd, J = 6.7, 3.2 Hz, 1H, H25), 8.08 (d, J = 2.4 Hz, 1H, H8), 8.03-7.99 (m, 2H, H23, H24). 13C-NMR (126 MHz, DMSO) δ 159.5 (C14), 147.8 (C4), 145.9 (C11), 144.6 (C19), 144.2 (C2), 144.1 (C17), 143.0 (C16), 139.8 (C20), 132.6 (C8), 132.1 (C6), 132.0 (C23), 131.4 (C25), 129.5 (C24), 129.2 (C22), 118.4 (C5), 112.3 (C9), 110.2 (C1).
  • (EZ)-N-((1H-pyrrolo[2,3-b]pyridin-3-yl)methylene)-4-(1H-indol-3-yl)butanehydrazide (2e or RF-96B)
White amorphous solid; 75%; mp 218-220 °C. Purity (HPLC): 96.8 %
IR (cm-1): 689 (ʋ C-Br), 1619 (ʋ C=C), 1655 (ʋ C=O), 3292 (ʋ N-H). 1H-NMR (400 MHz, DMSO) δ 12.27 (s, 1H, NH indole), 11.17 (s) and 11.05 (s, 1H, H3), 10.7 (d, 1H, NH azaindole) 8.65 (d, J = 2.3 Hz) and 8.53 (d, J = 2.2 Hz, 1H, H10), 8.38 (dd, J = 5.9, 2.3 Hz, H20), 8.27 (s) and 8.11 (s, 1H, H5), 7.97 (d, J = 5.2 Hz, 1H, H13), 7.53 (d, J = 7.9 Hz, 1H, H11), 7.37- 7.29 (m, 1H, H24), 7.14 (d, J = 5.8 Hz, 1H, H27), 7.09-6.88 (m, 2H, H25 and H26), 2.83 (t, J = 7.4 Hz) and 2.26 (t, J = 7.4 Hz, 2H, H1) 2.73 (dd, J = 18.2, 7.8 Hz, 2H, H18), 2.00 (td, J = 14.7, 7.6 Hz, 2H, H17). 13C-NMR (100 MHz, DMSO) δ 173.76 (C12), 168.2 (C2), 147.6 (C8), 143.9 (C5), 141.8 (C13), 138.7 (C10), 136.3 (C22), 131.8 (C11), 131.4 (C20), 127.2 (C23), 122.3 (C25), 120.8 (C26), 118.3 (C27), 114.1 (C7), 112.0 (C6), 111.3 (C24), 110.3 (C19), 34.0 and 32.5 (C1), 25.9 and 25.4 (C18), 24.7 and 24.3 (C17).

2.3. Effects on Cell Viability

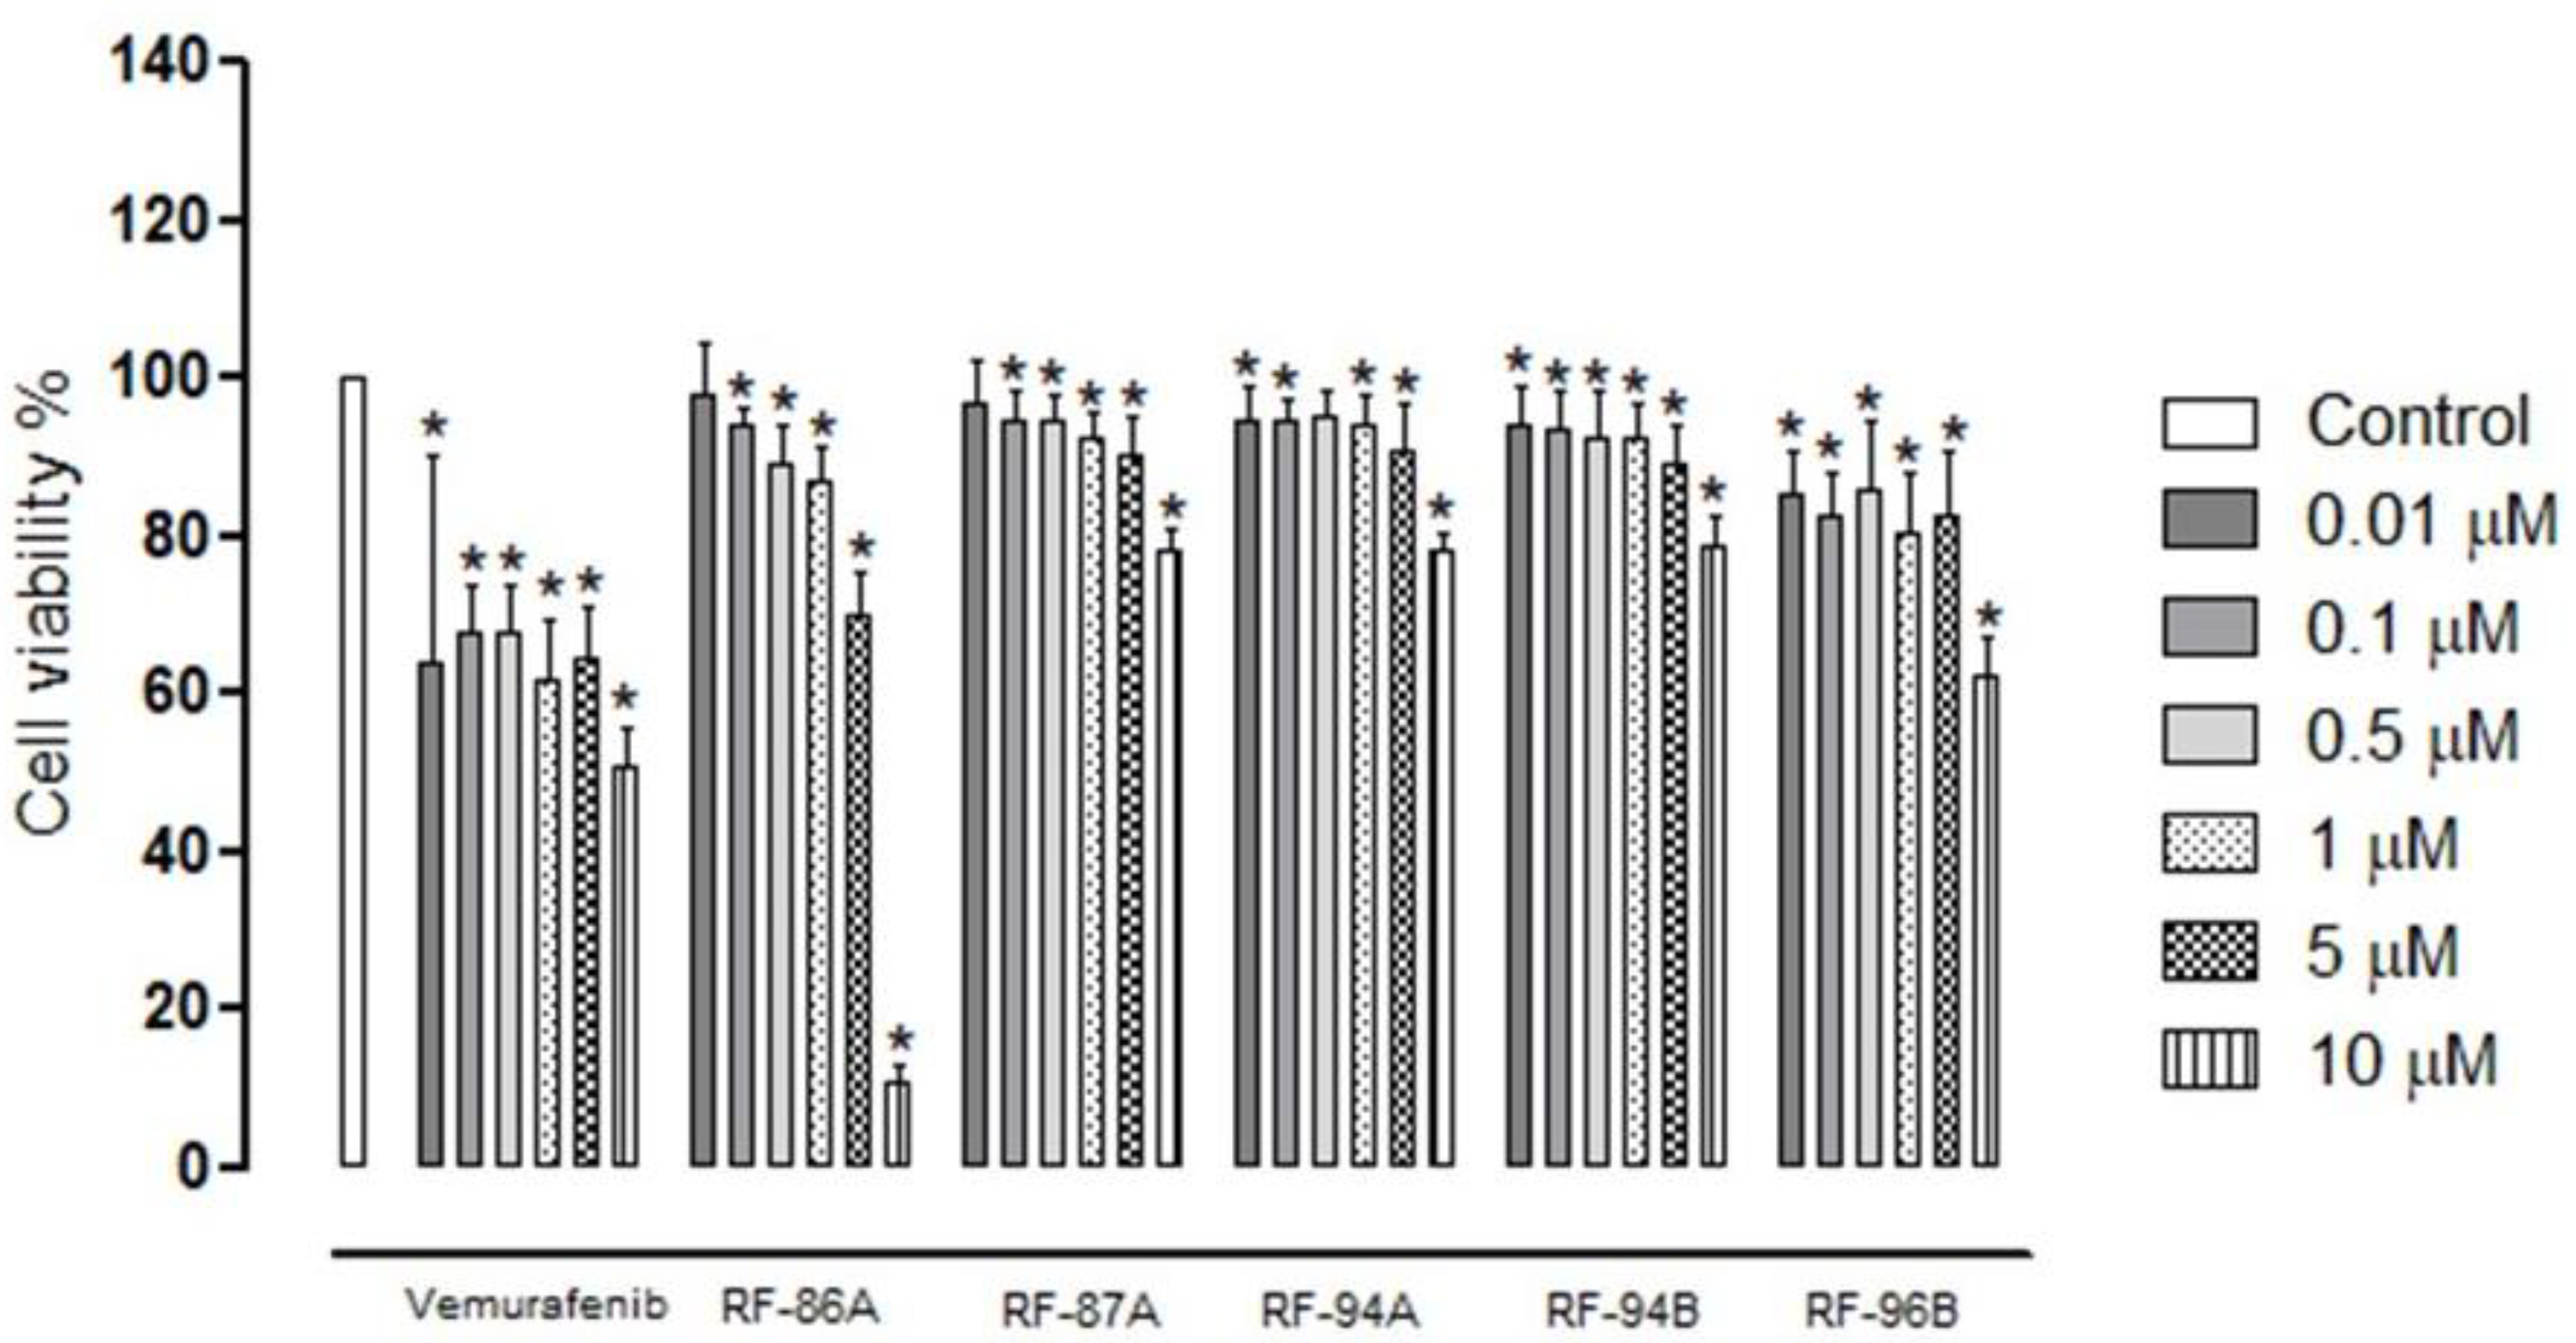
To study the role of new analogs of vemurafenib in human melanoma cells A375 we chose a range of concentrations since 0.01 to 10 μM. To analyze if these concentrations can reduce the viability of the cells we performed the MTS assay. The results showed that after 24h of treatment with all the analogs tested were able to reduce the viability of the A375 cells as well as the standard compound, vemurafenib (Figure 1). The mean IC50 values of vemurafenib and analogs are represented in Table 1. Noteworthy, the vemurafenib analog, RF-96B (2e), presented better cytotoxic activity between the other analogs (IC50 0.45±0.71 μM).

2.4. Vemurafenib and Analogs Caused DNA Fragmentation in A375 Cells

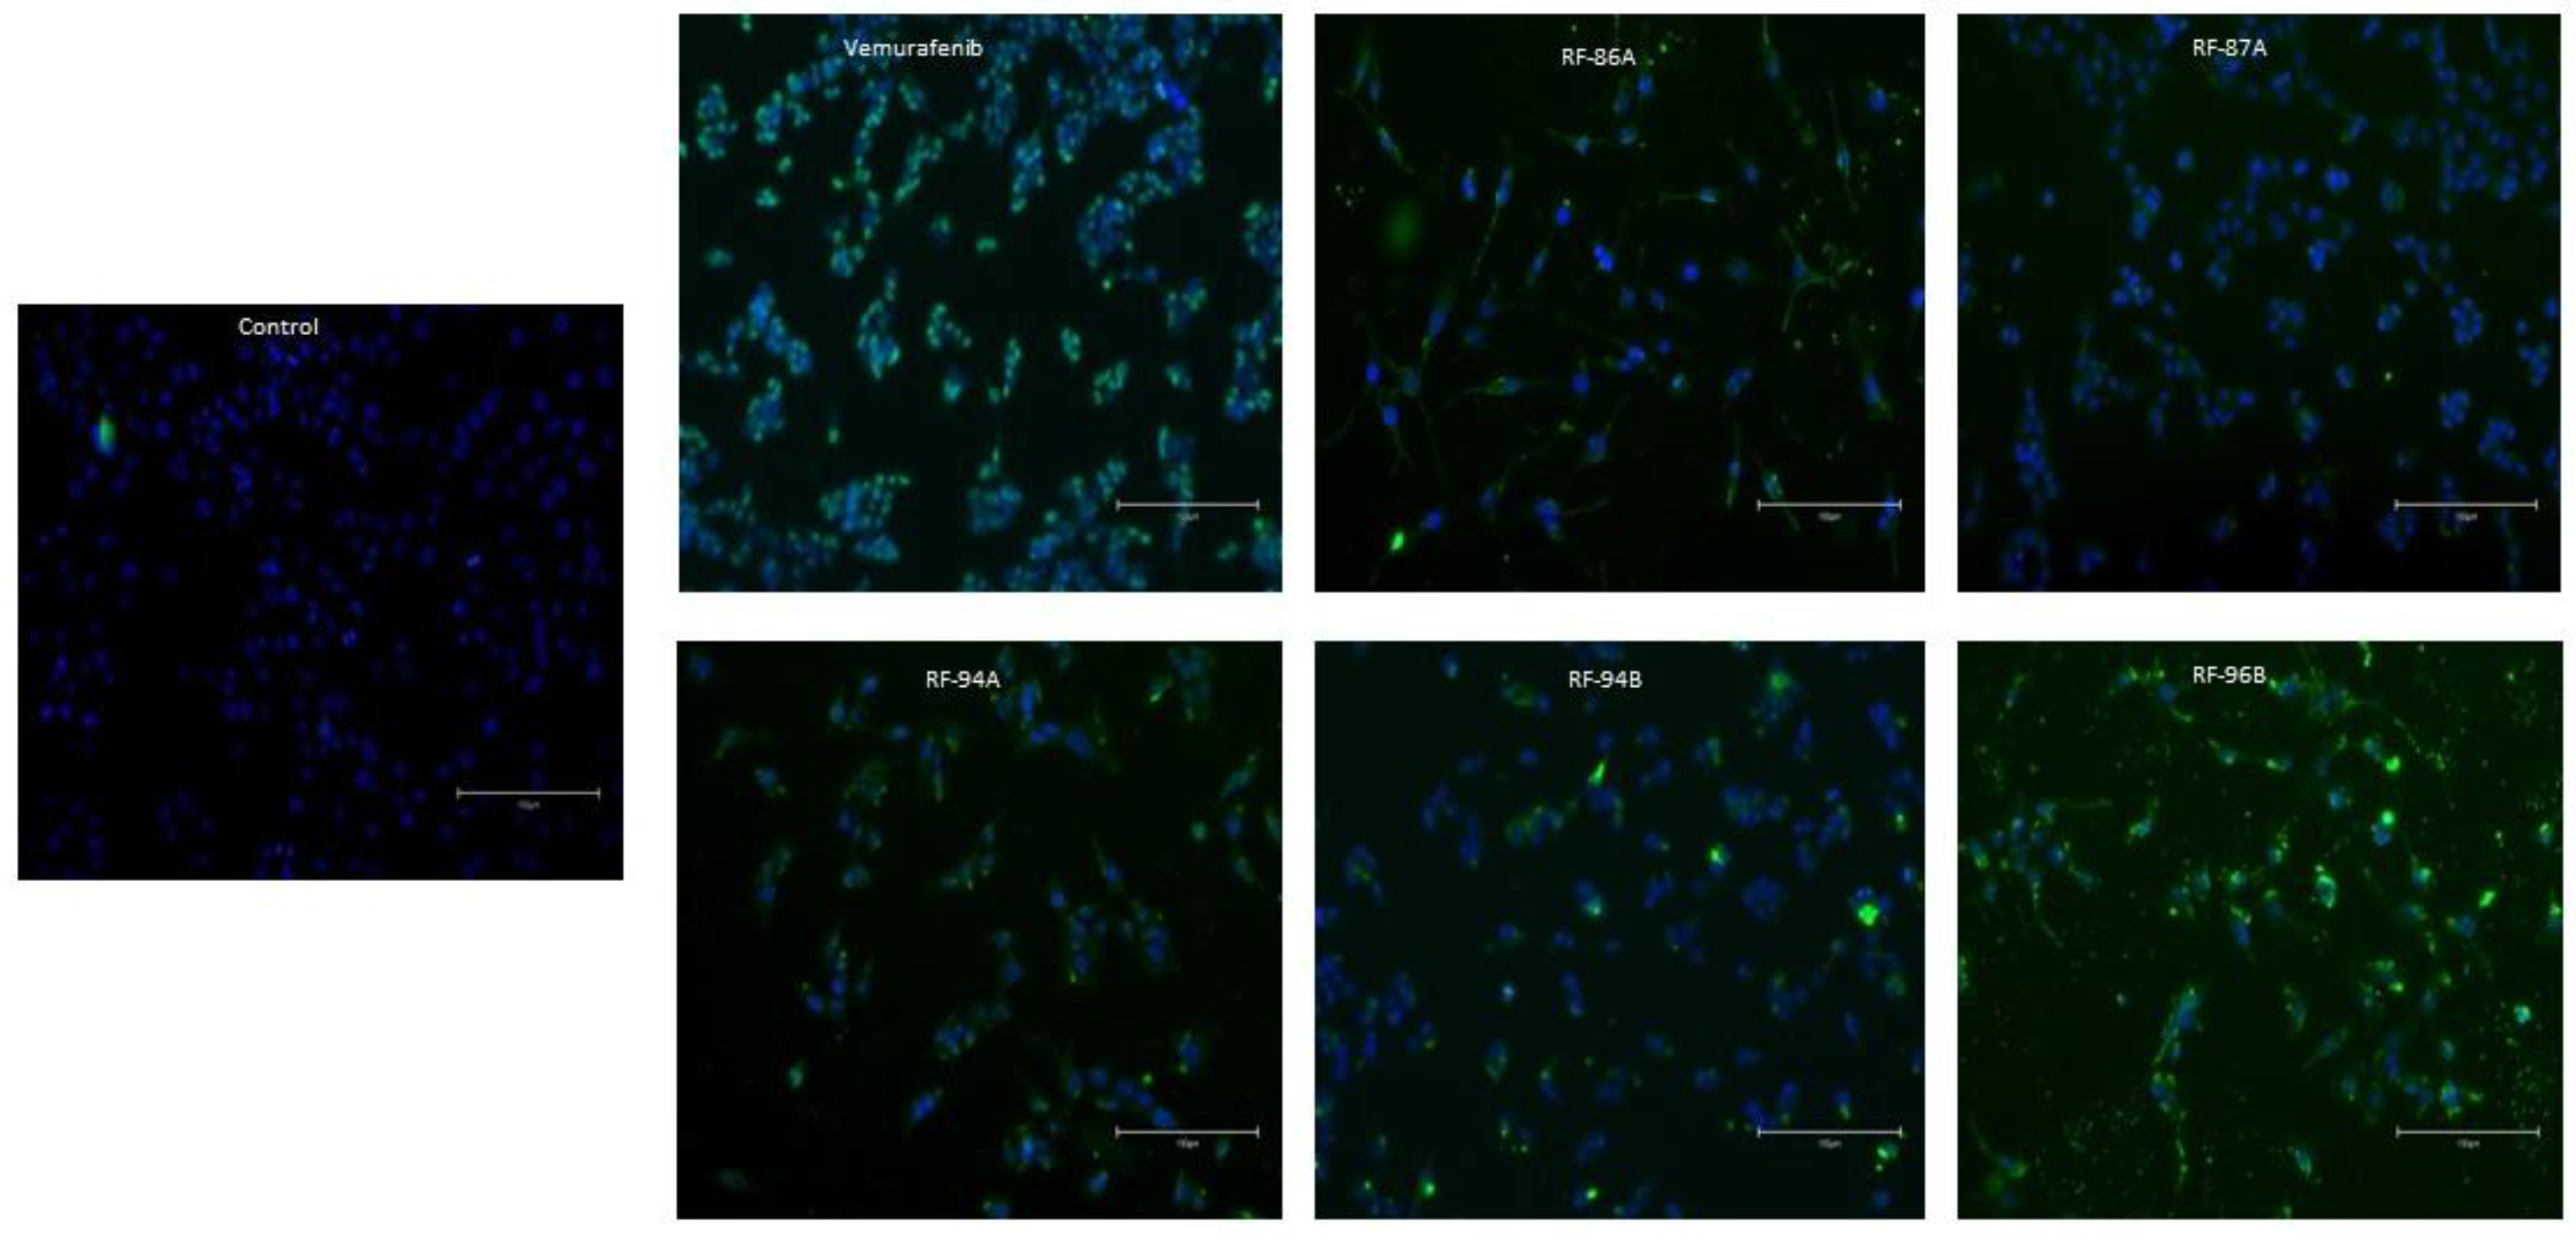
To understand the mechanisms involved in cell death, we carried out TUNEL assay–PI double staining. TUNEL assay is a well-known method for detecting such DNA fragments.
As shown in the Figure 2, normal cells had blue nucleus while treated cells with all compounds tested presented apoptotic cells revealed themselves as green-TUNEL-positive cells Indeed, all the compounds tested induced DNA fragmentation after 5 μM treatment during 24h, but the analogs RF-94A (2c) and RF-96B (2e) presented major number of apoptotic cells than the other analogs, as well as, the vemurafenib, at the same conditions.

2.5. Cell Apoptosis Detected by Cell Morphology Analysis

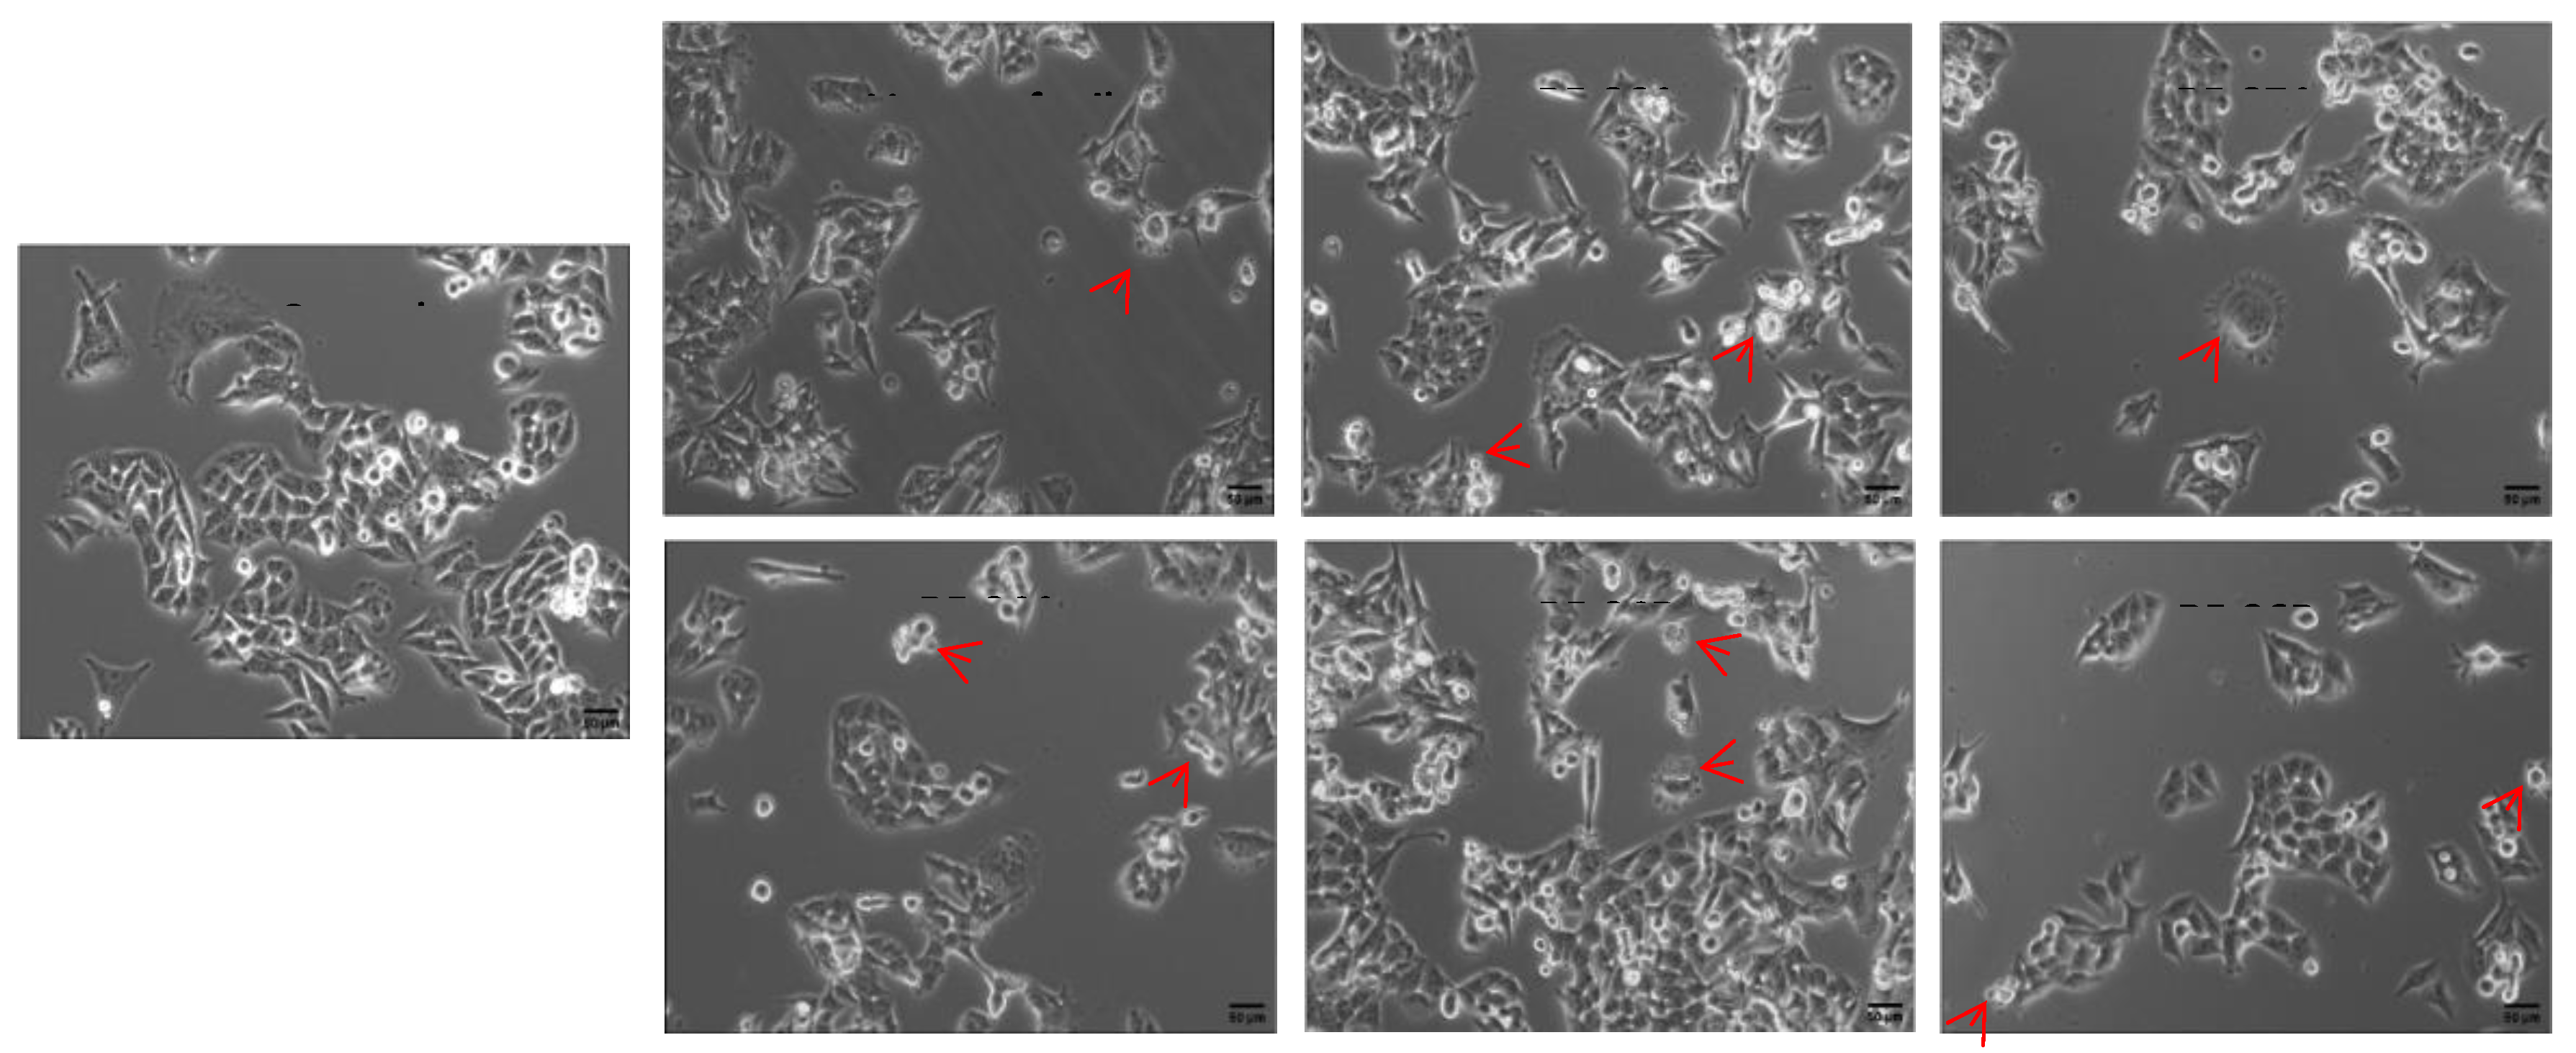
The apoptotic cells took on typical apoptotic morphology, apoptotic bodies namely, increasing intercellular distance, shrinking cell volume, chromatin condensation, rounding cell shape, nuclear pyknosis and plasma blebbing. By comparison to the control cells, treated cells with all compounds at 5 μM for 24h had a significant larger number of apoptotic cells, as shown in Figure 3. The red arrows indicate the apoptotic bodies.

2.6. Cell Migration Quantified by the Cell-Based Scratch Assay

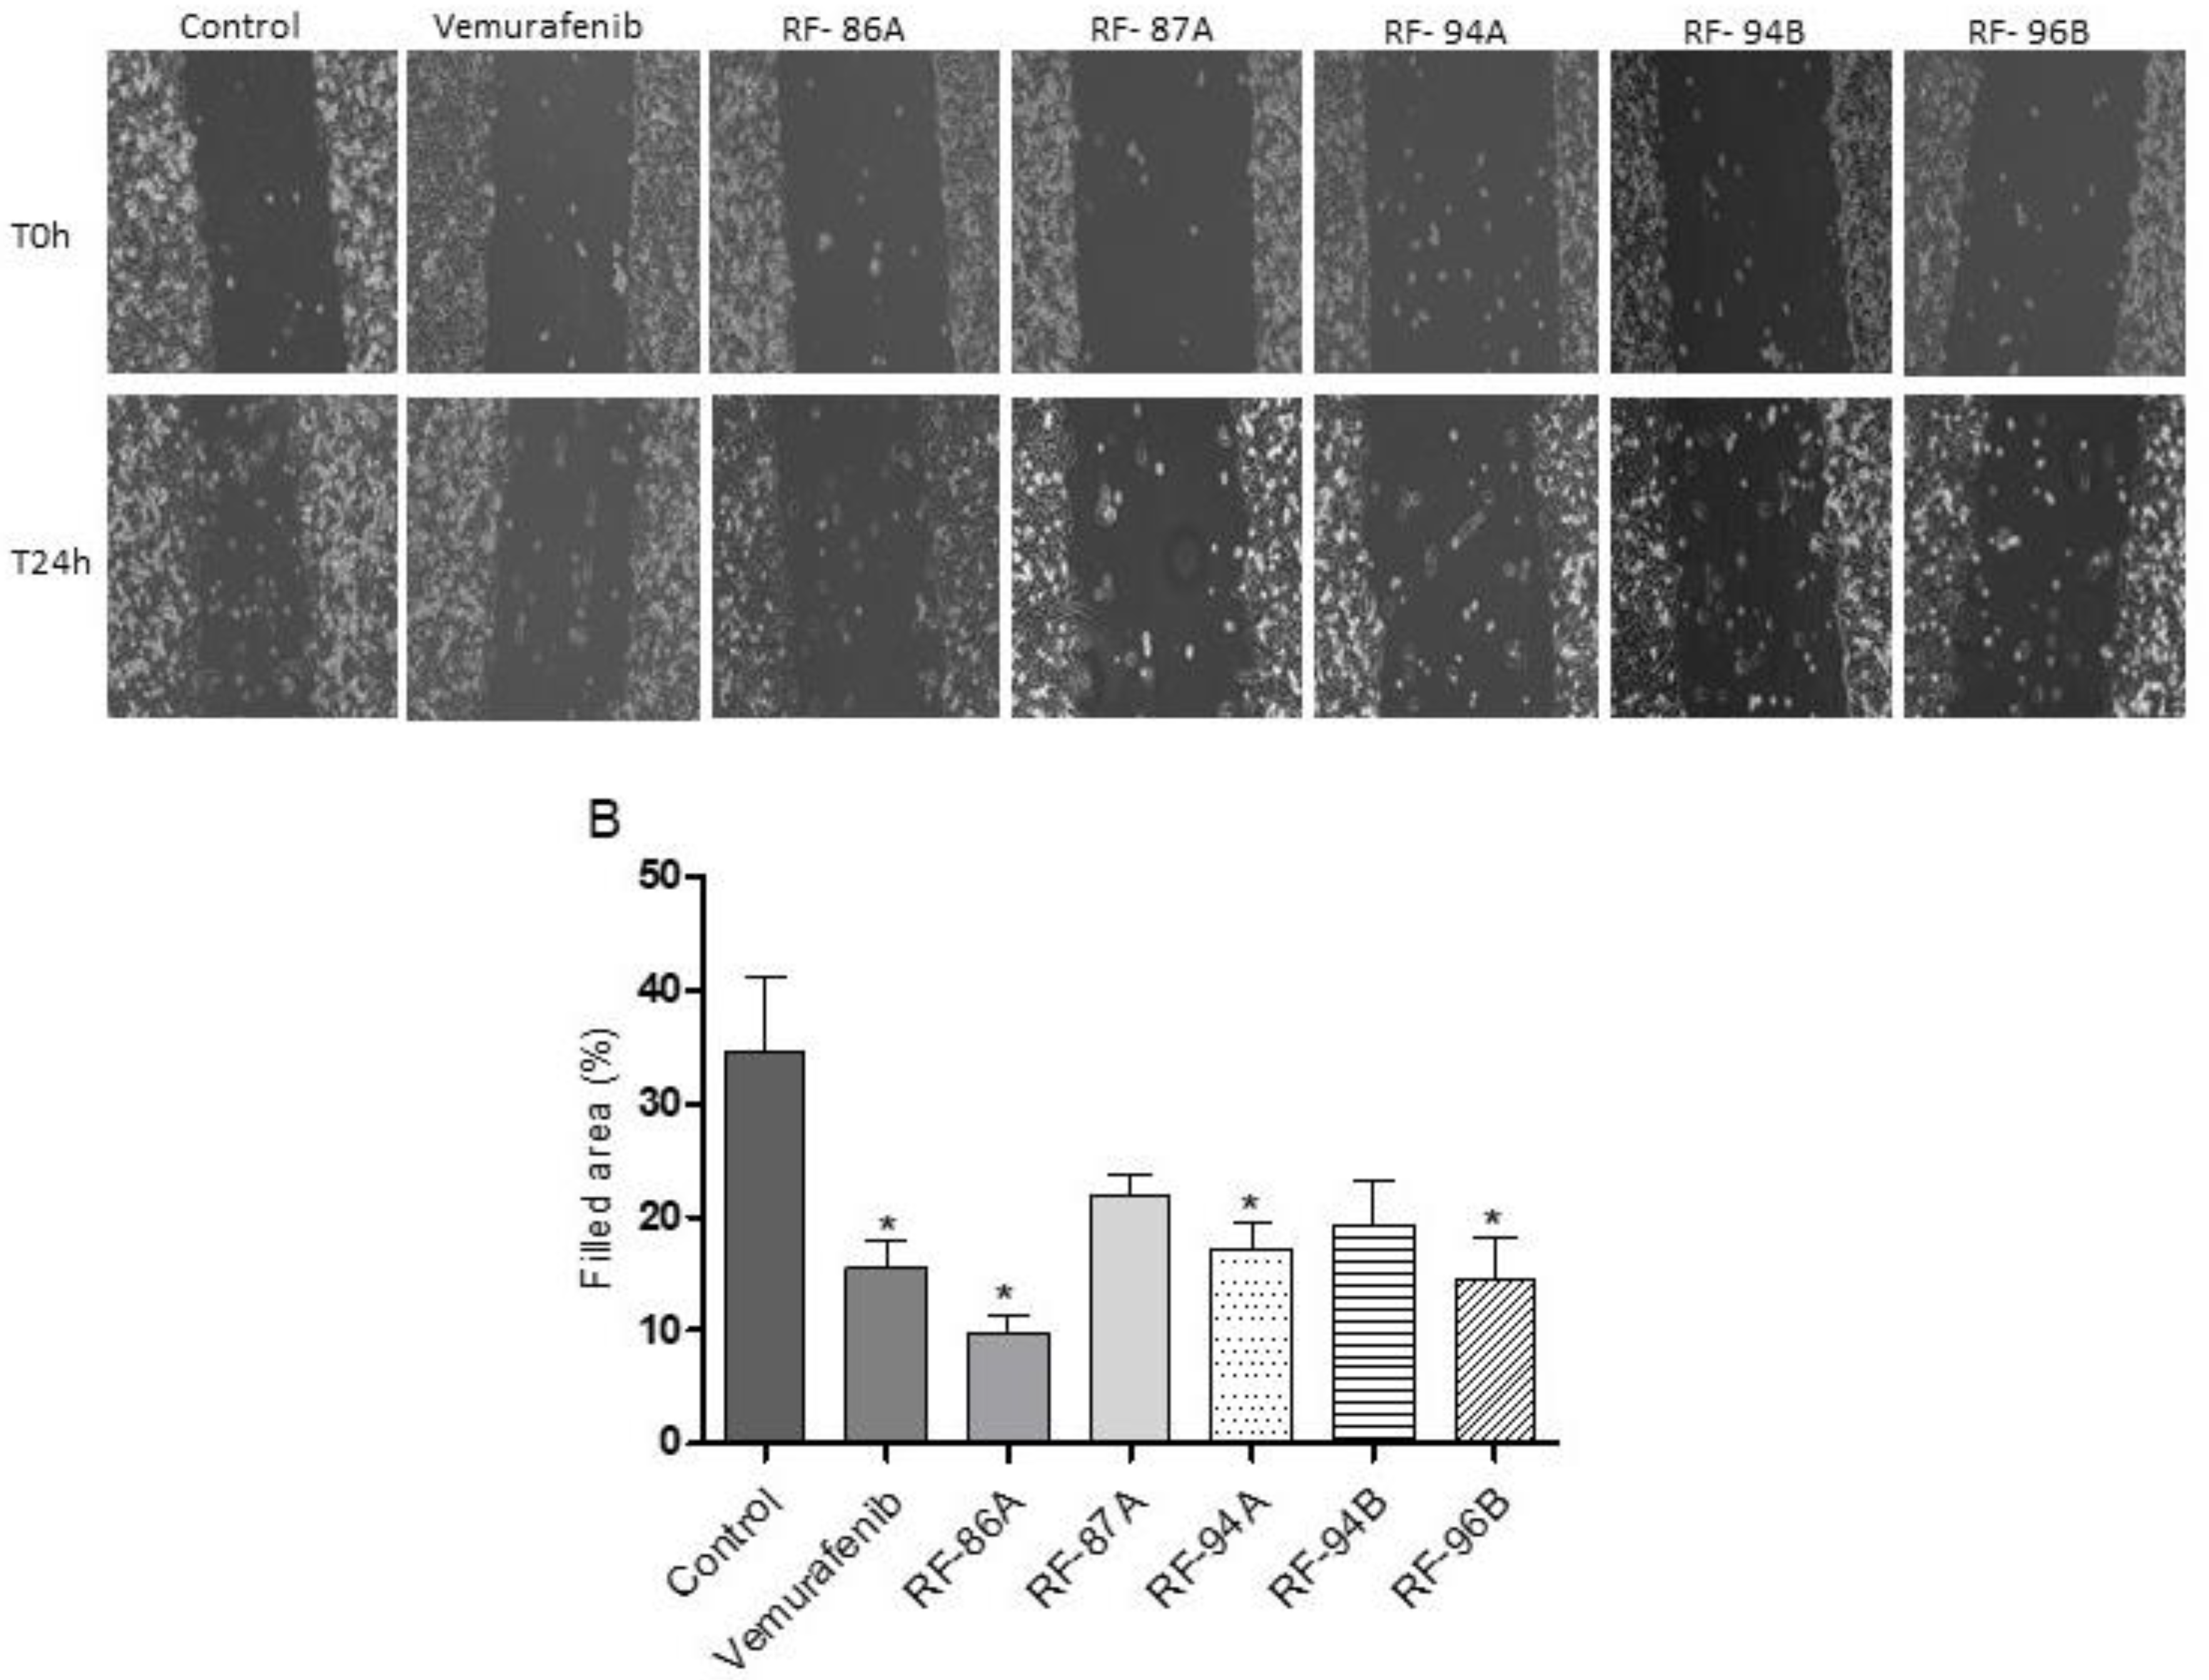
To analyze whether vemurafenib and analogs could alter the migration of A375 cells, we performed a cell-based scratch assay followed by the quantification of the wounded area. Cells were cultured up to 90–100% confluence and then scratched wound lines were created with a micropipette tip. The cells were treated for 24h with 0.5 μM of vemurafenib and analogs. This concentration was chosen to have less interference in cell viability. Untreated cells were used as control. Interestingly, untreated cells nearly covered the scratched areas of the dish in 24 h, whereas in vemurafenib and all analogs treated cells relatively large empty areas were visible in the culture dishes (Figure 4A). Empty areas varied from 25% to 50%, as compared to control untreated cultures (Figure 4B).

2.7. Effects of Vemurafenib and Analogs on A375 Cell Secretion of MMP-2 and MMP-9

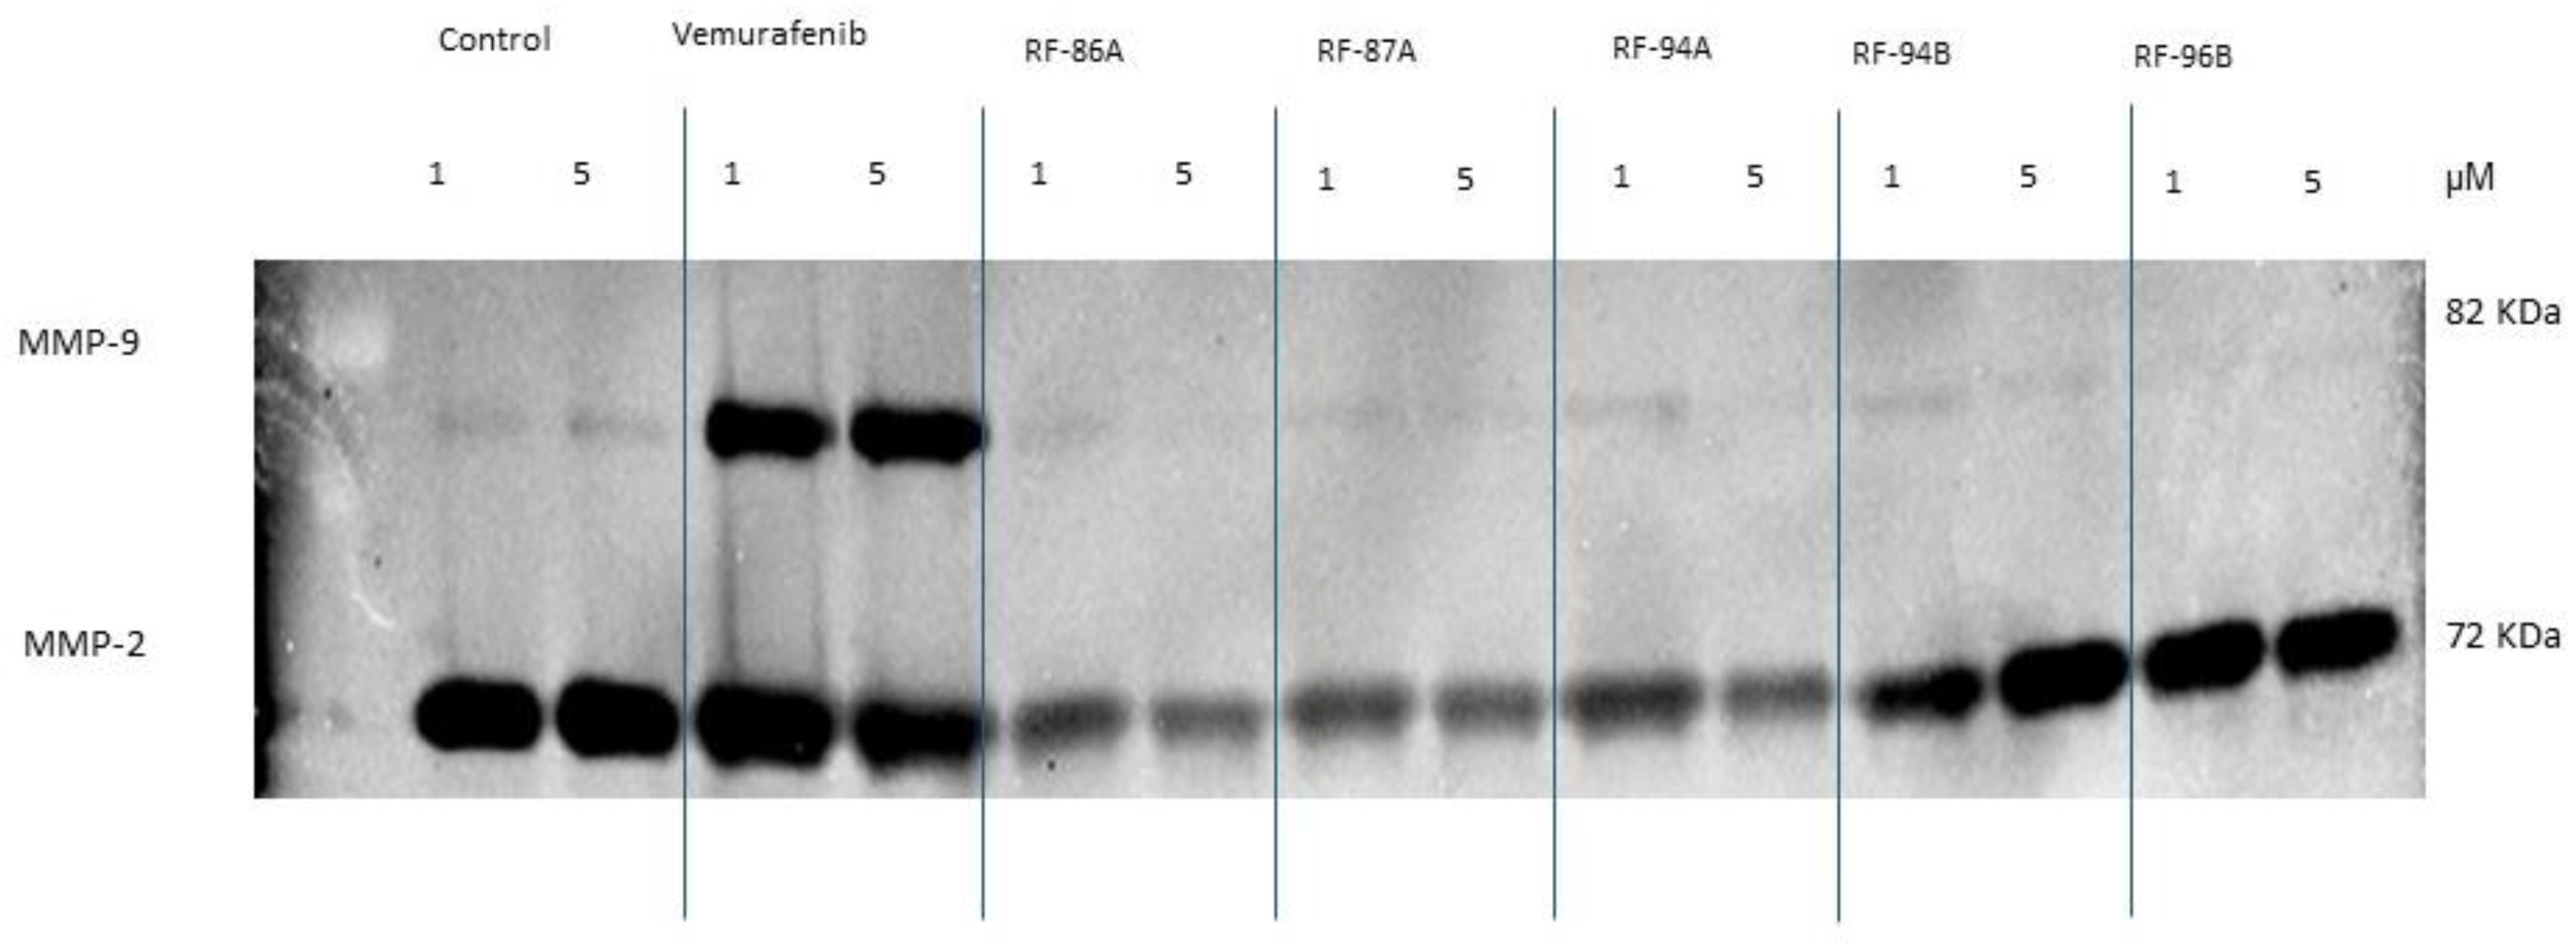
The potential effects of vemurafenib and analogs treatment on MMP-2 and MMP-9 activity by A375 cells were studied by gelatin zymography to detect the gelatinolytic activity in conditioned media. As shown in the Figure 5, conditioned media of A375 cells after 24h of the treatment with 1 and 5 μM vemurafenib and analogs, presented MMP-2 expression and activity reduced with 1 and 5 μM RF-86A (2a), RF-87A (2b) and RF-94A (2c)-treatment. The analog RF-87A reduced the MMP-2 activity only with the concentration of 1 μM. The analog RF-96B (2e) and the compound vemurafenib did not reduce the MMP-2 expression and activity. In the other side, the MMP-9 expression and activity were increased with the treatment with vemurafenib at 1 and 5 μM, which was not observed with any of the tested analogues.

3. Discussion

Vemurafenib is a standard chemotherapy approved to treat metastatic malignant melanoma, which causes significant tumor regression in metastasized BRAFV600E mutated melanoma patients [18,19]. Since tumor regression is only transient in most cases, followed by acquired drug resistance and tumor progression, the search for alternative therapeutic strategies is warranted.
In this work, we synthesize, characterize e evaluate the activity of 5 new compounds analogs of vemurafenib, that were projected to further improve the results of that, leading to less metastasis formation, eradicating tumor cells as well as reducing side effects.
Our findings suggested that the toxicity in the A375 cells of the analogs was similar among then, under tested conditions, presenting morphological and molecular characteristics that cell death causes by apoptosis highlighting the compound RF-96B (2e) that presents an IC50 around 4X lower than the other analogues. Even though the tested analogues showed significant cytotoxicity against A375 human melanoma cells, the standard compound vemurafenib still presented an IC50 2X lower than the compound RF-96B (2e).
The great activity presented by the tested analogues was the inhibition of metalloproteinases such as MMP-2 and MMP-9. MMPs can degrade various protein components in the extracellular matrix (ECM). Meanwhile, they can also destroy the histological barrier of tumor cells and affect tumor migration, invasion, metastasis, and angiogenesis. These molecules are important in the growth and invasion of malignant tumors and their expression has an important impact on the prognosis of patients [20]. Interestingly, according to our results, vemurafenib presented great inhibition of the cell migration, as well as the analogs (2a-e) tested (Figure 5). On the other hand, our analogs (2a-e) were very effective in the MMP-2 and MMP-9 expression and activity, instead of vemurafenib which did not reduce the MMP-2 and MMP-9 activity (Figure 6). This result is very interesting because degradation and remodeling of the ECM and basement membranes by proteolytic enzymes are essential steps in the metastasis process.
In this context, it is worth highlighting MMP-9 is considered as an indicator of invasiveness in malignant melanoma [21]. MMP-2 can act as a pro-metastatic factor in melanoma [22]. During melanoma progression, in vivo, increased expression of MMPs was detected not only in tumor cells but also in stromal cells [23]. The treatment of melanoma cells A375 for 24h clearly suppressed MMP-2 and MMP-9, indicating that the action of the analogs (2a-e), comparing to the action of vemurafenib, may be longer lasting and with less metastatic potential than the standard compound vemurafenib.

4. Materials and Methods

4.1. Drug Design

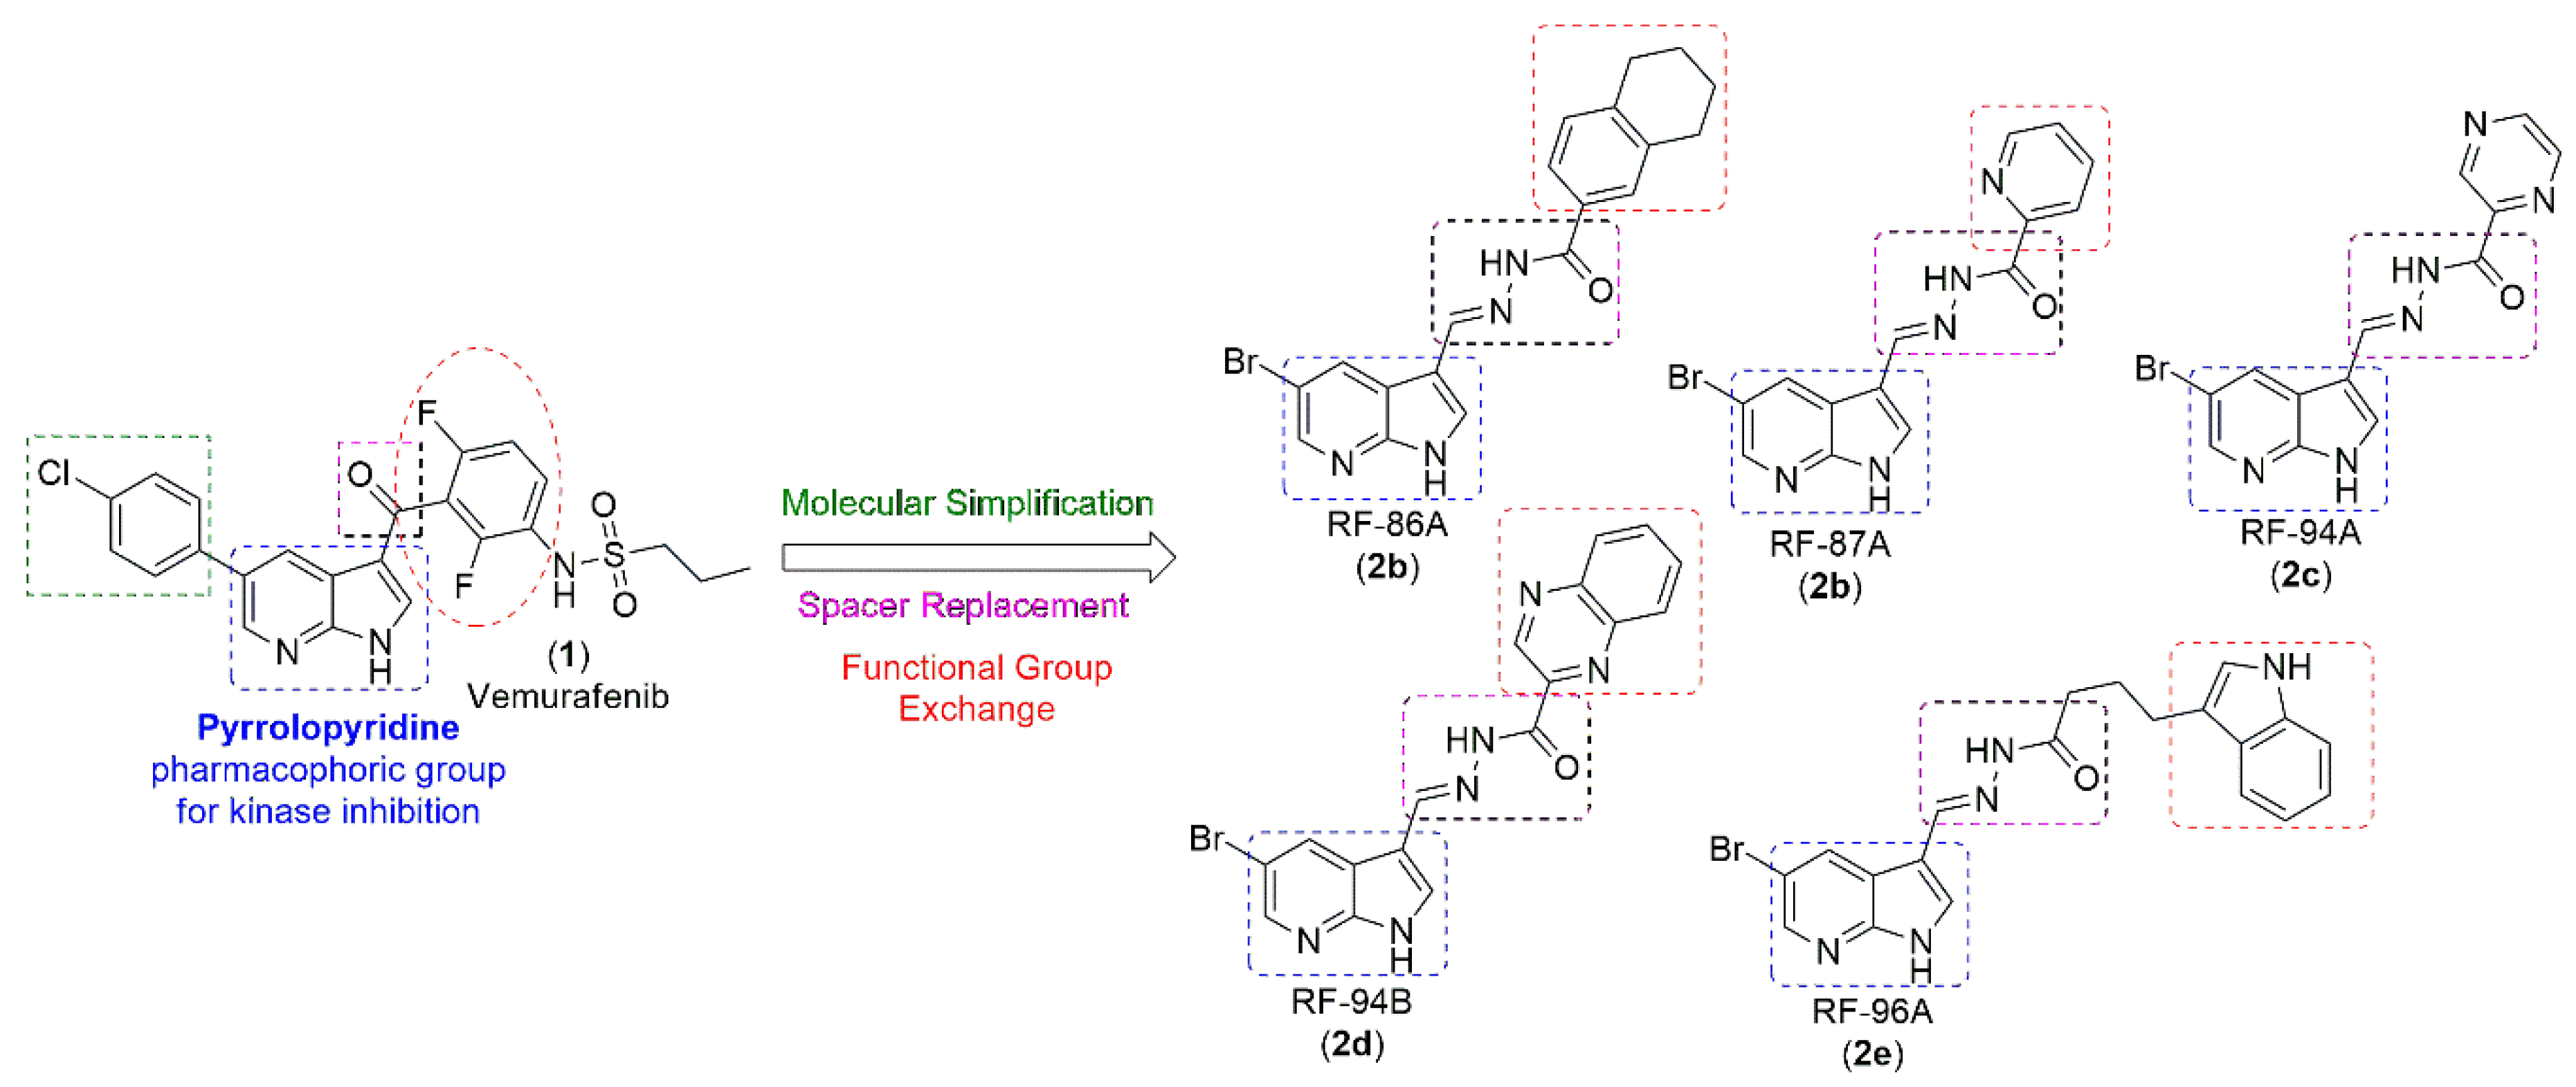
Design concept of the molecules in this work is based on Molecular Simplification in the drug vemurafenib. The pyrrolopyridine or azaindole nucleus, considered pharmacophoric for the inhibitory action on kinases [24,25] was maintained in all 4 molecules. The amide function was replaced by the N-acylhydrazone subunit, deeply described in the literature as a privileged structure [26] generating the first published azaindole-N-acylhydrazone derivatives. And finally, the 2,6-difluorophenyl group was replaced by the tetrahydronaphthalene fragment, (2a) which maintains a similar lipophilic profile. In order to carry out new interactions through hydrogen bonding with the target enzyme, the 2,6-difluorophenyl group was also replaced by nitrogenous heterocyclics (2b-e, Figure 1).

4.2. Chemicals

Vemurafenibe was obtained from MedChemExpress (NJ, USA). Vemurafenib and vemurafenib analogs RF-86A (2a), RF-97A (2b), RF-94A (2c), RF-94B (2b) and RF-96B (2e) were dissolved in DMSO (dimethyl sulfoxide) and further diluted in sterile culture medium immediately before their use. DMSO did not exceed 0.3% v/v in the culture medium.

4.3. Cell culture

The human cutaneous melanoma cancer cell line A375 was obtained from the American Type Culture Collection (ATCC, Rockville, MD, USA), cultured in Dulbecco's Modified Eagle’s Medium (DMEM) supplemented with L-glutamine (2 mM), 10% fetal bovine serum (FBS), 50 IU/ml penicillin and 50 μg/ml streptomycin (Wisent, QC, Canada). Cells were maintained at 370 C in a humidified atmosphere containing 5% CO2. Low cell passages (between 5 and 20) were used in the present study.

4.4. Cell Viability Assay

Cell viability was measured using an MTS method based on the conversion of the tetrazolium salt MTS (3-(4,5-dimethylthiazol-2-yl)-5-(3-carboxymethoxyphenyl)-2-(4-sulfophenyl)-2H-tetrazolium) to a purple formazan in the presence of phenazine methosulfate. The enzymes responsible are NADPH-dependent dehydrogenases, which are active in viable cells. Briefly, cells (5×10⁴/well) were seeded in 96-well plates in medium with 10% FBS; after 24 h, the complete medium was replaced with fresh medium containing 1% FBS and incubated for 24h. Fresh stock solutions were prepared on the day of the experiment and the cells were treated with of different concentrations of vemurafenib and analogs (0.01, 0.1, 0.5, 1, 5 and 10 μM). Effects were evaluated after 24 h. Untreated cells were incubated as controls. Following drug exposure, MTS was added, and the absorbance was measured at 570 nm using a microplate reader (CLARIOStar Plus).

4.5. DNA Fragmentation Analyses

To detect DNA fragmentation in A375 cells, a modified apoptosis TUNEL method was used with the MEBSTAIN Apoptosis TUNEL Kit Direct (MBL, International Corporation, USA) according to the manufacturer’s protocol. Briefly, cells were grown in 8-well culture slides (Corning, USA) and incubated with the compounds (5 μM) for 24 h. Following treatments, the cells were washed with PBS and subsequently stained with TdT buffer, TdT solution and Propidium Iodide, according to the manufacturer’s instructions. Experiments were conducted by fluorescent microscopy. The images were collected by an EVOS M5000 microscope (Thermo Fisher Scientific).

4.6. Cell Morphology Analysis

In order to investigate cell apoptosis, morphological analysis was performed by contrast phase microscopy. Briefly, cells were grown in 8-well culture slides (Corning, USA) and incubated with the compounds (5 μM) for 24 h. Following treatments, the cells were washed with PBS and subsequently fixed with PFA (paraformaldehyde) 4% solution, followed by observation under a EVOS M5000 microscope (Thermo Fisher Scientific).

4.7. Cell Scratch Assay

Cellular migration was evaluated by scratch assay according to our previous studies [27,28]. Cells were cultured in 12-well culture plates for 24 h up to 90–100% confluence. The cells were incubated for 24 h with compounds-test at final concentrations of 1 μM. All cell-based scratch assays were performed in the presence of the anti-mitotic reagent cytosine arabinoside (AraC; Sigma-Aldrich, St. Louis, MO, USA) at a final concentration of 10–5 M (to inhibit cell proliferation). After treatment with the compounds, the wound areas were observed, and images were acquired with an Evos M5000 (Invitrogen, Thermo Fischer Scientific Inc., Waltham, MA, EUA). The filled area was quantified using the Fiji software (ImageJ, National Institutes of Health, Bethesda, MD, USA).

4.8. Gelatin Zymography

Gelatin zymography was carried out according to [29], using 7.5% SDS-polyacrylamide gels with 0.2% (w/v) gelatin. SDS-PAGE was run at 100 V at room temperature. Following electrophoresis, the gels were removed and placed in 2.5% (v/v) Triton X-100 to renature enzymes for 60 minutes. Then, gels were incubated in 50 mM Tris-HCl, 1 μM ZnCl2, 5 mM CaCl2, pH 7.5 overnight to allow sufficient time for genatinolytic activity to occur. Following overnight incubation at 37°C, gels were incubated in a staining solution (0.5% (v/v) Coomassie blue in a 40% methanol-10% acetic acid-water mixture) for 60 minutes. Following incubation the staining solution, the gels were washed with the destaining solution (without coomassie blue) until the time to start to see the bands. Then imaged with a ChemiDocTM MP (BIO-RAD, Germany) gel imaging system. Total protein and gelatinase activity were quantified using Image Lab™ Software (BIO-RAD, Germany).

4.9. Statistical Analysis

All the values of in vitro experiments are presented as the mean ± standard error of three independent experiments. Statistical analyses were performed via a one-way ANOVA with Dunnett´s post-hoc test, and statistical significance was defined as * p < 0.05. Statistical analyses were performed with GraphPad Prism 8.02 (GraphPad Software Inc., San Diego, CA USA).

5. Conclusions

Our results demonstrated for the first time that treatment with the new 5 vemurafenib analogs can significantly reduce the viability of the A375 melanoma cells and reduce the metastasis associated with MMP-2 and MMP-9 activity. New studies designed to interfere with specific MMP actions may be useful in the treatment of metastatic melanoma.

Author Contributions

Conceptualization, F.S.G., F.M. and P.D.F.; methodology, F.S.G, F.M., D.R.R. and R.H.C.N.F.; formal analysis, F.S.G.; investigation, F.S.G.; resources, P.D.F.; data curation, F.S.G. and P.D.F.; writing—original draft preparation, F.S.G. and R.H.C.N.F.; writing—review and editing, F.S.G. and P.D.F.; supervision, P.D.F.; project administration, P.D.F.; funding acquisition, P.D.F. All authors have read and agreed to the published version of the manuscript.

Funding

This research was funded by Fundação Carlos Chagas Filho de Amparo a Pesquisa do Estado do Rio de Janeiro (FAPERJ), grants numbers E-26/200.942/2022, E-26/204.174/2021, SEI-260003/001182/2020, and SEI-260003/001154/2023.

Institutional Review Board Statement

Not applicable.

Informed Consent Statement

Not applicable.

Data Availability Statement

All data is present in the manuscript.

Acknowledgments

Alan Minho for technical support.

Conflicts of Interest

The authors declare no conflicts of interest.

References

  1. Weng, C.J.; Yen, G.C. The in vitro and in vivo experimental evidences disclose the chemopreventive effects of Ganoderma lucidum on cancer invasion and metastasis. Clin Exp Metastasis. 2010, 27, 361-369. [CrossRef]
  2. Fecher, L.A.; Amaravadi, R.K.; Flaherty, K.T. The MAPK pathway in melanoma. Curr Opin Oncol. 2008, 20, 183-189. [CrossRef]
  3. Sala, E.; Mologni, L.; Truffa, S.; Gaetano, C.; Bollag, G.E.; Gambacorti-Passerini, C. BRAF silencing by short hairpin RNA or chemical blockade by PLX4032 leads to different responses in melanoma and thyroid carcinoma cells. Mol Cancer Res. 2008, 6, 751-759. [CrossRef]
  4. Di Nunno, V.; Gatto, L.; Tosoni, A.; Bartolini, S.; Franceschi, E. Implications of BRAF V600E mutation in gliomas: Molecular considerations, prognostic value and treatment evolution. Front Oncol. 2023, 12, 1067252. [CrossRef]
  5. Cordeiro, N.M.; Freitas, R.H.C.N.; Fraga, C.A.M.; Fernandes, P.D. Discovery of novel orally active tetrahydro-naphthyl-N-acylhydrazones with in vivo anti-TNF-α effect and remarkable anti-inflammatory properties. PLoS One 2016, 11, 1-17.
  6. Freitas, R.H.C.N.; Cordeiro, N.M.; Carvalho, P.R.; Alves, M.A.; Guedes, I.A.; Valerio, T.S.; Dardenne, L.E.; Lima, L.M.; Barreiro, E.J.; Fernandes, P.D.; Fraga, C.A.M. Discovery of naphthyl-N-acylhydrazone p38α MAPK inhibitors with in vivo anti-inflammatory and anti-TNF-α activity. Chem Biol Drug Des. 2018, 91, 391-397.
  7. Lima, P.C.; Lima, L.M.; da Silva, K.C.; Léda, P.H.; de Miranda, A.L.; Fraga, C.A.M.; Barreiro, E.J. Synthesis and analgesic activity of novel N-acylarylhydrazones and isosters, derived from natural safrole. Eur J Med Chem. 2000, 35, 187-203. [CrossRef]
  8. Bahekar, R.H.; Jain, M.R.; Jadav, P.A., Prajapati, V.M.; Patel, D.N.; Gupta, A.A.; Sharma, A.; Tom, R.; Bandyopadhya, D.; Modi, H.; Patel, P.R. Synthesis and antidiabetic activity of 2,5-disubstituted-3-imidazol-2-yl-pyrrolo[2,3-b]pyridines and thieno[2,3-b]pyridines. Bioorg Med Chem. 2007, 15, 6782-6795. [CrossRef]
  9. Munir, R.; Javid, N.; Zia-Ur-Rehman, M.; Zaheer, M.; Huma, R.; Roohi, A.; Athar, M.M. Synthesis of Novel N-Acylhydrazones and Their C-N/N-N Bond Conformational Characterization by NMR Spectroscopy. Molecules. 2021, 26, 4908. [CrossRef]
  10. Cordeiro, N.M.; Freitas, R.H.C.N.; Fraga, C.A.M.; Fernandes, P.D. New 2-amino-pyridinyl-N-acylhydrazones: Synthesis and identification of their mechanism of anti-inflammatory action. Biomed Pharmacother. 2020, 123, 109739. [CrossRef]
  11. Cardoso, L.N.F.; Nogueira, T.C.M.; Kaiser, C.R.; Wardell, J.L.; Wardell, S.M.S.V.; de Souza, M.V.N. Synthesis and anti-tubercular activity of Thienyl and Furanyl derivatives. Mediterranean J Chem. 2016, 5, 356-366. [CrossRef]
  12. dos Santos, J.M.; de Souza Castro, M.V.B. Synthesis, structural characterization, and antimicrobial activity of novel ferrocene-N-acyl hydrazones designed by means of molecular simplification strategy Celebrating the 100th anniversary of the birth of Professor Paulo Freire. J Organomet Chem. 2022, 979.
  13. Rodrigues, D.A.; Guerra, F.S.; Sagrillo, F.S.; de Sena, M.P.P.; Alves, M.A.; Thota, S.; Chaves, L.S.; Sant'Anna, C.M.R.; Fernandes, P.D.; Fraga, C.A.M. Design, synthesis, and pharmacological evaluation of first-in-class multitarget n-acylhydrazone derivatives as selective HDAC6/8 and PI3Kα inhibitors. ChemMedChem 2020, 15, 539-551.
  14. Seitz, L.E.; Suling, W.J.; Reynolds, R.C. Synthesis and antimycobacterial activity of pyrazine and quinoxaline derivatives. J Med Chem 2002, 45, 5604-5606. [CrossRef]
  15. da Silva, Y.K.; Augusto, C.V.; de Castro Barbosa, M.L.; de Albuquerque Melo, G.; de Queiroz, A.C.; Dias, T.L.M.D.; Júnior, W.B.; Barreiro, E.J.; Lima, L.M.; Alexandre-Moreira, M.S. da Silva, Y.K.; Augusto, C.V.; de Castro Barbosa, M.L.; de Albuquerque Melo, G.; de Queiroz, A.C.; Dias, T.L.M.D.; Júnior, W.B.; Barreiro, E.J.; Lima, L.M.; Alexandre-Moreira, M.S. Synthesis and pharmacological evaluation of pyrazine N-acylhydrazone derivatives designed as novel analgesic and anti-inflammatory drug candidates. Bioorg Med Chem. 2010, 18, 5007-5015. [CrossRef]
  16. Freitas, R.H.C.N.; Barbosa, J.M.C.; Bernardino, P.; Sueth-Santiago, V.; Wardell, S.M.S.V.; Wardell, J.L.; Decoté-Ricardo, D.; Melo, T.G.; da Silva, E.F.; Salomão, K.; Fraga, C.A.M. Synthesis and trypanocidal activity of novel pyridinyl-1,3,4-thiadiazole derivatives. Biomed Pharmacother. 2020, 127, 110162. [CrossRef]
  17. Chapman, P.B.; Hauschild, A.; Robert, C.; Haanen, J.B.; Ascierto, P.; Larkin, J.; Dummer, R.; Garbe, C.; Testori, A.; Maio, M.; Hogg, D.; Lorigan, P.; Lebbe, C.; Jouary, T.; Schadendorf, D.; Ribas, A.; O'Day, S.J.; Sosman, J.A.; Kirkwood, J.M.; Eggermont, A.M.; Dreno, B.; Nolop, K.; Li, J.; Nelson, B.; Hou, J.; Lee, R.J.; Flaherty, K.T.; McArthur, G.A.; BRIM-3 Study Group. Improved survival with vemurafenib in melanoma with BRAF V600E mutation. N Engl J Med. 2011, 364, 2507-2516oup. [CrossRef]
  18. Wang, T.; Zhang, Y.; Bai, J.; Xue, Y.; Peng, Q. MMP1 and MMP9 are potential prognostic biomarkers and targets for uveal melanoma. BMC Cancer. 2021, 21, 1068. [CrossRef]
  19. Salemi, R.; Falzone, L.; Madonna, G.; Polesel, J.; Cinà, D.; Mallardo, D.; Ascierto, P.A.; Libra, M.; Candido, S. MMP-9 as a candidate marker of response to BRAF inhibitors in melanoma patients with BRAF(V600E) mutation detected in circulating-free DNA. Front Pharmacol 2018, 9, 856.
  20. Marusak, C.; Bayles, I.; Ma, J.; Gooyit, M.; Gao, M.; Chang, M.; Bedogni, B. The thiirane-based selective MT1-MMP/MMP2 inhibitor ND-322 reduces melanoma tumor growth and delays metastatic dissemination. Pharmacol Res 2016, 113, 515–520. [CrossRef]
  21. Hofmann, U.B.; Westphal, J.R.; Zendman, A.J.; Becker, J.C.; Ruiter, D.J.; van Muijen, G.N. Expression and activation of matrix metalloproteinase-2 (MMP-2) and its co-localization with membrane-type 1 matrix metalloproteinase (MT1-MMP) correlate with melanoma progression. J Pathol. 2000, 191, 245-256.
  22. Napoli, S.; Scuderi, C.; Gattuso, G.; Bella, V.D.; Candido, S.; Basile, M.S.; Libra, M.; Falzone, L. Functional roles of matrix metalloproteinases and their inhibitors in melanoma. Cells 2020, 9, 1151. [CrossRef]
  23. Mérour, J.Y.; Buron, F.; Plé, K.; Bonnet, P.; Routier, S. The azaindole framework in the design of kinase inhibitors. Molecules. 2014, 19, 19935-19979. [CrossRef]
  24. Irie, T.; Sawam M. 7-Azaindole: A versatile scaffold for developing kinase 26. inhibitors. Chem Pharm Bull (Tokyo). 2018, 66, 29-36.
  25. Duarte, C.D.; Barreiro, E.J.; Fraga, C.A. Privileged structures: a useful concept for the rational design of new lead drug candidates. Mini Rev Med Chem. 2007, 7, 1108-1119.
  26. Guerra, F.S.; Sampaio, L.S.; Konig, S.; Bonamino, S.; Rossi, M.I.D.; Costa, M.L.; Fernandes, P.D.; Mermelstein, C. Membrane cholesterol depletion reduces breast tumor cell migration by a mechanism that involves non-canonical Wnt signaling and IL-10 secretion. Transl Med Commun. 2016, 1, 3. [CrossRef]
  27. Guerra, F.S.; Oliveira, R.G.; Fraga, C.A.M.; Mermelstein, C.; Fernandes, P.D. ROCK inhibition with Fasudil induces beta-catenin nuclear translocation and inhibits cell migration of MDA-MB 231 human breast cancer cells. Sci Rep. 2017, 7, 13723. [CrossRef]
  28. Toth, M.; Sohail, A.; Fridman, R. Assessment of gelatinases (MMP-2 and MMP-9) by gelatin zymography. Methods Mol Biol. 2012, 878, 121-135.
Scheme 1. Synthesis of hydrazides (5a-e). Reagents and Conditions (a) MeOH, MePh, H2SO4 cat., 100°C, reflux, 24 h, 42-82%; (b) NH2NH2 1M in EtOH, 80°C, reflux, 48h, 50-63%.
Preprints 104868 sch001
Scheme 2. Synthesis of final products (2a-e). Reagents and Conditions: (a) HMTA, AcOH and H2O (2:1), reflux, 16 h, 66%; (b) hydrazides (5a-e), EtOH, HClcat., t.a, 6 h, 70-91%.
Preprints 104868 sch002
Figure 1. Cytotoxic effects of vemurafenib and analogs RF-86A (2a) RF-87A (2b), RF-94A (2c), RF-94B (2d) and RF-96B (2e) in A375 cells after 24h of incubation. The cells were incubated with different concentrations of vemurafenib, and analogs (0.01 to 10 μM) and the cell viability were analyzed by MTS assay. Untreated cells were used as a control group. Statistical analyses were performed with GraphPad Prism 8.02 and included one-way ANOVA followed by Dunnett´s post hoc test. Statistical significance was defined as * p < 0.05 when compared with the control group.
Preprints 104868 g001
Figure 2. Vemurafenib analogs (2a-e) induces apoptosis in A375 cells. Apoptosis was detected by Tunel assay. A double-staining technique was used. TUNEL staining by using an in-situ cell death detection kit (fluorescein) for apoptotic cell nuclei and DAPI (blue) staining for all cell nuclei. A375 cells were treated during 24h with or without (control) 5 μM of the compounds test. TUNEL positive cells were visualized as indicated by green fluorescence staining. The images were obtained by a EVOS M5000 microscope (Thermo Fisher, USA). Magnificance: 20X. Scale bar: 150 μm.
Preprints 104868 g002
Figure 3. Morphological appearance of A375 cells treated with vemurafenib and analogs (2a-e) (5 μM) for 24h. The red arrows indicate apoptotic bodies, showing membrane blebs and fragmented nucleus. The images were obtained by an EVOS M5000 microscope (Thermo Fisher, USA). Magnification of 20X.
Preprints 104868 g003
Figure 4. Effects of vemurafenib and analogs (2a-e) on migration of A375 cells. After incubation with medium alone (controls), and the treatment with the compounds test (0.5 μM) for 24h, cell migration was assayed through cell-based scratch method. (A) The images were obtained by a EVOS M5000 microscope (Thermo Fisher, USA). Magnification of 10X. Scale bar 50 μm. (B) The filled areas were analyzed and quantified using ImageJ software. Statistical analyses were performed with GraphPad Prism 8.02 and included one-way ANOVA followed by Dunnett´s post hoc test. Statistical significance was defined as * p < 0.05 when compared with the control group.
Preprints 104868 g004
Figure 5. Effects of vemurafenib and analogs (2a-e) on MMP-9 and MMP-2 expression and activity by A375 cells after incubation with medium alone (controls), and the treatment with the compounds test (1 and 5μm) for 24h. Gelatinase activity was assayed through zymography method. The protein bands were analyzed using ImageLab 6.1 software from Bio-Rad.
Preprints 104868 g005
Figure 1. Design concept of new pyrrolopyridine-N-acylhydrazone derivatives (2a-e).
Preprints 104868 g006
Table 1. IC50 values (μM ± SD) obtained for the compounds against A375 cell line.
Compound IC50 (µM)
Vemurafenib 0.22±0.37
RF-86A (2a) 4.68±0.68
RF-87A (2b) 1.88±0.92
RF-94A (2c) 1.39±0.88
RF-94B (2d) 1.60±0.86
RF-96B (2e) 0.45±0.71
Disclaimer/Publisher’s Note: The statements, opinions and data contained in all publications are solely those of the individual author(s) and contributor(s) and not of MDPI and/or the editor(s). MDPI and/or the editor(s) disclaim responsibility for any injury to people or property resulting from any ideas, methods, instructions or products referred to in the content.
Copyright: This open access article is published under a Creative Commons CC BY 4.0 license, which permit the free download, distribution, and reuse, provided that the author and preprint are cited in any reuse.
Prerpints.org logo

Preprints.org is a free preprint server supported by MDPI in Basel, Switzerland.

Subscribe

© 2024 MDPI (Basel, Switzerland) unless otherwise stated