1. Introduction
With advancements in the field of the Internet of Things (IoT), energy harvesting, and wireless sensor technology, autonomous systems are currently being developed and deployed in a variety of applications, including health monitoring of civil structures, fault identification in industrial machines, living and working area automation, forecasting of weather conditions, tracking and health monitoring of aircraft, and especially, bridge and railway track monitoring system. The economy of densely populated nations is wholly reliant on an effective transportation system. The railway is the most essential component of the transportation sector for transporting massive amounts of products and people. For an effective railway transmission system, railway tracks are crucial to the security of transportation. Therefore, a vast railway network is installed in different countries as shown in Table 1.
Table 1.
List of railway networks installed in different countries/territory.
Table 1.
List of railway networks installed in different countries/territory.
| Countries |
Installed Railway Track (Km) |
| United States |
220480 |
| European Union |
208211 |
| China |
150000 |
| Russia |
85600 |
| India |
68988 |
| Canada |
49422 |
| Germany |
40625 |
| Japan |
27311 |
| Italy |
16829 |
| Spain |
16355 |
| United Kingdom |
15935 |
| Pakistan |
7490 |
| Netherlands |
3055 |
Railway tracks are vital to the transportation industry since they facilitate the dependable and timely movement of people and goods. However, railway tracks are constantly subjected to wear and tear due to a wide range of factors, such as the weight of passing trains, harsh weather, and dynamic stresses. The deteriorating condition of railway tracks greatly reduces the efficiency of maintenance, safety, and operation. The human and financial costs of even a minor rail accident are enormous.
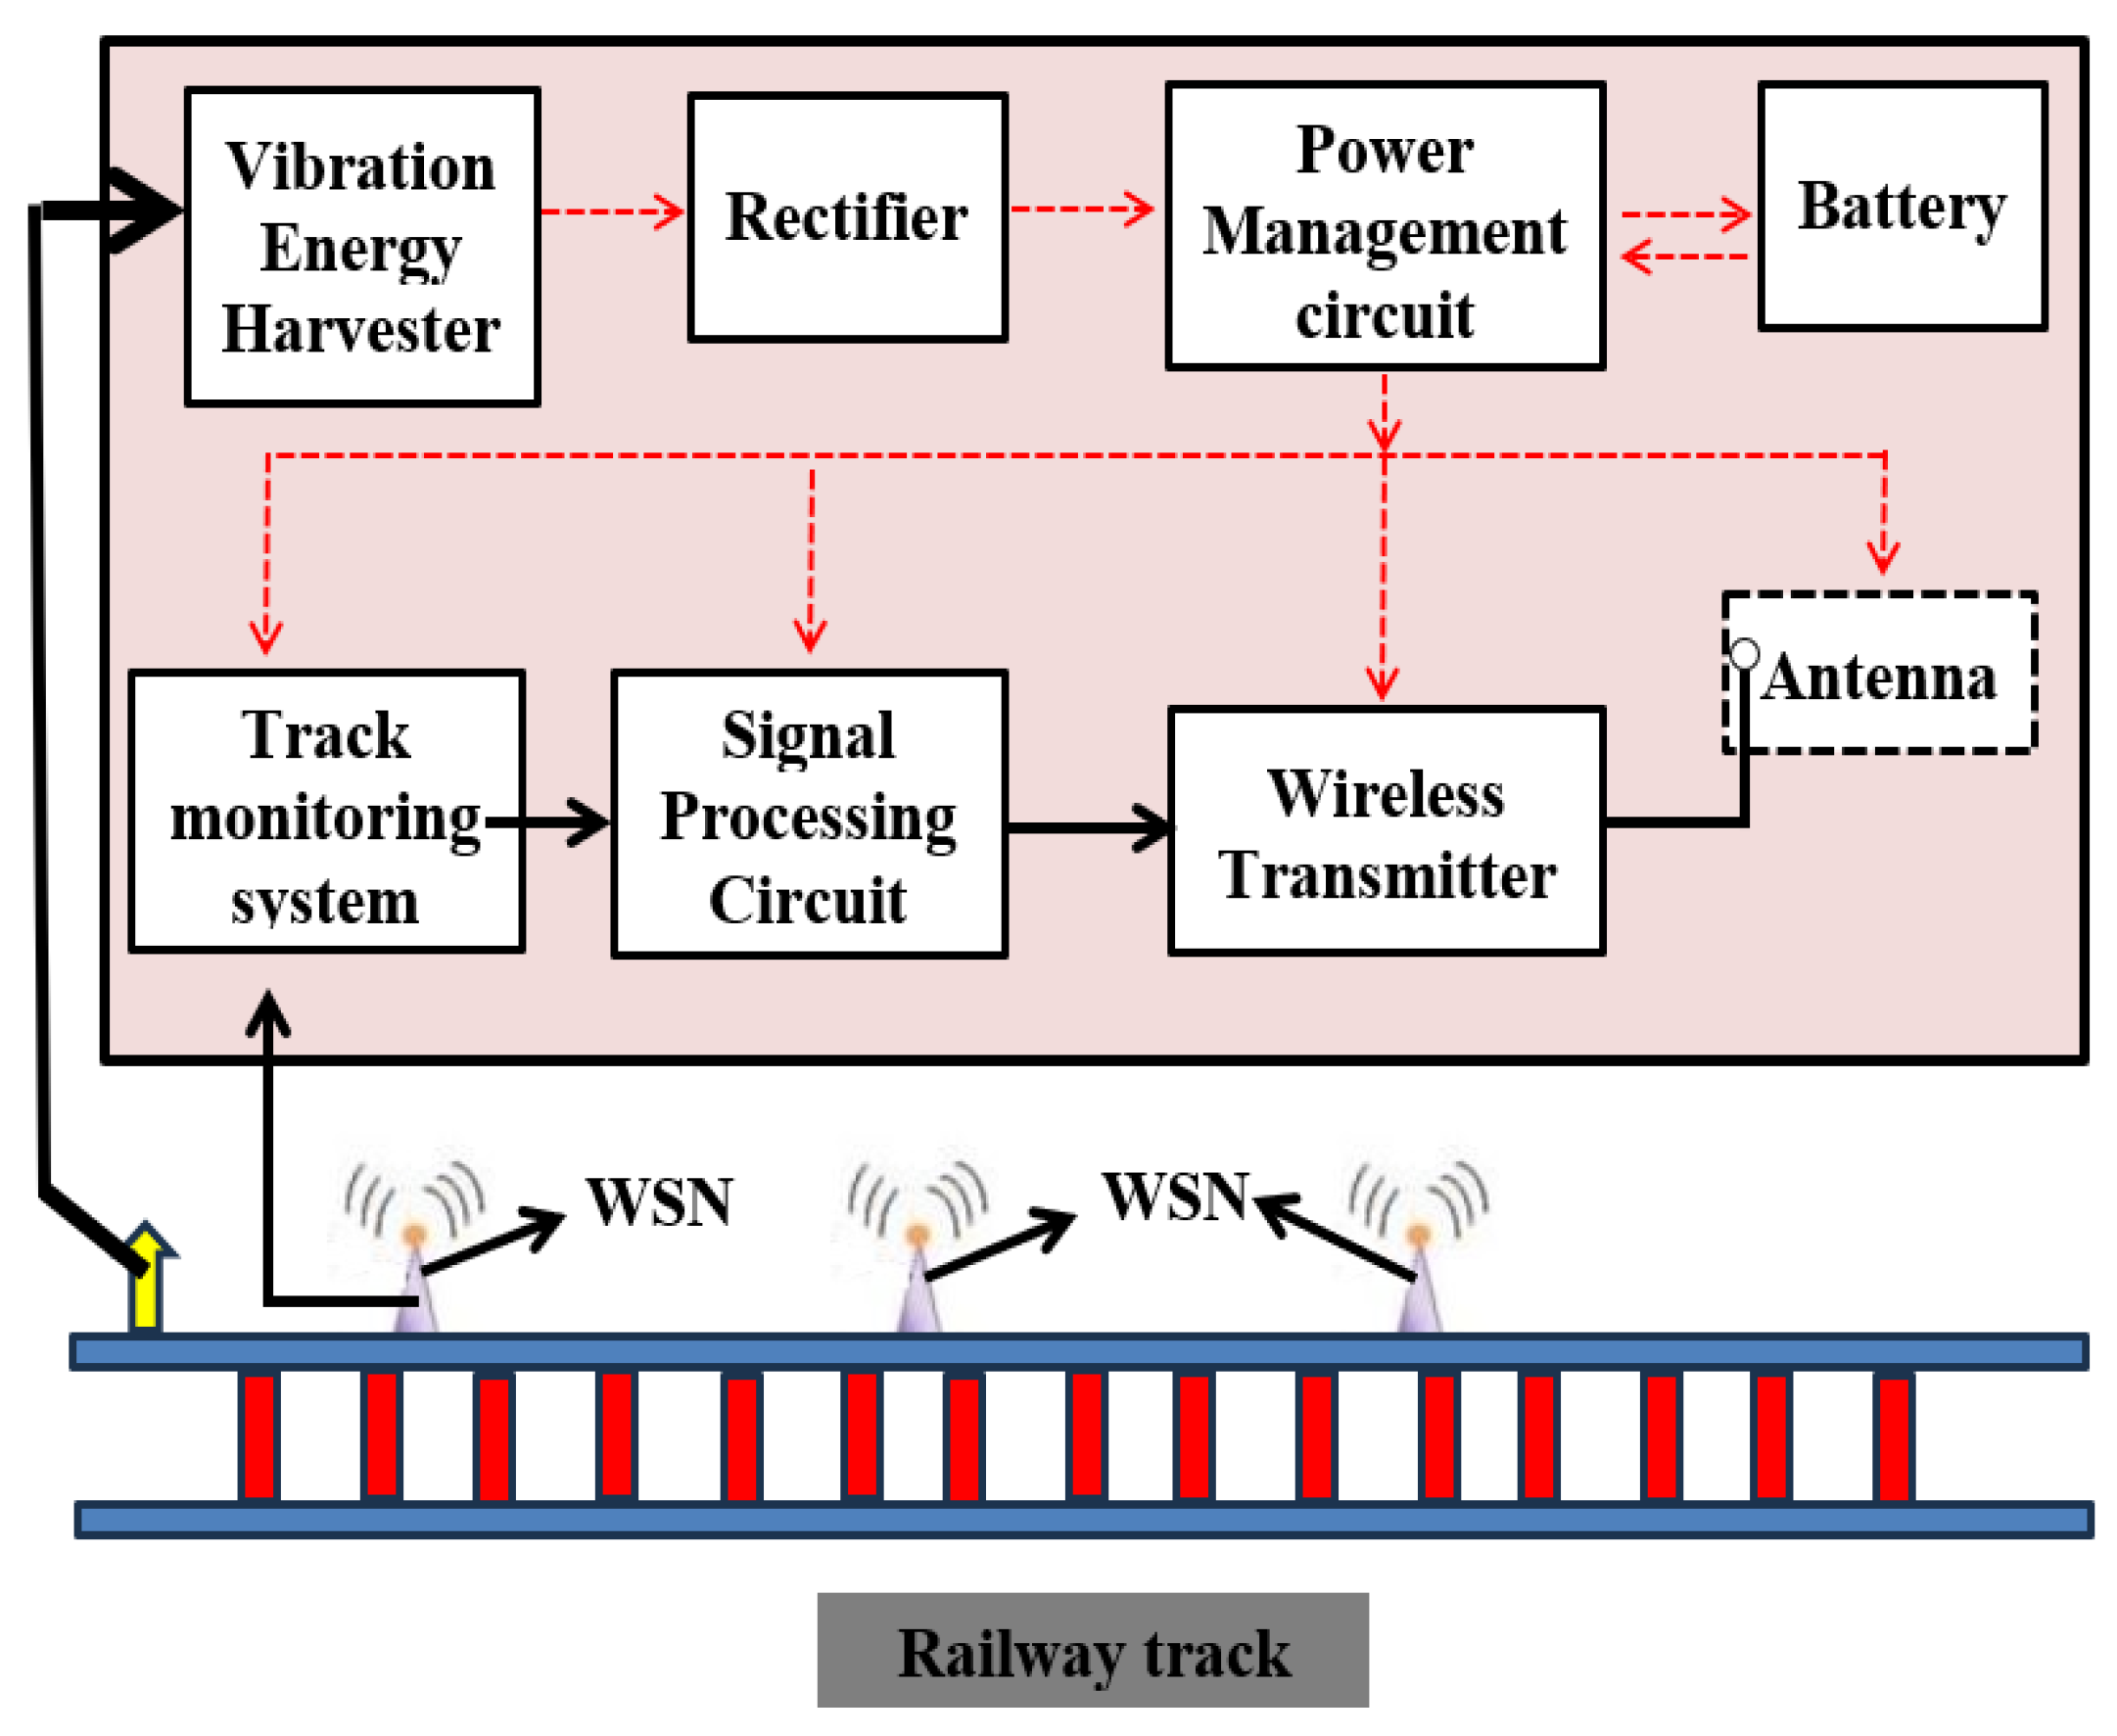
To prevent accidents and guarantee the safety of the transportation system, a monitoring system is a dire need that can keep an eye on the rails around the clock. A modern solution to this issue is IoT based monitoring system for railway tracks. An IoT-based railway track monitoring system is shown in
Figure 1. There are multiple wireless sensor nodes (WSNs) positioned above the rail line that gather data from the rail line and send it to the gateway sensor node via wireless data transmission modules. The data is communicated to the user through the gateway sensor unit.
The major concern here is providing power to the WSNs. Usually, the WSNs used for railway track monitoring utilize a battery as a power unit. Due to the short lifecycle of a battery, WSNs normally require maintenance in the form of battery replacement or recharging. However, a large number of WSNs are installed over railway track networks, so their battery’s recharging or replacement is not feasible. For the continuous operation of WSNs a long-lasting, alternative power source is a necessity. Energy harvesters [
1] are quite capable of replacing batteries in WSNs. These energy harvesters can provide an alternative solution for energy sources and the most promising advantage is that these harvesters will continuously convert ambient available energies into useful electrical energy.
Table 2 shows the ambient energy sources available around the railroad track. Several methods exist for transforming the energy contained in these forms into usable electrical power.
Most of these energy sources have limitations. The efficiency of wind power plants varies widely depending on topography and climate. Sound and radio waves have a low output power density, making them unsuitable for use as a primary energy source on a large scale. Similarly, the density of solar energy is greatest in dry, cloudless regions and lowest in sunny ones. The vibrational energy of the railway, on the other hand, is a viable alternative. Using an electromagnetic or piezoelectric transduction mechanism, vibration energy in the railway track can be harnessed and used.
Several researchers have worked to investigate the power obtained from the train-induced vibration, which can be later used to power WSNs used in the railway track monitoring system. Perez et al. developed a tram-mounted electromagnetic vibration energy harvesting with two degrees of freedom [
3]. The VEH is merely a permanent magnet and coils. Numerical simulation and actual data suggest that the energy harvester can output 6.5 mW. The inductive voice coil system invented in [
4] turns the vertical deflection of a track into electrical power. As the track deflected, a voltage was generated in the coil that was attached to the rail and traveled vertically through the stationary magnetic field. The average power with a 7.5 kΩ load resister was calculated to be 0.16 mW in the simulation. Many distinct designs of piezoelectric train-induced VEH systems have been created to accommodate a wide range of potential installation sites. Cantilever types, stacked types, bilateral fixed types, and circular types are the most common line-side structures for piezoelectric energy harvesters [
5].
In a railway setting, piezoelectric VEHs based on a cantilever mechanism are the simplest method for harvesting vibration energy. To capture the vibrational energy from passing trains on a bridge, Cahill
et al. [
6] designed a piezoelectric energy harvester based on a cantilever beam. The estimated frequency of the bridge's energy harvesting is shown to be consistent with the tested natural frequency, and the maximum output voltage was found to be 99 mV. Gao
et al. [
7] aimed to create a prototype to supply electricity to outlying areas. A detailed modelling and simulation of a railway track-mounted electromagnetic energy harvester are presented. Li
et al. [
8] investigated the performance of piezoelectric VEHs based on cantilevers when subjected to varying resistors and frequencies. The power output performance of a piezoelectric harvester is at its best at its resonance point. Wang
et al. [
9] examined the efficiency of a piezoelectric stack device coupled to the train track as a means of energy gathering. Based on the findings, the proposed piezoelectric energy harvesting technology may be used to power wireless sensors in railway systems. Hou
et al. [
10] proposed installing a piezoelectric VEH based on a layered structure atop the rail transit bridge. Based on simulation results, we know that the max output voltage and current can be as high as 195.8 V and 5.6 mA, respectively, for a total of 1.09 W. The examined piezoelectric energy harvester has a power density of up to 0.048 mW/cm
3, which is double that of current low-frequency piezoelectric VEHs. Cantilever-structured piezoelectric VEHs for use on railway vehicles were proposed by Pasquale and colleagues [
11].
The proposed energy harvester's performance was evaluated using a miniature train bogie. The results demonstrate that at its maximum capacity, the harvester can produce an output power of 4.12 mW. A piezoelectric VEH based on a cantilever construction was studied by Song
et al. [
12] and put on a superconducting Maglev train. Experiments showed that the harvester's output voltage rose with increasing vibration frequency, reaching a maximum of over 6 V.
In this work train induced vibration-based cantilever, beam-type piezoelectric energy harvester is modeled and simulated using MATLAB and COMSOL Multiphysics. The energy produced by the harvester can be used for powering WSNs installed at the railway track monitoring system. Most of the previously reported train-induced vibration energy harvesters were based on electromagnetic transduction mechanism while for the developed piezoelectric energy harvester, there is no analytical modeling for optimization of different parameters, however, in this work an analytical model and simulation is presented for piezoelectric energy harvester to optimize the device working parameters. Stationery and Eigen frequency analysis is performed for the harvester for the estimation of maximum deflection and stress in the beam with respect to device dimension and amplitude of applied vibration.
2. Analytical Modelling of PEHS
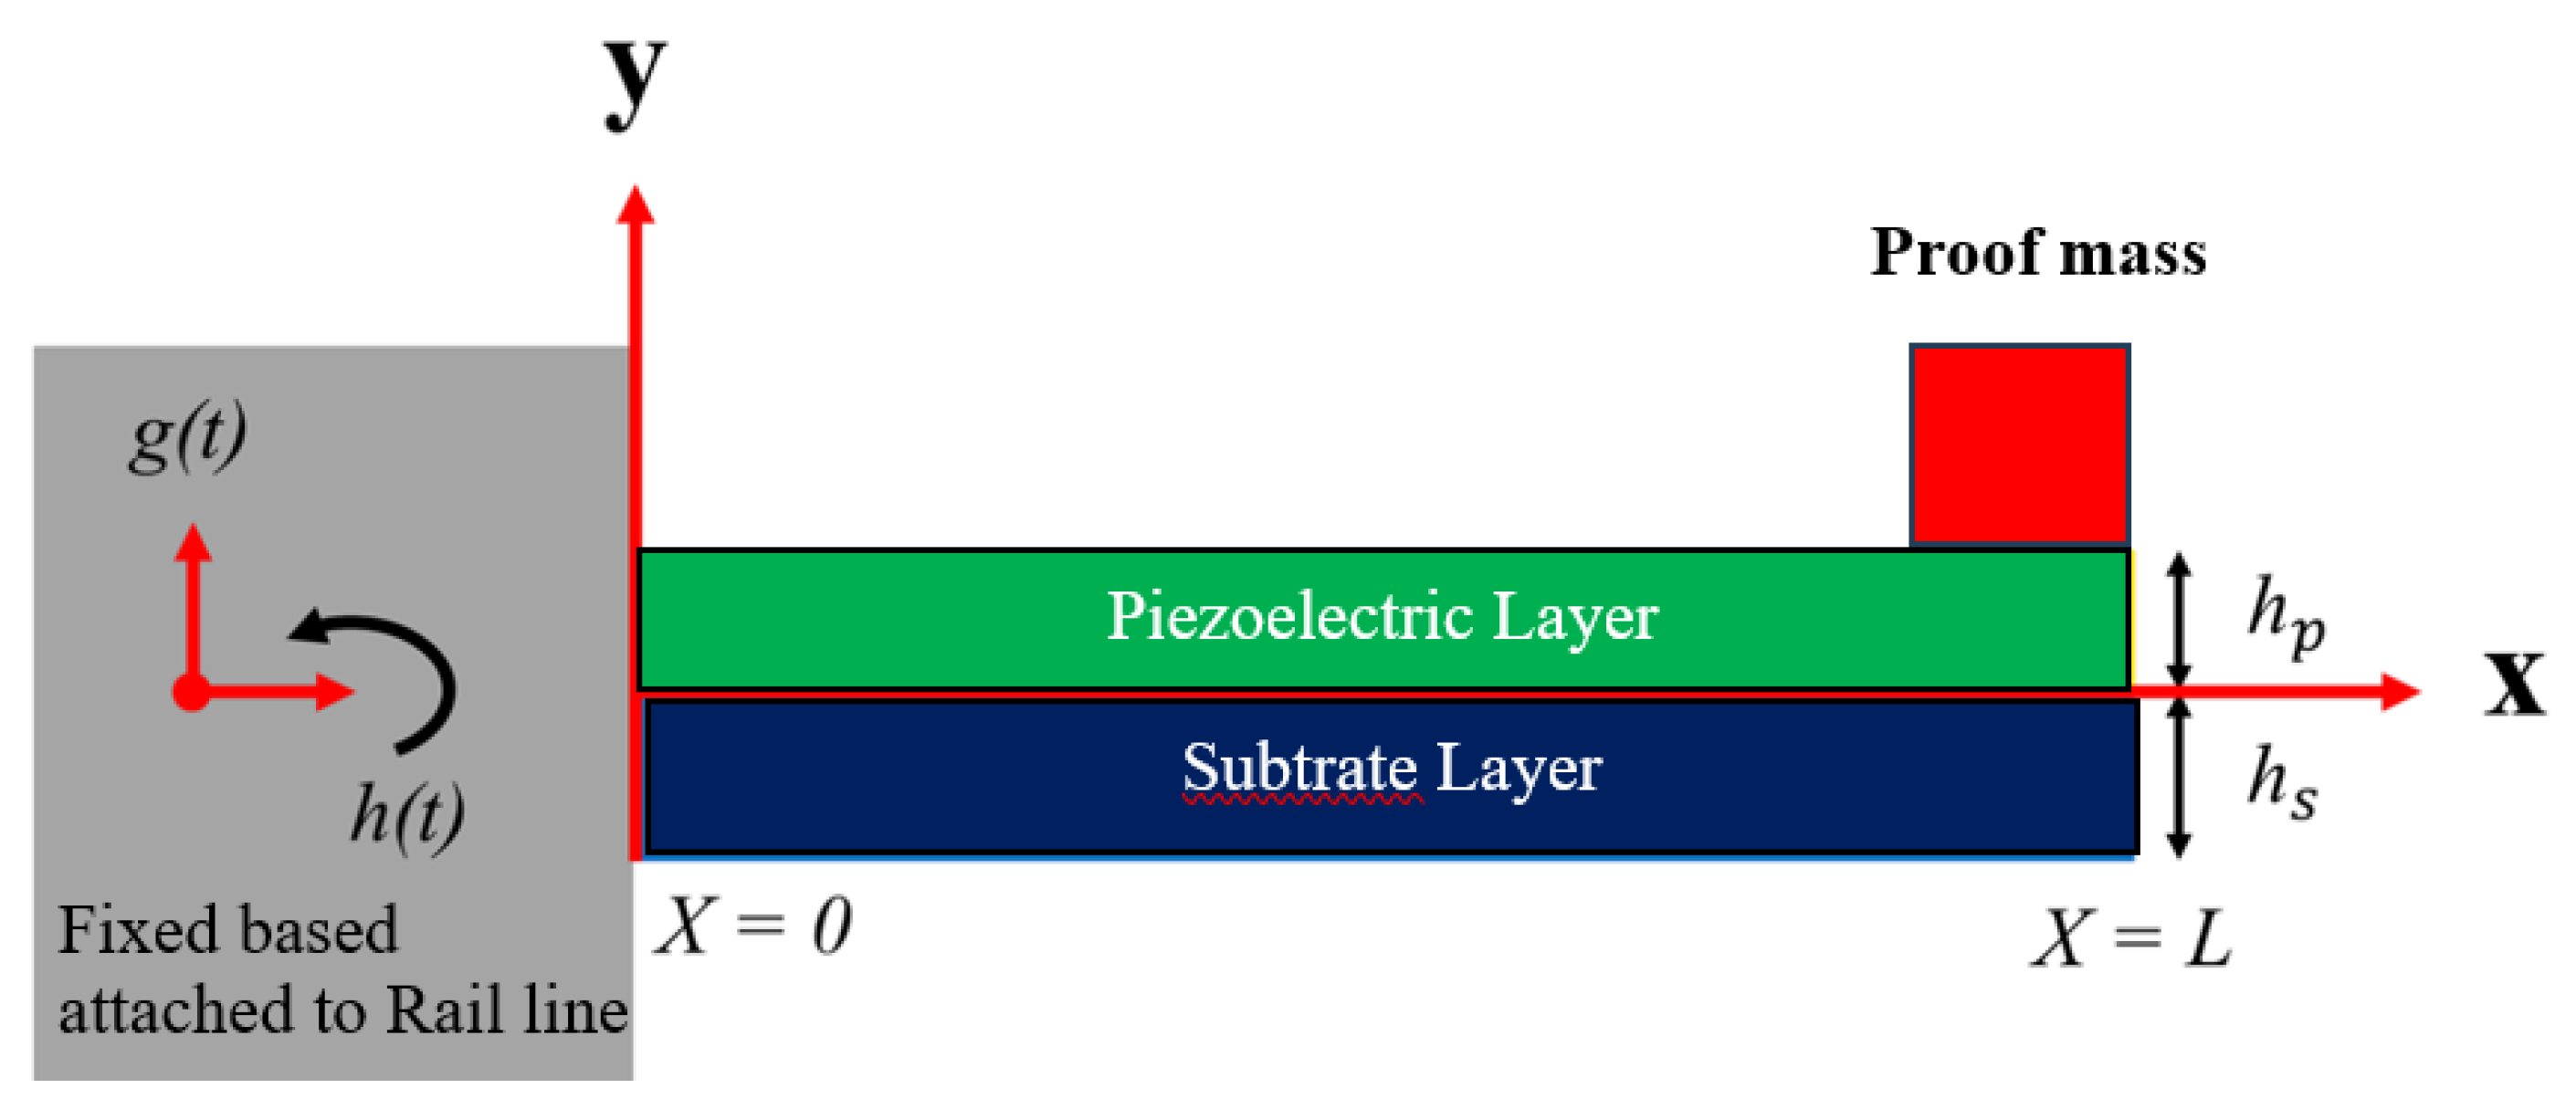
Figure 2 depicts the architecture of the rail track-induced vibration PEH. A Unimorph cantilever piezoelectric plate is designed to make the device. The device is supposed to be tightly fixed to the railway track or the body of the rail car. A proof mass is attached at the free end of the beam to lower the natural frequency of the piezoelectric structure. When the train is passing, it induces vibration in the body as well as in the track. The piezoelectric beam vibrates due to the vibration of the rail car. According to the piezoelectric effect,
when the beam vibrates under the influence of external sources, voltage is generated across its terminals. This voltage is used to charge the backup power bank for further usage. For small amplitude of applied vibration, deflection is produced in the piezoelectric beam, which produces electrical energy according to the piezoelectric principle. Piezoelectric basic equations [
6]
Where
is the strain,
is the electrical displacement,
is the stiffness,
is the Electrical field
is the PZT stress constant,
is the permittivity. For piezoelectric harvester, the governing equation is:
The strain of the layer can be considered in one direction, and the strain in the other two directions can be assumed to be zero because the thickness of a piezoelectric layer in a piezoelectric-based harvester is often considerably lower than the length and width. That's why we can reduce the complexity of the constitutive Equation (3) to
The stiffness of a cantilevered beam multilayered can be Written as
Where b is the beam width,
is the number of piezoelectric layers,
is the number of electrode layers, Ei is the young modulus, hi is the height of each piezoelectric layer, Ei is the young modulus and hj is the height of each electrode layer. Since the beam is Unimorph, only a single layer of piezoelectric material and substrate material will be used. Equation 5 will become
Multilayered cantilever beams that have a mass at their tip can have their effective mass calculated as
Where ρ
j and ρ
i denote the densities of the electrode and piezoelectric materials and m
T is the tip mass. For the Unimorph cantilever beam, equation (7) will be modified as follows.
From equation (8) the corresponding natural frequency of the cantilevered beam can be derived as
When a vibrating beam is subjected to a bending moment M(x), the average effective stress per unit length is
Cantilever beam length (L), maximum displacement (C), moment of inertia (I), and orientation (x) along the beam's length (x) are all inputs into the following equation. The moment M(x) when the beam to be in resonance can be evaluated as
Where Y denotes the tip deflection or vibration amplitude and is evaluated as
Here ζ is the damping ratio and is evaluated using the relationship
Where
and
are consecutive amplitudes of the beam. Putting the values of tip deflection in equation 11, the moment M(x) will become
Substituting equation 14 in equation10, the maximum stress in the beam will become
Integrating the equation (15) along the length of the beam, the equation for stress will be modified as follows
The voltage generated is proportional to the average effective stress in the cantilevered beam because it is formed of piezoelectric material and the electrodes run the length of the beam.
Where t
p is the thickness of the piezoelectric layer, -d31 is the strain constant of the piezoelectric material, and is the dielectric constant. integrating equation 16 with 17, the voltage equation will become
The output power of cantilever beam-based piezoelectric vibrational energy is given as
where
is the load resistance and
is the piezoelectric cantilever beam impedance (also called source resistance). The source resistance depends on the frequency ω of the beam as follows
when
the output power is maximum, this condition is called impedance matching. the corresponding power in this case is given as
3. COMSOL Modeling and Simulation
COMSOL Multiphysics is a powerful tool for modeling and simulation of various types of engineering problems. In this work train induced vibration type piezoelectric energy harvester with a cubical mass is modelled and simulated. COMSOL Multiphysics FEM technique is used for analyzing the maximum deflection occurred at the tip of the piezoelectric beam and mode shapes at the natural frequencies through the piezoelectric beam due to the applied vibration. The steps involved in the modeling and simulation of circular plate piezoelectric energy harvester using COMSOL Multiphysics are depicted in
Figure 3 and are discussed in the below subsection.
3.1. Creating Geometry
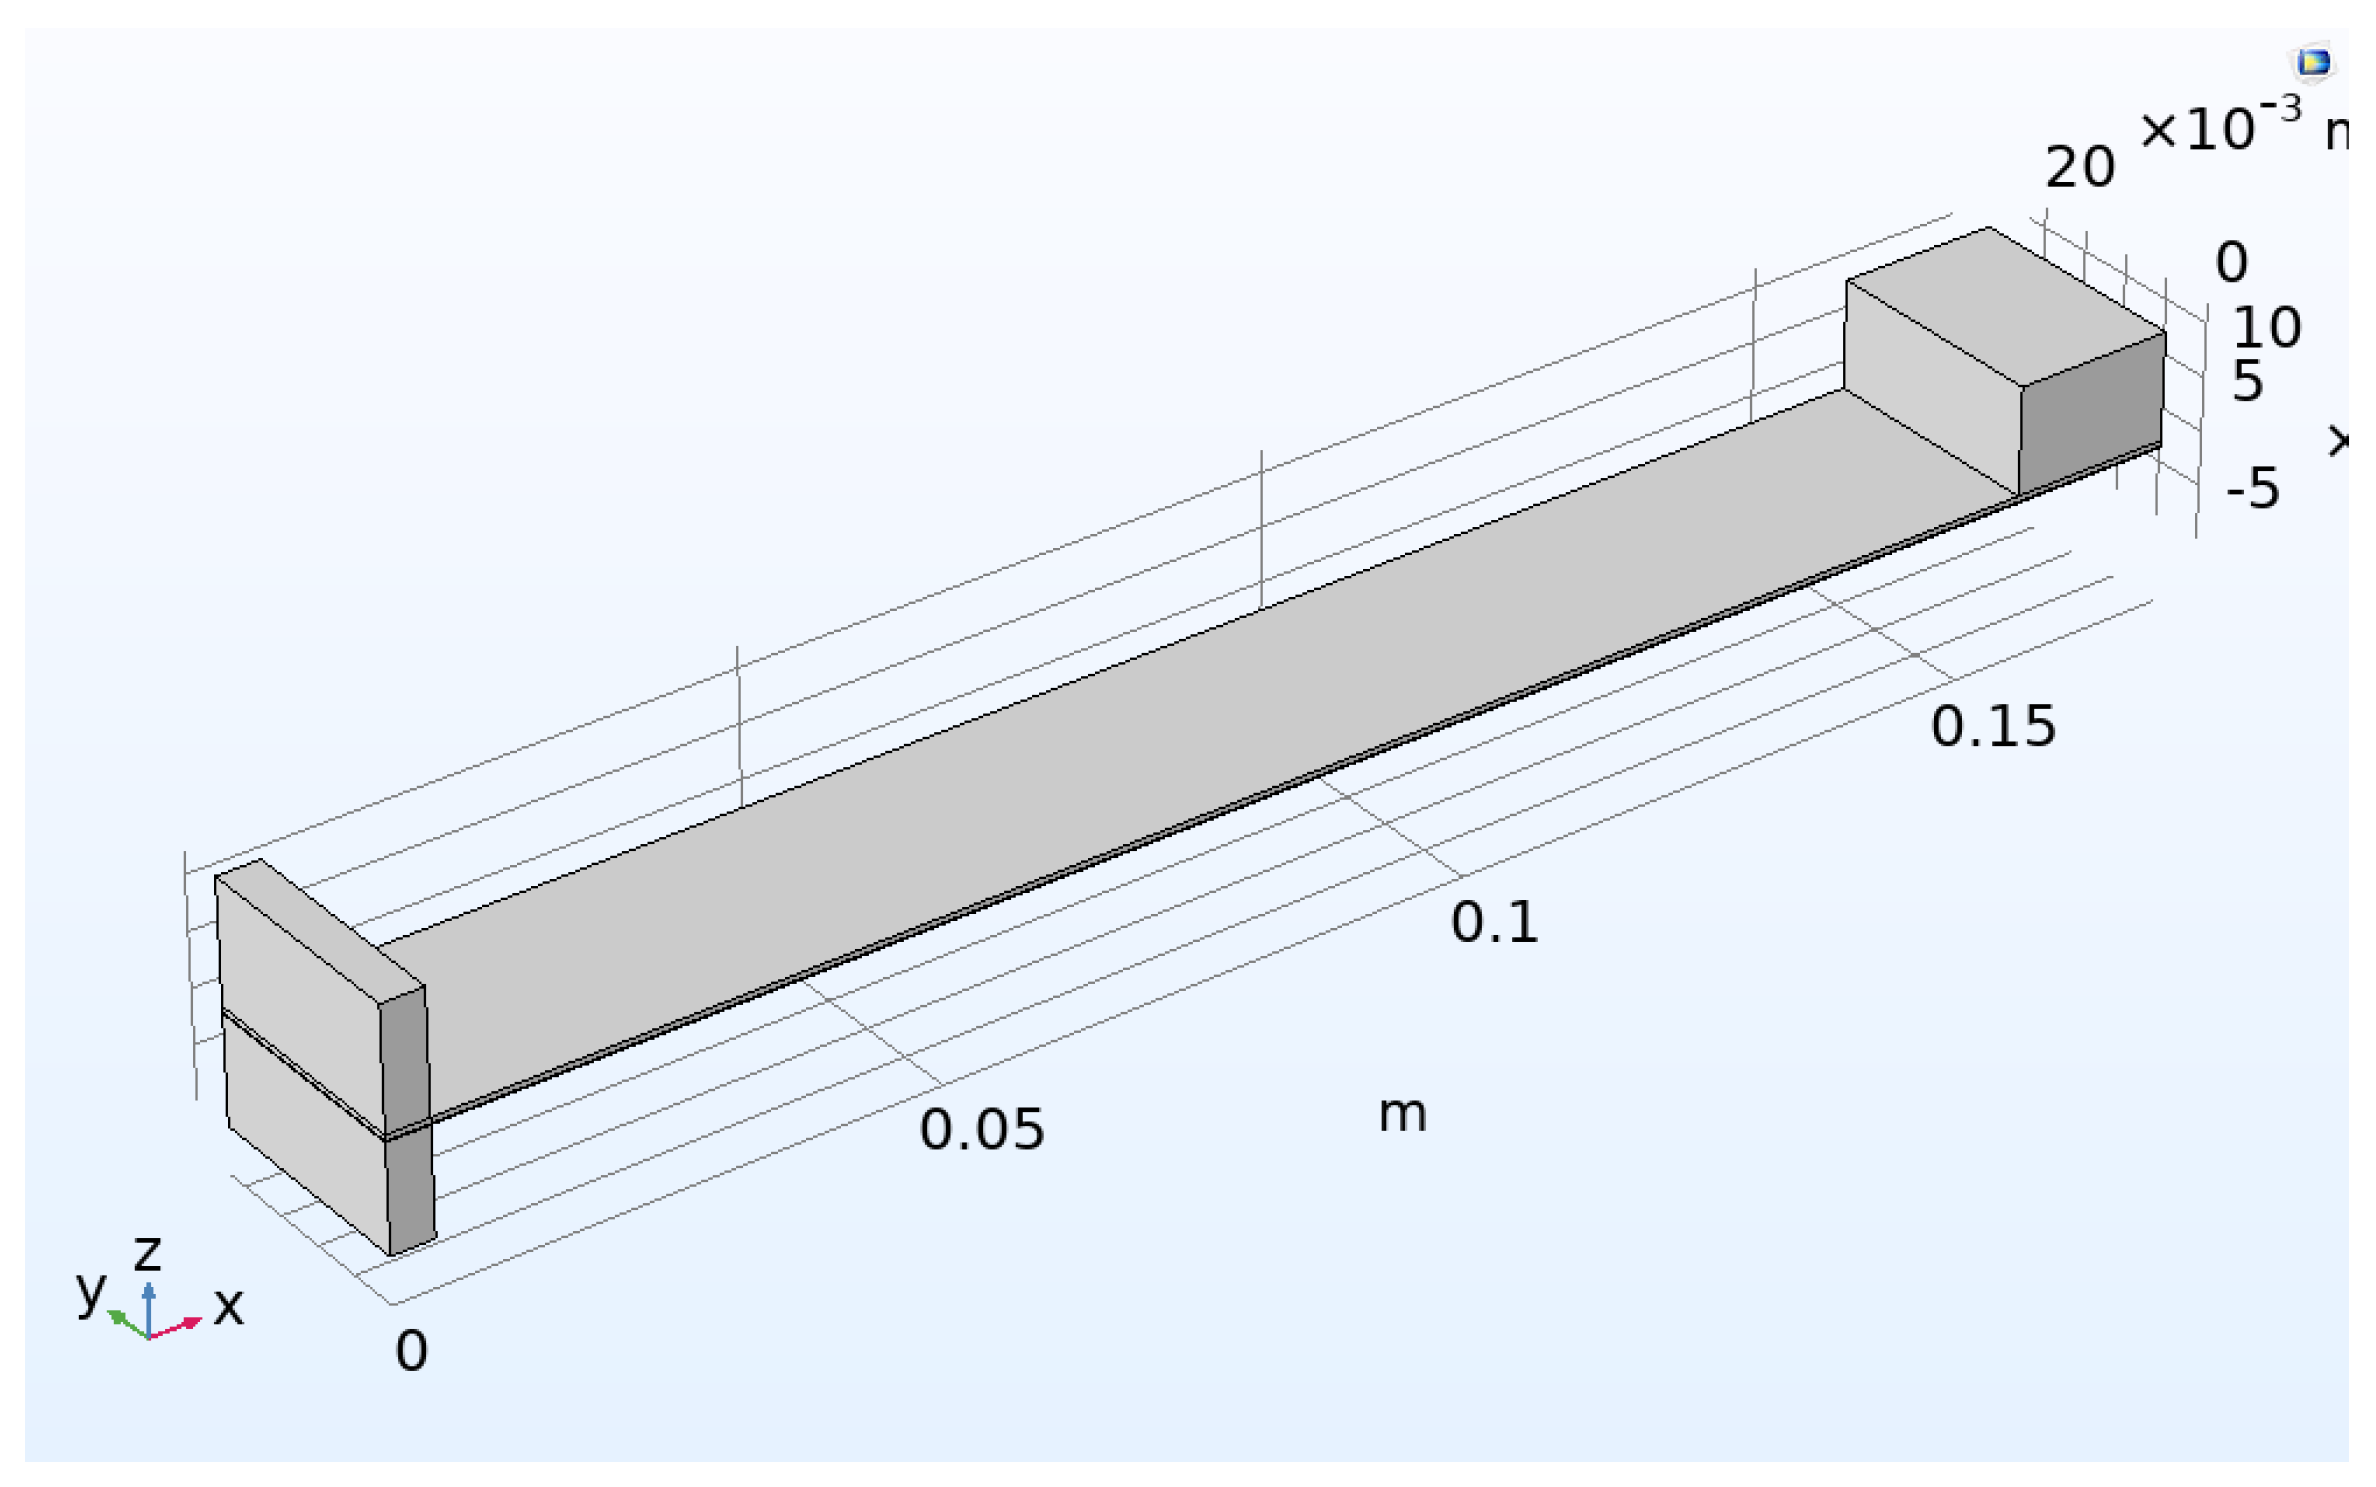
In the realm of energy harvesting, optimized geometry plays a crucial role. It's important to remember that the harvester's high-power density is only available at the low natural frequency. The proposed device geometry is shown in
Figure 4. It consists of a piezoelectric layer and a rectangular substrate layer. The precise geometrical specifications of the proposed device are displayed in
Table 3.
3.2. Adding material
PZT-5A is employed for the piezoelectric component, whereas brass is used for both the substrate layer and the proof mass. The suggested device's dimensions and material properties are shown in
Table 3.
3.3. Adding Multiphysics
In this study, piezoelectric Multiphysics is assigned to the device which is comprised of electrostatics and solid mechanics physics. The physics of Solid Mechanics is based on the equations of Navier and yields results such as stresses, strains, and displacements.
3.4. Initial and boundary condition
All of the device's areas are set free, except for the fixed end of the beam. The fixed end must be securely connected to the rail line. The option for linear elastic properties such as Young modulus, density, and Poisson ratio is set to receive their values from the material library.
3.5. Creating Mesh
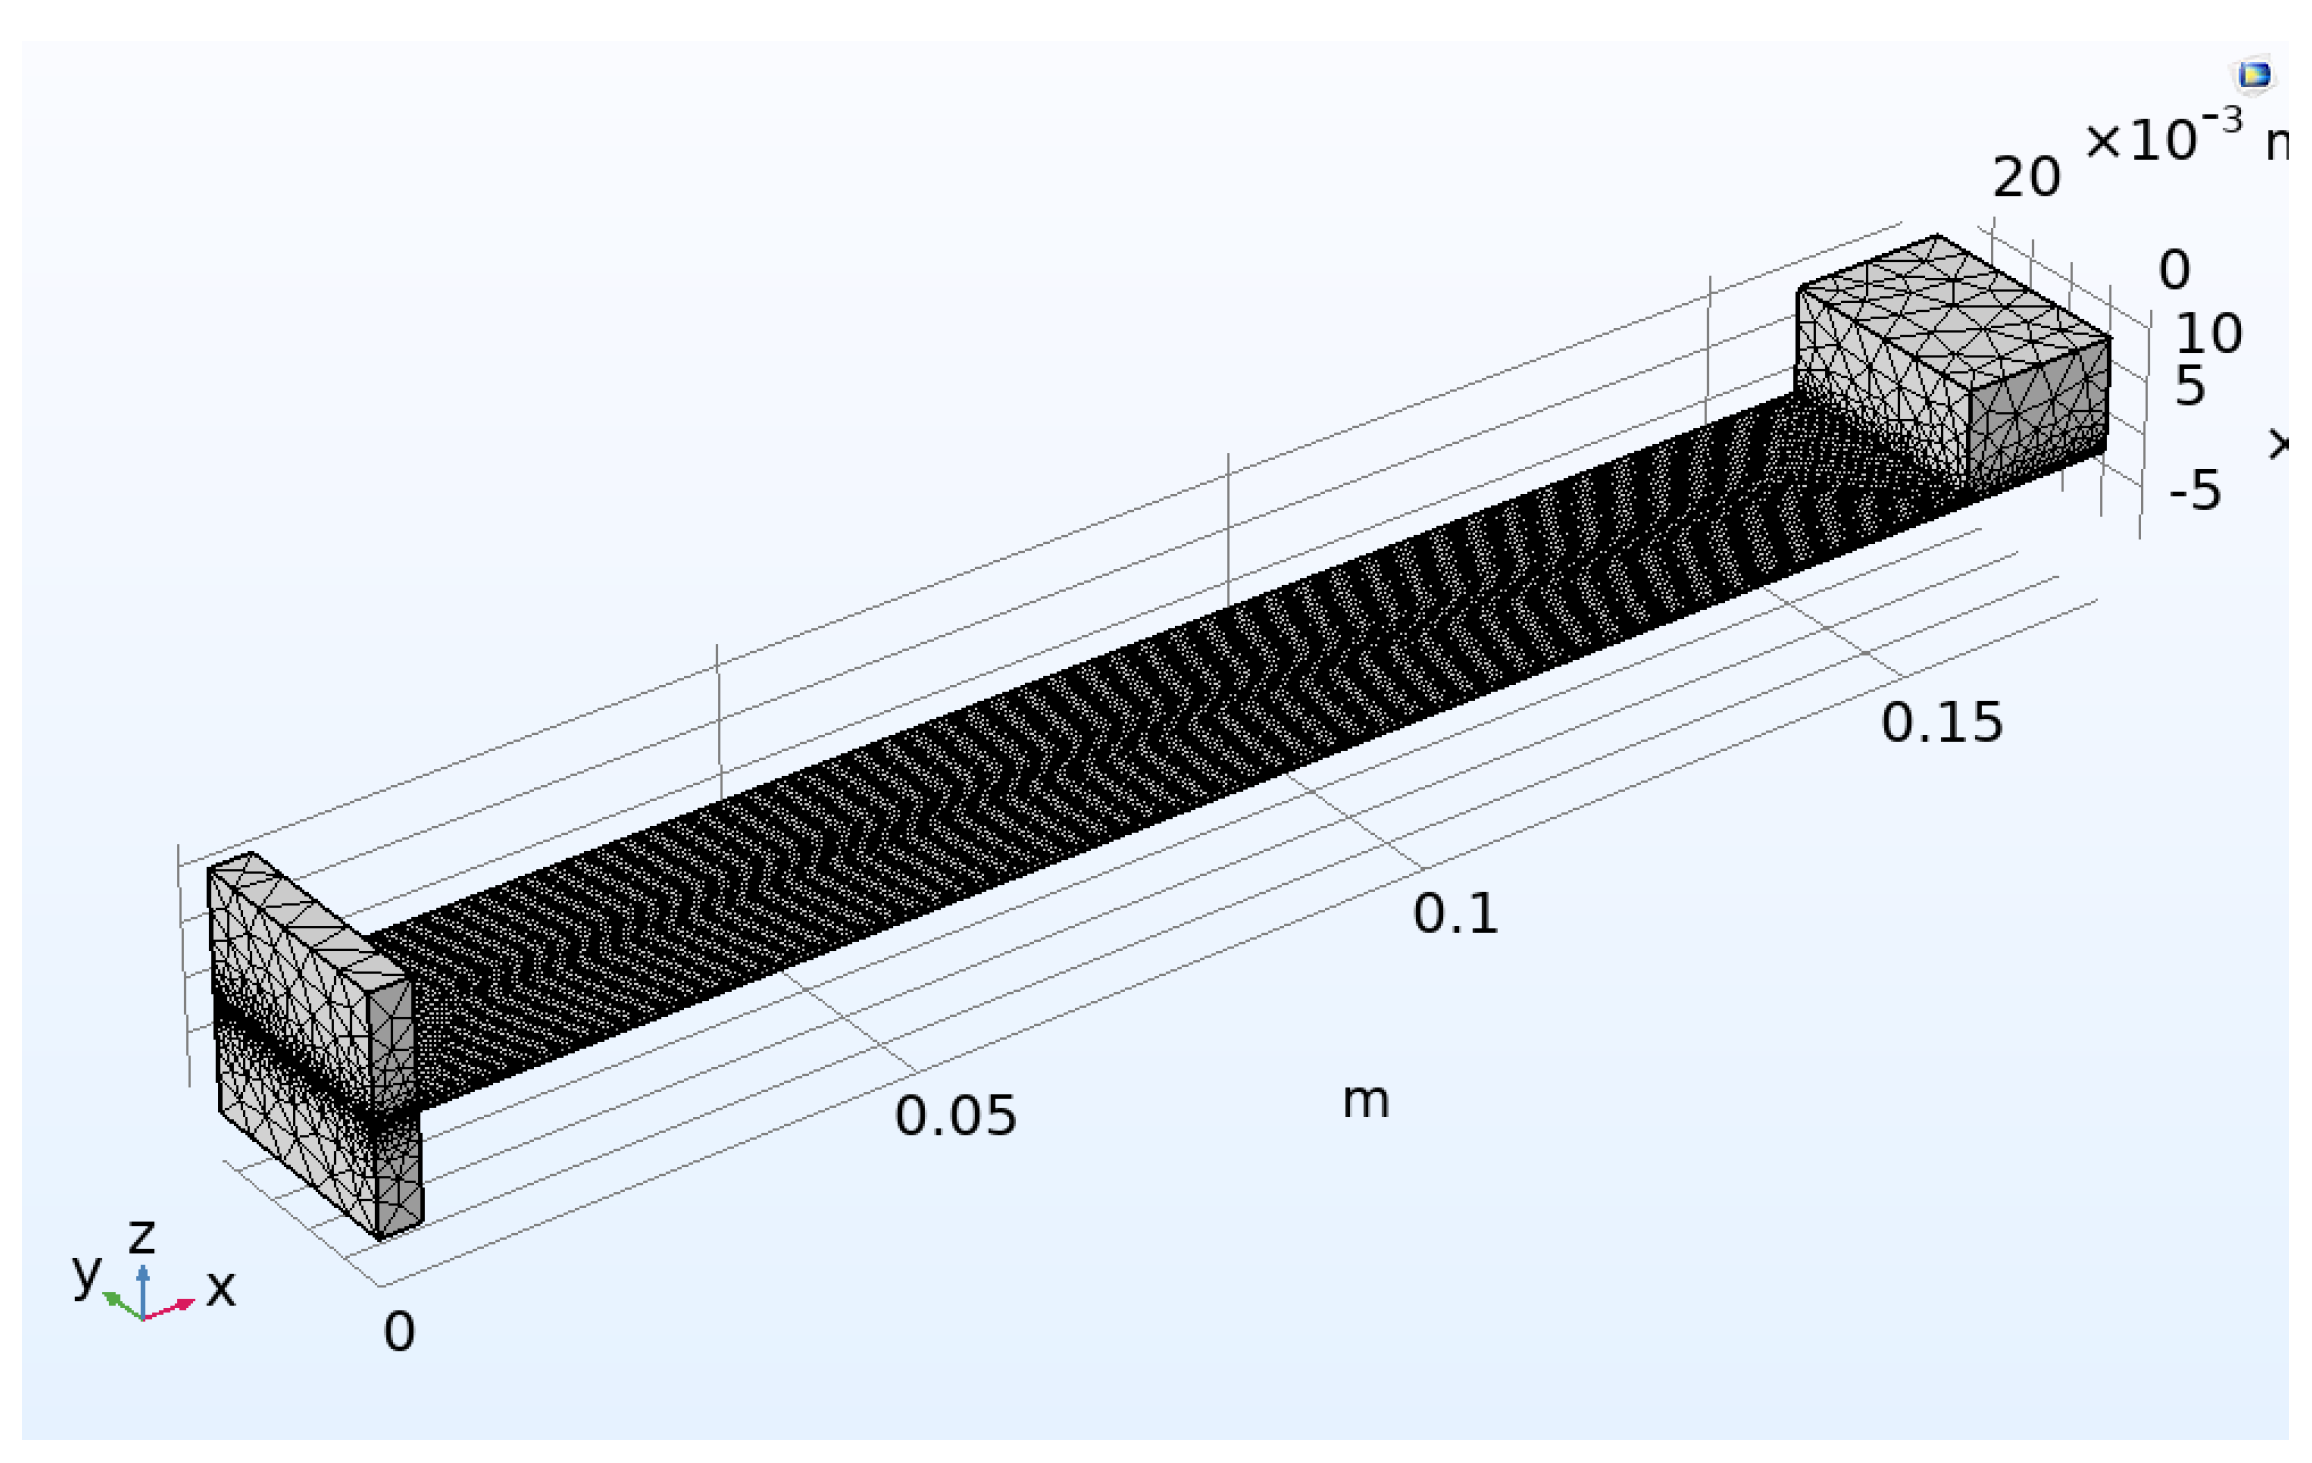
Figure 5 illustrates mesh geometry. COMSOL Multiphysics has numerous meshing defaults. This simulation uses tetrahedral mesh. The domain is small; hence an exceptionally normal element size is used. Meshing yielded 18672 boundary elements, 43967 domain elements, and 844 edge elements.
3.6. Adding Analysis
Different analyses have been carried out to analyze the effects of different parameters on the performance of piezoelectric energy harvesters. There are two types of analyses used in this investigation: stationary analysis and Eigen frequency analysis. Displacement at rest can be calculated by stationary analysis. The first six of the proposed device's natural frequencies and the mode shapes they produce can be found with the help of eigenfrequency analysis.
4. Simulation Results and Discussion
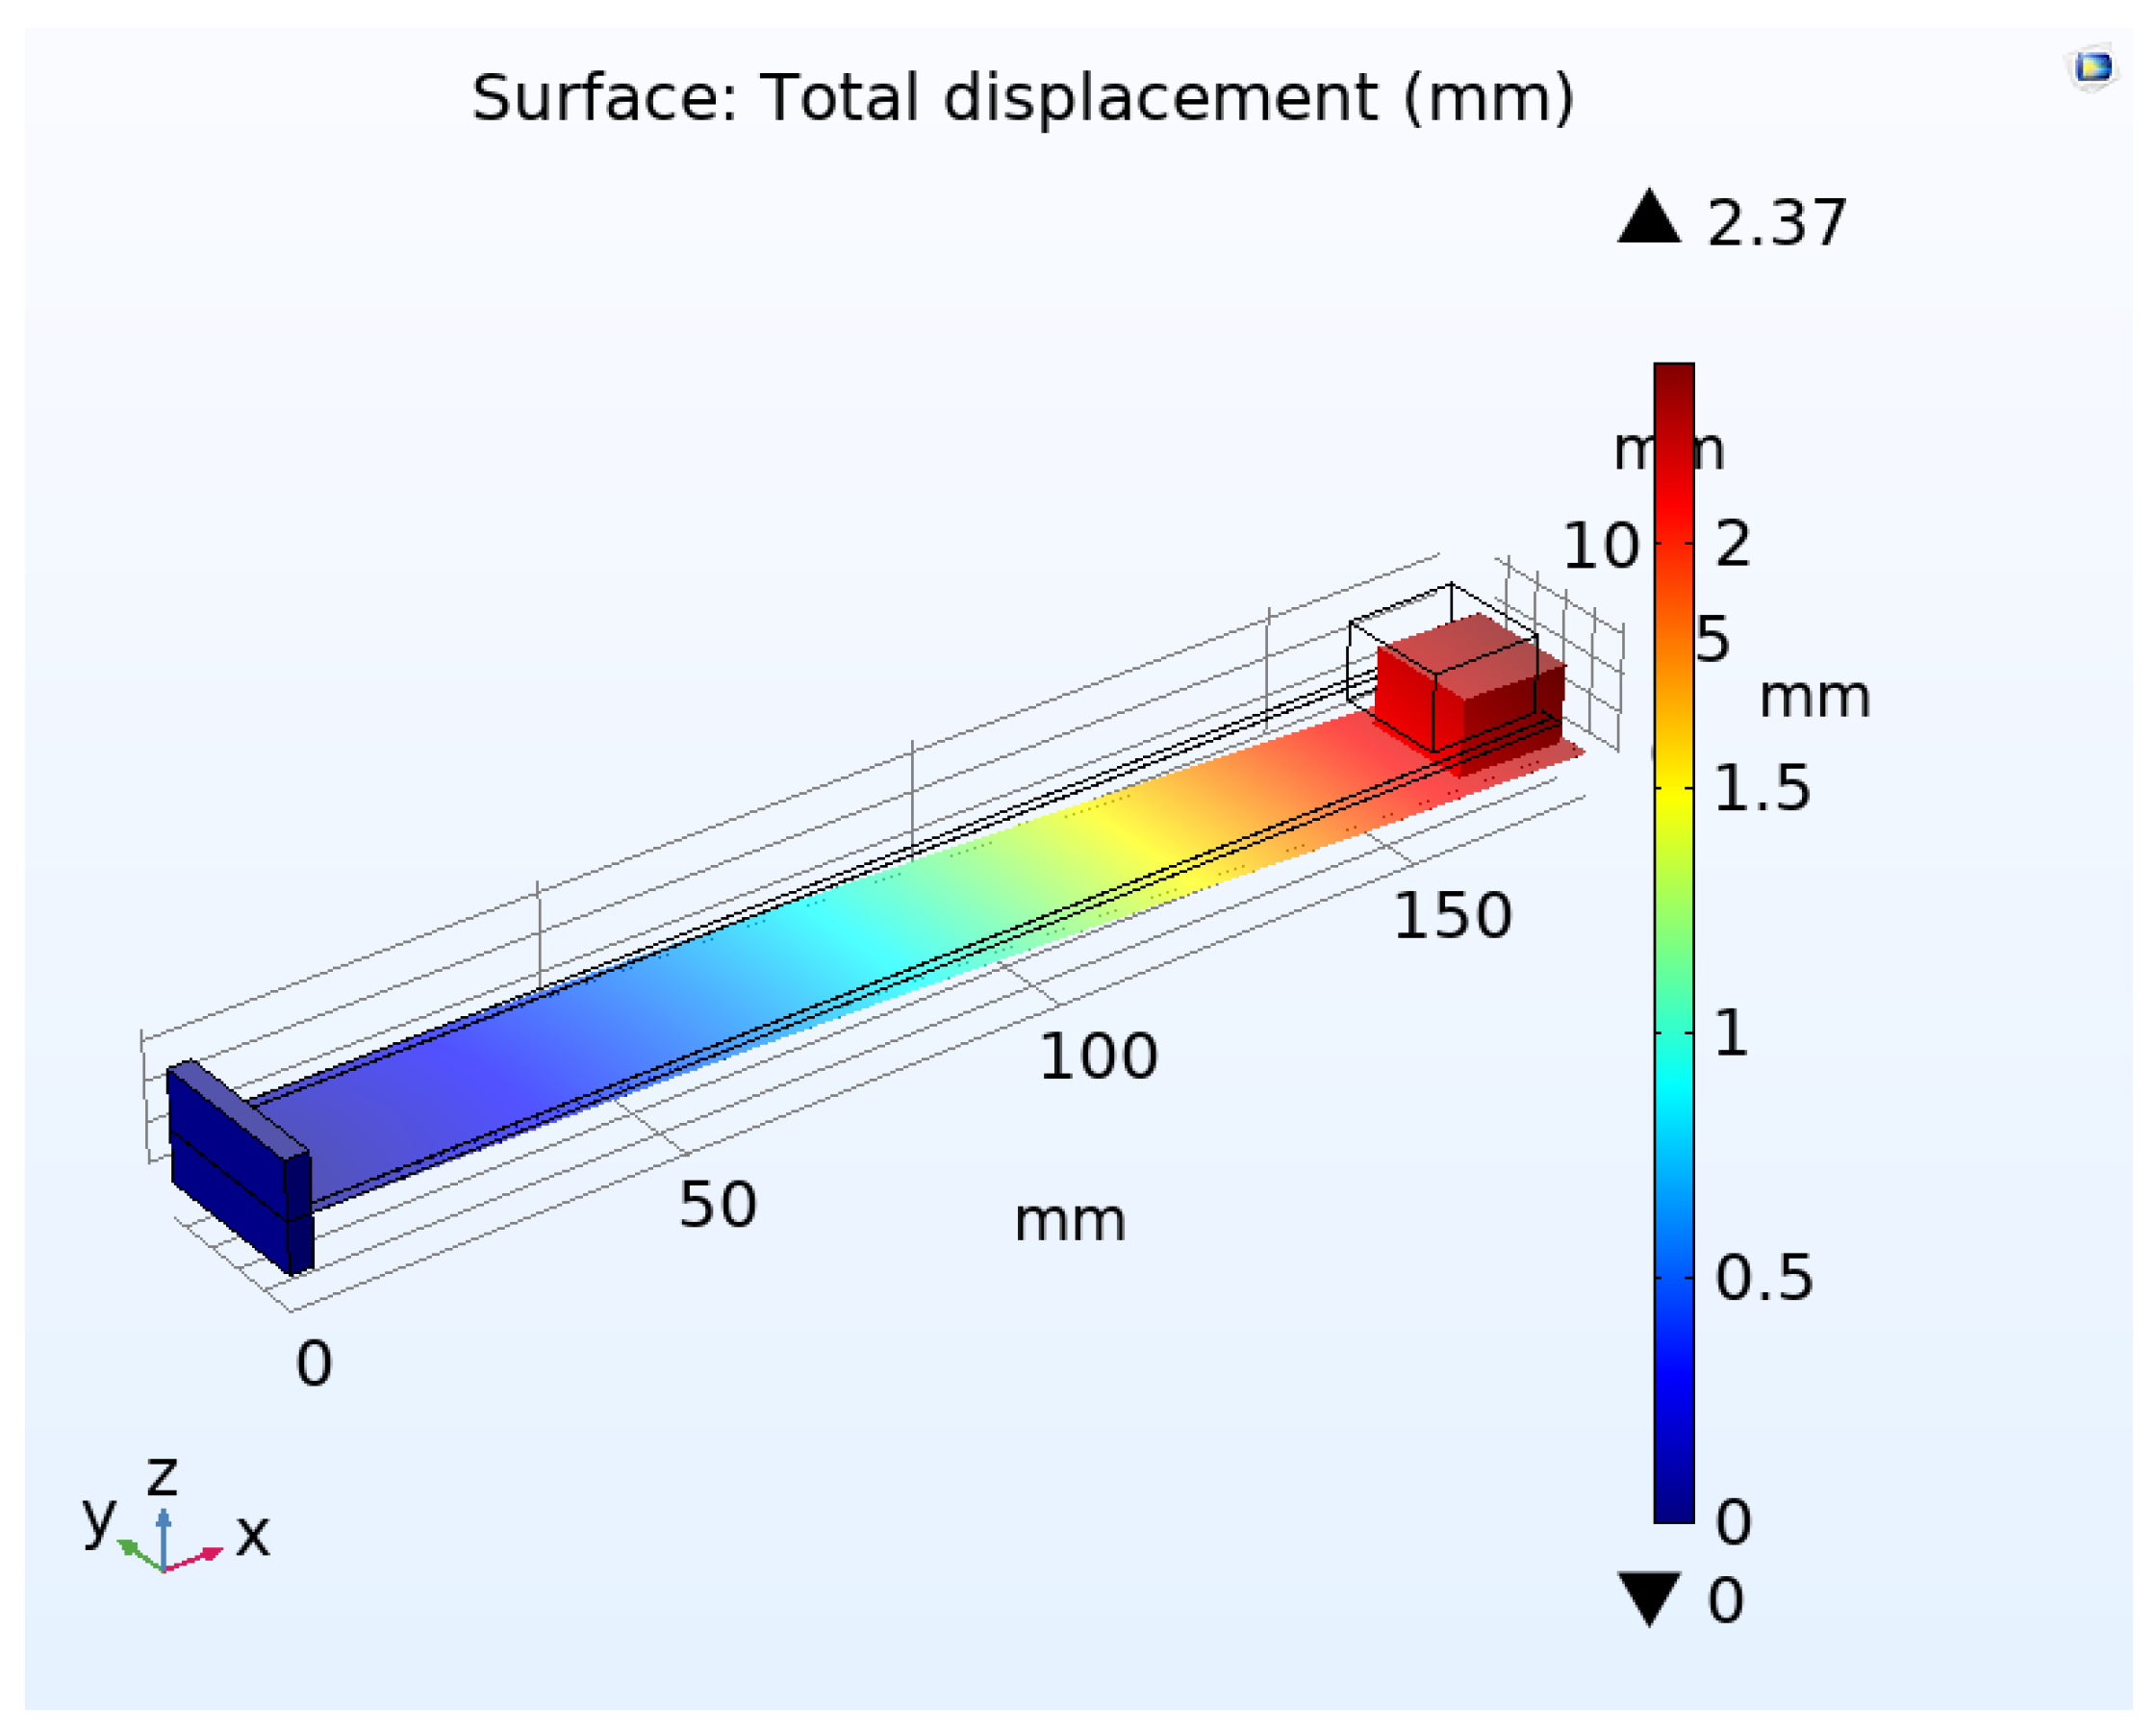
When vibration is applied at the fixed support of the beam, deflection is produced in the beam as shown in
Figure 6. The deflection is maximum at the free end and minimum at the fixed end of the beam. Piezoelectric beams bend and twist, causing tensions within the plates themselves. Vibration given to the device causes a corresponding fluctuation in stress.
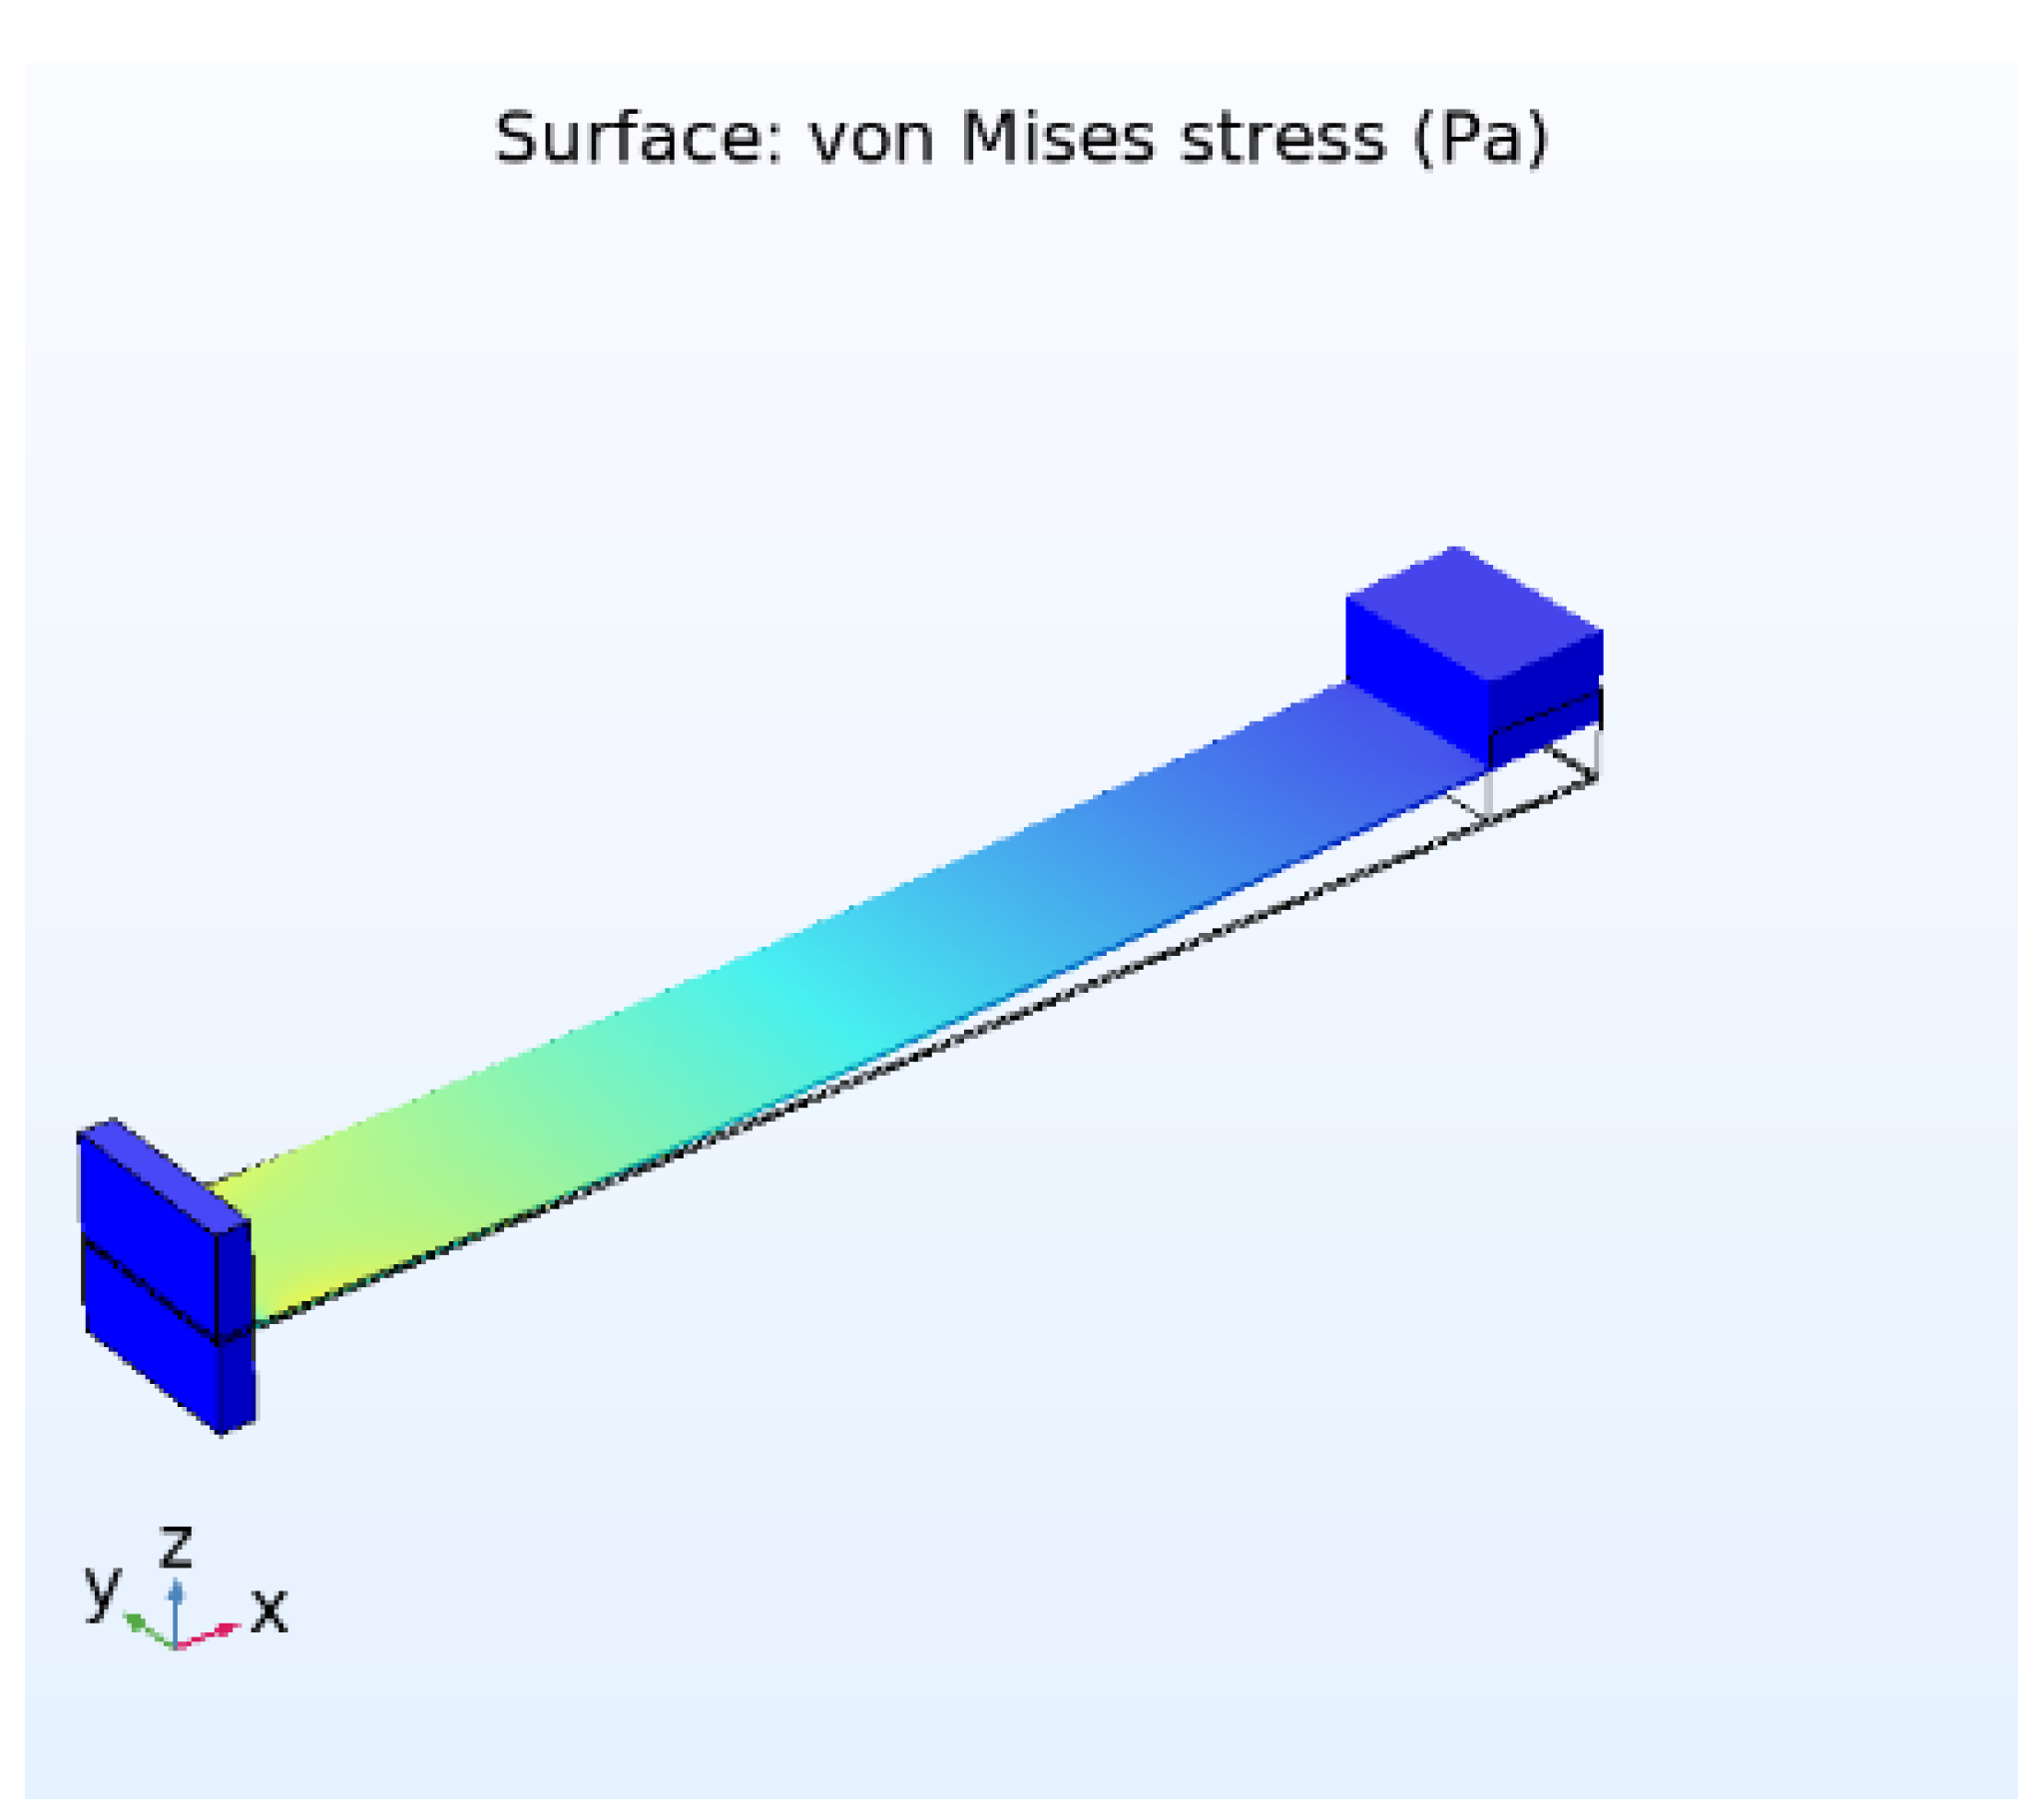
Figure 7 displays the simulation results showing that at 5 m/s acceleration, the greatest stress created is 2.87 MPa at the fixed side of the beam and the minimum stress developed is 0.001360 MPa at the free end of the beam.
The eigen frequencies and mode shapes are the outputs of an eigen frequency analysis. Finding the six lowest eigen frequencies (natural frequencies) and the geometry of the associated modes is the goal of the eigen frequency analysis, as illustrated in
Table 4.
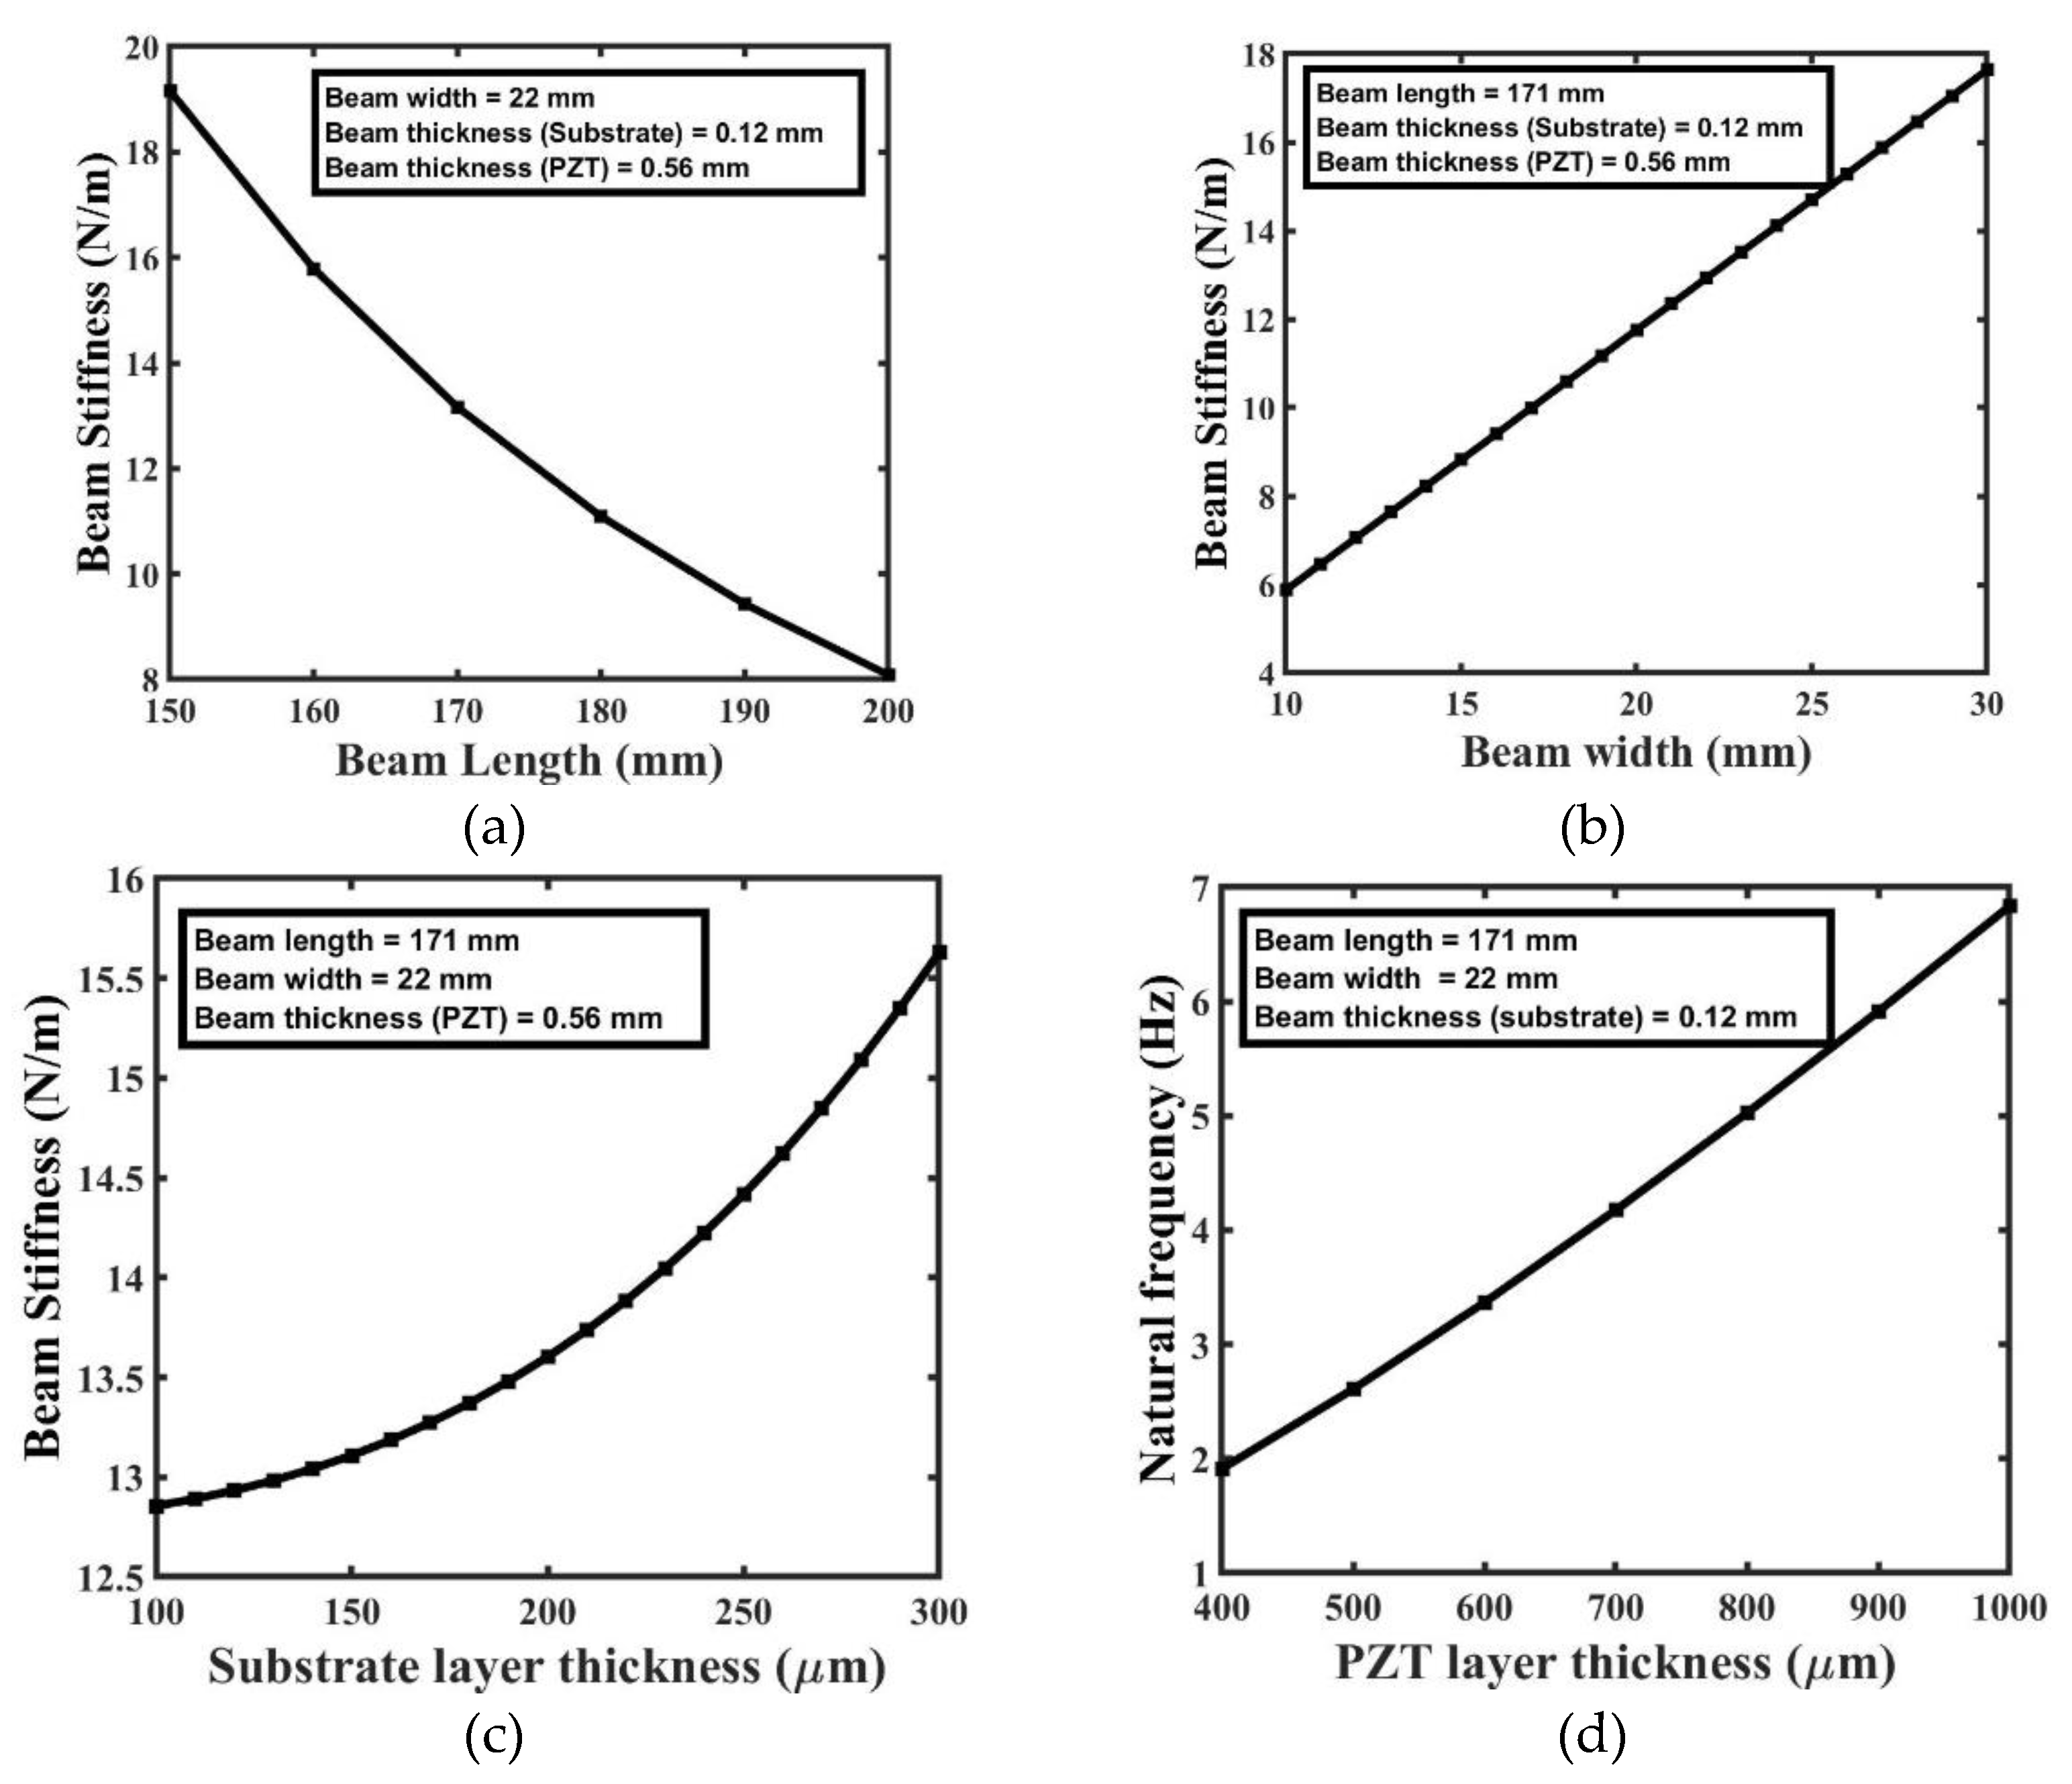
MATLAB simulation is used to analyze the different factors based on the analytical model developed in the previous section. There is a strong correlation between the length, width, and thickness of a cantilever beam and its stiffness, as shown in
Figure 8. Stiffness values decline noticeably from 18 N/m to 8 N/m as the length of the cantilever beam grows from 150 mm to 200 mm (
Figure 8(a)). This finding is consistent with the general rule that beams with a greater length are less rigid because they bend more easily under the same strain. In contrast, beams that are shorter by definition are stronger and less likely to deform under load.
Figure 8(b) shows the relationship between beam width and with stiffness of the beam. The rigidity of a cantilever beam increases dramatically from 6 N/m to 17 N/m as its width grows from 10 mm to 30 mm.
Figure 8(c) and 8(d) demonstrates that, when the thickness of the layer is increased, it increases the stiffness of the beam. When the thickness of the substrate layer varies from 100 µm to 300 µm, the stiffness of the beam increased from 12.9 N/m to 15.7 N/m. Similarly, when the thickness of the PZT layer is changed from 400 µm to 1000 µm, the beam stiffness varies from 5 N/m to 72 N/m. From these results, it is clear that the stiffness is more affected by changes in the thickness of the PZT layer compared to the substrate layer.
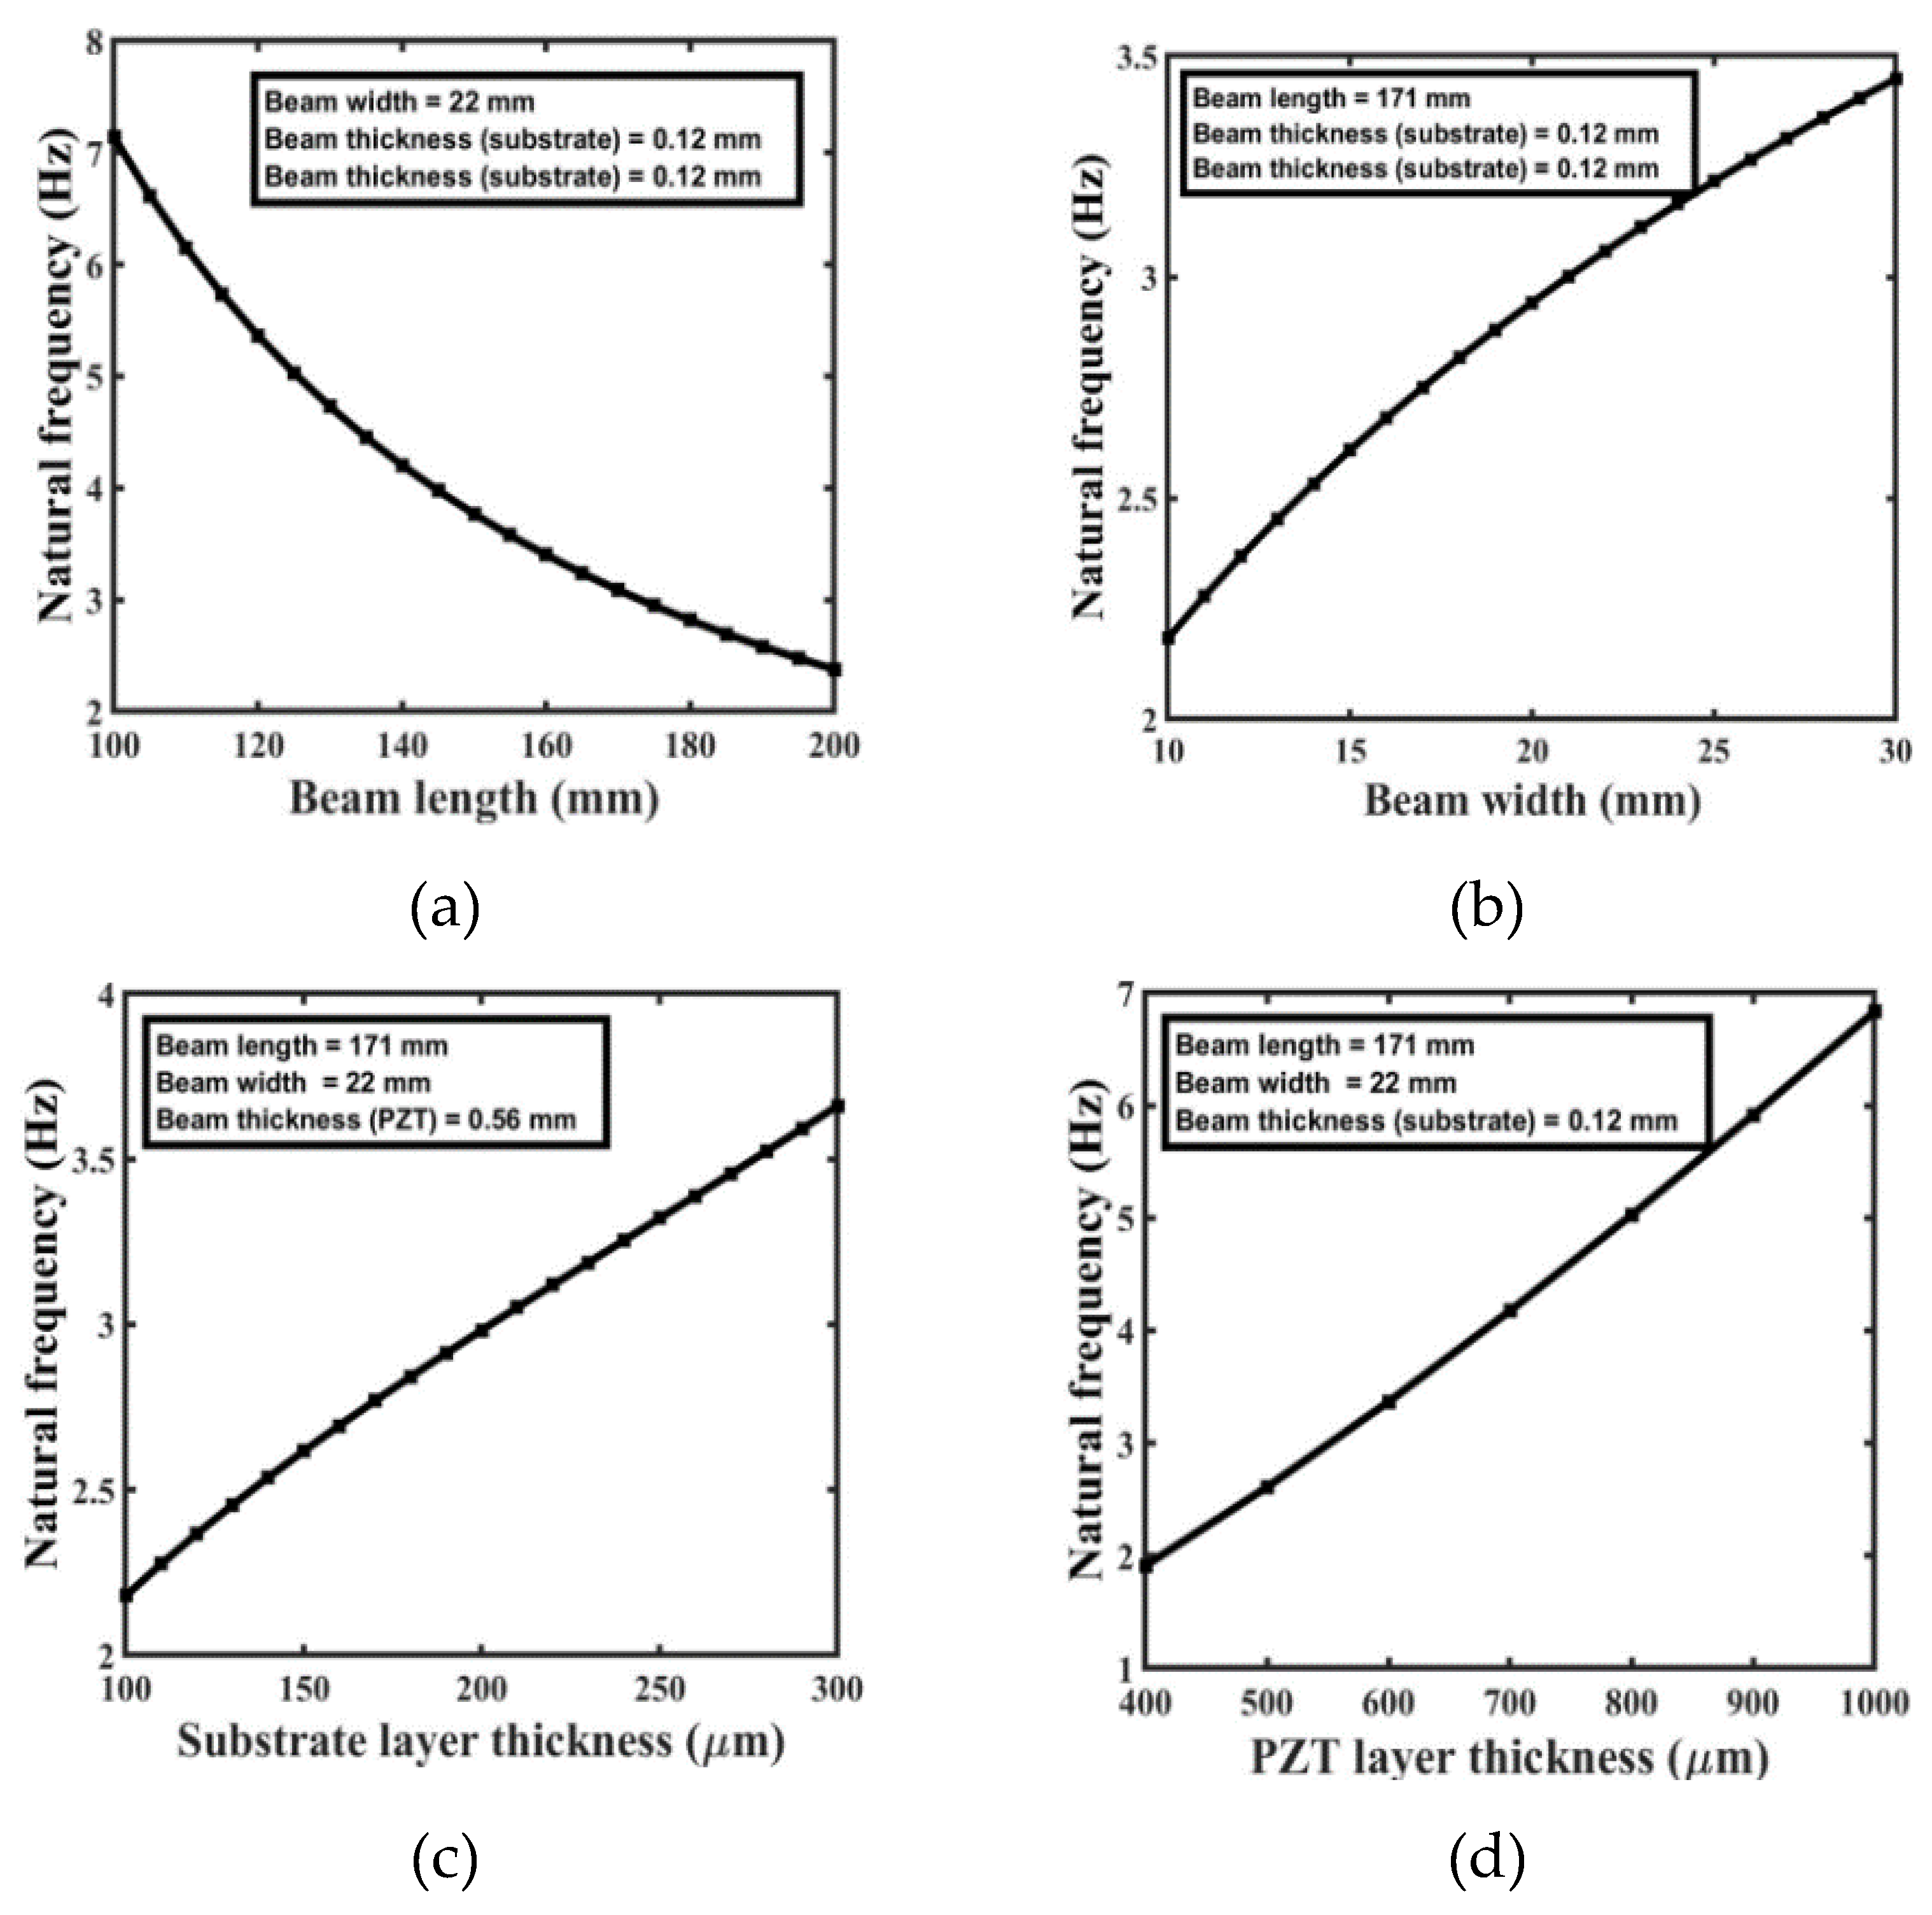
The dependency of the beam's natural frequency on beam dimension is depicted in
Figure 9. The dynamic behavior of a cantilever beam is best understood by
Figure 9(a) displaying the relationship between the length of the beam and its natural frequency at constant beam width and thickness. A significant drop in natural frequency is shown as beam length is increased from 150 mm to 200 mm, with values going from 7.1 Hz to 1.2 Hz. This trend can be attributed to the fundamental principle that longer beams exhibit lower natural frequencies, indicating greater flexibility and a longer period for oscillation. However, shorter beams indicate stiffer materials with faster oscillation cycles due to their higher inherent frequencies. Certainly, the width and thickness of each layer affect the natural frequency of a cantilever beam in addition to its length. When the length and thickness are held constant, the relationship between natural frequency and beam width is shown in
Figure 9(b). The beam's natural frequency falls as its width increase. Beam natural frequency with substrate layer thickness for a fixed beam size is analysed in
Figure 9(c). The natural frequency rises dramatically as the thickness of the substrate layer rises.
Figure 9(d) depicts the linear relationship between the natural frequency of a beam and the thickness of a PZT layer for a beam of constant length and width. Increases in PZT layer thickness result in a higher natural frequency.
Figure 10 depicts the relationship between the cantilever beam's tip mass and natural frequency. By adding a proof mass at the free end of the beam, the natural frequency is drastically reduced. As the proof mass varies between 0 g to 300 g, the frequency decreases from 4.4 Hz to 1 Hz. This decrease in natural frequency is directly attributable to the additional mass, which effectively modifies the beam's inertia and stiffness, resulting in a decreased oscillation rate. In numerous applications, such as vibration isolation, energy harvesting, and precision sensing, modulating the natural frequency to meet specific requirements is essential for optimal performance.
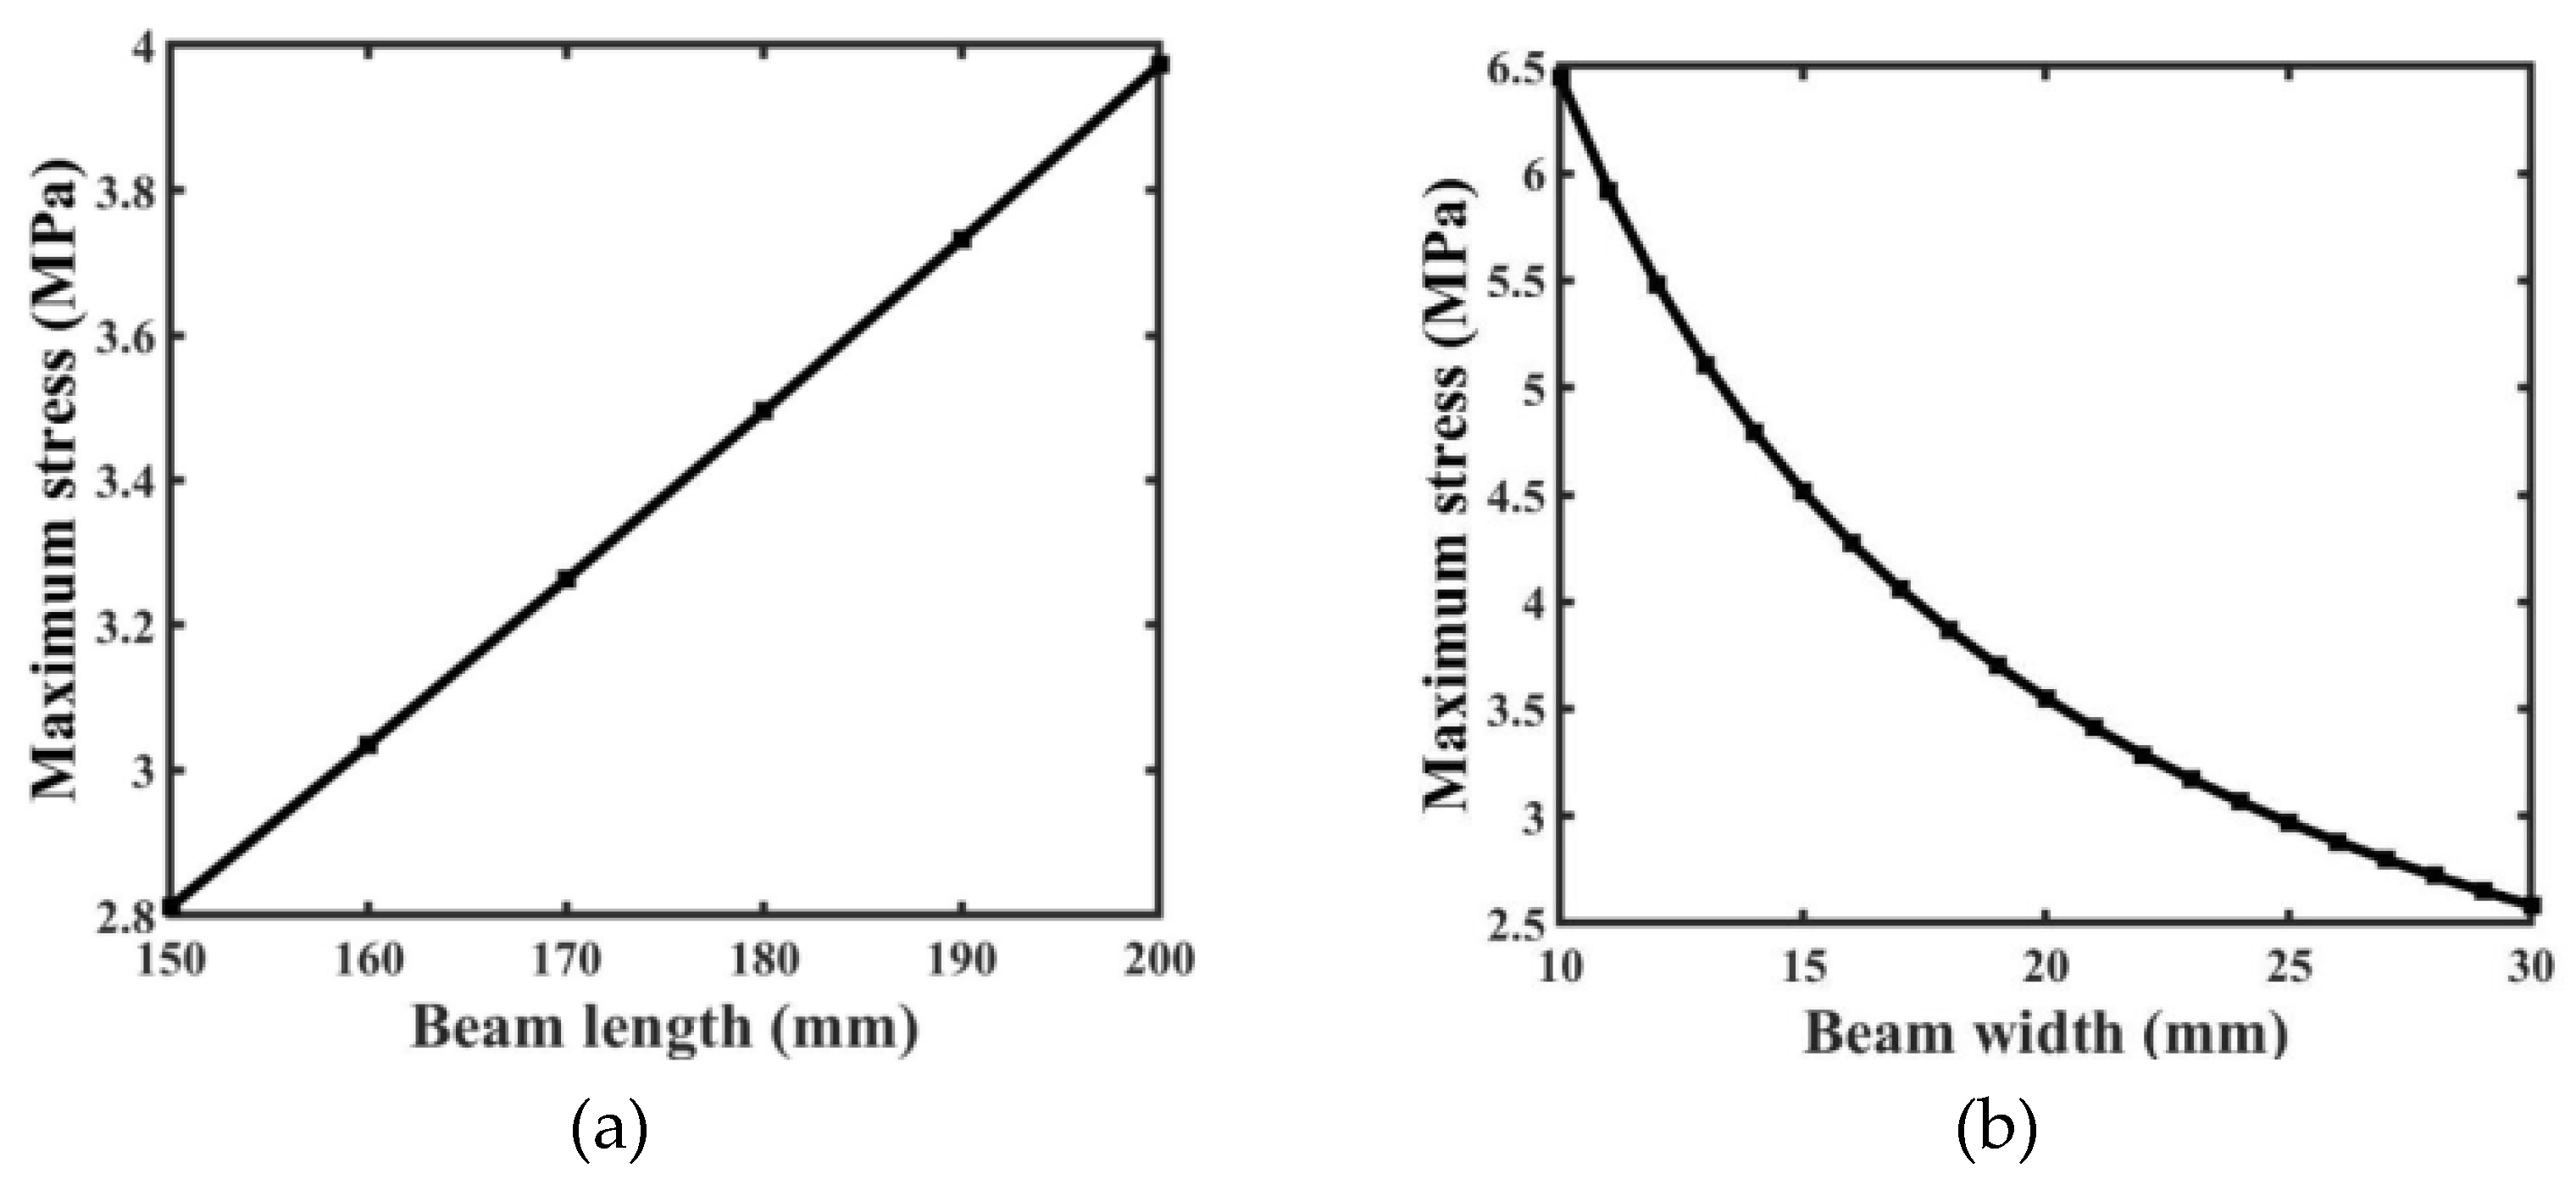
When a cantilever beam piezoelectric energy harvester is excited at its base, the stress generated within the beam is highly dependent on its dimensions (length, width, and layer thickness) as depicted in
Figure 11. Maximum stress increases with beam length because longer beams bend and deform more under an applied excitation. In contrast, the maximum stress decreases as beam width increases because broader beams provide greater resistance to bending, hence reducing the stress concentration. Increasing the beam's length from 150 mm to 200 mm results in a corresponding increase in maximum stress from 2.8 MPa to 3.9 MPa.
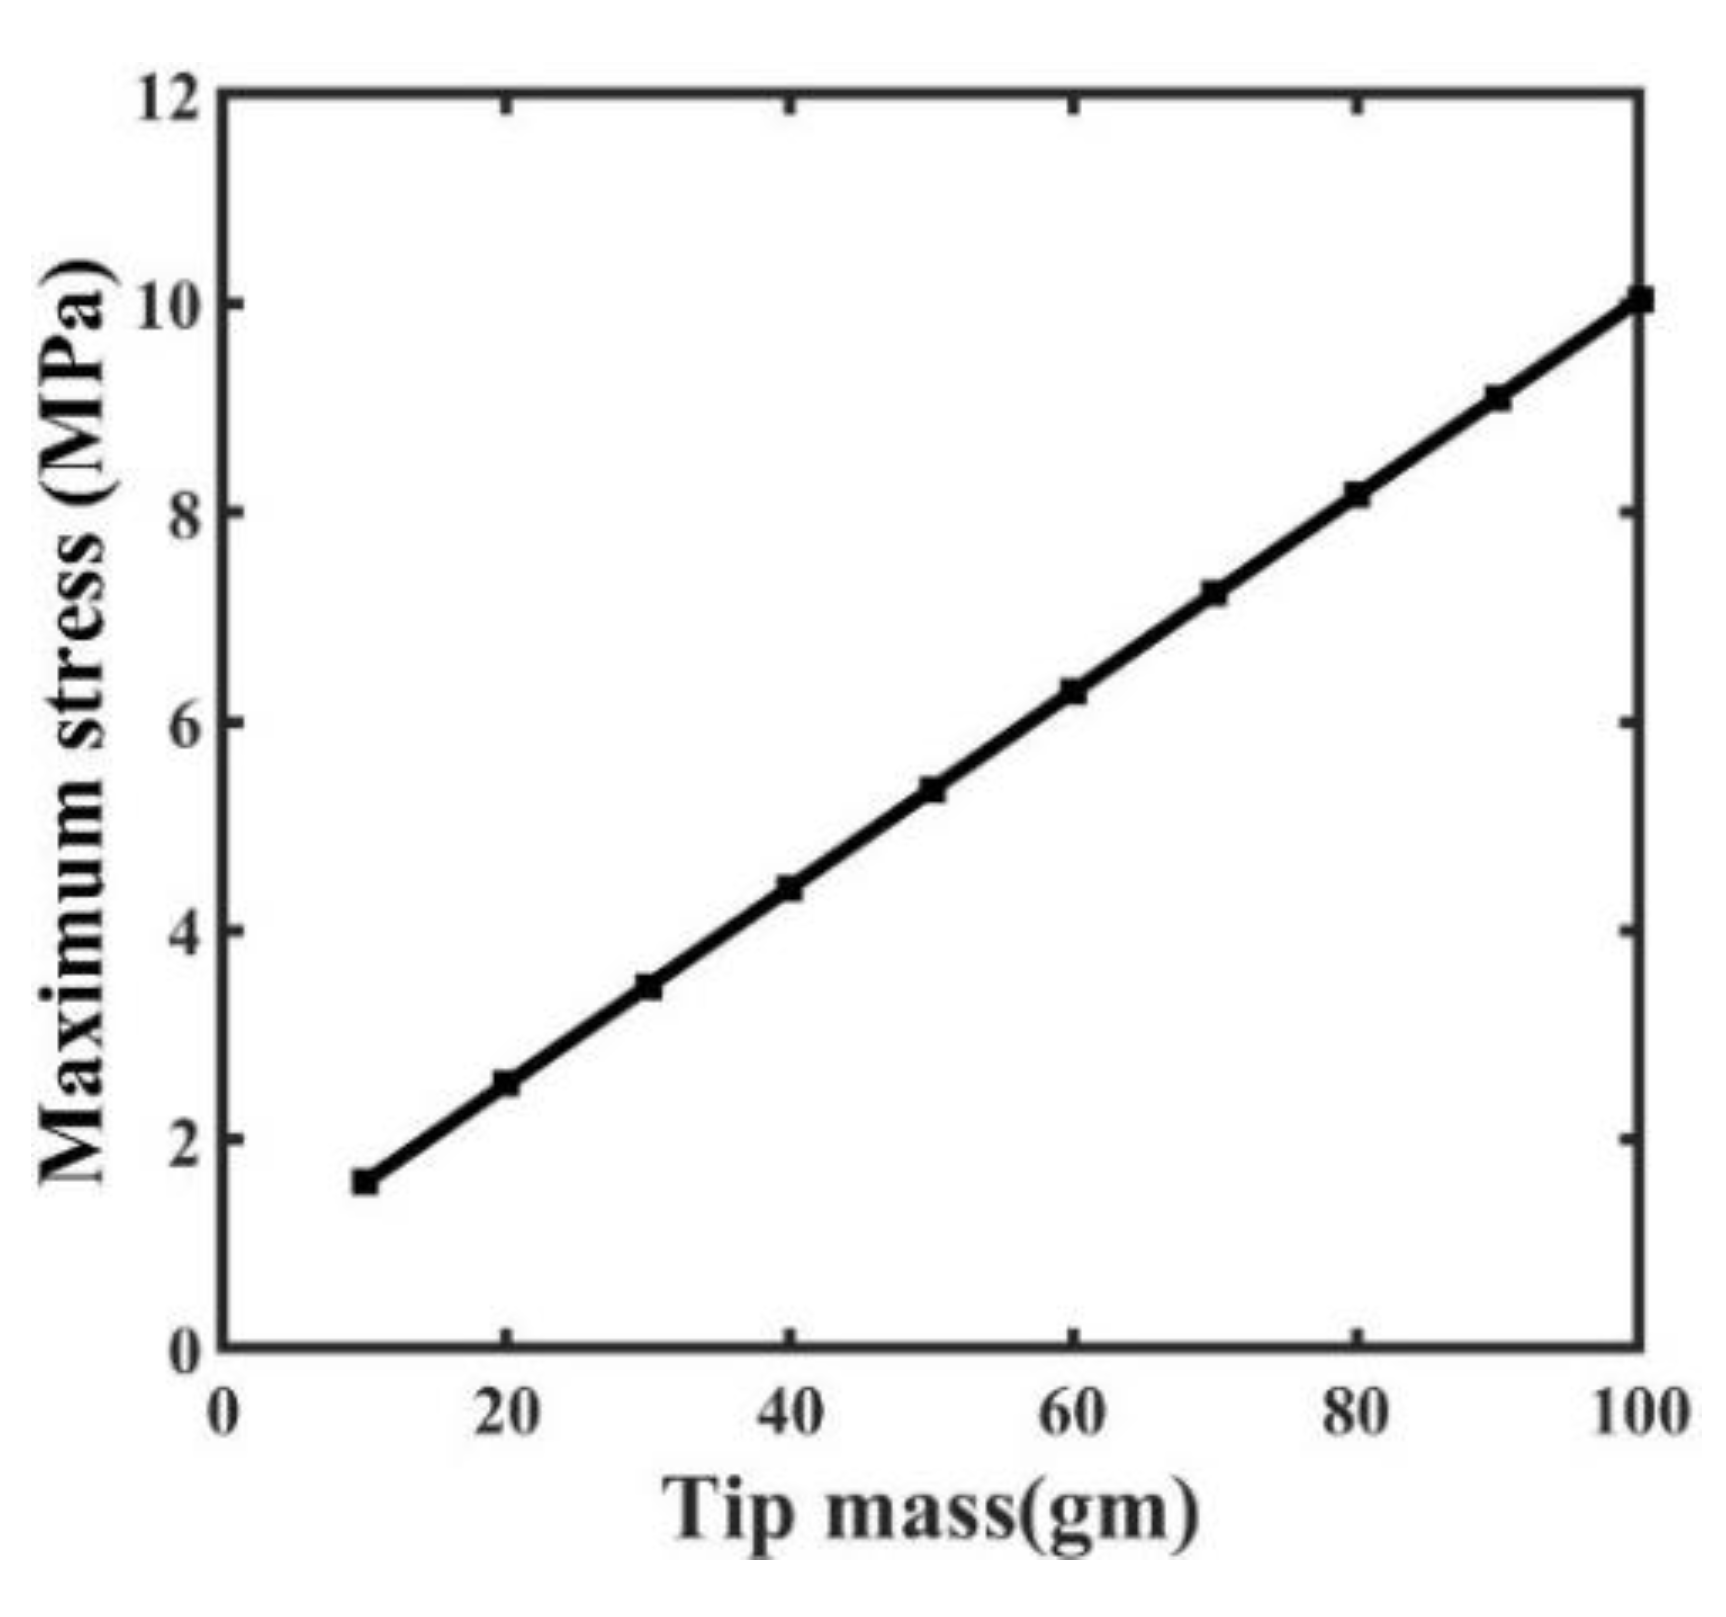
The maximum stress in a cantilever beam as a function of tip mass is shown in
Figure 12. The tension in the beam varies significantly as the tip mass is changed from 0 gm to 300 gm, going from 1.8 MPa to 10 MPa. This finding demonstrates how the increased mass at the beam's top has a dramatic effect on the beam's structural behaviors and stress distribution. Higher stresses in the beam are a direct result of the increased forces and deformations caused by the heavier load at the top.
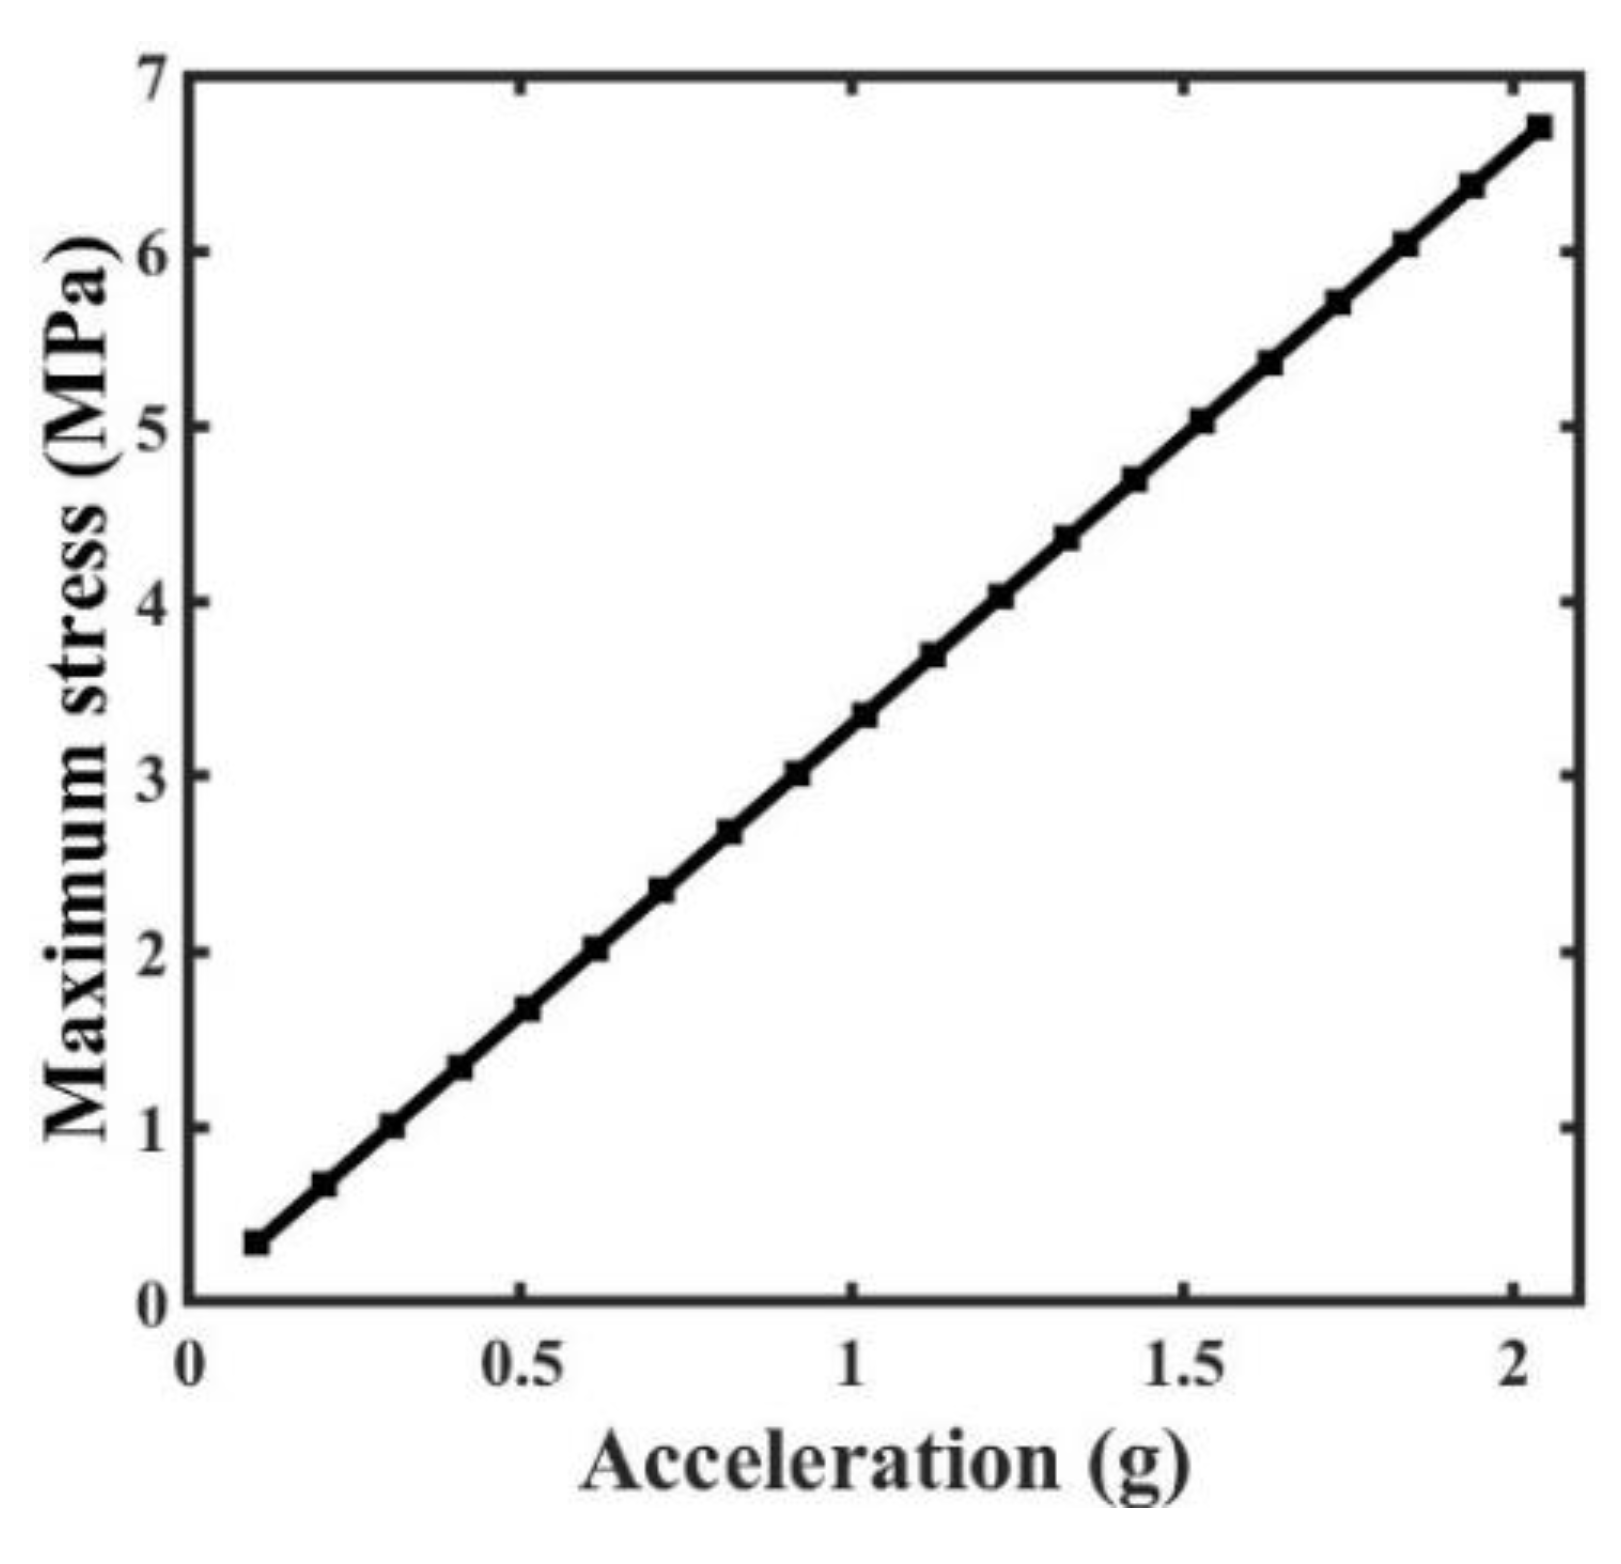
When a cantilever beam piezoelectric energy harvester is excited at its base, the input acceleration has a significant effect on the stress within the beam as depicted in
Figure 13. The maximum stress in the beam dramatically shifts from 0.5 MPa to 6.8 MPa as the input acceleration is doubled from 1 g to 2 g.
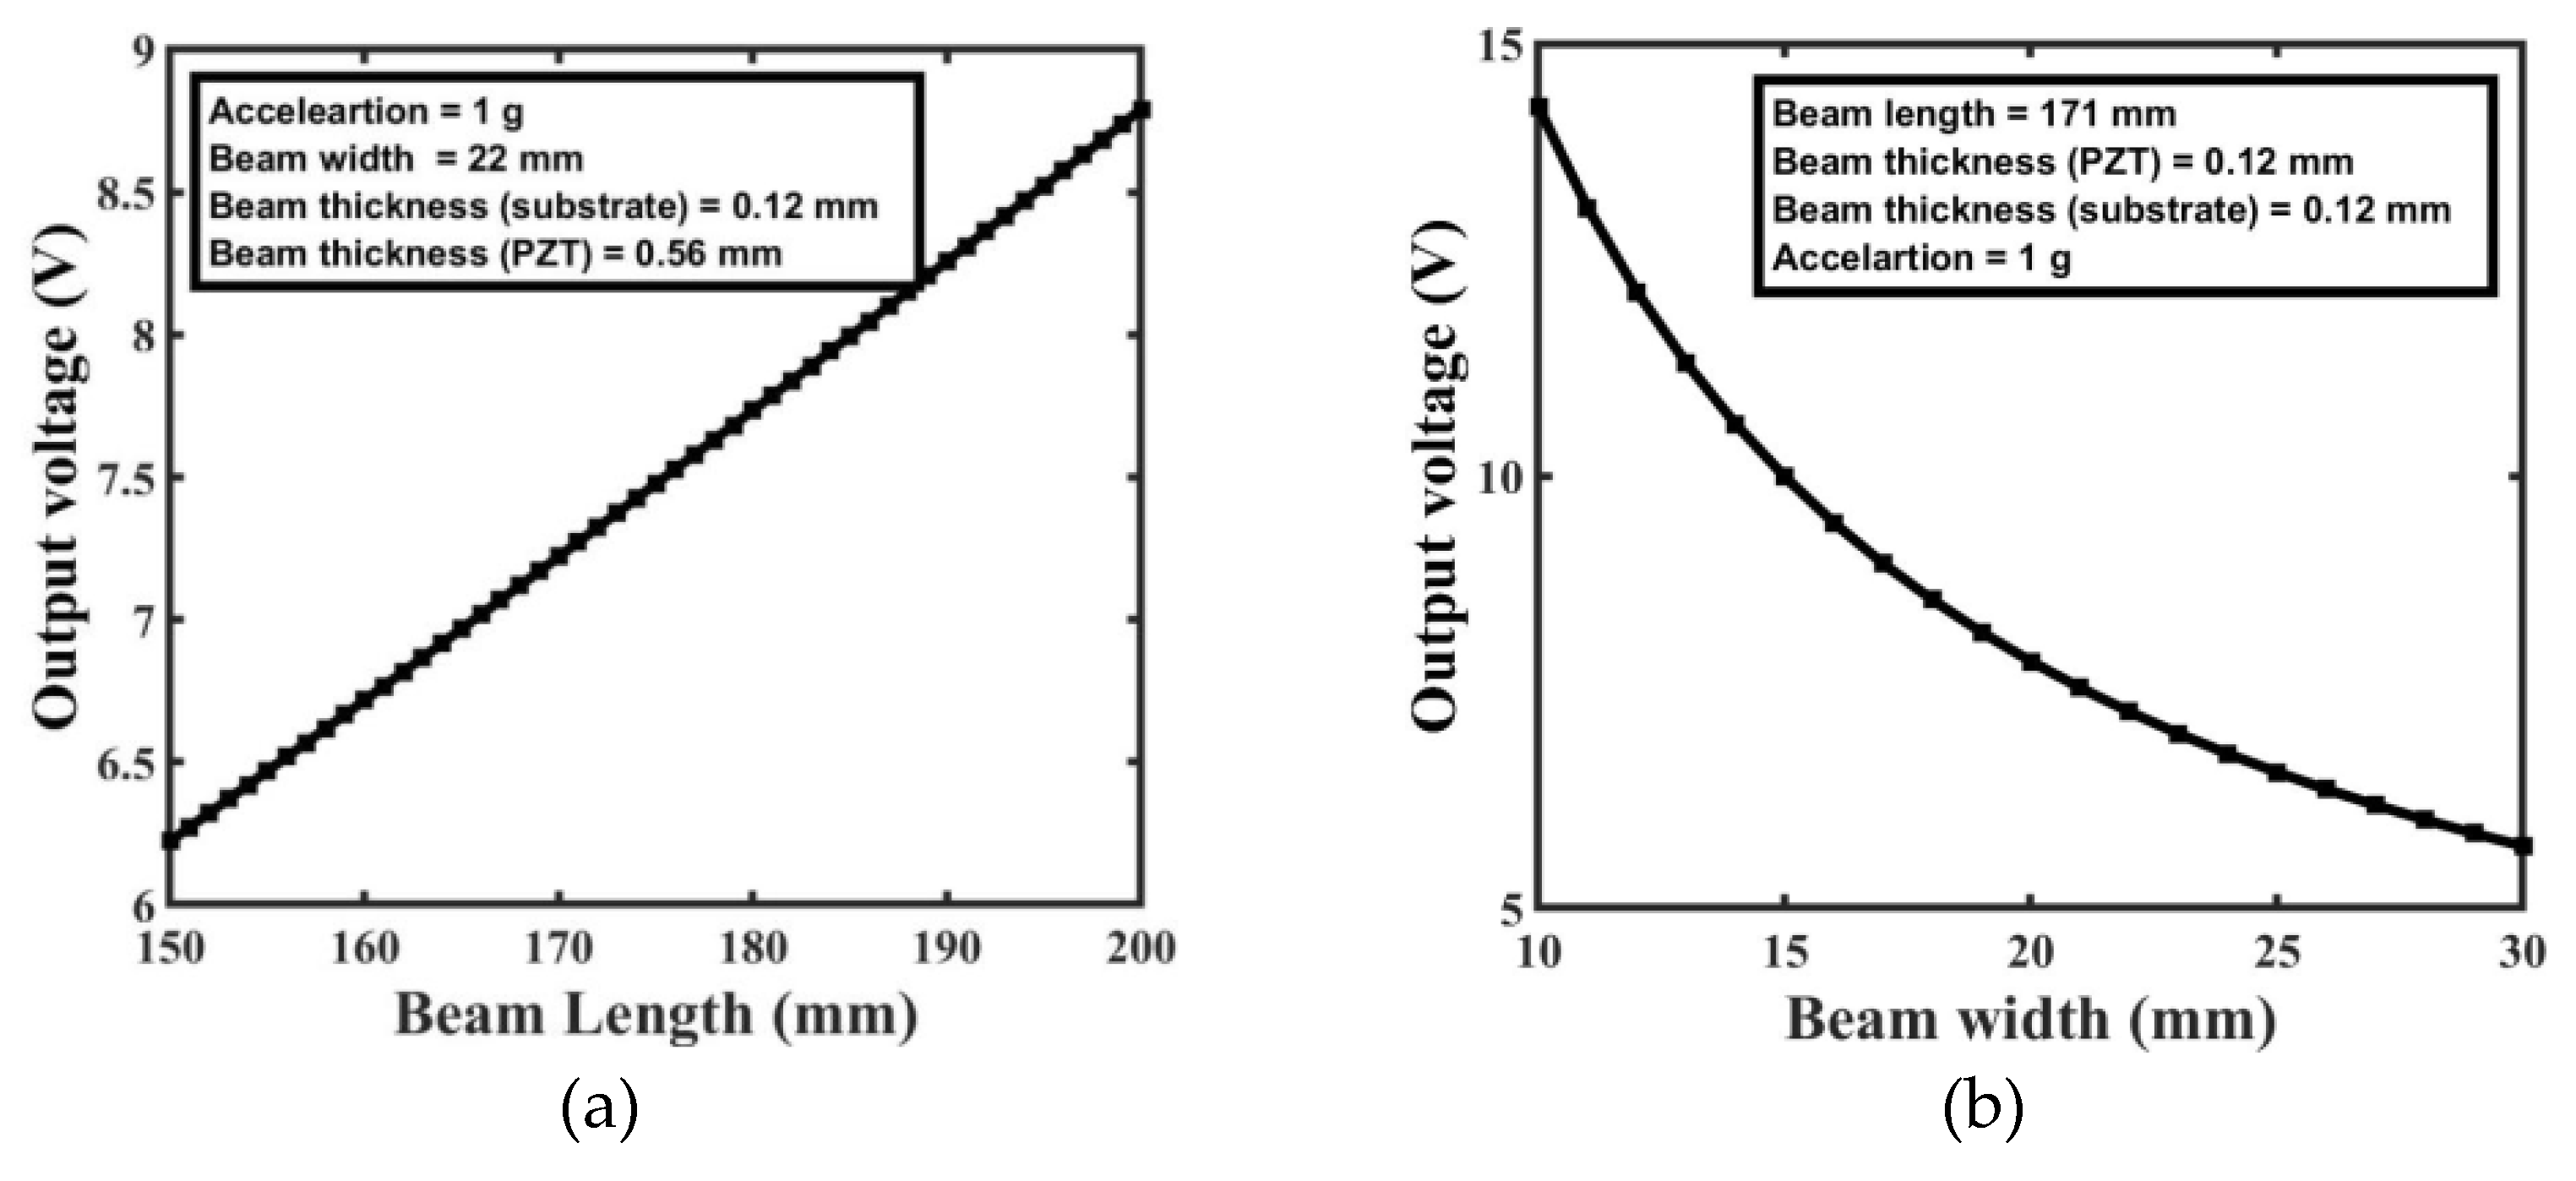
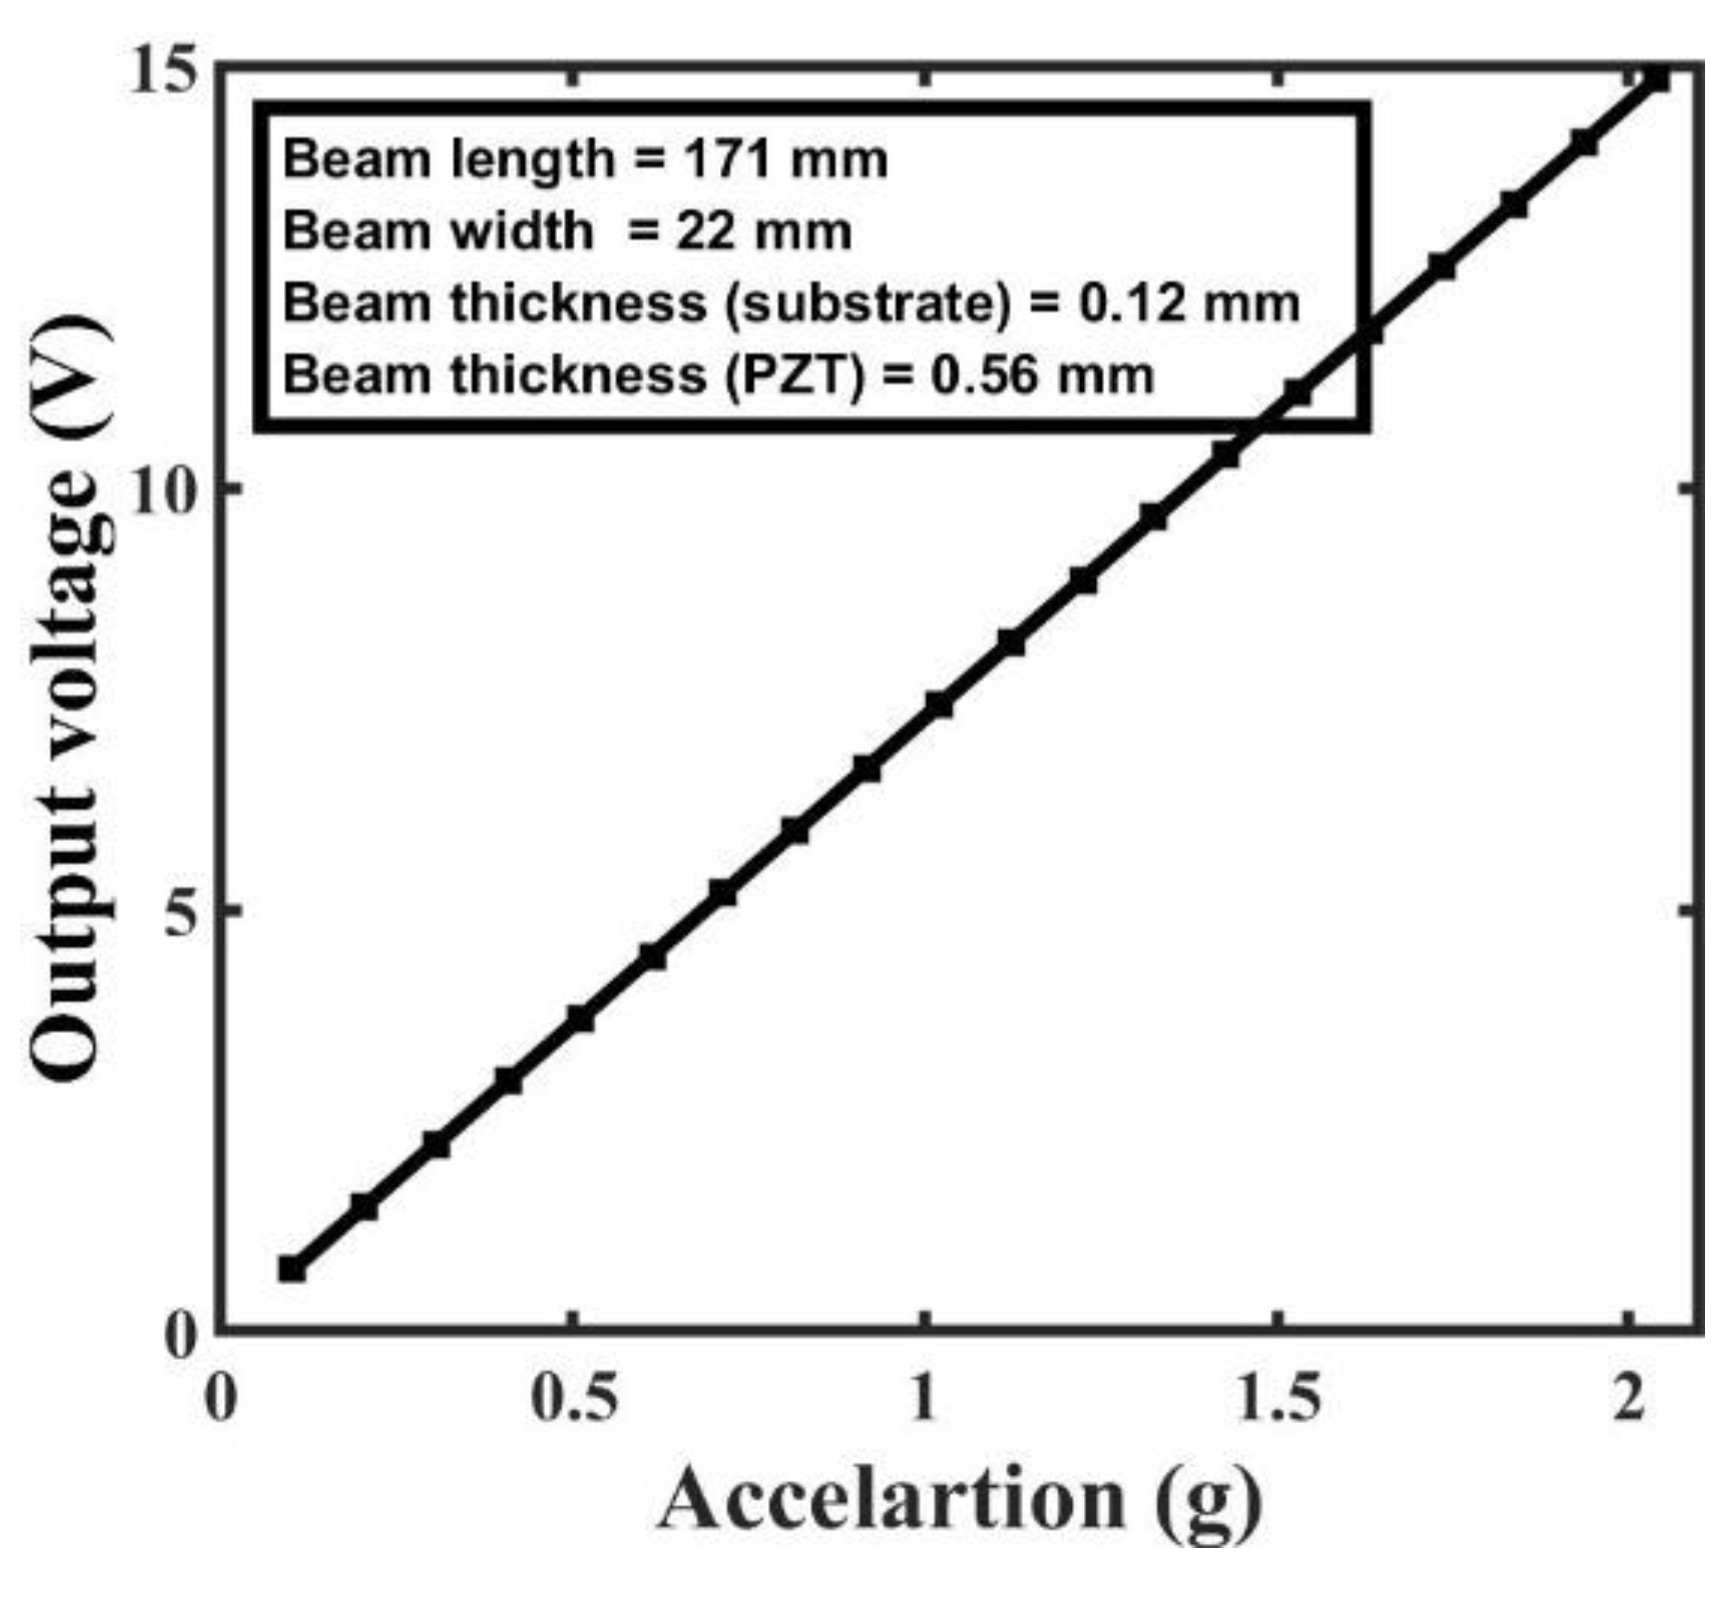
Figure 14 illustrates the relationship between the output voltage produced by the piezoelectric energy harvester and the variation in beam length. The harvester's output voltage varies from 6.3 V to 8.8 V as the beam's length is changed from 150 mm to 200 mm. The maximum output voltage of the harvester is 7.3 V when the beam length is 171 mm, the beam width is 22 mm, and the input acceleration is 1 g. There is an inverse relationship between output voltage and beam width as shown in
Figure 14(b).
Figure 15 depicts the relationship between the output voltage generated by the piezoelectric energy harvester and the variation in input base acceleration. Depending on the magnitude of the applied base acceleration, the harvester's output voltage might vary widely. When the input acceleration is increased from 1 g to 2 g, the harvester's output voltage varies dramatically, going from 0.5 V to 15 V.
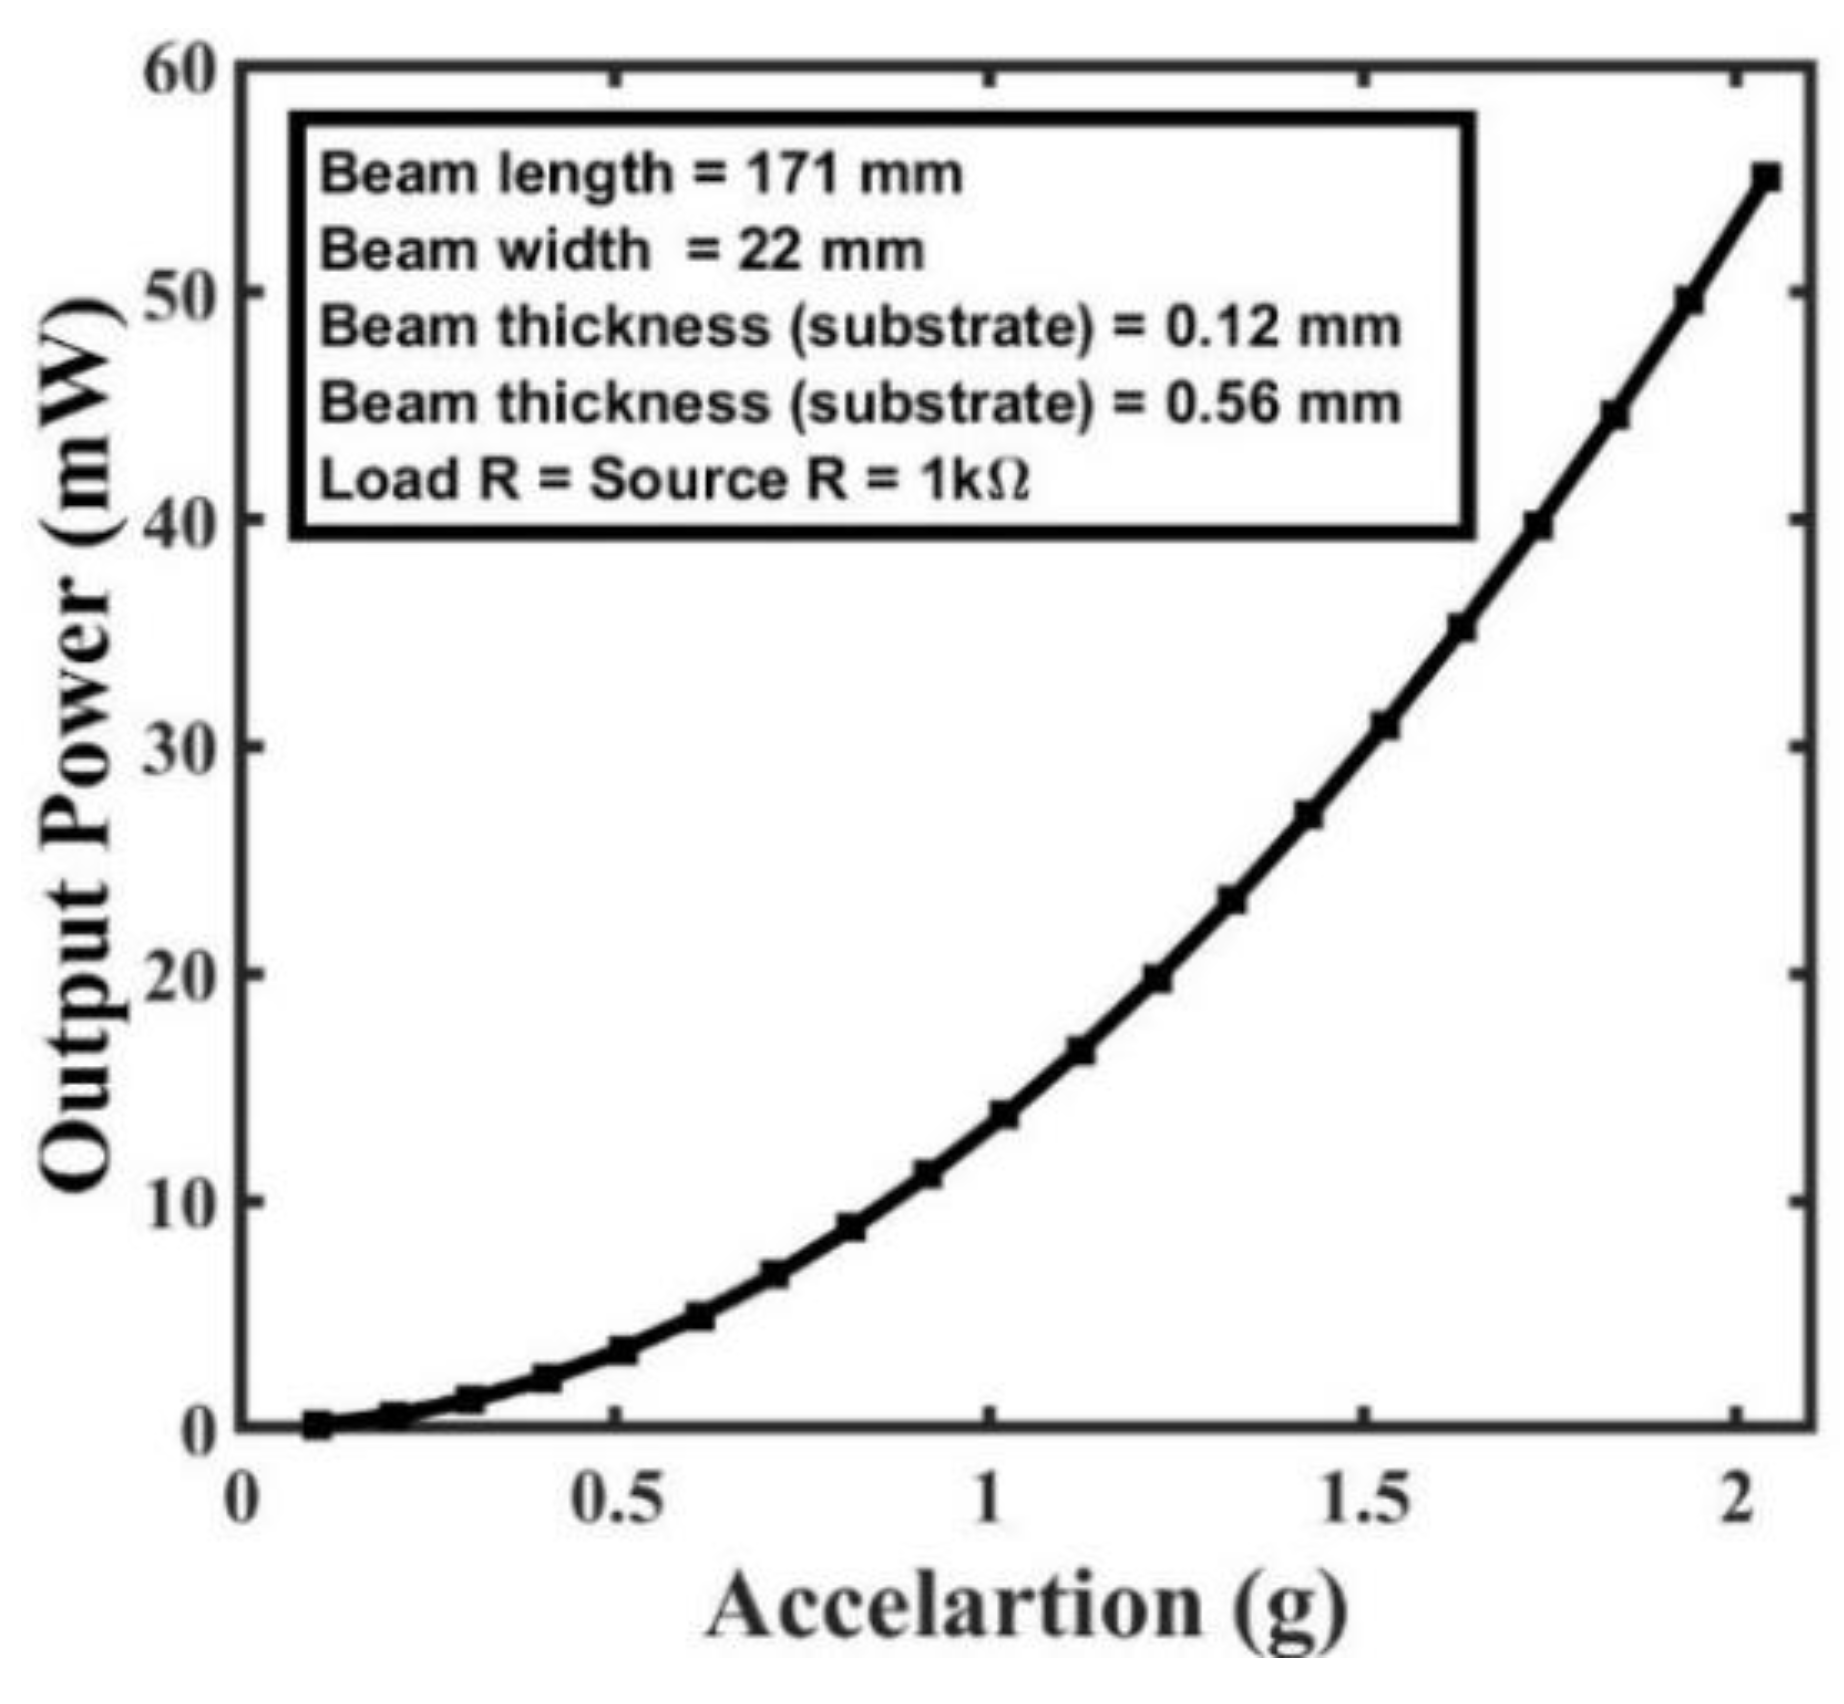
Power output by the piezoelectric beam-type energy harvester as a function of input resistance is shown in
Figure 16. The input base acceleration has a considerable effect on the output power. As the input base acceleration is doubled from 1 g to 2 g, the harvester's output power ranges from 100 µW to 55 mW, demonstrating a significant boost in its ability to generate electricity. The highest output power of the harvester is 13 mW, and it is achieved under specified conditions with a beam length of 171 mm, width of 22 mm, thickness of 68 mm, and under an input acceleration of 1 g.
5. Comparison and Discussion
The performance of the train-induced vibration energy harvester prototypes that have been produced is compared with the performance of train-induced vibration type harvesters that had been developed in the past.
Table 5 shows all the train-induced vibration energy harvester types that have been recorded. These comparisons are carried out concerning the place where the installation was carried out, the internal resistance, the frequency, the output-input base acceleration, the output voltage, and the output power. When compared to piezoelectric harvesters, the Electromagnetically developed harvesters have a comparatively lower Internal Impedance. Piezoelectric energy harvesters, on the other hand, have a high impedance.
The voltage production of the developed prototypes is quite better than the developed energy harvester that has ever been reported. However, when evaluated based on power output, the prototypes generated in this work are capable of generating higher output power than all of the reported energy harvesters combined. It is evident from this comparison that the energy harvester that was produced in this work is capable of producing higher voltage and output power than the majority of the reported harvesters that have been developed in the past.
Table 1.
Comparison of the developed train-induced vibration energy harvester.
Table 1.
Comparison of the developed train-induced vibration energy harvester.
| Type |
Installation position |
Frequency (Hz) |
Input acceleration
(g) |
|
Voltage
(V) |
Power
(mW) |
Ref. |
| Electromagnetic |
Line side |
6 |
- |
44.6 |
2.23 |
119 |
[7] |
| Onboard |
8 |
- |
- |
2.5 |
100 |
[13] |
| Line side |
7-500 |
2 |
- |
- |
45.5 |
[14] |
| Line side |
27 |
- |
- |
1.7 |
10 |
[15] |
| Onboard |
28 |
0.8 |
- |
- |
6.5 |
[3] |
| Onboard |
- |
- |
300 |
7.07 |
28.4 |
[16] |
| Line side |
4 |
- |
50 |
- |
196 |
[17] |
| Onboard |
- |
- |
- |
- |
263 |
[18] |
| Piezoelectric |
Line side |
- |
0.2 |
44 |
1.8 |
- |
[19] |
| Line side |
50 |
0.21 |
15000 |
- |
1.843 |
[20] |
| Onboard |
26 |
- |
11000 |
- |
3 |
[21] |
| Line side |
- |
- |
55024 |
- |
1.03 |
[22] |
| Onboard |
- |
1 |
- |
|
0.3 |
[23] |
| Line side |
16.6 |
- |
- |
0.144 |
- |
[6] |
| Line side |
1.8 |
|
- |
|
1.09 |
[10] |
| Line side |
3-6 |
- |
40000 |
- |
40 |
[24] |
| This prototype |
Line side |
4.56 |
2 |
100 |
14.8 |
550 |
This work |
6. Conclusion
This study aimed to evaluate the cantilever beam-type energy harvester that operates on train-induced vibrations and the developed prototypes may be used to supply power for Wireless Sensor Networks (WSN) employed in the condition monitoring of railway networks. The study covered a detailed discussion of the architecture, working mechanism, modeling, and simulation of the proposed energy harvester. An analytical model was built to estimate a number of factors, some of which include maximal stress, stiffness, natural frequency, output voltage, and output power. Different factors were examined employing MATLAB simulations based on the analytical model, yielding important insights into the harvester's performance under changing situations. COMSOL Multiphysics modeling and simulation of the proposed energy harvester device was carried out to validate the analytical modeling and acquire more accurate findings. The device's natural frequency, maximum deflection, and stress were calculated using eigenfrequency and stationary analysis. Simulated data showed that the designed energy harvester prototype could generate up to 14 V of AC output voltage and 550 mW of output power at a base excitation of 2 g and a resonant frequency of 4.38 Hz. These findings show that the suggested energy harvester has great potential as a means of transforming mechanical energy from trains into electrical power. The analytical and simulation models that were developed and validated show that the suggested energy harvester is practical and reliable for use in monitoring railway tracks in the real world.
Author Contributions
Conceptualization, S. K. and T. A.; methodology, S. K. and T. A.; software, S. K.; T. A.; and J.U. validation, S. K. and T. A.; formal analysis, S. K. and T. A.; investigation, S. K. and T. A.; data curation, S. K. and T. A.; writing—original draft preparation, S. K. and T. A.; writing—review and editing, T. A. and J.U.; visualization, S. K. and T. A.; supervision, J.U.; project administration, J.U.; funding acquisition, J.U. All authors have read and agreed to the published version of the manuscript.
Funding
This research is funded by Woosong University Academic Research 2024.
References
- S. J. Roundy, “Energy Scavenging for Wireless Sensor Nodes with a Focus on Vibration to Electricity Conversion,” 2000.
- F. U. Khan and S. Ahmad, “Flow type electromagnetic based energy harvester for pipeline health monitoring system,” Energy Convers. Manag., vol. 200, no. June, p. 112089, 2019. [CrossRef]
- “Perez, Matthias, et al. ‘A two degree-of-freedom electromagnetic vibration energy harvester for the railway infrastructure monitoring.’ Smart materials, adaptive structures and intelligent systems (2018).”.
- “Ghasemi-Nejhad, M. N., Pourghodrat, A., Nelson, C. A., Phillips, K. J., & Fateh, M. (2011). Improving an energy harvesting device for railroad safety applications. In Active and Passive Smart Structures and Integrated Systems 2011. International Society f.”.
- P. Wang, Y. F. Wang, M. Y. Gao, and Y. Wang, “Energy harvesting of track-borne transducers by train-induced wind,” J. Vibroengineering, vol. 19, no. 3, pp. 1624–1640, 2017. [CrossRef]
- “Cahill, Paul, et al. ‘Data of piezoelectric vibration energy harvesting of a bridge undergoing vibration testing and train passage.’ Data in brief 17 (2018): 261-266.”. [CrossRef]
- “Gao, M. Y., et al. ‘A rail-borne piezoelectric transducer for energy harvesting of railway vibration.’ Journal of vibroengineering 18.7 (2016): 4647-4663.”. [CrossRef]
- J. Li, S. Jang, and J. Tang, “Design of a Bimorph Piezoelectric Energy Harvester for Railway Monitoring,” J. Korean Soc. Nondestruct. Test., vol. 32, no. 6, pp. 661–668, 2012. [CrossRef]
- “Wang, Jianjun, et al. ‘Modeling on energy harvesting from a railway system using piezoelectric transducers.’ Smart Materials and Structures 24.10 (2015): 105017.”. [CrossRef]
- “Hou, Wenqi, et al. ‘Piezoelectric vibration energy harvesting for rail transit bridge with steel-spring floating slab track system.’ Journal of Cleaner Production 291 (2021): 125283.”. [CrossRef]
- “De Pasquale, G., Soma`, A., and Fraccarollo, F. (2012a). Piezoelectric energy harvesting for autonomous sensors network on safety-improved railway vehicles. Proc. Inst. Mech. Eng. C: J. Mech. Eng. Sci. 226, 1107–1117”.
- “Song, D., Jang, H., Kim, S.B., and Sung, T.H. (2013). Piezoelectric energy harvesting system for the vertical vibration of superconducting Maglev train. J. Electroceram. 31, 35–41”. [CrossRef]
- “De Pasquale, Giorgio, Aurelio Somà, and Federico Fraccarollo. ‘Piezoelectric energy harvesting for autonomous sensors network on safety-improved railway vehicles.’ Proceedings of the Institution of Mechanical Engineers, Part C: Journal of Mechanical Engin.”.
- “Gao, Mingyuan, et al. ‘Condition monitoring of urban rail transit by local energy harvesting.’ International Journal of Distributed Sensor Networks 14.11 (2018): 1550147718814469.”. [CrossRef]
- “Hosseinkhani, A., et al. ‘Sound and vibration energy harvesting for railway applications: A review on linear and nonlinear techniques.’ Energy Reports 7 (2021): 852-874.”. [CrossRef]
- “Lin, Teng, John J. Wang, and Lei Zuo. ‘Efficient electromagnetic energy harvester for railroad transportation.’ Mechatronics 53 (2018): 277-286.”. [CrossRef]
- “Pan, Yu, et al. ‘Modeling and field-test of a compact electromagnetic energy harvester for railroad transportation.’ Applied Energy 247 (2019): 309-321.”. [CrossRef]
- “Wang, Yifeng, et al. ‘An electromagnetic vibration energy harvester using a magnet-array-based vibration-to-rotation conversion mechanism.’ Energy Conversion and Management 253 (2022): 115146.”. [CrossRef]
- “Song, Yooseob. ‘Finite-element implementation of piezoelectric energy harvesting system from vibrations of railway bridge.’ Journal of Energy Engineering 145.2 (2019): 04018076.”. [CrossRef]
- “Hou, Wenqi, et al. ‘Railway vehicle induced vibration energy harvesting and saving of rail transit segmental prefabricated and assembling bridges.’ Journal of Cleaner Production 182 (2018): 946-959.”. [CrossRef]
- “Mouapi, Alex. ‘Design, modeling and simulation of piezoelectric microgenerator for application in underground vehicles.’ 2019 IEEE International Conference on Environment and Electrical Engineering and 2019 IEEE Industrial and Commercial Power Systems Eur.”.
- “Li, Shoutai, et al. ‘Investigation on a broadband magnetic levitation energy harvester for railway scenarios.’ Journal of intelligent material systems and structures 33.5 (2022): 653-668.”. [CrossRef]
- “Wischke, M., et al. ‘Vibration harvesting in traffic tunnels to power wireless sensor nodes.’ Smart Materials and Structures 20.8 (2011): 085014.”. [CrossRef]
- “Costanzo, Luigi, et al. ‘Stochastic Thermodynamics of an Electromagnetic Energy Harvester.’ Entropy 24.9 (2022): 1222.”. [CrossRef]
Figure 1.
IoT based Self powered Railway track monitoring system.
Figure 1.
IoT based Self powered Railway track monitoring system.
Figure 2.
Architecture of train-induced vibration PEH.
Figure 2.
Architecture of train-induced vibration PEH.
Figure 3.
Steps in COMSOL Multiphysics modeling and simulation.
Figure 3.
Steps in COMSOL Multiphysics modeling and simulation.
Figure 4.
3D model geometry of the flow-based piezoelectric energy harvester.
Figure 4.
3D model geometry of the flow-based piezoelectric energy harvester.
Figure 6.
Maximum deflection observed in the device.
Figure 6.
Maximum deflection observed in the device.
Figure 7.
Maximum stress produced in the device.
Figure 7.
Maximum stress produced in the device.
Figure 8.
Beam stiffness with (a) Length of the beam, (b) width of the beam, (c) Substrate layer thickness, (d) PZT layer thickness.
Figure 8.
Beam stiffness with (a) Length of the beam, (b) width of the beam, (c) Substrate layer thickness, (d) PZT layer thickness.
Figure 9.
Beam natural frequency Vs: (a) Length of the beam, (b) Width of the beam, (c) Substrate layer thickness, (d) PZT layer thickness.
Figure 9.
Beam natural frequency Vs: (a) Length of the beam, (b) Width of the beam, (c) Substrate layer thickness, (d) PZT layer thickness.
Figure 10.
Natural frequency vs. tip mass.
Figure 10.
Natural frequency vs. tip mass.
Figure 11.
Maximum stress Vs (a) Beam Length (b) Beam width.
Figure 11.
Maximum stress Vs (a) Beam Length (b) Beam width.
Figure 12.
Maximum stress Vs. tip mass.
Figure 12.
Maximum stress Vs. tip mass.
Figure 13.
Maximum stress Vs. acceleration.
Figure 13.
Maximum stress Vs. acceleration.
Figure 14.
Output voltage Vs. (a) Beam length, (b) Beam width.
Figure 14.
Output voltage Vs. (a) Beam length, (b) Beam width.
Figure 15.
Output voltage Vs. Acceleration.
Figure 15.
Output voltage Vs. Acceleration.
Figure 16.
Output Power Vs. load resistance.
Figure 16.
Output Power Vs. load resistance.
Table 2.
Different ambient energy sources [
2].
Table 2.
Different ambient energy sources [
2].
| Energy sources |
Power density μW/cm2
|
| RF energy |
0.0002-1 |
| Vibration Energy |
200 |
| Airflow |
177 |
| Solar (outdoor) |
7500 |
| Thermal energy |
60 |
| Temperature variation |
10 |
| Acoustic energy |
191 |
Table 3.
Material and variable description.
Table 3.
Material and variable description.
| Description |
Variable |
Values |
Unit |
| Elastic layer Length |
Le |
171 |
mm |
| PZT layer Length |
Lp |
171 |
mm |
| Elastic layer Width |
We |
22 |
mm |
| PZT layer Width |
Wp |
22 |
mm |
| Thickness of the PZT layer |
hp |
0.052 |
mm |
| Thickness of the elastic layer |
He |
0.012 |
mm |
| The volume of proof mass |
V |
15x15x10 |
Mm3 |
| Density of proof mass |
ρm |
8,587 |
Kg/m3 |
| Elastic layer elasticity |
Ye |
97 |
Gpa |
| PZT layer elasticity |
Yp |
66 |
Gpa |
| Elastic layer density |
Ρe |
8785 |
Kg/m3 |
| PZT layer density |
ρp |
7800 |
Kg/m3 |
| Piezoelectric Charge |
d31 |
1.75x10⁻⁹ |
C/N |
Table 4.
Eigen frequencies and modes shapes of device.
Table 4.
Eigen frequencies and modes shapes of device.
|
Disclaimer/Publisher’s Note: The statements, opinions and data contained in all publications are solely those of the individual author(s) and contributor(s) and not of MDPI and/or the editor(s). MDPI and/or the editor(s) disclaim responsibility for any injury to people or property resulting from any ideas, methods, instructions or products referred to in the content. |
© 2024 by the authors. Licensee MDPI, Basel, Switzerland. This article is an open access article distributed under the terms and conditions of the Creative Commons Attribution (CC BY) license (http://creativecommons.org/licenses/by/4.0/).
