Preprint
Article

Efficient Refinement of Complex Structures of Flexible Histone Peptides Using Post-Docking Molecular Dynamics Protocols

Altmetrics

Downloads

119

Views

43

Comments

0

A peer-reviewed article of this preprint also exists.

Submitted:

25 April 2024

Posted:

26 April 2024

You are already at the latest version

Alerts
Abstract
Histones are keys to many epigenetic events and their complexes have therapeutic and diagnostic importance. The determination of the structures of histone complexes is fundamental in the design of new drugs. Computational molecular docking is widely used for the prediction of target-ligand complexes. Large, linear peptides like the tail regions of histones are challenging ligands for docking due to their large conformational flexibility, extensive hydration, and weak interactions with the shallow binding pockets of their reader proteins. Thus, fast docking methods often fail to produce complex structures of such peptide ligands at a level appropriate for drug design. To answer this challenge, and improve the structural quality of the docked complexes, post-docking refinement has been applied using various molecular dynamics (MD) approaches. However, a final consensus has not been reached on the desired MD refinement protocol. In the present study, MD refinement strategies were systematically explored on a set of problematic complexes of histone peptide ligands with relatively large errors in their docked geometries. Six protocols were compared that differ in their MD simulation parameters. In all cases, pre-MD hydration of the complex interface regions was applied to avoid the unwanted presence of empty cavities. The best-performing protocol achieved a median of 32 % improvement over the docked structures in terms of the change of root mean squared deviations from the experimental references. The influence of structural factors and explicit hydration on the performance of post-docking MD refinements was also discussed to help their implementation in future methods and applications.
Keywords: 
Subject: Computer Science and Mathematics  -   Mathematical and Computational Biology

1. Introduction

Fast molecular docking methods are widely used tools of drug design and molecular engineering [1]. The docking procedure aims to search the target-ligand conformational space at a reasonable computational cost to predict the most probable binding mode (position, orientation, and conformation) of ligands in the binding pocket of a target [2,3]. While docking is undoubtedly a leading technique, it still faces persistent challenges [4,5,6,7,8,9] especially when it comes to large, flexible peptide ligands. However, peptides mediate up to 40% of naturally occurring protein-protein interactions and play a central role in various cellular processes, including signal transduction, transcriptional regulation, immune response, and oncology [10,11,12,13,14]. Structural models of peptide–protein complexes have been used to design inhibitory peptides and peptidomimetics that modulate protein–protein interactions involved in various disease pathways [14,15,16,17,18,19,20]. In addition to their high specificity and relatively low toxicity [21,22,23,24], peptides were able to successfully target protein complexes such as transcription factors, which were considered undruggable by small molecules due to their huge structures and stable state [25,26]. Thus, the solution to the peptide docking problem would remarkably foster many drug development projects.
The problem of peptide docking originates from three main roots. Firstly, peptide-mediated interactions are often transient and their strength is typically weaker than that of protein-protein interactions since peptides bind to large, mostly shallow binding pockets having high structural flexibility before complexation [11,27]. Secondly, peptides have relatively large sizes and high conformational flexibility that require global search. Thirdly, peptides have many hydrophilic regions, and therefore, they are extensively hydrated which further complicates the docking process [28,29,30,31]. Notably, the elucidation of the role of hydration and water networks is a general problem in drug design that is not restricted to peptide ligands [32,33,34,35,36,37,38,39,40]. However, incorporating explicit water molecules in molecular docking is rather challenging [41,42,43,44]. Large complexes such as adenosine A2A [45] and histone proteins [46] were shown to be challenging due to their extensive water-mediated H-bond network with their ligands, however, only a few refinement methods are designed to incorporate experimental [47] or predicted [41] water molecules in their protocol to assist formation of accurate mediated interactions during simulations.
Unfortunately, the above-mentioned problems of peptide docking seem to persist even in the cases of the latest methodologies based on artificial intelligence. The recent release of DeepMind’s AlphaFold2 (AF2) [48,49] and AlphaFold-Multimer (AFM2) [50,51] has brought the accuracy of the computational modeling of proteins to another level. Several studies have shown that both AFM2 and the input-manipulated versions of AF2 are able to predict protein-peptide complexes with high accuracy [51,52,53,54]. However, they have several major limitations including their (i) protein-only predictions, excluding cofactors, ions, or any post-translational modifications, (ii) inconsistency in the prediction quality of secondary structures and other local conformations due to their over- and under-representations during the training process [52,53], (iii) complete neglect of the effect critical water molecules at the binding interface, (iv) decreased prediction accuracy for protein side-chains [54] and (v) inadequate modeling of conformational flexibility [49,55] which is crucial for modeling ligand binding with induced fit. A recent study also showed that despite the excellent structural agreement of their predicted ligand bound conformation to the experimental one, deep learning-based docking methods often produce physically implausible structures [56] and can be outperformed by standard, physics-based docking methods.
Thus, physics-based refinement, like molecular dynamics (MD) simulations can help to fix the problems of structures generated by deep learning or other knowledge-based methods [57,58,59]. There have been several attempts to improve the quality of AF2 and AFM2 models using MD simulations [57,58] or applying their own recycling process when the models are used as custom template inputs [60]. The recycling route of AF2 passes the partially completed proto-model through the deep neural networks repeatedly (four times by default) [49]. Although recycling significantly improved the model quality in most cases, unrealistic atomic positions were observed [60] in the recycled models due to their unrelaxed nature. Therefore, they also suggested the combination of MD protocols and the AF2 recycling process to improve models for further applications, such as drug discovery.
Similar, post-docking refinement steps have been also introduced in many docking protocols (Table S1). A refinement step prior to ranking could introduce structural flexibility and improve the energetics of the interface for proper scoring [61,62]. Refinements can range from short energy minimizations [63,64] removing steric clashes to more sophisticated methods that allow binding site flexibility upon ligand binding using MD [41,47,65,66,67,68,69,70,71,72] or Monte-Carlo simulations [73,74]. Refinement protocols or standalone tools often include energy minimization and much longer MD simulations in nanoseconds accompanied by various optimized parameters of the simulation [41,47,68,70,71]. The docking scores are often used for ranking the refined structures accompanied by structural clustering simulation [41,47,63,64,68,70,71,73,74,75]. As MD-based protocols can effectively incorporate the effects of explicit water molecules and the flexibility of both protein target and ligand [75,76], several studies have reported the use of MD simulations for improvement of the docked poses of various ligands [41,69,70,77,78,79] including peptides [47,65,67,68,69,70,71,75,80].
While MD has proved useful in the above-mentioned structural refinements, an ultimate protocol has not been published that may be appropriate for any peptide ligands. The large variability of peptide ligands necessitates the systematic investigation of various MD parameters like simulation length, temperature, water model, restraints, clustering, etc. In this study, we focused on histone H3 peptides in complexes with their reader proteins that have crucial therapeutic, as well as diagnostic importance in various cancer and other diseases [81,82,83,84,85,86,87,88,89,90,91,92,93]. At the same time, histones are particularly challenging ligands for molecular docking as they often interact with shallow binding pockets on the reader proteins with weak interactions measured in micromolar binding constants [94]. Moreover, their large conformational flexibility [24,95,96,97,98,99] and extensive hydration in such shallow binding pockets further complicates the prediction of accurate binding modes [24,29,99,100].

2. Results

2.1. Systems and MD Protocols

In a previous study [94], a set of ten histone H3 peptides (Table 1) in complex with their reader proteins were used to measure the performance of eleven fast docking methods [63,64,66,73,75,94,101,102,103,104,105,106,107]. The comparison of the calculated (docked) ligand structures with the respective experimental (reference) ligand structures resulted in large root mean squared deviations (RMSD of all heavy atoms, Methods) of an average of 9 Å (Table S2) showing that the precision of fast docking methods is moderate for the reproduction of the histone complexes.
The investigated complexes are particularly challenging, as mostly the N-terminal head of ca. five amino acids of the histone H3 ligand has a well-defined binding geometry, while the C-terminal region shows a high structural variability (Figure 1a). This feature can be exemplified by the high mean RMSD of 11 Å of the histone H3 ligand in the experimental solution structures of System 2fui calculated in comparison with the representative structure of the PDB entry. Thus, the nuclear magnetic resonance (NMR) spectroscopic measurements of System 2fui show the flexibility (uncertainty) of ligand conformation, especially at its C-terminal region with a high mobility in the bulk. This uncertainty can be attributed to the relatively weak interactions between the C-terminal region of histone H3 (ligand, Figure 1b) and the BPTF PHD finger (target, Figure 1b) and the correspondingly moderate (micromolar) binding affinity value (Table 1). For the same System 2fui, a moderate mean RMSD of 1 Å can be calculated for the tightly bound N-terminal region of the histone H3 ligand (Figure 1a). Accordingly, eleven fast docking methods in the previous study [94] also showed (Table S2) a better performance of an average RMSD of 7 Å calculated for the first five N-terminal amino acids if compared with the RMSD (the above-mentioned 9 Å) calculated for entire the ligand including the C-terminus.
The above-mentioned results [94] and other studies (Introduction) concluded that complex structures of peptide ligands produced by fast docking methods have moderate structural precision, and therefore, they should be subjected to post-docking refinements. Moreover, the ranking performance of such methods (that is the score-based selection of the close to real docked ligand structure) is very low [94].
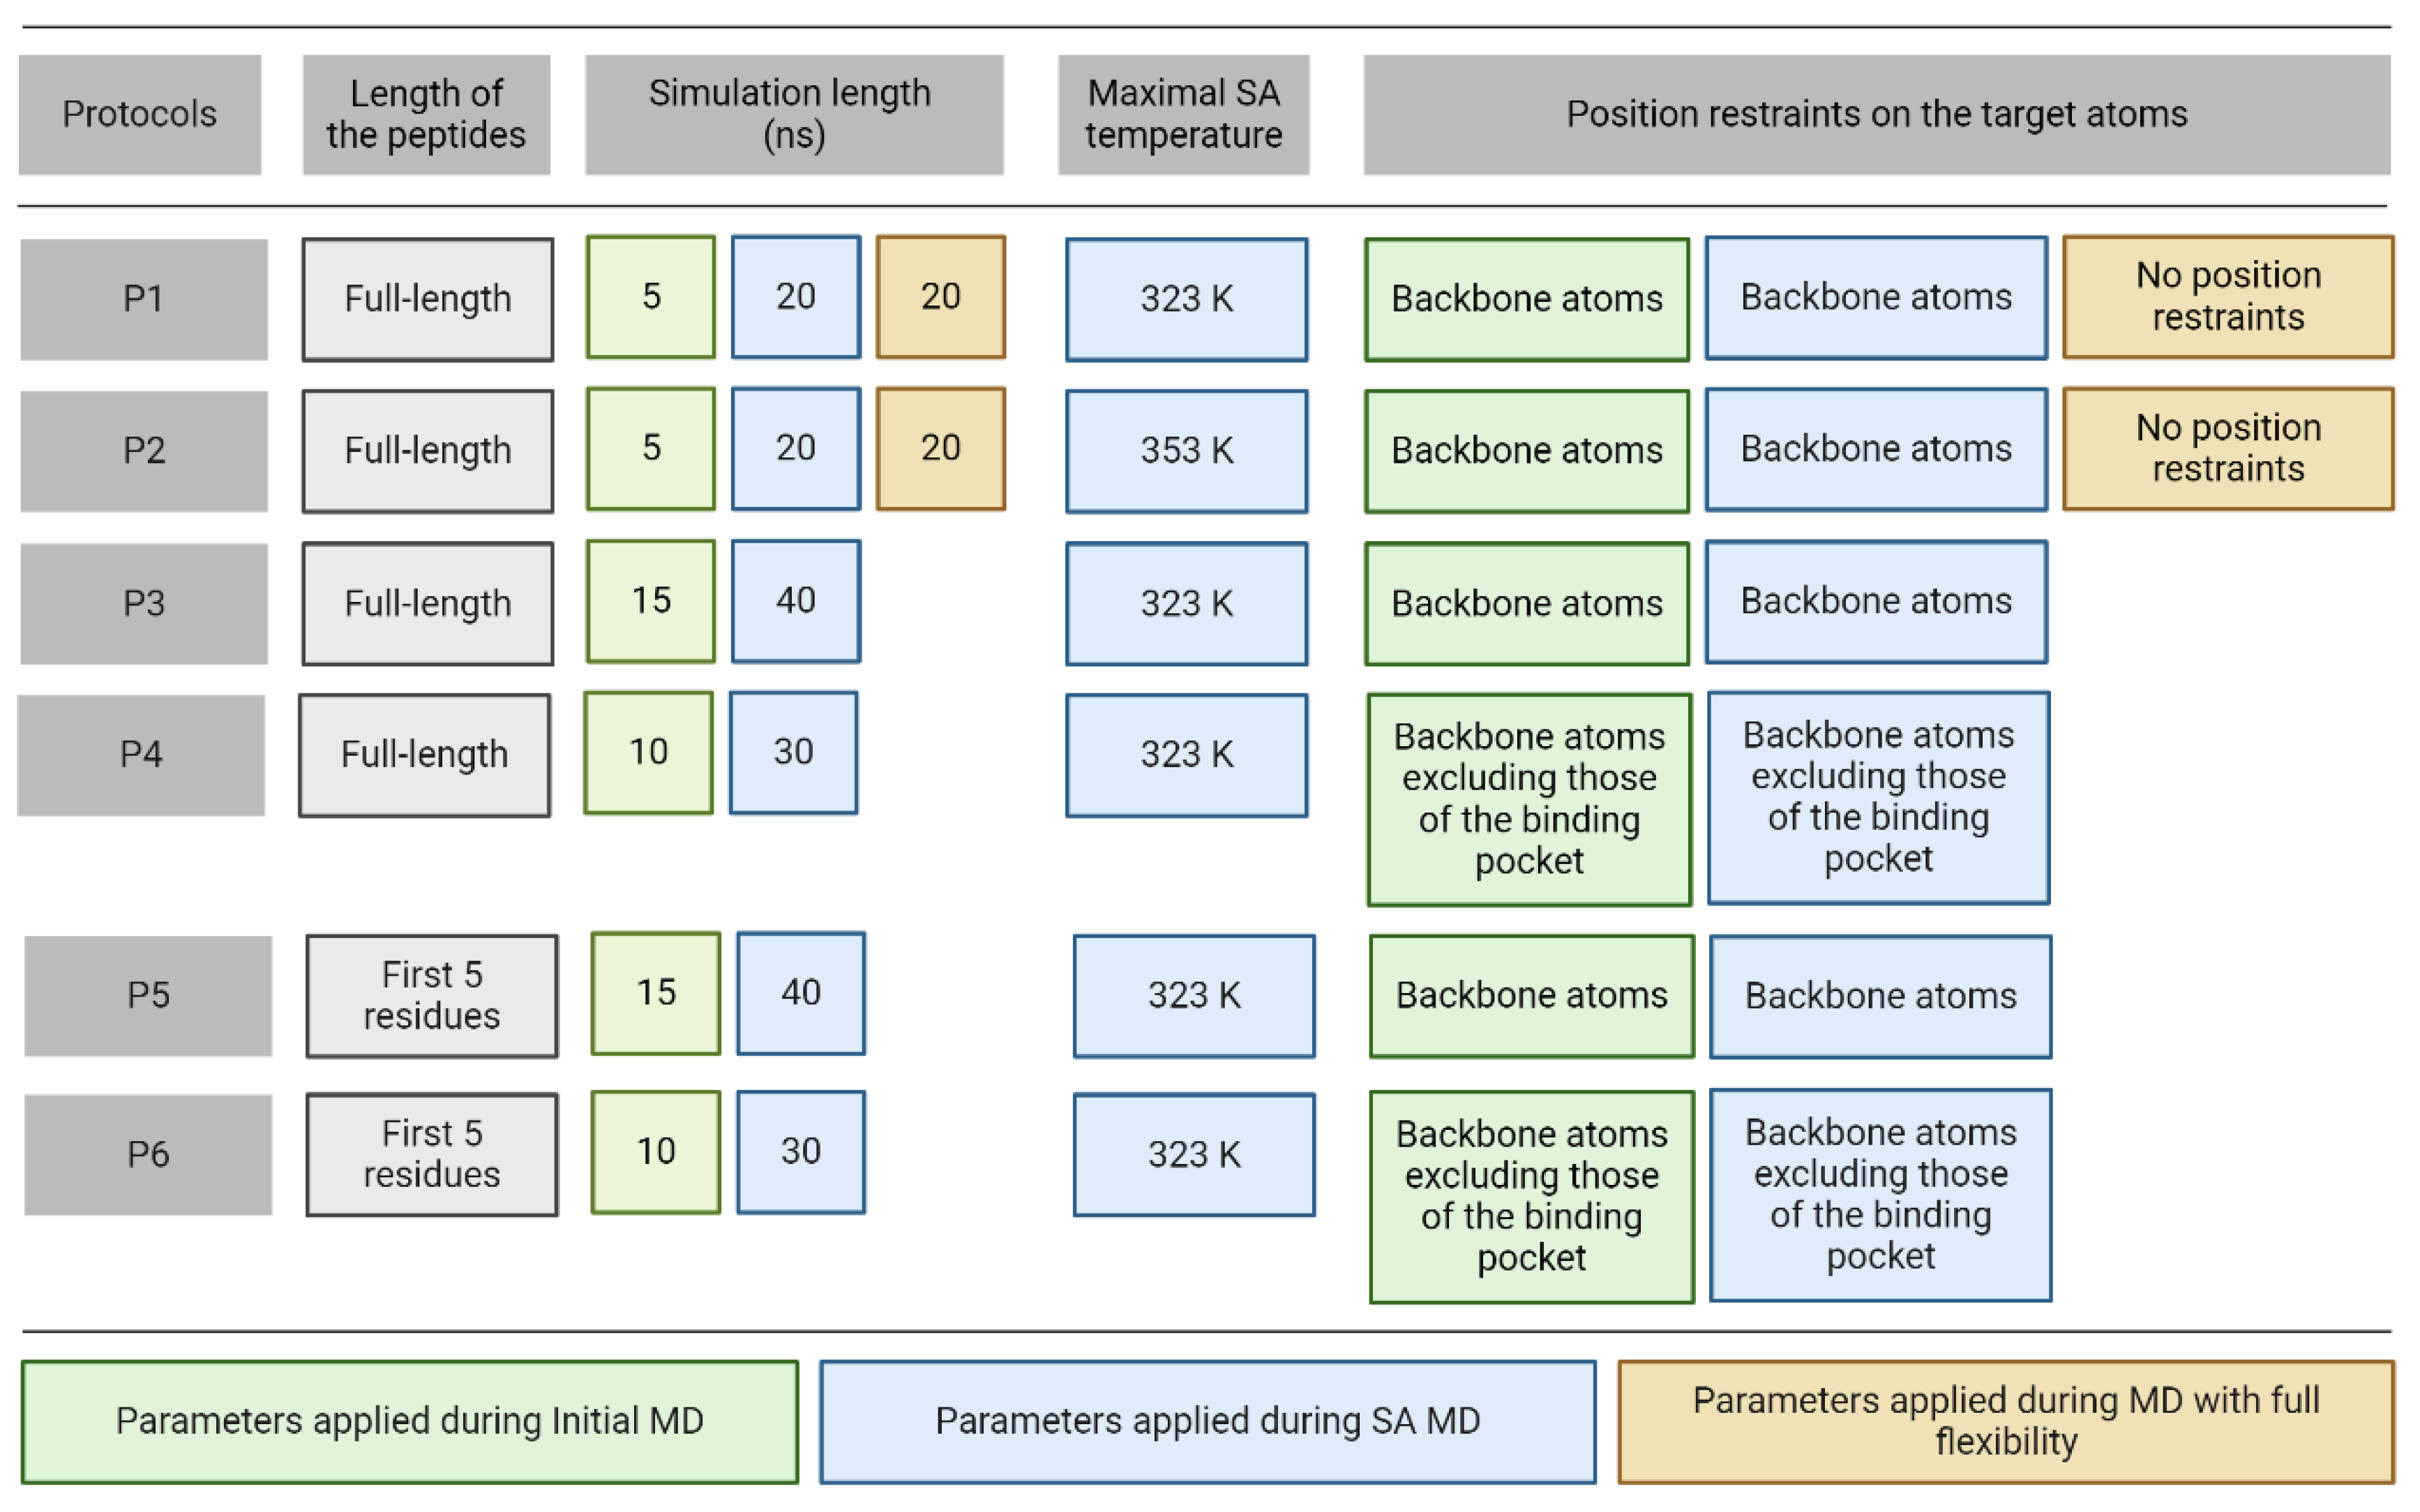
Thus, in the present study, complexes including the top-ranked docked ligand [94] conformations were used as starting structures for MD refinements. Due to poor ranking performance, these docked ligand conformations had a relatively large RMSD (RMSDstart, Table 1) in all complexes. Six different MD protocols were constructed from three consecutive steps (Figure 2) including initial, simulated annealing (SA), and full flexibility MD.
In all cases, the same preparatory steps (Methods) were performed prior to the MD runs including a pre-MD hydration (Methods) that filled up the target-ligand interfaces with explicit water molecules to eliminate unwanted empty spaces. The refinement protocols differ in four parameters including temperature, position restraints, simulation time, and length of the peptide ligand (Figure 2). In Protocol P1, there were three consecutive MD simulations with an SA stage and it improved the binding mode of a pentapeptide from an RMSD of 6.6 Å (from fast docking) to 1.7 Å (after MD steps) in a previous study [80]. P1 started with a short MD simulation to remove bad interactions and to improve the target-ligand interactions preparing the complex for further steps. It was followed by SA MD simulation during which high temperature accelerates the thermal motion of solutes and water molecules allowing the ligand to overcome energetic barriers to explore more conformational space and move towards a minimum energy conformation as the temperature lowers. Full target flexibility in P1 and P2 did not result in significant improvement after the first two simulation steps, and therefore, it was skipped in the next (P3-P6) protocols. Instead of full target flexibility, the release of the binding pocket residues in P4 and P6 reduces the complexity of the simulation and sampling of irrelevant conformational space, requiring less computational time. Moreover, position restraints on the binding site surrounding residues prevent any major structural changes that could lead to instability of the complex structure. The length of each simulation was altered to ensure that peptides could find their correct positions within as minimal computational time as possible (Figure 2). All six protocols have the first two consecutive MD simulations with the peptide freely moving while position restraints were applied on different atom groups of the target to ensure optimal target flexibility during the simulations (Figure 2). A close inspection of the refined complexes showed that in some cases, extensive intramolecular interactions between the N- and C-termini of the peptide resulted in ball-like conformations limiting the development of intermolecular interactions between the peptide and the target. Thus, the C-terminal peptide tails of no role in target binding (Figure 1) were removed in Protocols P5 and P6 to foster intermolecular interactions with the target and interface water molecules instead of the intramolecular ones.

2.2. Structural Performance

2.2.1. The Overall Performance of the MD Protocols

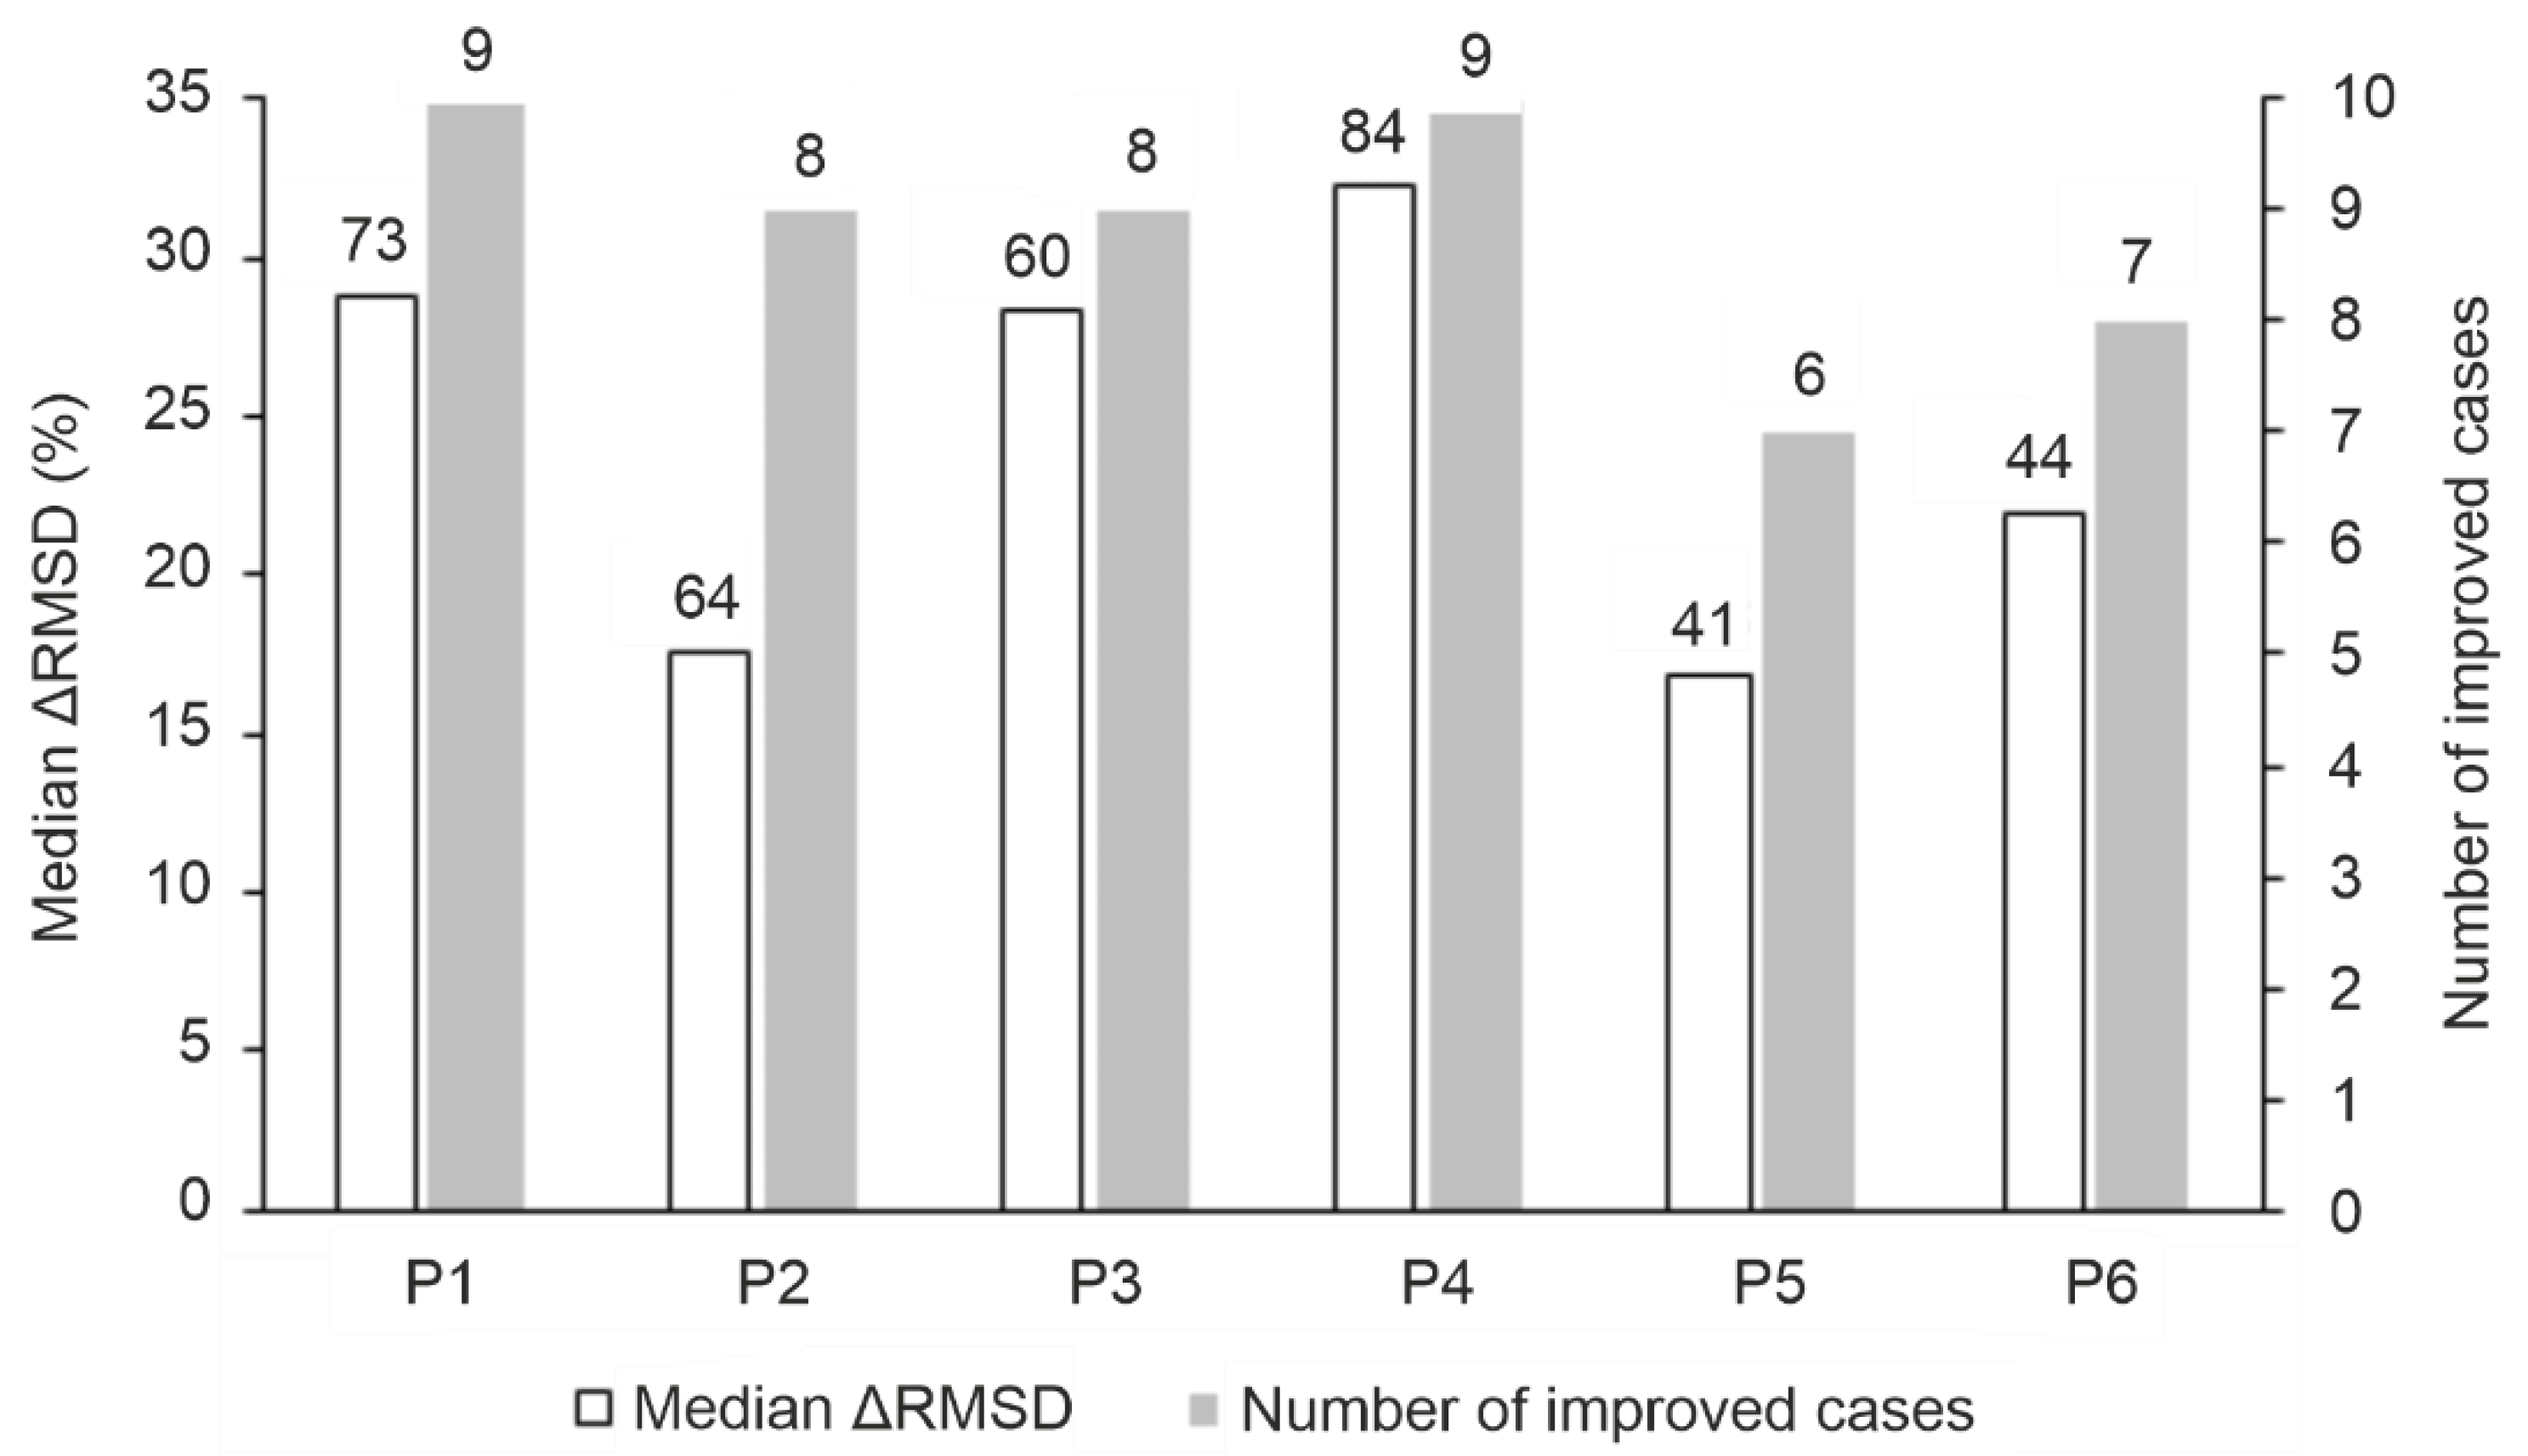
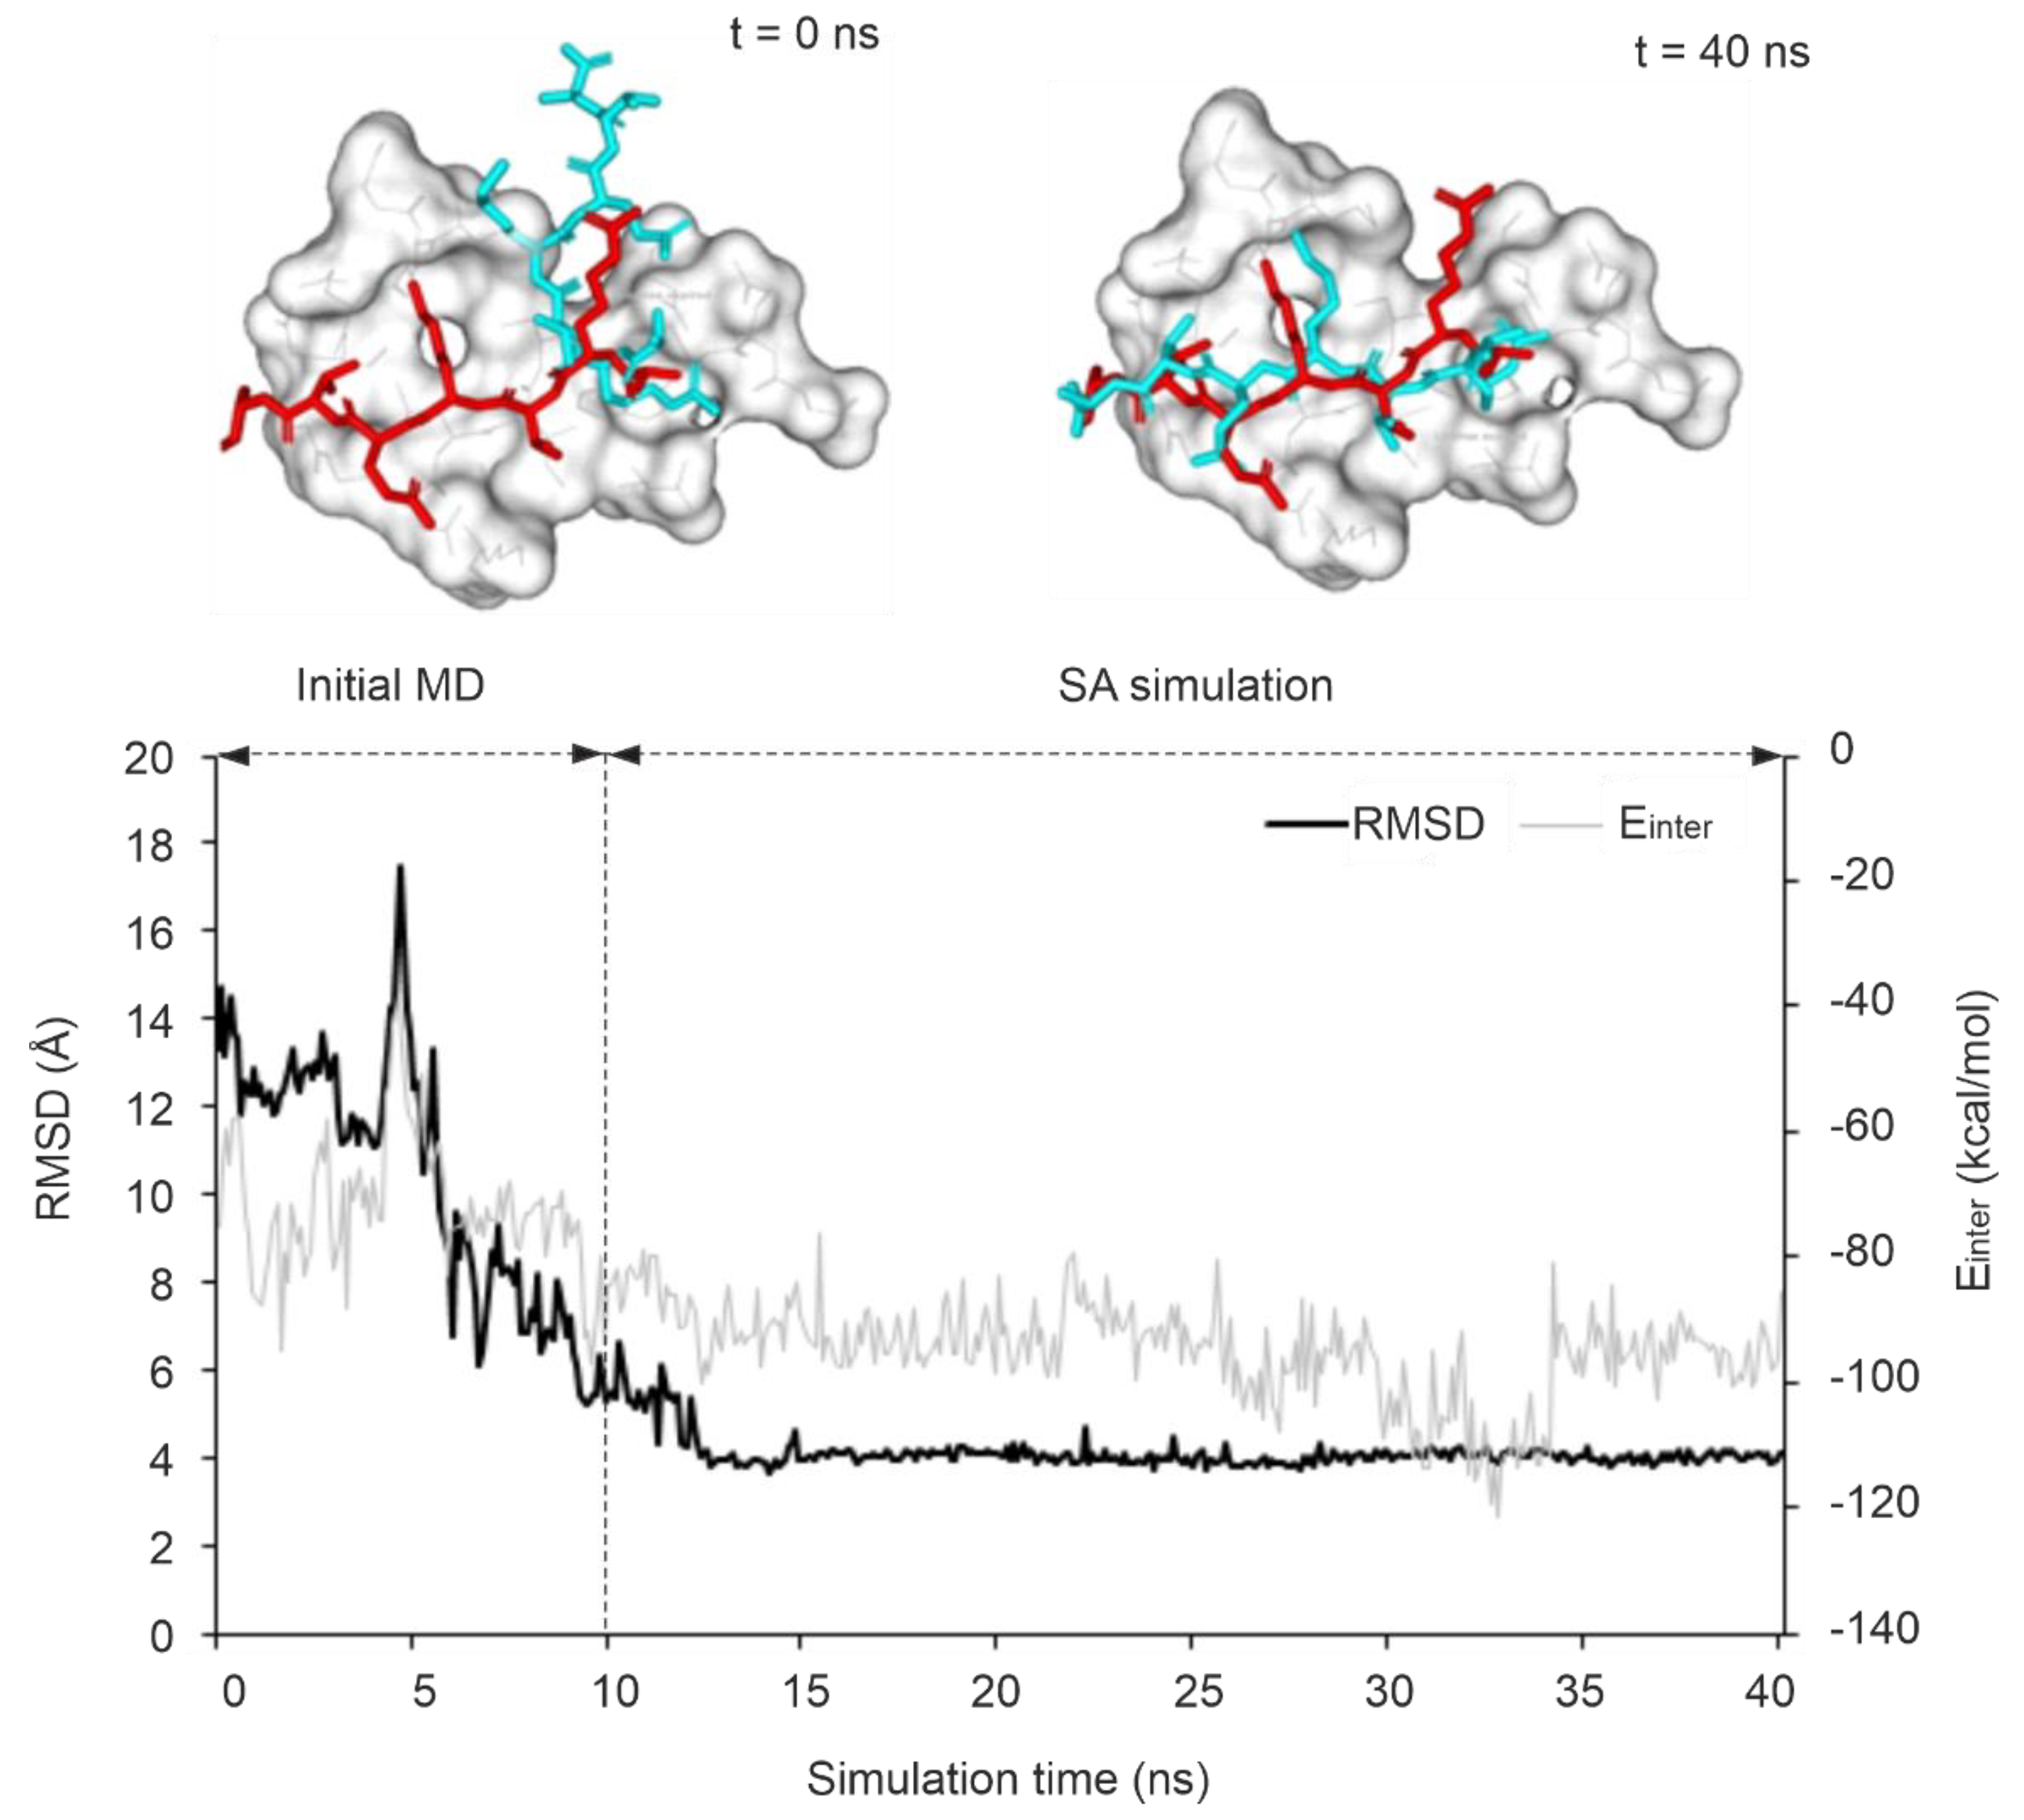
The performance of the MD-based refinement protocols (Figure 2) was evaluated by measuring how close they can bring the refined ligand binding mode to the reference (experimental) one, compared to the initial fast-docked binding mode (RMSDstart, Table S2). The improvement of starting structures (ΔRMSD) that is the decrease of RMSD upon MD-refinement is expressed in the percentage of RMSDstart (in Figure 3, Tables S3 and S6). The refinement protocols were able to improve the starting conformations in most cases, especially P1 and P4, displaying a large ΔRMSD of >1 Å in nearly all cases (Table S5, Figure 3). The overall statistics show that P4 outperformed all other protocols with a median ΔRMSD of 32 % corresponding to a large improvement of 7.5 Å. Furthermore, P4 produced the largest improvement of 22.8 Å (84 %) in the case of target TRIM24 PHD Bromo (System 3o33) starting from the largest RMSDstart of 27.2 Å of the test set (Table S2). The improvement (decrease) of RMSD was accompanied and resulted by the strengthening the target-ligand interaction energy (Einter) during MD optimization (Figure 4 and Figure S1) in many cases. Thus, Einter is a useful measure indicating the level of structural precision achieved during the post-docking refinements. For example, the change in Einter value of the starting conformation of System 3qln shows a ca. 25 % strengthening of the target-ligand interactions alongside a large ΔRMSD improvement of 9.6 Å (72 %) (Figure 4, Movie S1). The overall performance of Protocols P1 and P3 were comparable to that of P4, both of them produced a median ΔRMSD close to 30 % (Table S3).
The increase in simulation time in P3 (Figure 2) did not result in a significant improvement over P1 or P4 (Table S4). Notably, during longer simulations, the loosely bound (C-terminal, Figure 1) regions have more time to interact with the bulk that may result in the step-wise dissociation of the whole peptide. The increase of the maximal temperature of simulation annealing in Protocol P2 (Figure 2) was even counterproductive with a drop of median ΔRMSD below 20 % except for System 4ljn. Unlike other systems (Figure 1), the C-terminal region of the histone ligand of 4ljn is engaged in extensive intramolecular interactions, resulting in a helix-like conformation. These interactions are further stabilized by weak interactions with the target. Protocols P1, P3, and P4 tend to promote stable interactions between the C-terminal region of the peptide and the target, limiting its chance to engage in intramolecular interactions. In P2, the high temperature accelerates the peptide movements minimizing its interaction with the target promoting intramolecular interactions. When the highly mobile C-terminal region of histone H3 ligands (Section 2.1.) were excluded and only the N-terminal five amino acids were involved in the RMSD calculations, all protocols except P2 showed a median ΔRMSD of at least ca. 20 % (Table S6) which can be attributed to the general improvement of MD-based protocols for the strongest binding N-terminal region of the ligand (Figure 1). The above-mentioned exclusion of the non-interacting C-terminal region in Protocols P5 and P6 promoted the formation of interactions with the target and the bulk, and speeded up the optimization (drop of RMSD) for Systems 3qlc, 3o33 and 4qf2. For example, P3 was able to obtain a ΔRMSD of 22 % calculated for the first five amino acids of the ligand for System 3o33. Upon removing the C-terminal region of non-specific interactions with the target, P5 achieved a ΔRMSD of 58 % for the same system (Table S6).

2.2.2. The Kinetic Stability of the MD-Refined Complex Structure

The stability of an improved RMSD along the MD trajectory indicates a stable binding mode and strong interactions with a target. Several studies have reported that such kinetic stability can be used as a descriptor for discriminating real and artificial docked ligand binding modes [69,70,108]. In the present study, the kinetic stability of the correct binding mode corresponding to the largest ΔRMSD was calculated for all MD trajectories and expressed in terms of residence frequency (RF, Methods) as it had been introduced in a previous study [109]. It was observed that systems with an RF > 0.5 ns-1 have a target-ligand complex of high kinetic stability along the full MD trajectory. In this sense, protocol P4 was able to achieve the best results as 4 out of 10 systems showed high kinetic stability. As an example of a stable MD-refinement, P4 improved RMSD of the initial docked pose of system 3qln by 72 % which was achieved upon a sharp drop in RMSD along the trajectory started around 5 ns into the equilibrium simulation and stabilized at 4 Å soon after entering to the final simulation (Figure 4). Compared to the trend observed in P4, the sharp drop in the RMSD started at ca. 8 ns of the SA simulation step for the same system using P1 since the target flexibility is restricted in P1, allowing an increased target motion mostly in high temperature of SA (Figure S1a). Similarly, System 3o33 exhibited a comparable trend, with P5 (limited target flexibility) and P6 (flexible binding site region) following the same pattern (Figure S1b, c). On the other hand, for system 3qln, P2 was able to produce the best possible model with up to 41 % improvement over its starting conformation after 9 ns into the SA simulation, however, the conformation did not last long due to high thermal motions (Figure S1d).

2.2.3. Comparison with the Results of Other Post-Docking Refinement Studies

Post-docking refinement methods vary in their structural performance depending on the different protocols they apply to increase the accuracy of peptide-protein docking results. A brief comparison of the performance of protocol P4 of the present study and the best results of other methods will be discussed here. The different studies in the literature use different statistics for the measurement of the performance of the refinement. Here, we re-calculated the statistical measures of the previous studies or the present study for comparability.
The refinement protocol implemented in HADDOCK [75,110] peptide docking protocol was reported to improve the docked ligands with a success rate of more than 15 % (from 54 % to 69 %). The HADDOCK semi-flexible refinement works at high temperature allowing flexibility in the interface region and also performs full MD in explicit solvent. The post-docking refinement step of the peptide-protein docking method, pepATTRACT [111,112] was able to increase the initial docking success rate by 10 % (from 70 % to 80 %) using short MD simulations with an implicit solvent model. Using the same criterion as HADDOCK and pepATTRACT, Protocol P4 of the present study improved the success rate by 20 % for full-length ligands (from 10 % to 30 %) and for the first five amino acids (from 50 % to 70 %) (Methods, Tables S8 and S9).
Accelerated MD techniques are aimed at improving conformational sampling [113,114,115]. Gaussian accelerated MD was also used [71] to refine the global docking results of three peptide-protein complexes (with decapeptide-sized ligands) obtained by ClusPro PeptiDock [116]. Indeed, the refinement protocol produced [71] a backbone ΔRMSD of docked peptide ligands up to 83 %. In the case of our Protocol P4, a maximum of 89 % backbone ΔRMSD was achieved for the full H3 peptide ligand (Tables S10 and S11).
The Rosetta FlexPepDock refinement protocol was tested on 37 peptide-protein complexes (with decapeptide-sized ligands) and was able to achieve a backbone ΔRMSD of 64 % for the majority of the test set [74]. The protocol uses Monte-Carlo search followed by energy minimization (EM) steps that allow full flexibility for the peptide and side-chain flexibility for the target protein. Protocol P4 (Figure 2) produced a median backbone ΔRMSD of 33 % for full-length ligands (Tables S10 and S11). However, it is important to note that Rosetta FlexPepDock was tested on starting conformations with backbone RMSDstart of 1-5 Å while much worse geometries of RMSDstart values of 8-27 Å were used in the present study (Table 1) for the full-length ligand.

2.3. Factors Influencing MD-Refinement

2.3.1. Target Conformation

The conformational state of the target may have a great impact on ligand binding and influence the accuracy of binding mode prediction [117,118,119,120]. MD provides conformational flexibility on both ligand and target sides during refinement. However, insufficient sampling may limit the performance of MD-refinements. For example, the refinements failed or worked at limited accuracy in cases where the conformational change at the target interface during ligand binding exceeded an RMSD of 1-2 Å [110,112]. The apo state of the target is often characterized by a higher flexibility compared to the holo states and this higher flexibility could enable extensive conformational sampling during MD simulations [121]. In the present study, three systems (2mny, 3qln, and 4ljn) had a target conformational change at the interface above an RMSD of 2 Å (Table S12). However, the MD refinement achieved a ΔRMSD up to 72 % (Protocol P4) improvement in these three systems with starting conformations obtained using apo target structures (Tables S3 and S6). The protocols were also repeated for a docked set with holo targets that had a 2 Å better mean RMSDstart value (Table S13) than that of the apo set (Table 1). However, P4 produced a median ΔRMSD of 25 % for the holo set while the same value was 32 % for the apo set (Tables S3 and S13). These findings indicate that the MD refinement protocols are relatively robust in the sense that apo target conformations can be used, and they do not necessitate ligand-bound target conformations as starting points.

2.3.2. Initial Ligand Binding Mode

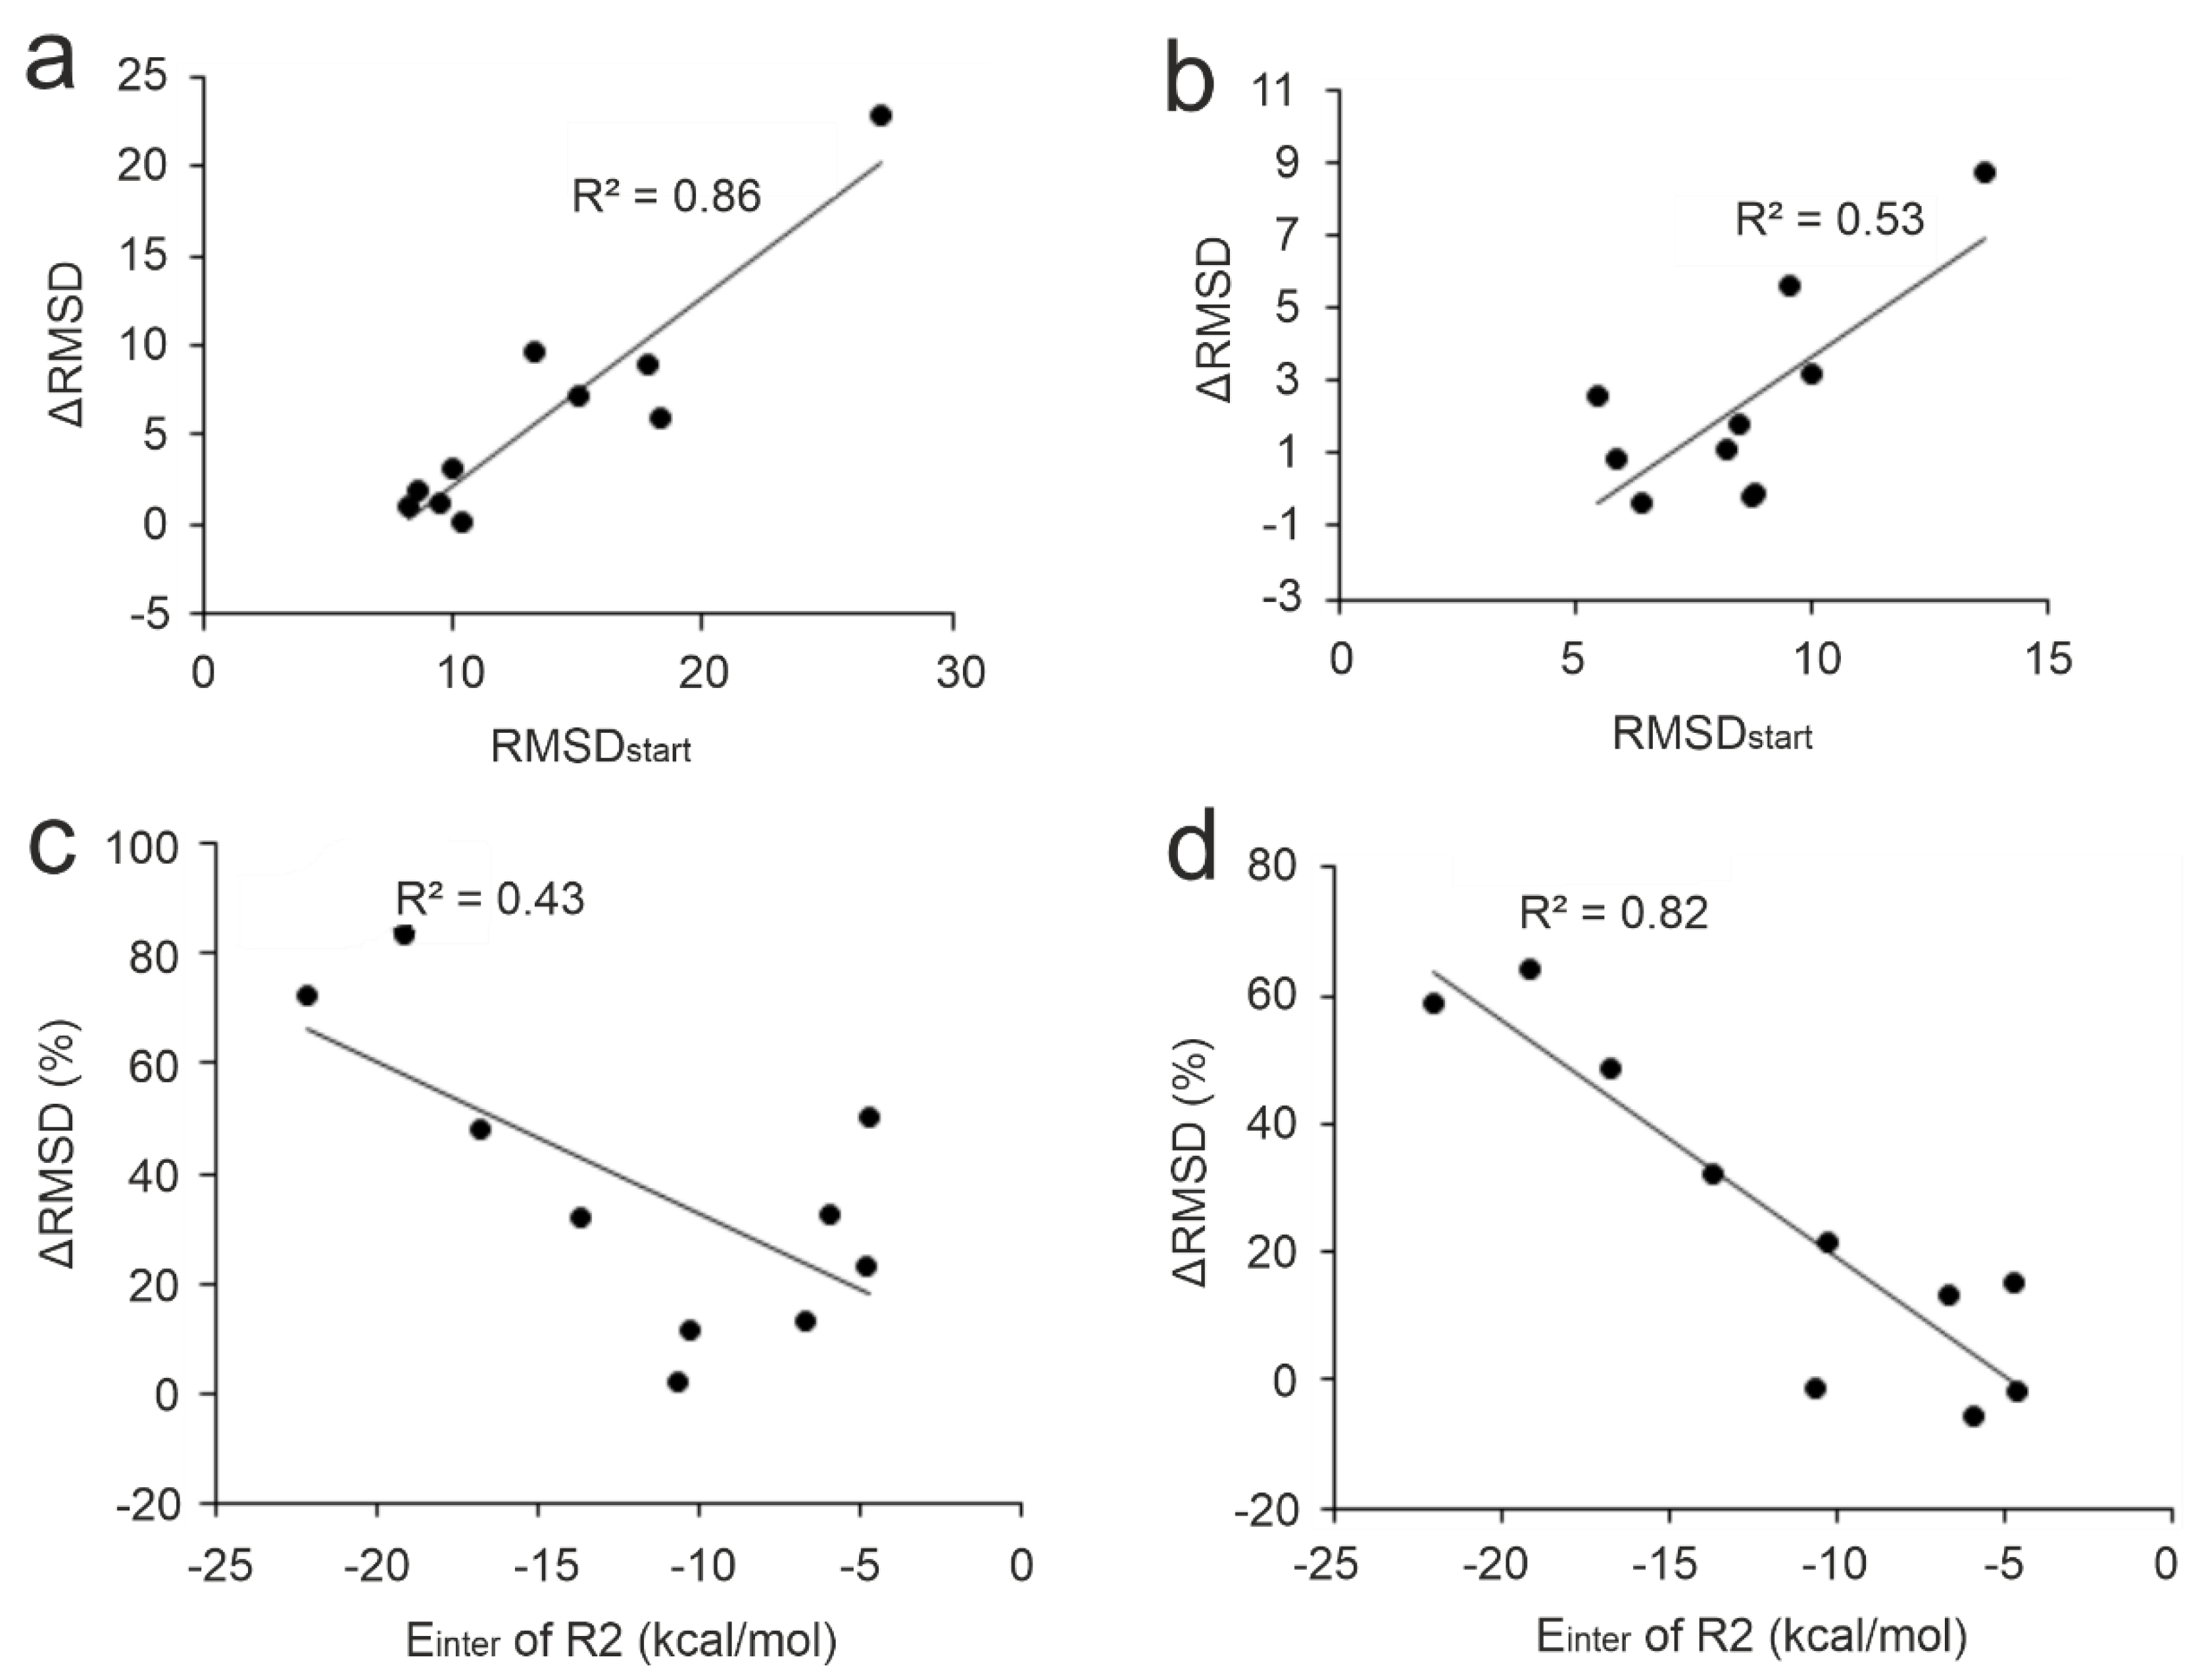
Several refinement studies have reported the effect of the distance of the initial ligand binding mode (=position, orientation, and conformation) from the experimental (real) structure on the success of structural refinements. In the cases where the initial peptide binding mode was completely wrong, refinement procedures failed to produce the real binding mode [70,74,80]. For example, in a previous study, we carried out 1-μs-long MD simulations on a benzamidine-trypsin complex (PDB ID: 3ptb) where benzamidine was placed at three different starting positions [80]. The results showed that even in the easy case of the small benzamidine ligand, 81 ns to 690 ns of simulation time was necessary to navigate the ligand to the real binding pocket depending on the distance of the post-docking starting position from the real pocket. In the present study, moderate to high correlations (R2 of 0.86 and 0.53) were observed between RMSDstart and the improvement (ΔRMSD calculated for the full ligand and the N-terminal five amino acids, respectively) using Protocol P4 on the apo set (Figure 5a and b) as well as all the other protocols (R2 ranges from 0.25 to 0.73, Figure S2). Accordingly, for the N-terminal fragment, smaller improvements can be expected (see also Section 2.2.). Thus, docked ligand binding modes that largely deviate from the reference (high RMSDstart) have a high potential for improvement upon MD-refinement while those close to the reference structure showed only little further improvement. This finding shows that in the case of linear peptide ligands like the N-terminal histone fragments of the present study (Table 1) MD can achieve considerable improvements even for starting situations that have a hopelessly large starting deviation from the real binding mode.

2.3.3. Anchoring Residues

The presence of strong interactions of the target and the initial (docked) binding mode of the ligand affects the performance of MD-refinements [68,70]. Many peptides are known to interact with their targets through highly conserved anchoring residues [27,122,123,124]. Strong interactions at these hot spots may be particularly important to drive the highly flexible, linear histone peptide to an appropriate final binding mode. In the case of histone H3 ligand, anchoring residues A1, R2, and K4 [88,90,91,92,94] are located at the N-terminal end of the peptide with the best per-residue Einter (Figure 1) values. The correlations of the pre-residue Einter values of these anchoring residues with ΔRMSD showed that interactions at residue R2 are the most important for a successful MD-refinement, especially for the best-performing Protocols P4 (Figure 5c and d). As (the backbone of) R2 residue had an accurate initial binding mode (low RMSDstart) in most cases (Table S14), its strong interaction with the target can keep the fragment in close proximity to its native conformation while the simulation samples conformations of side-chain and the remaining part of the peptide. For example, the initial ligand binding mode of System 3o33 deviated largely from its experimental structure (Table 1). At the same time, anchoring R2 residue in the initial structure was relatively accurately positioned and contributed almost half of the total Einter of the ligand. This provided a good starting point for sampling the possible conformations of the peptide during the simulations resulting in 84 % improvement over its RMSDstart with Protocol P4 (Table S3). On the other hand, System 2mny had an initial docked pose closer to its experimental structure compared to System 3o33 (Table 1). However, only weak interaction was detected between R2 residue and the target resulting in only 33 % improvement upon P4 (Table S3). Thus, the correct docked (initial) binding mode of key residues like R2 is crucial for the success of post-docking MD refinements.

2.3.4. Interfacial Water Network

It has been long recognized that water molecules play key roles in protein folding, stability, filling cavities, and mediating interactions with ligands [39,125]. Peptide ligands like the histone H3 fragments (Table 1) are highly hydrated, and therefore, water molecules play a central role [32] during their binding to the target molecules. Water molecules in the interface of the binding partners can form adhesive hydrogen-bonded networks between the partners, stabilizing the protein–ligand complex structure [39,126]. Computational studies commonly use MD simulations with explicit solvent models to investigate the above-mentioned roles of water at the atomic level [39]. However, providing a complete hydration structure of target-ligand complexes is often challenging for the default hydration algorithms of MD simulation packages due to the restricted access of bulk water to interface regions [46]. In the present study, the interfaces between the docked ligand and the target molecules of all systems of Table 1 were filled with water molecules by a pre-MD hydration step based on the HydroDock protocol [41] and MobyWat [46,127] (Step 1, Methods). This step results in a complete hydration structure without void spaces. Notably, in a previous paper [46] it was discussed that due to the simplicity of the default pre-MD water positioning process of MD programs and the inaccessibility of the target-ligand interface result in void spaces. That is, cavities without water molecules can remain in the interface unless such pre-MD hydration is applied as described in Step 1 of Methods.
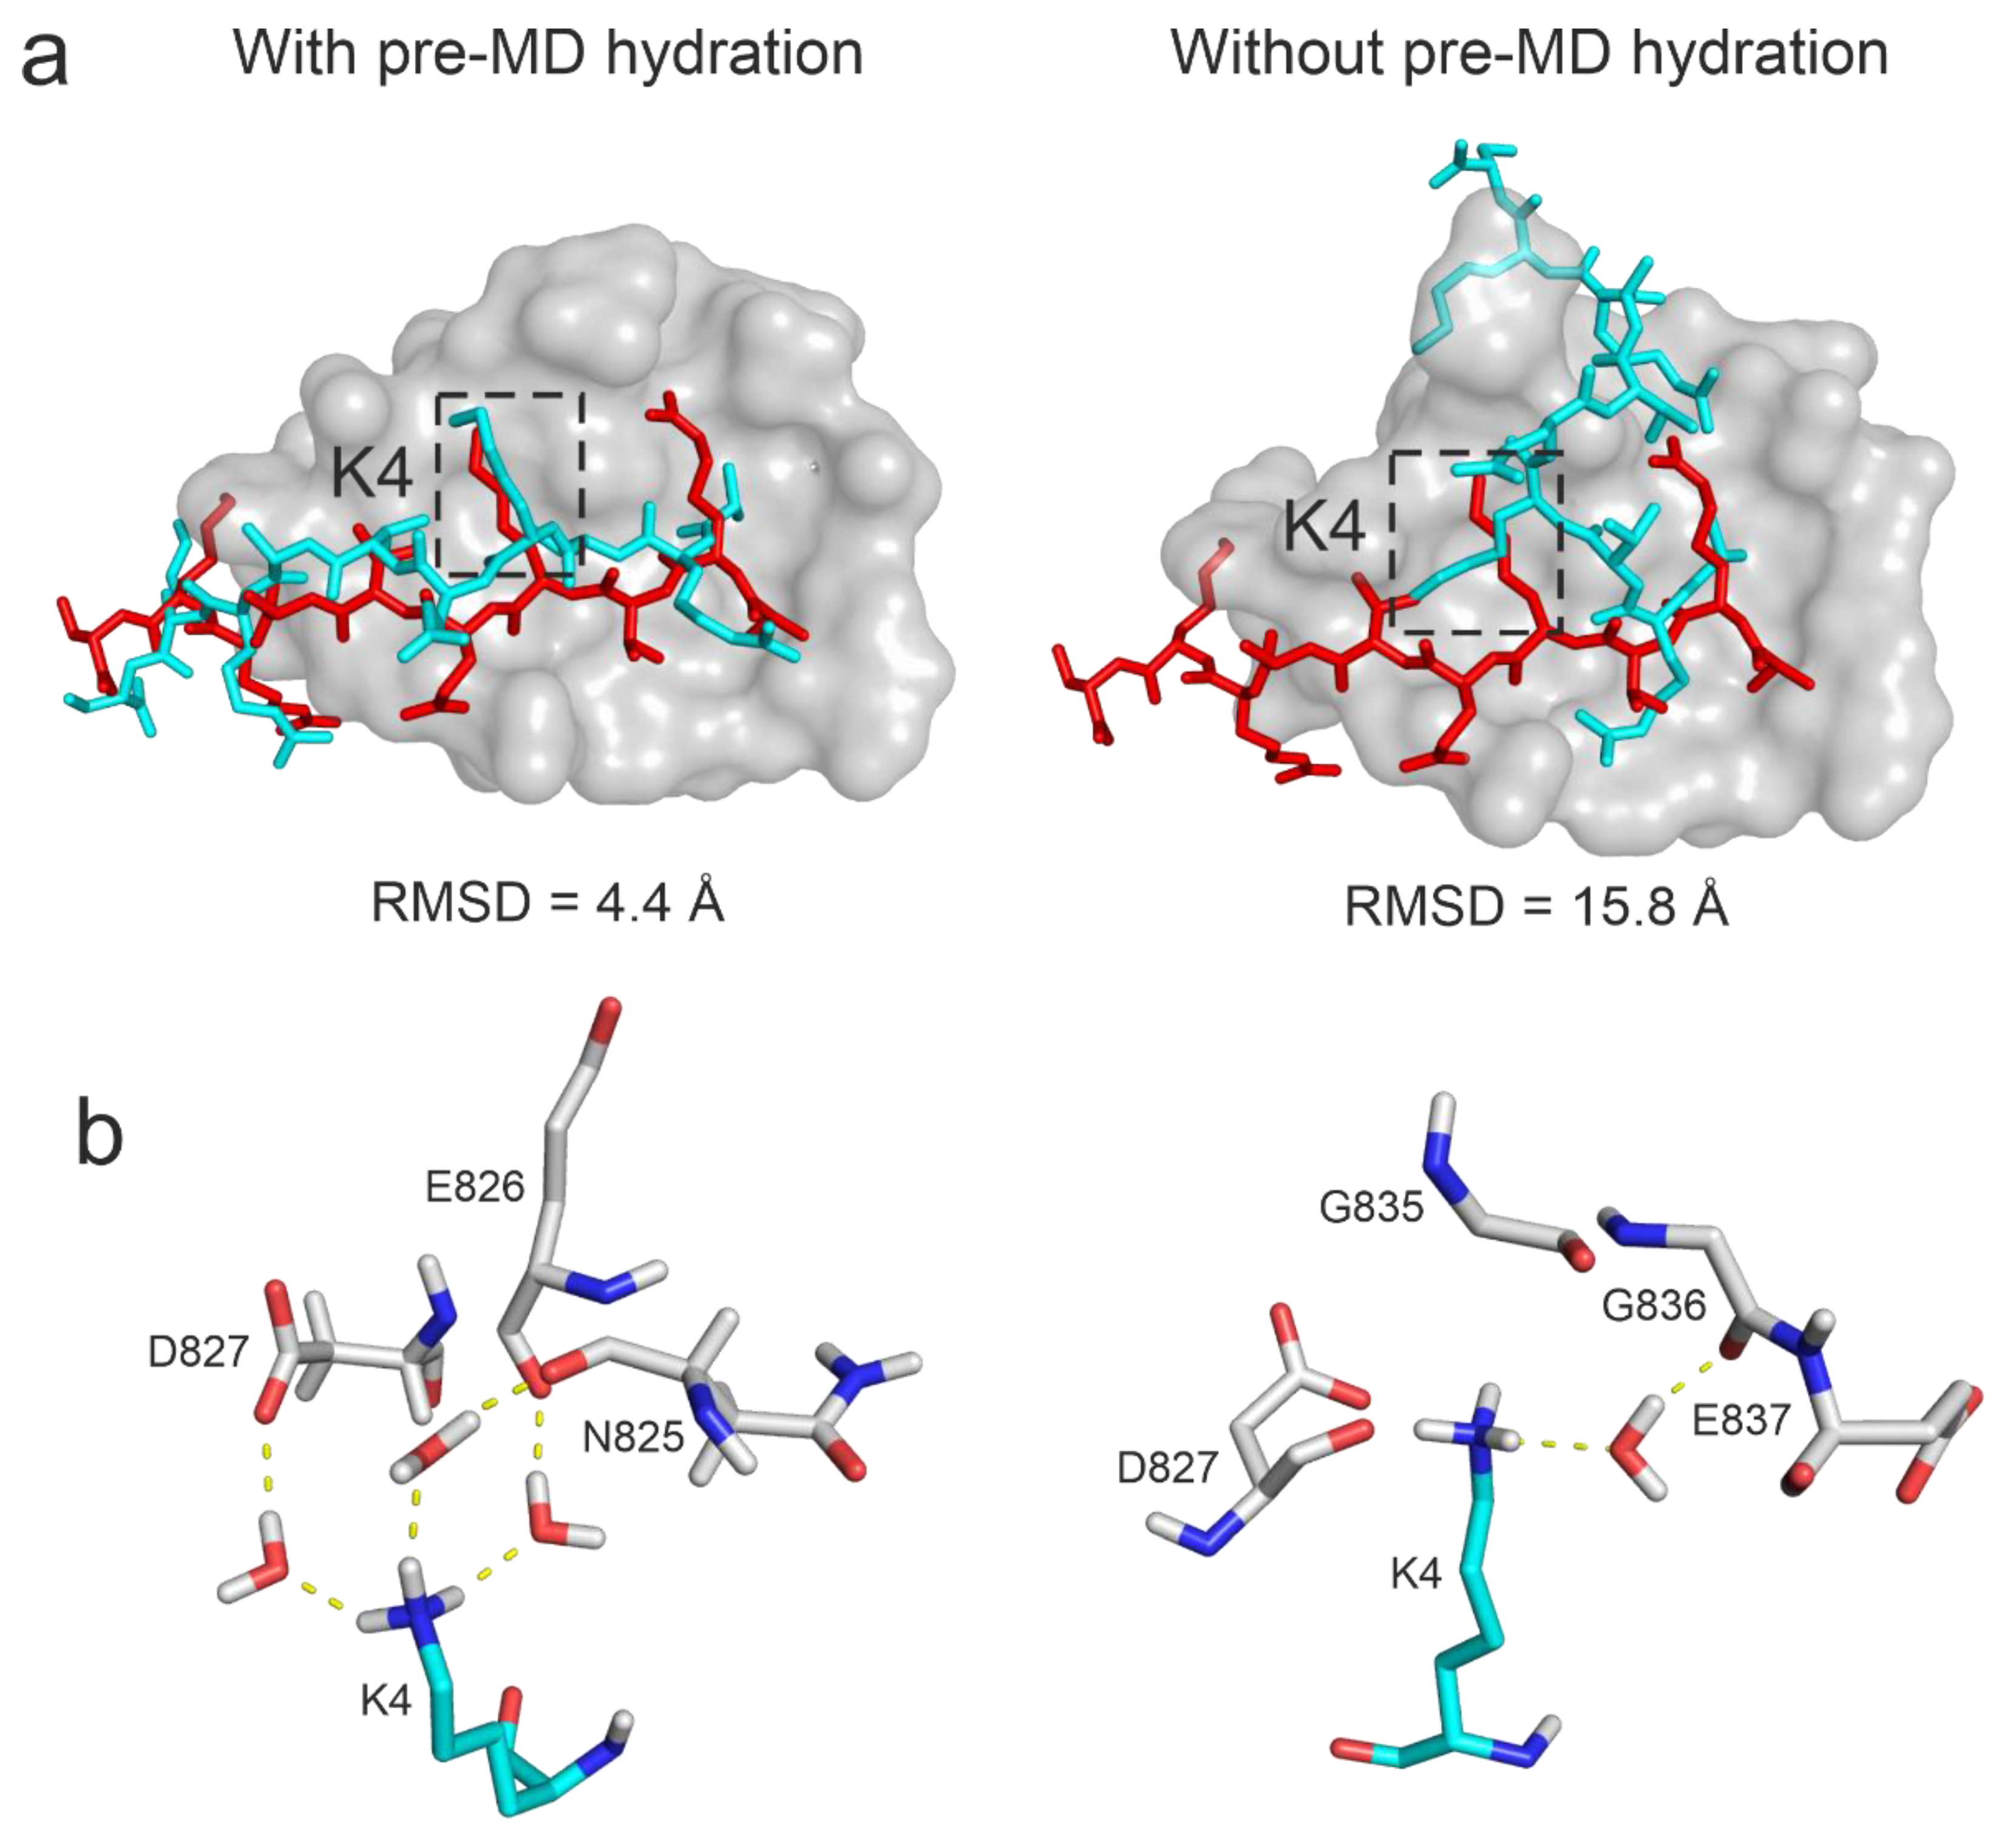
To investigate the effect of the complete hydration on the results, Protocol P4 was also performed without the pre-MD hydration (Step 1, Methods) on System 3o33, that is using only the default water positioning of the MD program. It was found that pre-MD hydration considerably improved the RMSD from 15.77 Å to 4.41 Å (that is a ΔRMSD from 42 % to 84 %) with Protocol P4 (Figure 6). Since the docked (starting) peptide binding mode for System 3o33 was largely deviated from the reference (Table 1), extensive conformational sampling was necessary to find its near-native conformation. However, if the pre-MD hydration was not performed, the anchoring R2 and K4 residues of the peptide formed extensive (artificial) interactions with the target limiting the movements of the peptide during the simulations (Figure 6a) and resulting in a large RMSD value. On the other hand, after pre-MD hydration, H-bond donors on the anchoring residues of the peptide were well shielded by water molecules in the starting complex structure allowing the formation of proper interactions with the target (Figure 6a) resulting in a drop of RMSD. As the pre-MD hydration fills void spaces of the interface completely, large number of water molecules were accurately positioned with the above-mentioned shielding effect and later forming bridging hydrogen bonds between the target and the histone peptide. For example, in the case of residue K4, three bridging water molecules stabilized the interaction with the neighboring target residues in the final structure if the pre-MD hydration was applied. Without pre-MD hydration, only one water bridge was formed, providing less stability at a wrong pocket (Figure 6b). Thus, interface water structure is crucial in promoting stable interactions and hindering the formation of artificial intramolecular interactions in the peptide. In addition to bridging hydrogen bonds, water-water interaction networks can further stabilize the target-peptide complex.
The above example showed the importance of interfacial hydration networks of large protein-peptide complexes for forming interactions between the partners in agreement with previous studies [41,46]. This problem of correct interface hydration is vital as handling explicit water molecules is still an intractable challenge for machine learning technologies [128] and docking methods [129,130].

3. Materials and Methods

3.1. Refinement Protocols

All refinement protocols consist of two main steps (1) pre-MD hydration (the building and equilibration of the void-free hydration structure of the complex interface) and (2) consecutive MD simulations. The uniform procedures of all steps and the common parameters of the simulations are described in the next Sections, followed by the specific details of the two main steps.
Energy minimization (EM). The structure was placed in a dodecahedral box with a distance criterion of 1 nm between the solute and the box. The box was filled with explicit TIP3P water molecules [131] and counterions (sodium or chloride ions) were added to neutralize the system by the gmx solvate routine of GROMACS [132]. The simulation box was subjected to a steepest descent (sd) optimization with convergence thresholds set to 1000 kJ mol −1 nm −1. Next, conjugate gradient (cg) optimization was carried out, with convergence thresholds set to 10 kJ mol −1 nm −1. In both steps, solute-heavy atoms were position restrained at a force constant of 1000 kJ mol −1 nm −2. In cases where the target structure contains structural Zn2+ ions, zinc-coordinating cysteine or histidine residues have the residue types with the appropriate protonation state (cysteine and histidine in the Amber force field). When position restraints were applied, the zinc ions were considered as heavy atoms of the target. All simulations were performed with the AMBER99SB-ILDN force field [133] using the GROMACS software package [132].
Molecular Dynamics (MD). After EM, NPT MD simulations were performed with a time step of 2 fs on the optimized structure. Solute and solvent were coupled separately to a reference temperature of 300 K using the velocity rescale algorithm [134] with a time constant of 0.1 ps. The temperature differs in the simulated annealing MD simulations (see below) depending on the refinement protocol (Figure 2). The pressure was kept at 1 bar using the Parrinello-Rahman algorithm [135,136,137] with a time constant of 0.5 ps, compressibility of 4.5×10 -5 bar -1. Particle mesh Ewald summation [135] was used for long-range electrostatics using a Fourier spacing of 0.12 nm and a grid spacing of 1 Å. All van der Waals interactions were truncated at a cutoff of 11 Å. Position restraints were applied on all solute-heavy atoms with a force constant of 1000 kJ mol −1 nm −2. The bonds in solute and solvent were constrained using the LINCS [138,139] algorithm. Coordinates were saved at regular time intervals, at every 10 ps. Before analysis, periodic boundary conditions were treated and each frame was fit to the experimental target structure using Cɑ atoms. The final trajectory containing all atomic coordinates of all frames was saved in a portable binary file and used for subsequent procedures.
Simulated annealing (SA). During SA MD simulations, simulated annealing temperature was rescaled and controlled in the same way for each temperature group in GROMACS (both solvent and solute). For protocols (Figure 2) with a maximal SA temperature of 323 K, the simulation started at 300 K and temperature increased to 310 K, to 323 K, and then cooled down to 310 K and 300 K. The simulation was performed for 2.5 ns for each temperature, except for the highest temperature. Depending on the length of the SA MD simulation of each protocol, the highest temperature was applied for the remaining simulation time (10 ns, 30 ns, 20 ns, 30 ns, and 20 ns for P1, P3, P4, P5, and P6, respectively). Maximal SA temperature is 353 K for P2 and the simulation temperature increased from 300 K to 311 K and then by 14 K interval until it reached 353 K. From the highest temperature, it cooled down to 300 K following the same temperature scheme. The simulation was performed for 1.2 ns for each temperature (10 ns for the highest temperature). All the other simulation parameters were unchanged and used as described in Molecular Dynamics.
Pre-MD hydration (Step 1). Hydration structures of the starting protein-peptide complexes were built using MobyWat [46,127], which predicts water positions on the target surface and in the complex interface at high precision using MD trajectories. From the starting complex structure, the ligand was removed and the resulting dry target structure was then energy-minimized by sd and cg algorithms as in Energy Minimization to prepare it for the 10 ns-long NPT MD simulation which was performed as described in Molecular Dynamics. Using the resulting MD trajectory file, the surface water structure of the target was calculated by the prediction mode of MobyWat using its all-inclusive identity-based prediction algorithm (IDa). During the calculation, the maximum distance from the target (dmax) of 5 Å was applied with clustering (ctol) and prediction (ptol) tolerances of 1.5 and 2.5 Å, respectively. The hydrated target structure was then placed in a common coordinate system as the starting peptide structure using Pymol [140]. The water molecules conflicting with the ligand structure were removed using the editing mode of MobyWat at a minimum distance limit (dmin) of 1.75 Å.
The hydrated complex structures were subjected to a five-step robust equilibration of the HydroDock protocol [41] to optimize the orientation of H atoms of the predicted water molecules that can assist formation of a water network. In the first two steps, sd and cg optimizations were performed as described in Energy Minimization, followed by a short 100 ps-long NPT MD simulation with the same parameters as in Molecular Dynamics, with the exception that only backbone Cɑ atoms were position restrained. The second round of sd and cg optimizations were carried out with the same settings as the first round, except for the position restraints which were applied on only backbone Cɑ atoms.
Consecutive MD simulations (Step 2). For all complex systems, three consecutive simulations of initial equilibrium MD (1), SA-MD (2), and MD with full flexibility (3) were performed on the hydrated and equilibrated complex structures depending on the refinement protocol (Figure 2). All simulations were performed with settings described in Section Molecular Dynamics, except for the parameters varied in the different protocols (Figure 2) including the simulation length, position restraints on the target atoms, SA parameters, and the length of peptide ligands. All frames generated in the MD trajectory were fitted onto the initial structure using their target Cα atoms using a GROMACS tool trjconv which also handles periodic boundary effects and centers the system in the box. Complex snapshots were extracted to individual PDB files from the resulting trajectory file by 0.1 ns steps and subjected to further analysis.

3.2. Evaluation Metrics

Root mean squared deviation (RMSD, Equation 1). RMSD values were calculated between all-heavy atoms of the calculated (C in Equation 1) and the experimental reference (R) peptide binding mode according to Equation 1.
R M S D = 1 N H i = 1 N H C i R i 2
NH is the number of heavy atoms in the ligand, C and R are space vectors of the ith heavy atom of the calculated and the experimental reference ligand binding modes in the respective Protein Databank (PDB) coordinate files.
Improvement of RMSD. ΔRMSD values were calculated to quantify the improvement of starting structures upon MD refinement. ΔRMSD (Equation 2) is measured as, the difference between RMSDstart (the RMSD calculated for the starting ligand conformation obtained from docking), and RMSDbest (the model with the best RMSD produced by a refinement protocol, Equation 2). The improvement is also expressed as a percentage (ΔRMSD (%) in Equation 3) relative to RMSDstart.
Δ R M S D = R M S D s t a r t R M S D b e s t
Δ R M S D % = Δ R M S D × 100 R M S D s t a r t
Kinetic stability of a binding mode. The kinetic stability of the binding mode of a ligand during the simulation was measured by residence frequency (RF in Equation 4) [110]. The movement of the ligand was determined by RMSD calculated between its experimental reference structure and its actual structure at each frame during the total simulation time.
R F = N u m b e r   o f   f r a m e s   w i t h   Δ R M S D c u t o f f S i m u l a t i o n   t i m e ( n s )
The cutoff was set to 1 Å indicating that the RF value is a fraction of the simulation time in which peptide binding modes improved RMSD of the starting conformation by 1 Å or more (ΔRMSD ≥ 1 Å).

3.3. Per-Residue Interaction Energy Analyses

Per-residue interaction energy analysis was performed on the experimental structure of System 2fui (Figure 1). The calculations were also performed for the preparation of data in Figure 4 and Figure 5. Upon adding polar hydrogen atoms and Gasteiger-Marsilli partial charges [141] to the experimental structure, the structural file in PBD format was converted to MOL2 using OpenBabel [142]. Per-residue interaction energy (Einter) was then calculated on the MOL2 files according to Equation 5. The Coulomb term (ECoulomb) in Equation 5 was calculated with a distance-dependent dielectric function. The Lennard Jones term (ELJ) was calculated using Amber2012 force field parameters [143].
E i n t e r = E L J + E C o u l o m b = i , j N T N L A i j r i j 12 B i j r i j 6 + q i q j 4 π ε 0 ε r r i j
A i j = ε i j R i j 12
B i j = 2 ε i j R i j 6
R i j = R i + R j
ε i j = ε i ε j
ε r = A + B 1 + k e λ B r
NT and NL are the number of target and ligand atoms, respectively; rij is the actual distance between the ith (ligand) and jth (target) atoms; q is the partial charge of an atom; ε0 is the permittivity of vacuum; εr, distance-dependent relative permittivity; εij is the potential well depth at equilibrium; Rij is the inter-nuclear distance at equilibrium; B = ε0 – A in which ε0 is the dielectric constant of water at 25°C; A, λ and k are constants [144].

5. Conclusions

Large peptides loosely bound to their target proteins are challenging ligands for fast computational docking tools. In such cases, the application of post-docking refinement methods is necessary to achieve precise target-ligand complex structures. MD simulations have been applied for such refinements as they account for the flexibility of both target and ligand partners, and can be efficiently combined with various solvent models. In the present study, MD refinement protocols were explored using a challenging set of structures of docked complexes of histone H3 peptide ligands with a relatively large deviation from the experimental reference binding modes. In the present protocols, a pre-MD hydration step was introduced to complete the docked (starting) complex structures with a layer of water molecules. Thus, the complexes were equipped with appropriately oriented waters in the target-ligand interface and the number of unwanted void cavities was minimized prior to the MD simulations. Six different MD protocols of three consecutive MD steps and the effects of various simulation parameters were investigated. We found that MD refinements can handle the challenges of histone ligands, and the best performing Protocol P4 achieved an improvement of a median ΔRMSD of 32 % (the largest improvement of 84 %) if compared with the docked starting complex. Furthermore, the refinement protocols considerably improved the docked structures of large deviation from the experimental reference. An analysis of the MD parameters showed that the increase of simulation time and maximal SA temperature beyond a limit did not result in further improvement of the efficiency of the refinement. It was also concluded that an accurate positioning of anchoring residues (like R2 in the histone H3 ligand) in the docked structure considerably improves the efficiency of the MD refinement. The target-ligand intermolecular interaction energy (Einter) proved to be a good indicator of the quality (structural precision) of the actual complex structure during the refinements. It was also found that the pre-MD hydration step promotes the formation of hydration networks required for appropriate target-ligand interactions during MD. The application of the results of the present study will increase the efficiency of current fast docking methods, and help the design of new peptide ligands.

Supplementary Materials

The following supporting information can be downloaded at the website of this paper posted on Preprints.org. Figures S1-S2 and Tables S1-S14 are provided as a single pdf file, Video S1: Conformational changes of the initial structure of histone H3 peptide bound to ATRX ADD (System 3qln) domain during Step 2 of Protocol P4.

Author Contributions

Conceptualization, C.H.; research, simulations and data analyses, B.B.; writing—original draft preparation, B.B., B.Z.Z., R.B. and C.H.; writing—review and editing, B.B., R.B. and C.H.; visualization, B.B. and C.H.; supervision, C.H.; project administration, C.H and B.Z.Z.; funding acquisition, C.H. All authors have read and agreed to the published version of the manuscript.

Funding

Project no. RRF-2.3.1-21-2022-00015 has been implemented with the support provided by the European Union.

Institutional Review Board Statement

Not applicable.

Informed Consent Statement

Not applicable.

Data Availability Statement

Data files are available at https://zenodo.org/records/11051777. A compressed data file contains the in- and output files of the refinement Protocol 4 for apo systems, the scripts and the programs necessary to produce them. A README file contains detailed description how to perform the protocol. The programs necessary for producing results, MobyWat (http://mobywat.com/), and GROMACS (https://www.gromacs.org/), are open source programs. The in-house programs that are used to calculate RMSD and interaction energy values are provided in the Supporting_data.zip.

Acknowledgments

We acknowledge the support from the Governmental Information Technology Development Agency, Hungary.

Conflicts of Interest

The authors declare no conflicts of interest.

References

  1. Drwal, M.N.; Griffith, R. Combination of Ligand- and Structure-Based Methods in Virtual Screening. Drug Discov Today Technol 2013, 10, e395–e401. [Google Scholar] [CrossRef] [PubMed]
  2. Kitchen, D.B.; Decornez, H.; Furr, J.R.; Bajorath, J. Docking and Scoring in Virtual Screening for Drug Discovery: Methods and Applications. Nat Rev Drug Discov 2004, 3, 935–949. [Google Scholar] [CrossRef]
  3. Dias, R.; de Azevedo, W.F. Molecular Docking Algorithms. Curr Drug Targets 2008, 9, 1040–1047. [Google Scholar] [CrossRef] [PubMed]
  4. Meng, X.-Y.; Zhang, H.-X.; Mezei, M.; Cui, M. Molecular Docking: A Powerful Approach for Structure-Based Drug Discovery. Curr Comput Aided Drug Des 2011, 7, 146–157. [Google Scholar] [CrossRef] [PubMed]
  5. Ferreira, L.G.; Dos Santos, R.N.; Oliva, G.; Andricopulo, A.D. Molecular Docking and Structure-Based Drug Design Strategies. Molecules 2015, 20, 13384–13421. [Google Scholar] [CrossRef] [PubMed]
  6. Fletcher, S.; Hamilton, A.D. Targeting Protein-Protein Interactions by Rational Design: Mimicry of Protein Surfaces. J R Soc Interface 2006, 3, 215–233. [Google Scholar] [CrossRef]
  7. Torres, P.H.M.; Sodero, A.C.R.; Jofily, P.; Silva-Jr, F.P. Key Topics in Molecular Docking for Drug Design. Int J Mol Sci 2019, 20. [Google Scholar] [CrossRef] [PubMed]
  8. de Ruyck, J.; Brysbaert, G.; Blossey, R.; Lensink, M.F. Molecular Docking as a Popular Tool in Drug Design, an in Silico Travel. Adv Appl Bioinform Chem 2016, 9, 1–11. [Google Scholar] [CrossRef]
  9. Li, C.; Sun, J.; Li, L.-W.; Wu, X.; Palade, V. An Effective Swarm Intelligence Optimization Algorithm for Flexible Ligand Docking. IEEE/ACM Trans Comput Biol Bioinform 2022, 19, 2672–2684. [Google Scholar] [CrossRef]
  10. Pawson, T.; Nash, P. Assembly of Cell Regulatory Systems through Protein Interaction Domains. Science 2003, 300, 445–452. [Google Scholar] [CrossRef]
  11. Petsalaki, E.; Russell, R.B. Peptide-Mediated Interactions in Biological Systems: New Discoveries and Applications. Curr Opin Biotechnol 2008, 19, 344–350. [Google Scholar] [CrossRef] [PubMed]
  12. Dyson, H.J.; Wright, P.E. Intrinsically Unstructured Proteins and Their Functions. Nat Rev Mol Cell Biol 2005, 6, 197–208. [Google Scholar] [CrossRef] [PubMed]
  13. Das, A.A.; Sharma, O.P.; Kumar, M.S.; Krishna, R.; Mathur, P.P. PepBind: A Comprehensive Database and Computational Tool for Analysis of Protein-Peptide Interactions. Genomics Proteomics Bioinformatics 2013, 11, 241–246. [Google Scholar] [CrossRef] [PubMed]
  14. Fatoki, T.H.; Chukwuejim, S.; Udenigwe, C.C.; Aluko, R.E. In Silico Exploration of Metabolically Active Peptides as Potential Therapeutic Agents against Amyotrophic Lateral Sclerosis. International Journal of Molecular Sciences 2023, 24, 5828. [Google Scholar] [CrossRef] [PubMed]
  15. Schreiber, G.; Fleishman, S.J. Computational Design of Protein-Protein Interactions. Curr. Opin. Struct. Biol. 2013, 23, 903–910. [Google Scholar] [CrossRef] [PubMed]
  16. Grosdidier, S.; Fernández-Recio, J. Protein-Protein Docking and Hot-Spot Prediction for Drug Discovery. Curr. Pharm. Des. 2012, 18, 4607–4618. [Google Scholar] [CrossRef] [PubMed]
  17. Fuller, J.C.; Burgoyne, N.J.; Jackson, R.M. Predicting Druggable Binding Sites at the Protein-Protein Interface. Drug Discov. Today 2009, 14, 155–161. [Google Scholar] [CrossRef]
  18. Kann, M.G. Protein Interactions and Disease: Computational Approaches to Uncover the Etiology of Diseases. Brief. Bioinformatics 2007, 8, 333–346. [Google Scholar] [CrossRef] [PubMed]
  19. Bienstock, R.J. Computational Drug Design Targeting Protein-Protein Interactions. Curr. Pharm. Des. 2012, 18, 1240–1254. [Google Scholar] [CrossRef]
  20. Silva, M.; Philadelpho, B.; Santos, J.; Souza, V.; Souza, C.; Santiago, V.; Silva, J.; Souza, C.; Azeredo, F.; Castilho, M.; et al. IAF, QGF, and QDF Peptides Exhibit Cholesterol-Lowering Activity through a Statin-like HMG-CoA Reductase Regulation Mechanism: In Silico and In Vitro Approach. Int J Mol Sci 2021, 22, 11067. [Google Scholar] [CrossRef]
  21. Ahrens, V.M.; Bellmann-Sickert, K.; Beck-Sickinger, A.G. Peptides and Peptide Conjugates: Therapeutics on the Upward Path. Future Med Chem 2012, 4, 1567–1586. [Google Scholar] [CrossRef] [PubMed]
  22. Fosgerau, K.; Hoffmann, T. Peptide Therapeutics: Current Status and Future Directions. Drug Discov Today 2015, 20, 122–128. [Google Scholar] [CrossRef] [PubMed]
  23. Kahler, U.; Fuchs, J.E.; Goettig, P.; Liedl, K.R. An Unexpected Switch in Peptide Binding Mode: From Simulation to Substrate Specificity. J Biomol Struct Dyn 2018, 36, 4072–4084. [Google Scholar] [CrossRef] [PubMed]
  24. Lee, A.C.-L.; Harris, J.L.; Khanna, K.K.; Hong, J.-H. A Comprehensive Review on Current Advances in Peptide Drug Development and Design. Int J Mol Sci 2019, 20, 2383. [Google Scholar] [CrossRef]
  25. Koehler, A.N. A Complex Task? Direct Modulation of Transcription Factors with Small Molecules. Curr Opin Chem Biol 2010, 14, 331–340. [Google Scholar] [CrossRef] [PubMed]
  26. Seo, P.J.; Hong, S.-Y.; Kim, S.-G.; Park, C.-M. Competitive Inhibition of Transcription Factors by Small Interfering Peptides. Trends Plant Sci 2011, 16, 541–549. [Google Scholar] [CrossRef] [PubMed]
  27. Oleinikov, P.D.; Fedulova, A.S.; Armeev, G.A.; Motorin, N.A.; Singh-Palchevskaia, L.; Sivkina, A.L.; Feskin, P.G.; Glukhov, G.S.; Afonin, D.A.; Komarova, G.A.; et al. Interactions of Nucleosomes with Acidic Patch-Binding Peptides: A Combined Structural Bioinformatics, Molecular Modeling, Fluorescence Polarization, and Single-Molecule FRET Study. International Journal of Molecular Sciences 2023, 24, 15194. [Google Scholar] [CrossRef] [PubMed]
  28. Huang, S.-Y. Search Strategies and Evaluation in Protein-Protein Docking: Principles, Advances and Challenges. Drug Discov. Today 2014, 19, 1081–1096. [Google Scholar] [CrossRef] [PubMed]
  29. Ciemny, M.; Kurcinski, M.; Kamel, K.; Kolinski, A.; Alam, N.; Schueler-Furman, O.; Kmiecik, S. Protein-Peptide Docking: Opportunities and Challenges. Drug Discov. Today 2018, 23, 1530–1537. [Google Scholar] [CrossRef]
  30. Zhou, P.; Wang, C.; Ren, Y.; Yang, C.; Tian, F. Computational Peptidology: A New and Promising Approach to Therapeutic Peptide Design. Curr. Med. Chem. 2013, 20, 1985–1996. [Google Scholar] [CrossRef]
  31. Wodak, S.J.; Méndez, R. Prediction of Protein-Protein Interactions: The CAPRI Experiment, Its Evaluation and Implications. Curr. Opin. Struct. Biol. 2004, 14, 242–249. [Google Scholar] [CrossRef] [PubMed]
  32. Zsidó, B.Z.; Hetényi, C. The Role of Water in Ligand Binding. Current Opinion in Structural Biology 2021, 67, 1–8. [Google Scholar] [CrossRef] [PubMed]
  33. Cui, G.; Swails, J.M.; Manas, E.S. SPAM: A Simple Approach for Profiling Bound Water Molecules. J Chem Theory Comput 2013, 9, 5539–5549. [Google Scholar] [CrossRef] [PubMed]
  34. Bodnarchuk, M.S.; Viner, R.; Michel, J.; Essex, J.W. Strategies to Calculate Water Binding Free Energies in Protein–Ligand Complexes. J. Chem. Inf. Model. 2014, 54, 1623–1633. [Google Scholar] [CrossRef] [PubMed]
  35. Le Roux, J.; Leriche, C.; Chamiot-Clerc, P.; Feutrill, J.; Halley, F.; Papin, D.; Derimay, N.; Mugler, C.; Grépin, C.; Schio, L. Preparation and Optimization of Pyrazolo[1,5-a]Pyrimidines as New Potent PDE4 Inhibitors. Bioorg Med Chem Lett 2016, 26, 454–459. [Google Scholar] [CrossRef]
  36. Bortolato, A.; Tehan, B.G.; Bodnarchuk, M.S.; Essex, J.W.; Mason, J.S. Water Network Perturbation in Ligand Binding: Adenosine A(2A) Antagonists as a Case Study. J Chem Inf Model 2013, 53, 1700–1713. [Google Scholar] [CrossRef]
  37. Chrencik, J.E.; Patny, A.; Leung, I.K.; Korniski, B.; Emmons, T.L.; Hall, T.; Weinberg, R.A.; Gormley, J.A.; Williams, J.M.; Day, J.E.; et al. Structural and Thermodynamic Characterization of the TYK2 and JAK3 Kinase Domains in Complex with CP-690550 and CMP-6. J Mol Biol 2010, 400, 413–433. [Google Scholar] [CrossRef]
  38. Mason, J.S.; Bortolato, A.; Congreve, M.; Marshall, F.H. New Insights from Structural Biology into the Druggability of G Protein-Coupled Receptors. Trends Pharmacol Sci 2012, 33, 249–260. [Google Scholar] [CrossRef] [PubMed]
  39. Tshilande, N.; Mammino, L.; Bilonda, M.K. The Study of Molecules and Processes in Solution: An Overview of Questions, Approaches and Applications. Computation 2024, 12, 78. [Google Scholar] [CrossRef]
  40. Wei, L.; Chen, Y.; Liu, J.; Rao, L.; Ren, Y.; Xu, X.; Wan, J. Cov_DOX: A Method for Structure Prediction of Covalent Protein–Ligand Bindings. J. Med. Chem. 2022, 65, 5528–5538. [Google Scholar] [CrossRef]
  41. Zsidó, B.Z.; Börzsei, R.; Szél, V.; Hetényi, C. Determination of Ligand Binding Modes in Hydrated Viral Ion Channels to Foster Drug Design and Repositioning. J Chem Inf Model 2021, 61, 4011–4022. [Google Scholar] [CrossRef] [PubMed]
  42. Hu, B.; Lill, M.A. Protein Pharmacophore Selection Using Hydration-Site Analysis. J Chem Inf Model 2012, 52, 1046–1060. [Google Scholar] [CrossRef]
  43. Murphy, R.B.; Repasky, M.P.; Greenwood, J.R.; Tubert-Brohman, I.; Jerome, S.; Annabhimoju, R.; Boyles, N.A.; Schmitz, C.D.; Abel, R.; Farid, R.; et al. WScore: A Flexible and Accurate Treatment of Explicit Water Molecules in Ligand-Receptor Docking. J. Med. Chem. 2016, 59, 4364–4384. [Google Scholar] [CrossRef] [PubMed]
  44. Kalyanaraman, C.; Bernacki, K.; Jacobson, M.P. Virtual Screening against Highly Charged Active Sites:  Identifying Substrates of Alpha−Beta Barrel Enzymes. Biochemistry 2005, 44, 2059–2071. [Google Scholar] [CrossRef] [PubMed]
  45. Anighoro, A.; Rastelli, G. Enrichment Factor Analyses on G-Protein Coupled Receptors with Known Crystal Structure. J Chem Inf Model 2013, 53, 739–743. [Google Scholar] [CrossRef] [PubMed]
  46. Jeszenői, N.; Bálint, M.; Horváth, I.; van der Spoel, D.; Hetényi, C. Exploration of Interfacial Hydration Networks of Target-Ligand Complexes. J Chem Inf Model 2016, 56, 148–158. [Google Scholar] [CrossRef]
  47. Kapla, J.; Rodríguez-Espigares, I.; Ballante, F.; Selent, J.; Carlsson, J. Can Molecular Dynamics Simulations Improve the Structural Accuracy and Virtual Screening Performance of GPCR Models? PLoS Comput Biol 2021, 17, e1008936. [Google Scholar] [CrossRef] [PubMed]
  48. Bryant, P.; Pozzati, G.; Elofsson, A. Improved Prediction of Protein-Protein Interactions Using AlphaFold2. Nat Commun 2022, 13, 1265. [Google Scholar] [CrossRef] [PubMed]
  49. Jumper, J.; Evans, R.; Pritzel, A.; Green, T.; Figurnov, M.; Ronneberger, O.; Tunyasuvunakool, K.; Bates, R.; Žídek, A.; Potapenko, A.; et al. Highly Accurate Protein Structure Prediction with AlphaFold. Nature 2021, 596, 583–589. [Google Scholar] [CrossRef]
  50. Ko, J.; Lee, J. Can AlphaFold2 Predict Protein-Peptide Complex Structures Accurately? 07.27.45 3972.
  51. Johansson-Åkhe, I.; Wallner, B. Improving Peptide-Protein Docking with AlphaFold-Multimer Using Forced Sampling. Front Bioinform 2022, 2, 959160. [Google Scholar] [CrossRef] [PubMed]
  52. de Brevern, A.G. An Agnostic Analysis of the Human AlphaFold2 Proteome Using Local Protein Conformations. Biochimie 2023, 207, 11–19. [Google Scholar] [CrossRef]
  53. Al-Masri, C.; Trozzi, F.; Lin, S.-H.; Tran, O.; Sahni, N.; Patek, M.; Cichonska, A.; Ravikumar, B.; Rahman, R. Investigating the Conformational Landscape of AlphaFold2-Predicted Protein Kinase Structures. Bioinform Adv 2023, 3, vbad129. [Google Scholar] [CrossRef]
  54. Tong, A.B.; Burch, J.D.; McKay, D.; Bustamante, C.; Crackower, M.A.; Wu, H. Could AlphaFold Revolutionize Chemical Therapeutics? Nat Struct Mol Biol 2021, 28, 771–772. [Google Scholar] [CrossRef]
  55. Skolnick, J.; Gao, M.; Zhou, H.; Singh, S. AlphaFold 2: Why It Works and Its Implications for Understanding the Relationships of Protein Sequence, Structure, and Function. J Chem Inf Model 2021, 61, 4827–4831. [Google Scholar] [CrossRef] [PubMed]
  56. Buttenschoen, M. ; M. Morris, G.; M. Deane, C. PoseBusters: AI-Based Docking Methods Fail to Generate Physically Valid Poses or Generalise to Novel Sequences. Chemical Science 2024, 15, 3130–3139. [Google Scholar] [CrossRef] [PubMed]
  57. Heo, L.; Janson, G.; Feig, M. Physics-Based Protein Structure Refinement in the Era of Artificial Intelligence. Proteins 2021, 89, 1870–1887. [Google Scholar] [CrossRef]
  58. Arantes, P.R.; Polêto, M.D.; Pedebos, C.; Ligabue-Braun, R. Making It Rain: Cloud-Based Molecular Simulations for Everyone. J. Chem. Inf. Model. 2021, 61, 4852–4856. [Google Scholar] [CrossRef]
  59. Zhang, Y.; Luo, M.; Wu, P.; Wu, S.; Lee, T.-Y.; Bai, C. Application of Computational Biology and Artificial Intelligence in Drug Design. International Journal of Molecular Sciences 2022, 23, 13568. [Google Scholar] [CrossRef]
  60. Adiyaman, R.; Edmunds, N.S.; Genc, A.G.; Alharbi, S.M.A.; McGuffin, L.J. Improvement of Protein Tertiary and Quaternary Structure Predictions Using the ReFOLD Refinement Method and the AlphaFold2 Recycling Process. Bioinform Adv 2023, 3, vbad078. [Google Scholar] [CrossRef]
  61. Karplus, M.; McCammon, J.A. Molecular Dynamics Simulations of Biomolecules. Nat Struct Biol 2002, 9, 646–652. [Google Scholar] [CrossRef] [PubMed]
  62. Norberg, J.; Nilsson, L. Advances in Biomolecular Simulations: Methodology and Recent Applications. Q Rev Biophys 2003, 36, 257–306. [Google Scholar] [CrossRef]
  63. Kozakov, D.; Hall, D.R.; Xia, B.; Porter, K.A.; Padhorny, D.; Yueh, C.; Beglov, D.; Vajda, S. The ClusPro Web Server for Protein-Protein Docking. Nat Protoc 2017, 12, 255–278. [Google Scholar] [CrossRef] [PubMed]
  64. Tovchigrechko, A.; Vakser, I.A. GRAMM-X Public Web Server for Protein-Protein Docking. Nucleic Acids Res. 2006, 34, W310–W314. [Google Scholar] [CrossRef] [PubMed]
  65. Heo, L.; Park, H.; Seok, C. GalaxyRefine: Protein Structure Refinement Driven by Side-Chain Repacking. Nucleic Acids Res. 2013, 41, W384–W388. [Google Scholar] [CrossRef] [PubMed]
  66. Dominguez, C.; Boelens, R.; Bonvin, A.M.J.J. HADDOCK: A Protein-Protein Docking Approach Based on Biochemical or Biophysical Information. J Am Chem Soc 2003, 125, 1731–1737. [Google Scholar] [CrossRef] [PubMed]
  67. Rastelli, G.; Pinzi, L. Refinement and Rescoring of Virtual Screening Results. Front Chem 2019, 7, 498. [Google Scholar] [CrossRef] [PubMed]
  68. Guterres, H.; Im, W. Improving Protein-Ligand Docking Results with High-Throughput Molecular Dynamics Simulations. J Chem Inf Model 2020, 60, 2189–2198. [Google Scholar] [CrossRef] [PubMed]
  69. Lee, H.S.; Jo, S.; Lim, H.-S.; Im, W. Application of Binding Free Energy Calculations to Prediction of Binding Modes and Affinities of MDM2 and MDMX Inhibitors. J Chem Inf Model 2012, 52, 1821–1832. [Google Scholar] [CrossRef]
  70. Radom, F.; Plückthun, A.; Paci, E. Assessment of Ab Initio Models of Protein Complexes by Molecular Dynamics. PLoS Comput Biol 2018, 14, e1006182. [Google Scholar] [CrossRef]
  71. Wang, J.; Alekseenko, A.; Kozakov, D.; Miao, Y. Improved Modeling of Peptide-Protein Binding Through Global Docking and Accelerated Molecular Dynamics Simulations. Front Mol Biosci 2019, 6, 112. [Google Scholar] [CrossRef] [PubMed]
  72. Huo, S.; Wang, J.; Cieplak, P.; Kollman, P.A.; Kuntz, I.D. Molecular Dynamics and Free Energy Analyses of Cathepsin D-Inhibitor Interactions: Insight into Structure-Based Ligand Design. J Med Chem 2002, 45, 1412–1419. [Google Scholar] [CrossRef] [PubMed]
  73. Lamiable, A.; Thévenet, P.; Rey, J.; Vavrusa, M.; Derreumaux, P.; Tufféry, P. PEP-FOLD3: Faster de Novo Structure Prediction for Linear Peptides in Solution and in Complex. Nucleic Acids Res. 2016, 44, W449–W454. [Google Scholar] [CrossRef] [PubMed]
  74. Raveh, B.; London, N.; Schueler-Furman, O. Sub-Angstrom Modeling of Complexes between Flexible Peptides and Globular Proteins. Proteins 2010, 78, 2029–2040. [Google Scholar] [CrossRef] [PubMed]
  75. van Zundert, G.C.P.; Rodrigues, J.P.G.L.M.; Trellet, M.; Schmitz, C.; Kastritis, P.L.; Karaca, E.; Melquiond, A.S.J.; van Dijk, M.; de Vries, S.J.; Bonvin, A.M.J.J. The HADDOCK2. 2 Web Server: User-Friendly Integrative Modeling of Biomolecular Complexes. J. Mol. Biol. 2016, 428, 720–725. [Google Scholar] [CrossRef] [PubMed]
  76. Branches, A.D.S.; Da Silva, J.N.; De Oliveira, M.D.L.; Bezerra, D.P.; Soares, M.B.P.; Costa, E.V.; Oliveira, K.M.T. DFT Calculations, Molecular Docking, Binding Free Energy Analysis and Cytotoxicity Assay of 7,7-Dimethylaporphine Alkaloids with Methylenedioxy Ring in Positions 1 and 2. Computational and Theoretical Chemistry 2024, 1233, 114483. [Google Scholar] [CrossRef]
  77. Cavalli, A.; Bottegoni, G.; Raco, C.; De Vivo, M.; Recanatini, M. A Computational Study of the Binding of Propidium to the Peripheral Anionic Site of Human Acetylcholinesterase. J Med Chem 2004, 47, 3991–3999. [Google Scholar] [CrossRef] [PubMed]
  78. Park, H.; Yeom, M.S.; Lee, S. Loop Flexibility and Solvent Dynamics as Determinants for the Selective Inhibition of Cyclin-Dependent Kinase 4: Comparative Molecular Dynamics Simulation Studies of CDK2 and CDK4. Chembiochem 2004, 5, 1662–1672. [Google Scholar] [CrossRef] [PubMed]
  79. Ogrizek, M.; Turk, S.; Lešnik, S.; Sosič, I.; Hodošček, M.; Mirković, B.; Kos, J.; Janežič, D.; Gobec, S.; Konc, J. Molecular Dynamics to Enhance Structure-Based Virtual Screening on Cathepsin B. J Comput Aided Mol Des 2015, 29, 707–712. [Google Scholar] [CrossRef]
  80. Bálint, M.; Jeszenői, N.; Horváth, I.; van der Spoel, D.; Hetényi, C. Systematic Exploration of Multiple Drug Binding Sites. Journal of Cheminformatics 2017, 9, 65. [Google Scholar] [CrossRef]
  81. Fu, I.; Geacintov, N.E.; Broyde, S. Molecular Dynamics Simulations Reveal How H3K56 Acetylation Impacts Nucleosome Structure to Promote DNA Exposure for Lesion Sensing. DNA Repair (Amst) 2021, 107, 103201. [Google Scholar] [CrossRef]
  82. Mosammaparast, N.; Shi, Y. Reversal of Histone Methylation: Biochemical and Molecular Mechanisms of Histone Demethylases. Annu. Rev. Biochem. 2010, 79, 155–179. [Google Scholar] [CrossRef] [PubMed]
  83. Martin, C.; Zhang, Y. The Diverse Functions of Histone Lysine Methylation. Nat. Rev. Mol. Cell Biol. 2005, 6, 838–849. [Google Scholar] [CrossRef]
  84. Zsidó, B.Z.; Hetényi, C. Molecular Structure, Binding Affinity, and Biological Activity in the Epigenome. Int J Mol Sci 2020, 21. [Google Scholar] [CrossRef]
  85. Bortoluzzi, A.; Amato, A.; Lucas, X.; Blank, M.; Ciulli, A. Structural Basis of Molecular Recognition of Helical Histone H3 Tail by PHD Finger Domains. Biochem J 2017, 474, 1633–1651. [Google Scholar] [CrossRef] [PubMed]
  86. Ruthenburg, A.J.; Wang, W.; Graybosch, D.M.; Li, H.; Allis, C.D.; Patel, D.J.; Verdine, G.L. Histone H3 Recognition and Presentation by the WDR5 Module of the MLL1 Complex. Nat. Struct. Mol. Biol. 2006, 13, 704–712. [Google Scholar] [CrossRef]
  87. Ooi, S.K.T.; Qiu, C.; Bernstein, E.; Li, K.; Jia, D.; Yang, Z.; Erdjument-Bromage, H.; Tempst, P.; Lin, S.-P.; Allis, C.D.; et al. DNMT3L Connects Unmethylated Lysine 4 of Histone H3 to de Novo Methylation of DNA. Nature 2007, 448, 714–717. [Google Scholar] [CrossRef]
  88. Iwase, S.; Xiang, B.; Ghosh, S.; Ren, T.; Lewis, P.W.; Cochrane, J.C.; Allis, C.D.; Picketts, D.J.; Patel, D.J.; Li, H.; et al. ATRX ADD Domain Links an Atypical Histone Methylation Recognition Mechanism to Human Mental-Retardation Syndrome. Nat. Struct. Mol. Biol. 2011, 18, 769–776. [Google Scholar] [CrossRef] [PubMed]
  89. Rajakumara, E.; Wang, Z.; Ma, H.; Hu, L.; Chen, H.; Lin, Y.; Guo, R.; Wu, F.; Li, H.; Lan, F.; et al. PHD Finger Recognition of Unmodified Histone H3R2 Links UHRF1 to Regulation of Euchromatic Gene Expression. Mol. Cell 2011, 43, 275–284. [Google Scholar] [CrossRef]
  90. Tsai, W.-W.; Wang, Z.; Yiu, T.T.; Akdemir, K.C.; Xia, W.; Winter, S.; Tsai, C.-Y.; Shi, X.; Schwarzer, D.; Plunkett, W.; et al. TRIM24 Links a Non-Canonical Histone Signature to Breast Cancer. Nature 2010, 468, 927–932. [Google Scholar] [CrossRef]
  91. Chignola, F.; Gaetani, M.; Rebane, A.; Org, T.; Mollica, L.; Zucchelli, C.; Spitaleri, A.; Mannella, V.; Peterson, P.; Musco, G. The Solution Structure of the First PHD Finger of Autoimmune Regulator in Complex with Non-Modified Histone H3 Tail Reveals the Antagonistic Role of H3R2 Methylation. Nucleic Acids Res. 2009, 37, 2951–2961. [Google Scholar] [CrossRef] [PubMed]
  92. Zhang, Y.; Yang, H.; Guo, X.; Rong, N.; Song, Y.; Xu, Y.; Lan, W.; Zhang, X.; Liu, M.; Xu, Y.; et al. The PHD1 Finger of KDM5B Recognizes Unmodified H3K4 during the Demethylation of Histone H3K4me2/3 by KDM5B. Protein Cell 2014, 5, 837–850. [Google Scholar] [CrossRef] [PubMed]
  93. Zhang, Y.; Tao, H.; Huang, S.-Y. Dynamics and Mechanisms in the Recruitment and Transference of Histone Chaperone CIA/ASF1. International Journal of Molecular Sciences 2019, 20, 3325. [Google Scholar] [CrossRef] [PubMed]
  94. Zsidó, B.Z.; Bayarsaikhan, B.; Börzsei, R.; Hetényi, C. Construction of Histone–Protein Complex Structures by Peptide Growing. International Journal of Molecular Sciences 2023, 24, 13831. [Google Scholar] [CrossRef] [PubMed]
  95. Antunes, D.A.; Devaurs, D.; Kavraki, L.E. Understanding the Challenges of Protein Flexibility in Drug Design. Expert Opin Drug Discov 2015, 10, 1301–1313. [Google Scholar] [CrossRef] [PubMed]
  96. Du, X.; Li, Y.; Xia, Y.-L.; Ai, S.-M.; Liang, J.; Sang, P.; Ji, X.-L.; Liu, S.-Q. Insights into Protein-Ligand Interactions: Mechanisms, Models, and Methods. Int J Mol Sci 2016, 17, 144. [Google Scholar] [CrossRef] [PubMed]
  97. Hauser, A.S.; Windshügel, B. LEADS-PEP: A Benchmark Data Set for Assessment of Peptide Docking Performance. J Chem Inf Model 2016, 56, 188–200. [Google Scholar] [CrossRef] [PubMed]
  98. Liu, Y.; Qin, S.; Chen, T.-Y.; Lei, M.; Dhar, S.S.; Ho, J.C.; Dong, A.; Loppnau, P.; Li, Y.; Lee, M.G.; et al. Structural Insights into Trans-Histone Regulation of H3K4 Methylation by Unique Histone H4 Binding of MLL3/4. Nat Commun 2019, 10, 36. [Google Scholar] [CrossRef] [PubMed]
  99. Rentzsch, R.; Renard, B.Y. Docking Small Peptides Remains a Great Challenge: An Assessment Using AutoDock Vina. Brief. Bioinformatics 2015, 16, 1045–1056. [Google Scholar] [CrossRef]
  100. Peterson, L.X.; Roy, A.; Christoffer, C.; Terashi, G.; Kihara, D. Modeling Disordered Protein Interactions from Biophysical Principles. PLoS Comput Biol 2017, 13, e1005485. [Google Scholar] [CrossRef]
  101. Alam, N.; Goldstein, O.; Xia, B.; Porter, K.A.; Kozakov, D.; Schueler-Furman, O. High-Resolution Global Peptide-Protein Docking Using Fragments-Based PIPER-FlexPepDock. PLoS Comput. Biol. 2017, 13, e1005905. [Google Scholar] [CrossRef] [PubMed]
  102. Kurcinski, M.; Jamroz, M.; Blaszczyk, M.; Kolinski, A.; Kmiecik, S. CABS-Dock Web Server for the Flexible Docking of Peptides to Proteins without Prior Knowledge of the Binding Site. Nucleic Acids Res. 2015, 43, W419–W424. [Google Scholar] [CrossRef] [PubMed]
  103. Morris, G.M.; Huey, R.; Lindstrom, W.; Sanner, M.F.; Belew, R.K.; Goodsell, D.S.; Olson, A.J. AutoDock4 and AutoDockTools4: Automated Docking with Selective Receptor Flexibility. J Comput Chem 2009, 30, 2785–2791. [Google Scholar] [CrossRef] [PubMed]
  104. Schneidman-Duhovny, D.; Inbar, Y.; Nussinov, R.; Wolfson, H.J. PatchDock and SymmDock: Servers for Rigid and Symmetric Docking. Nucleic Acids Res. 2005, 33, W363–W367. [Google Scholar] [CrossRef] [PubMed]
  105. Zhou, P.; Jin, B.; Li, H.; Huang, S.-Y. HPEPDOCK: A Web Server for Blind Peptide-Protein Docking Based on a Hierarchical Algorithm. Nucleic Acids Res. 2018, 46, W443–W450. [Google Scholar] [CrossRef] [PubMed]
  106. Yan, Y.; Zhang, D.; Zhou, P.; Li, B.; Huang, S.-Y. HDOCK: A Web Server for Protein-Protein and Protein-DNA/RNA Docking Based on a Hybrid Strategy. Nucleic Acids Res. 2017, 45, W365–W373. [Google Scholar] [CrossRef] [PubMed]
  107. Kozakov, D.; Brenke, R.; Comeau, S.R.; Vajda, S. PIPER: An FFT-Based Protein Docking Program with Pairwise Potentials. Proteins 2006, 65, 392–406. [Google Scholar] [CrossRef]
  108. De Vivo, M.; Masetti, M.; Bottegoni, G.; Cavalli, A. Role of Molecular Dynamics and Related Methods in Drug Discovery. J. Med. Chem. 2016, 59, 4035–4061. [Google Scholar] [CrossRef] [PubMed]
  109. Bálint, M.; Jeszenői, N.; Horváth, I.; Ábrahám, I.M.; Hetényi, C. Dynamic Changes in Binding Interaction Networks of Sex Steroids Establish Their Non-Classical Effects. Sci Rep 2017, 7, 14847. [Google Scholar] [CrossRef]
  110. Trellet, M.; Melquiond, A.S.J.; Bonvin, A.M.J.J. A Unified Conformational Selection and Induced Fit Approach to Protein-Peptide Docking. PLoS One 2013, 8, e58769. [Google Scholar] [CrossRef]
  111. de Vries, S.J.; Rey, J.; Schindler, C.E.M.; Zacharias, M.; Tuffery, P. The pepATTRACT Web Server for Blind, Large-Scale Peptide-Protein Docking. Nucleic Acids Res 2017, 45, W361–W364. [Google Scholar] [CrossRef] [PubMed]
  112. Schindler, C.E.M.; de Vries, S.J.; Zacharias, M. Fully Blind Peptide-Protein Docking with pepATTRACT. Structure 2015, 23, 1507–1515. [Google Scholar] [CrossRef] [PubMed]
  113. Lamothe, G.; Malliavin, T.E. Re-TAMD: Exploring Interactions between H3 Peptide and YEATS Domain Using Enhanced Sampling. BMC Struct Biol 2018, 18, 4. [Google Scholar] [CrossRef]
  114. Cuendet, M.A.; Zoete, V.; Michielin, O. How T Cell Receptors Interact with Peptide-MHCs: A Multiple Steered Molecular Dynamics Study. Proteins 2011, 79, 3007–3024. [Google Scholar] [CrossRef] [PubMed]
  115. Sheik Amamuddy, O.; Veldman, W.; Manyumwa, C.; Khairallah, A.; Agajanian, S.; Oluyemi, O.; Verkhivker, G.M.; Tastan Bishop, Ö. Integrated Computational Approaches and Tools for Allosteric Drug Discovery. Int J Mol Sci 2020, 21, 847. [Google Scholar] [CrossRef]
  116. Porter, K.A.; Xia, B.; Beglov, D.; Bohnuud, T.; Alam, N.; Schueler-Furman, O.; Kozakov, D. ClusPro PeptiDock: Efficient Global Docking of Peptide Recognition Motifs Using FFT. Bioinformatics 2017, 33, 3299–3301. [Google Scholar] [CrossRef] [PubMed]
  117. Keskin, O. Binding Induced Conformational Changes of Proteins Correlate with Their Intrinsic Fluctuations: A Case Study of Antibodies. BMC Struct Biol 2007, 7, 31. [Google Scholar] [CrossRef] [PubMed]
  118. Seeliger, D.; de Groot, B.L. Conformational Transitions upon Ligand Binding: Holo-Structure Prediction from Apo Conformations. PLoS Comput Biol 2010, 6, e1000634. [Google Scholar] [CrossRef] [PubMed]
  119. Birch, L.; Murray, C.W.; Hartshorn, M.J.; Tickle, I.J.; Verdonk, M.L. Sensitivity of Molecular Docking to Induced Fit Effects in Influenza Virus Neuraminidase. J Comput Aided Mol Des 2002, 16, 855–869. [Google Scholar] [CrossRef]
  120. Erickson, J.A.; Jalaie, M.; Robertson, D.H.; Lewis, R.A.; Vieth, M. Lessons in Molecular Recognition: The Effects of Ligand and Protein Flexibility on Molecular Docking Accuracy. J Med Chem 2004, 47, 45–55. [Google Scholar] [CrossRef]
  121. Gervasoni, S.; Guccione, C.; Fanti, V.; Bosin, A.; Cappellini, G.; Golosio, B.; Ruggerone, P.; Malloci, G. Molecular Simulations of SSTR2 Dynamics and Interaction with Ligands. Sci Rep 2023, 13, 4768. [Google Scholar] [CrossRef]
  122. Neduva, V.; Linding, R.; Su-Angrand, I.; Stark, A.; de Masi, F.; Gibson, T.J.; Lewis, J.; Serrano, L.; Russell, R.B. Systematic Discovery of New Recognition Peptides Mediating Protein Interaction Networks. PLoS Biol 2005, 3, e405. [Google Scholar] [CrossRef] [PubMed]
  123. Puntervoll, P.; Linding, R.; Gemünd, C.; Chabanis-Davidson, S.; Mattingsdal, M.; Cameron, S.; Martin, D.M.A.; Ausiello, G.; Brannetti, B.; Costantini, A.; et al. ELM Server: A New Resource for Investigating Short Functional Sites in Modular Eukaryotic Proteins. Nucleic Acids Res 2003, 31, 3625–3630. [Google Scholar] [CrossRef] [PubMed]
  124. Stein, A.; Pache, R.A.; Bernadó, P.; Pons, M.; Aloy, P. Dynamic Interactions of Proteins in Complex Networks: A More Structured View. FEBS J 2009, 276, 5390–5405. [Google Scholar] [CrossRef] [PubMed]
  125. Scaramozzino, D.; Khade, P.M.; Jernigan, R.L. Protein Fluctuations in Response to Random External Forces. Applied Sciences 2022, 12, 2344. [Google Scholar] [CrossRef]
  126. Dutkiewicz, Z.; Mikstacka, R. Hydration and Structural Adaptations of the Human CYP1A1, CYP1A2, and CYP1B1 Active Sites by Molecular Dynamics Simulations. International Journal of Molecular Sciences 2023, 24, 11481. [Google Scholar] [CrossRef] [PubMed]
  127. Jeszenői, N.; Horváth, I.; Bálint, M.; van der Spoel, D.; Hetényi, C. Mobility-Based Prediction of Hydration Structures of Protein Surfaces. Bioinformatics 2015, 31, 1959–1965. [Google Scholar] [CrossRef] [PubMed]
  128. Dahlström, K.M.; Salminen, T.A. Apprehensions and Emerging Solutions in ML-Based Protein Structure Prediction. Curr Opin Struct Biol 2024, 86, 102819. [Google Scholar] [CrossRef] [PubMed]
  129. Hu, X.; Maffucci, I.; Contini, A. Advances in the Treatment of Explicit Water Molecules in Docking and Binding Free Energy Calculations. Curr Med Chem 2019, 26, 7598–7622. [Google Scholar] [CrossRef]
  130. Park, H.; Lee, H.; Seok, C. High-Resolution Protein-Protein Docking by Global Optimization: Recent Advances and Future Challenges. Curr Opin Struct Biol 2015, 35, 24–31. [Google Scholar] [CrossRef]
  131. Jorgensen, W.L.; Chandrasekhar, J.; Madura, J.D.; Impey, R.W.; Klein, M.L. Comparison of Simple Potential Functions for Simulating Liquid Water. The Journal of Chemical Physics 1983, 79, 926–935. [Google Scholar] [CrossRef]
  132. Abraham, M.J.; Murtola, T.; Schulz, R.; Páll, S.; Smith, J.C.; Hess, B.; Lindahl, E. GROMACS: High Performance Molecular Simulations through Multi-Level Parallelism from Laptops to Supercomputers. SoftwareX 2015, 1–2, 19–25. [Google Scholar] [CrossRef]
  133. Lindorff-Larsen, K.; Piana, S.; Palmo, K.; Maragakis, P.; Klepeis, J.L.; Dror, R.O.; Shaw, D.E. Improved Side-Chain Torsion Potentials for the Amber ff99SB Protein Force Field. Proteins 2010, 78, 1950–1958. [Google Scholar] [CrossRef] [PubMed]
  134. Bussi, G.; Donadio, D.; Parrinello, M. Canonical Sampling through Velocity Rescaling. J Chem Phys 2007, 126, 014101. [Google Scholar] [CrossRef] [PubMed]
  135. Darden, T.; York, D.; Pedersen, L. Particle Mesh Ewald: An N⋅log(N) Method for Ewald Sums in Large Systems. The Journal of Chemical Physics 1993, 98, 10089–10092. [Google Scholar] [CrossRef]
  136. Nosé, S.; Klein, M.L. Constant Pressure Molecular Dynamics for Molecular Systems. Molecular Physics 1983, 50, 1055–1076. [Google Scholar] [CrossRef]
  137. Parrinello, M.; Rahman, A. Polymorphic Transitions in Single Crystals: A New Molecular Dynamics Method. Journal of Applied Physics 1981, 52, 7182–7190. [Google Scholar] [CrossRef]
  138. Hess, B. P-LINCS:  A Parallel Linear Constraint Solver for Molecular Simulation. J Chem Theory Comput 2008, 4, 116–122. [Google Scholar] [CrossRef] [PubMed]
  139. Hess, B.; Bekker, H.; Berendsen, H.J.C.; Fraaije, J.G.E.M. LINCS: A Linear Constraint Solver for Molecular Simulations. Journal of Computational Chemistry 1997, 18, 1463–1472. [Google Scholar] [CrossRef]
  140. DeLano, W.L. The PyMOL Molecular Graphics System, Version 2.0; Schrödinger, LLC.: New York, NY, USA, 2021. [Google Scholar]
  141. Gasteiger, J.; Marsili, M. Iterative Partial Equalization of Orbital Electronegativity—a Rapid Access to Atomic Charges. Tetrahedron 1980, 36, 3219–3228. [Google Scholar] [CrossRef]
  142. O’Boyle, N.M.; Banck, M.; James, C.A.; Morley, C.; Vandermeersch, T.; Hutchison, G.R. Open Babel: An Open Chemical Toolbox. Journal of Cheminformatics 2011, 3, 33. [Google Scholar] [CrossRef] [PubMed]
  143. Wang, J.; Cieplak, P.; Li, J.; Cai, Q.; Hsieh, M.-J.; Luo, R.; Duan, Y. Development of Polarizable Models for Molecular Mechanical Calculations. 4. van Der Waals Parametrization. J Phys Chem B 2012, 116, 7088–7101. [Google Scholar] [CrossRef] [PubMed]
  144. Mehler, E.L.; Solmajer, T. Electrostatic Effects in Proteins: Comparison of Dielectric and Charge Models. Protein Engineering, Design and Selection 1991, 4, 903–910. [Google Scholar] [CrossRef] [PubMed]
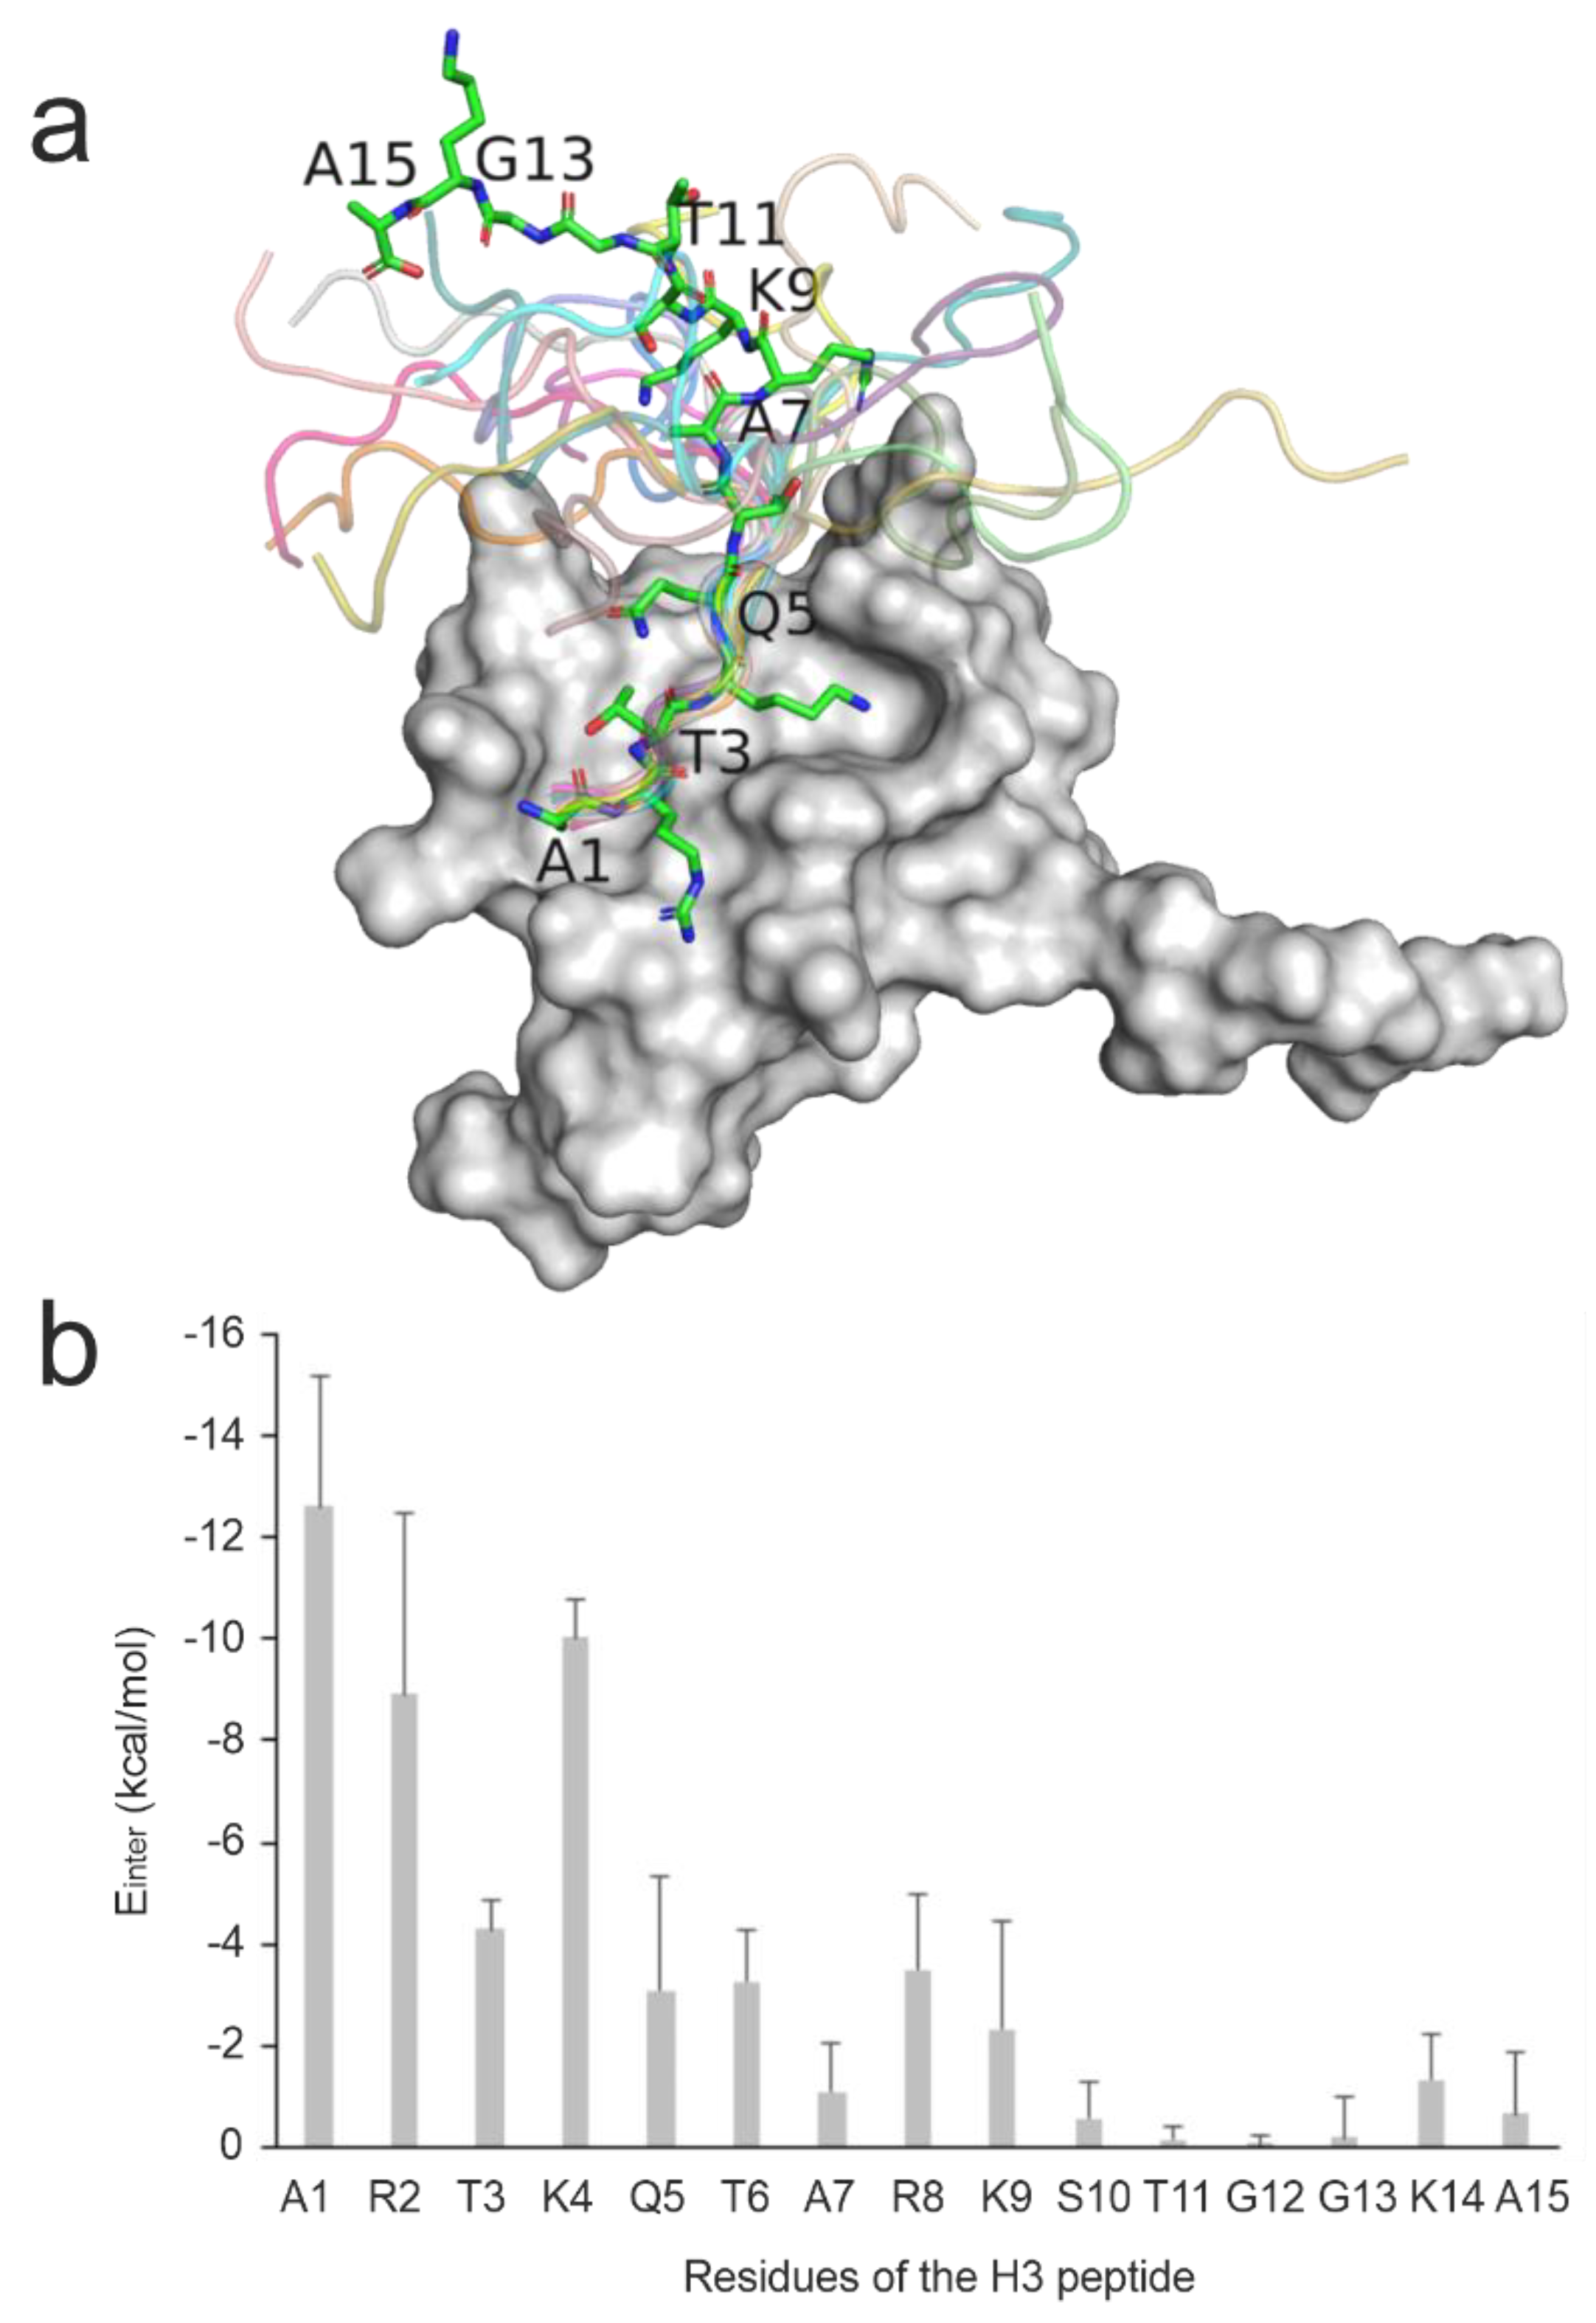
Figure 1. Structural and per-residue energetic analysis of histone H3 peptide bound to reader protein. (a) NMR solution structure of the BPTF PHD finger domain (grey surface, PDB ID 2fui) in complex with a histone H3 peptide in which the peptide structure in the first model is shown in sticks representation while the remaining models are shown in cartoon representation. (b) The mean (columns) and standard deviations (error bars) of Einter values of all 20 NMR models calculated for the peptide respective residues upon a brief energy-minimization.
Preprints 104881 g001
Figure 2. Parameters of the MD refinement protocols.
Preprints 104881 g002
Figure 3. General performance of the MD-refinement protocols. Empty bars indicate the median ΔRMSD (%) obtained by each protocol for the set of Systems in Table 1 and the number on top shows the largest ΔRMSD (%) of the protocol. ΔRMSD (%) was calculated according to Equation 3 (Methods). The full bars indicate the number of systems that have any improvement (ΔRMSD ≥ 0.1 Å) in a protocol and the number on top shows the number of systems with large improvements (ΔRMSD ≥ 1 Å).
Preprints 104881 g003
Figure 4. A successful MD refinement of the docked binding mode of ATRX ADD domain – histone H3 peptide complex (System 3qln) using Protocol P4. The upper plot shows the trend of RMSD of the peptide ligand and the ATRX ADD domain-peptide interaction energy (Einter). The best match with the experimental reference binding mode of the ligand (RMSDbest = 3.68 Å) was achieved after 14 ns and stabilized in the rest of the protocol. The different steps of the MD protocol are divided by a dashed line separating the first 10 ns initial MD followed by 30 ns of SA simulation. Representative structures of the complexes are shown at the top, where the experimental reference histone conformation is shown in red sticks and the starting (t=0 ns, docked) peptide conformation, and after SA MD simulation (t=40 ns) are shown in teal sticks. (See also Movie S1 with more details on the dynamic changes.).
Preprints 104881 g004
Figure 5. Correlations between RMSDstart and ΔRMSD (Protocol P4 with apo target) calculated for the full ligand (a), and for the N-terminal five amino acids (b). Correlations between Einter calculated for residue R2 (initial structures) and ΔRMSD (%) calculated for full ligands (c) and for the N-terminal five amino acids (d). The data points correspond to the respective systems in Table 1.
Preprints 104881 g005
Figure 6. Comparison of ligand binding modes produced with and without the pre-MD hydration step (Protocol P4, System 3o33) Target, MD-refined, and experimental reference ligand structures are depicted as grey surface, cyan and red sticks, respectively (a). The close-up of the surrounding of ligand residue K4 (b) marked by dashed boxes at the top. Three bridging water molecules can be observed if pre-MD hydration was applied, while only one water bridge was formed at a wrongly found pocket without pre-MD hydration (b).
Preprints 104881 g006
Table 1. The target-histone H3 peptide systems.
PDB ID (Apo) Res
(Å)
PDB ID (Holo) Res
(Å)
Target Histone H3 peptide sequence1 Kd
(µM)
RMSDstart (Å)
1xwh NMR2 2ke1 NMR2 AIRE PHD finger ARTKQTARKS 6.5 8.56
2fui NMR2 2fuu NMR2 BPTF PHD finger ARTKQTARKSTGGKA 2.7 17.75
2gnq 1.8 2co0 2.25 WDR5 ARTKQTARKSTGGKA 3.3 8.21
2mny NMR2 2mnz NMR2 KDM5B PHD1 finger ARTKQTARKS 6.4 18.33
2pv0 3.3 2pvc 3.69 DNMT3L ARTKQTA 2.1 9.51
3o33 2.0 3o37 2.0 TRIM24 PHD-Bromo complex ARTKQTARKS 8.6 27.18
3qln 1.90 3qlc 2.5 ARTX ADD ARTKQTARKSTGGKA 3.7 13.28
3sox 2.65 3sou 1.8 UHRF1 PHD finger ARTKQTARK 2.1 10.32
4ljn 3.0 4lk9 1.6 MOZ double PHD finger ARTKQTARKSTGGKAPRKQLA - 15.02
4qf2 1.7 4q6f 1.91 BAZ2A PHD Zinc finger ARTKQ 2.51 9.99
1 Experimentally determined portions of the amino acid sequences of the histone tails are underlined. 2 For complex structures determined by NMR, peptide structures from their first model were used as reference structures during RMSD calculations.
Disclaimer/Publisher’s Note: The statements, opinions and data contained in all publications are solely those of the individual author(s) and contributor(s) and not of MDPI and/or the editor(s). MDPI and/or the editor(s) disclaim responsibility for any injury to people or property resulting from any ideas, methods, instructions or products referred to in the content.
Copyright: This open access article is published under a Creative Commons CC BY 4.0 license, which permit the free download, distribution, and reuse, provided that the author and preprint are cited in any reuse.
Prerpints.org logo

Preprints.org is a free preprint server supported by MDPI in Basel, Switzerland.

Subscribe

© 2024 MDPI (Basel, Switzerland) unless otherwise stated