1. Introduction
As reservoirs mature, the offshore oil and gas industry is seeing greater water cuts. The present de-oiling systems are being stressed by the increase in produced water, resulting in further oil in the untreated wastewater (Collins, 1975). During oil and gas exploration and production, produced water (PW) is the greatest effluent stream (high-salinity) that is raised from the hydrocarbon-bearing geological strata (Jepsen et al., 2018; Ali, A. et al., 2024). It is a combination of formation water, which is seawater or freshwater that has been encased in ice hydrocarbons in a highly permeable reservoir conduit for millions of years, injection water, and small amounts of condensed water from gas production (Collins, 1975; Lirette, A. O. et al., 2024). The elements of produced water are divided into organic and inorganic substances and include dissolved and dispersed oils, grease, metals, radioactive elements, treatment chemicals, formation solids, salts, dissolved gases, scaling products, lubricants, microbes, and chemical oxygen demand (Hayes, Tom, and Dan Arthur, 2004; Judd et al., 2014). Multiple separation steps of de-oiling units are typical in produced water technologies, and each sub-system impacts the others (Yang et al., 2014). As a result, it is critical to include total system behavior in control strategies, often known as plant-wide control (Yang et al., 2016; Arora, J. et al., 2024).
Gas flotation, hydrocyclone, membrane separation, and gravity-based separators are the most commonly utilized technologies in the oil and gas industry for water purification and oil removal (Coca-Prados et al., 2010). Whereas these methods provide adequate oil and water segregation to meet existing regulations, a growing environmental concern may compel enforcement to become more stringent (Jepsen et al., 2018). However, some of the produced water treatment technologies are ineffective at removing dissolved organic components, including aromatics in the dissolved water phase (Igunnu and Chen, 2014).
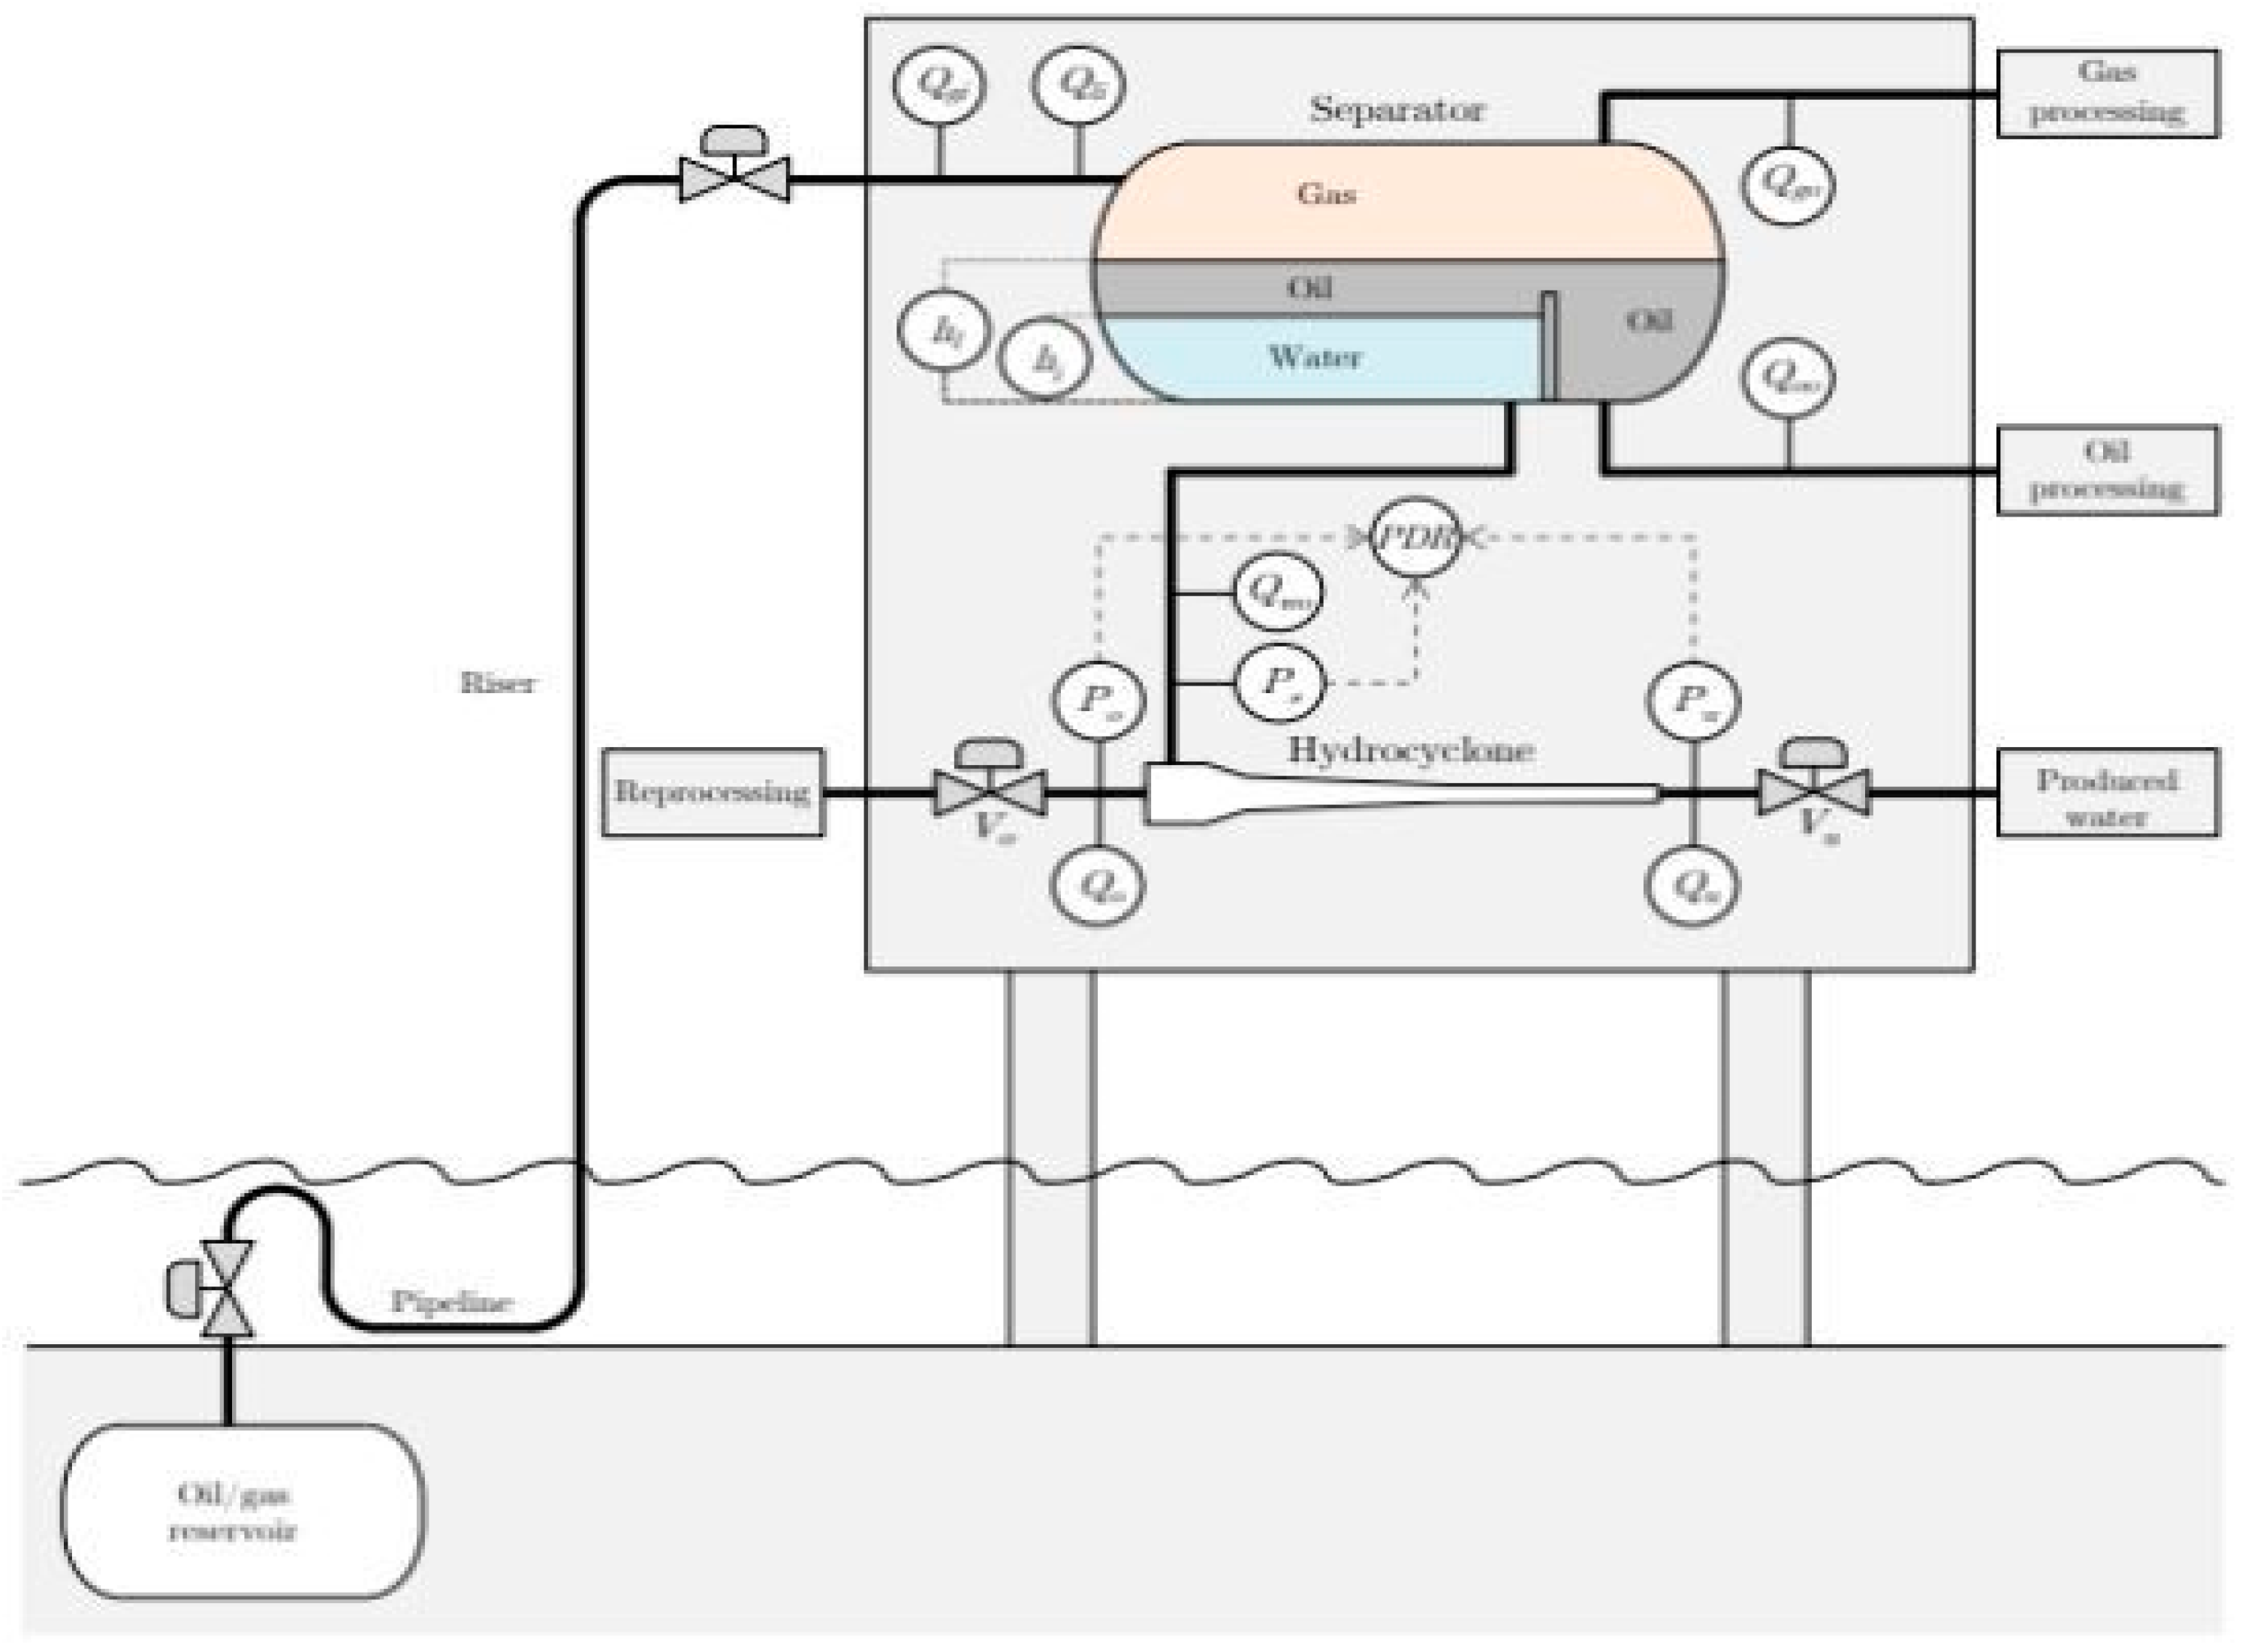
Figure 1 (Bram, 2020) depicts a typical offshore de-oiling produced water technology process (Fakhru'l-Razi et al., 2009), in which a mixture of oil, gas, and water enters various phases of multiple separator tanks. The extracted oil and gas are then dispatched to be processed further, while the water is purified further using various produced water technologies to extract dispersed oil droplets (
Mohamed, M., et al., 2024).
Modeling and control of produced water technologies has piqued the interest of numerous researchers in the oil and gas industry to profound positive and save costs during the operation of plants (Durdevic et al., 2017). Furthermore, chemical and biological interactions between processes, the particular nature of bacteria, a disorder of concentrations, and dynamic rates of flow make produced water treatment systems complicated (Durdevic et al., 2017; Obiuto, N. C. et al., 2024).
The methods for boosting a plant's profitability and efficiency are advanced process control (APC) and real-time optimization by maintaining a process at specified operating parameters while considering process constraints. The most well-known and efficient methodologies for real-time optimization and advanced control setup for produced water de-oiling technologies include fuzzy logic control, statistical control, and model predictive control (Amin, 2016; Khaled, M. S., 2020). However, the development in those control and optimization processes is thoroughly reviewed in the next sections of this review paper. In addition, the following sections provide a detailed overview of recent advancements in control loops and their configurations.
2. Freshwater Challenges in Oil and Gas Operations
Freshwater is a critical commodity in oil and gas activities, such as well-fracturing. Chemicals are forced down holes under high water pressure during a fracking operation. Produced water is the water that returns to the surface. Produced water must be treated to meet acceptable standards before being disposed of through injection wells or saltwater disposal facilities (Durdevic et al., 2017; Al Ismaili, S., 2024).
The first challenge that oil and gas companies encounter is a lack of a reliable supply of fresh water to continue operations. Freshwater is already scarce in numerous essential areas, including irrigation, agriculture, and industry, making it difficult to procure. Furthermore, current local water sources cannot always offer enough water to sustain fracturing operations, which might need millions of gallons of water each day. As a result, these water resources are insufficient (Igunnu et al., 2014; Hardberger, A., 2024).
3. Produced Water Use and Treatment in Oil and Gas Exploration
More operators are pursuing alternate methods and technology intended to treat produced and flow back water at the wellhead and recover and restore water for reuse in drilling or fracturing operations to solve these challenges. A system that can treat complicated generated water helps reduce the requirement for fresh water by recycling water suited for downhole fracturing. This removes the need to bring fresh water to the wellheads and high TDS-saturated brine water to disposal facilities (Amin, 2016).
In addition, rising oil and gas activity has resulted in greater saltwater intrusion in injection wells, resulting in higher total dissolved solids (TDS) levels. Due to its density and strong pressure, saltwater may readily penetrate freshwater aquifers and pose a contamination risk. Injection wells reach saturation limitations after repeated injections, and rules require operators to treat brine concentrations before injecting, adding complexity, time, and cost to the operation. In 2006, the globe used 85 million barrels of oil per day, and it is anticipated to reach 106.6 million barrels by 2030 (Igunnu et al., 2014). Despite its importance, oil and gas production generates huge amounts of waste, with generated water accounting for over 80% of liquid waste in older oilfields. Oil/water volume ratio is usually 1:3 (Fakhru'l-Razi A et al., 2009). Produced water is a byproduct of oil and gas exploration and production. Flowback operation generates produced water by recovering fluid used to hydraulically fracture a shale deposit from the well at the surface. Flowback typically lasts 30–120 days (Dopico, 2019). This complex combination of oil/organics, suspended particles, dissolved solids, and chemicals utilized in the manufacturing process is produced water. Produced water must be treated to meet acceptable levels before being injected into wells or reused in the oil and gas production process (Murphy, 2018).
Water quality is crucial to maximize recovery and reduce environmental damage. Oil and gas companies are concerned about protecting their wells, cutting costs, protecting downstream equipment, and reducing safety and environmental hazards. As a result, the industry is focused on reducing water usage, increasing reuse, and recycling options, and developing water treatment technology. A typical water treatment process performs the following functions (Renfrew, D. et al., 2024):
- ➢
Removes petroleum hydrocarbons, oil, grease and solids
- ➢
Removes friction reducers and other polymer additives
- ➢
Removes inorganic scale-forming compounds
- ➢
Kills bacteria
- ➢
Removes iron (Fe)
- ➢
Removes total dissolved solids (TDS)
4. Membrane Technology
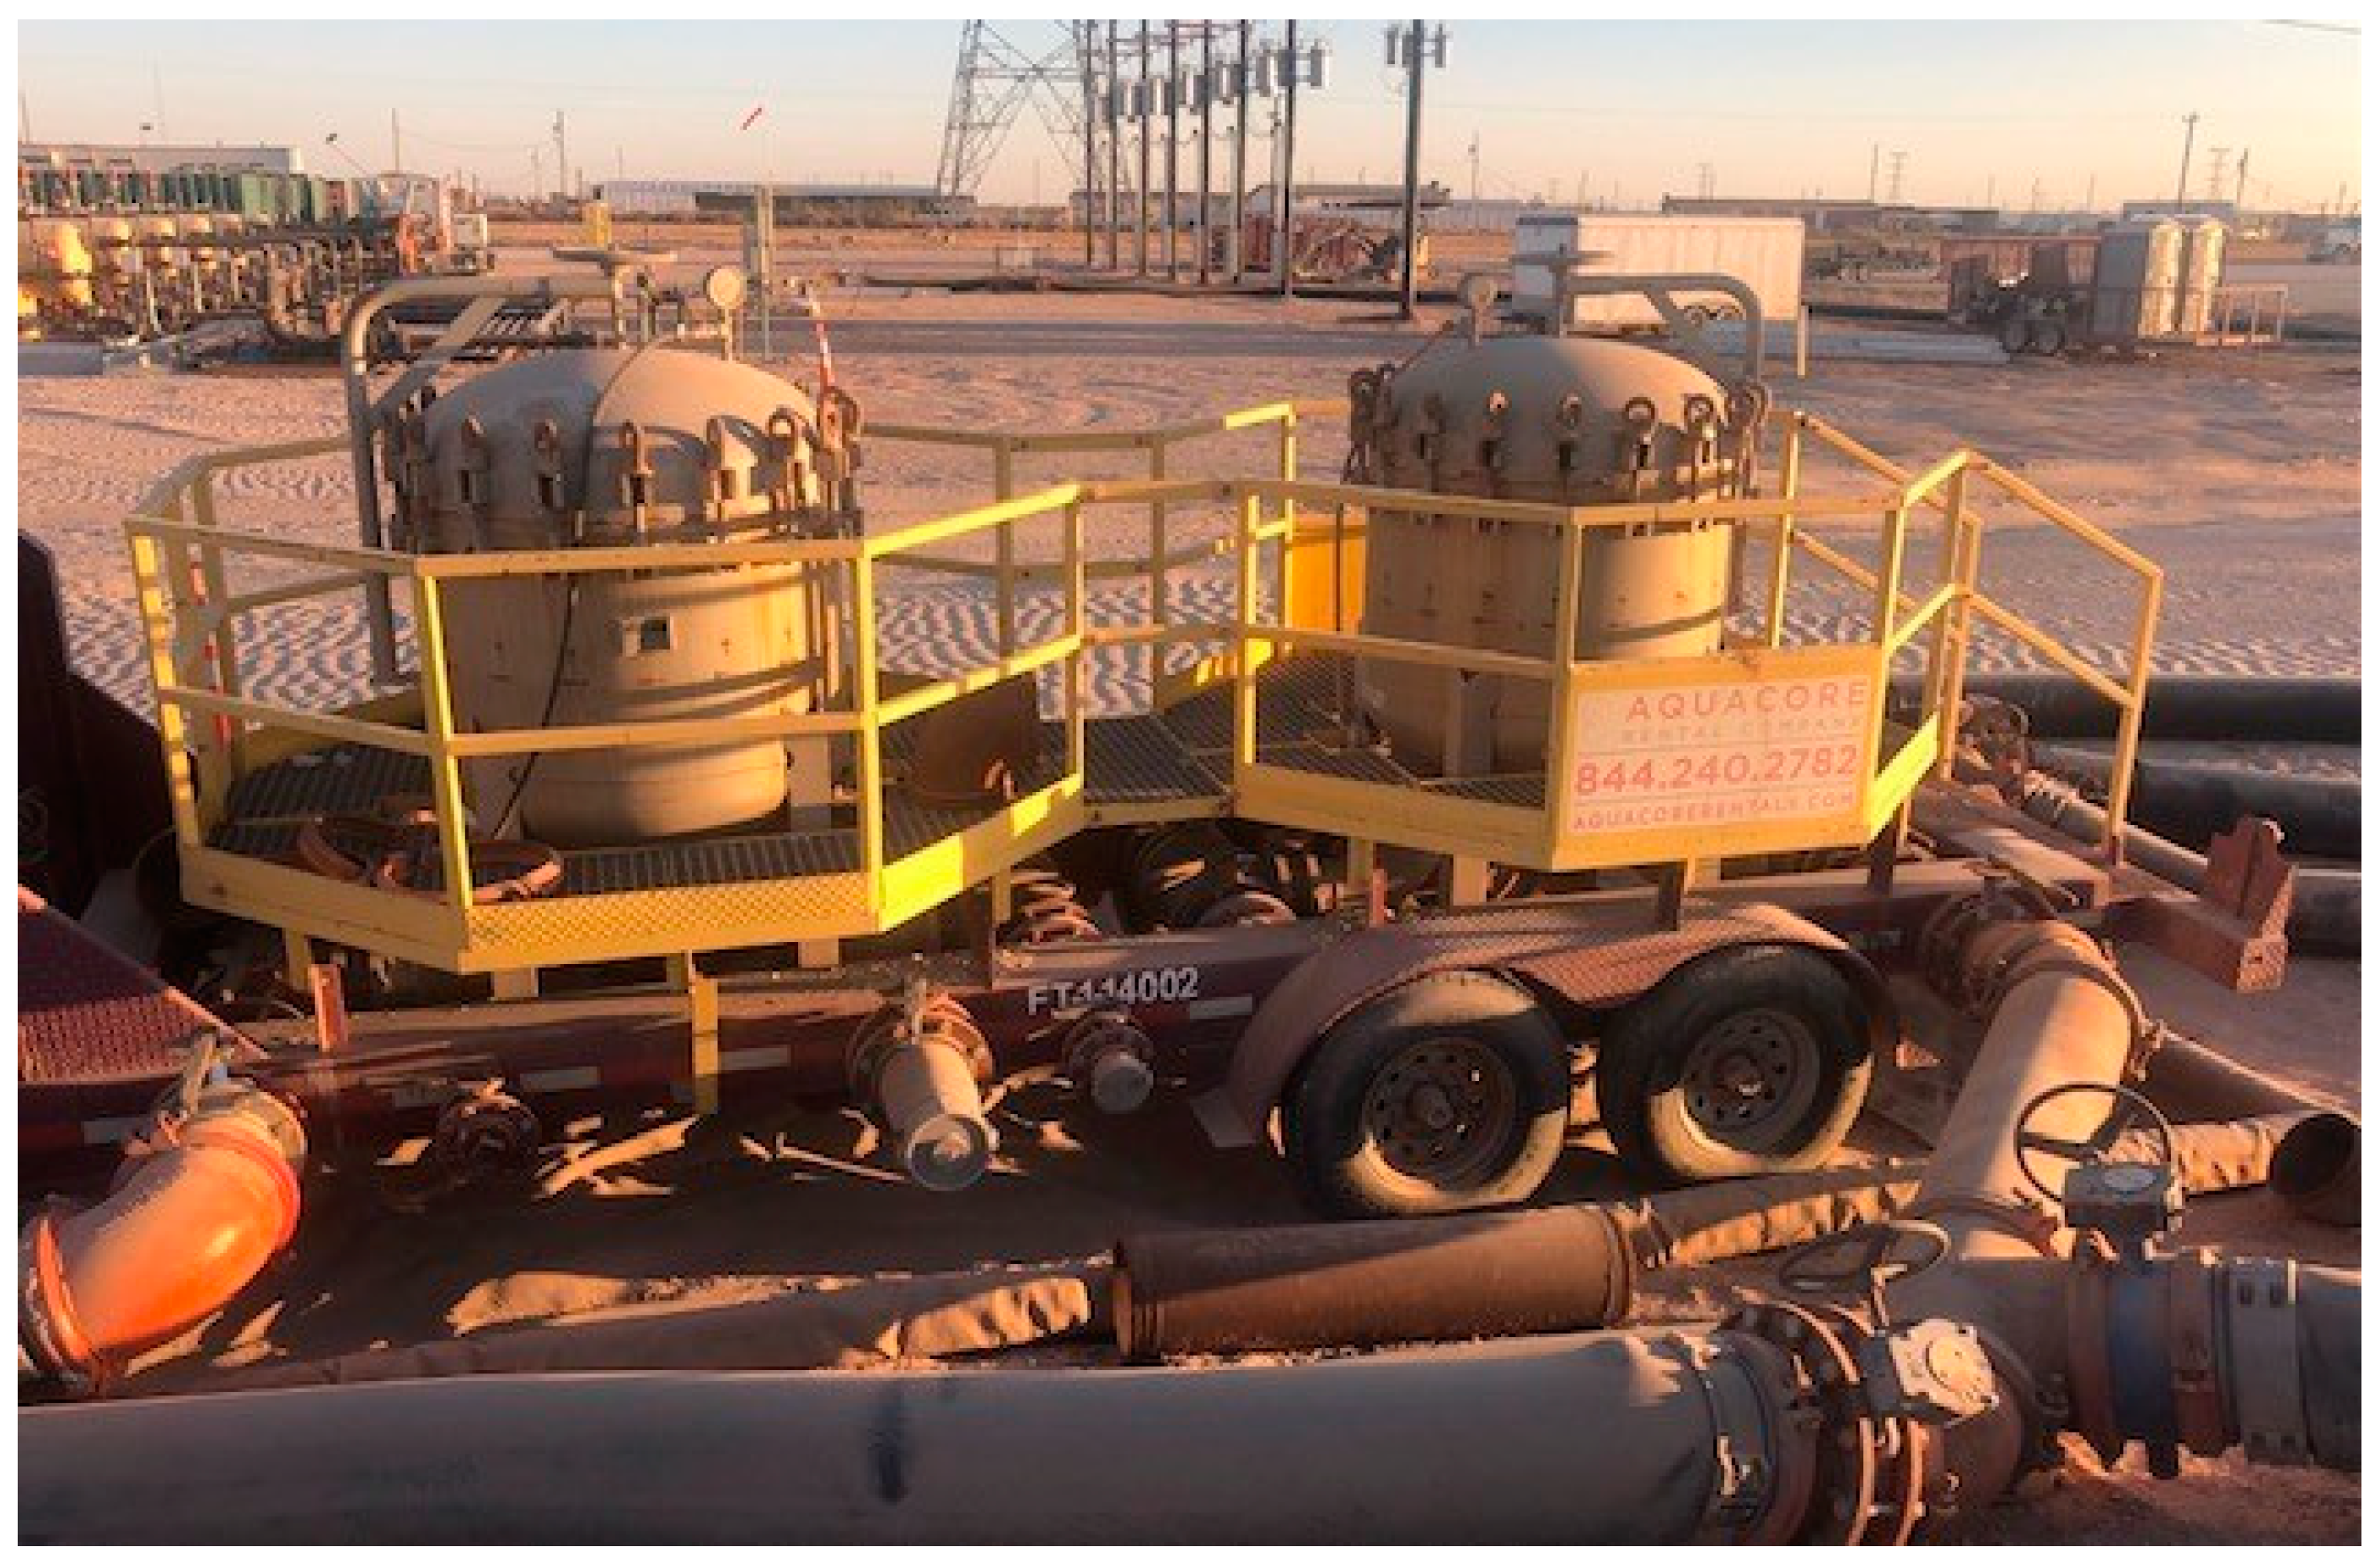
Membrane technology is used to remove suspended solids and oils from generated water. Membranes are microporous sheets with different pore sizes that selectively separate a fluid from its constituents. Membranes are categorized into four types based on their pore size: microfiltration (MF), ultrafiltration (UF), nanofiltration (NF), and reverse osmosis (RO) (Xu et al. 2006). The hydrodynamic barrier to liquid flow rises as the pore size decreases, implying that the applied pressure for membrane functioning will increase considerably as the pore size of the membrane decreases. The operating principles of MF and UF are based on convective pore-flow mechanisms, while RO is based on solution diffusion mechanisms, and the NF membrane is a hybrid of the two. Various researchers have used membrane technology to accomplish various separations in generated water treatment. Membrane technology (
Figure 2) is used to treat generated water in a variety of ways, ranging from moderate treatment aimed at eliminating suspended particles and oil to desalination. This method provides better-quality water with reduced sludge production (Olajire, 2020).
4.1. Microfiltration
Microfiltration is successful in removing suspended particles and turbidity from wastewater. To obtain the required permeate quality, the microfiltration process was combined with pre-treatment and post-treatment processes to minimize membrane fouling. Microfiltration has also been utilized as a pre-treatment phase for other membrane operations such as ultrafiltration (UF) and nanofiltration (NF) for the purification of generated water and the removal of oil from wastewater before ultimate discharge or treatment (Lee. Et al., 2015; Rajbongshi, A. et al., 2024).
4.2. Reverse Osmosis
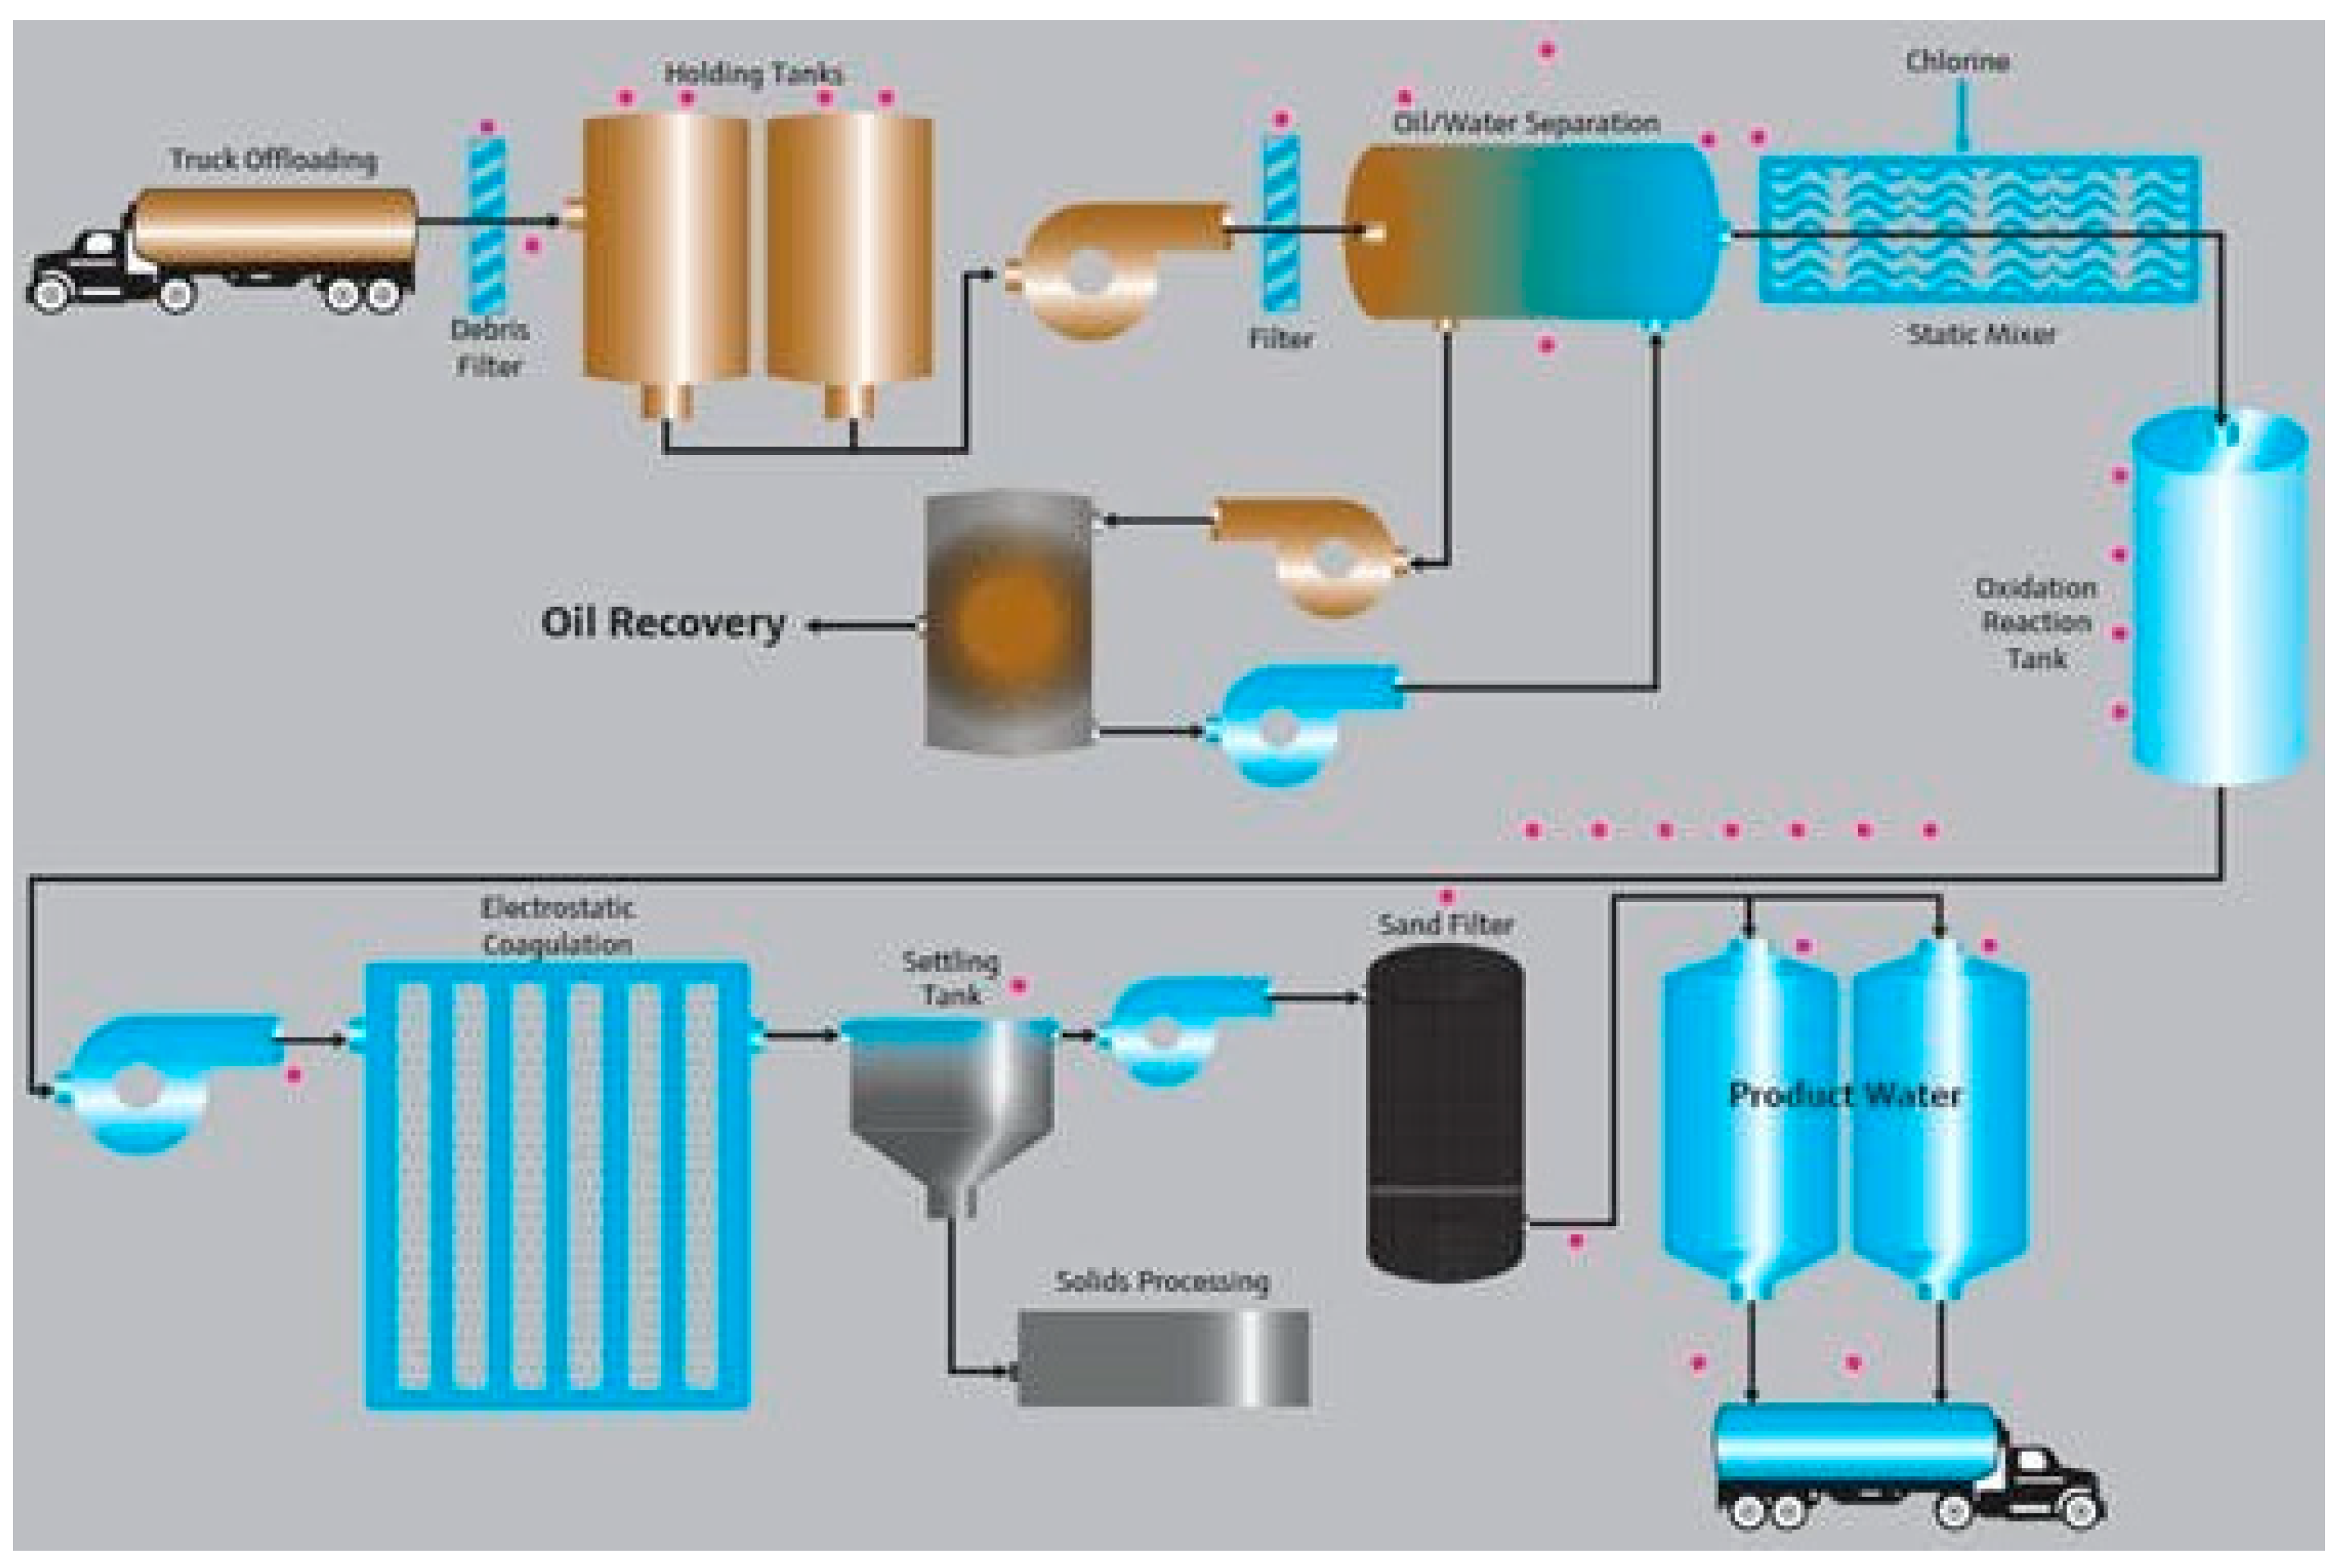
Reverse osmosis includes extracting groundwater and passing it through a procedure that eliminates all of the water's minerals and deionizes it, making it acceptable for reuse in oil and gas production. This method is utilized in desalinization, which is the process of converting generated water into clean, fresh water. Reverse osmosis removes salt from ocean water, leaving clean water that may be reused in the oil and gas industry. Reverse osmosis may also be used in wastewater treatment and can help recycle water to make it clean and safe again (
Figure 3) (Olajire, 2020).
5. Produced Water Treatment
Multiple parameters may need to be monitored in the final water;
- ➢
Iron
- ➢
Conductivity
- ➢
pH , ORP
- ➢
Free Chlorine
- ➢
Temperature
- ➢
Pressure
After treatment, the water can be injected into a surface well, used for agriculture or industrial process water, or reused for hydraulic fracturing (Madhi, A. A. et al., 2024).
5.1. Iron
The amount of iron in generated water varies depending on geology and other variables. While all generated water includes some iron, some is so high that it must be treated and continuously monitored. Iron in the final water is harmful to pipe systems if left untreated. High iron levels might decrease ultimate water utilization (Smith, 2013). An iron analyzer measures the finished product's iron content. An iron analyzer is a small photometric analysis equipment for iron measurement extensively used in drinking water and waste treatment facilities. (Olajire, 2020).
5.2. Conductivity
Though separated at the well site, the produced water still contains considerable amounts of crude oil. Oil included in produced water that is transported to the processing plant must be removed as effectively as feasible. The conductivity of oil and water is markedly different. The conductivity of the generated water after the oil/water separation process is used to determine the separation efficiency (Smith, 2013). This is determined using a toroidal conductivity analyzer. Conductivity is also tested after the water has been disinfected to assist in determining the amount of dissolved iron in the water. As the disinfected water exits the process, the iron in the water begins to agglomerate and initiate the precipitation process. Conductivity sensors may be utilized in conjunction with pH and ORP sensors through a single controller (Khurshid, A. A. et al., 2024).
5.3. Total Dissolved Solids
Total dissolved solid data derived from conductivity may be used to determine the necessary dilution factor for further water quality study (Olajire, 2020).
5.3.1. Biocide Addition (Chlorine) or Sodium Hypochlorite Addition
The bacteria levels in the produced water vary. Chlorine is widely used to disinfect water to kill bacteria. In addition to its disinfectant properties, chlorine's oxidation process causes iron to precipitate out of the generated water. Monitoring chlorine levels ensures that the appropriate amount of chlorine is maintained. The chlorination procedure also involves the measurement of ORP, conductivity, and pH. To provide an accurate chlorine measurement, a full chlorine monitoring system incorporates the chlorine sensor, pH, and flow cell (Khurshid, A. A., et al., 2024).
Alternatively, by adding hypochlorite to produced water, hypochlorous acid (HOCl) is formed:
Hypochlorous acid is divided into hydrochloric acid (HCl) and oxygen (O). The oxygen atom is a very strong oxidant (Lenntech, n.d). Sodium hypochlorite is effective against bacteria, viruses, and fungi that can affect the composition of the final water. Sodium hypochlorite disinfects the same way as chlorine does (Olajire, 2020).
5.4. pH and ORP
Because of the high chloride levels, acidity (pH) and ORP sensors are required. ORP is monitored before and after the addition of chlorine to ensure that the addition rate and oxidation potential are suitably controlled. Because chlorine may poison pH and ORP sensors, probes with a tiny ceramic reference junction are employed in this environment to withstand poisoning and give greater longevity. Maintaining a proper oxidation potential, pH level and chlorine level optimizes the disinfection process (Chang, G. et al., 2024).
Ceramic sensors are ideal for abrasive and corrosive environments. A ceramic sensor is used in the pH sensors, and flush-mounted ceramic pressure sensors avoid accumulation, erosion, and poisoning. Because pH and ORP sensors are readily poisoned in this application, it is critical to monitor them and be prepared to replace them as soon as possible. Endress+Hauser pH and ORP monitors with digital Memosense technology offer built-in diagnostics that identify faults and enable fouled sensors to be quickly replaced with a pre-calibrated sensor. A single transmitter may control both sensors, lowering the overall system cost and component count (Smith, 2013; Chang, G. et al., 2024).
5.5. Temperature
In the treatment of generated water for use in oil and gas applications, the temperature of the fluid is continuously monitored throughout the process. The final water temperature is checked to ensure it does not exceed set limits. Standard temperature sensors and equipment are typically adequate for generated water applications, while additional care must be taken in certain cases owing to the severe circumstances present in specific locations (Smith, 2013; Alkalbani, A. M. et al., 2024).
5.6. Pressure
Water is filtered when it enters a processing plant, goes through stages of the process, and exits final settling to clean water storage tanks. The removal of solids at different stages of the process guarantees that particles do not clog processing systems or impair vital operations. Pressure measurements are utilized throughout the filtering phases to monitor pressure differentials that might indicate a clogged or damaged filter system. The efficiency of filters may have a substantial influence on system throughput. With differential pressure (DP) monitoring, it is possible to clean and replace filters before they reach the point of failure (Pereira, J. D., 2024).
Differential pressure measurements are commonly performed using two pressure sensors and a transmitter that computes the difference between the two sensors. If a produced water plant is susceptible to environmental extremes, such as freezing in the winter, heat tracing the capillary tubes linking the two sensors to the transmitter will be required (Smith, 2013; Pereira, J. D., 2024).
6. Process Control
Process control can so easily be defined as a system of controls mainly used for mass production. Process control enables automation, ensures safety, and is energy efficient. It is all data collected from an automated control system being sent over to the hardware on-site and forwarded to the software in the central control room. Before such a system came into place individuals had to travel to each site pad to take the necessary data from this system of controls that communicate with one another to optimize production. The data collected for such a system would come from connectors, flow meters, level switches, pressure transmitters, temperature transmitters, electricity meters, and control valves are a few examples of what are referred to as end devices (Pereira, J. D., 2024).
All information gathered would be sent over to a control device hardware on site. The remote device can either be an RTU (remote terminal unit) or a PLC (programmable logic control). From this point, once all data is gathered it is sent over to a software called SCADA (supervisory control and data acquisition). Process control should not be confused with automation. Automation is the system of automated sensors that are referred to as end devices. These end devices collect vibration readings, pressure, temperature, flow rate, and levels of tanks. The sensors are all able to collect all necessary analog data. For example, if the level switch of one of the tanks is triggered an electronic signal is sent out from the remote terminal unit or programmable logic control ordering to shut off the pump connected to that tank. Automation works together with process control to ensure efficiency (
Moustafa, A. M., et al., 2024).
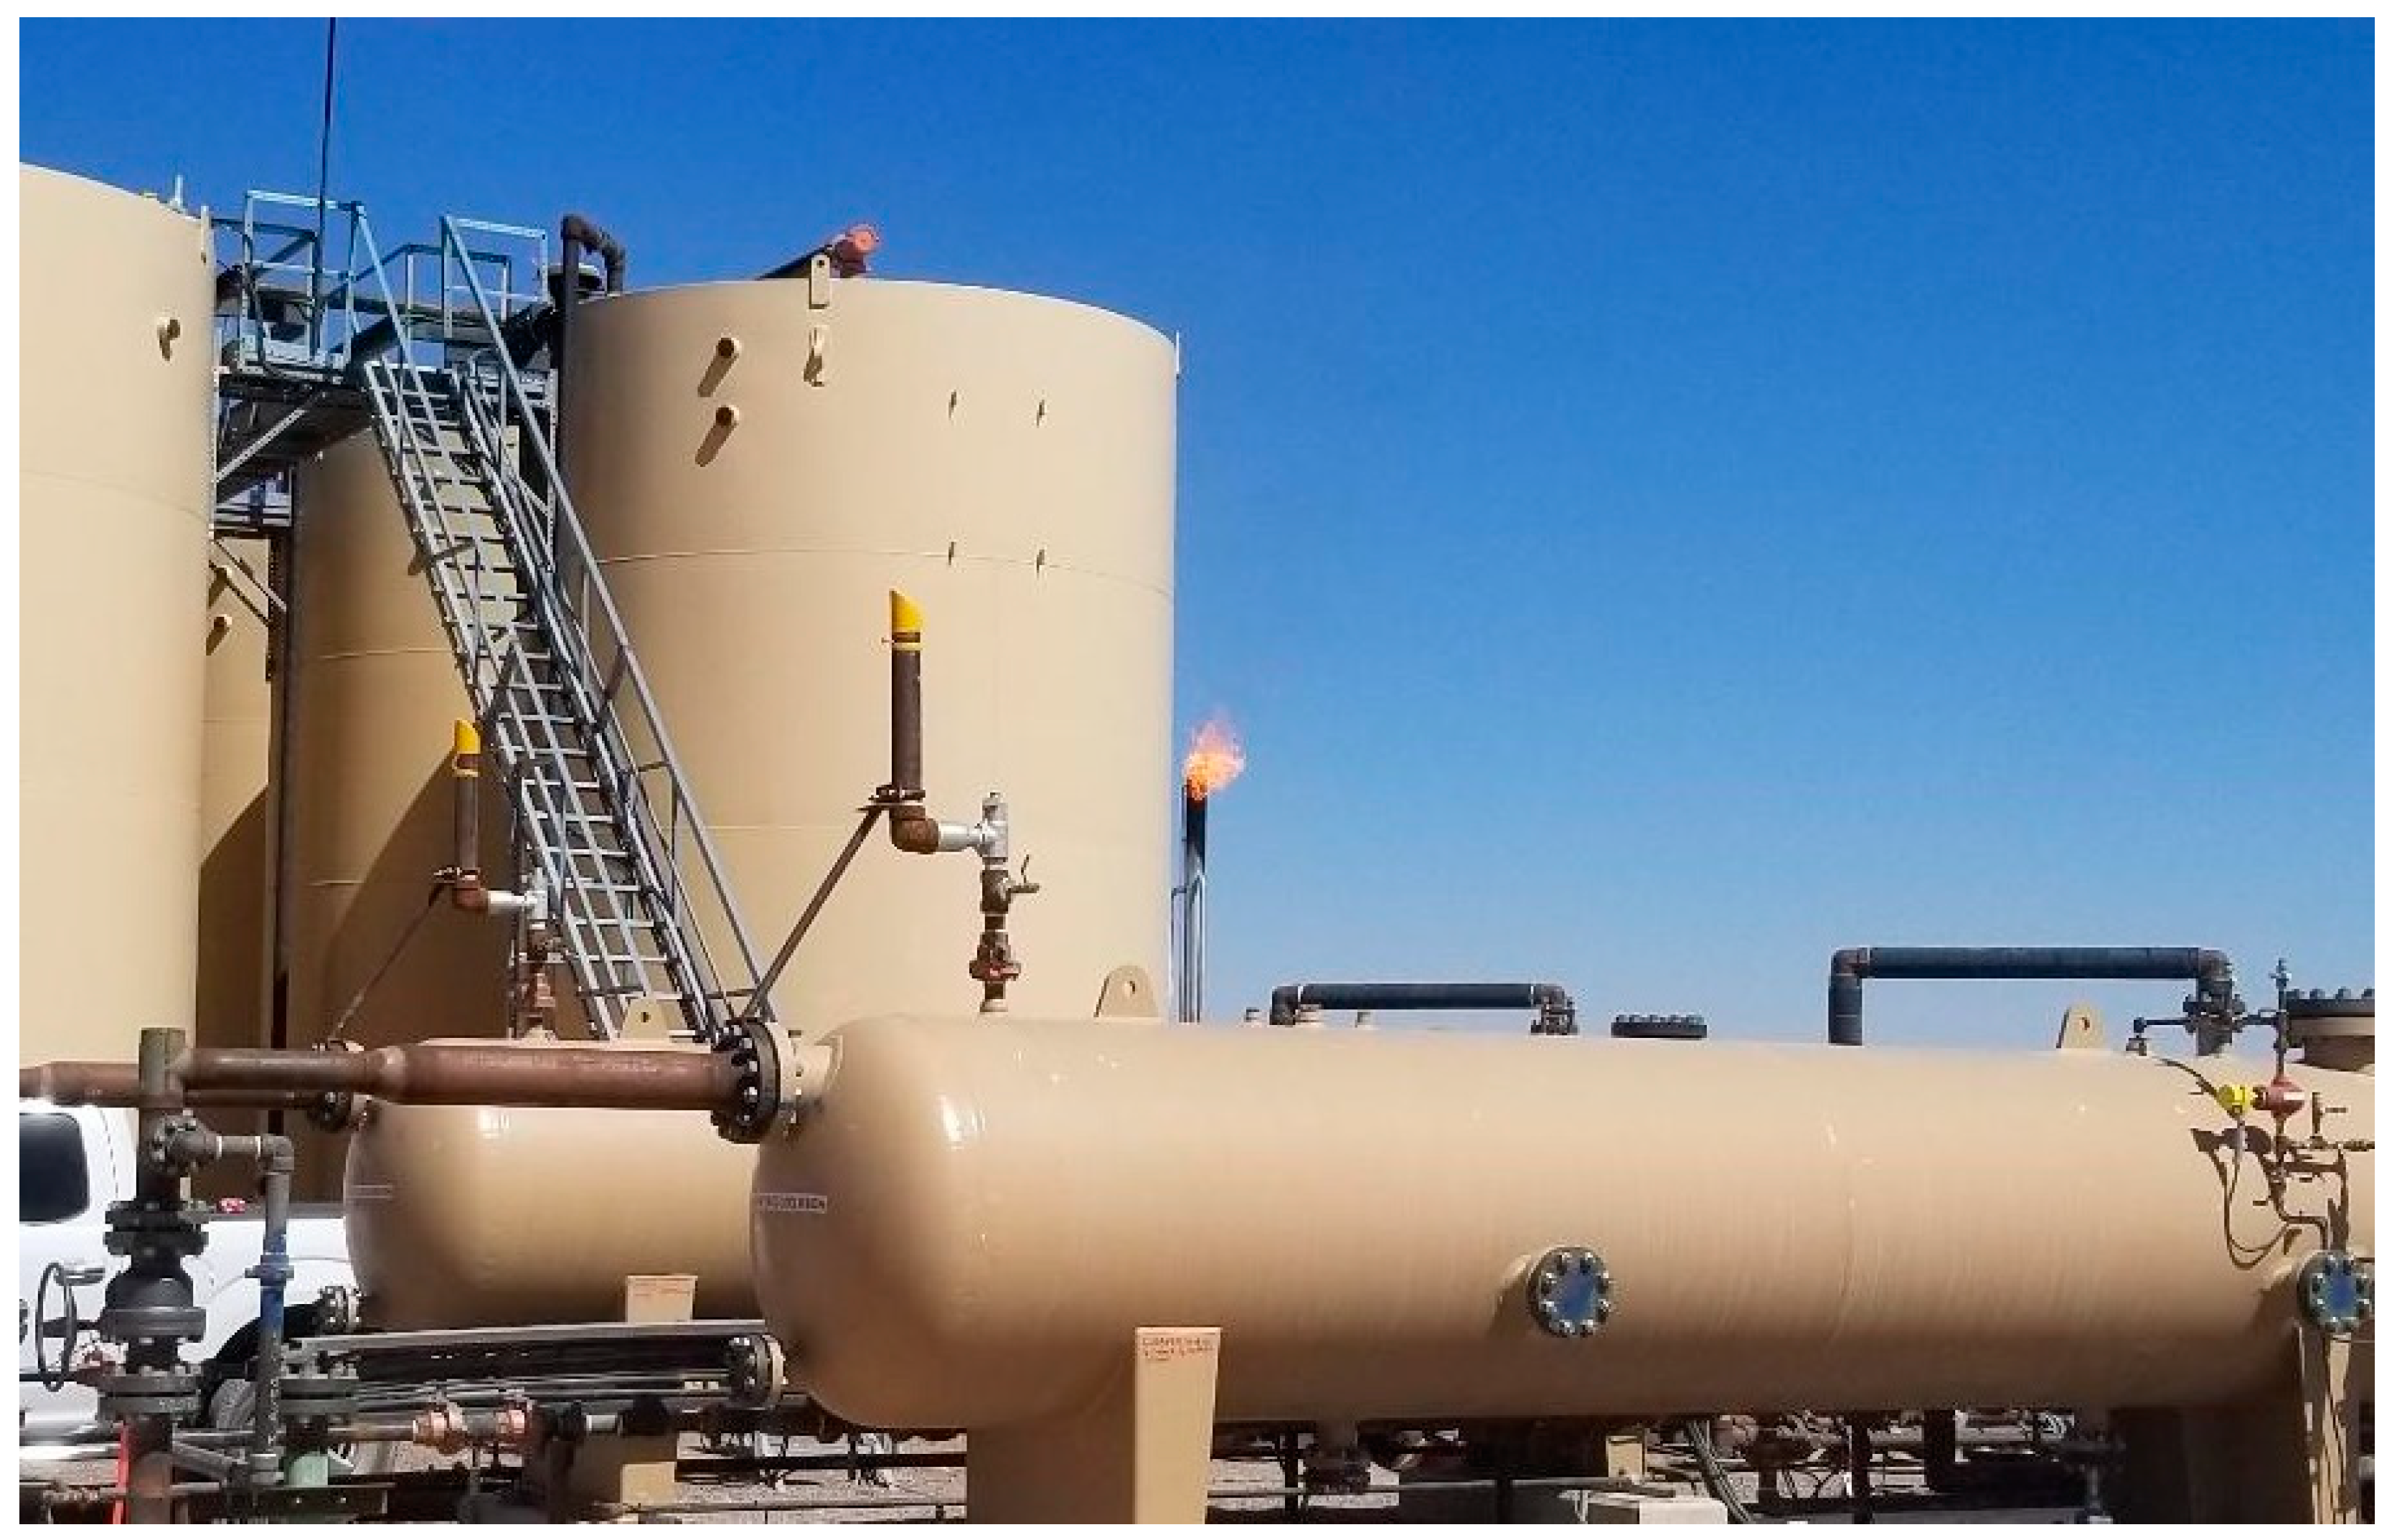
Figure 4 shows a tank battery site in Orla, TX that had an automation team working on the equipment on site.
It is a tedious job having to send a person over to collect all data if you have 40 or 50 tank batteries. It can take someone extensive amount of time to gather all information without such an automated system put into place. Automation increases the ease of data sharing between the monitoring location and the observing personnel to further assist in preventing preventable accidents by making the necessary changes in the site pads. Fire and safety are crucial to the oil and gas industry which is why the fire suppression System was put into place. It has been seen that many fires in the oil and gas industry are caused by mechanical failure and the traditional methods of firefighters have been seen as ineffective. On the morning of January 28, 2014, in Monroe County, Ohio a small fire occurred at the Statoil Eisenbarth well pad. (In-Depth Review of the Statoil Well Pad Fire - FracTracker Alliance, n.d.) That small fire rapidly spread leaving 40-50 employees injured. After many attempts to extinguish or at least minimize damage because of the high heat and explosions the fire department was left with no choice but to stand back and allow the fire to die down. The automatic sensors give warning signals when temperatures get too high or indicative of a fire. Nozzles are situated to attack fires at their most frequent initial points. Process control ensures safety when used appropriately (Fire Suppression Systems Protect Frac Pads in Oil & Gas, n.d.).
Oil and gas are hazardous materials and in very high demand. Being able to produce more in less time possible, comes along with even more risk added to the development. The importance of the end devices plays a significant role in the safety of the process because any slight change throughout the system can cause significant damage. For example, suppose that the pressure of a boiler is too high. The inflow of air will be affected which will change the outflow of discharge gases. This is a threat to the safety of the employees. Energy efficiency is something any industrial owner dreams of achieving and continues to improve in. (What Are Oil and Gas Automation_ _ Cognizant, n.d.) “A dollar saved, is a dollar earned” is the saying. With automation and process control working together, the monitoring team can supervise production. By modifying current the end device settings and using previous output data, optimum levels can be achieved using the minimum of resources and power. These changes are made using a web of structures working together. All the information gathered by automation is fed to a standard machine collector such as a programmable logic control or a remote terminal unit. Remote terminal units and PLCs are very similar however, there are minor differences. The main difference is that a remote terminal unit was made for more rugged environments (What Is a Remote Terminal Unit (RTU) _ - Technical Articles, n.d.; Karlsson, D.,2024).
PLCs were invented to replace relays and contactors. When programmable logic controls (PLCs) were first introduced in 1968, the programming required the utilization of Boolean statements. Boolean is a simple zeros and ones using 3 expressions: and, or, and not. Painting everything as black and white when life is not that simple. It lacked the one thing it was supposed to have, logic. In 1969, a new and improved PLC was released called the Modicon PLC (Programmable Logic Controller - A Brief History of Modicon PLCs ⋆ the Stuff of Success, n.d.). These new controllers integrated ladder logic into its system. Ladder logic is a programming language that creates a graphical representation using ladder diagrams to interpret a wiring diagram. The workers found it so much easier to understand this version. Shorter training time was required to learn to interpret its data. Other advantages are the simplicity of programming or reprogramming, reliability, and small, but some of the limitations are that they cannot handle extremely high temperatures or turbulent settings (Zhang, R., et al., 2024).
In the 1970s Allen Bradley, a Modicon programmable logic control competitor created programmable automation controller (PAC) control systems with multi-systematic control solutions. Programmable logic control and PAC are very similar, but they have different programming languages. PLC uses ladder logic, but a PAC uses C+ or C++. Both communicate the same data, however, through different languages. PACs have an open architecture they are allowed to be integrated with other devices, networks, and systems so communication between each other becomes simpler. RTUs (remote terminal Units) are compared to a PLC but differ in the sense that remote terminal units (RTUs) were made for more harsh environments, as mentioned earlier. This is because remote terminal units can take the extreme heat that PLCs cannot.
Figure 5 shows an automation tech working in the control panel (Payne, J., 2015; Michael, I. A., 2022).
Programmable logic control troubleshooting became a great concern in the 1990s, so plant managers requested a solution. To fix the issue, the PLC programmers began programming PLCs to troubleshoot themselves and fix minor issues such as if the switch level for a tank gets too high the PLC shuts off a pump or shuts off a valve, find a solution to prevent the level of the tank from getting any higher (PLC Programming _ What Is PLC_ & The History of PLC’s - C3controls, n.d.). This saved hours in troubleshooting maintenance. There was a merging of PACs and PLCs and in doing so engineers only rely on the pros and cons and the features accessible. It does not look like ladder logic is going to cease to exist anytime soon. It will continue to evolve along with other technology in the oil and gas industry. It is of no concern what company manufactured which remote terminal unit or PLC ( Herb, S., 2008).
HMI (human-machine interface) is software that is designed for the operators to make it easy for them to control the site from the monitoring site (PLC Programming _ What Is PLC_ & The History of PLC’s - C3controls, n.d.). Many times, they are in the form of a screen including data information that is taken from end devices. HMIs can control multiple machines and/or equipment at the same time. It can be thought of as the operating panel or screen on location. The way this machine communicates with the PLC or remote terminal unit is called a protocol. A protocol is a language understood by devices. Engineers can program any HMI to perform any task that can be manipulated. HMIs and PLCs work together to supervise and control the process (Bansal, R., et al., 2024).
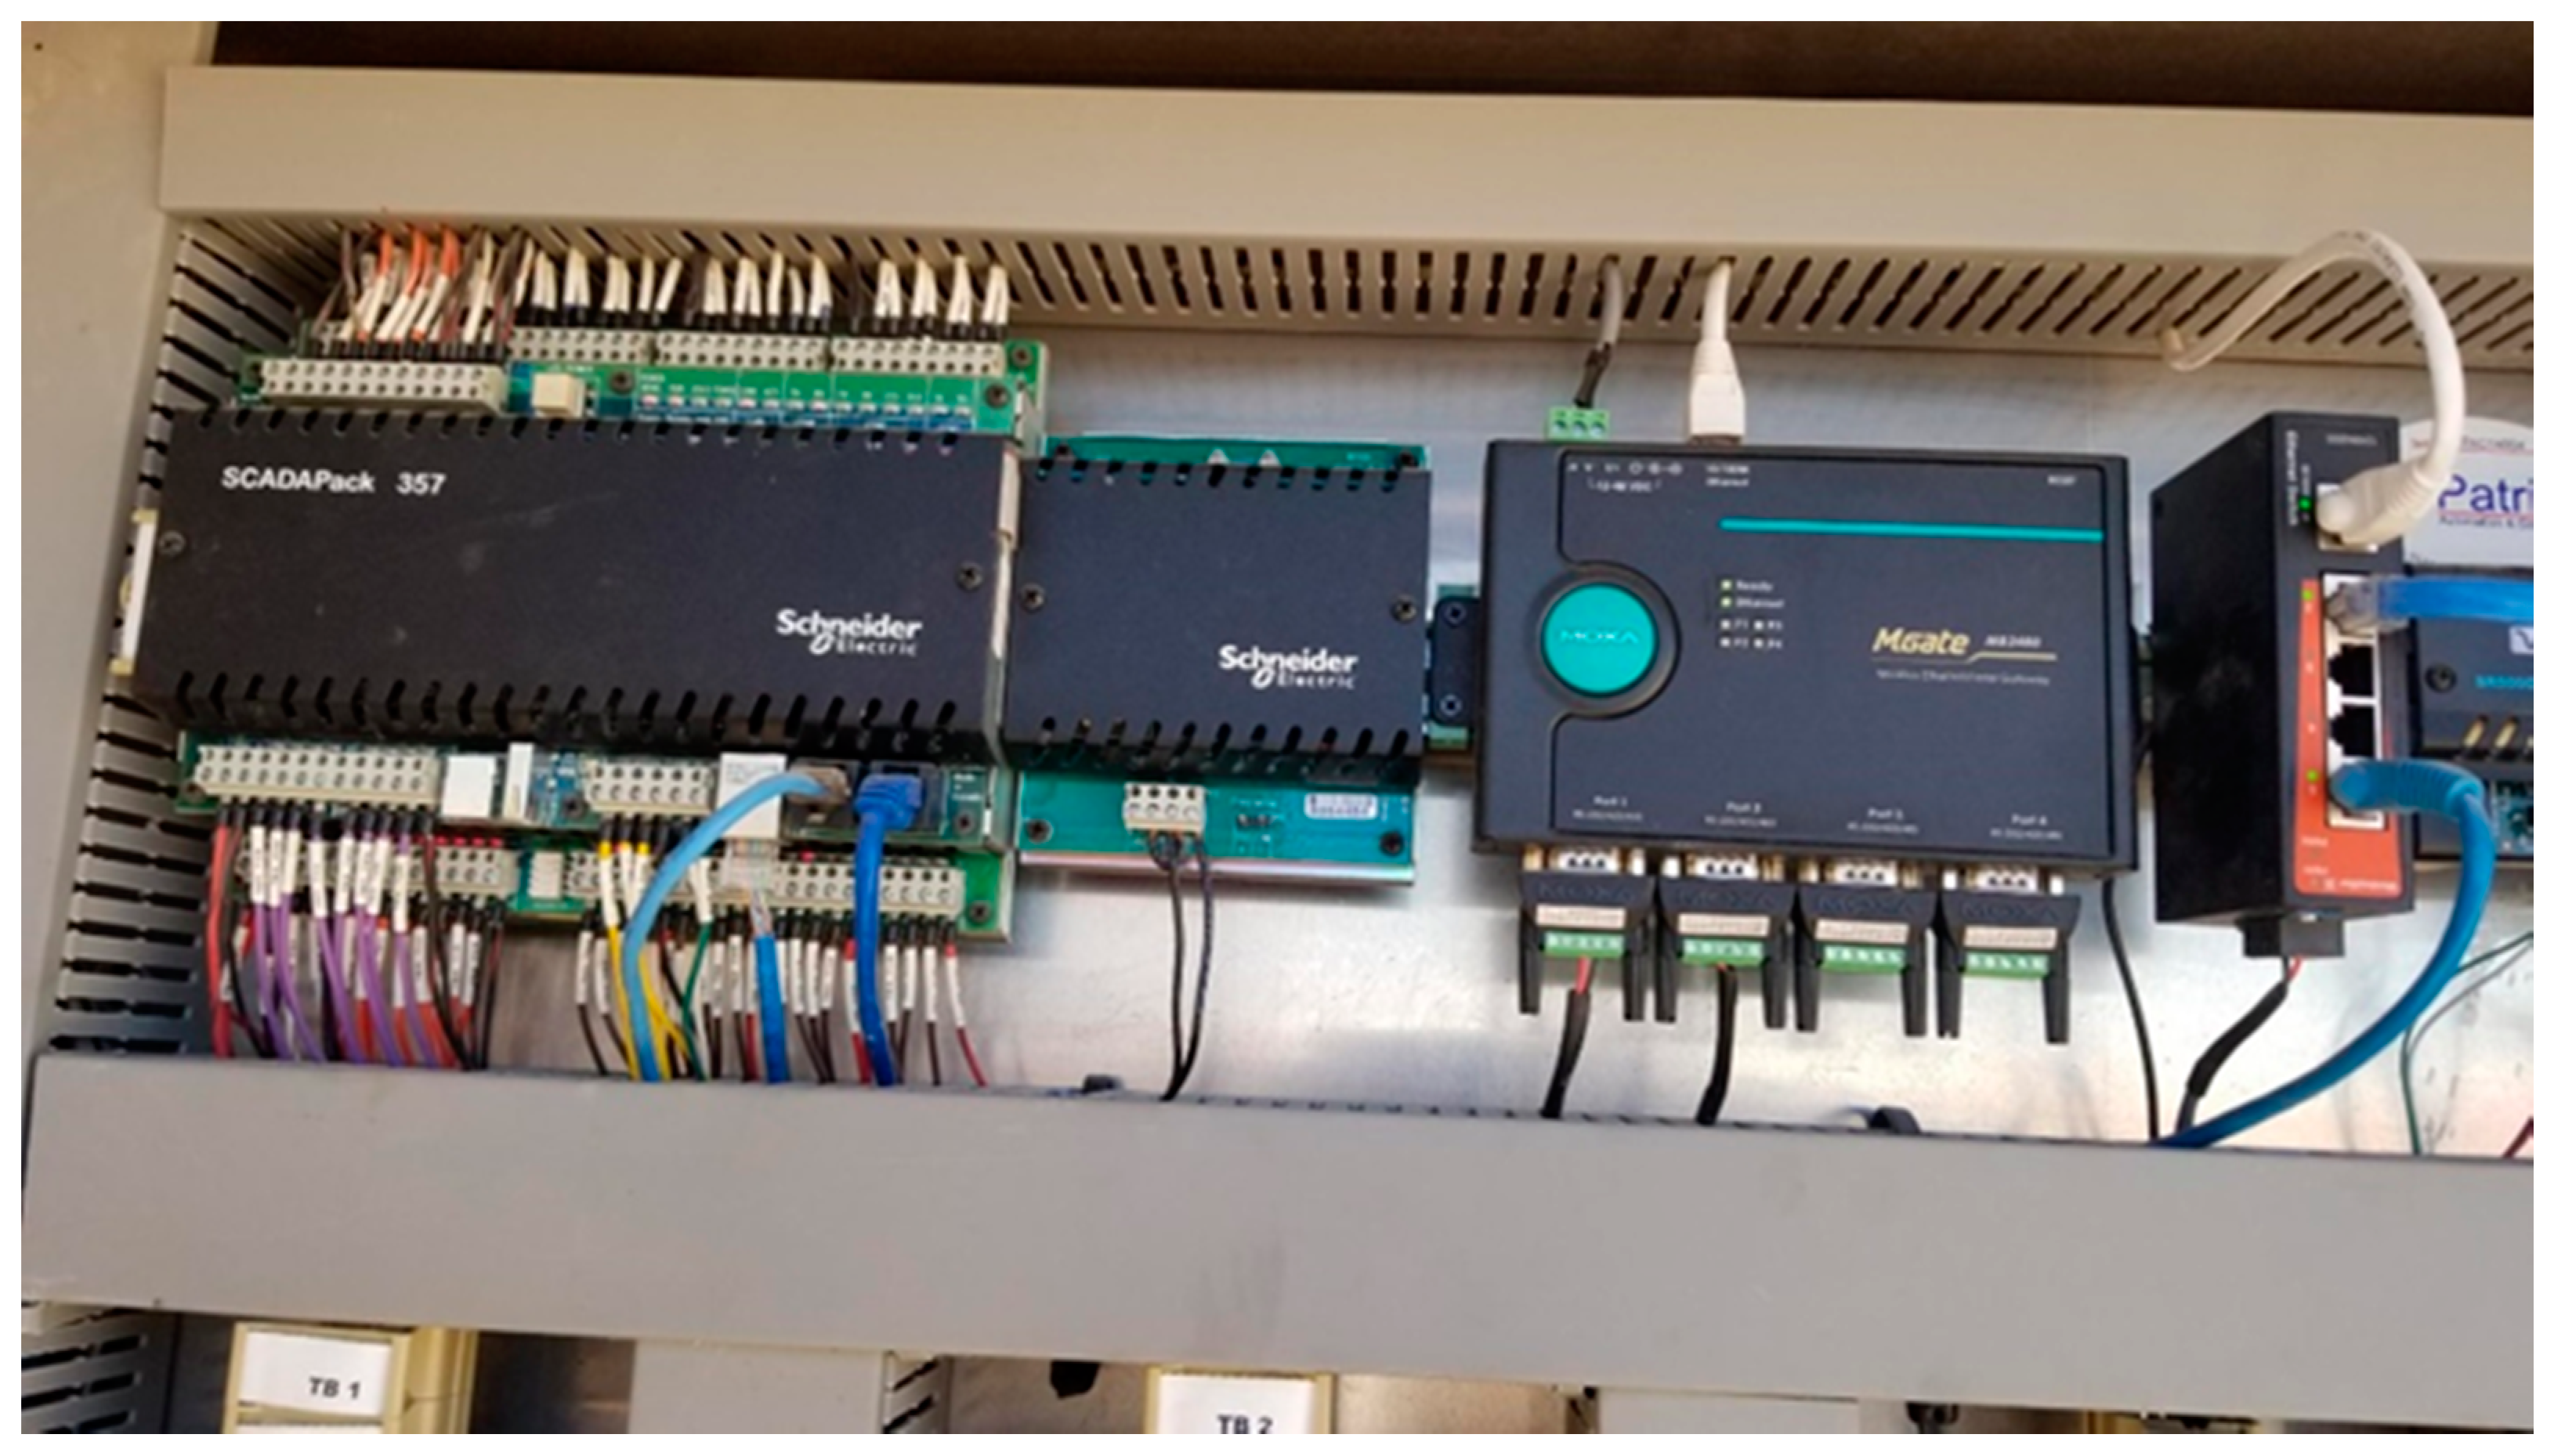
There are an endless number of brands that manufacture the devices and there many different forms of communication between them. Most communicate using Modbus protocol or what is widely known as the slave-master communication system. There are slave devices that send messages to the master and the messages are separated and sent to the appropriate destination. The master requests information from the slaves and the slaves send data over, which would be either they have the information the master requested along with the data, or they do not have it available. Either way, the slave sends over a signal with feedback.
Figure 6 shows the SCADAPack on the far left ( Chehaitly, M., et al., 2024).
On the far right, there is a modem. A master might be the SCADA system requesting data from a control valve from a PLC at a certain location, however at the same time it could be a programmable logic control sending the signal over to a transmitter. Either way, a master and a slave is requesting and transmitting a request. In very few occasions a slave is transmitting a request but that is hardly the scenario. The master transmits a signal to the receiving end of all the slaves and whichever slave has the information will transmit the data to the receiving end of the SCADA system (Manoj, K. S. 2019).
All is sent over to the SCADA system hardware and from there sent to the software in the control room. SCADA is software in the main control room that controls the process at a remote location. That was introduced as early as the 1950s and was first used in power plant generation plants. However, the challenge that remained was collecting the data from the PLCs and remote terminal units and sending it to the SCADA system (Afenu, D. S. et al., 2024).
When computers were introduced in the 1980s, the PLCs began incorporating innovative technology into the SCADA system, removing any need for drafting boards. (PLC Programming _ What Is PLC_ & The History of PLC’s - C3controls, n.d.) SCADA is a centralized system in that controls and monitors numerous sites. SCADA system delivers the data using a fiber optic network or a fiber optic cable. When a fiber optic cable is in place although it may be slower, it is reliable no matter the severe weather conditions. With a modem (Fiber optic network) is much faster but the weather conditions cause it to be ineffective at times. Fiber optic cable may be expensive to put in place. When hazardous raw materials are being processed it should be a question of safety first. A few hours without any analytic data could mean many mechanical failures, injured workers on the site pad, it could mean inefficiency. A SCADA system is a system that gathers real-time data, it motors remote locations and the progress and optimization of a process. Utilizing the automation system put into place with the end devices, all statistical analysis is recorded and stored for future analysis for further plans to optimize at full potential (What Is SCADA_ Supervisory Control and Data Acquisition, n.d.)
7. Process Dynamics
Within the process dynamic control, we have what is called process dynamics. From what we had previously stated there are changes over time, included in those elements are level flow pressure, temperature, and pH. Anything that is being read by the end devices and has a switch as well as mentioned earlier. These components bring your substance back to equilibrium or to the set point you may have it as. For example, you may have a level of a tank battery set at a certain point and you want the level to remain at that point. So, you program a device known as a PID (proportional Integral Derivative) to be notified by a level switch when it has gone out of its parameters (Prabowo, M. C. A., et al., 2024). In doing so, the PID will automatically do what is necessary to keep the tank at that level. Another way to look at it is your car's gas gauge as the level sensor. Your gas gauge lets you know when you are running low, you are the PID that gets your car's gas back to level. Gone are the days when working personnel had to get so close to all the dangerous equipment to manually shut off a pump if the level of a tank reached over its set parameters. These sensors are part of what keeps consistency throughout your process to continue the optimization of your desired product (Hethcox, J. C., et al., 2024).
Level sensors are split into two parts, one is point level measurements, and the other is continuous level measuring. The main difference between both is that point level measuring gives the level of a tank at a particular point. However, for continuous level measuring you will continue to receive the level of a substance as it soars and decreases in quantity at any given point in time. Point-level measurements include sensors such as float switches, capacitance, optical, conductivity, and tuning fork-level sensors. Continuous level measuring sensors include ultrasonic, and radar often referred to as microwaves (Raeis, H., et al., 2024).
A capacitance level sensor detects the level by its proximity to the sensor by sensing the effect on its electrical field. Its advantages are that it is small, it is less expensive, very accurate and it has no moving parts requiring less maintenance. The advantages of such a device are that is invasive. These devices have to touch the substance being measured to get any readings, unfortunately, it only detects specific liquids, and these types of sensors need to be calibrated. Optical sensors convert light rays into electrical signals to measure a physical entity of light. It is then interpreted into a measurement. The advantages of these are that it has no moving parts and that it is not affected by pressure or temperature. These types of sensors are also small. The downside is that since the lens gets coated with dirt, it has to constantly be cleaned (Canbolat, H., 2009).
Conductivity (resistance) level sensors use a probe to read the conductivity within a probe. The probes are equipped with a pair of conductors and apply a rotating current to them. When the liquid in a tank for example covers a probe, the conductors become part of an electrical circuit triggering a current to indicate an elevated or low tank level. The advantages of these types of sensors are that there are no moving parts, they are less expensive compared to other sensors and fortunately, they are fairly easy to use. Though they are invasive and must be touching the substance being measured, they only sense conductive liquids and the probe will erode over time (Sun, Z. et al., 2024).
A vibrating (tuning fork) level sensor is another type of point-level measurement. This sensor is in the shape of a fork and uses vibrations at a resonance frequency. The tuning fork senses the level changes in an element because the frequency will change when the level changes. The advantages of such technology are that they are cost-effective, compact, easy to install, and maintenance-free. The disadvantage is that they must be touching the liquid and or material. It does have unlimited uses but only if the liquid and or material is something they can sense. The vibrating level sensors are great when it comes to mining, the food and beverage industry or a chemical process. A float switch is a device that will raise and fall when a product is applied or removed. This will cause a circuit to open or close and the level of a tank changes. This is a device that does not require power. It also provides a direct indication of its level and is comparatively inexpensive. Since these switches do have moving parts, there is cause for more maintenance. They are also big and will only give a clear indication of a high or low level within a tank. Float switches cannot measure a fluctuating level. The ideal application of these gadgets is in storage tanks (Goda, A., et al., 2024).
For a continuous level measuring sensor, ultrasonic level sensors admit and receive ultrasonic waves and the time it takes for a wave to reflect is the gap measured, being the level. Like most point-level measurement sensors, an ultrasonic does not require any moving parts, it is compact, very reliable, non-invasive and it is unaffected by the material being measured. It is also self-cleaning because of the vibrations it is dispersing. On the downside, they are very expensive, and the environment can hurt the sensors. Radar level sensors are known as microwave level sensors. With the help of an antenna that is attached to the radar sensor, the radar sensor transmits microwaves and the ultrasonic level sensor reflects the waves dispersed from the antenna back to the antenna (Kaur, K. et al., 2024).
According to the time it takes from emission to reception of this signal, it is proportional to the product's tank level. The advantage of this type of sensor is that it is not affected by the tank's pressure, temperature, or dust. Radar level sensors measure various types of liquids, pastes, powders, and solids. These types of sensors are very accurate and there is no calibration necessary. This product is non-invasive, as well. These types of applications, however, are very expensive, and unfortunately, even though they are very accurate they have a limited range which they can measure (Sabarish, N. B., et al., 2024).
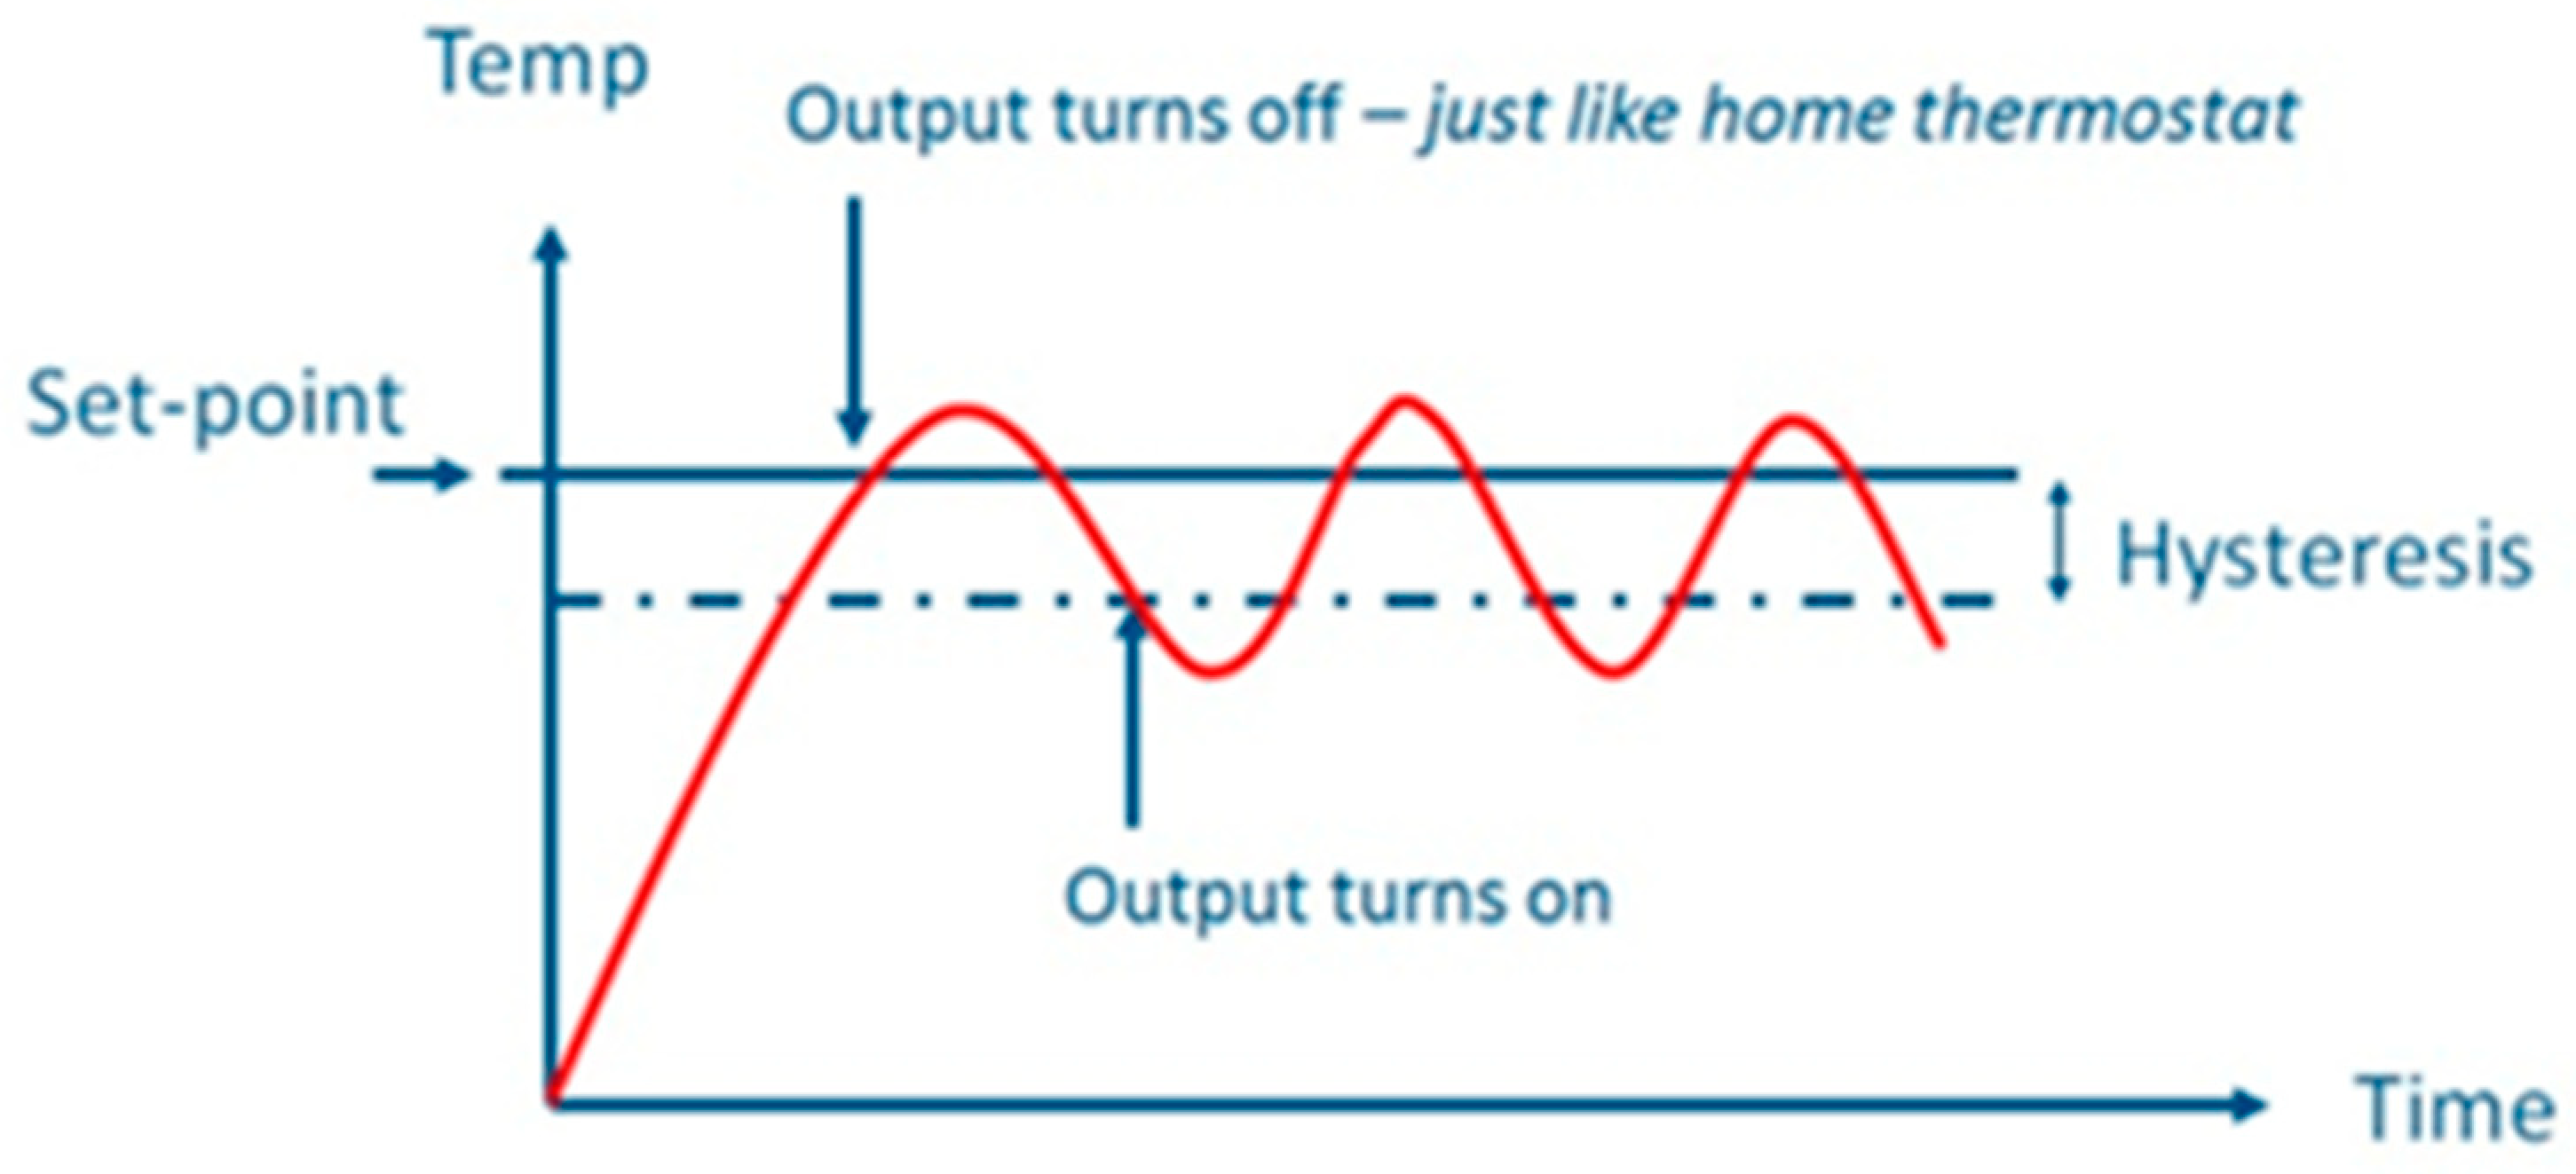
Putting the whole system together is the PID. The proportional Integral Derivative device is a mechanism used when you must keep the consistency of pressure temperature, and pH of a liquid, or tank level. This is the brain that signals an RSP controller which is simply used for voltage control when changes need to be made to the temperature control, a tank level, or a particular pressure you may need. Simply supply the PID with your desired setting or constants and it will incorporate control loop feedback to ensure you receive the desired product. Feedback loop control will signal a command to keep your expected process at your preferred setting. When the PID signals that it requires the RSP to give out a signal. It will. In the occasion that pH is trying to be maintained and a probe indicated that the pH level was not where it was supposed to be the PID would signal the RSP control to either inject more chemicals to assist in stabilization into the process or manage to get the desired pH levels (Jahan, N., et al., 2024).
Figure 7 shows what an on/off state looks like.
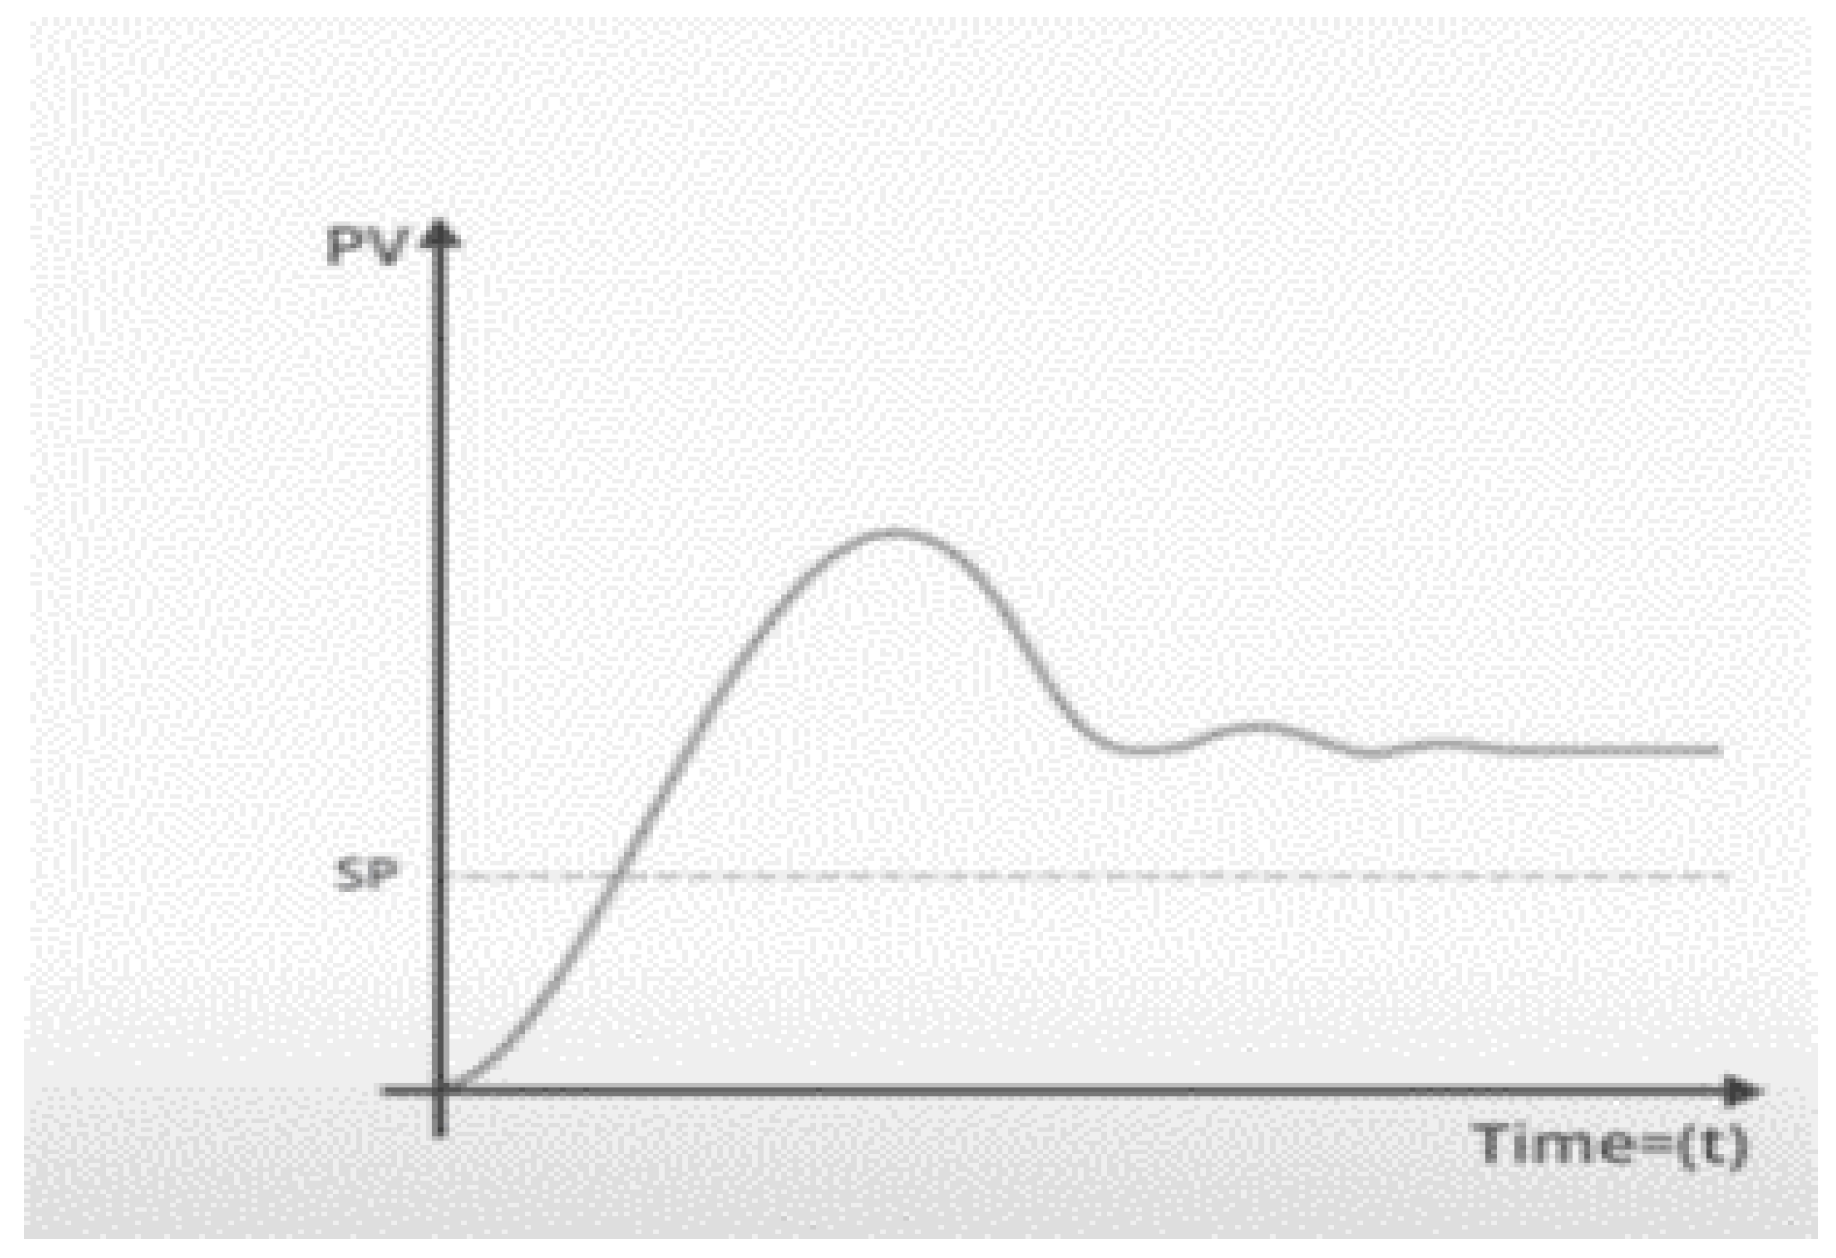
The fluctuation may not be acceptable in some processes in which case PIDs are put into place. The PID stands for proportional integral derivative bringing together different control blocks that send signals to attempt to maintain a steady state process (Gopi, P. et al., 2024). The proportional block work of a PID can be seen in
Figure 8.
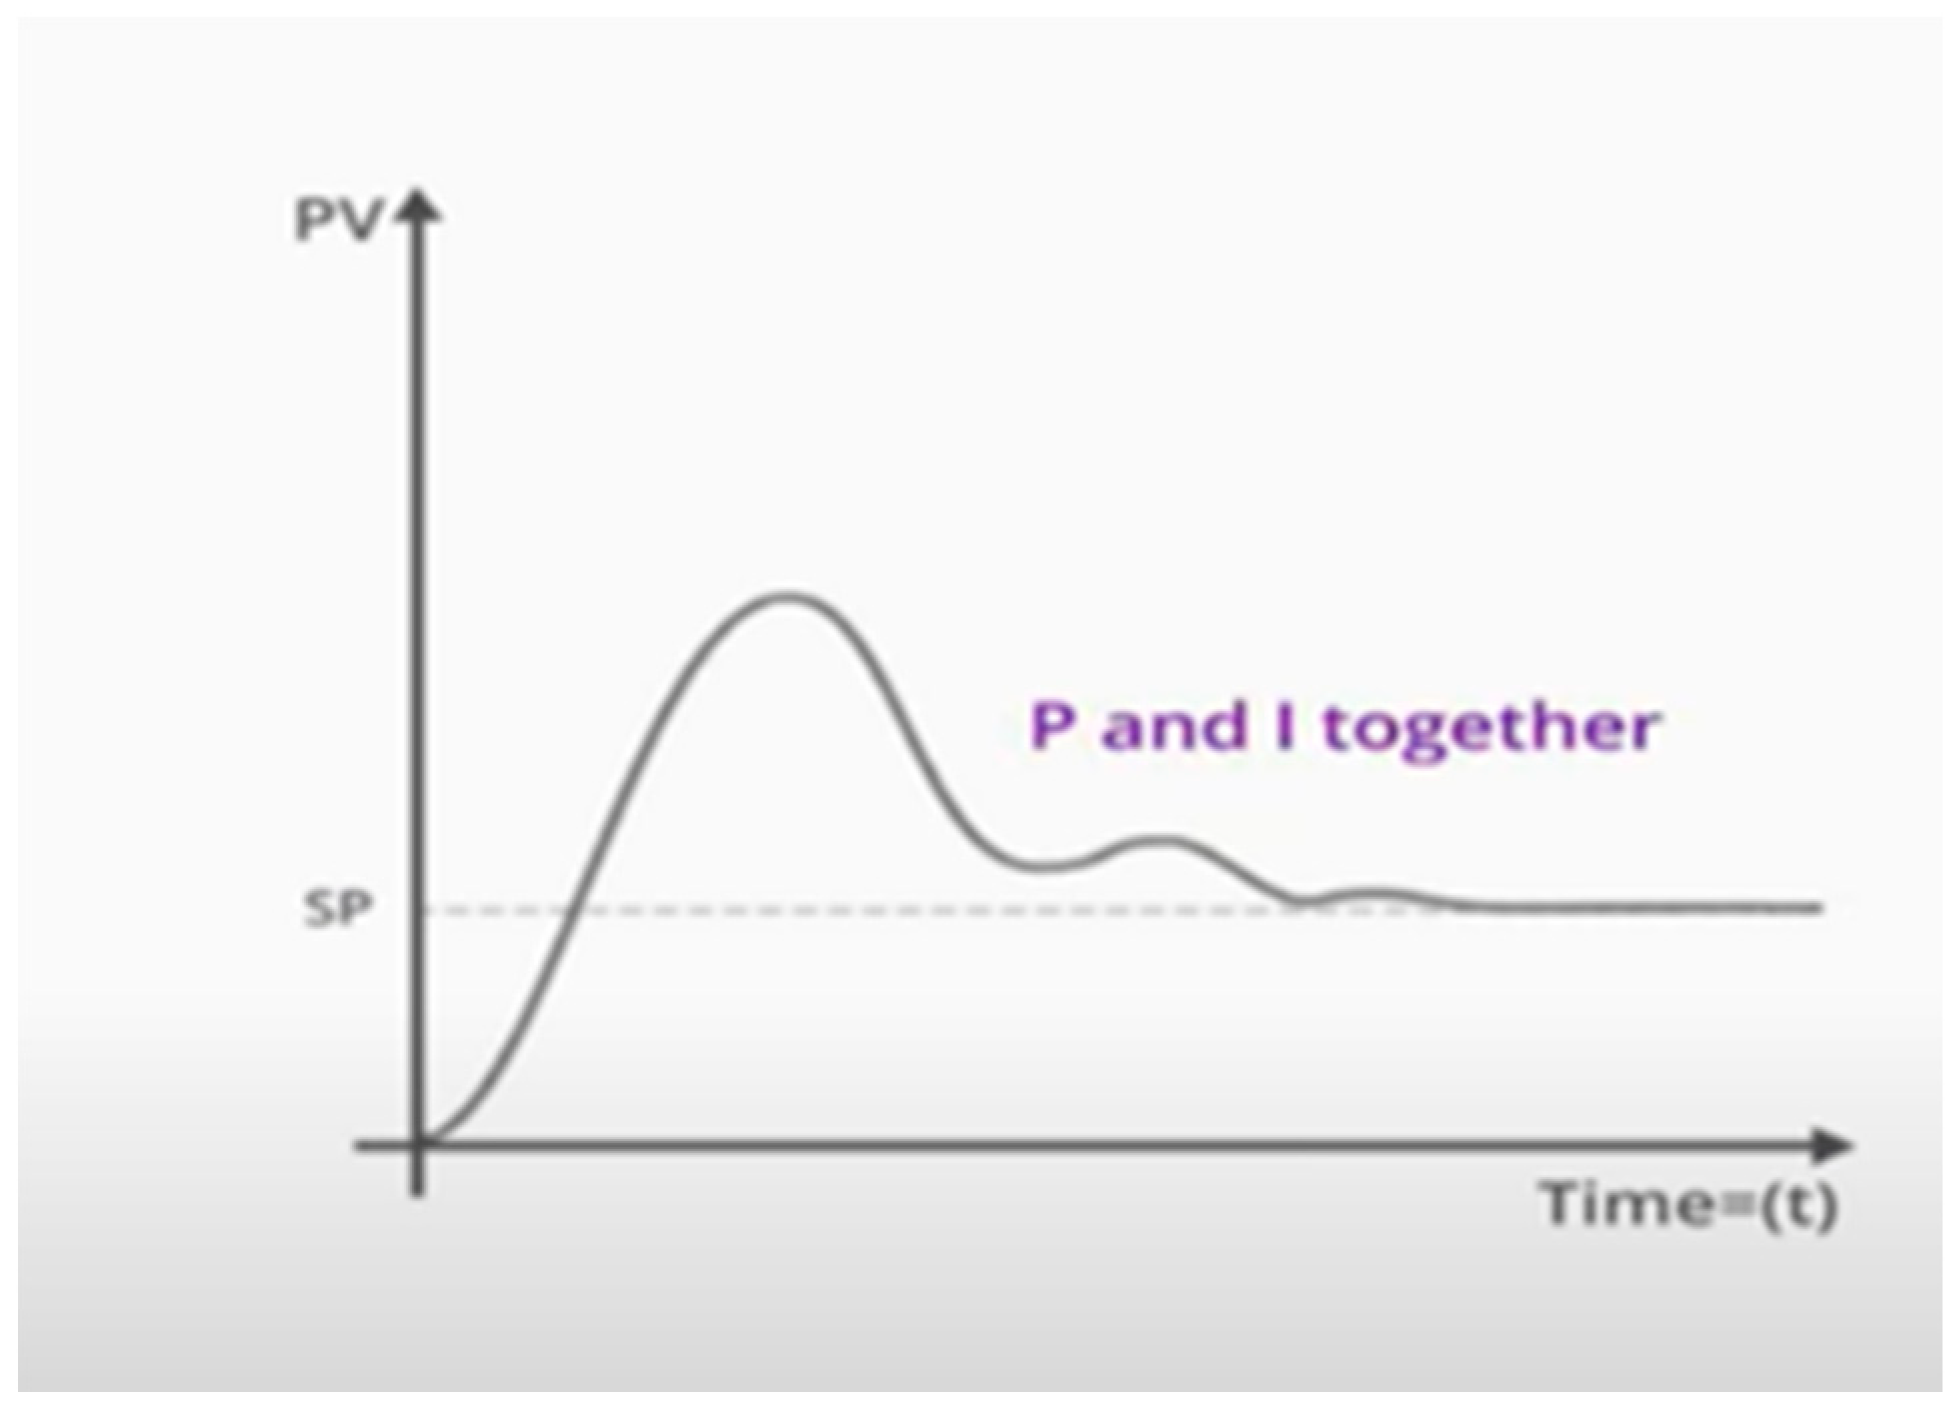
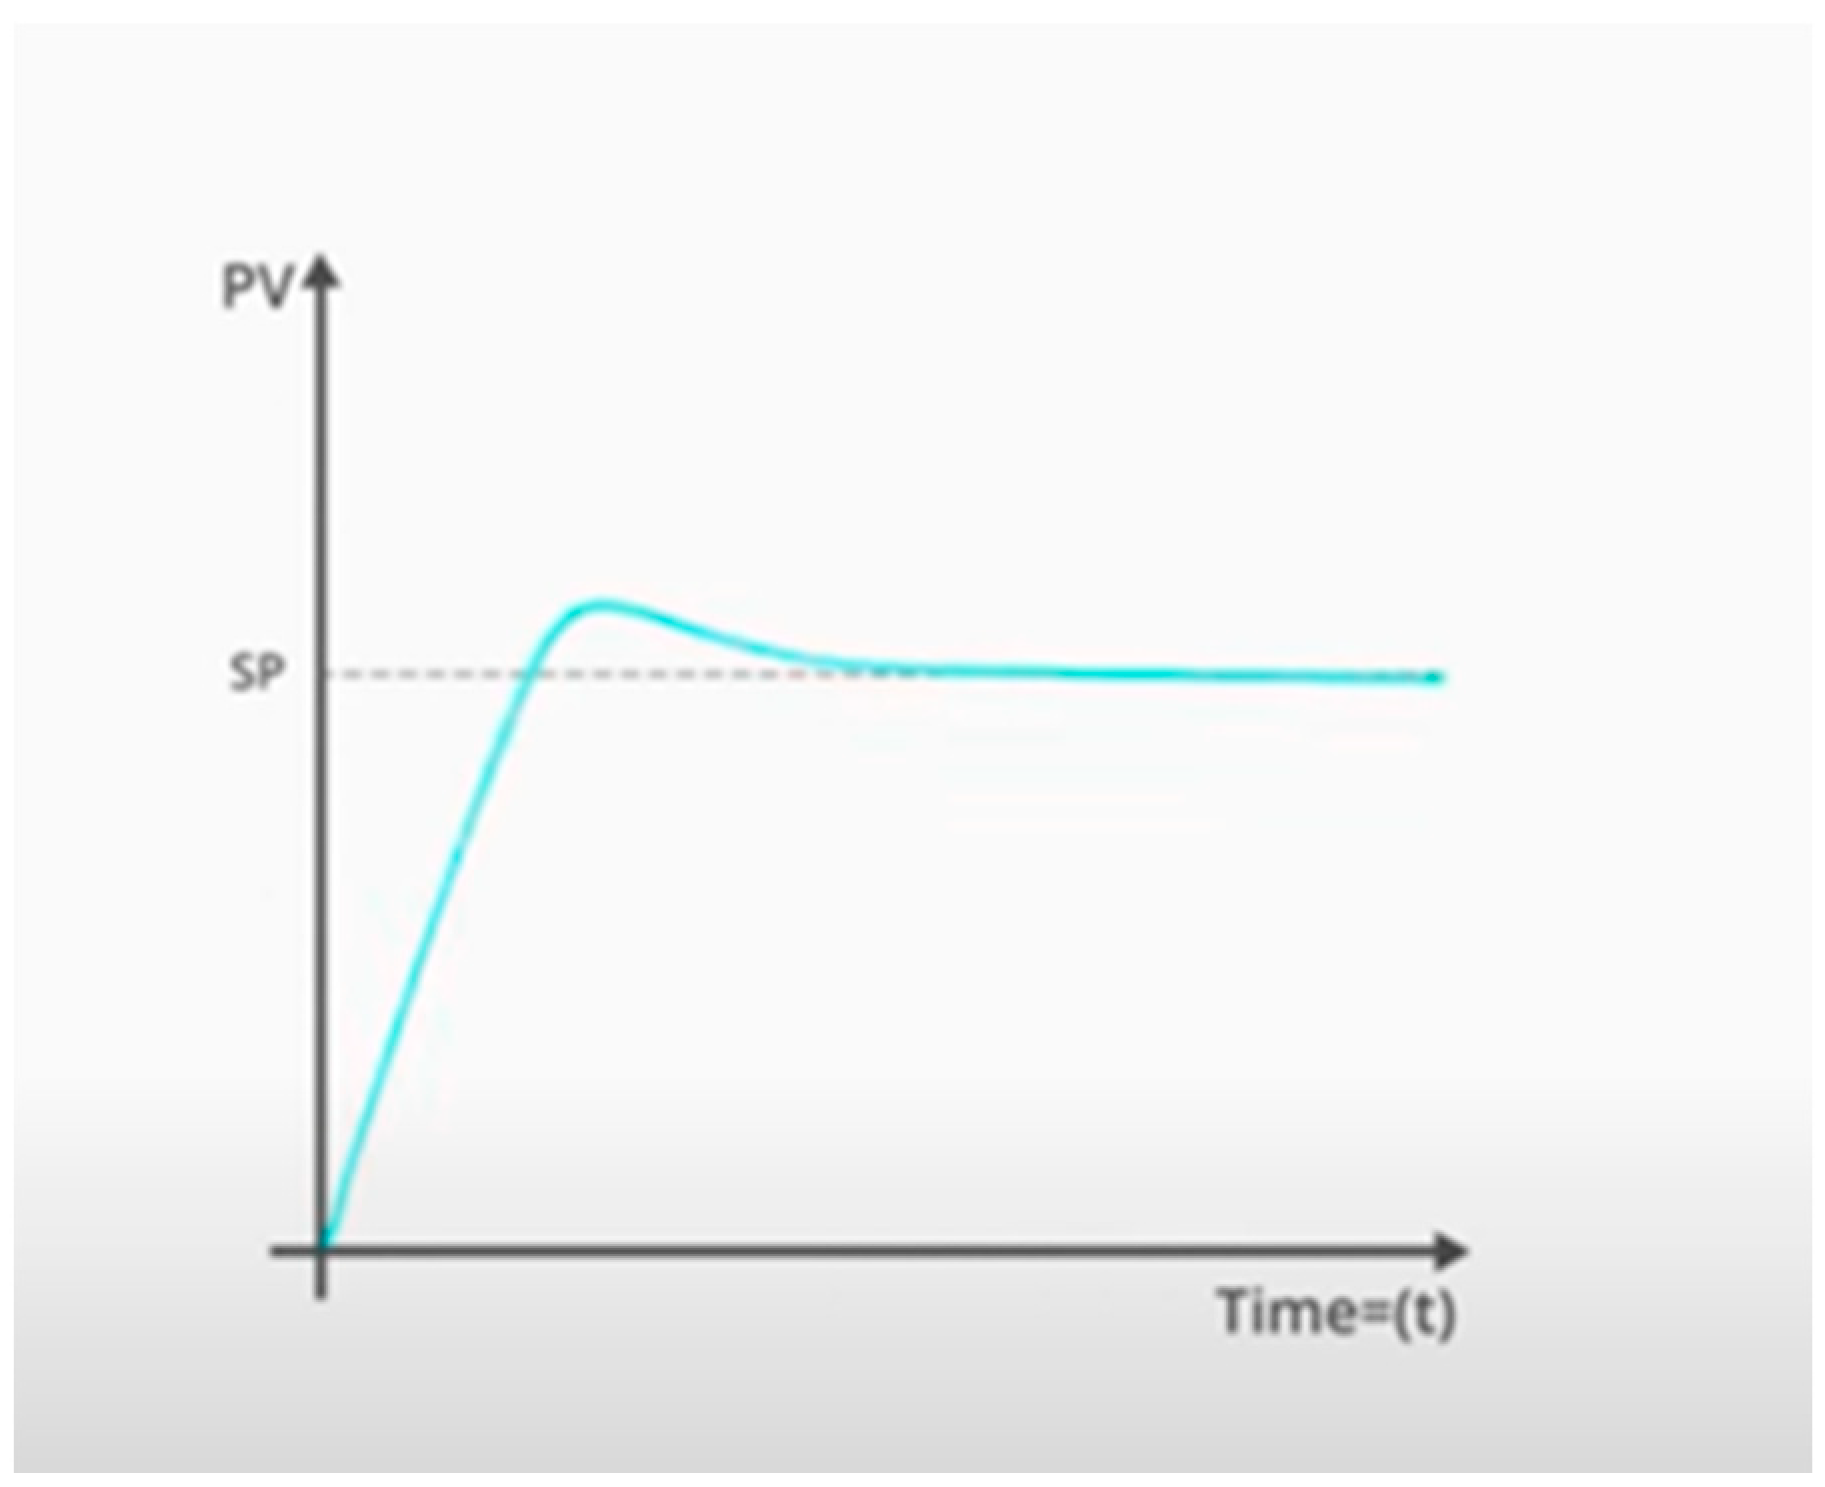
It draws a curve proportional to the magnitude of the error signal. The proportional block creates a signal proportional to the duration and magnitude of the error signal (Karadol, H. et al., 2024). When both the proportional and the integral blocks work together, the curve comes closer to the set point which can be seen in
Figure 9.
As long as there is an error signal, the integral action will persist. The derivative block creates an output proportional to the rate of change or the slope. The main task of this block is to try to guess what the error will be further ahead and deliver to the controller yield appropriately (Çavdar, B., et al., 2024).
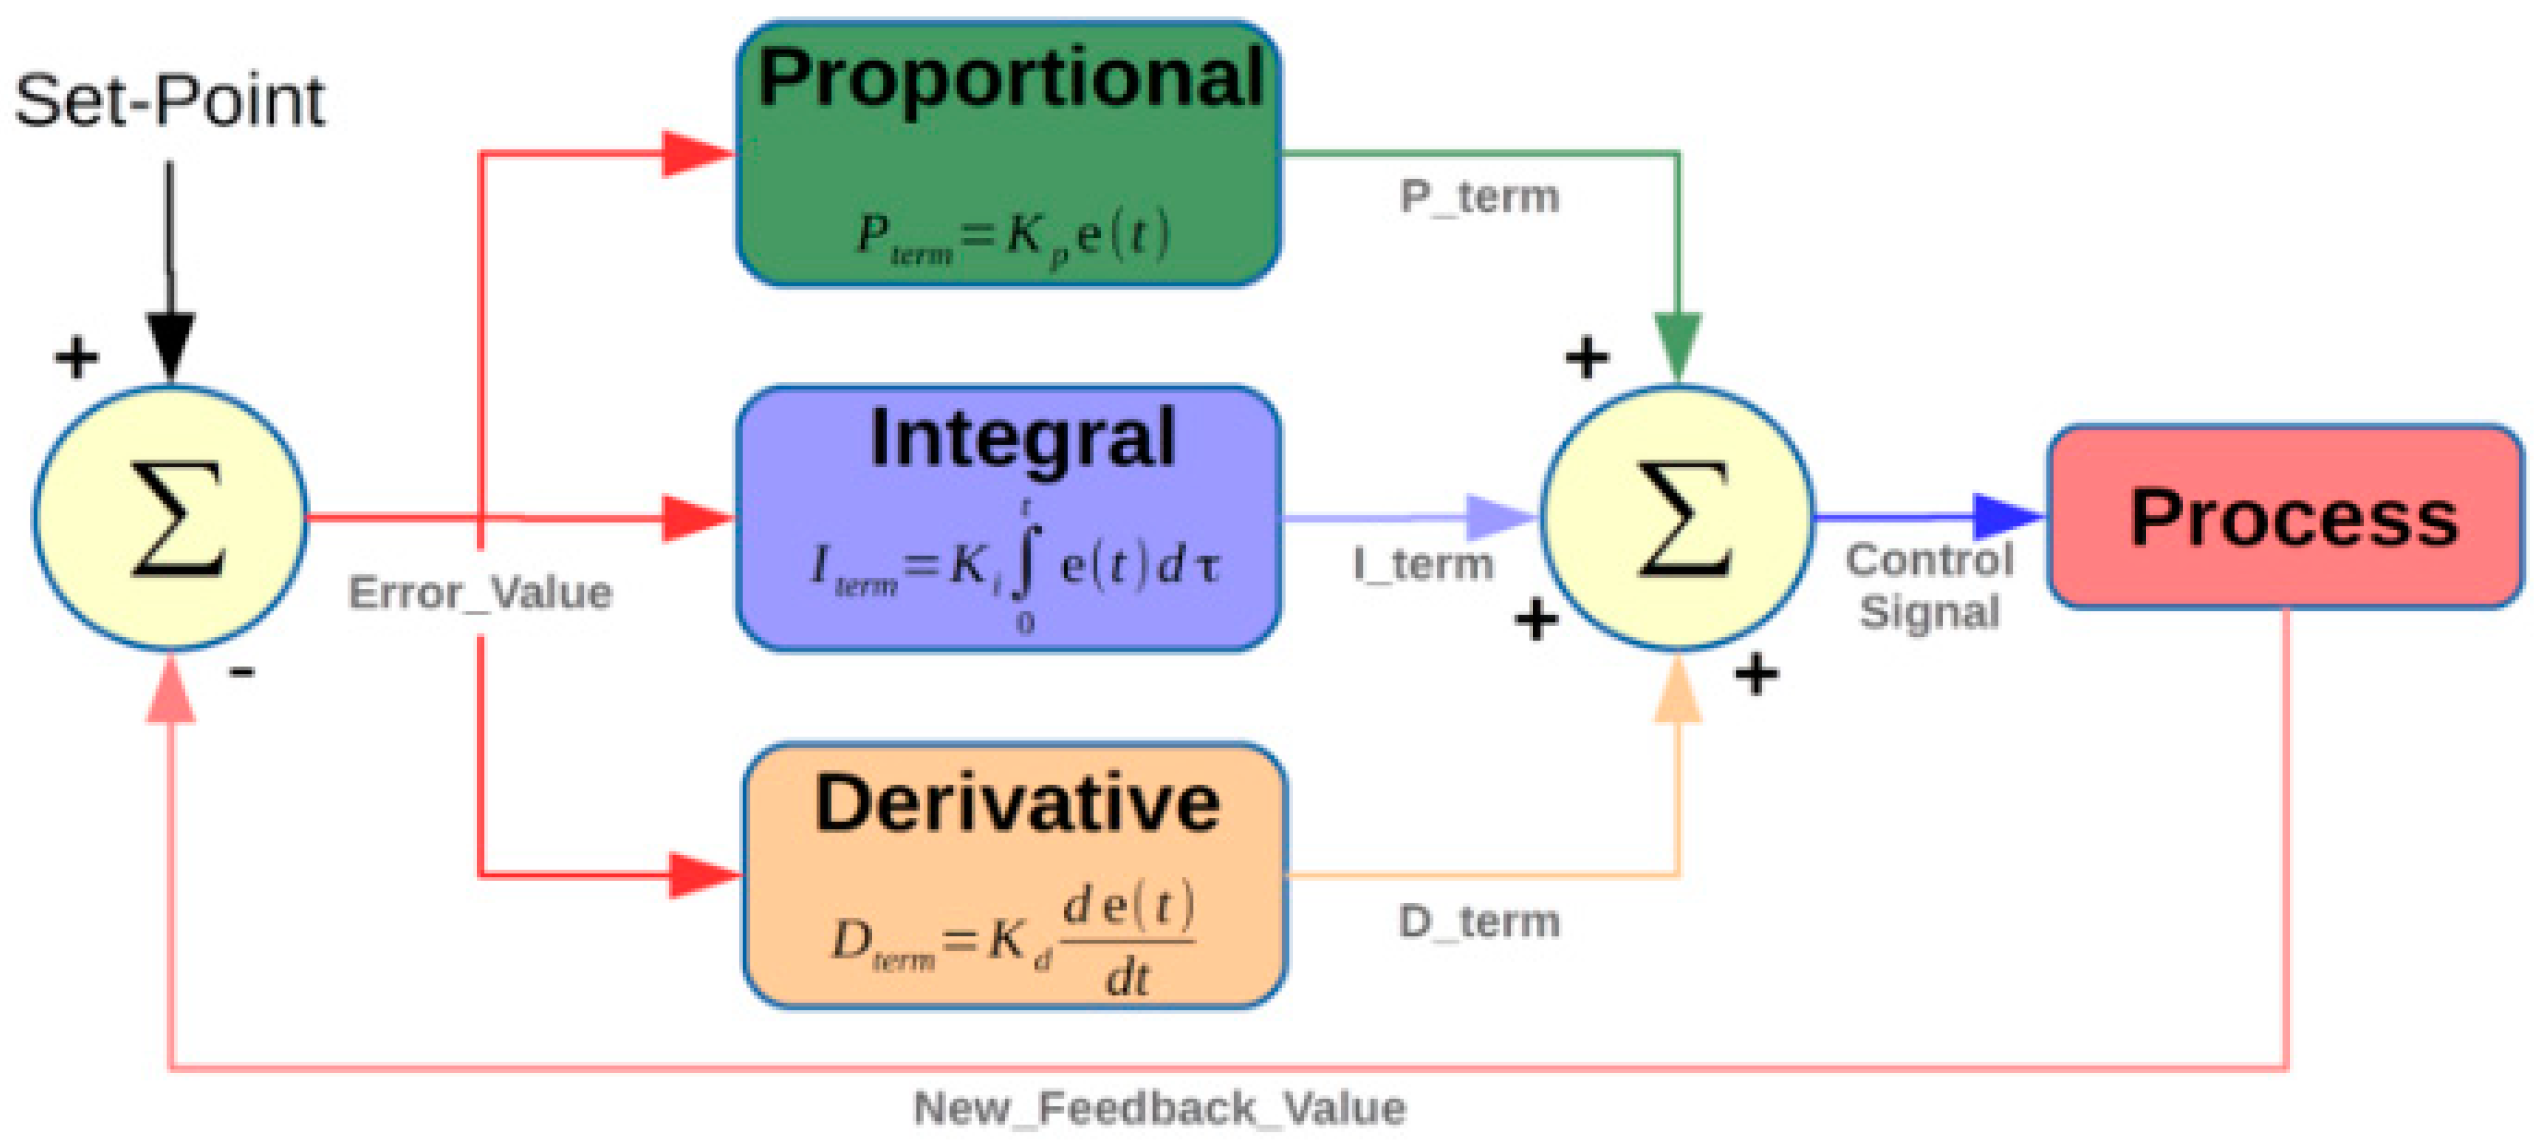
Figure 10 shows the algorithm that takes place when all 3 actions work together.
Figure 11 shows a block diagram showing the changes made by the PID trying to fix the error detected.
8. Recent Advances in Feedback and Feedforward Controls
Control characteristics of generated water technologies have received a lot of attention in recent years. The feedback control scheme has developed in a number of ways throughout time. Feedback Control ensures that a desirable performance state is maintained by assessing it, comparing it to the intended condition, and implementing corrective actions based on the difference between the ideal and real conditions. In other words, an error signal is generated by comparing a measurement to a specified point. This mistake is handled in such a way that the magnitude of the error is decreased. (Sheik et al., 2021).
With generated water technologies, the choice of what control actions to take (for example, how much to open or shut a valve) and when to execute them is a problem. Control operations are regularly carried out on the ad hoc control system, depending on the reservoir engineer's or production engineer's engineering judgment (Gai 2001). Some of the control methods that have been used or proposed include open loop, closed loop proactive (model or near-well sensor-based), and closed loop reactive (called direct feedback). (Dilib and Jackson 2012) proposed an open-loop feedback control based on the design and sizing of Inflow Control Devices (ICD) before installation, which is best suited to well-understood for produced water treatment technologies with little geological or drive mechanism uncertainty; it has been proven successful in real fields with all controllers, including P, PI, and PID (Erlandsen 2000). These feedback control strategies are more adaptive and can use expanded reservoir knowledge to enhance the regulation strategy over time (Gomes Jr, M. N. et al., 2024).
After the first decade of the 21st century, based on multiphase measurements at the completion level, Dilib and Jackson (2012) suggested a closed-loop continuous control loop of ICVs. The suggested control approach is a widely used control loop optimized over an array of reservoir realizations for produced water treatment technology or a single reservoir/well. They demonstrated that this method could boost economic returns for a single horizontal production well, even when the reservoir behaves strangely. Progressively, a proper control strategy or automation was necessary to follow discharge-produced water quality regulations, which was proposed by Szép and Kohlheb (2010) as the Smart water discharge (SWD) plan. SWD is a combo of continuous TPH surveillance, manipulation of regulating parameters (which include holding duration, chemical concentrations, and escape screens), and Human-Machine engagement. The system is made up of three main components (Controller, Coordinator Equipment, and Sensor) as well as several auxiliary components. The Sensor is used to measure the controlled variable in produced water discharge (PWD) from reservoirs of oil and gas, which acts as a feedback control mechanism. Few limitations were discovered after the successful experimentation by Szép and Kohlheb (2010). When a control loop's dead time exceeds its steady state, standard PID algorithms are unable to offer sufficient monitoring. This feedback approach, on the other hand, proved appropriate for P and P controllers (Johnson, A. et al., 2024).
Following that, Khairullin (2012) used closed-loop direct feedback control in the SPE Brugge model, a synthetic reservoir model built to compare closed-loop waterflood management systems and maximize the efficiency of produced water separation from gas reserves. The outcomes of this investigation also contribute to the resolution of the constraint identified by the previous studies performed by Szép and Kohlheb (2010).
Durdevic et al. (2015) identified a series of First-OrderPlus-Dead-Time (FOPDT) models through experiments. Based on mass balance equations in Das and Jaschke (2018), a control-oriented model of an inline de-oiling hydrocyclone was created. Mishiga et al. (2020) developed a first-principles mathematical model for a hydrocyclone, which serves as the foundation for the model employed in this thesis. Vallabhan and Holden (2020) introduced two nonlinear control methods: linear control and slide control technique.
In comparison to feedback loop configuration, feed-forward loop configuration has not gotten much attention in recent years. However, few studies reflect current advances in the field of produced water technology from the perspective of feed-forward control (Nudelman, C. J., 2024).
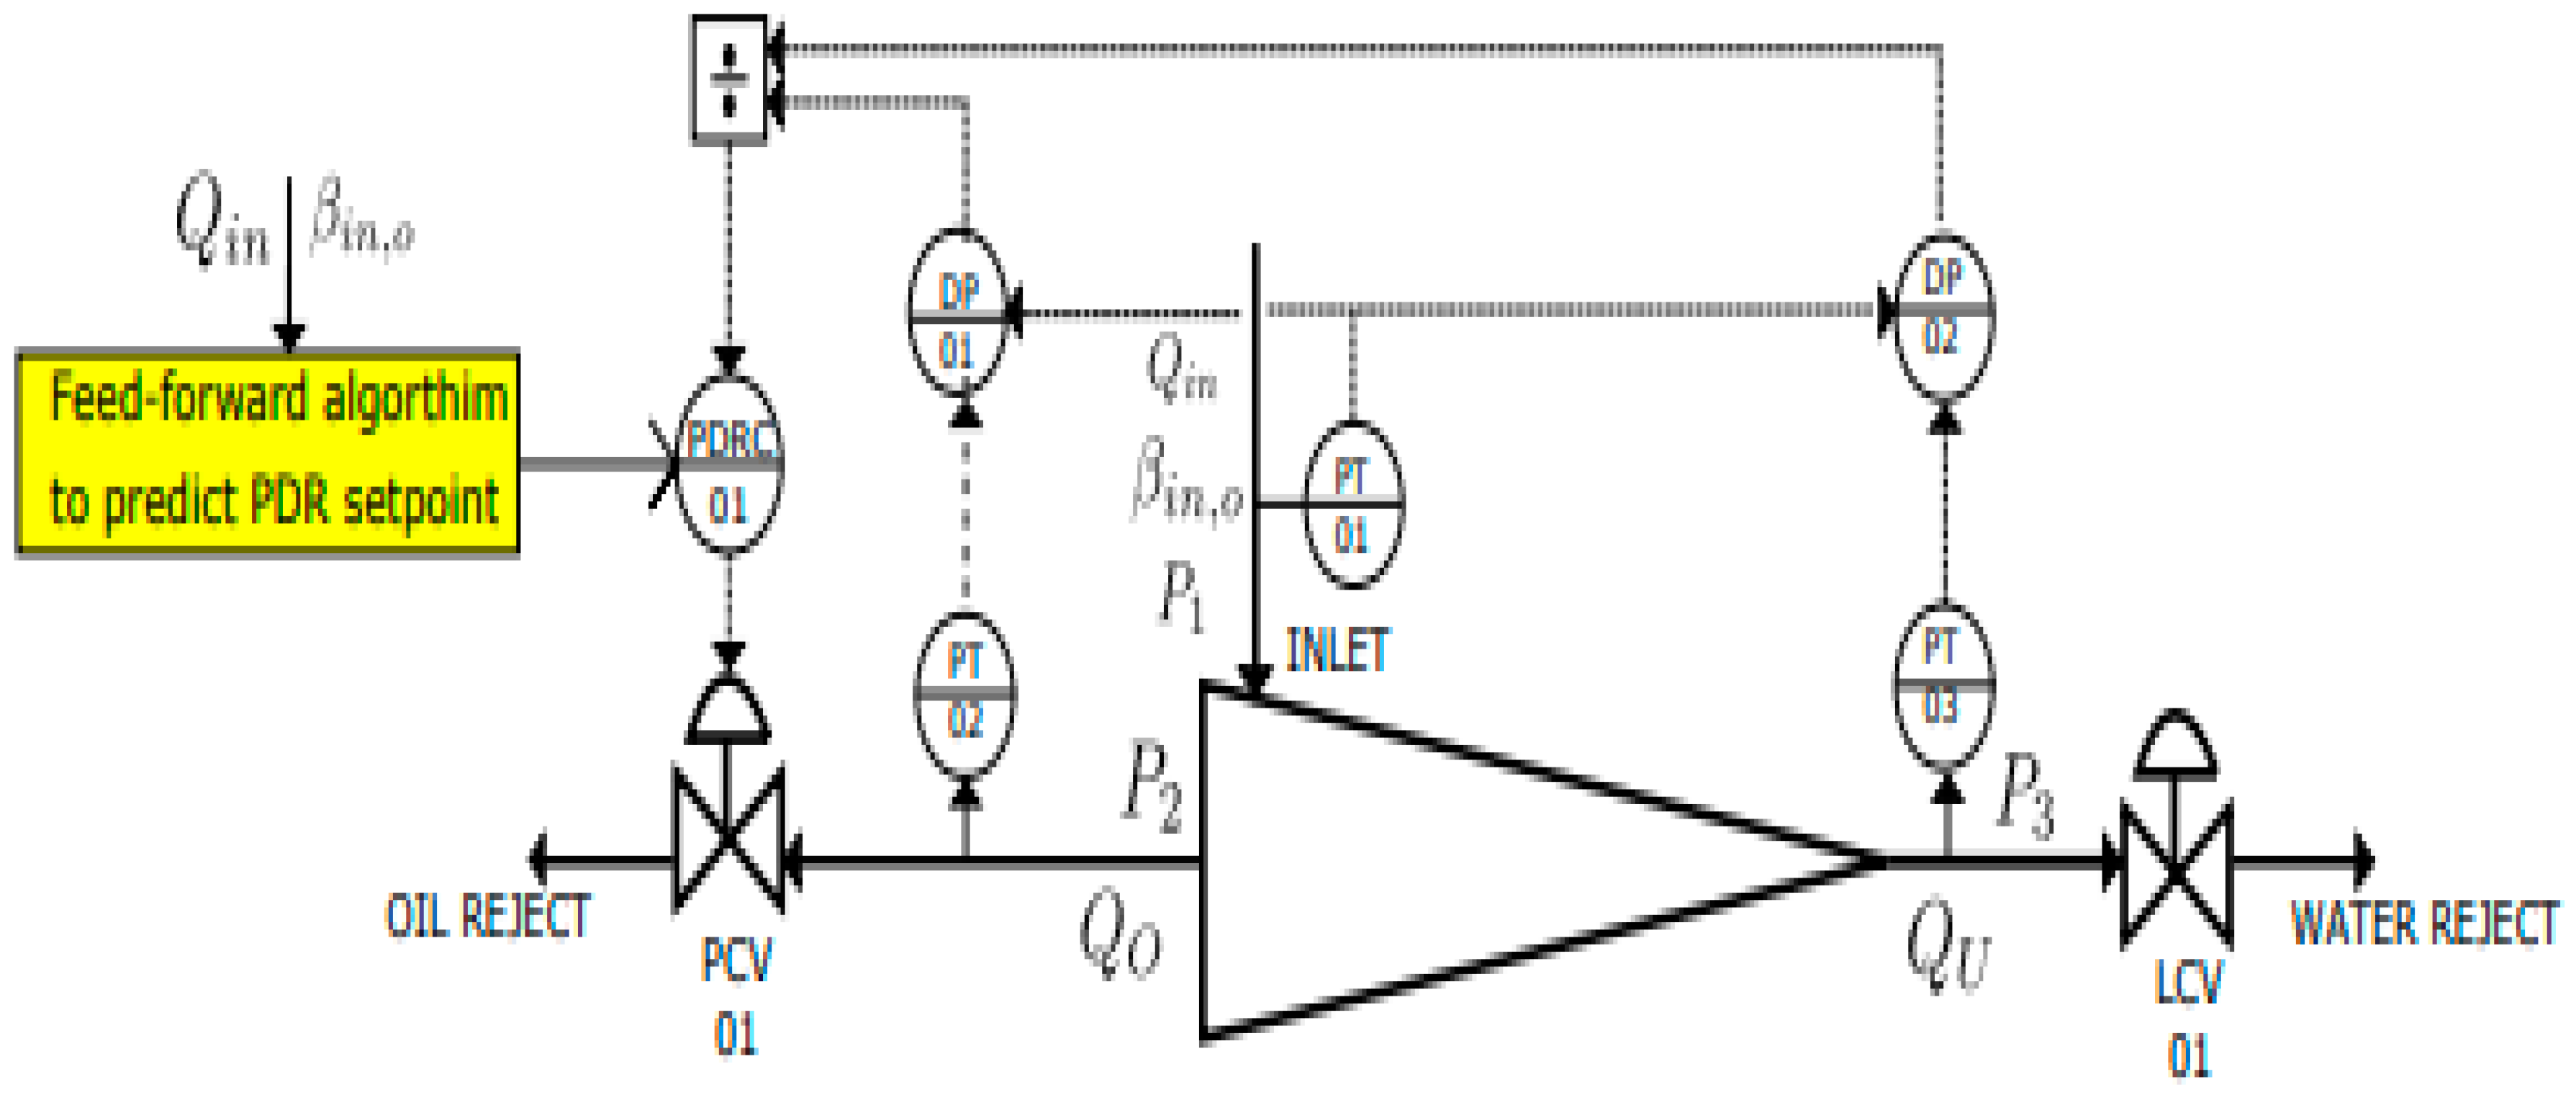
Feed-forward control can be utilized for disturbance compensation if the disturbance can be measured before it enters the system, according to Mishiga et al. (2021). A model is utilized in this control strategy to automatically alter system parameters based on certain metrics using a model. Mishiga et al. (2021) researched a produced water technology and offered a solution for hydrocyclones, and other comparable technologies, with short residency durations, which renders them more vulnerable to upstream alterations such as significant variations in inlet oil quality, input feed rate, and so on. They presented a variety of control systems, including a feedforward loop strategy using PID and PDR controllers. The feedforward approach employed in this research study is depicted schematically in
Figure 12 below (Mishiga et al., 2021).
9. Recent Advances in Control Loops
Two Proportional-Integral-Derivative (PID) controllers manage the level in the gravity separator as well as the pressure drop ratio (PDR) across the produced water treatment equipment in a traditional de-oiling and produced water treatment system in the oil and gas sector (Husveg, 2007). A classic de-oiling system, according to Husveg (2007), comprises multiple input multiple outputs (MIMO) configurations, however, it is most often regulated by a network of single input single output (SISO) PID controller loops which may or may not be governed by a certain form of framework-based controller approach. Most of these controllers are built and tweaked in an ad-hoc manner. However, it was discovered that an advanced model-based multiple-loop control technique, with many control objectives handled, would significantly enhance the performance of this type of system (Bernardino, L. F. et al., 2024).
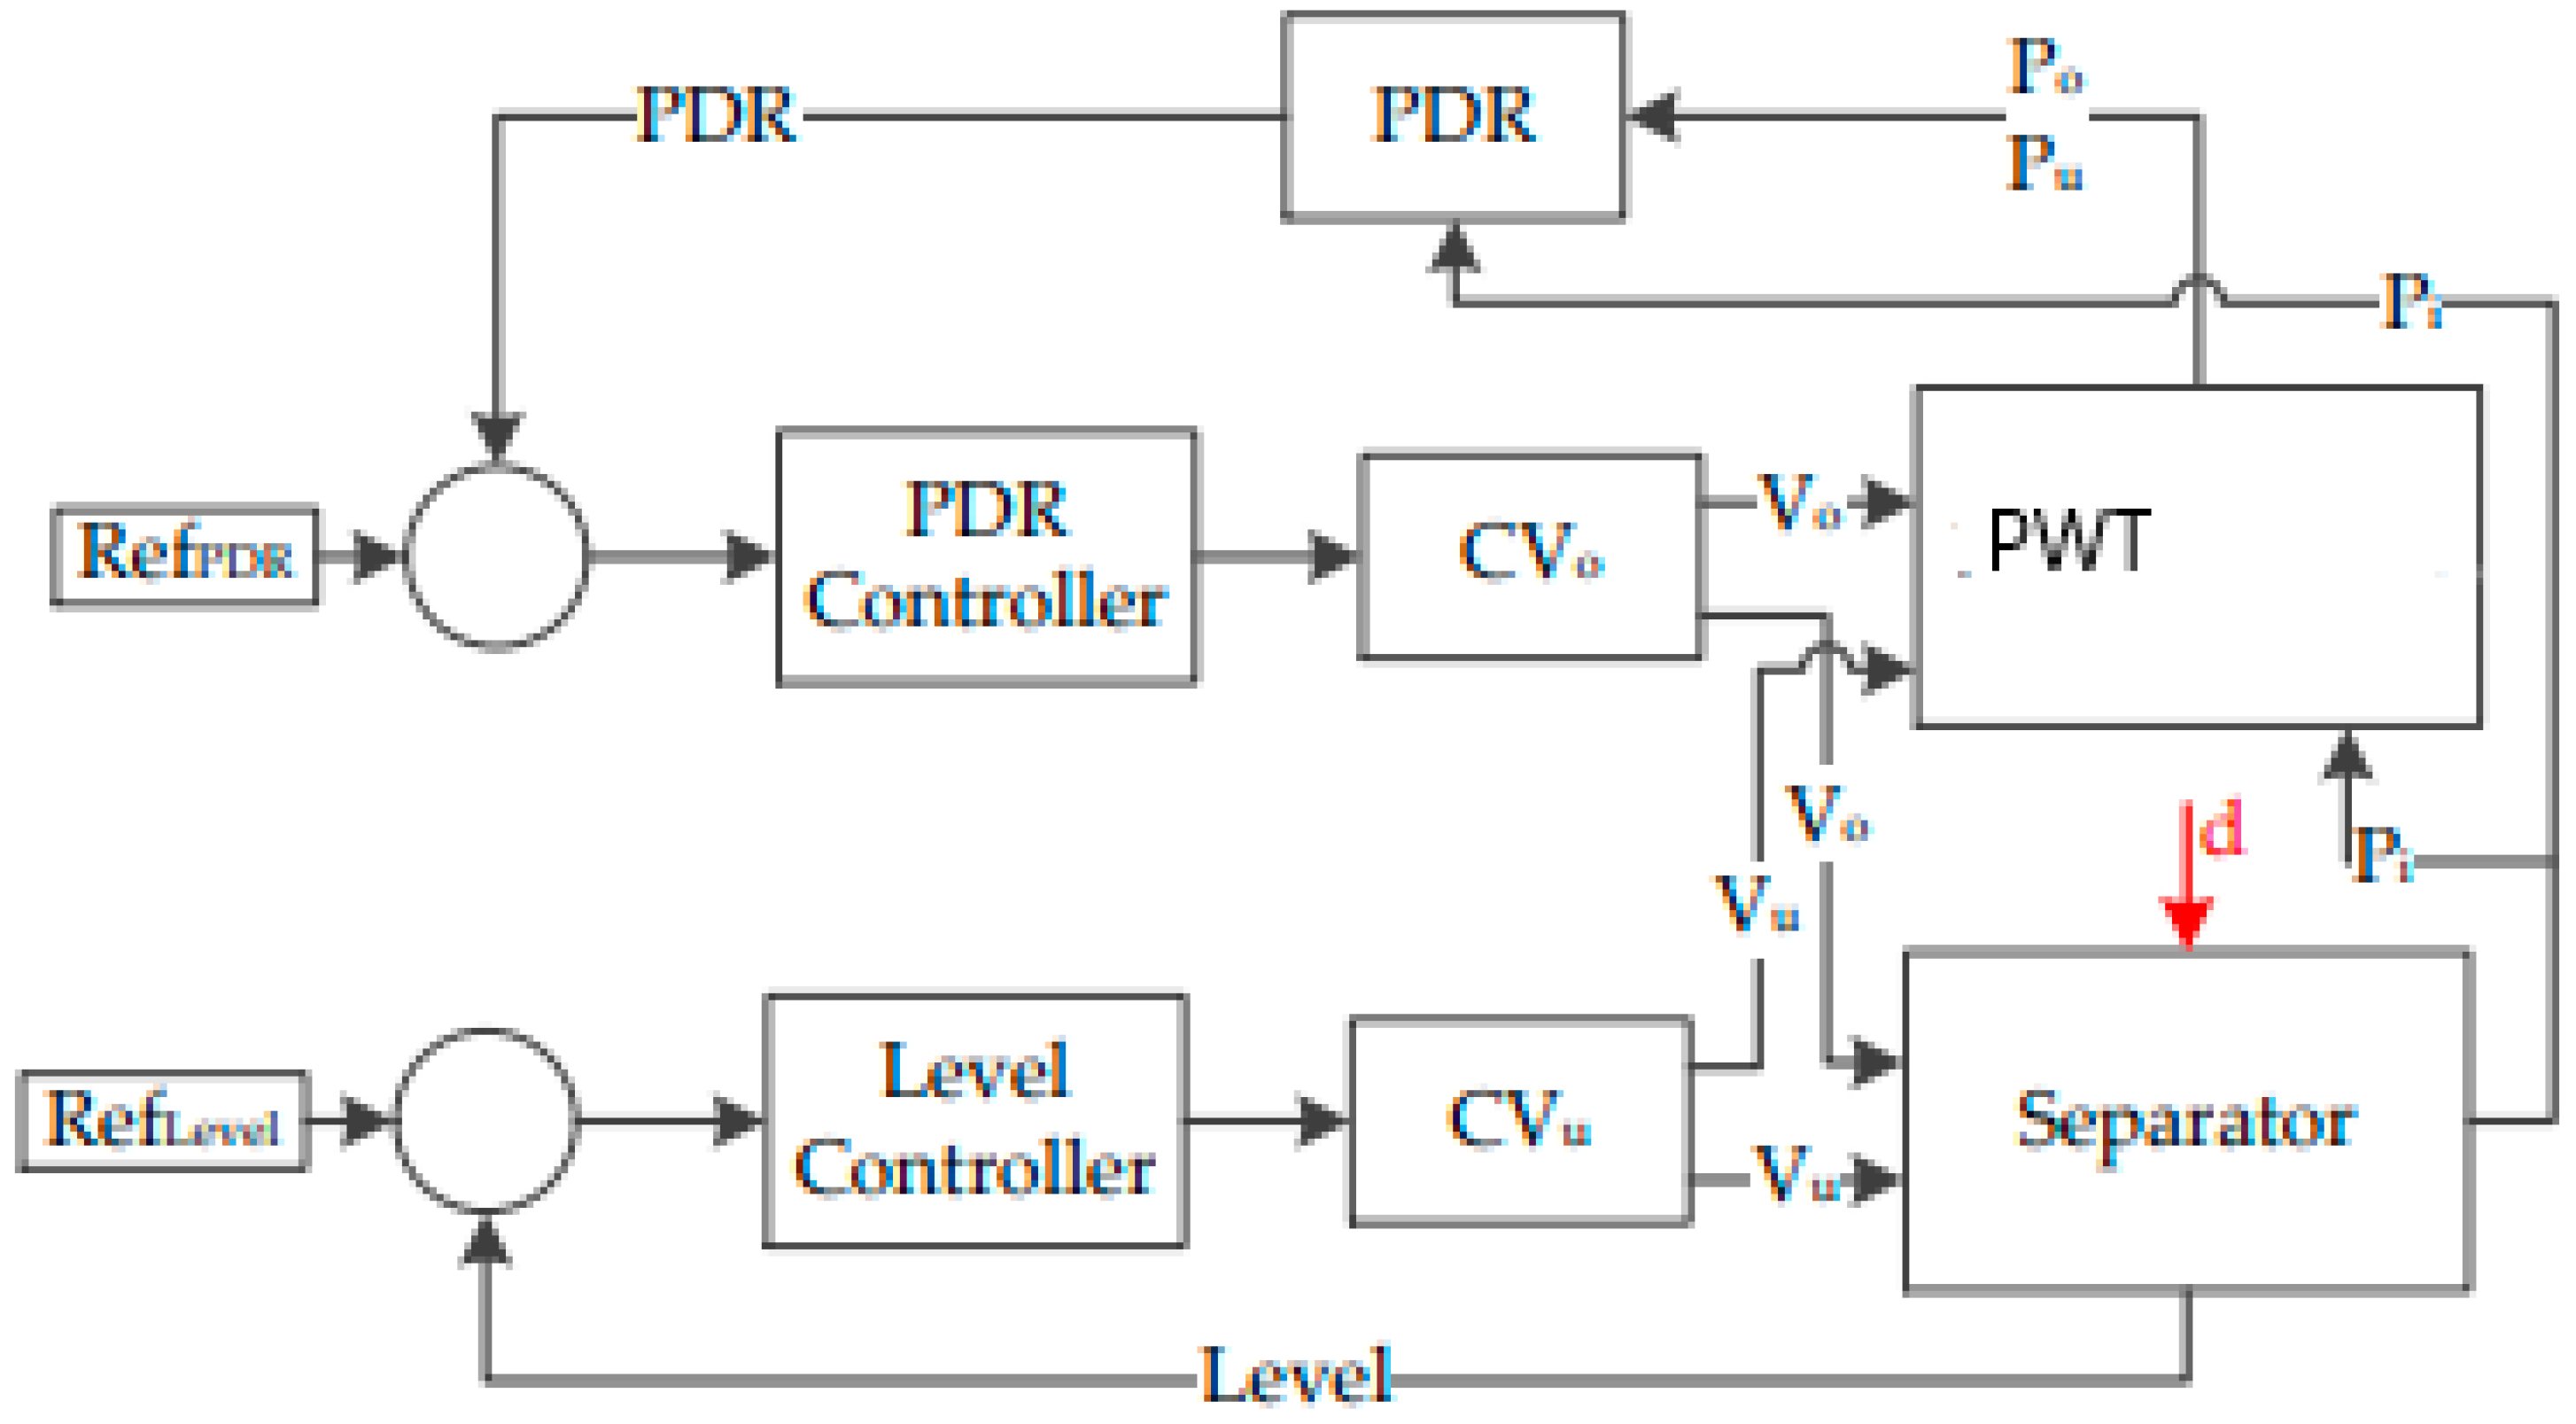
A robust control method is used, as provided by Durdevic et al. (2017) because it promises to manage the first objective and allows the benchmark monitoring to be relaxed while making sure that the system remains within a range. A process multi-control loop model of the system is required for the construction of such a control strategy. Durdevic et al. (2018) developed a multi-loop MIMO model to correct for the flaws in Durdevic et al. (2017) study. The major variables in the control loop that govern the gravity separator are the level in the separator and the opening of the underflow valve, hence they are included in this model.
Figure 13 exhibits the model and visual representation of the system that was constructed in this work, respectively. Only the model is depicted here. However, for a thorough explanation and conceptual foundation, see Durdevic et al. (2018). The PID and robust controllers were deployed on the scaled pilot plant and tested under various operating situations using the above-mentioned model. When compared to PID controllers, the robust control approach considerably led to the improvement of the produced water de-oiling technology with multiple control loops (Mohamed, M. et al., 2024).
Patel et al. (2019) developed an advanced hybrid strategy called advanced process control (APC) in the second half of the 2020s. APC is a multi-input as well as multi-output control loop technology that monitors multi-input parameters and forecasts the future behavior patterns of process variables while simultaneously attempting to manipulate multi-output variables to produce the desired outcomes. It is also valid, as per this research, for the operation of a single control loop in the desired produced water technology (Molina, P., et al., 2024).
Experimentation and simulation validation, on the other hand, have yet to be accomplished. Before the aforementioned findings of 2019, Patel et al. (2014) presented a good comparison between APC and the widely used Proportional Integral derivative (PID) control approach with a single strategy. The findings of this research study emphasize that the APC technique is more appropriate than the traditional PID strategy. Due to the typical method, the single loop control system was not investigated as fully as the feedback control setup (Monday, C., et al., 2024).
10. Process Monitoring in Produced Water Treatment
10.1. What Is Process Monitoring?
In a process, many variables/parameters must be kept within certain limits to keep said process running properly. Sometimes, a variable going beyond the limits, whether it be the lower or upper limit, can greatly impact the process safety, environment, product quality, and cost. Process monitoring consists of monitoring certain parameters, or variables, of the process in real time, not at the end of the process. The main reason monitoring is implemented in processes is to have the opportunity to react early to unusual operation situations (Dunn, n.d.). Routine monitoring is put into practice to ensure that the process variables are within the specified/needed limits. An abnormal process operation can be detected; monitoring can diagnose the cause. Monitoring can be used as a preventive strategy; the abnormal situation can be detected early enough to take corrective actions before the process is severely disturbed (Seborg et al., n.d., 2016). As engineers, it is important to know if the product dimensions/quality are stable, detect abnormalities in the process and react to them quickly, and be able to show and interpret data in efficient ways. Process monitoring is reactive, meaning that you are reacting to an event that happened and was monitored/measured rather than anticipating that event. Equipment failures, instrumentation malfunctions, and unexpected disturbances such as diminished catalyst activity and slowly drifting feed composition can all cause abnormal process performance. Severe anomalous conditions can have catastrophic consequences, including the forced shutdown of a plant. As a result, process monitoring and abnormal situation management are critical tasks (Seborg et al., n.d., 2016).
10.2. What Should Be Monitored in a Process?
Any variable, or parameter, of a process can be monitored. Examples of often monitored things are temperature, pressure, flow rate (mass or volumetric), conductivity, viscosity, level, pH, and many others. During a produced water treatment process, the following parameters may need to be monitored: flow, level, pressure, temperature, conductivity, pH, iron, free chlorine, turbidity, and ORP, which stands for oxidation-reduction potential (Smith, n.d.). There are several kinds of instrumentation used in the produced water treatment process. The level in a tank is measured by instruments made to physically detect the level (like floats) or by using the hydrostatic pressure at the bottom of the tank to figure out the level in the tank. The pressure inside a tank of pipe can be measured by gauge or differential pressure transmitters/transducers. Most level measuring instruments are based on pressure measurements. Analytical instrumentation is used to get measurements for pH, conductivity, free chlorine, and oxidation-reduction potential (ORP) (Smith, n.d.). Conductivity sensors/probes consist of two electrodes immersed in the liquid, in this case, the produced water. A voltage is then applied between the electrodes, and the measured voltage drop is used to calculate the conductivity. A temperature probe, or thermocouple, is immersed in the fluid and placed appropriately within the process to measure the temperature. To achieve an intelligent monitoring system, that would optimize the performance of the produced water treatment process, the following information could be required: temperatures, pressures, flow rates, interface levels, oil drop sizes, and concentrations, solids data, etc. (Ariaratnam et al., n.d.).
10.3. How Are Processes Monitored?
The classic method of process monitoring involves comparing measurements to predetermined limitations. This limit-checking approach is common in computer control systems and is used to confirm process variables like flow rate, temperature, pressure, and liquid level measurements. Process variables are monitored regularly. However, many important quality variables require taking a product sample and having it sent to the lab for analysis (Seborg et al., n.d., 2016). The instrumentation devices are connected to an automation system, commonly via a Fieldbus interface, which allows the system to perform the required control, monitoring and operator interface (Smith, n.d.). In many cases, the data measured and calculated is displayed in what is called a process monitoring chart, which is usually a time-series or sequence plot. This monitoring method is called statistical process control (SPC). Its main goal is to assess whether process operation is normal or abnormal by using process data and statistical methodologies. Many traditional SPC approaches are based on quality control charts. A Shewhart chart is the most basic control chart, consisting of data plotted against the sample number and control limits indicating the upper and lower limits for normal process functioning (Seborg et al., n.d., 2016).
10.4. Monitoring Configurations
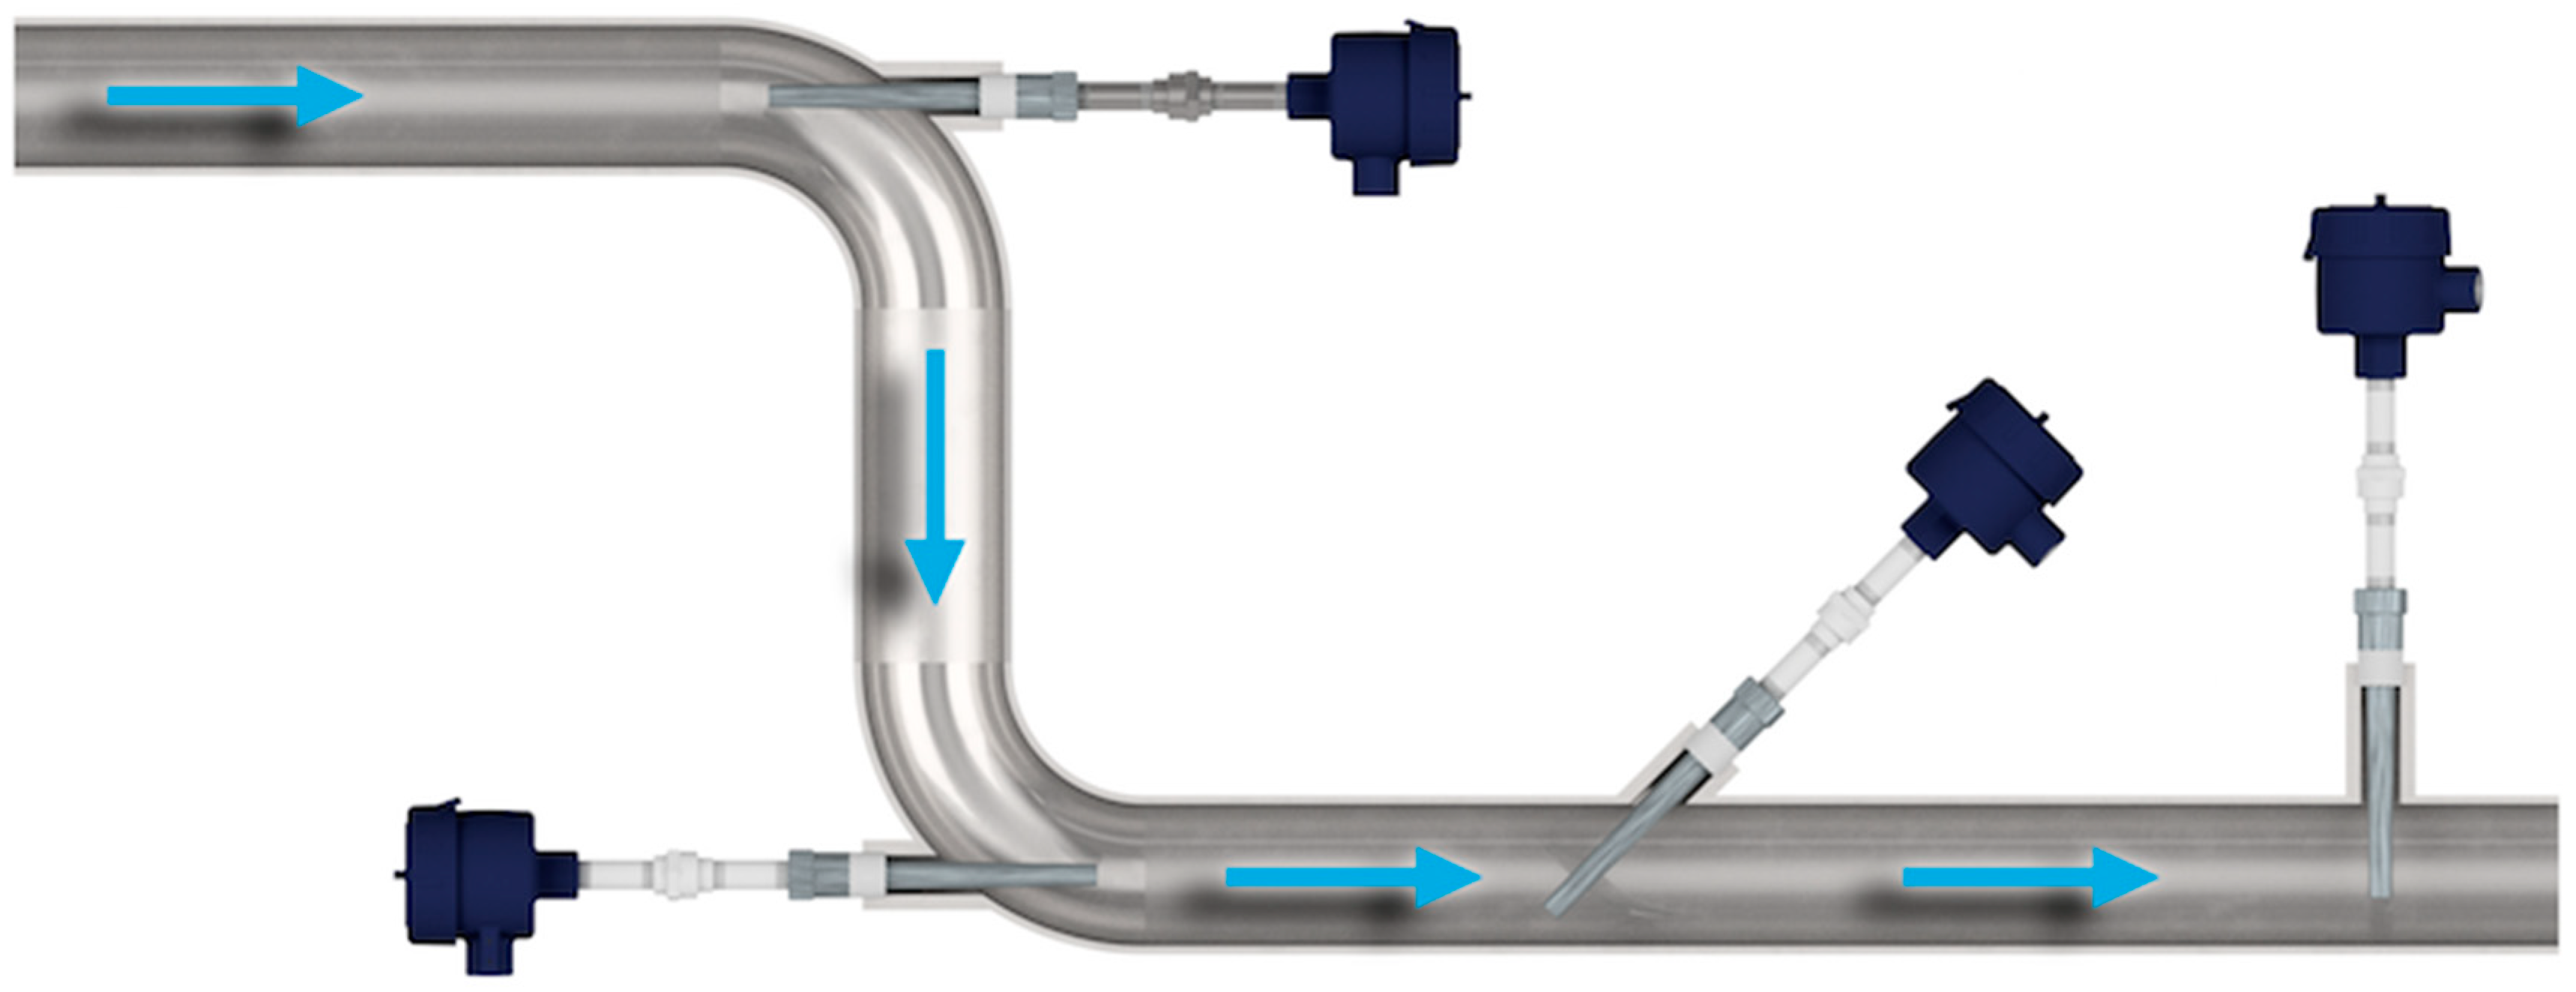
Inline probe – direct access to the process stream. A point of high turbulence is preferred for the placement of a probe. The probes are often inserted axially in the center of a pipe at a tee where the process stream turns 90 degrees. The issue of bubble formation in the measurement section due to a pressure drop is effectively eliminated (Crum et al., 2021). However, probes are inserted in various other ways, as shown in
Figure 14.
Inline probe configurations operate effectively if the process fluid is relatively clean and uniform. Because the probe is constantly immersed in the process fluid, automated maintenance and cleaning methods are limited. Fouling the optical window is a leading source of poor data quality in all continuous Oil-in-water (OiW) monitors. Hence a thorough cleaning routine is required (Crum et al., 2021).
Side stream – a small representative water stream is redirected to an external section where measurements are taken. It should be ensured that the stream entering the monitor is truly representative of the process stream. A tie-in position with turbulent water flow, such as immediately downstream from an elbow, tee, or pump, is desirable. If that isn't possible and the flow is likely to be partially stratified, a quill can be put into the center of the pipe to capture a side stream that is more indicative of average process conditions (Crum et al., 2021).
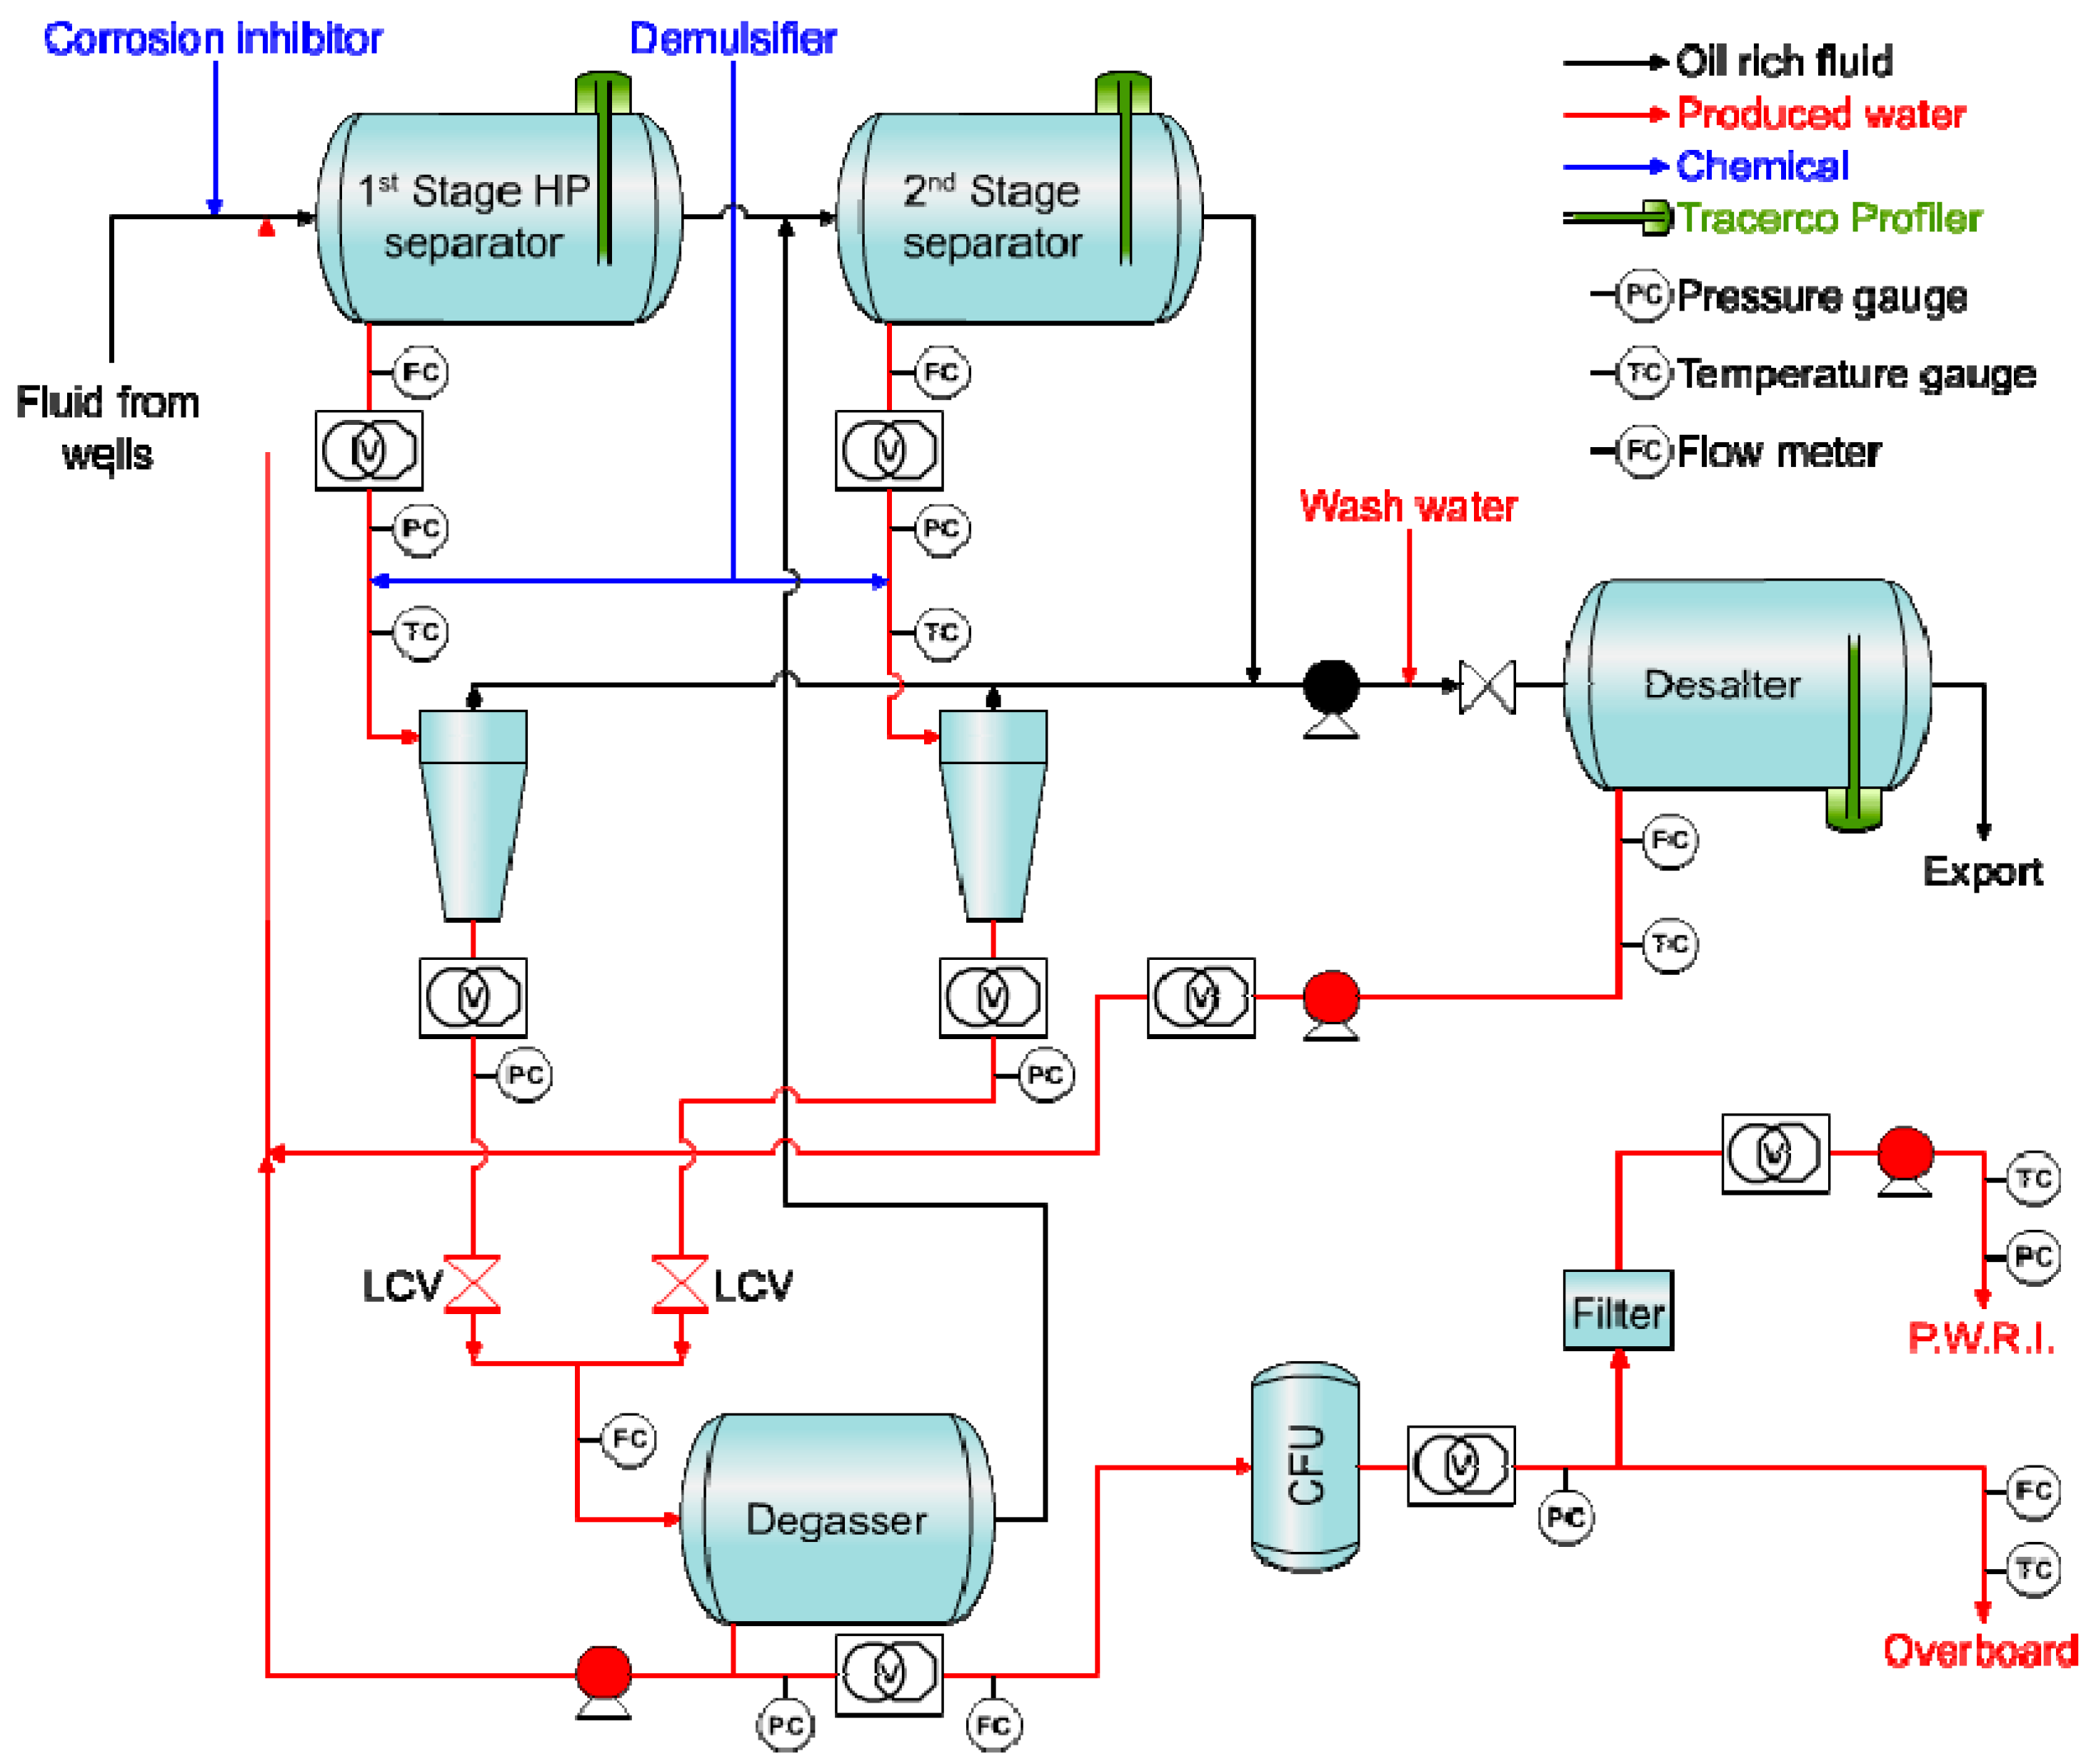
To achieve an intelligent and/or automated monitoring system, which would optimize the performance of the produced water treatment process, the following information could be required: temperatures, pressures, flow rates, interface levels, oil drop sizes, and concentrations, solids data, etc. (Ariaratnam et al., n.d.). “An ideal system would include Tracerco Profiler in separators and desalters; ViPA’s downstream of separators, hydrocyclones, desalters, degasser/floatation units, and upstream PWRI injection pumps; as shown in
Figure 15” (Ariaratnam et al., n.d.). Monitoring devices in all of these sites would allow for greater process control of the plant's produced water, as well as the ability to skip some separation phases if the water quality is acceptable (Ariaratnam et al., n.d.). Online monitors would provide continuous, real-time information, which can be used for optimization (Dr. Ming, 2019).
In water treatment, you can have manual monitoring, continuous online monitoring, as well as other monitoring techniques. During manual monitoring, chemical tests are conducted by plant operators or technicians, and those results are compared to defined chemical control limits. Depending on the resources available, the sampling frequency can range from once a day to once an hour. Tests may be performed on the pH, conductivity, suspended particles, alkalinity, hardness, and/or other parameters. Based on the results of the tests, the plant operator estimates the degree of change required and manually readjusts a chemical feed pump or blowdown valve (Chapter 36-Monitoring And Control Of Water Treatment, n.d.). However, manual monitoring has its limitations. Continuous, online monitoring, which has automatic instrumentation, proves a greater level of precision than manual monitoring could. There is a wide range of instrumentation available to monitor water treatment systems as a result of major technological advances in electronics and microprocessor technology over the past decade (Hossain, N., et al., 2024).
Conductivity controllers have become more reliable and sophisticated as a result of those advancements. Electrode-type probes are the most common conductivity probe used; however, an electrodeless probe, also known as a toroidal probe, must be used (Chapter 36-Monitoring And Control Of Water Treatment, n.d.). The monitoring systems for other parameters, just like conductivity, have also become more advanced and accurate. Due to past advancements in technology, the monitoring systems for water treatment have become more dynamic, just like the process itself. Seeing that technology keeps evolving, soon enough there will be more effective and cost-efficient ways to monitor the produced water treatment process that will allow for more drilling operations to have their produced water, or even their flow back water, treated (Eyitayo, S. I., et al., 2024).
11. Real-Time Optimization
Production optimization is a balance between production rate and deliverability of the demand providing a good understanding of the processing system and reservoir fluid. Real-time Optimization (RTO) is a method for finding optimal performance settings (Zhao, j., et al.,2024).
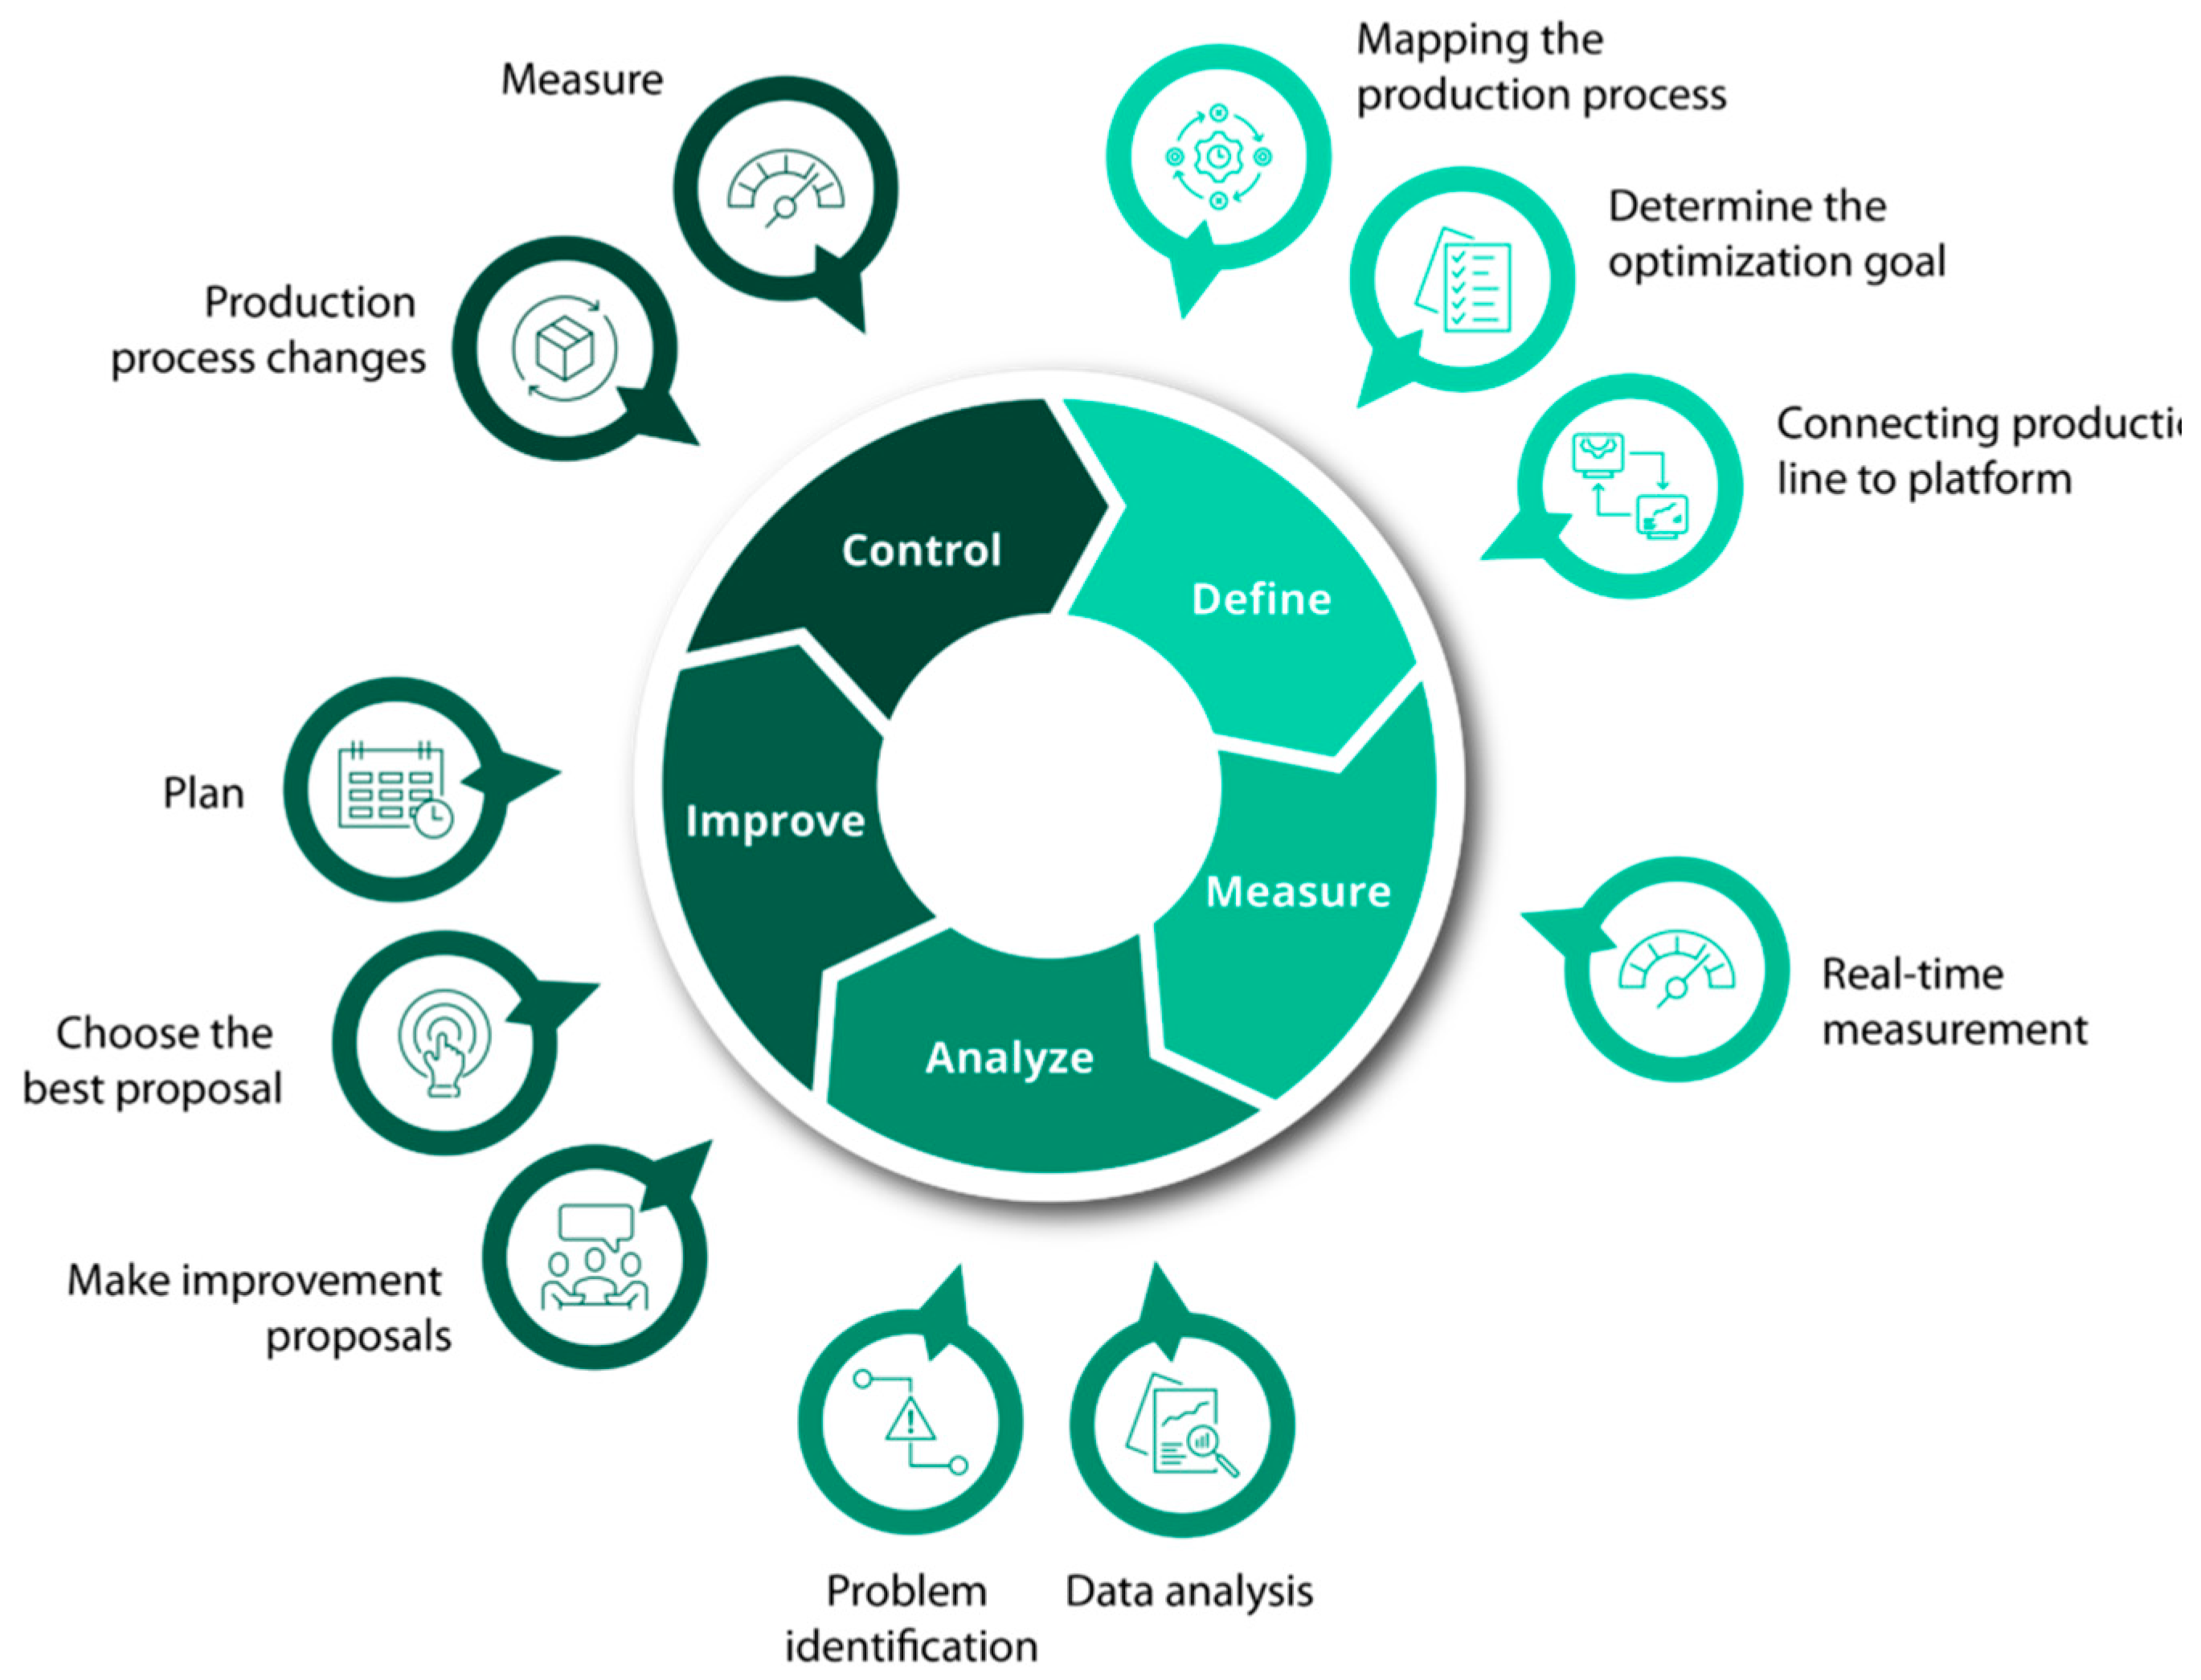
Figure 16 below looks at how the production process may be optimized in 5 steps.
The first step is defining what you want to improve, and which production line is causing the most issues or easiest to interpret. A simple model of the production process must be mapped out, which is usually already done. Then begin setting the goals for you wish to accomplish which can be a reduction of energy consumption or overall effectiveness of the equipment by a particular percentage. Feed all necessary data into the data platform to optimize the process, avoiding any data points that may be inaccurate (Herbert, 2019).
The second step is being measured, meaning the measurements are taken as soon as data points are connected, they are monitored and used as a baseline for any analysis used in step 3. Data is collected for 14 days which then brings us to step 3. Analyzation of the data collected is used by observing the behavior and quality of the product to be able to establish where corrections are necessary to reach the goal. Based on the data analysis, there can be a conclusion drawn from where it is that takes the most value from the company meeting its goal (Rijksen, 2021).
The fourth step is where improvements are made by proposing different ideas and forming a plan from the most cost-effective and possible options. The execution of a final proposal is decided by the team to avoid any shutdown time. Once a plan has formed, step 5 comes into place. The production changes are made and checked for the results of the newly implemented plan and once again any further improvements that may need to be made (Rijksen, 2021).
12. Optimization technology in-depth
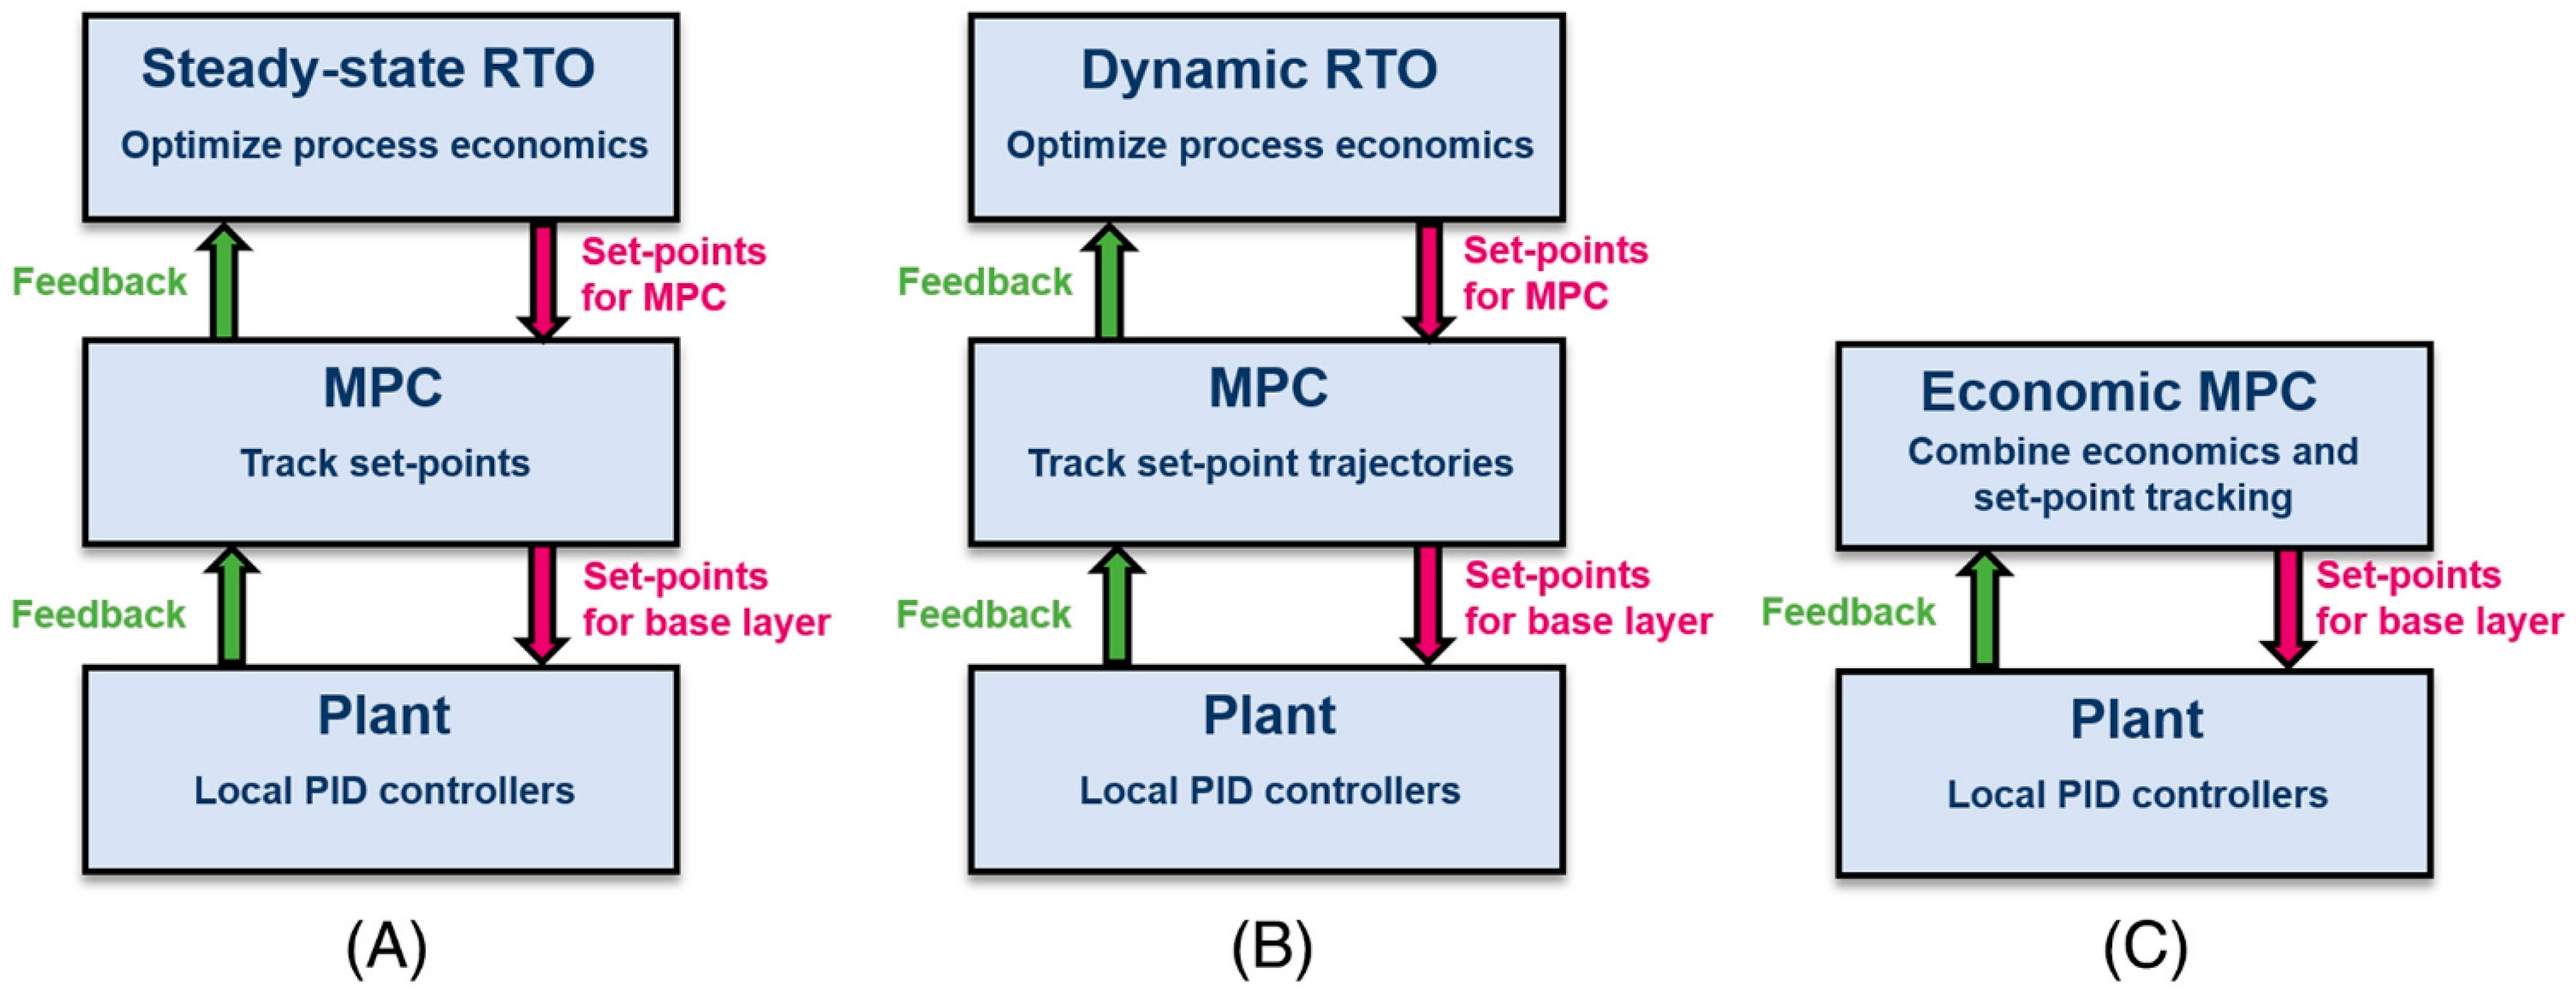
Real-time Optimization better known as RTO technology has emerged as an indispensable use of tech to increase production economically using a steady-state process by using its algorithmic tendencies in order to compute an efficient course of action. The advantage is that there is no need for any new equipment. The only thing needed is a yearly subscription for the software being used. There has been a major increase in the cost of energy and raw materials in the last two decades. Because of this, there have been many changes in the quality of production. Competition, environmentally friendly measures, and safety concerns have also contributed to the matter.(Ganji et al., 2015) A chemical process is manipulated by many variables including human interference, which is why a smart process was developed. Smart processes can respond fittingly to variations throughout your process. RTO systems command the contraption of closed-loop processes to automatically maintain the operating conditions of the process to an optimized state as close as possible (Speakman & Francois, 2019).
Dynamic RTO (DRTO) uses dynamic process modeling and low-cost computation to further detail the ideal simulation for optimization. DRTO is better used for nonlinear systems. The major difference between the two systems is that RTOs are a two-step process. However, DRTOs can calculate an optimal path in one step. Real-Time Product Optimization has increased oil and gas production by as much as 3 to 8 percent. Other key factors that are of great benefit to the oil and gas industry is there is no need for much investment in equipment and there is also a decrease in production losses. Simulations can be done to imitate the unforeseen incidents or even better, to see if changes can be made to further improve production. You are getting the latest data so you may make the most desired decision for the process in action (Weigert et al., 2020). In
Figure 17, the differences between RTO and DRTO can be observed within the MPC (Model Predictive Control).
To break down the process, the electrical signals are sent from the servers called slaves to the master also known as a driver. The driver receives these messages and distributes the messages or electrical signals known as tasks accordingly to the executors. These executors are in charge of processing the task and then sending it to a centralized storage or a database incrementing per second. A spark driver can initiate micro-batching. Meaning, that instead of taking this received data and delivering it per second, it compiles it for a few seconds. For example, if the driver waited 2 seconds, then it converts the collected tasks into a data type called resilient distributed dataset (RDD). Let's say that the number of tasks increases from 2000 messages per second to 6000 tasks per second. There is no need to panic, the only thing that must be done is add more executing machines to push the data-structured messages once they are processed into the database. This will add more computing power and the driver will continue to simply distribute the messages to the appropriate executor. Once the tasks are separated it is then sent to a database or a file depending on which executor it was sent to. Continuous operating models work slightly differently. You have what is called an operator which needs to be coded beforehand. You initiate a code with predefined methods taking the place of the master or driver that separates the incoming messages to the indicating operators. The codes are separated using the beginning number, it is given a name depending on the information it is transcribing (Bonner et al., 2017).
There are many ways to transfer data to the centralized storage or database, once that is completed and you begin receiving data, software is used to indicate what changes need to be made. The software indicates if any parameters deviated too far off from their set integers indicating either a problem or that modifications may need to be put into place. Process optimization programs have the capabilities to do material balance, mass and volume balance, heat and material reconciliation, mass and heat balances, rigorous data reconciliation, mass, heat and equilibrium, gross error detection, performance monitoring for reconciliation and simulation to achieve what every employer wants to hear, peak optimization. These types of programs offer reliable results because of their great accuracy (Krishnamoorthy et al., 2018).
“What if” scenarios can be simulated using precise models that will operate in the real-life conditions of the area being assessed. Web-based dashboards are used to visualize the fed results. Programs such as these are so precise, they will even notify you of the performance of your equipment including exchanger fouling, catalyst activity, compressor, and column tray efficiencies. This will effectively allow any user to pinpoint any issues with the equipment should they arise. To have an unscheduled shutdown in a continuous process, or accidents can create great monetary losses for the company. Thankfully, because of these programs problems can be quickly identified before incidents such as this occur (Krishnamoorthy et al., 2018).
13. Conclusions and Future Works
Innovations throughout technology have helped engineers overcome different types of challenges ranging from time management, safety, expenses, and more environmentally friendly solutions all over the world. With each new invention and development, industries can improve productivity at a lower cost. The development of computers has changed the lives of engineers making it easier to develop solutions. Everyday data analytics in the oil and gas industry draw more profit from decisions to cut the industry’s carbon emissions. Automation is finding ways to improve safety with the help of robotics to reduce the requirement of costly labor and reduce human error. Intelligent automation is being developed to reduce the time it takes to detect, diagnose, and solve issues that may occur out on the field.
There is a paucity of literature on the systematic design of control techniques for produced water treatment technologies in the petroleum and gas sectors, including the standardized PID-based PDR control discussed in the preceding sections. There is no structured way to tuning these controllers described in those control strategies, other than lengthy empirical tunings, yet various control designs for separation can be identified. Studies should be carried out in the future to resolve this complex challenge. Furthermore, when increases in the inflow concentration occur, the standard control technique in produced water technologies struggles to maintain efficiency. Three novel control techniques were proposed because of this problem: feedback or cascade, feed-forward, and Model Predictive Control (MPC). Feedback configuration has already been created and tested in a controlled environment. MPC, on the other hand, has yet to be tested in a real-world setting. As a result, academics should pay attention to this field of study in order to gain more insight into this issue in the future.
In the previous sections, it was also noted that research data were scarce for feedforward configuration and single loop control approach. As a result, these topics should be thoroughly studied in future research. Furthermore, there was less research that focused on improving the performance of control loops for produced water technologies. As a result, greater attention is needed to propose some strategies for improving the control loops' efficiency. Finally, further modeling and testing work is necessary to verify and validate the prior research's theoretical findings.
References
- Al Ismaili, S. (2024, March). Conceptual Selection of Disposal Alternative for Low-Carbon Water Handling Systems. In SPE Water Lifecycle Management Conference and Exhibition (p. D011S003R003). SPE.
- Ali, A., Jassim, N., & Faris, M. N. (2024). Produced Water Treatment by Adsorption: A Review. Journal of Advances in Engineering Research, 27(2), 1-10.
- Alkalbani, A. M., & Chala, G. T. (2024). A Comprehensive Review of Nanotechnology Applications in Oil and Gas Well Drilling Operations. Energies, 17(4), 798. [CrossRef]
- Afenu, D. S., Asiri, M., & Saxena, N. (2024). Industrial Control Systems Security Validation Based on MITRE Adversarial Tactics, Techniques, and Common Knowledge Framework. Electronics, 13(5), 917. [CrossRef]
- Amin, A. A. (n.d.). Advanced process control and real-time optimization. Control Engineering. Retrieved April 24, 2024, from https://www.controleng.com/articles/advanced-process-control-and-real-time-optimization/.
- Ariaratnam, G. D., Roth, N. J., & Limited, J. (n.d.). Produced water-process problem or process control.
- Arora, J., Chauhan, A., Ranjan, A., Rajput, V. D., Minkina, T., Zhumbei, A. I., ... & Prasad, R. (2024). Degradation of SDS by psychrotolerant Staphylococcus saprophyticus and Bacillus pumilus isolated from Southern Ocean water samples. Brazilian Journal of Microbiology, 1-13. [CrossRef]
- Bansal, R., & Dubey, A. K. Communication protocols used for industrial automation. In Computational Intelligence in the Industry 4.0 (pp. 73-94). CRC Press.
- Bernardino, L. F., & Skogestad, S. (2024). Decentralized control using selectors for optimal steady-state operation with changing active constraints. Journal of Process Control, 137, 103194. [CrossRef]
- Bonner, S., Kureshi, I., Brennan, J., & Theodoropoulos, G. (2017). Exploring the evolution of big data technologies. In Software Architecture for Big Data and the Cloud (pp. 253–283). [CrossRef]
- Bram, M. V. (2020). Grey-box modeling and validation of deoiling hydrocyclones.
- Canbolat, H. (2009). A novel level measurement technique using three capacitive sensors for liquids. IEEE transactions on Instrumentation and Measurement, 58(10), 3762-3768. [CrossRef]
- Çavdar, B., Şahin, E., & Sesli, E. (2024). On the assessment of meta-heuristic algorithms for automatic voltage regulator system controller design: a standardization process. Electrical Engineering, 1-39. [CrossRef]
- Chapter 36-Monitoring and Control of Water Treatment. (n.d.). Water Handbook. Retrieved March 31, 2022, from https://www.suezwatertechnologies.com/handbook/chapter-36-monitoring-and-control-water-treatment.
- Chang, G., Liu, Y., Luo, Z., Ni, K., Zhang, P., Zhou, T., ... & Wang, X. (2024). Response surface methodology to optimize the sterilization process of slightly acidic electrolyzed water for Chinese shrimp (Fenneropenaeus chinensis) and to investigate its effect on shrimp quality. Food Chemistry: X, 101180. [CrossRef]
- Chehaitly, M., Tabaa, M., Borras, J. Q., Monteiro, F., & Chatzinotas, S. (2024). Error Correcting Codes Analysis for Wireless Industrial Communication based on Wavelet Packet Architecture.
- Coca-Prados, J., & Gutiérrez-Cervelló, G. (Eds.). (2010). Water purification and management. Springer.
- Collins, A. (1975). Geochemistry of oilfield waters. Elsevier.
- Crum, B., Wilcox, A., & Oulman, S. (2021). Closing the loop: Real-time measurement of oil in water for process facilities. World Oil, 242(5). Retrieved from https://www.worldoil.com/magazine/2021/may-2021/features/closing.
- Das, T., & Jäschke, J. (2018). Modeling and control of an inline deoiling hydrocyclone. IFAC PapersOnLine, 51(6), 138-143. [CrossRef]
- DeLancey, A. (2020). Thermowell installation best practices - WIKA blog.
- Design of a PID Control System for a Wastewater Treatment Plant. Bados, J. S. F., & Morejon. (n.d.).
- Dilib, F. A., & Jackson, M. D. (2013). Closed-loop feedback control for production optimization of intelligent wells under uncertainty. SPE Production & Operations, 28(4), 345-357. [CrossRef]
- Dr. Ming, Y. (2019). Produced water management. AWE Magazine.
- Dunn, K. (n.d.). 3.3. What is process monitoring about? — Process Improvement using Data.
- Durdevic, P., Pedersen, S., & Yang, Z. (2017). Operational performance of offshore de-oiling hydrocyclone systems. In IECON 2017-43rd Annual Conference of the IEEE Industrial Electronics Society.
- Durdevic, P., Pedersen, S., & Yang, Z. (2017). Challenges in modelling and control of offshore de oiling hydrocyclone systems. Journal of Physics: Conference Series, 783. [CrossRef]
- Durdevic, P., Pedersen, S., Bram, M., Hansen, D., Hassan, A., & Yang, Z. (2015). Control oriented modeling of a de-oiling hydrocyclone. IFAC-PapersOnLine, 48(28), 291-296. [CrossRef]
- Eyitayo, S. I., Watson, M. C., Kolawole, O., Xu, P., Bruant, R., & Henthorne, L. (2024). External utilization of oil and gas produced water: Why is the industry hesitant to full-scale implementation?. Environment, Development and Sustainability, 26(1), 89-108. [CrossRef]
- Fakhru’l-Razi, A., Pendashteh, A., Abdullah, L. C., Awang Biak, D. R., Madaeni, S. S., & Abidin, Z. Z. (2009). Review of technologies for oil and gas produced water treatment. Journal of Hazardous Materials, 170. [CrossRef]
- Fire Suppression Systems Protect Frac Pads in Oil & Gas. (n.d.).
- Gai, H. (2001). Downhole flow control optimization in the world’s 1st extended reach multilateral well at Wytch Farm. In SPE/IADC Drilling Conference. OnePetro.
- Ganji, H., Shokri, S., Marvast, M. A., Abghari, S. Z., & Nonahal, B. (2015). Implementing real time optimisation technology.
- Goda, A., Matsui, C., & Takeuchi, K. (2024). Stochastic Resonance Modeling of Floating Gate-Based Neurons in Summing Networks for Accurate and Energy-Efficient Operations. IEEE Transactions on Electron Devices. [CrossRef]
- Gopi, P., Reddy, S. V., Bajaj, M., Zaitsev, I., & Prokop, L. (2024). Performance and robustness analysis of V-Tiger PID controller for automatic voltage regulator. Scientific Reports, 14(1), 7867. [CrossRef]
- Gomes Jr, M. N., Taha, A. F., Rápallo, L. M. C., Mendiondo, E. M., & Giacomoni, M. H. (2024). Real-time Regulation of Detention Ponds via Feedback Control: Balancing Flood Mitigation and Water Quality. arXiv preprint arXiv:2403.04675.
- Hardberger, A. (2024). The Challenges and Opportunities of Beneficially Reusing Produced Water. In Duke Environmental Law & Policy Forum (Vol. 34, No. 1, pp. 1-48). Duke University School of Law.
- Hayes, T., & Arthur, D. (2004). Overview of emerging produced water treatment technologies. In 11th Annual International Petroleum Environmental Conference, Albuquerque, NM.
- Hayes, T., & Arthur, D. (2004). Overview of emerging produced water treatment technologies. In 11th Annual International Petroleum Environmental Conference, Albuquerque, NM.
- Herb, S. (2008). Hybrid (PAC) systems: pathway to productivity. Assembly Automation, 28(1), 10-17. [CrossRef]
- Herbert, R. (2019). OSIsoft: Real-time data strategy for advanced oil & gas operations - Milan | Sigmafine.
- Hethcox, J. C., Kim, J., Johnson, H. C., Ji, Y., Chow, M., Newman, J. A., ... & McMullen, J. P. (2024). Evolution of a Green and Sustainable Manufacturing Process for Belzutifan: Part 2─ Development of a Scalable Nickel-Catalyzed Sulfonylation. Organic Process Research & Development. [CrossRef]
- Hossain, N., Al Mahmud, M. Z., Hossain, A., Rahman, M. K., Islam, M. S., Tasnim, R., & Mobarak, M. H. (2024). Advances of Materials Science in MEMS Applications: A Review. Results in Engineering, 102115.
- Igunnu, E. T., & Chen, G. Z. (2014). Produced water treatment technologies. International Journal of Low Carbon Technologies.
- In-depth Review of the Statoil Well Pad Fire - FracTracker Alliance. (n.d.).
- Introduction to PID — FIRST Robotics Competition documentation. (n.d.).
- Jahan, N., Niloy, T. B. M., Silvi, J. F., Hasan, M., Nashia, I. J., & Khan, R. (2024). Development of an IoT-based firefighting drone for enhanced safety and efficiency in fire suppression. Measurement and Control, 00202940241238674.
- Jepsen, K. L., Bram, M. V., Pedersen, S., & Yang, Z. (2018). Membrane fouling for produced water treatment: A review study from a process control perspective. Water. [CrossRef]
- Johnson, A., Boucher, M., & Pink, S. (2024, February). Rethinking Event Detection and Drilling Processes Using High-Speed Downhole Telemetry and MPD Know-How. In International Petroleum Technology Conference (p. D031S091R007). IPTC.
- Judd, S., Qiblawey, H., Al-Marri, M., Clarkin, C., Watson, S., Ahmed, A., & Bach, S. (2014). The size and performance of offshore produced water oil-removal technologies for reinjection. Separation and Purification Technology. [CrossRef]
- Kaur, K., & Kaur, A. (2024). In silico, in vitro, and in vivo validation of a microwave imaging system using a low-profile Ultra Wide Band Archimedean spiral antenna to detect skin cancer. International Journal of Imaging Systems and Technology, 34(1), e23016. [CrossRef]
- Karadol, H., Aybek, A., Ucgul, M., Kuzu, H., & Gunes, M. (2024). Field Sprayer with Application Rate Control Using Fast Response Proportional Valves under Variable Speed Conditions. Agriculture, 14(3), 361. [CrossRef]
- Karlsson, D. (2024). A case study of SCADA implementation for small electrical producers in WideQuick.
- Khairullin, A. (2012). Closed-loop feedback control of intelligent wells: Application to the SPE Brugge model (PhD diss.). Centre for Petroleum Studies, Department of Earth Science and Engineering.
- Khaled, M. S. (2020). Plantwide simulation and monitoring of offshore oil and gas production facility (Doctoral dissertation, Memorial University of Newfoundland).
- Khurshid, A. A., Soni, S., Minase, A., Bonkinpalliwar, A., & Jain, D. Iot-Enabled Embedded Virtual Sensor for Energy-Efficient Scalable Online Water Quality Monitoring System. Available at SSRN 4750832.
- Krishnamoorthy, D., Foss, B., & Skogestad, S. (2018). Steady-state real-time optimization using transient measurements. Computers and Chemical Engineering, 115, 34-45. [CrossRef]
- Lirette, A. O., Chen, Y. J., Freyria, N. J., Góngora, E., Greer, C. W., & Whyte, L. G. (2024). Characterization of hydrocarbon degraders from Northwest Passage beach sediments and assessment of their ability for bioremediation. Canadian Journal of Microbiology. [CrossRef]
- Madhi, A. A., Reddy, V. B., Al Ameri, L., Abdelmobdy, M., Goswami, N. H., AlAwlaqi, A. O., ... & Fandino, A. (2024, March). Water Management Strategy Across ADNOC Oil and Gas Operations. In SPE Water Lifecycle Management Conference and Exhibition (p. D021S006R001). SPE.
- Manoj, K. S. (2019). Industrial automation with SCADA: concepts, communications and security. Notion Press.
- Michael, I. A. (2022). Design of Lift Group Control Systems based on PLC. Journal of Engineering Research and Reports, 22(3), 31-44. [CrossRef]
- Monday, C., Zaghloul, M. S., Krishnamurthy, D., & Achari, G. (2024). A Review of AI-Driven Control Strategies in the Activated Sludge Process with Emphasis on Aeration Control. Water, 16(2), 305. [CrossRef]
- Mohamed, M., & Igor, B. (2024, March). Development of a Multi-Controller Tuning Strategy and Rules for Oily Water Treatment Plant. In SPE Water Lifecycle Management Conference and Exhibition (p. D021S010R004). SPE.
- Molina, P., Rios, C., de Leon, C. M., & Brey, J. J. (2024). Heat management system design and implementation in a PEM water electrolyser. International Journal of Hydrogen Energy. [CrossRef]
- Moustafa, A. M., Abdelghany, M. B., Younis, A. S. A., Moness, M., Al-Durra, A., & Guerrero, J. M. (2024). Software-defined control of an emulated hydrogen energy storage for energy Internet ecosystems. International Journal of Hydrogen Energy, 50, 893-909. [CrossRef]
- Nudelman, C. J. (2024). Sensorimotor Integration in Patients with Voice Disorders: A Scoping Review of Behavioral Research. Folia Phoniatrica et Logopaedica: Official Organ of the International Association of Logopedics and Phoniatrics (IALP).
- Obiuto, N. C., Ugwuanyi, E. D., Ninduwezuor-Ehiobu, N., Ani, E. C., & Olu-lawal, K. A. (2024). Advancing wastewater treatment technologies: The role of chemical engineering simulations in environmental sustainability. World Journal of Advanced Research and Reviews, 21(3), 019-031. [CrossRef]
- Patel, K. M., Bakhurji, A. S., Salloum, H. S., Kim, H. K., Winarno, M. B., & Mubarak, S. (2019). Use of advanced process control for automating conventional oilfield operations. SPE Production & Operations. [CrossRef]
- Patel, K., Aske, E. M., & Fredriksen, M. (2014). Use of model-predictive control for automating SAGD well-pair operations: A simulation study. SPE Production & Operations. [CrossRef]
- Payne, J. (2015). Convergence of PLCs, PACs, IPCs. Control Engineering, 62(11), 26-29.
- Pereira, J. D. (2024). Pressure Sensors: Working Principles of Static and Dynamic Calibration. Sensors, 24(2), 629. [CrossRef]
- PLC Hardware and Software - Allied Electronics & Automation. (n.d.).
- PLC Programming - What is PLC? & The history of PLC’s - c3controls. (n.d.).
- Prabowo, M. C. A., Sayekti, I., Astuti, S., Nursaputro, S. T., & Supriyati, S. (2024). Development of an IoT-Based Egg Incubator with PID Control System and Web Application. JOIV: International Journal on Informatics Visualization, 8(1), 465-472.
- Programmable Logic Controller - A brief history of Modicon PLCs ⋆ The Stuff of Success. (n.d.).
- Raeis, H., Kazemi, M., & Shirmohammadi, S. (2024). CAE-MAS: Convolutional Autoencoder Interference Cancellation for Multiperson Activity Sensing With FMCW Microwave Radar. IEEE Transactions on Instrumentation and Measurement, 73, 1-10. [CrossRef]
- Ramesh, P. S., Swartz, C. L. E., & Mhaskar, P. (2021). Closed-loop dynamic real-time optimization with stabilizing model predictive control. AIChE Journal. [CrossRef]
- Rajbongshi, A., & Gogoi, S. B. (2024). Microfiltration, ultrafiltration and nanofiltration as a post-treatment of biological treatment process with references to oil field produced water of Moran oilfield of Assam. Petroleum Research, 9(1), 143-154. [CrossRef]
- Renfrew, D., Vasilaki, V., & Katsou, E. (2024). Indicator based multi-criteria decision support systems for wastewater treatment plants. Science of the Total Environment, 169903. [CrossRef]
- Rijksen, J. (2021). The 5 steps of Lean to optimize production processes with Industrial IoT - Innius.
- Sabarish, N. B., & Jayakumar, M. (2024). Estimation of reflection loss of lossy dielectric powders using coaxial line based guided wave technique for conventional cement based microwave absorber applications. Measurement, 114739.
- Seborg, D. E., Edgar, T. F., Mellichamp, D. A., & Doyle III, F. J. (n.d.). Process dynamics and control (4th ed.).
- Sheik, A. G., Tejaswini, E., Seepana, M. M., Ambati, S. R., Meneses, M., & Vilanova, R. (2021). Design of feedback control strategies in a plant-wide wastewater treatment plant for simultaneous evaluation of economics, energy usage, and removal of nutrients. [CrossRef]
- Smith, S. (n.d.). Instrumentation guide for produced water applications. Retrieved from https://www.watertechonline.com/print/content/16212326.
- Speakman, J., & Francois, G. (2019). Real-time optimisation of closed-loop processes using transient measurements. ScienceDirect.
- Sun, Z., Yao, Q., Jin, H., Xu, Y., Hang, W., Chen, H., ... & Shen, X. (2024). A novel in-situ sensor calibration method for building thermal systems based on virtual samples and autoencoder. Energy, 131314. [CrossRef]
- Szép, A., & Kohlheb, R. (2010). Water treatment technology for produced water. Water Science and Technology. [CrossRef]
- The Engineering Concepts. (2018, November 14). PID controller - what is a PID controller & how it works? Retrieved May 28, 2022, from https://www.theengineeringconcepts.com/pid-controller/.
- Vallabhan, M., & Holden, C. (2020). Non-linear control algorithms for de-oiling hydrocyclones. In 2020 28th Mediterranean Conference on Control and Automation (MED).
- Vallabhan, M., Holden, C., & Skogestad, S. (2020). A first-principles approach for control-oriented modeling of de-oiling hydrocyclones. Industrial & Engineering Chemistry Research, 59. [CrossRef]
- Vallabhan, M., Matias, J., & Holden, C. Feedforward, cascade, and model predictive control algorithms for de-oiling hydrocyclones: Simulation study. [CrossRef]
- Weigert, J., Hoffman, C., Esche, E., & Repke, J.-U. (2020). Enabling dynamic real-time optimization under uncertainty using data-driven chance constraints. ScienceDirect.
- What is a Remote Terminal Unit (RTU)? - Technical Articles. (n.d.).
- What is oil and gas automation? Cognizant. (n.d.).
- What is SCADA? Supervisory Control and Data Acquisition. (n.d.).
- Yang, Z., Pedersen, S., & Durdevic, P. (2014). Cleaning the produced water in offshore oil production by using plant-wide optimal control strategy.
- Zhao, J., & Zhao, Z. (2024). Optimal Step-Size Control with Bayesian Optimization for Correlation Integral Based Real Time Optimization.
- Zhang, R., Xu, X., Liu, K., Kong, L., Wang, W., & Wortmann, T. (2024). Airflow modelling for building design: A designers' review. Renewable and Sustainable Energy Reviews, 197, 114380. [CrossRef]
Figure 1.
Schematic representation of offshore oil and gas production with produced water treatment (Bram, 2020).
Figure 1.
Schematic representation of offshore oil and gas production with produced water treatment (Bram, 2020).
Figure 2.
Membrane Separator Unit Courtesy: New Wave Energy Services, A Water Transfer Company in Midland, TX.
Figure 2.
Membrane Separator Unit Courtesy: New Wave Energy Services, A Water Transfer Company in Midland, TX.
Figure 3.
Produced Water Treatment Process (Instrumentation Guide for Produced Water Applications _ Water Technology).
Figure 3.
Produced Water Treatment Process (Instrumentation Guide for Produced Water Applications _ Water Technology).
Figure 4.
British Petroleum America (BPX) Tank Battery Site in Orla, TX.
Figure 4.
British Petroleum America (BPX) Tank Battery Site in Orla, TX.
Figure 5.
PLC Control Panel- BPX Tank Battery Site in Orla, TX.
Figure 5.
PLC Control Panel- BPX Tank Battery Site in Orla, TX.
Figure 6.
SCADA Hardware-BPX Tank Battery Site in Orla, TX.
Figure 6.
SCADA Hardware-BPX Tank Battery Site in Orla, TX.
Figure 7.
On/Off Control (Mortensen, 2021).
Figure 7.
On/Off Control (Mortensen, 2021).
Figure 8.
Proportional Block Graph (Mortensen, 2021).
Figure 8.
Proportional Block Graph (Mortensen, 2021).
Figure 9.
Proportional and Integral Graph (Mortensen, 2021).
Figure 9.
Proportional and Integral Graph (Mortensen, 2021).
Figure 10.
PID Blocks working together (Mortensen, 2021).
Figure 10.
PID Blocks working together (Mortensen, 2021).
Figure 11.
PID response (The Engineering Concepts, 2018).
Figure 11.
PID response (The Engineering Concepts, 2018).
Figure 12.
Representation of the feed-forward approach in produced water technologies (Mishiga et al., 2021).
Figure 12.
Representation of the feed-forward approach in produced water technologies (Mishiga et al., 2021).
Figure 13.
Representation of a multi-control loop around the produced water plant (Durdevic et al., 2018).
Figure 13.
Representation of a multi-control loop around the produced water plant (Durdevic et al., 2018).
Figure 14.
Example of probe placement in pipelines (DeLancey, 2020).
Figure 14.
Example of probe placement in pipelines (DeLancey, 2020).
Figure 15.
An ideal installation of sensors/controllers (Ariaratnam et al., n.d.).
Figure 15.
An ideal installation of sensors/controllers (Ariaratnam et al., n.d.).
Figure 16.
RTO Steps (Rijksen, 2021)..
Figure 16.
RTO Steps (Rijksen, 2021)..
Figure 17.
Block diagram or RTO and DRTO (Ramesh et al., 2021)..
Figure 17.
Block diagram or RTO and DRTO (Ramesh et al., 2021)..
|
Disclaimer/Publisher’s Note: The statements, opinions and data contained in all publications are solely those of the individual author(s) and contributor(s) and not of MDPI and/or the editor(s). MDPI and/or the editor(s) disclaim responsibility for any injury to people or property resulting from any ideas, methods, instructions or products referred to in the content. |
© 2024 by the authors. Licensee MDPI, Basel, Switzerland. This article is an open access article distributed under the terms and conditions of the Creative Commons Attribution (CC BY) license (http://creativecommons.org/licenses/by/4.0/).
