Submitted:
27 April 2024
Posted:
28 April 2024
You are already at the latest version
Abstract
Keywords:
Introduction
Material and Methods
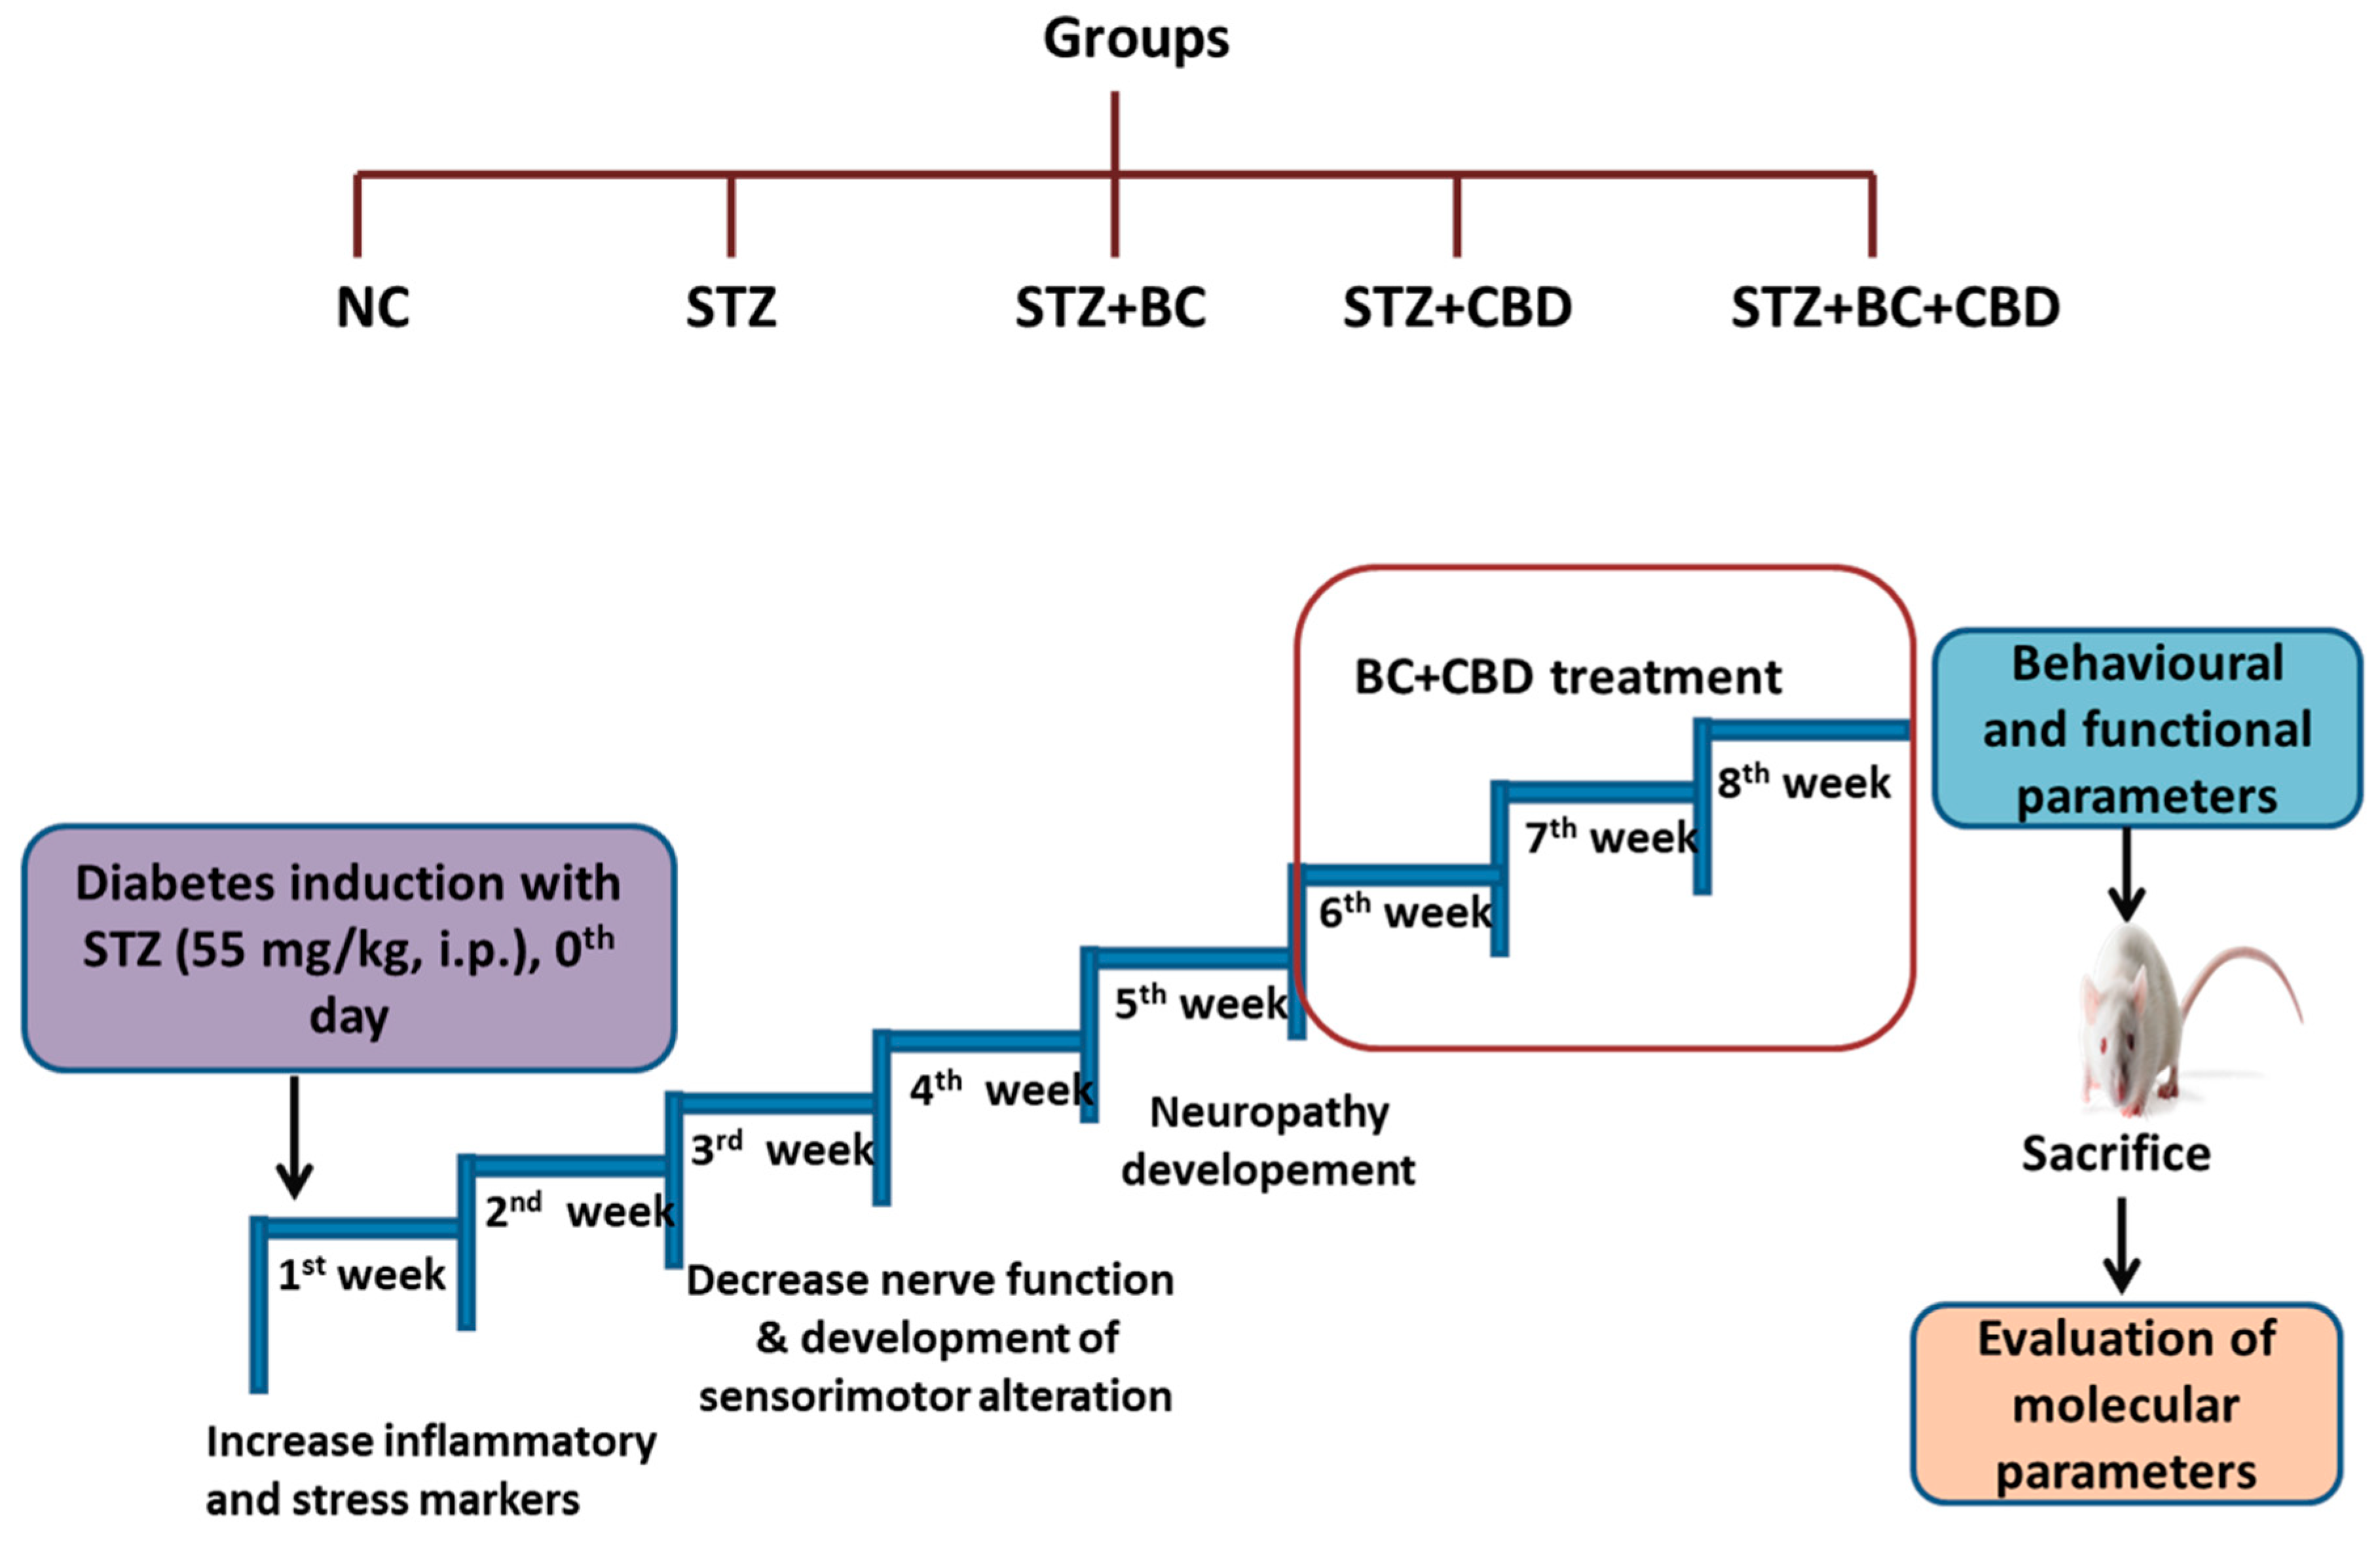
- Experimental design
- Cell viability determination
- DCFDA
- FDA staining to measure intracellular ROS
- MitoSOX staining to measure mitochondrial superoxides
- JC1
- JC1 staining for mitochondrial membrane potential
- Western blotting
- In vivo Experiments
- Induction of diabetic neuropathy and the experimental designs
- Behavioural parameters
- Mechanical and thermal hyperalgesia
- Nerve functional studies
- Nerve blood flow
- Western blotting
- Immunohistochemistry (IHC)
- Intra
- tra epidermal nerve fibre density in the hind paw of diabetic rats
- Statistical analysis
Results
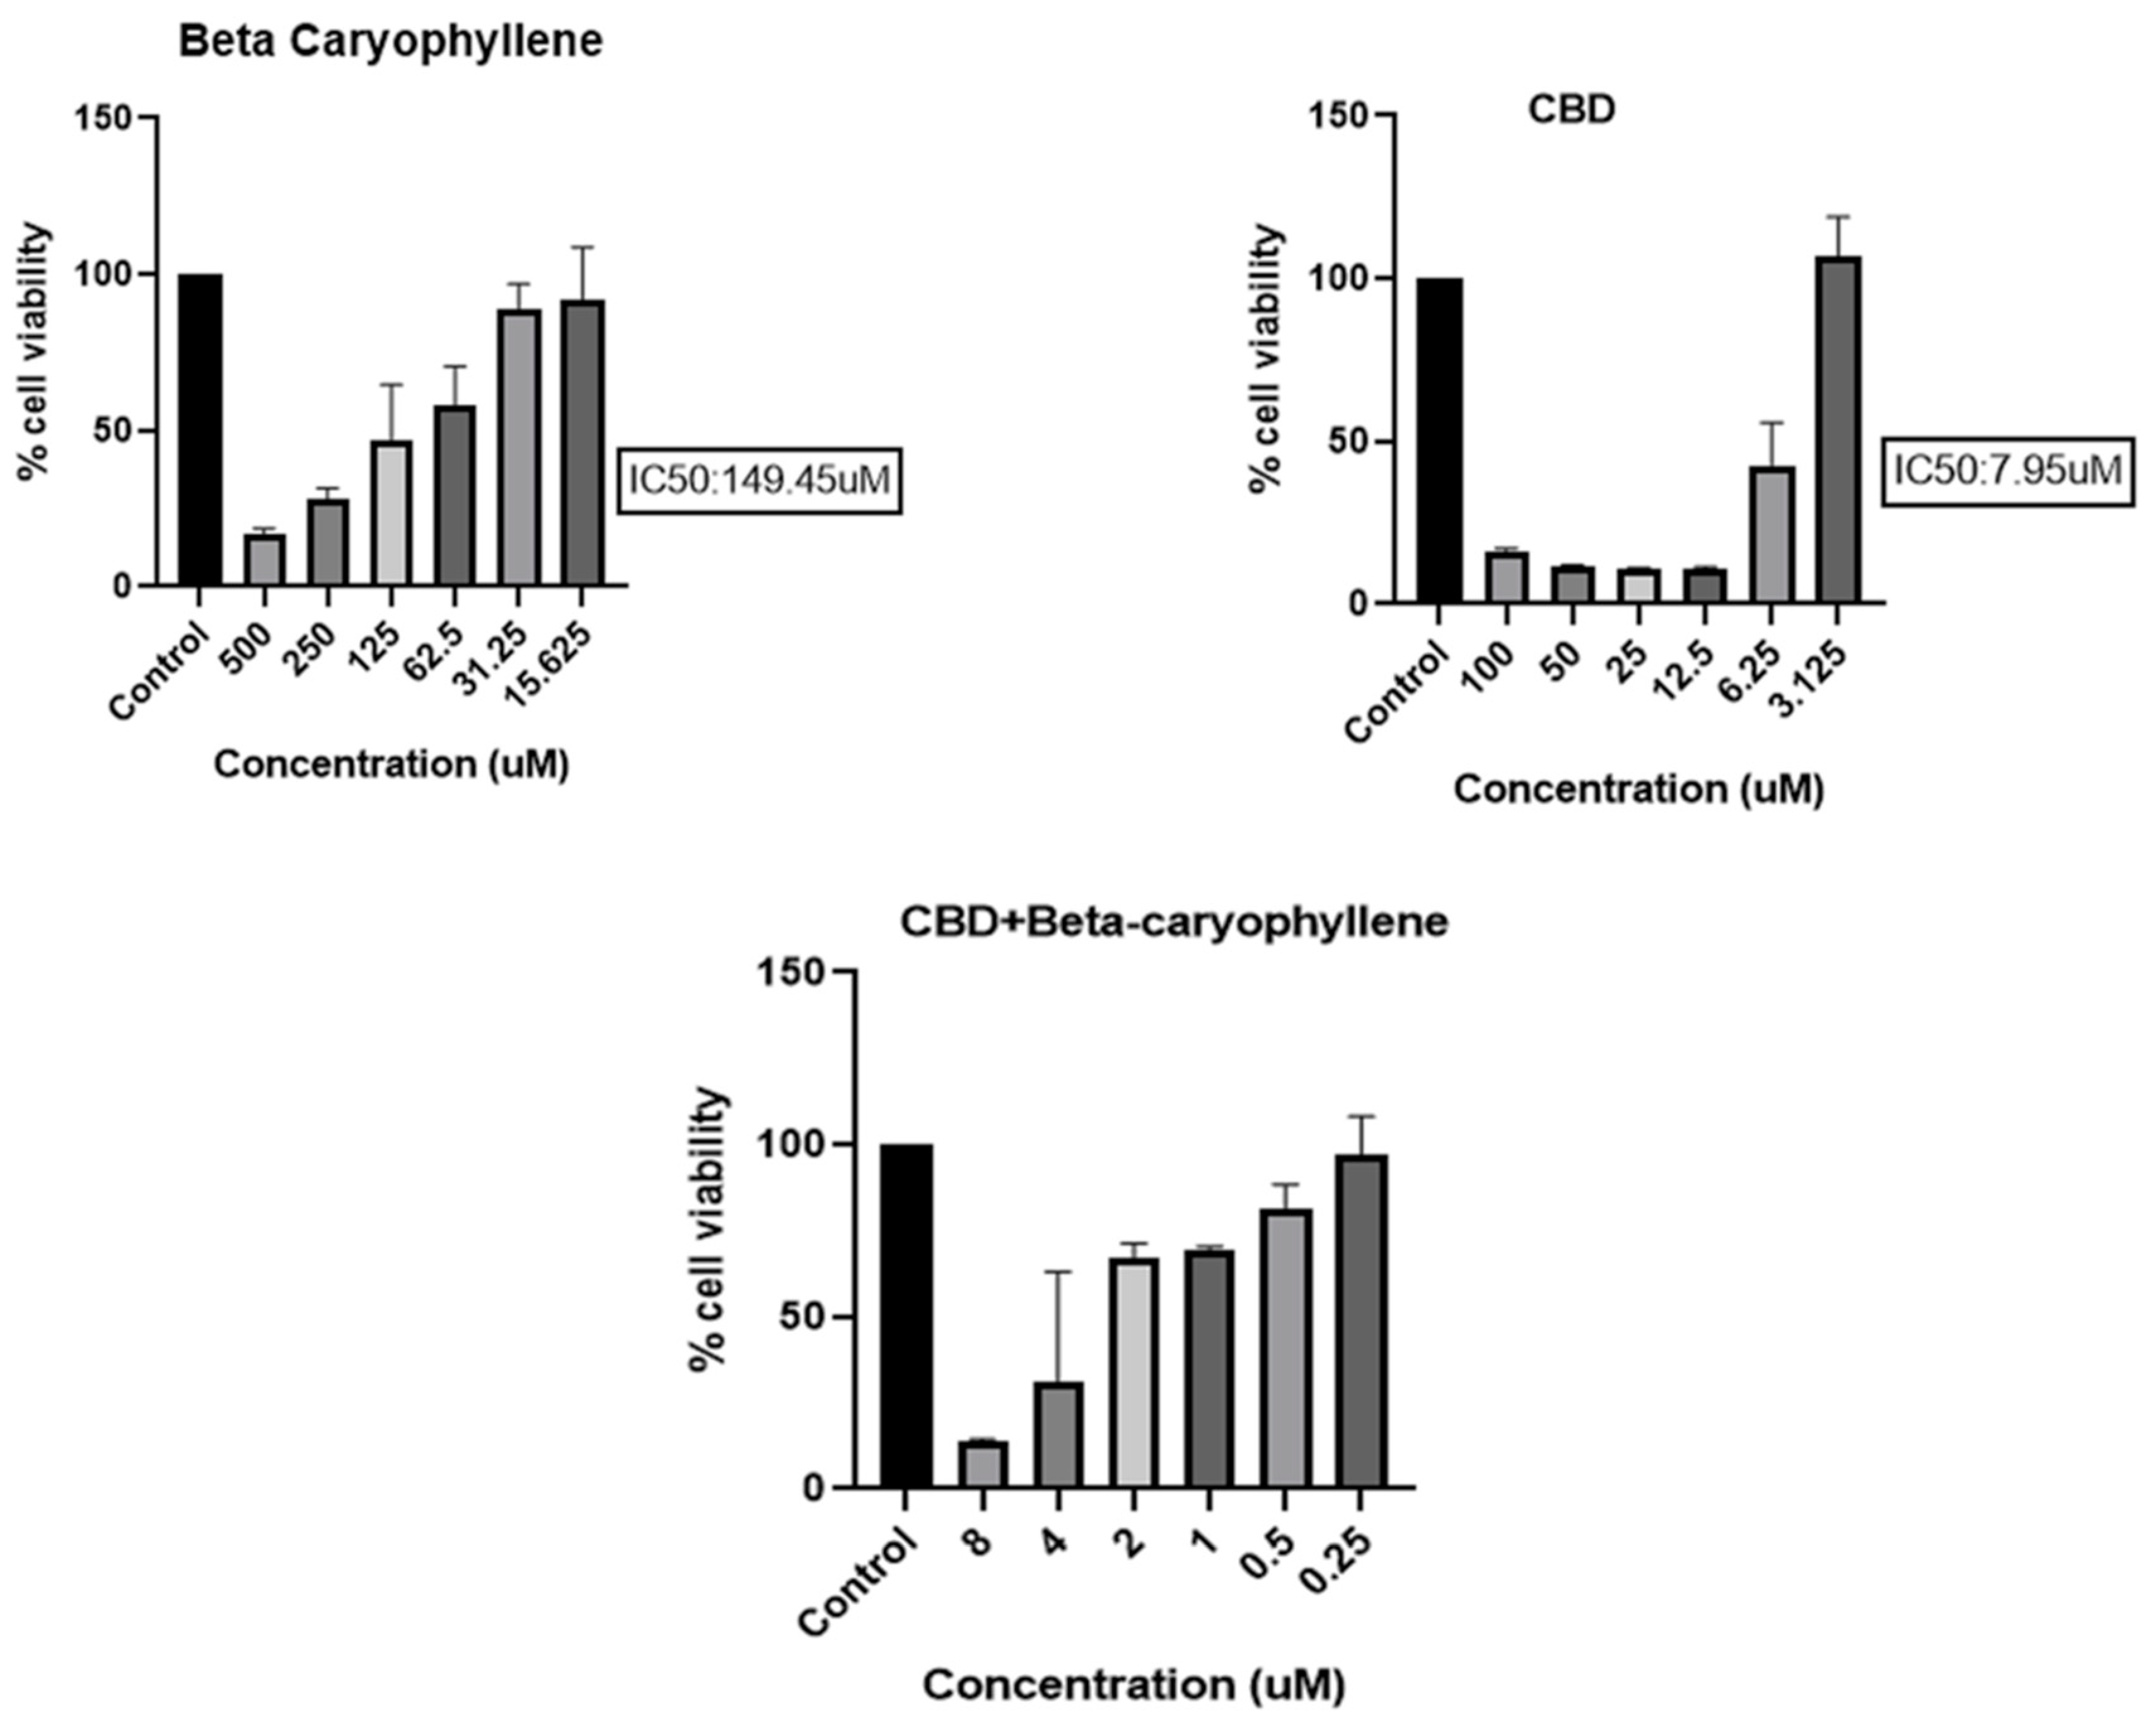
- BC, CBD, and their combination effect on the cell viability
- Effect of BC, CBD, and their combination on the generation of ROS, mitochondrial superoxide, and the mitochondrial potential in high glucose exposed Schwann cells
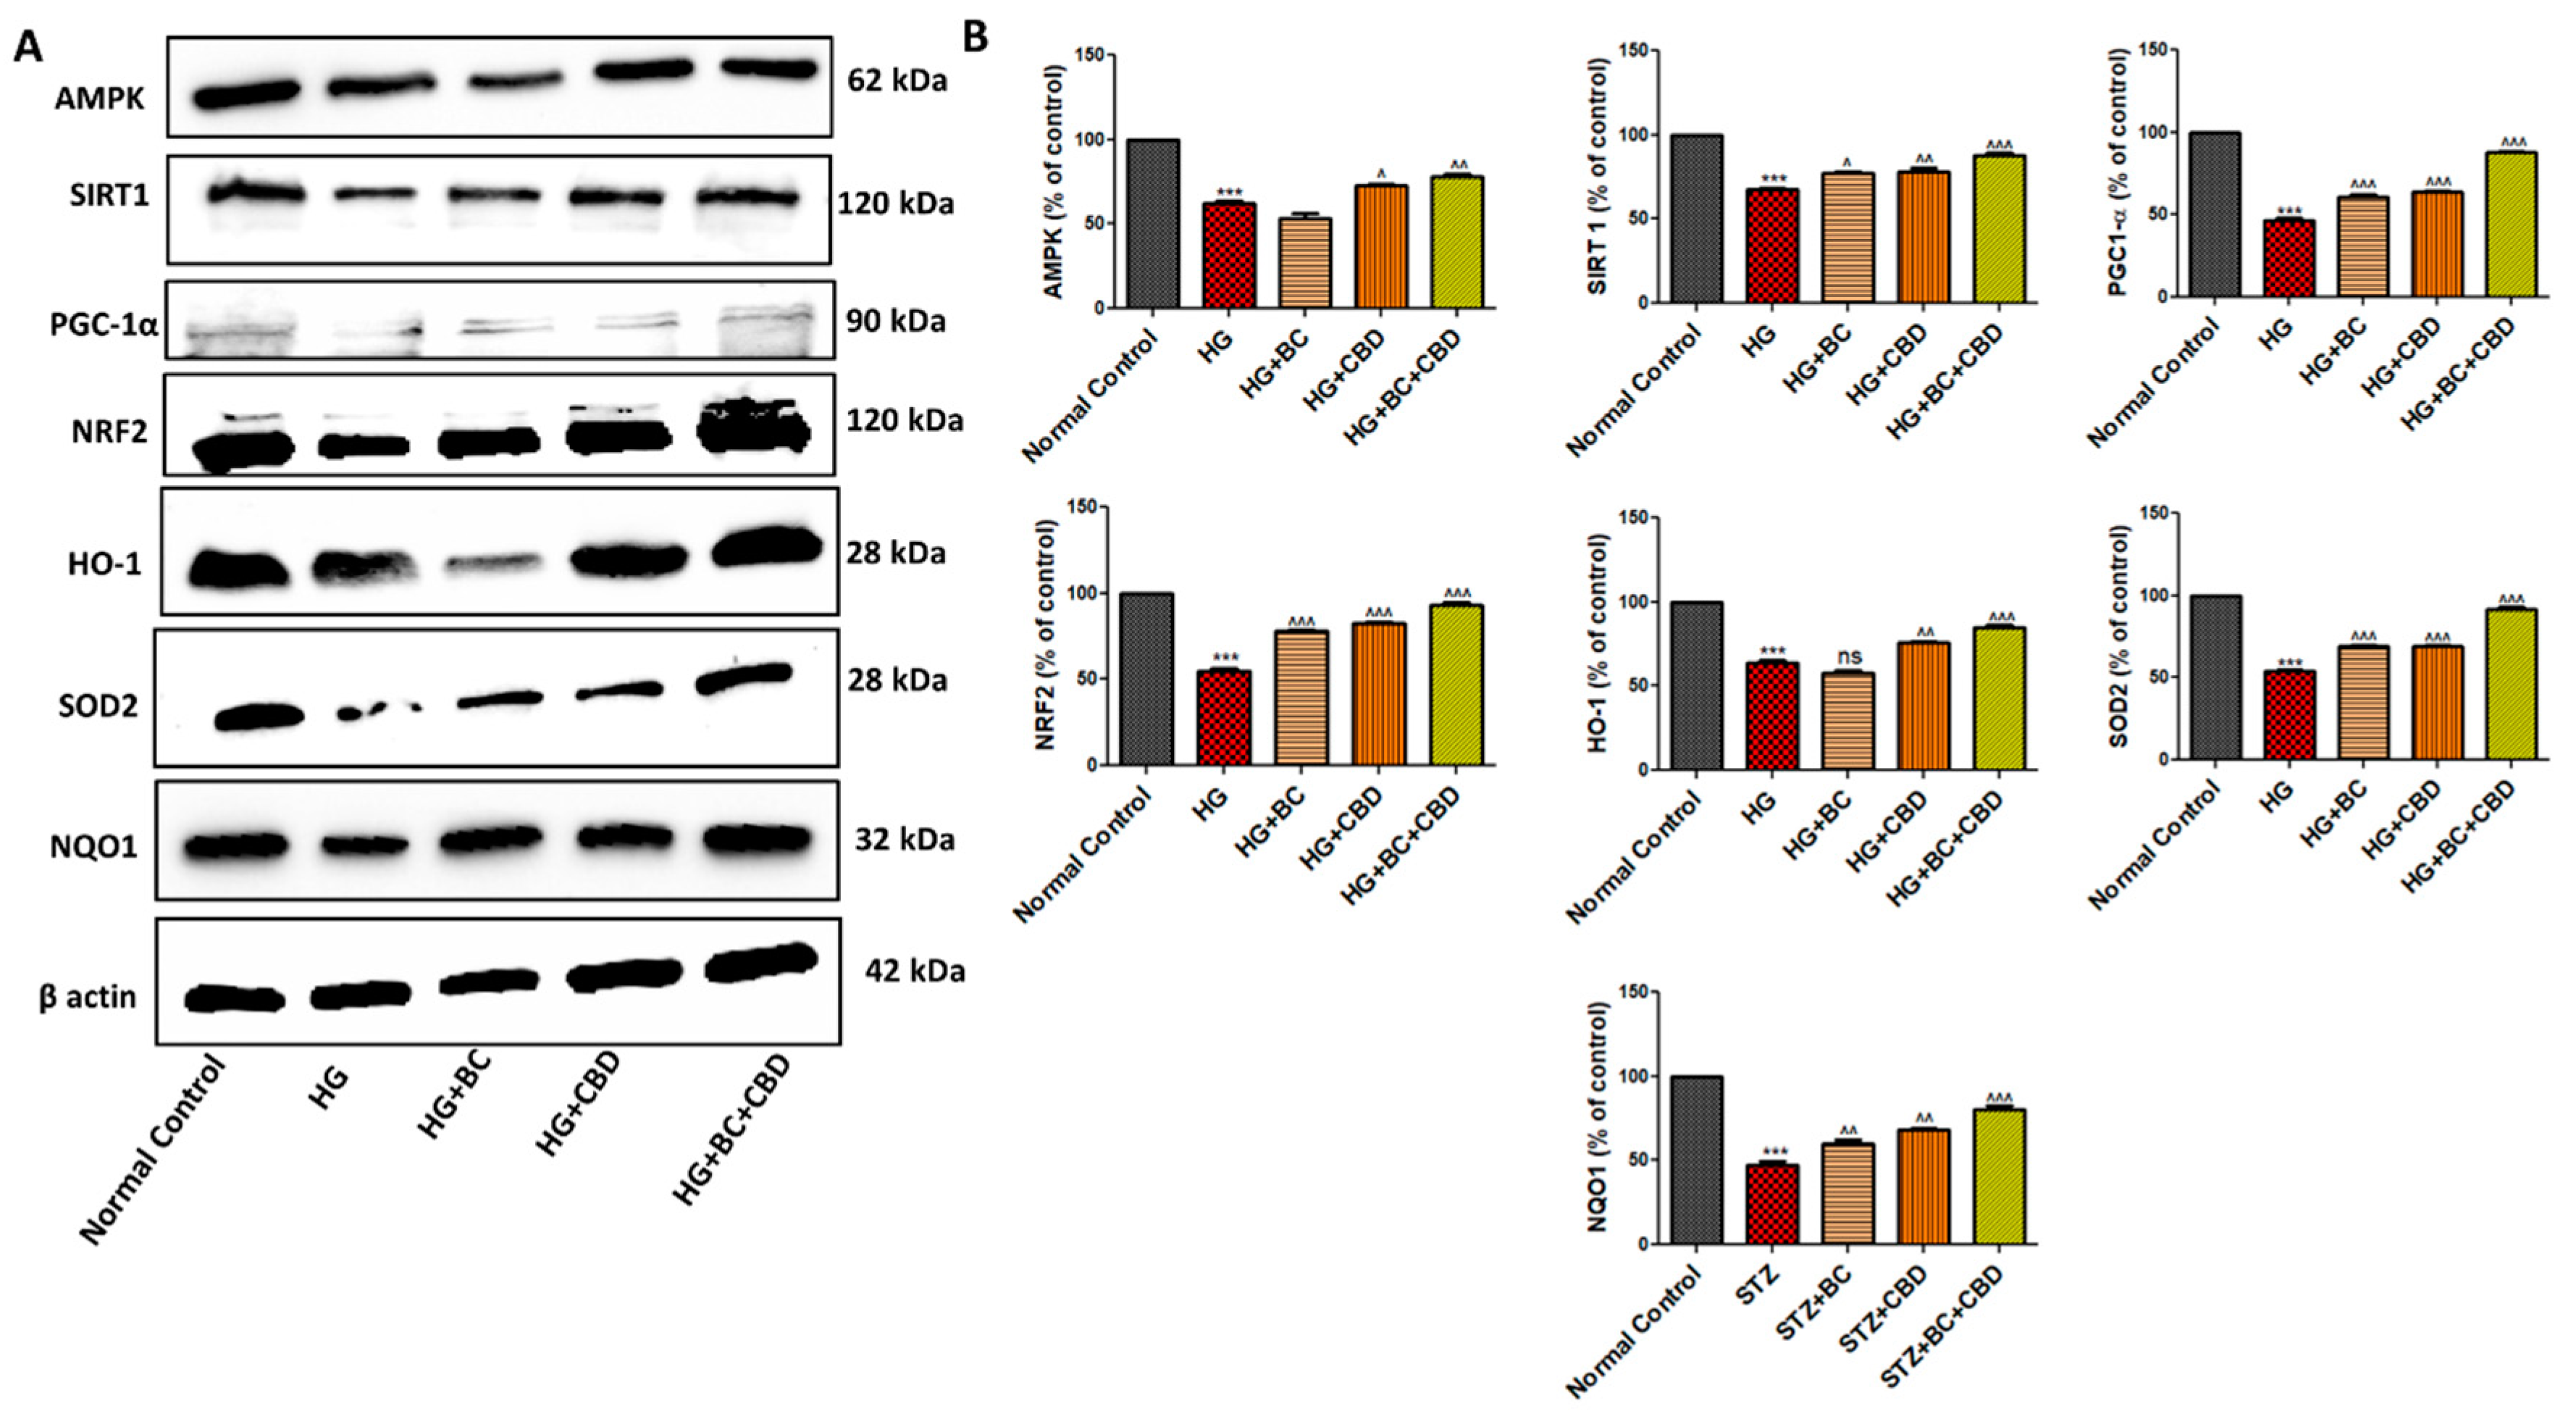
- BC, CBD and their combination effect on mitochondrial biogenesis and antioxidant effect in HG induced Schwann cells
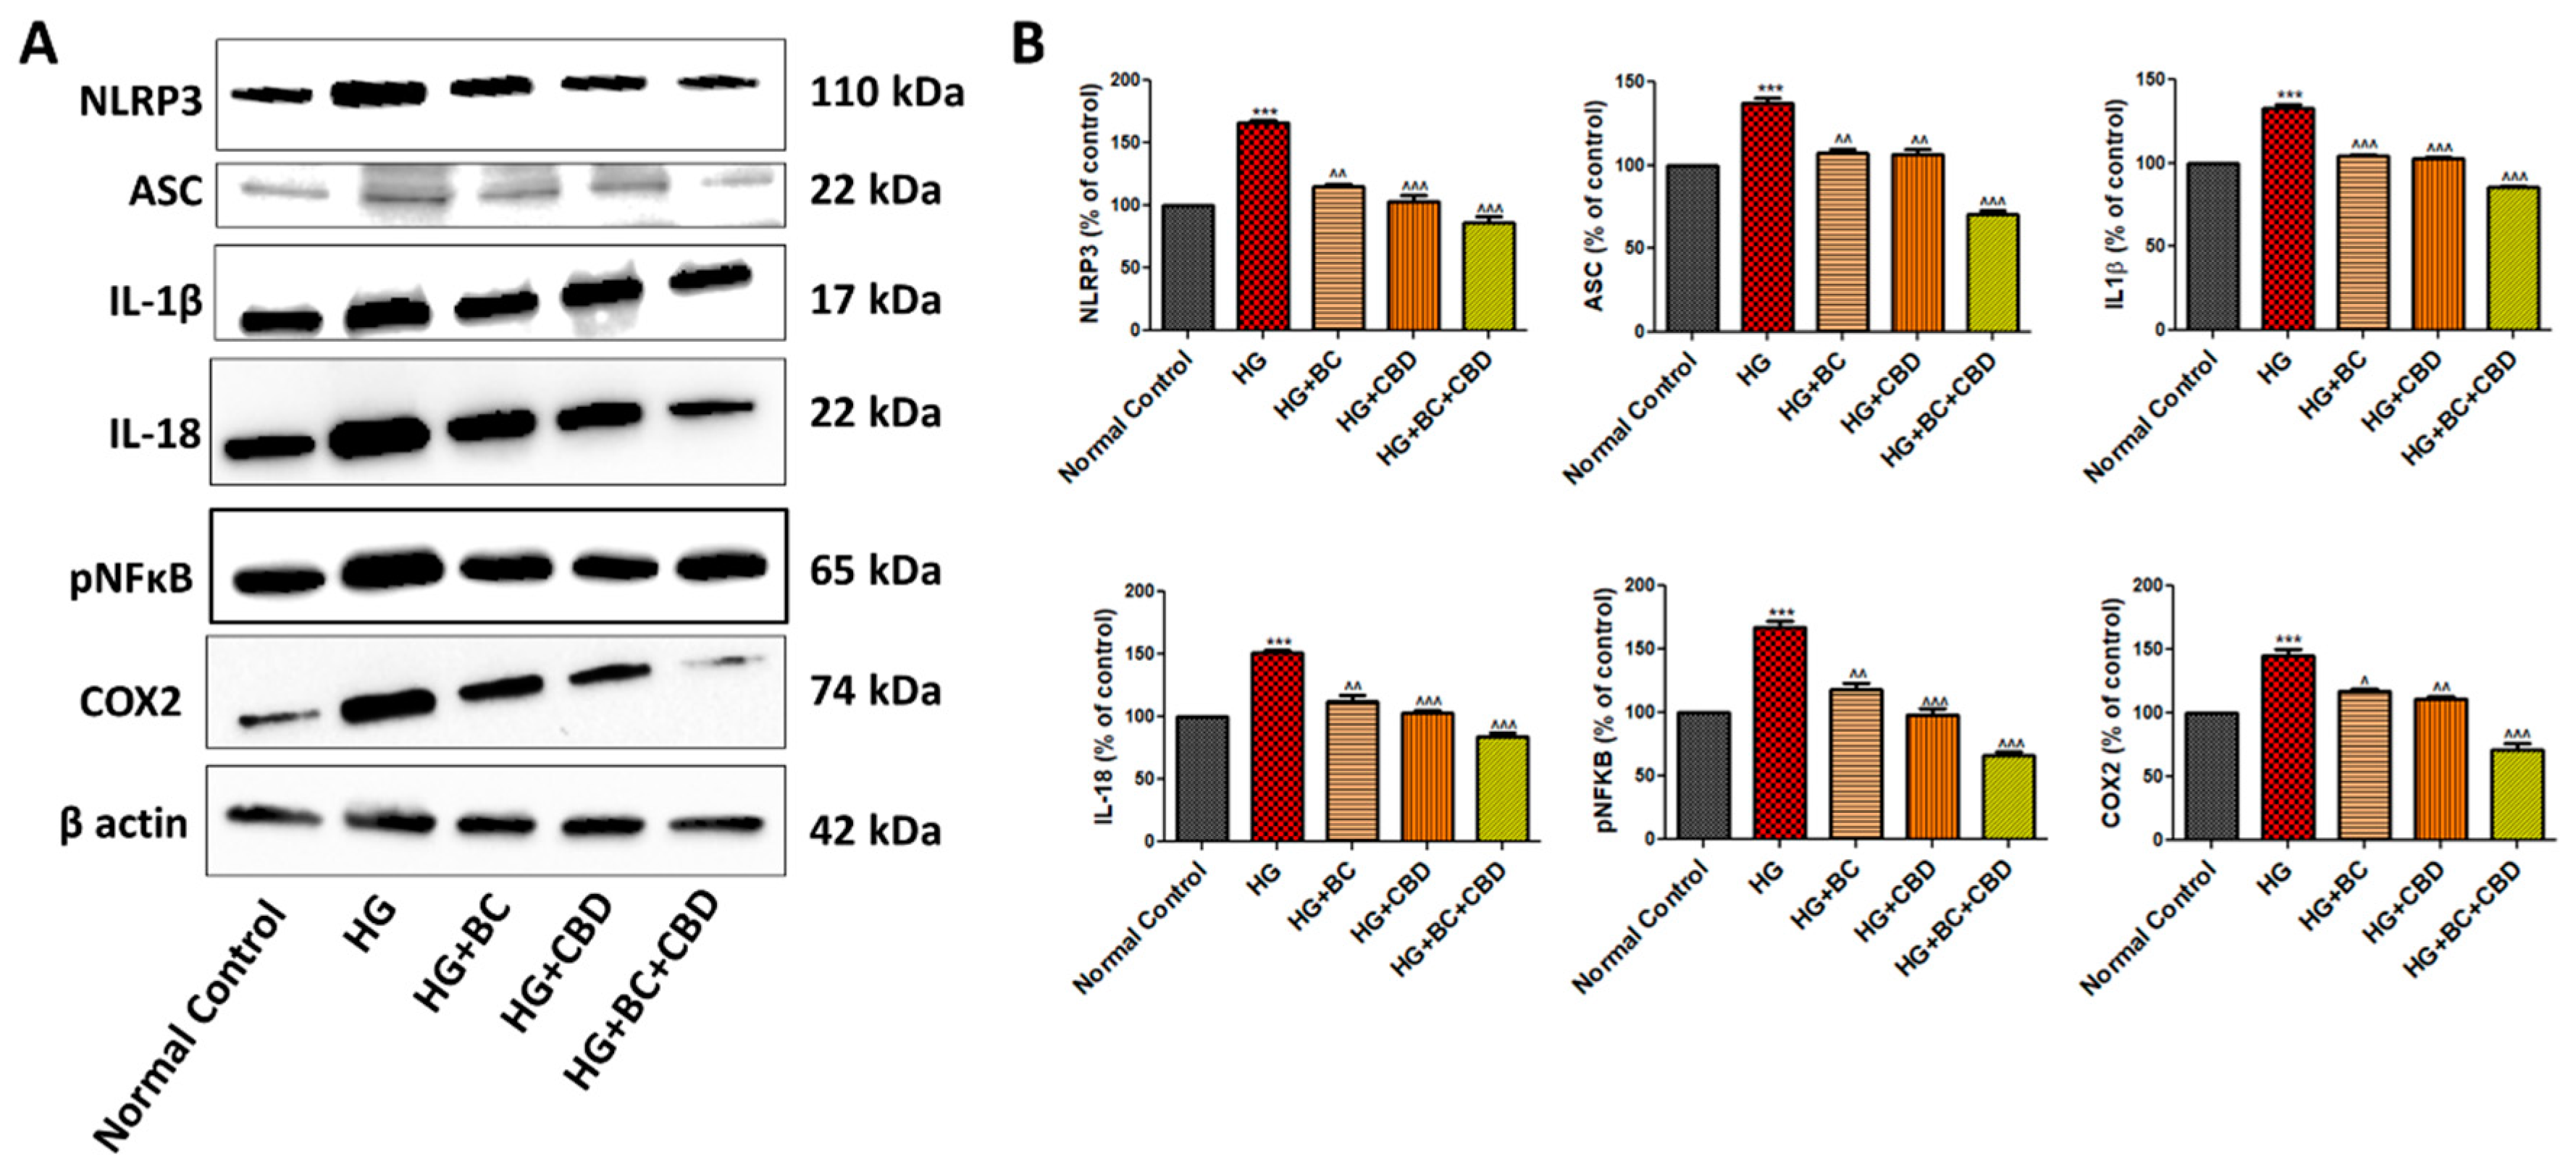
- BC, CBD, and their combination effects on neuroinflammation in HG induced Schwann cells
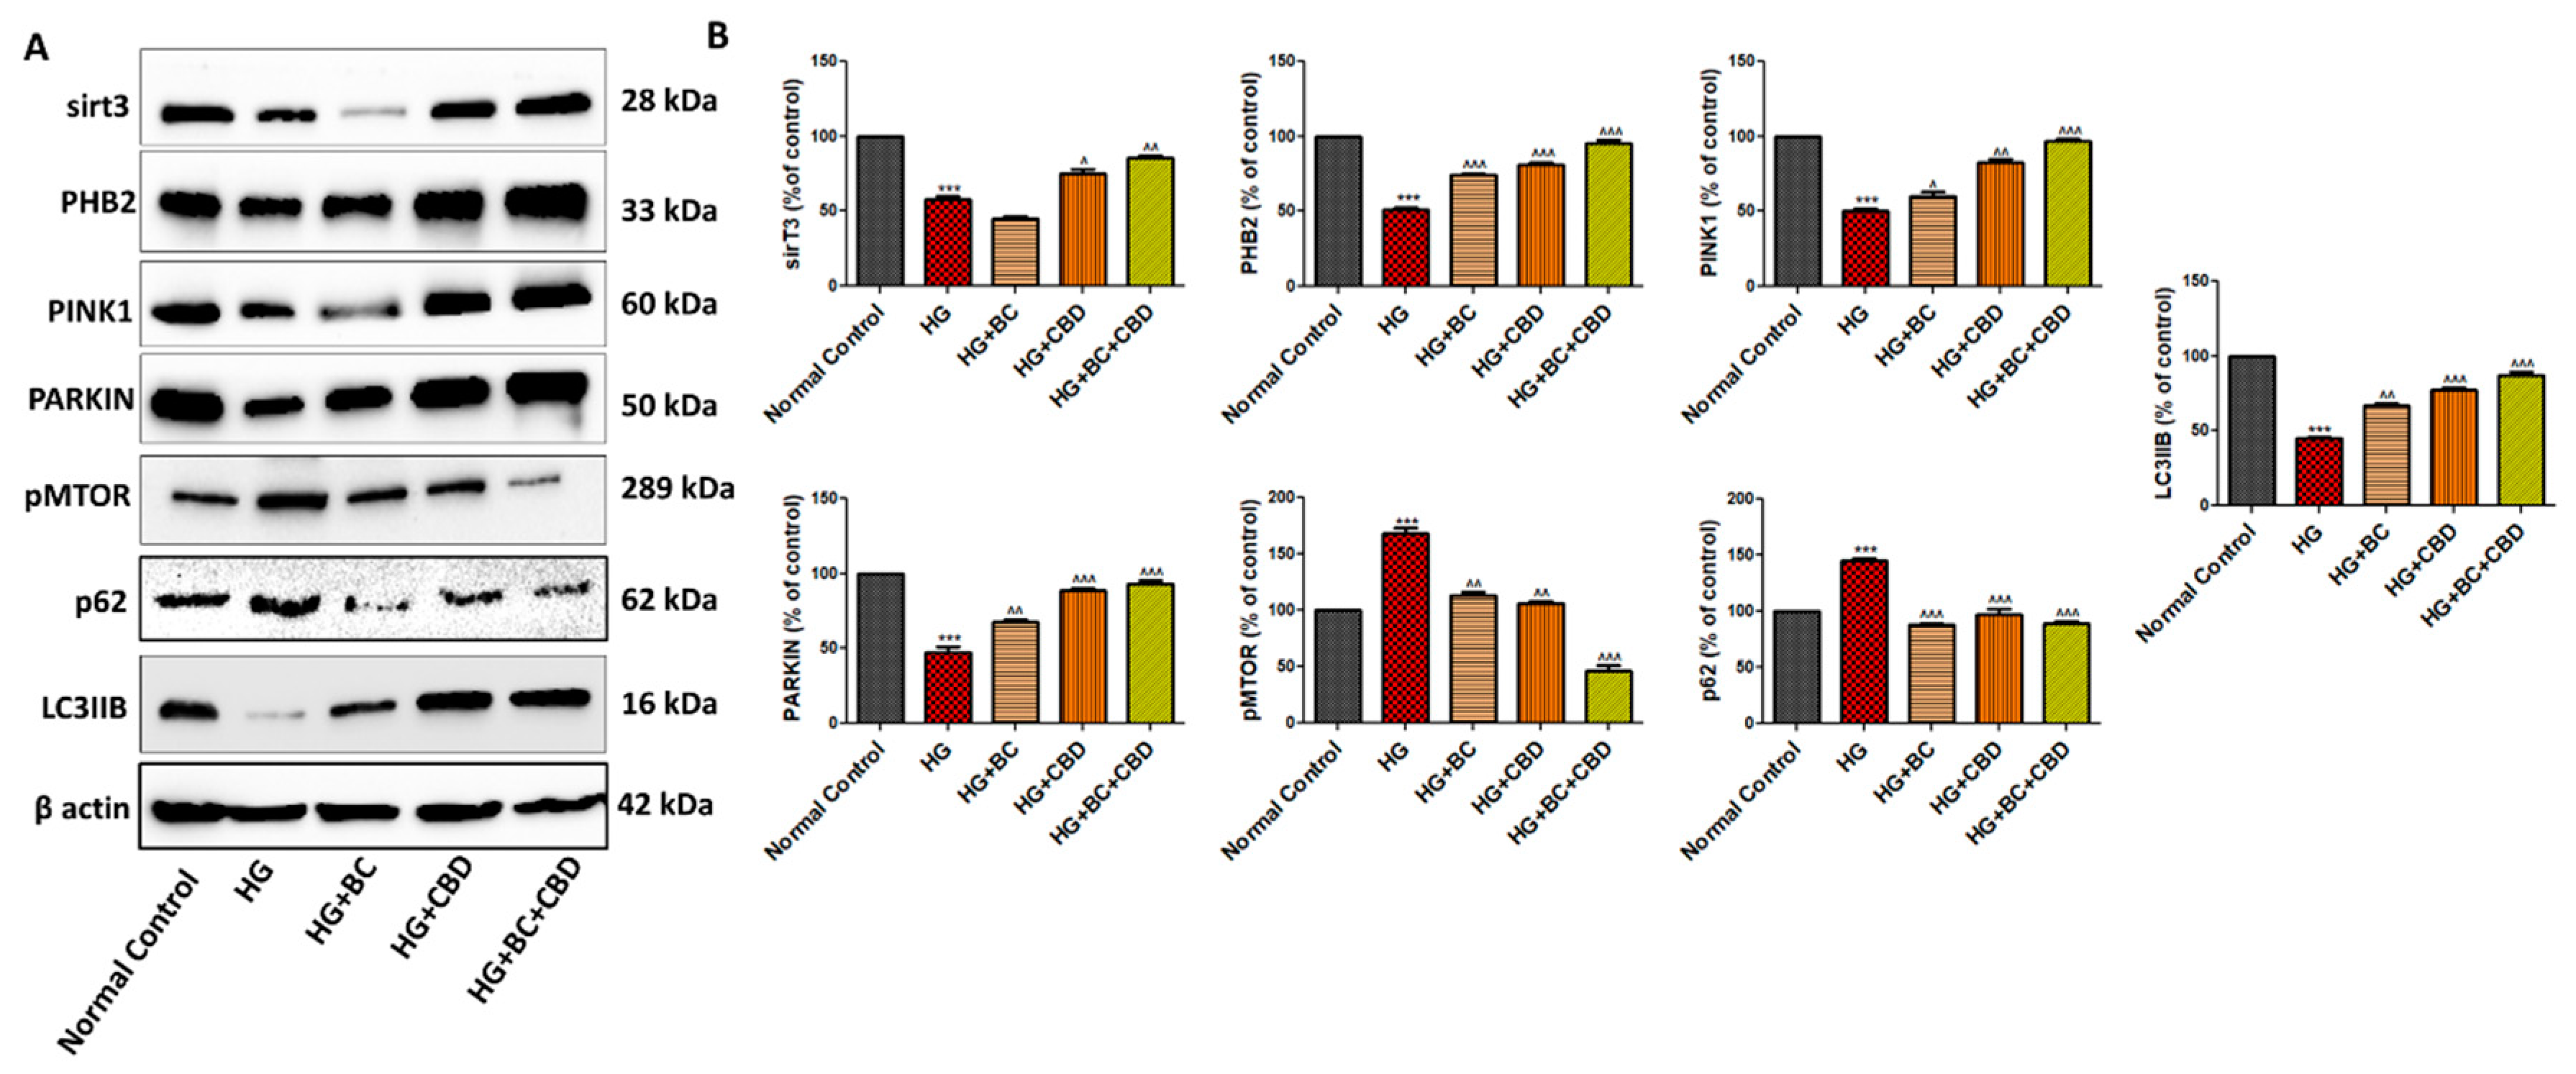
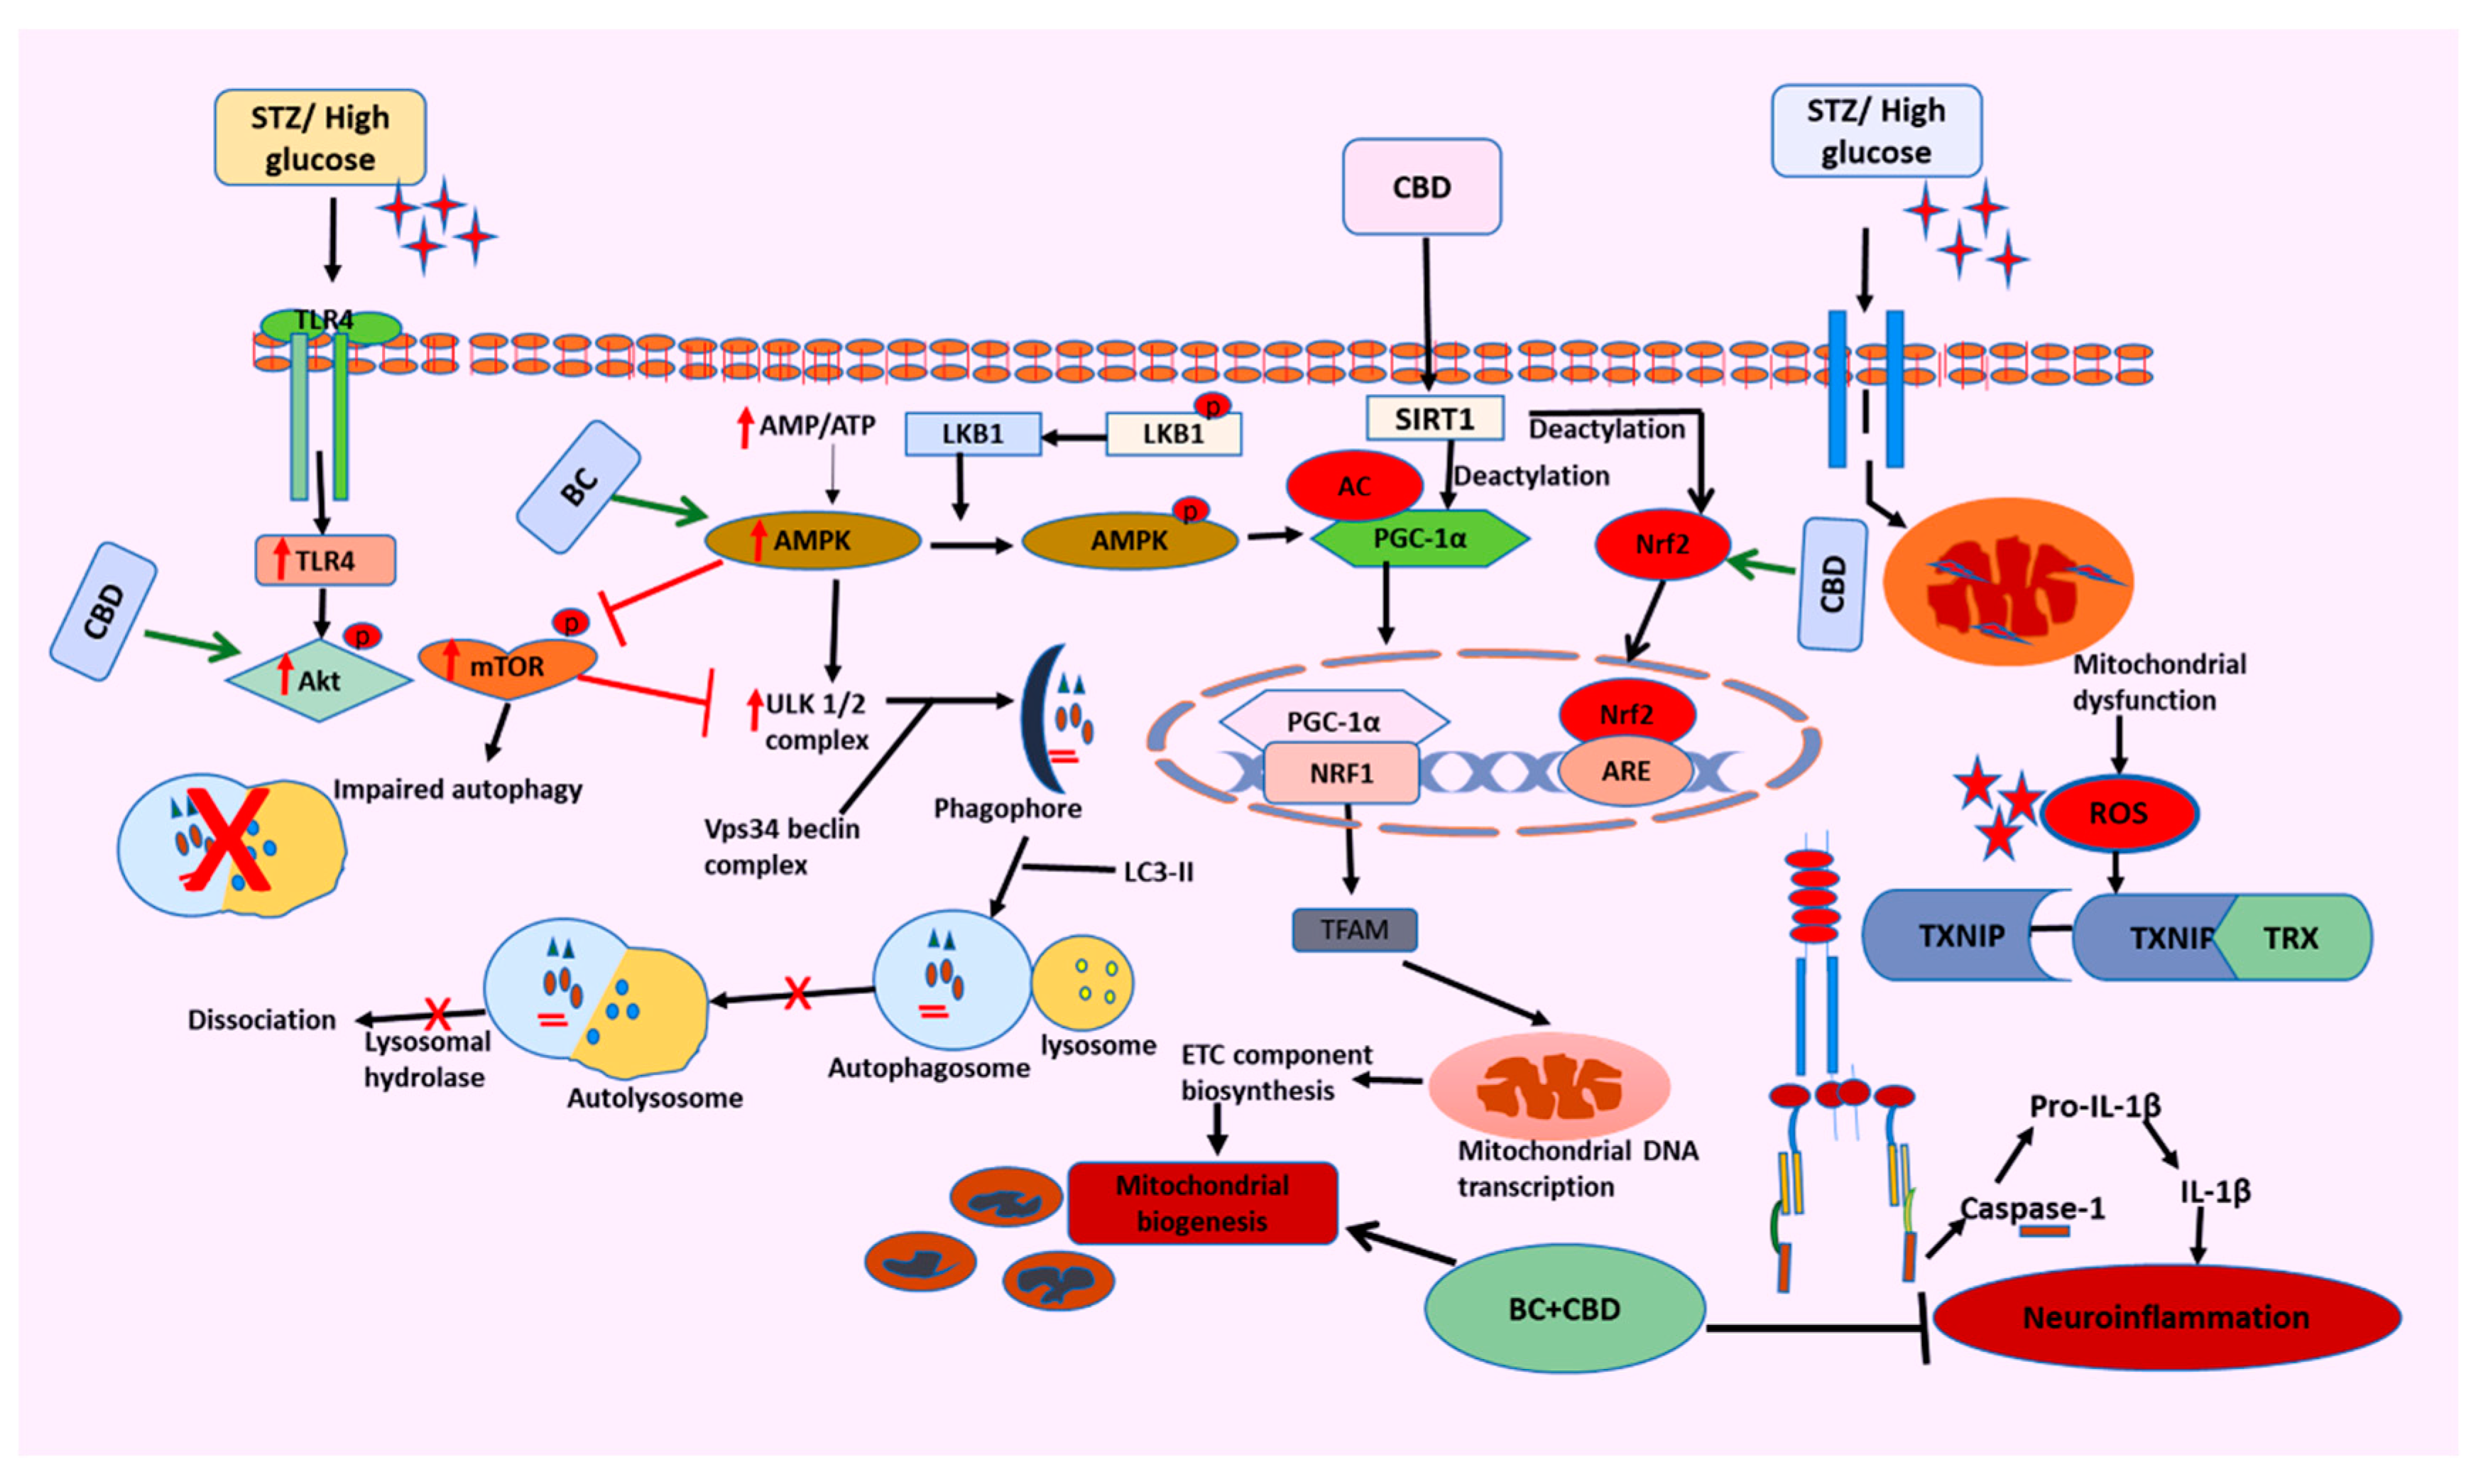
- BC and CBD combination effect on mitochondrial quality control and autophagy in high glucose induced Schwann cells
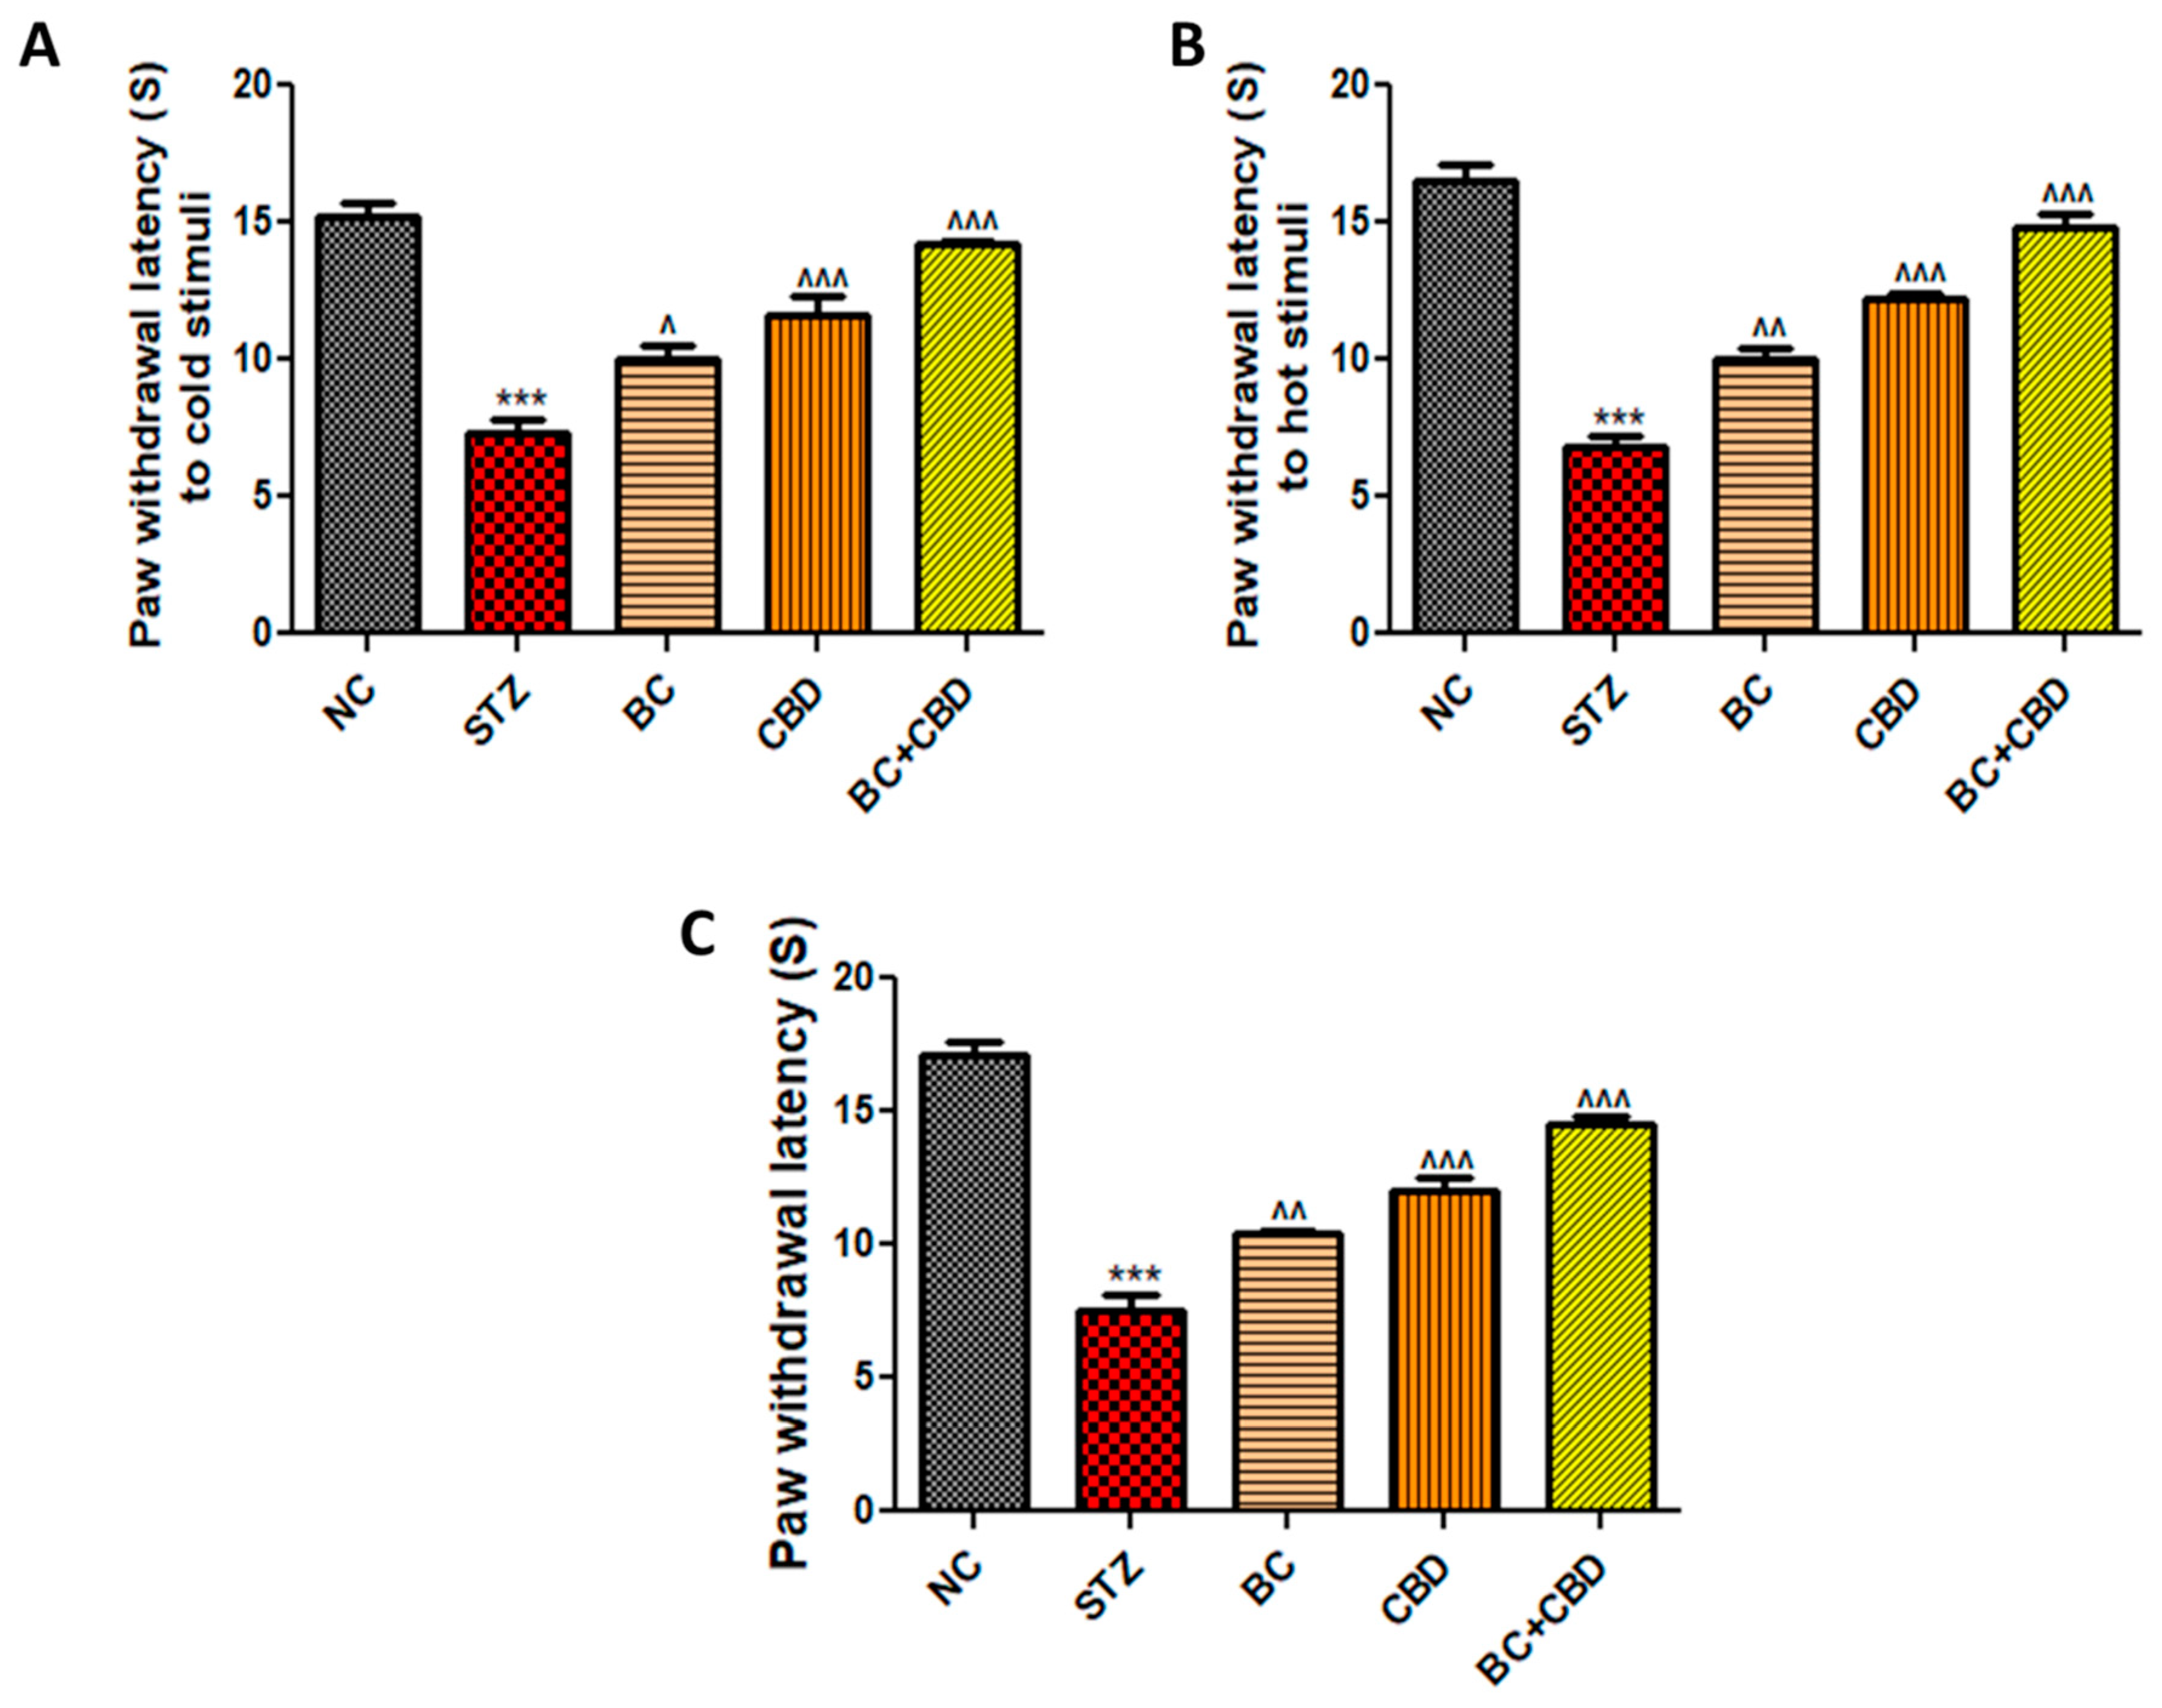
- BC, CBD, and their combination effect on nerve function in SD rats
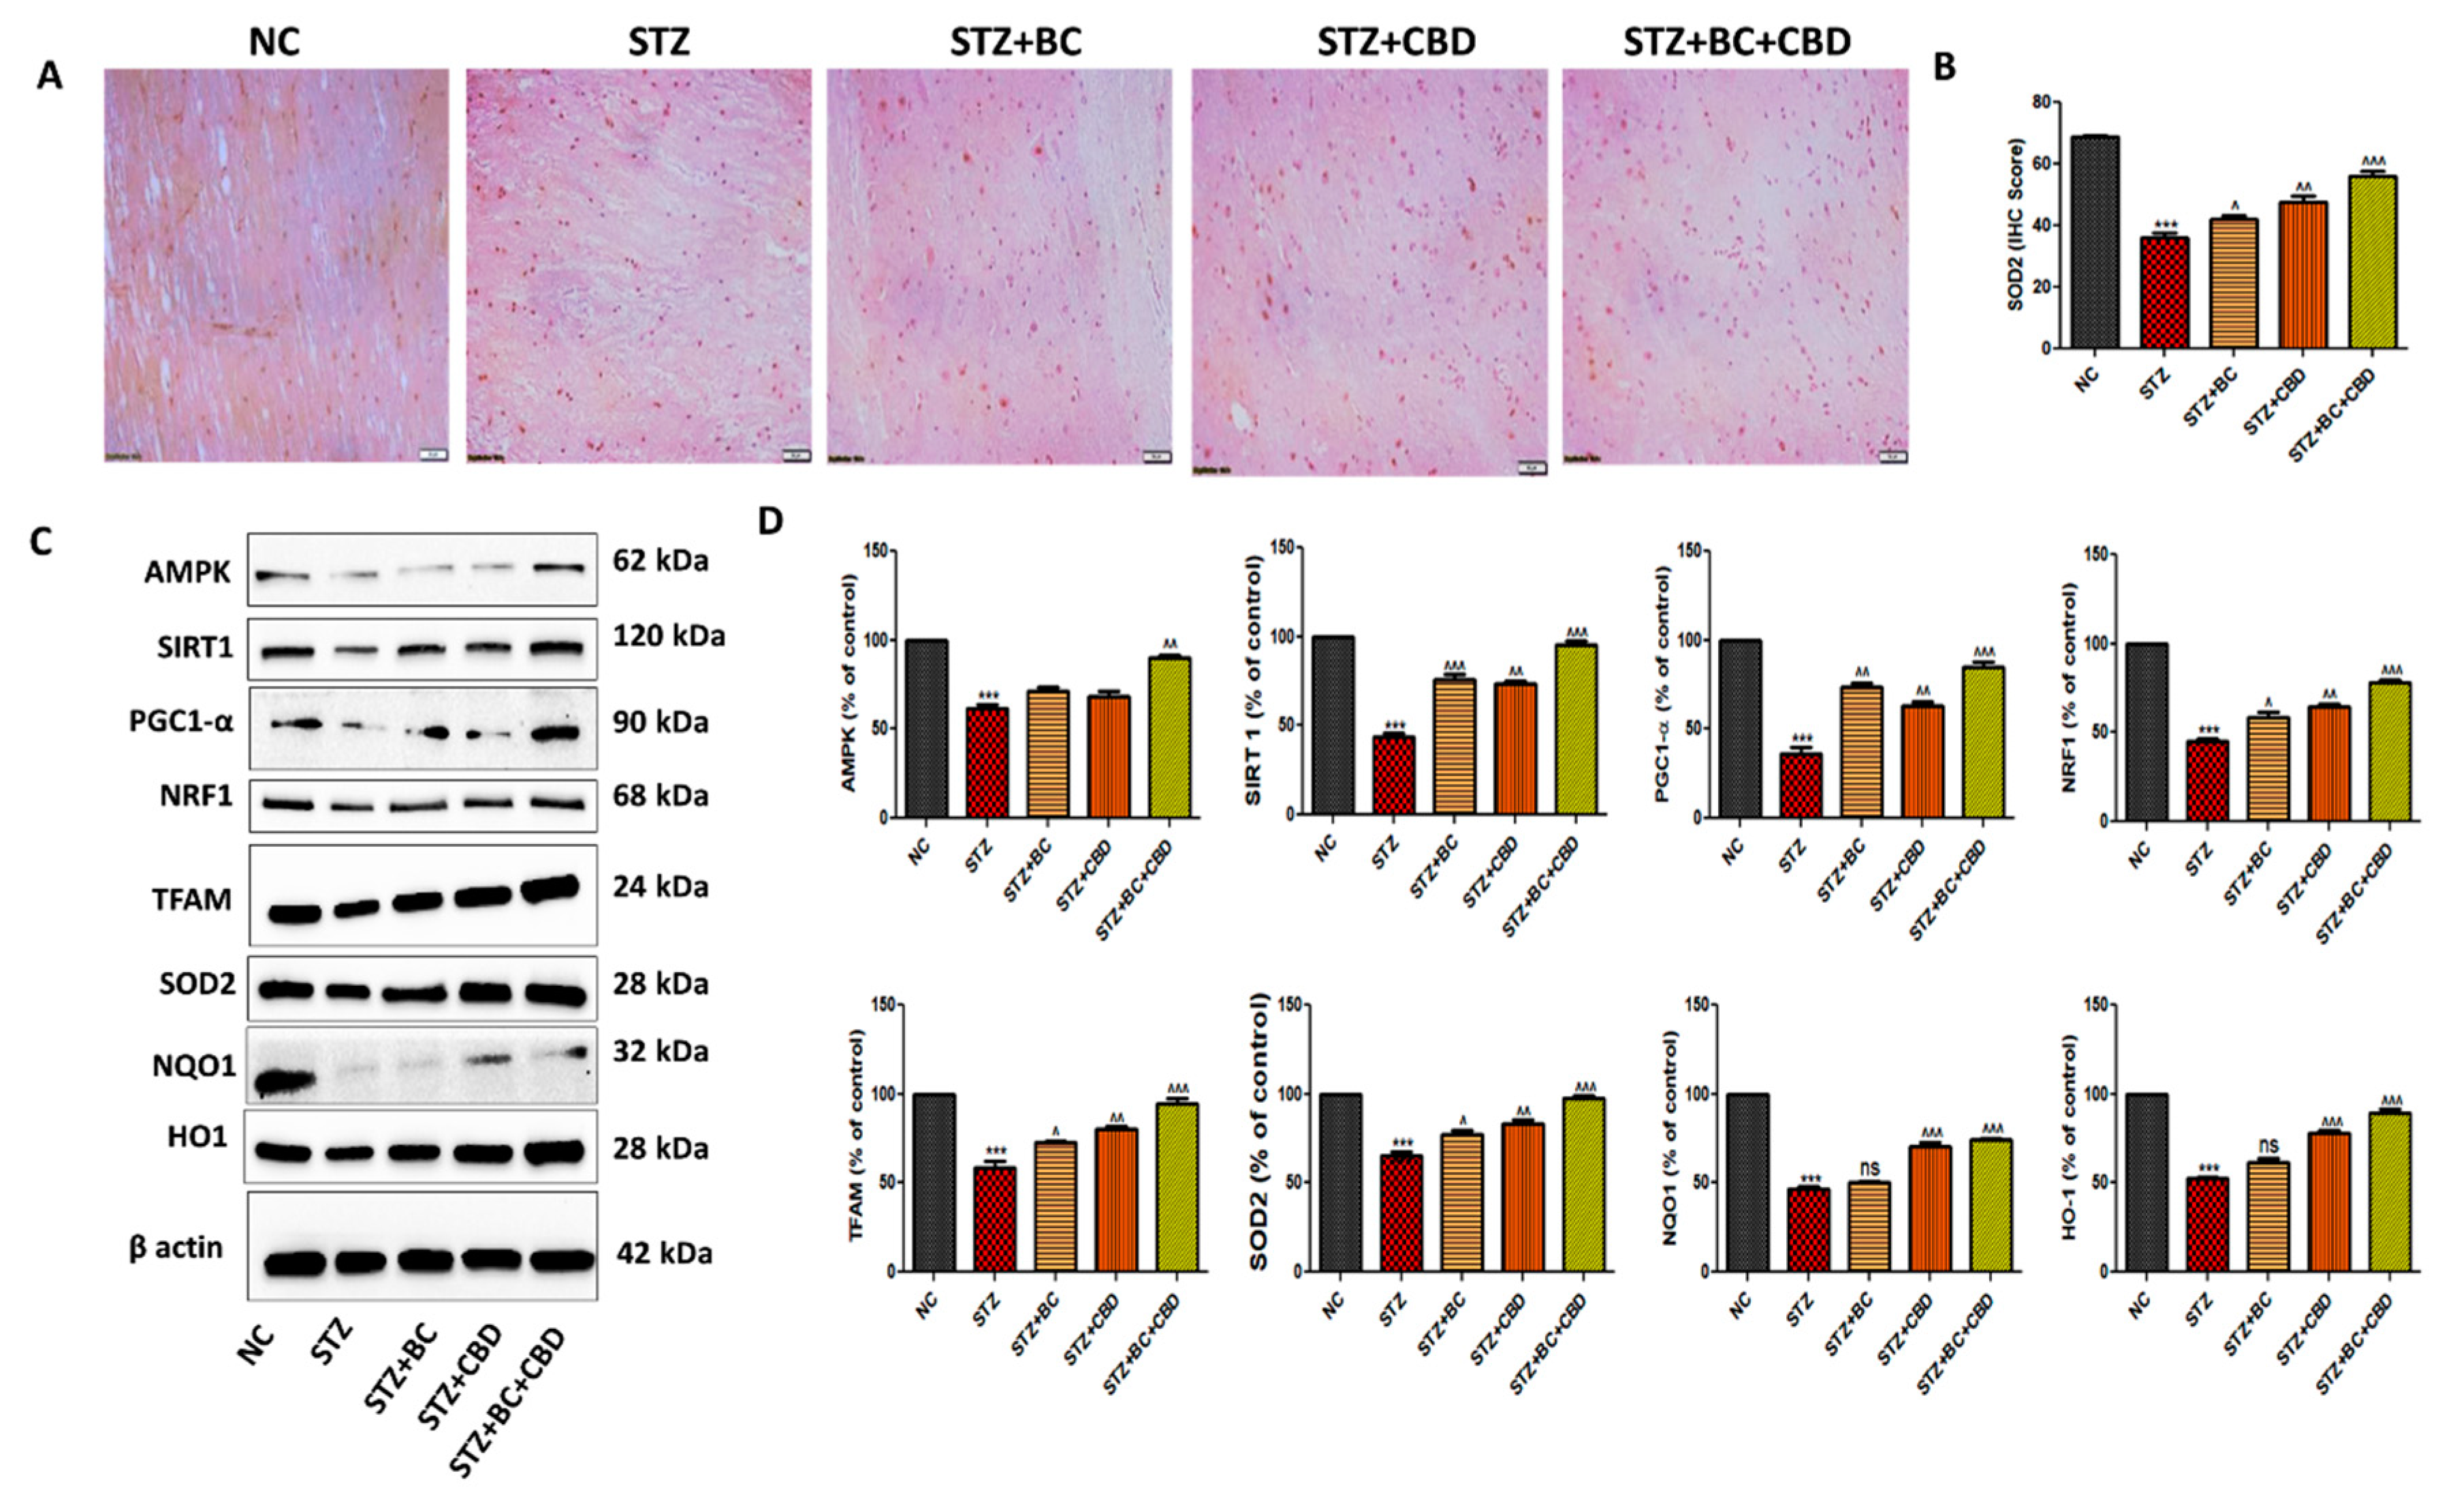
- BC, CBD, and their combination effect on mitochondrial biogenesis in diabetic SD rats
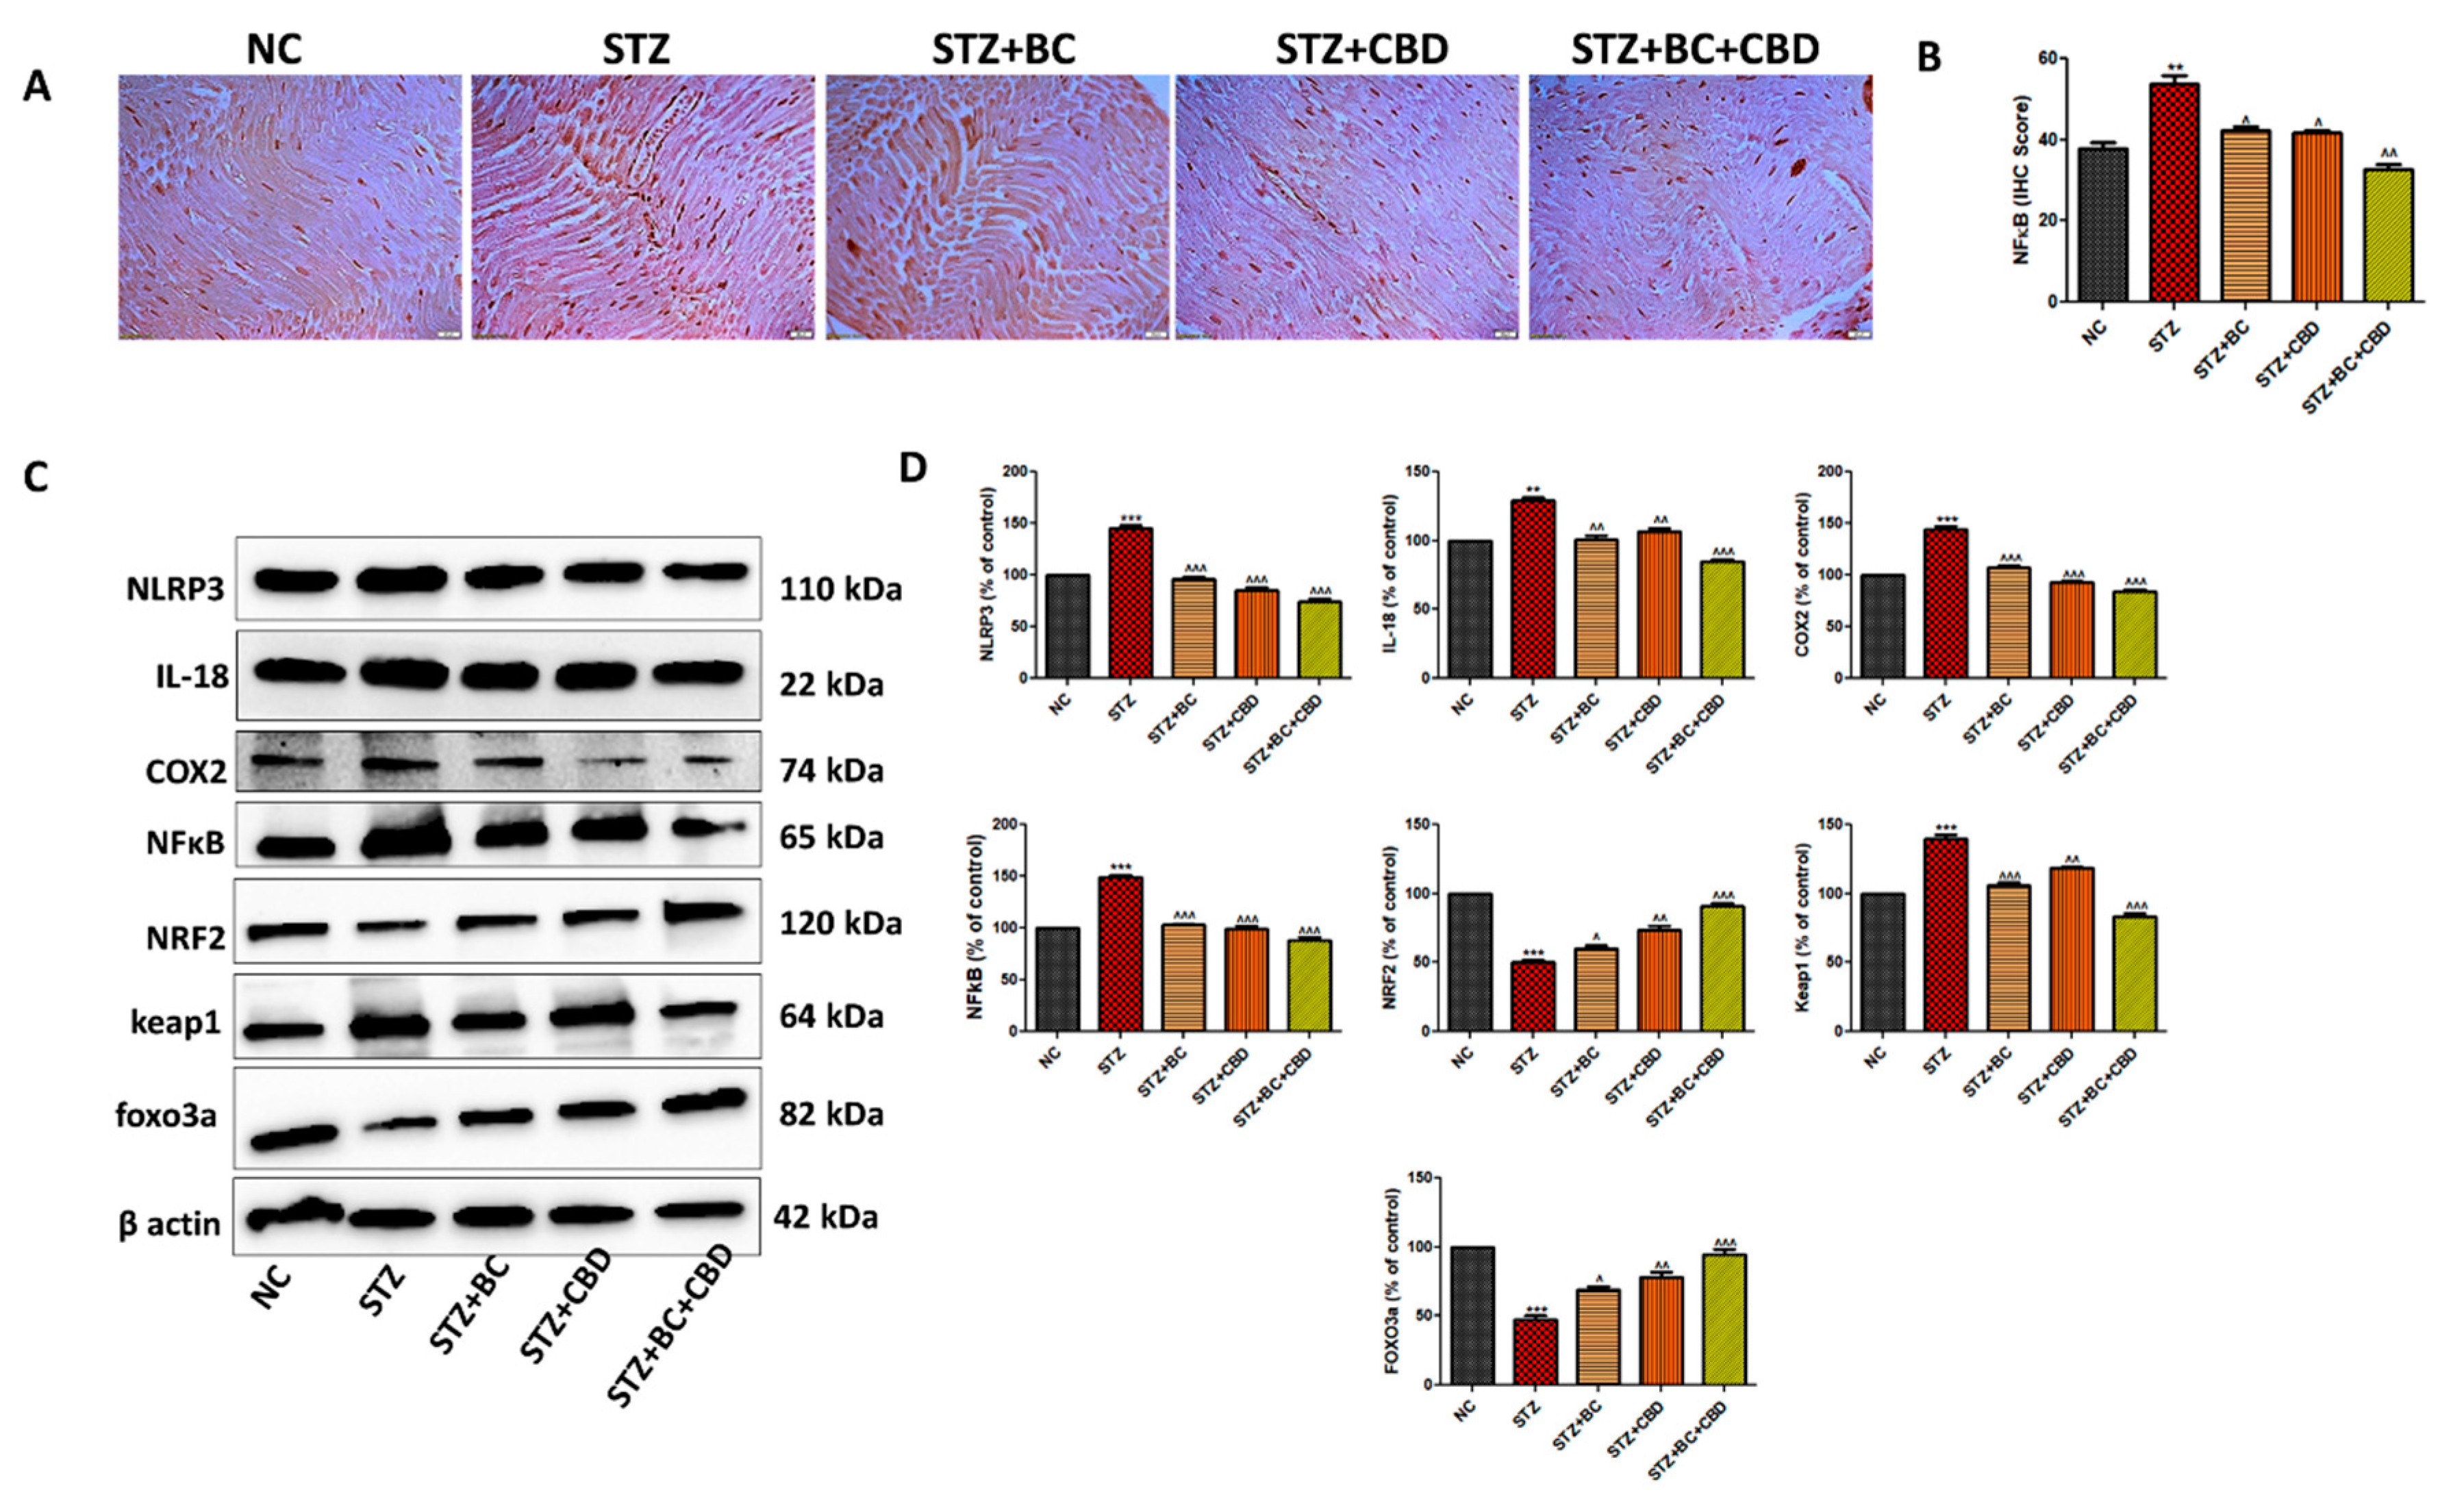
- BC, CBD and their combination effect on inflammasome and Nrf2 linked antioxidant effect in diabetic SD rats
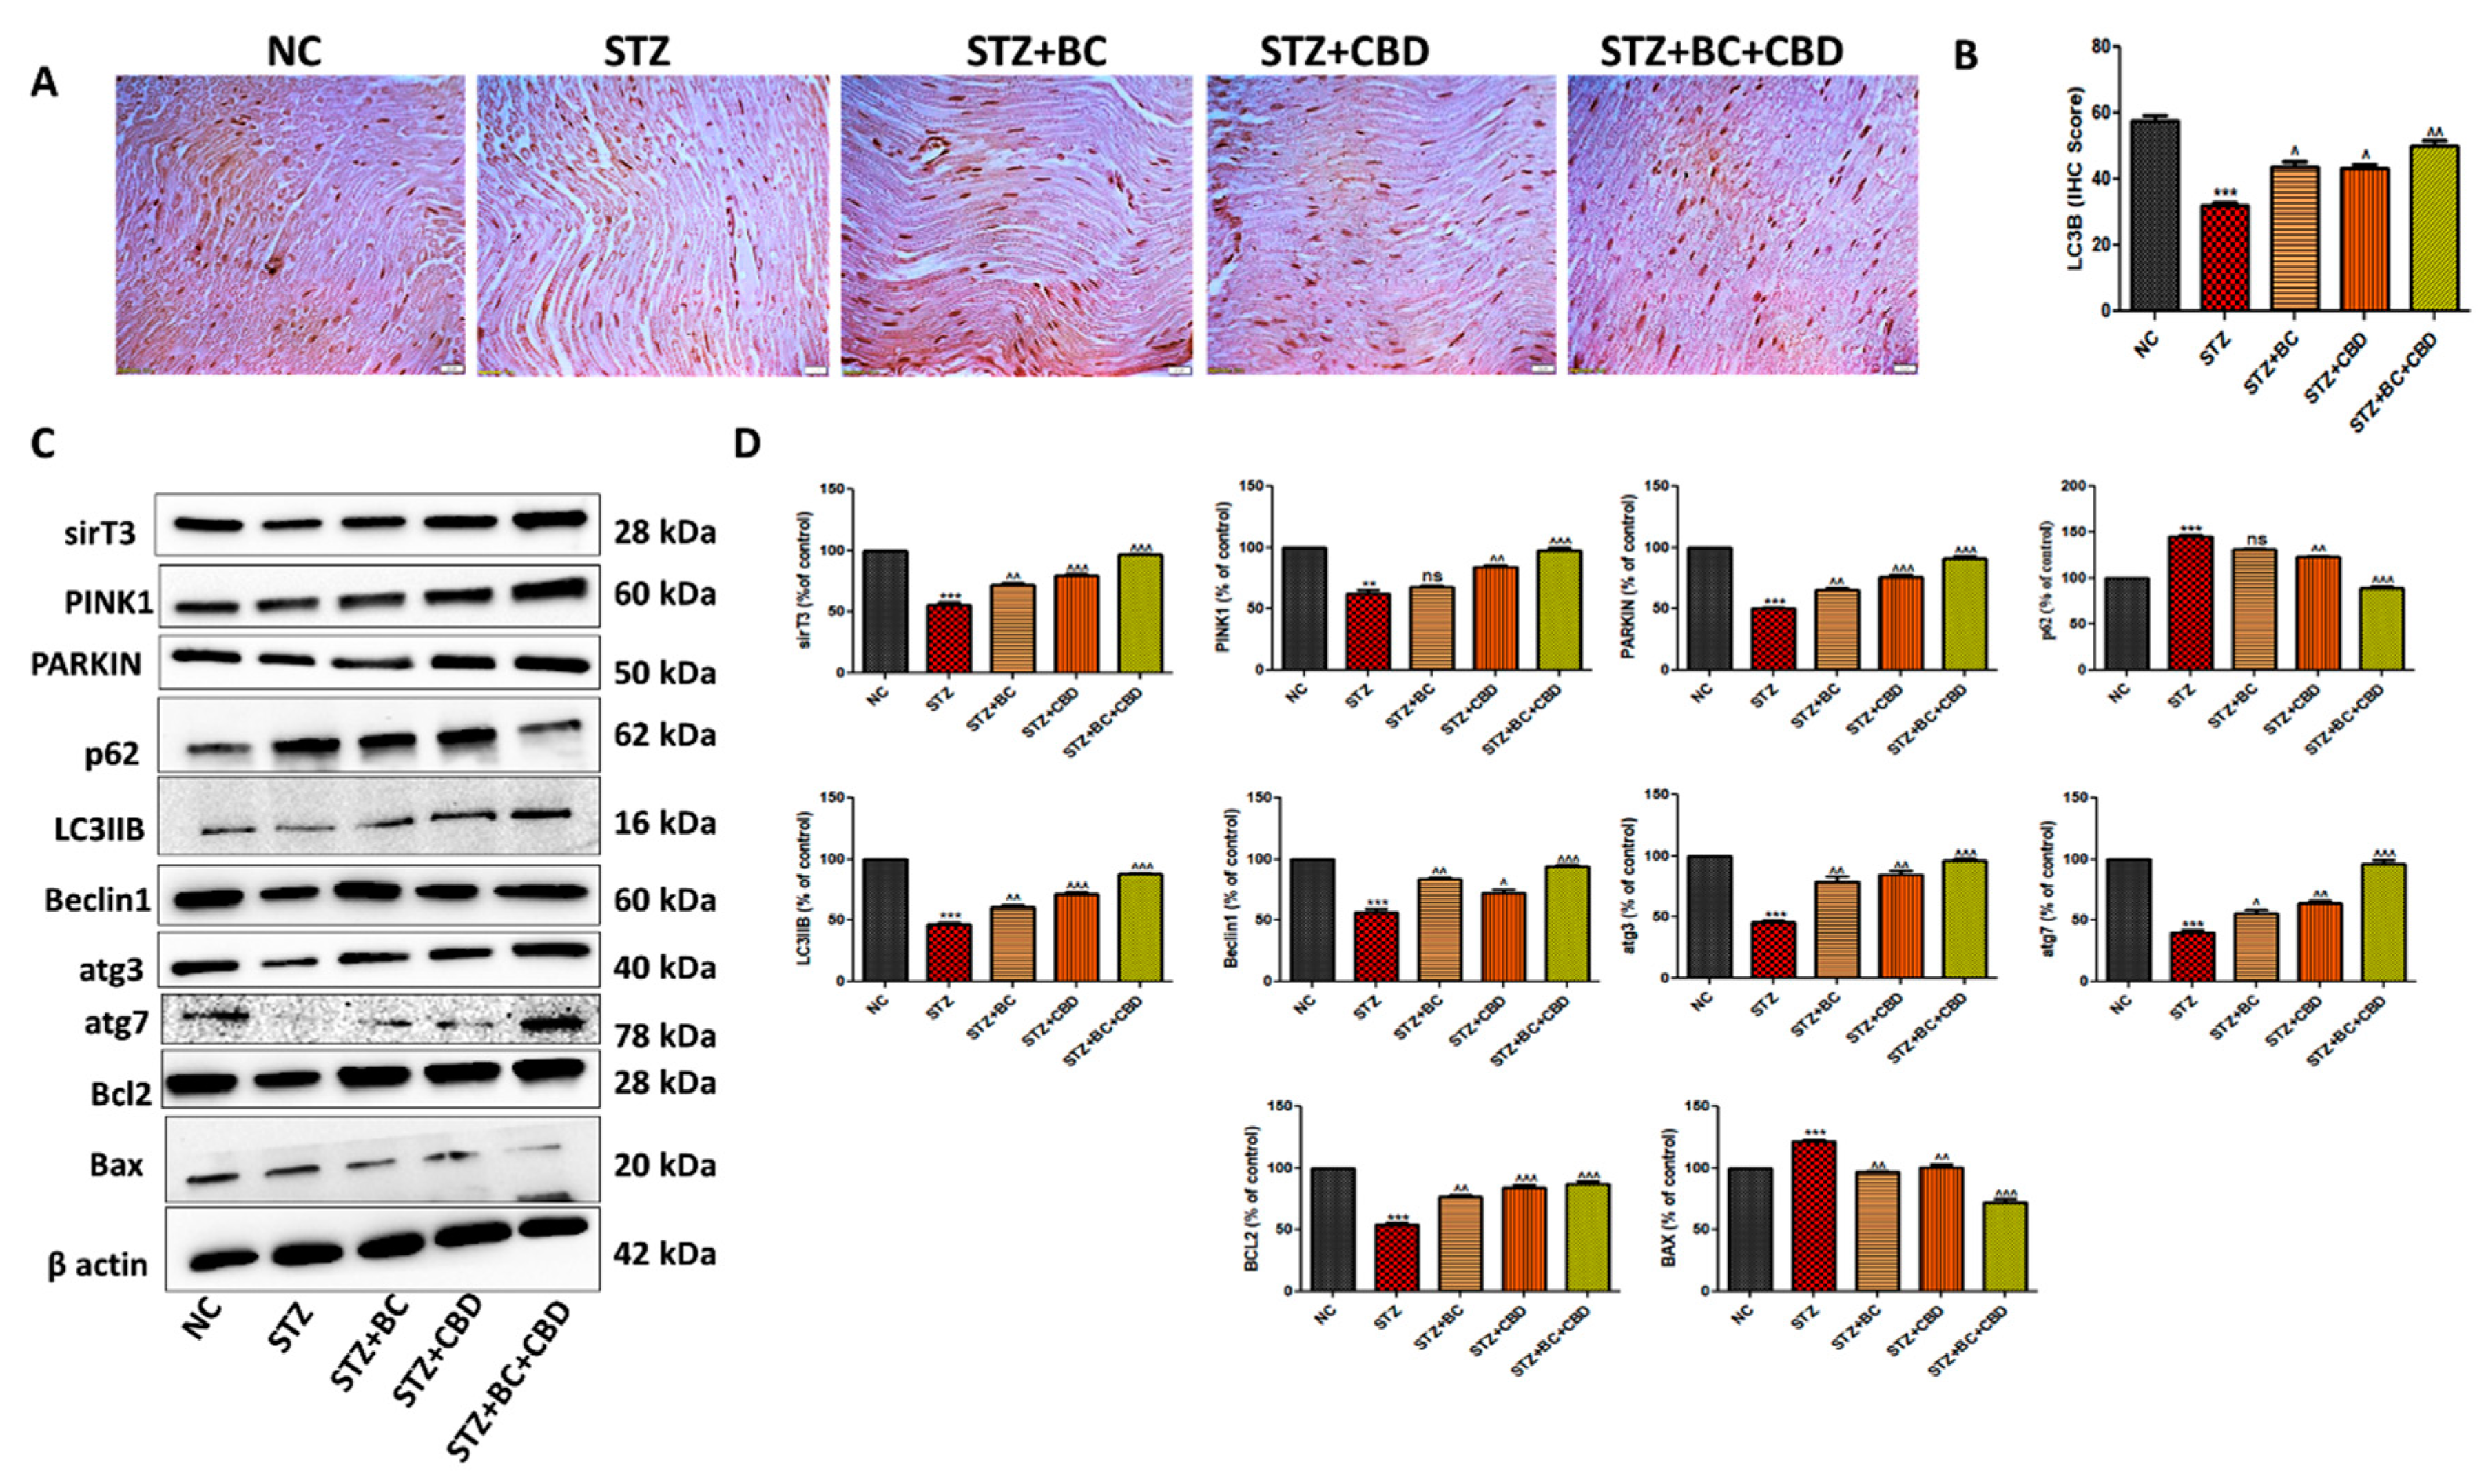
- BC, CBD, and their combination effect on autophagy in the diabetic SD rats
- BC, CBD and their combination effect on the loss of Intraepidermal nerve fiber (IENF) in the STZ induced neuropathic SD rats
Discussion
Conclusion
Author Contributions
Funding
Data Availability Statements
Conflict of Interest Statement
Abbreviations
References
- H. Yang, G. Sloan, Y. Ye, S. Wang, B. Duan, S. Tesfaye, L. Gao, New Perspective in Diabetic Neuropathy: From the Periphery to the Brain, a Call for Early Detection, and Precision Medicine, Front. Endocrinol. (Lausanne). 10 (2020) 503723. [CrossRef]
- E.L. Feldman, B.C. Callaghan, R. Pop-Busui, D.W. Zochodne, D.E. Wright, D.L. Bennett, V. Bril, J.W. Russell, V. Viswanathan, Diabetic neuropathy, Nat. Rev. Dis. Prim. 5 (2019) 42. [CrossRef]
- H. Sun, P. Saeedi, S. Karuranga, M. Pinkepank, K. Ogurtsova, B.B. Duncan, C. Stein, A. Basit, J.C.N. Chan, J.C. Mbanya, M.E. Pavkov, A. Ramachandaran, S.H. Wild, S. James, W.H. Herman, P. Zhang, C. Bommer, S. Kuo, E.J. Boyko, D.J. Magliano, IDF Diabetes Atlas: Global, regional and country-level diabetes prevalence estimates for 2021 and projections for 2045, Diabetes Res. Clin. Pract. 183 (2022) 109119. [CrossRef]
- V.K. Arruri, C. Gundu, I. Khan, D.K. Khatri, S.B. Singh, PARP overactivation in neurological disorders, Mol. Biol. Rep. 48 (2021) 2833–2841. [CrossRef]
- M. Rakusa, I. Marolt, Z. Stevic, S.V. Rebrina, T. Milenkovic, A. Stepien, Efficacy of Pregabalin and Duloxetine in Patients with Painful Diabetic Peripheral Neuropathy (PDPN): A Multi-Centre Phase IV Clinical Trial—BLOSSOM, Pharmaceuticals 16 (2023) 1017. [CrossRef]
- P. Fernyhough, Mitochondrial dysfunction in diabetic neuropathy: a series of unfortunate metabolic events, Curr. Diab. Rep. 15 (2015). [CrossRef]
- R. V. Intine, M.P. Sarras, Metabolic Memory and Chronic Diabetes Complications: Potential Role for Epigenetic Mechanisms, Curr. Diab. Rep. 12 (2012) 551. [CrossRef]
- I. Khan, K. Preeti, V. Fernandes, D.K. Khatri, S.B. Singh, Role of MicroRNAs, Aptamers in Neuroinflammation and Neurodegenerative Disorders, Cell. Mol. Neurobiol. 2021 427 42 (2021) 2075–2095. [CrossRef]
- Y. Yang, Y. Liu, Y. Wang, Y. Chao, J. Zhang, Y. Jia, J. Tie, D. Hu, Regulation of SIRT1 and Its Roles in Inflammation, Front. Immunol. 13 (2022) 831168. [CrossRef]
- K. Vargas-Ortiz, V. Pérez-Vázquez, M.H. Macías-Cervantes, Exercise and Sirtuins: A Way to Mitochondrial Health in Skeletal Muscle, Int. J. Mol. Sci. 20 (2019). [CrossRef]
- Y. Majeed, N. Halabi, A.Y. Madani, R. Engelke, A.M. Bhagwat, H. Abdesselem, M. V. Agha, M. Vakayil, R. Courjaret, N. Goswami, H. Ben Hamidane, M.A. Elrayess, A. Rafii, J. Graumann, F. Schmidt, N.A. Mazloum, SIRT1 promotes lipid metabolism and mitochondrial biogenesis in adipocytes and coordinates adipogenesis by targeting key enzymatic pathways, Sci. Reports 2021 111 11 (2021) 1–19. [CrossRef]
- I. Khan, K. Preeti, R. Kumar, D. Kumar Khatri, S. Bala Singh, Piceatannol promotes neuroprotection by inducing mitophagy and mitobiogenesis in the experimental diabetic peripheral neuropathy and hyperglycemia-induced neurotoxicity, Int. Immunopharmacol. 116 (2023) 109793. [CrossRef]
- Y.C. Chuang, S. Der Chen, S. Bin Jou, T.K. Lin, S.F. Chen, N.C. Chen, C.Y. Hsu, Sirtuin 1 Regulates Mitochondrial Biogenesis and Provides an Endogenous Neuroprotective Mechanism Against Seizure-Induced Neuronal Cell Death in the Hippocampus Following Status Epilepticus, Int. J. Mol. Sci. 20 (2019). [CrossRef]
- F. Villavicencio Tejo, R.A. Quintanilla, Contribution of the Nrf2 Pathway on Oxidative Damage and Mitochondrial Failure in Parkinson and Alzheimer’s Disease, Antioxidants 10 (2021). [CrossRef]
- H.-R. Li, Q. Liu, C.-L. Zhu, X.-Y. Sun, C.-Y. Sun, C.-M. Yu, P. Li, X.-M. Deng, J.-F. Wang, Î2-Nicotinamide mononucleotide activates NAD+/SIRT1 pathway and attenuates inflammatory and oxidative responses in the hippocampus regions of septic mice, Redox Biol. 63 (2023) 102745. [CrossRef]
- A.P. Rolo, C.M. Palmeira, Diabetes and mitochondrial function: role of hyperglycemia and oxidative stress, Toxicol. Appl. Pharmacol. 212 (2006) 167–178. [CrossRef]
- J.W. Russell, D. Golovoy, A.M. Vincent, P. Mahendru, J.A. Olzmann, A. Mentzer, E.L. Feldman, High glucose-induced oxidative stress and mitochondrial dysfunction in neurons, FASEB J. 16 (2002) 1738–1748. [CrossRef]
- A. Loboda, M. Damulewicz, E. Pyza, A. Jozkowicz, J. Dulak, Role of Nrf2/HO-1 system in development, oxidative stress response and diseases: an evolutionarily conserved mechanism, Cell. Mol. Life Sci. 73 (2016) 3221. [CrossRef]
- H. Chen, J. Deng, H. Gao, Y. Song, Y. Zhang, J. Sun, J. Zhai, Involvement of the SIRT1-NLRP3 pathway in the inflammatory response, Cell Commun. Signal. 21 (2023) 185. [CrossRef]
- Y. Li, P. Wang, X. Yang, W. Wang, J. Zhang, Y. He, W. Zhang, T. Jing, B. Wang, R. Lin, SIRT1 inhibits inflammatory response partly through regulation of NLRP3 inflammasome in vascular endothelial cells, Mol. Immunol. 77 (2016) 148–156. [CrossRef]
- G.E.S. Batiha, H.M. Al-kuraishy, A.I. Al-Gareeb, E. Elekhnawy, SIRT1 pathway in Parkinson’s disease: a faraway snapshot but so close, Inflammopharmacology 31 (2023) 37. [CrossRef]
- X. Li, Y. Feng, X.X. Wang, D. Truong, Y.C. Wu, The Critical Role of SIRT1 in Parkinson’s Disease: Mechanism and Therapeutic Considerations, Aging Dis. 11 (2020) 1608. [CrossRef]
- M. Entezari, D. Hashemi, A. Taheriazam, A. Zabolian, S. Mohammadi, F. Fakhri, M. Hashemi, K. Hushmandi, M. Ashrafizadeh, A. Zarrabi, Y.N. Ertas, S. Mirzaei, S. Samarghandian, AMPK signaling in diabetes mellitus, insulin resistance and diabetic complications: A pre-clinical and clinical investigation, Biomed. Pharmacother. 146 (2022) 112563. [CrossRef]
- N.B. Ruderman, X.J. Xu, L. Nelson, J.M. Cacicedo, A.K. Saha, F. Lan, Y. Ido, AMPK and SIRT1: A long-standing partnership?, Am. J. Physiol. - Endocrinol. Metab. 298 (2010) 751–760. [CrossRef]
- K. Huang, X. Luo, Y. Zhong, L. Deng, J. Feng, New insights into the role of melatonin in diabetic cardiomyopathy, Pharmacol. Res. Perspect. 10 (2022) e00904. [CrossRef]
- M.I. Martić-Kehl, R. Schibli, P.A. Schubiger, Can animal data predict human outcome? Problems and pitfalls of translational animal research, Eur. J. Nucl. Med. Mol. Imaging 39 (2012) 1492–1496. [CrossRef]
- N. Shanks, R. Greek, J. Greek, Are animal models predictive for humans?, Philos. Ethics. Humanit. Med. 4 (2009). [CrossRef]
- M.B. Bracken, Why animal studies are often poor predictors of human reactions to exposure, J. R. Soc. Med. 102 (2009) 120. [CrossRef]
- D.E. Ingber, Human organs-on-chips for disease modelling, drug development and personalized medicine, Nat. Rev. Genet. 2022 238 23 (2022) 467–491. [CrossRef]
- A.F. Gileta, C.J. Fitzpatrick, A.S. Chitre, C.L. St. Pierre, E. V. Joyce, R.J. Maguire, A.M. McLeod, N.M. Gonzales, A.E. Williams, J.D. Morrow, T.E. Robinson, S.B. Flagel, A.A. Palmer, Genetic characterization of outbred Sprague Dawley rats and utility for genome-wide association studies, PLoS Genet. 18 (2022). [CrossRef]
- V.G. Yerra, A. Kumar, Adenosine Monophosphate-Activated Protein Kinase Abates Hyperglycaemia-Induced Neuronal Injury in Experimental Models of Diabetic Neuropathy: Effects on Mitochondrial Biogenesis, Autophagy and Neuroinflammation, Mol. Neurobiol. 54 (2017) 2301–2312. [CrossRef]
- V.G. Yerra, A.K. Kalvala, A. Kumar, Isoliquiritigenin reduces oxidative damage and alleviates mitochondrial impairment by SIRT1 activation in experimental diabetic neuropathy, J. Nutr. Biochem. 47 (2017) 41–52. [CrossRef]
- A. Höke, Animal Models of Peripheral Neuropathies, Neurotherapeutics 9 (2012) 262. [CrossRef]
- R. Singh, S.A. Farooq, A. Mannan, T.G. Singh, A. Najda, Z. Grażyna, G.M. Albadrani, A.A. Sayed, M.M. Abdel-Daim, Animal models of diabetic microvascular complications: Relevance to clinical features, Biomed. Pharmacother. 145 (2022). [CrossRef]
- S. Green, M.R. Dietrich, S. Leonelli, R.A. Ankeny, “Extreme” organisms and the problem of generalization: interpreting the Krogh principle, Hist. Philos. Life Sci. 40 (2018). [CrossRef]
- Y.C. Cheng, L.W. Chu, J.Y. Chen, S.L. Hsieh, Y.C. Chang, Z.K. Dai, B.N. Wu, Loganin Attenuates High Glucose-Induced Schwann Cells Pyroptosis by Inhibiting ROS Generation and NLRP3 Inflammasome Activation, Cells 9 (2020) 1–18. [CrossRef]
- J. Li, R. Guan, L. Pan, Mechanism of Schwann cells in diabetic peripheral neuropathy: A review, Medicine (Baltimore). 102 (2023) E32653. [CrossRef]
- A.P. Mizisin, Mechanisms of diabetic neuropathy: Schwann cells, Handb. Clin. Neurol. 126 (2014) 401–428. [CrossRef]
- N.P. Gonçalves, C.B. Vægter, H. Andersen, L. Østergaard, N.A. Calcutt, T.S. Jensen, Schwann cell interactions with axons and microvessels in diabetic neuropathy, Nat. Rev. Neurol. 2017 133 13 (2017) 135–147. [CrossRef]
- H.M. Hashiesh, M.F. Nagoor Meeran, C. Sharma, B. Sadek, J. Al Kaabi, S.K. Ojha, Therapeutic Potential of β-Caryophyllene: A Dietary Cannabinoid in Diabetes and Associated Complications, Nutr. 2020, Vol. 12, Page 2963 12 (2020) 2963. [CrossRef]
- B. Horvth, P. Mukhopadhyay, G. Hask, P. Pacher, The Endocannabinoid System and Plant-Derived Cannabinoids in Diabetes and Diabetic Complications, Am. J. Pathol. 180 (2012) 432. [CrossRef]
- Z. Atakan, Cannabis, a complex plant: different compounds and different effects on individuals, Ther. Adv. Psychopharmacol. 2 (2012) 241. [CrossRef]
- V. Desaulniers Brousseau, B. Sen Wu, S. MacPherson, V. Morello, M. Lefsrud, Cannabinoids and Terpenes: How Production of Photo-Protectants Can Be Manipulated to Enhance Cannabis sativa L. Phytochemistry, Front. Plant Sci. 12 (2021) 620021. [CrossRef]
- H. Blanton, L. Yin, J. Duong, K. Benamar, Cannabidiol and Beta-Caryophyllene in Combination: A Therapeutic Functional Interaction, Int. J. Mol. Sci. 23 (2022) 15470. [CrossRef]
- B. Donertas, C. Cengelli Unel, K. Erol, Cannabinoids and agmatine as potential therapeutic alternatives for cisplatin-induced peripheral neuropathy, J. Exp. Pharmacol. 10 (2018) 19–28. [CrossRef]
- J. Zhang, C. Lin, S. Jin, H. Wang, Y. Wang, X. Du, M.R. Hutchinson, H. Zhao, L. Fang, X. Wang, The pharmacology and therapeutic role of cannabidiol in diabetes, Exploration 3 (2023). [CrossRef]
- R. Verma, F. Hoda, M. Arshad, A. Iqubal, A.N. Siddiqui, M.A. Khan, S.E. Haque, M. Akhtar, A.K. Najmi, Cannabis, a Miracle Drug with Polyvalent Therapeutic Utility: Preclinical and Clinical-Based Evidence, Med. Cannabis Cannabinoids 4 (2021) 43. [CrossRef]
- D. An, S. Peigneur, L.A. Hendrickx, J. Tytgat, Targeting Cannabinoid Receptors: Current Status and Prospects of Natural Products, Int. J. Mol. Sci. 21 (2020) 1–33. [CrossRef]
- H.M. Hashiesh, M.F. Nagoor Meeran, C. Sharma, B. Sadek, J. Al Kaabi, S.K. Ojha, Therapeutic Potential of β-Caryophyllene: A Dietary Cannabinoid in Diabetes and Associated Complications, Nutrients 12 (2020) 1–30. [CrossRef]
- E.P. Baron, P. Lucas, J. Eades, O. Hogue, Patterns of medicinal cannabis use, strain analysis, and substitution effect among patients with migraine, headache, arthritis, and chronic pain in a medicinal cannabis cohort, J. Headache Pain 2018 191 19 (2018) 1–28. [CrossRef]
- M.S. Wallace, T.D. Marcotte, A. Umlauf, B. Gouaux, J.H. Atkinson, Efficacy of Inhaled Cannabis on Painful Diabetic Neuropathy, J. Pain 16 (2015) 616–627. [CrossRef]
- J. Zhang, C. Lin, S. Jin, H. Wang, Y. Wang, X. Du, M.R. Hutchinson, H. Zhao, L. Fang, X. Wang, The pharmacology and therapeutic role of cannabidiol in diabetes, Exploration 3 (2023) 20230047. [CrossRef]
- D.S. Aguilar-Ávila, M.E. Flores-Soto, C. Tapia-Vázquez, O.A. Pastor-Zarandona, R.I. López-Roa, J.M. Viveros-Paredes, β-Caryophyllene, a Natural Sesquiterpene, Attenuates Neuropathic Pain and Depressive-Like Behavior in Experimental Diabetic Mice, J. Med. Food 22 (2019) 460–468. [CrossRef]
- H. Li, D. Wang, Y. Chen, M. Yang, β-Caryophyllene inhibits high glucose-induced oxidative stress, inflammation and extracellular matrix accumulation in mesangial cells, Int. Immunopharmacol. 84 (2020) 106556. [CrossRef]
- H. Blanton, L. Yin, J. Duong, K. Benamar, Cannabidiol and Beta-Caryophyllene in Combination: A Therapeutic Functional Interaction, Int. J. Mol. Sci. 23 (2022). [CrossRef]
- K.M. King, A.M. Myers, A.J. Soroka-Monzo, R.F. Tuma, R.J. Tallarida, E.A. Walker, S.J. Ward, Single and combined effects of Δ9-tetrahydrocannabinol and cannabidiol in a mouse model of chemotherapy-induced neuropathic pain, Br. J. Pharmacol. 174 (2017) 2832. [CrossRef]
- Glucose in Cell Culture, (n.d.). https://www.sigmaaldrich.com/US/en/technical-documents/technical-article/cell-culture-and-cell-culture-analysis/mammalian-cell-culture/glucose (accessed February 22, 2024).
- S. Clement, S.S. Braithwaite, M.F. Magee, A. Ahmann, E.P. Smith, R.G. Schafer, I.B. Hirsh, Management of Diabetes and Hyperglycemia in Hospitals, Diabetes Care 27 (2004) 553–591. [CrossRef]
- S. Yadranji Aghdam, Z. Gurel, A. Ghaffarieh, C.M. Sorenson, N. Sheibani, High glucose and diabetes modulate cellular proteasome function: Implications in the pathogenesis of diabetes complications, Biochem. Biophys. Res. Commun. 432 (2013) 339–344. [CrossRef]
- W. Wang, Z. Chai, M.E. Cooper, P.Z. Zimmet, H. Guo, J. Ding, F. Yang, X. Chen, X. Lin, K. Zhang, Q. Zhong, Z. Li, P. Zhang, Z. Wu, X. Guan, L. Zhang, K. He, High Fasting Blood Glucose Level With Unknown Prior History of Diabetes Is Associated With High Risk of Severe Adverse COVID-19 Outcome, Front. Endocrinol. (Lausanne). 12 (2021). [CrossRef]
- Y. pu Liu, S. jin Shao, H. dong Guo, Schwann cells apoptosis is induced by high glucose in diabetic peripheral neuropathy, Life Sci. 248 (2020) 117459. [CrossRef]
- L.Q. Sun, Y.Y. Chen, X. Wang, X.J. Li, B. Xue, L. Qu, T.T. Zhang, Y.M. Mu, J.M. Lu, The protective effect of Alpha lipoic acid on Schwann cells exposed to constant or intermittent high glucose, Biochem. Pharmacol. 84 (2012) 961–973. [CrossRef]
- Q. Li, Y. Jiao, Y. Yu, G. Wang, Y. Yu, Hydrogen-rich medium alleviates high glucose-induced oxidative stress and parthanatos in rat Schwann cells in vitro, Mol. Med. Rep. 19 (2019) 338. [CrossRef]
- W.D. Pallas, E.S. Pak, J.L. Hannan, In vitro high glucose increases apoptosis, decreases nerve outgrowth, and promotes survival of sympathetic pelvic neurons, Sex. Med. 11 (2023) 1–7. [CrossRef]
- A.K. Kalvala, R. Nimma, A. Bagde, S.K. Surapaneni, N. Patel, P. Arthur, L. Sun, R. Singh, N. Kommineni, A. Nathani, Y. Li, M. Singh, The role of Cannabidiol and tetrahydrocannabivarin to overcome doxorubicin resistance in MDA-MB-231 xenografts in athymic nude mice, Biochimie 208 (2023) 19–30. [CrossRef]
- A. Sood, V. Fernandes, K. Preeti, M. Khot, D.K. Khatri, S.B. Singh, Fingolimod Alleviates Cognitive Deficit in Type 2 Diabetes by Promoting Microglial M2 Polarization via the pSTAT3-jmjd3 Axis, Mol. Neurobiol. 60 (2023) 901–922. [CrossRef]
- H. Kim, X. Xue, Detection of Total Reactive Oxygen Species in Adherent Cells by 2′,7′-Dichlorodihydrofluorescein Diacetate Staining, J. Vis. Exp. 2020 (2020) 1–5. [CrossRef]
- J. Luo, Y. Xiang, X. Xu, D. Fang, D. Li, F. Ni, X. Zhu, B. Chen, M. Zhou, High Glucose-Induced ROS Production Stimulates Proliferation of Pancreatic Cancer via Inactivating the JNK Pathway, Oxid. Med. Cell. Longev. 2018 (2018). [CrossRef]
- A. Kumar Kalvala, A. Bagde, P. Arthur, S. Kumar Surapaneni, N. Ramesh, A. Nathani, M. Singh, Role of Cannabidiol and Tetrahydrocannabivarin on Paclitaxel-induced neuropathic pain in rodents, Int. Immunopharmacol. 107 (2022). [CrossRef]
- P. Bheereddy, V.G. Yerra, A.K. Kalvala, B. Sherkhane, A. Kumar, SIRT1 Activation by Polydatin Alleviates Oxidative Damage and Elevates Mitochondrial Biogenesis in Experimental Diabetic Neuropathy, Cell. Mol. Neurobiol. (2020). [CrossRef]
- S. Gunes, Z. He, R. Malone, P.J. Cullen, J.F. Curtin, J. Curtin, Platinum nanoparticles inhibit intracellular ROS generation and protect against Cold Atmospheric Plasma-induced cytotoxicity, BioRxiv (2021) 2021.02.18.431888. [CrossRef]
- K. Preeti, V. Fernandes, A. Sood, I. Khan, D.K. Khatri, S.B. Singh, Necrostatin-1S mitigates type-2 diabetes-associated cognitive decrement and lipotoxicity-induced neuro-microglia changes through p-RIPK-RIPK3-p-MLKL axis, Metab. Brain Dis. 38 (2023) 1581–1612. [CrossRef]
- S.K. Surapaneni, N. Patel, L. Sun, N. Kommineni, A.K. Kalvala, A. Gebeyehu, P. Arthur, L.C. Duke, R. Nimma, D. G Meckes, M. Singh, Anticancer and chemosensitization effects of cannabidiol in 2D and 3D cultures of TNBC: involvement of GADD45α, integrin-α5, -β5, -β1, and autophagy, Drug Deliv. Transl. Res. 12 (2022) 2762. [CrossRef]
- I. Khan, K. Preeti, R. Kumar, D.K. Khatri, S.B. Singh, Activation of SIRT1 by silibinin improved mitochondrial health and alleviated the oxidative damage in experimental diabetic neuropathy and high glucose-mediated neurotoxicity, Arch. Physiol. Biochem. 0 (2020) 1–17. [CrossRef]
- A.K. Kalvala, A. Bagde, P. Arthur, T. Kulkarni, S. Bhattacharya, S. Surapaneni, N.K. Patel, R. Nimma, A. Gebeyehu, N. Kommineni, D.G. Meckes, L. Sun, B. Banjara, K. Mosley-Kellum, T.C. Dinh, M. Singh, Cannabidiol-Loaded Extracellular Vesicles from Human Umbilical Cord Mesenchymal Stem Cells Alleviate Paclitaxel-Induced Peripheral Neuropathy, Pharmaceutics 15 (2023). [CrossRef]
- K. Preeti, A. Sood, V. Fernandes, I. Khan, D.K. Khatri, S.B. Singh, Experimental Type 2 diabetes and lipotoxicity-associated neuroinflammation involve mitochondrial DNA-mediated cGAS/STING axis: implication of Type-1 interferon response in cognitive impairment, Mol. Neurobiol. (2024) 1–28. [CrossRef]
- A. Nathani, L. Sun, I. Khan, M. Aare, A. Bagde, Y. Li, M. Singh, Combined Role of Interleukin-15 Stimulated Natural Killer Cell-Derived Extracellular Vesicles and Carboplatin in Osimertinib-Resistant H1975 Lung Cancer Cells with EGFR Mutations, Pharm. 2024, Vol. 16, Page 83 16 (2024) 83. [CrossRef]
- N.P. du Sert, V. Hurst, A. Ahluwalia, S. Alam, M.T. Avey, M. Baker, W.J. Browne, A. Clark, I.C. Cuthill, U. Dirnagl, M. Emerson, P. Garner, S.T. Holgate, D.W. Howells, N.A. Karp, S.E. Lazic, K. Lidster, C.J. MacCallum, M. Macleod, E.J. Pearl, O.H. Petersen, F. Rawle, P. Reynolds, K. Rooney, E.S. Sena, S.D. Silberberg, T. Steckler, H. Würbel, The ARRIVE guidelines 2.0: Updated guidelines for reporting animal research, PLoS Biol. 18 (2020). [CrossRef]
- A. Kumar, G. Negi, S.S. Sharma, Suppression of NF-κB and NF-κB regulated oxidative stress and neuroinflammation by BAY 11-7082 (IκB phosphorylation inhibitor) in experimental diabetic neuropathy, Biochimie 94 (2012) 1158–1165. [CrossRef]
- V.G. Yerra, A.K. Kalvala, A. Kumar, Isoliquiritigenin reduces oxidative damage and alleviates mitochondrial impairment by SIRT1 activation in experimental diabetic neuropathy, J. Nutr. Biochem. 47 (2017) 41–52. [CrossRef]
- A.K. Kalvala, V.G. Yerra, B. Sherkhane, C. Gundu, V. Arruri, R. Kumar, A. Kumar, Chronic hyperglycemia impairs mitochondrial unfolded protein response and precipitates proteotoxicity in experimental diabetic neuropathy: focus on LonP1 mediated mitochondrial regulation, Pharmacol. Reports 2020 726 72 (2020) 1627–1644. [CrossRef]
- H. Blanton, L. Yin, J. Duong, K. Benamar, Cannabidiol and Beta-Caryophyllene in Combination: A Therapeutic Functional Interaction, Int. J. Mol. Sci. 23 (2022). [CrossRef]
- A. Areti, P. Komirishetty, M. Akuthota, R.A. Malik, A. Kumar, Melatonin prevents mitochondrial dysfunction and promotes neuroprotection by inducing autophagy during oxaliplatin-evoked peripheral neuropathy, J. Pineal Res. 62 (2017) e12393. [CrossRef]
- R.M.P. Campos, A.F.L. Aguiar, Y. Paes-Colli, P.M.P. Trindade, B.K. Ferreira, R.A. de Melo Reis, L.S. Sampaio, Cannabinoid Therapeutics in Chronic Neuropathic Pain: From Animal Research to Human Treatment, Front. Physiol. 12 (2021) 785176. [CrossRef]
- J.M. Quintero, G. Pulido, L.F. Giraldo, M.X. Leon, L.E. Diaz, R.H. Bustos, A Systematic Review on Cannabinoids for Neuropathic Pain Administered by Routes Other than Oral or Inhalation, Plants 11 (2022). [CrossRef]
- J. Mlost, M. Bryk, K. Starowicz, Cannabidiol for Pain Treatment: Focus on Pharmacology and Mechanism of Action, Int. J. Mol. Sci. 21 (2020) 1–22. [CrossRef]
- Z. Wang, P. Zheng, X. Chen, Y. Xie, K. Weston-Green, N. Solowij, Y.L. Chew, X.F. Huang, Cannabidiol induces autophagy and improves neuronal health associated with SIRT1 mediated longevity, GeroScience 44 (2022) 1505–1524. [CrossRef]
- B. Ni, Y. Liu, M. Dai, J. Zhao, Y. Liang, X. Yang, B. Han, M. Jiang, The role of cannabidiol in aging, Biomed. Pharmacother. 165 (2023) 115074. [CrossRef]
- P. Bheereddy, V.G. Yerra, A.K. Kalvala, B. Sherkhane, A. Kumar, SIRT1 Activation by Polydatin Alleviates Oxidative Damage and Elevates Mitochondrial Biogenesis in Experimental Diabetic Neuropathy, Cell. Mol. Neurobiol. 41 (2021) 1563–1577. [CrossRef]
- A.K. Kalvala, I. Khan, C. Gundu, A. Kumar, An Overview on ATP Dependent and Independent Proteases Including an Anterograde to Retrograde Control on Mitochondrial Function; Focus on Diabetes and Diabetic Complications, Curr. Pharm. Des. 25 (2019) 2584–2594. [CrossRef]
- G.J. Biessels, V. Bril, N.A. Calcutt, N.E. Cameron, M.A. Cotter, R. Dobrowsky, E.L. Feldman, P. Fernyhough, J. Jakobsen, R.A. Malik, A.P. Mizisin, P.J. Oates, I.G. Obrosova, R. Pop-Busui, J.W. Russell, A.A. Sima, M.J. Stevens, R.E. Schmidt, S. Tesfaye, A. Veves, A.I. Vinik, D.E. Wright, S. Yagihashi, M.A. Yorek, D. Ziegler, D.W. Zochodne, Phenotyping animal models of diabetic neuropathy: a consensus statement of the diabetic neuropathy study group of the EASD (Neurodiab), J. Peripher. Nerv. Syst. 19 (2014) 77. [CrossRef]
- D.H. Xu, B.D. Cullen, M. Tang, Y. Fang, The Effectiveness of Topical Cannabidiol Oil in Symptomatic Relief of Peripheral Neuropathy of the Lower Extremities, Curr. Pharm. Biotechnol. 21 (2020) 390–402. [CrossRef]
- E. Schulz, S. Schuhmacher, T. Münzel, When metabolism rules perfusion: AMPK-mediated endothelial nitric oxide synthase activation, Circ. Res. 104 (2009) 422–424. [CrossRef]
- V.G. Yerra, A. Kumar, Adenosine Monophosphate-Activated Protein Kinase Abates Hyperglycaemia-Induced Neuronal Injury in Experimental Models of Diabetic Neuropathy: Effects on Mitochondrial Biogenesis, Autophagy and Neuroinflammation, Mol. Neurobiol. 54 (2017) 2301–2312. [CrossRef]
- K.A. Weikel, N.B. Ruderman, J.M. Cacicedo, Unraveling the Actions of AMP-activated Protein Kinase in Metabolic Diseases: Systemic to Molecular Insights, Metabolism. 65 (2016) 634. [CrossRef]
- C. Rodríguez, M. Muñoz, C. Contreras, D. Prieto, AMPK, metabolism, and vascular function, FEBS J. 288 (2021) 3746–3771. [CrossRef]
- M.C.N. Sack, T. Finkel, Mitochondrial metabolism, sirtuins, and aging, Cold Spring Harb. Perspect. Biol. 4 (2012). [CrossRef]
- Y. Li, L. Wang, G. Zhang, X. Qiao, M. Zhang, SIRT1 Mediates Neuropathic Pain Induced by Sciatic Nerve Chronic Constrictive Injury in the VTA-NAc Pathway, Pain Res. Manag. 2020 (2020). [CrossRef]
- Y.Q. Zhou, W. Mei, X.B. Tian, Y.K. Tian, D.Q. Liu, D.W. Ye, The therapeutic potential of Nrf2 inducers in chronic pain: Evidence from preclinical studies, Pharmacol. Ther. 225 (2021). [CrossRef]
- F.H. Song, D.Q. Liu, Y.Q. Zhou, W. Mei, SIRT1: A promising therapeutic target for chronic pain, CNS Neurosci. Ther. 28 (2022) 818–828. [CrossRef]
- K.C. Chang, P.F. Liu, C.H. Chang, Y.C. Lin, Y.J. Chen, C.W. Shu, The interplay of autophagy and oxidative stress in the pathogenesis and therapy of retinal degenerative diseases, Cell Biosci. 12 (2022) 1–20. [CrossRef]
- W. Ornatowski, Q. Lu, M. Yegambaram, A.E. Garcia, E.A. Zemskov, E. Maltepe, J.R. Fineman, T. Wang, S.M. Black, Complex interplay between autophagy and oxidative stress in the development of pulmonary disease, Redox Biol. 36 (2020). [CrossRef]
- Y.L. Wu, Z.J. Lin, C.C. Li, X. Lin, S.K. Shan, B. Guo, M.H. Zheng, F. Li, L.Q. Yuan, Z. hong Li, Epigenetic regulation in metabolic diseases: mechanisms and advances in clinical study, Signal Transduct. Target. Ther. 2023 81 8 (2023) 1–27. [CrossRef]
- G.F.S. Fernandes, G.D.B. Silva, A.R. Pavan, D.E. Chiba, C.M. Chin, J.L. Dos Santos, Epigenetic Regulatory Mechanisms Induced by Resveratrol, Nutrients 9 (2017). [CrossRef]
- A. Salminen, J.M.T. Hyttinen, K. Kaarniranta, AMP-activated protein kinase inhibits NF-κB signaling and inflammation: impact on healthspan and lifespan, J. Mol. Med. (Berl). 89 (2011) 667–676. [CrossRef]
- A.K. Kalvala, A. Bagde, P. Arthur, T. Kulkarni, S. Bhattacharya, S. Surapaneni, N.K. Patel, R. Nimma, A. Gebeyehu, N. Kommineni, D.G. Meckes, L. Sun, B. Banjara, K. Mosley-Kellum, T.C. Dinh, M. Singh, Cannabidiol-Loaded Extracellular Vesicles from Human Umbilical Cord Mesenchymal Stem Cells Alleviate Paclitaxel-Induced Peripheral Neuropathy, Pharm. 2023, Vol. 15, Page 554 15 (2023) 554. [CrossRef]
- S. Atalay Ekiner, A. Gęgotek, E. Skrzydlewska, The molecular activity of cannabidiol in the regulation of Nrf2 system interacting with NF-κB pathway under oxidative stress, Redox Biol. 57 (2022) 102489. [CrossRef]
- R. Prakash, N. Kumari, A.J. Siddiqui, A.Q. Khan, M.A. Khan, R. Khan, R. Haque, A.A. Robertson, J. Boltze, S.S. Raza, MCC950 Regulates Stem Cells Destiny Through Modulating SIRT3-NLRP3 Inflammasome Dynamics During Oxygen Glucose Deprivation, Stem Cell Rev. Reports 19 (2023) 1415–1426. [CrossRef]
- T. Zhang, Z. Fang, K.G. Linghu, J. Liu, L. Gan, L. Lin, Small molecule-driven SIRT3-autophagy-mediated NLRP3 inflammasome inhibition ameliorates inflammatory crosstalk between macrophages and adipocytes, Br. J. Pharmacol. 177 (2020) 4645–4665. [CrossRef]
- M.L. Chen, X.H. Zhu, L. Ran, H.D. Lang, L. Yi, M.T. Mi, Trimethylamine-N-Oxide Induces Vascular Inflammation by Activating the NLRP3 Inflammasome Through the SIRT3-SOD2-mtROS Signaling Pathway, J. Am. Heart Assoc. 6 (2017). [CrossRef]
- K. Schroder, J. Tschopp, The Inflammasomes, Cell 140 (2010) 821–832. [CrossRef]
- R. Zhou, A.S. Yazdi, P. Menu, J. Tschopp, A role for mitochondria in NLRP3 inflammasome activation, Nat. 2010 4697329 469 (2010) 221–225. [CrossRef]
- F. Marín-Aguilar, B. Castejón-Vega, E. Alcocer-Gómez, D. Lendines-Cordero, M.A. Cooper, P. De La Cruz, E. Andújar-Pulido, M. Pérez-Alegre, J. Muntané, A.J. Pérez-Pulido, B. Ryffel, A.A.B. Robertson, J. Ruiz-Cabello, P. Bullón, M.D. Cordero, NLRP3 Inflammasome Inhibition by MCC950 in Aged Mice Improves Health via Enhanced Autophagy and PPARα Activity, J. Gerontol. A. Biol. Sci. Med. Sci. 75 (2020) 1457–1464. [CrossRef]
- W. Chen, X. Wang, Q. Sun, Y. Zhang, J. Liu, T. Hu, W. Wu, C. Wei, M. Liu, Y. Ding, D. Liu, Y. Chong, P. Wang, H. Zhu, W. Cui, J. Zhang, Q. Li, F. Yang, The upregulation of NLRP3 inflammasome in dorsal root ganglion by ten-eleven translocation methylcytosine dioxygenase 2 (TET2) contributed to diabetic neuropathic pain in mice, J. Neuroinflammation 19 (2022) 1–19. [CrossRef]
- Y. Bai, Q. Mu, X. Bao, J. Zuo, X. Fang, J. Hua, D. Zhang, G. Jiang, P. Li, S. Gao, D. Zhao, Targeting NLRP3 Inflammasome in the Treatment Of Diabetes and Diabetic Complications: Role of Natural Compounds from Herbal Medicine, Aging Dis. 12 (2021) 1587. [CrossRef]
- Y. qun Zhou, D. qiang Liu, S. ping Chen, N. Chen, J. Sun, X. mei Wang, F. Cao, Y. ke Tian, D. wei Ye, Nrf2 activation ameliorates mechanical allodynia in paclitaxel-induced neuropathic pain, Acta Pharmacol. Sin. 41 (2020) 1041–1048. [CrossRef]
- N. Chen, M.M. Ge, D.Y. Li, X.M. Wang, D.Q. Liu, D.W. Ye, Y.K. Tian, Y.Q. Zhou, J.P. Chen, β2-adrenoreceptor agonist ameliorates mechanical allodynia in paclitaxel-induced neuropathic pain via induction of mitochondrial biogenesis, Biomed. Pharmacother. 144 (2021). [CrossRef]
- J. Sun, J.Y. Li, L.Q. Zhang, D.Y. Li, J.Y. Wu, S.J. Gao, D.Q. Liu, Y.Q. Zhou, W. Mei, Nrf2 Activation Attenuates Chronic Constriction Injury-Induced Neuropathic Pain via Induction of PGC-1 α-Mediated Mitochondrial Biogenesis in the Spinal Cord, Oxid. Med. Cell. Longev. 2021 (2021). [CrossRef]
- J. Sun, F.H. Song, J.Y. Wu, L.Q. Zhang, D.Y. Li, S.J. Gao, D.Q. Liu, Y.Q. Zhou, W. Mei, Sestrin2 overexpression attenuates osteoarthritis pain via induction of AMPK/PGC-1α-mediated mitochondrial biogenesis and suppression of neuroinflammation, Brain. Behav. Immun. 102 (2022) 53–70. [CrossRef]
- G. Negi, A. Kumar, R.P. Joshi, S.S. Sharma, Oxidative stress and Nrf2 in the pathophysiology of diabetic neuropathy: old perspective with a new angle, Biochem. Biophys. Res. Commun. 408 (2011) 1–5. [CrossRef]
- G. Negi, A. Kumar, S. S. Sharma, Nrf2 and NF-κB modulation by sulforaphane counteracts multiple manifestations of diabetic neuropathy in rats and high glucose-induced changes, Curr. Neurovasc. Res. 8 (2011) 294–304. [CrossRef]
- G. Negi, A. Kumar, S.S. Sharma, Melatonin modulates neuroinflammation and oxidative stress in experimental diabetic neuropathy: effects on NF-κB and Nrf2 cascades, Undefined 50 (2011) 124–131. [CrossRef]
- L. Yang, R. Rozenfeld, D. Wu, L.A. Devi, Z. Zhang, A. Cederbaum, Cannabidiol protects liver from binge alcohol-induced steatosis by mechanisms including inhibition of oxidative stress and increase in autophagy, Free Radic. Biol. Med. 68 (2014) 260–267. [CrossRef]
- W. Xu, U. Ocak, L. Gao, S. Tu, C.J. Lenahan, J. Zhang, A. Shao, Selective autophagy as a therapeutic target for neurological diseases, Cell. Mol. Life Sci. 78 (2021) 1369. [CrossRef]
- O. Corti, K. Blomgren, A. Poletti, P.M. Beart, Autophagy in neurodegeneration: New insights underpinning therapy for neurological diseases, J. Neurochem. 154 (2020) 354–371. [CrossRef]
- R. Kang, H.J. Zeh, M.T. Lotze, D. Tang, The Beclin 1 network regulates autophagy and apoptosis, Cell Death Differ. 18 (2011) 571. [CrossRef]
- G. Jîtcă, B.E. Ősz, C.E. Vari, C.M. Rusz, A. Tero-Vescan, A. Pușcaș, Cannabidiol: Bridge between Antioxidant Effect, Cellular Protection, and Cognitive and Physical Performance, Antioxidants 2023, Vol. 12, Page 485 12 (2023) 485. [CrossRef]



Disclaimer/Publisher’s Note: The statements, opinions and data contained in all publications are solely those of the individual author(s) and contributor(s) and not of MDPI and/or the editor(s). MDPI and/or the editor(s) disclaim responsibility for any injury to people or property resulting from any ideas, methods, instructions or products referred to in the content. |
© 2024 by the authors. Licensee MDPI, Basel, Switzerland. This article is an open access article distributed under the terms and conditions of the Creative Commons Attribution (CC BY) license (http://creativecommons.org/licenses/by/4.0/).


