Introduction
Chirality represents a fundamental characteristic of natural biological molecules. The distinct chiral structures of molecules with chiral centers exert significant influences on their metabolic patterns within cellular environments [
1,
2]. Notably, the therapeutic efficacy of L-dopa in Parkinson’s disease treatment is well-established, as it can bypass the blood-brain barrier and covert to dopamine through decarboxylation [
3]. Conversely, the enantiomer D-dopa lacks therapeutic effects and, instead, accumulates in the body, leading to adverse reactions [
4]. Recent investigations have unveiled that the regulatory role of chirality in metabolic behavior extends beyond small molecules to include nanomaterials [
5,
6], giving rise to the emerging field of chiral nanomedicine. In pursuit of this objective, researchers have devised two key strategies: intrinsic chiral synthesis, involving surface microstructure modifications of nanomaterials [
7] through ligand-assisted synthesis, and chiral small molecule surface modification [
8]. These approaches enable the construction of diverse chiral nanomedicines. Compared to intrinsic chiral synthesis, chemical modification strategies offer benefits such as operational simplicity and precise control over the chirality of product [
9]. The application of these strategies has garnered increasing attention in the realm of chiral nanomedicine research [
10,
11].
Mounting evidence suggests that the rational modification of chiral ligands enables the fabrication of nanomedicines that elicit distinct biological responses in cancerous and normal cells post uptake. For instance, Li et al. [
12] demonstrated a pronounced disparity in toxicity between L-glutathione-modified (the tripeptide, γ-L-glutamyl-L-cysteinyl-glycine, known as glutathione) and D-glutathione-modified nanomaterials, specifically CdTe quantum dots. Moreover, in another investigation [
13], it was revealed that divergent chirality-related outcomes were induced in cells received chiral gold clusters. Of note, D-glutathione-modified nanomaterials exhibited enhanced cytotoxicity towards cancer cells compared to their L-glutathione counterparts [
12], underscoring the intricate interplay between cell toxicity, the chirality of nanomedicines, the chiral properties of ligands, and the inherent structure of materials. Numerous research findings suggest that exposure to chiral drugs induces cellular stress, which is tightly correlated with elevated intracellular levels of free radicals. For instance, D-glutathione-modified gold clusters were found to provoke mitochondrial release of free radicals, resulting in upregulated mRNA expression associated with steroid synthesis and peroxisome proliferator-activated receptor pathways (PPAR) in gastric cancer cells [
13]. Additionally, Zhang et al. [
14] accomplished in vivo cleavage of pathological Aβ amyloid aggregates by utilizing ROS provoked by chiral Fe
xCu
ySe complexes, leading to improved cognitive function in murine models of Alzheimer’s disease. Furthermore, the involvement of non-free radical-dependent mechanisms in the regulation of cellular stress by chiral nanomedicines remains elusive, highlighting the significance of further elucidation of this issue to advance clinical applications in the field.
In the past decade, research has shown that in addition to metabolic and transcriptional regulation, cells form an unstable structure called stress granules (SGs) to alleviate damage caused by stress stimuli [
15,
16]. Stress granules are regulated by proteins such as G3BP1, which recruit specific proteins to form transient membraneless condense to protect certain mRNA and translation components from degradation or destruction when cells face stress conditions (
e.g., unfolded protein response or oxidative stress) [
17,
18,
19]. Recent studies have also shown that SGs can reduce stress damage by recruiting and imprisoning cell death execution proteins (such as Caspase 3) [
20], further confirming the important role of emergency granules in repairing cellular stress damage. Meanwhile, it is yet unclear whether and how SGs affect the metabolism of chiral nanotherapeutics. In this study, we used a set of chiral ligands with different molecular structures to functionalize gold nanoparticles and construct a library of chiral nanomaterials. First, we compared the ability of different chiral nanomaterials to stimulate SGs in cancer cells and endothelial cells using immunofluorescence analysis. We then analyzed the differences in SG condensation content in different types of cells under combined stimulation of chiral nanomaterials and chemotherapeutic drugs, and the results confirmed that chiral materials have completely opposite regulatory effects on the phase separation behavior of G3BP1 in cancer cells and endothelial cells. In addition, through fluorescence recovery after photobleaching experiments (FRAP) [
21], we explored the fluidity of SGs under the action of different chiral nanomaterials and found that the gelation of droplets may be a key factor leading to the weakening of the protective effect of SGs on cancer cells by chiral nanotherapeutics. To better understand the regulatory mechanism of chiral nanomaterials on SG assembly and disassembly, we used proximity labeling technology [
22] combined with proteomic analysis to identify and analyze the types and functions of proteins bound by different types of materials in cells. Our research results first confirmed that the chirality of ligands can affect the adsorption of chaperons and ubiquitinated proteins on cell surfaces, thereby affecting SG assembly. Our study shows that by simply changing the chirality of nanodrugs, it is possible to selectively inhibit the liquid-liquid phase separation of G3BP1 in cancer cells, thereby increasing chemotherapy sensitivity, and reduce chemotherapy damage by enhancing SG assembly in endothelial cells. Our study confirms the potential of chiral drugs as chemotherapy sensitizers or chemotherapy damage blockers, whose effectiveness is closely related to the ability of material chirality to regulate SG assembly. This finding provides important reference significance for the development of targeted membrane-free cell structure new nanodrugs in the future.
Materials and Methods
Materials
Gold(Ⅲ) chloride trihydrate (HAuCl4·3H2O) (>99.9%), ascorbic acid (AA), cetyltrimethylammonium chloride (CTAC, 25% wt/vol), cetyltrimethylammonium bromide (CTAB, ≥98%) were all purchased from Sigma-Aldrich (United States). Sodium borohydride and ethanol were obtained from the SinoPharm (P. R. China). Cy5-PEG-SH (2 kDa), D-Histidine (≥99%), L-Histidine (≥99%), L-Cysteine (≥99%), dimethyl sulfoxide (DMSO, anhydrous) and 4-[3-(Trifluoromethyl)-3H-diazirin-3-yl] benzylamine Hydrochloride (>98%) were purchased from Aladdin (P. R. China). D-Cysteine (>98%), L-penicillamine (>98%), D-penicillamine (>99%), cis-Diammineplatinum dichloride (>65%), puromycin dihydrochloride (>98%) were purchased from Macklin (P. R. China). All chemicals were used as received without further purification. Deionized (DI) water with a resistivity of 18.2 MΩ·cm was used in all experiments, which was prepared using a Sartorius ultrapure water system (Arium mini, Germany).
Preparation of Chiral Nanomaterials
Au nanospheres were synthesized by using seed-mediated growth by following a published protocol [
23]. In detail, Au seeds were prepared by mixing HAuCl
4 aqueous solution (5 mL, 0.25 mM) sequentially with CTAB solution (5 mL, 100 mM) and an ice-cold aqueous NaBH
4 solution (0.6 mL, 10 mM). Then, the brownish mixture was left undisturbed at 37
oC for 3 h to ensure the complete decomposition of excess NaBH
4. Next, HAuCl
4 solution (2 mL, 0.5 mM) were sequentially mixed with CTAC solution (2 mL, 200 mM) and aqueous AA solution (1.5 mL, 100 mM), followed by the introduction of freshly prepared seeds (10 μL) that give rise to 30-nm Au nanospheres. The unmodified Au nanospheres were collected by centrifugation at 15,000 rpm for 30 min, washed once and redispersed in DI water.
For the chiral modification, chiral ligands (20 mg/mL, including L-Histidine, D-Histidine, L-Cysteine, D-Cysteine, L-penicillamine, D-penicillamine) were added into the suspension of Au nanospheres in proportion, followed by gently shaking in the dark for 4 hours to prepare different functionalized nanomaterials. To fluorescently label Au nanomaterials for in vitro analyses, Cy5-PEG-SH (2 kDa, 20 mg/mL) was added into the reaction system during this step. Final products were collected via centrifugation at 15,000 rpm for 30 min, followed by repeated washing with DI water to remove unbound molecules.
The morphology of the obtained nanomaterials was characterized by transmission electron microscope (JEM-1400, JEOL, Japan). UV-vis-NIR spectrophotometer (1800PC, JingHua, P.R. China) was performed to obtain spectral properties of nanoparticles.
Cell Culture and Lentiviral Infection
Human cervical carcinoma cell line (HeLa) was obtained from American Type Culture Collection (ATCC). Human umbilical vein endothelial cell line (HUVEC), human osteosarcoma cells (U-2 OS), human colon cancer cells (HCT-116) were obtained from Procell Life Science (P. R. China). Human gastric cancer cells (SGC-7901) were purchased from National Collection of Authenticated Cell Cultures (NCACC, P. R. China). HeLa and HUVEC cells were cultured and maintained in the growth medium of Dulbecco’s Modified Eagle’s Medium (DMEM, Gibco, Thermo Fisher Scientific) supplemented with 10% FBS (Sigma-Aldrich) and 1% penicillin/streptomycin (Beyotime, P. R. China). For HCT-116 and SGC-7901 cells, they were cultured and maintained in the growth medium of 1640 supplemented with 10% FBS and 1% penicillin/streptomycin. And U-2 OS cells were cultured and maintained in the growth medium of McCoy’s 5A (Procell Life Science, P. R. China) supplemented with 10% FBS and 1% penicillin/streptomycin. Cultures were maintained in an incubator at 37 oC in a humidified atmosphere of 5% CO2 (PHC, Japan). The medium was replaced every other day until a ca. 90% confluency was reached.
Infection with G3BP1-EGFP viruses (OBiO Technology, P. R. China) was conducted as instructed by well-established protocol. Polyclonal cell populations were selected with 1 mg/ml puromycin, 24 hours after infection.
Immunofluorescence
Cell samples were fixed with 4 % paraformaldehyde (Phygene, P. R. China) for 10 min and rinsed three times with PBS (KeyGEN Bio TECH, P. R. China). Next, they were permeabilized with blocking buffer (Beyotime, P. R. China) and then incubated with primary antibodies at 4℃ overnight: G3BP1 (CST, #61559, dilution: 1:400), Cleaved Caspase-3 (CST, #9664, 1: 1000), Alexa Fluor 555-conjugated Anti-Sodium Potassium ATPase (Abcam, ab274883, 1: 100), Alexa Fluor 647-conjugated Anti-gamma H2A.X (Abcam, ab195189, 1: 200). The samples were washed three times with PBS and further incubated with secondary antibodies: Alexa Fluor-488-Goat-anti-Rabbit IgG H&L (Invitrogen, A-11008, 1: 500), Alexa Fluor 555-Goat-anti-rabbit lgG H&L (CST, #4413, 1:1000). DAPI (Invitrogen, S33025) were used to counterstain the cell nucleus.
Fluorescence Imaging and Graph Processing
Fluorescent images were sampled by total internal reflection fluorescence microscope (Thunder Imager, Leica, Germany) equipped with 405-, 488-, 561-, and 638-nm lasers, using a plan-Apochromat 100× (Numerical aperture: 1.47) and 20× objectives. The captured images were first processed by LAS X software (version 3.2.1) for computational clearing, followed by deconvolution. Imaris software (version 9.8, Oxford Instruments) was used to quantitatively analyze 3D micrographs and track the motions of SGs. Parameters including intensity sum, volume, shortest distance to recognized surface, percentage of colocalization were calculated by combining different modules provided (Surface, Spot).
Treatments
Chiral nanomaterials were dissolved in culture media and incubate with cells for 4 h (1012 nanoparticles/mL). Sodium arsenite dissolved in DMSO was used to stress cells (0.3 mM, 30 min). Cisplatin was dissolved in culture media (50 μM, 125μM, 250 μM, 375 μM, and 500 μM) and prewarmed before introducing to the cell culture medium.
Time-Lapse Study and FRAP
G3BP1-EGFP HeLa cells were seeded into an 18-well plate (ibidi, Germany) at a concentration of 5 × 10³ cells/well, cultured overnight at 37 ℃ in 5% CO2. D-/L-Pen-functionalized nanomaterials (4 h) and Cisplatin (250 μM, 2 h) were co incubated with cells sequentially or separately. After washed with prewarmed PBS, these cells were next moved into a stage-top live imaging chamber (ibidi). Fluorescence recovery after photobleaching was performed using an inverted Leica laser scanning confocal microscope with a 100× oil immersion objective with numerical aperture (NA) equal to 1.47 (Apo oil immersion, Vizla, Germany). For each experiment, three droplets with 2.5–3.5 μm diameter were selected. A circular region of interest (2.5 μm diameter) was bleached once (~10 ms) with a bleaching power equal of 30 μW, time-lapses graphs were acquired every 5 s over the course. Data was analyzed using Leica LAS X software.
Photo-Proximity Labeling and Co-IP Experiments
For chemo-etching-assisted photo-proximity labeling, HeLa cells cultured in a 10-cm cell culture dish were treated with chiral nanospheres functionalized with diazirines (1012 nanoparticles/mL, 4 h). After being washed three times with PBS, cells were irradiated (20 min, 360 nm, 15 mW/cm2) in situ to covalently capture the protein from nanoparticles. Afterwards, a 2 mL of RIPA lysis buffer (Beyotime, #P0013D, 50 mM Tris-HCl, pH = 7.4, 150 mM NaCl, 0.25% (wt/vol) sodium deoxycholate) was added to cells (R.T, 10 min). The cell lysate was collected and centrifuged (18,000g for 10 min at 4 °C) to enrich the nanoparticle−protein complexes. Subsequently, the sediment was etched by I3- solution (10 mM, 2 h, 4℃) to release the protein from nanoparticles and purified by using Amicon Ultra (cutoff: 3 kDa, Millipore, United States). Identity of proteins were characterized by lable-free LC-MS analysis as described below.
For Co-IP experiment, 2 mL RIPA lysis buffer (Beyotime, P0013D) containing protease inhibitor was added to the cells after treatment, followed by the quantification of protein concentration by using BCA assay (#23225, Thermo Fisher Scientific). G3BP1 and the proteins that interact with it were enriched using commercially available Kit (#26146, Thermo Fisher Scientific) in combination with G3BP1 antibody (CST, #61559, dilution 1:50).
Proteomics Study
The proteomic analysis was conducted by Verygenome Technology Co. Ltd. (P. R. China). Samples were first reduced, alkylated, and digested with trypsin for 20 h at 37 ℃ to liberate peptides. The resulting mixtures were separated and analyzed by an Easy-nLC 1000 coupled with a Q-Exactive HF hybrid quadrupole-orbitrap mass spectrometer (Thermo Fisher Scientific). Mass spectra were analyzed using the Proteome Discoverer software. A false discovery rate (FDR) of 0.1 % was set for peptide and protein identification. Gene Ontology (
https://geneontology.org) and String tools (
https://string-db.org/) were harnessed to comprehensively describe the biological functions, physical and chemical properties of proteins bound to nanomaterials, including the protein class, cellular component, biological process, and molecular function. For pathway analysis, the KEGG database was harnessed.
Statistical Analysis
For all experiments, data was collected at least in triplicate. All data shown as Mean ± standard deviation (SD) or min to max (Box or Violin Plot). One-way analysis of variance (ANOVA) was used to examine the difference between three or more groups when the residues conform to a Gaussian distribution, and the correction for multiple comparisons was tested by Tukey.
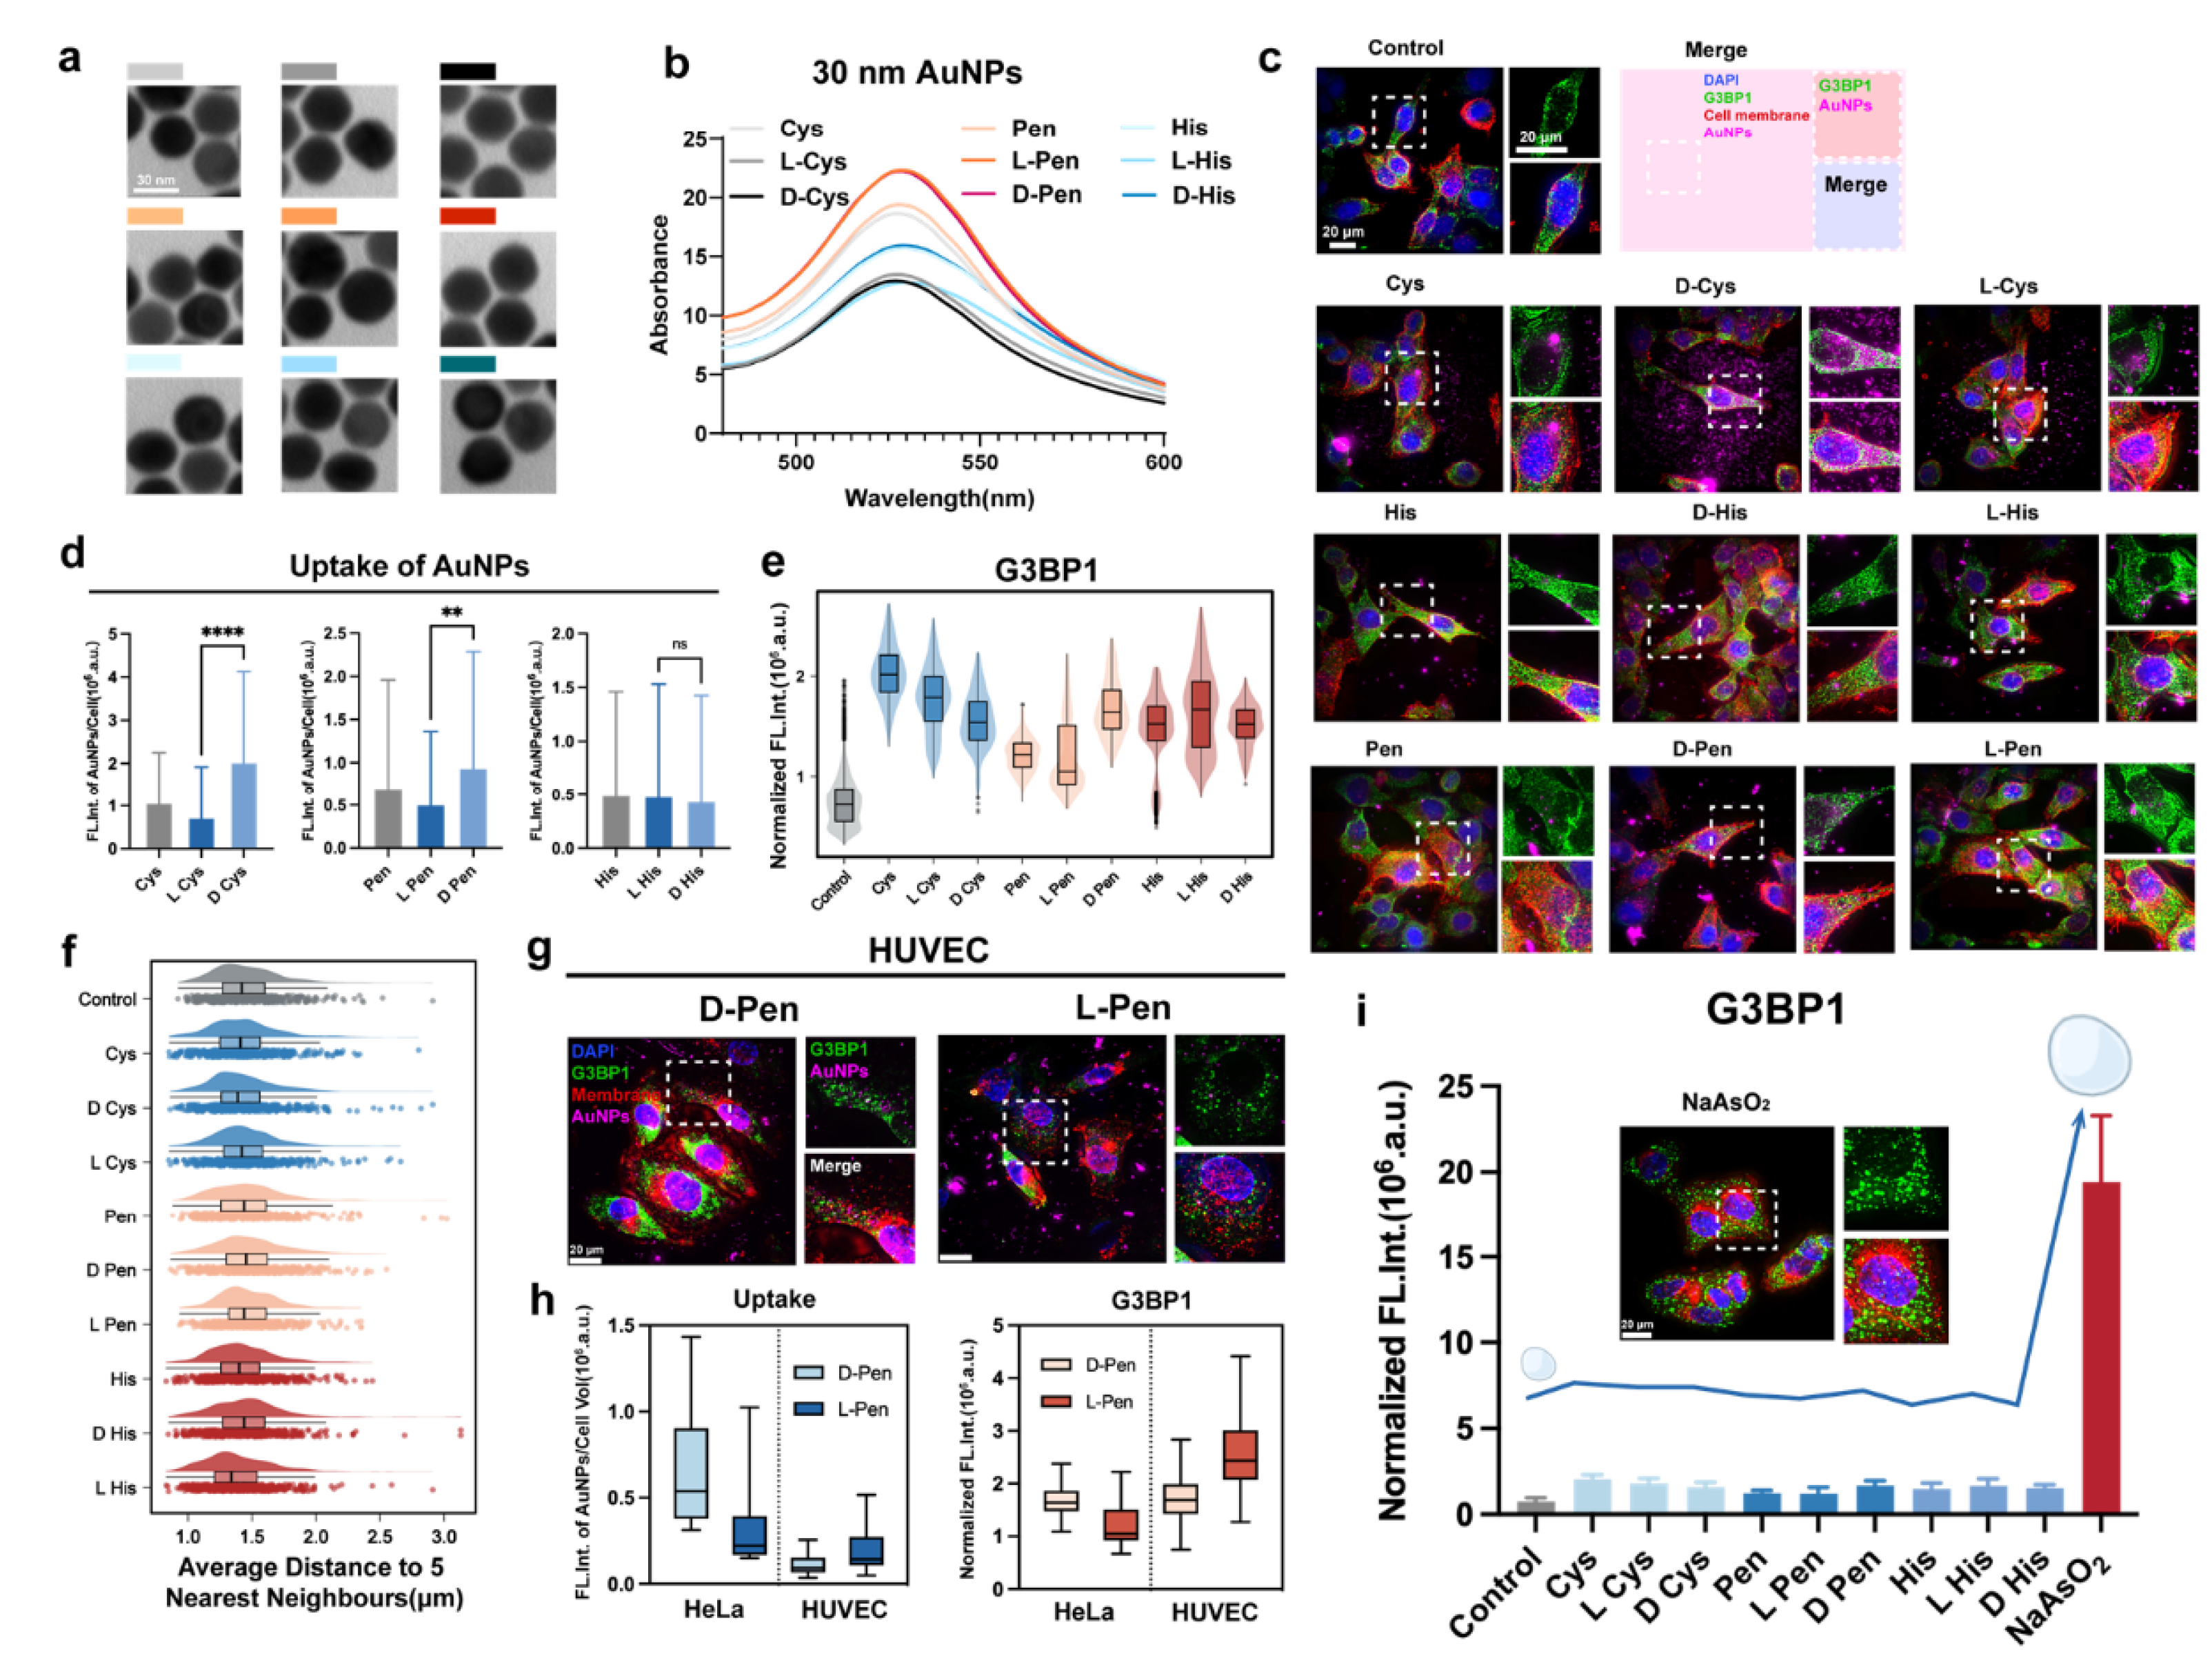
Figure 1.
(a) TEM micrographs of differently functionalized Au nanospheres employed in this study. For the definition of various color codes, please refer to the legends in b. Scale bar: 30 nm. (b) UV-vis spectra results of Au nanospheres featuring distinct surface ligands. (c) Immunofluorescence graphs showing the condensation of stress granules in HeLa cells due to exposure to nanomaterials. A schematic is provided (middle in the upper panel) to help appreciate the presentation of graphs. The nucleus and membrane of cells were counter-stained to visulize the cell body. Here, Cys, His, and Pen stands for Cysteine, Histidine, and Penicilamine in their meso-forms, respectively. (d) Normalized uptake of fluorescently labeled nanomaterials by HeLa cells. (e) Condesation of stress granules as provoked by nanomaterials. The fluorescence intensity of G3BP1 was calculated and normalized by the volume of membraneless droplets in order to reflect the condensation content of each stress granules (n>200 droplets). (f) Shortest distance of stress granule to their closest counterparts. For median value, please refer to the violin plot in each panel (in the middle), whereas the distribution of all data points can be found underneath each plot. (g) Immunofluorescence graphs showing the condensation of stress granules in HUVEC cells received nanomaterials enclosed by D-/L-Pen molecules. For the organization of graphs and their definition, we follow the same order as described in b. (h) Difference in uptake behaviors of handed Pen-functionalized nanomaterials and condensation of stress granules between HeLa and HUVEC cells. (i) Comparison of stress granules condensation content in between cells received nanomaterials alone and that treated with sodium arsenite (NaAsO2). **, and **** indicate P < 0.01, and P < 0.0001, respectively. NS stand for non-significant statistical differences. .

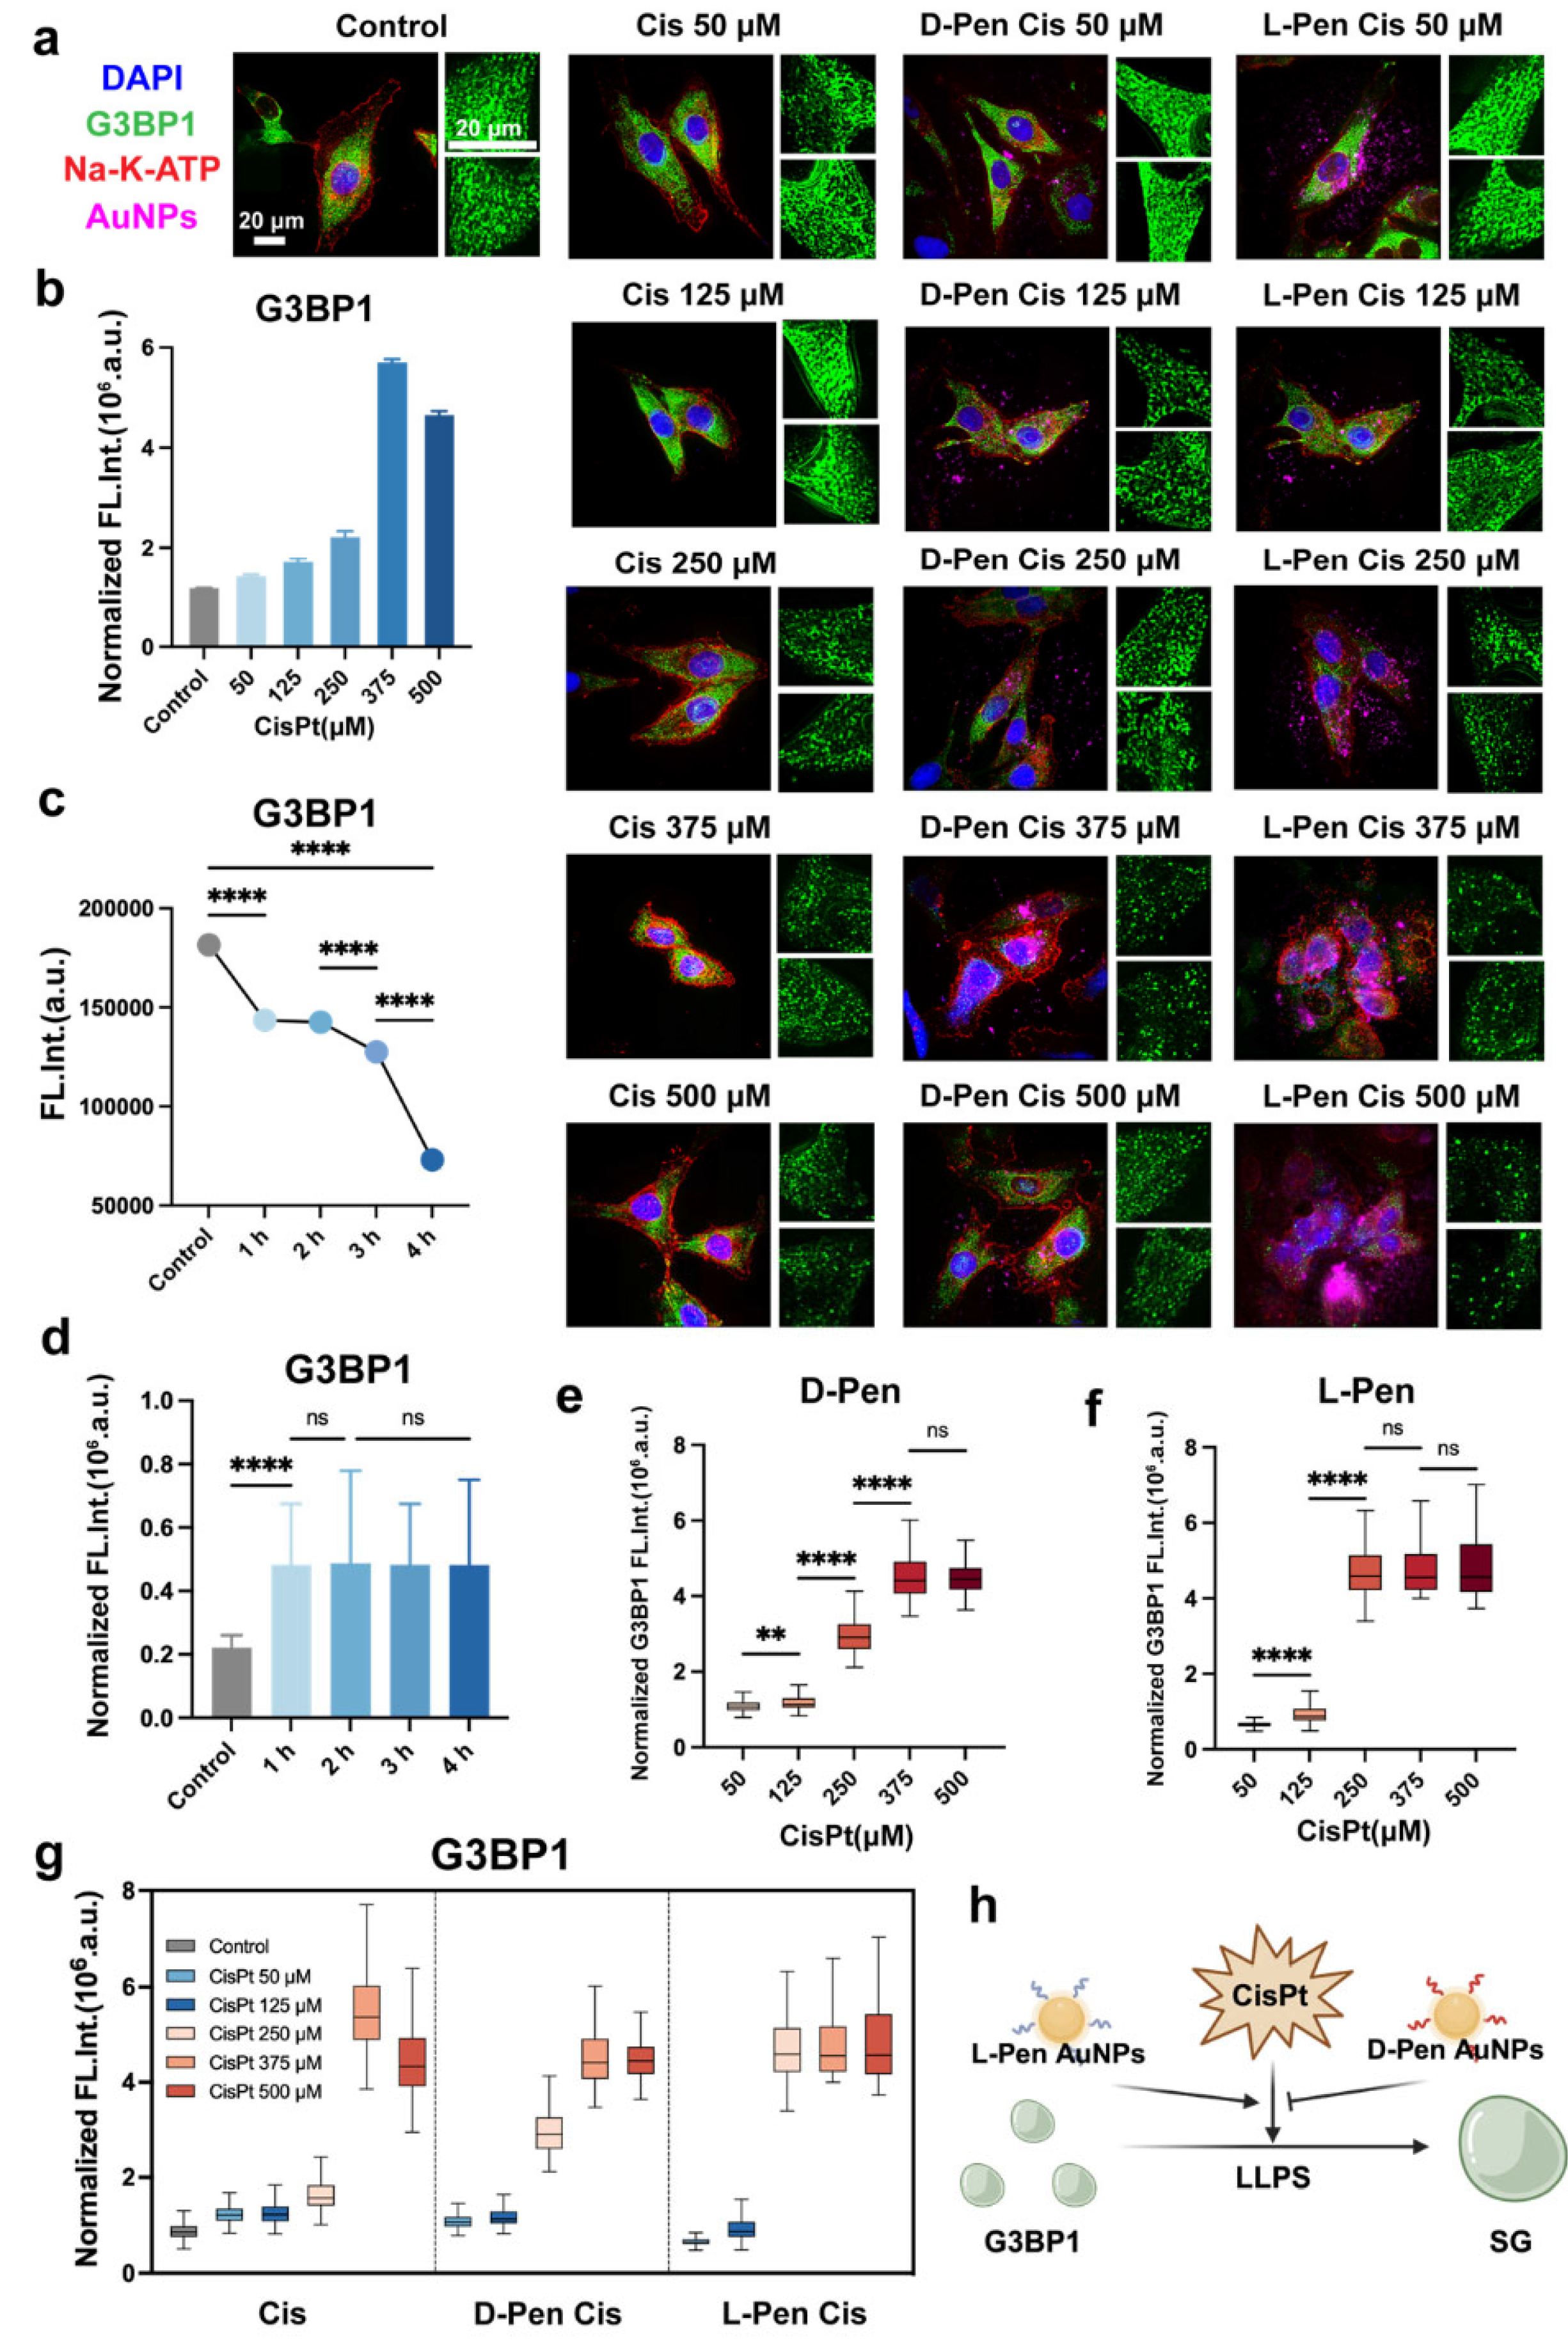
Figure 2.
(a) Immunofluorescence graphs of cells received different treatments (cisplatin alone versus exposure in combination with chiral nanomaterials). Cell membrane and the nucleus were counter-stained with antibody of Na-K-ATPase and DAPI, respectively. (b) Condensation content of stress granules in HeLa cells received different concentrations of cisplatin (CisPt, 1 h). (c) Fluorescence of G3BP1 proteins in HeLa cells received CisPt (250 μM) as a function of time post treatment. (d) Disassemble of stress granule as a function of time post treatment with CisPt. (e,f) Condensation of stress granules in HeLa cells received combinational treatment with CisPt and D-(e) and L- (f) Pen-functionalized nanomaterials, respectively. (g) Difference in condensation content of stress granules in HeLa cells received either various concentrations of CisPt alone or combinational treatments. (h) A schematic illustrating the hand-related implication in chemotherapeutic-provoked liquid-liquid phase separation (LLPS). **, and **** indicate P < 0.01, and P < 0.0001, respectively. NS stand for non-significant statistical differences.

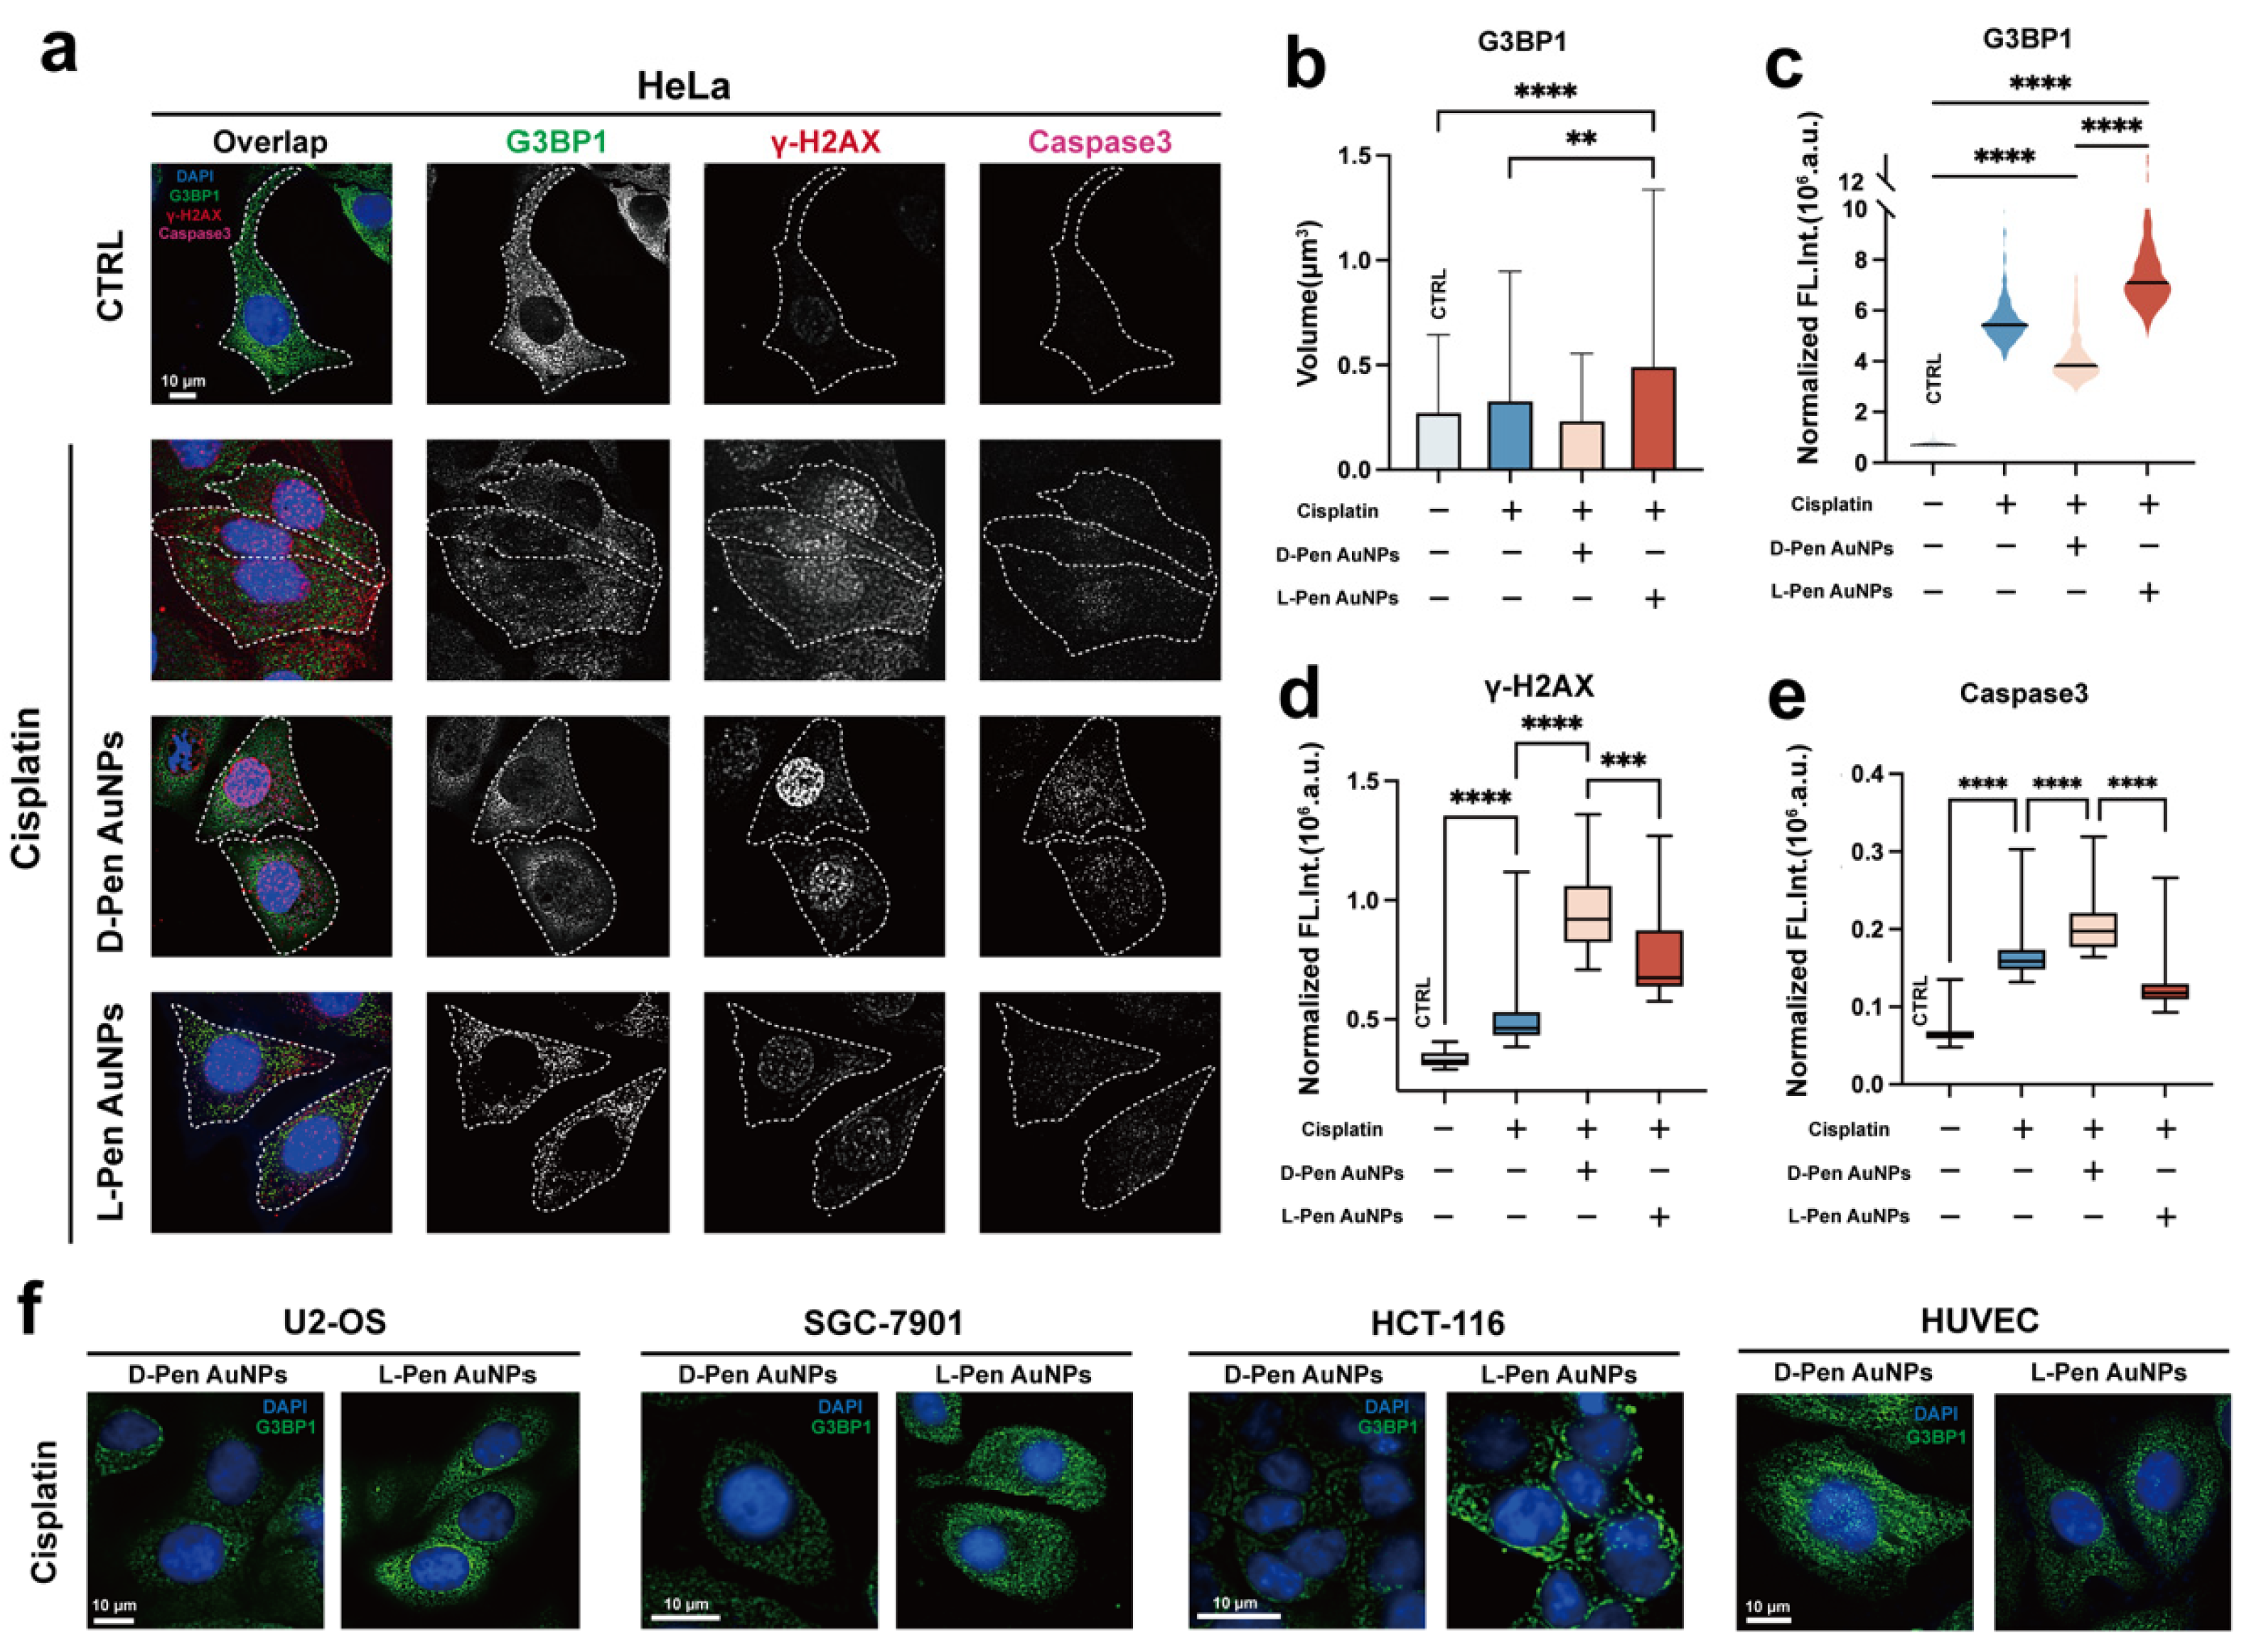
Figure 3.
(a) Immunofluorescence graphs of HeLa cells received cisplatin alone or its combination with chiral nanomaterials. Expression level of γ-H2AX (DNA damage marker) and cleaved Caspase 3 (marker of programmed apoptosis) are shown in (d,e) as box plots, respectively. (b,c) Size (b) and condensation contents (c) of stress granules in cells. For cells received neither cisplatin nor chiral nanomaterials, they serve the role as control for comparison. (f) Immunofluorescence graphs of cancerous (U2-OS, SGC-7901, and HCT-116) and normal cells (HUVEC) received chemotherapy in combination with handed Pen-functionalized nanomaterials. **, and **** indicate P < 0.01, and P < 0.0001, respectively.
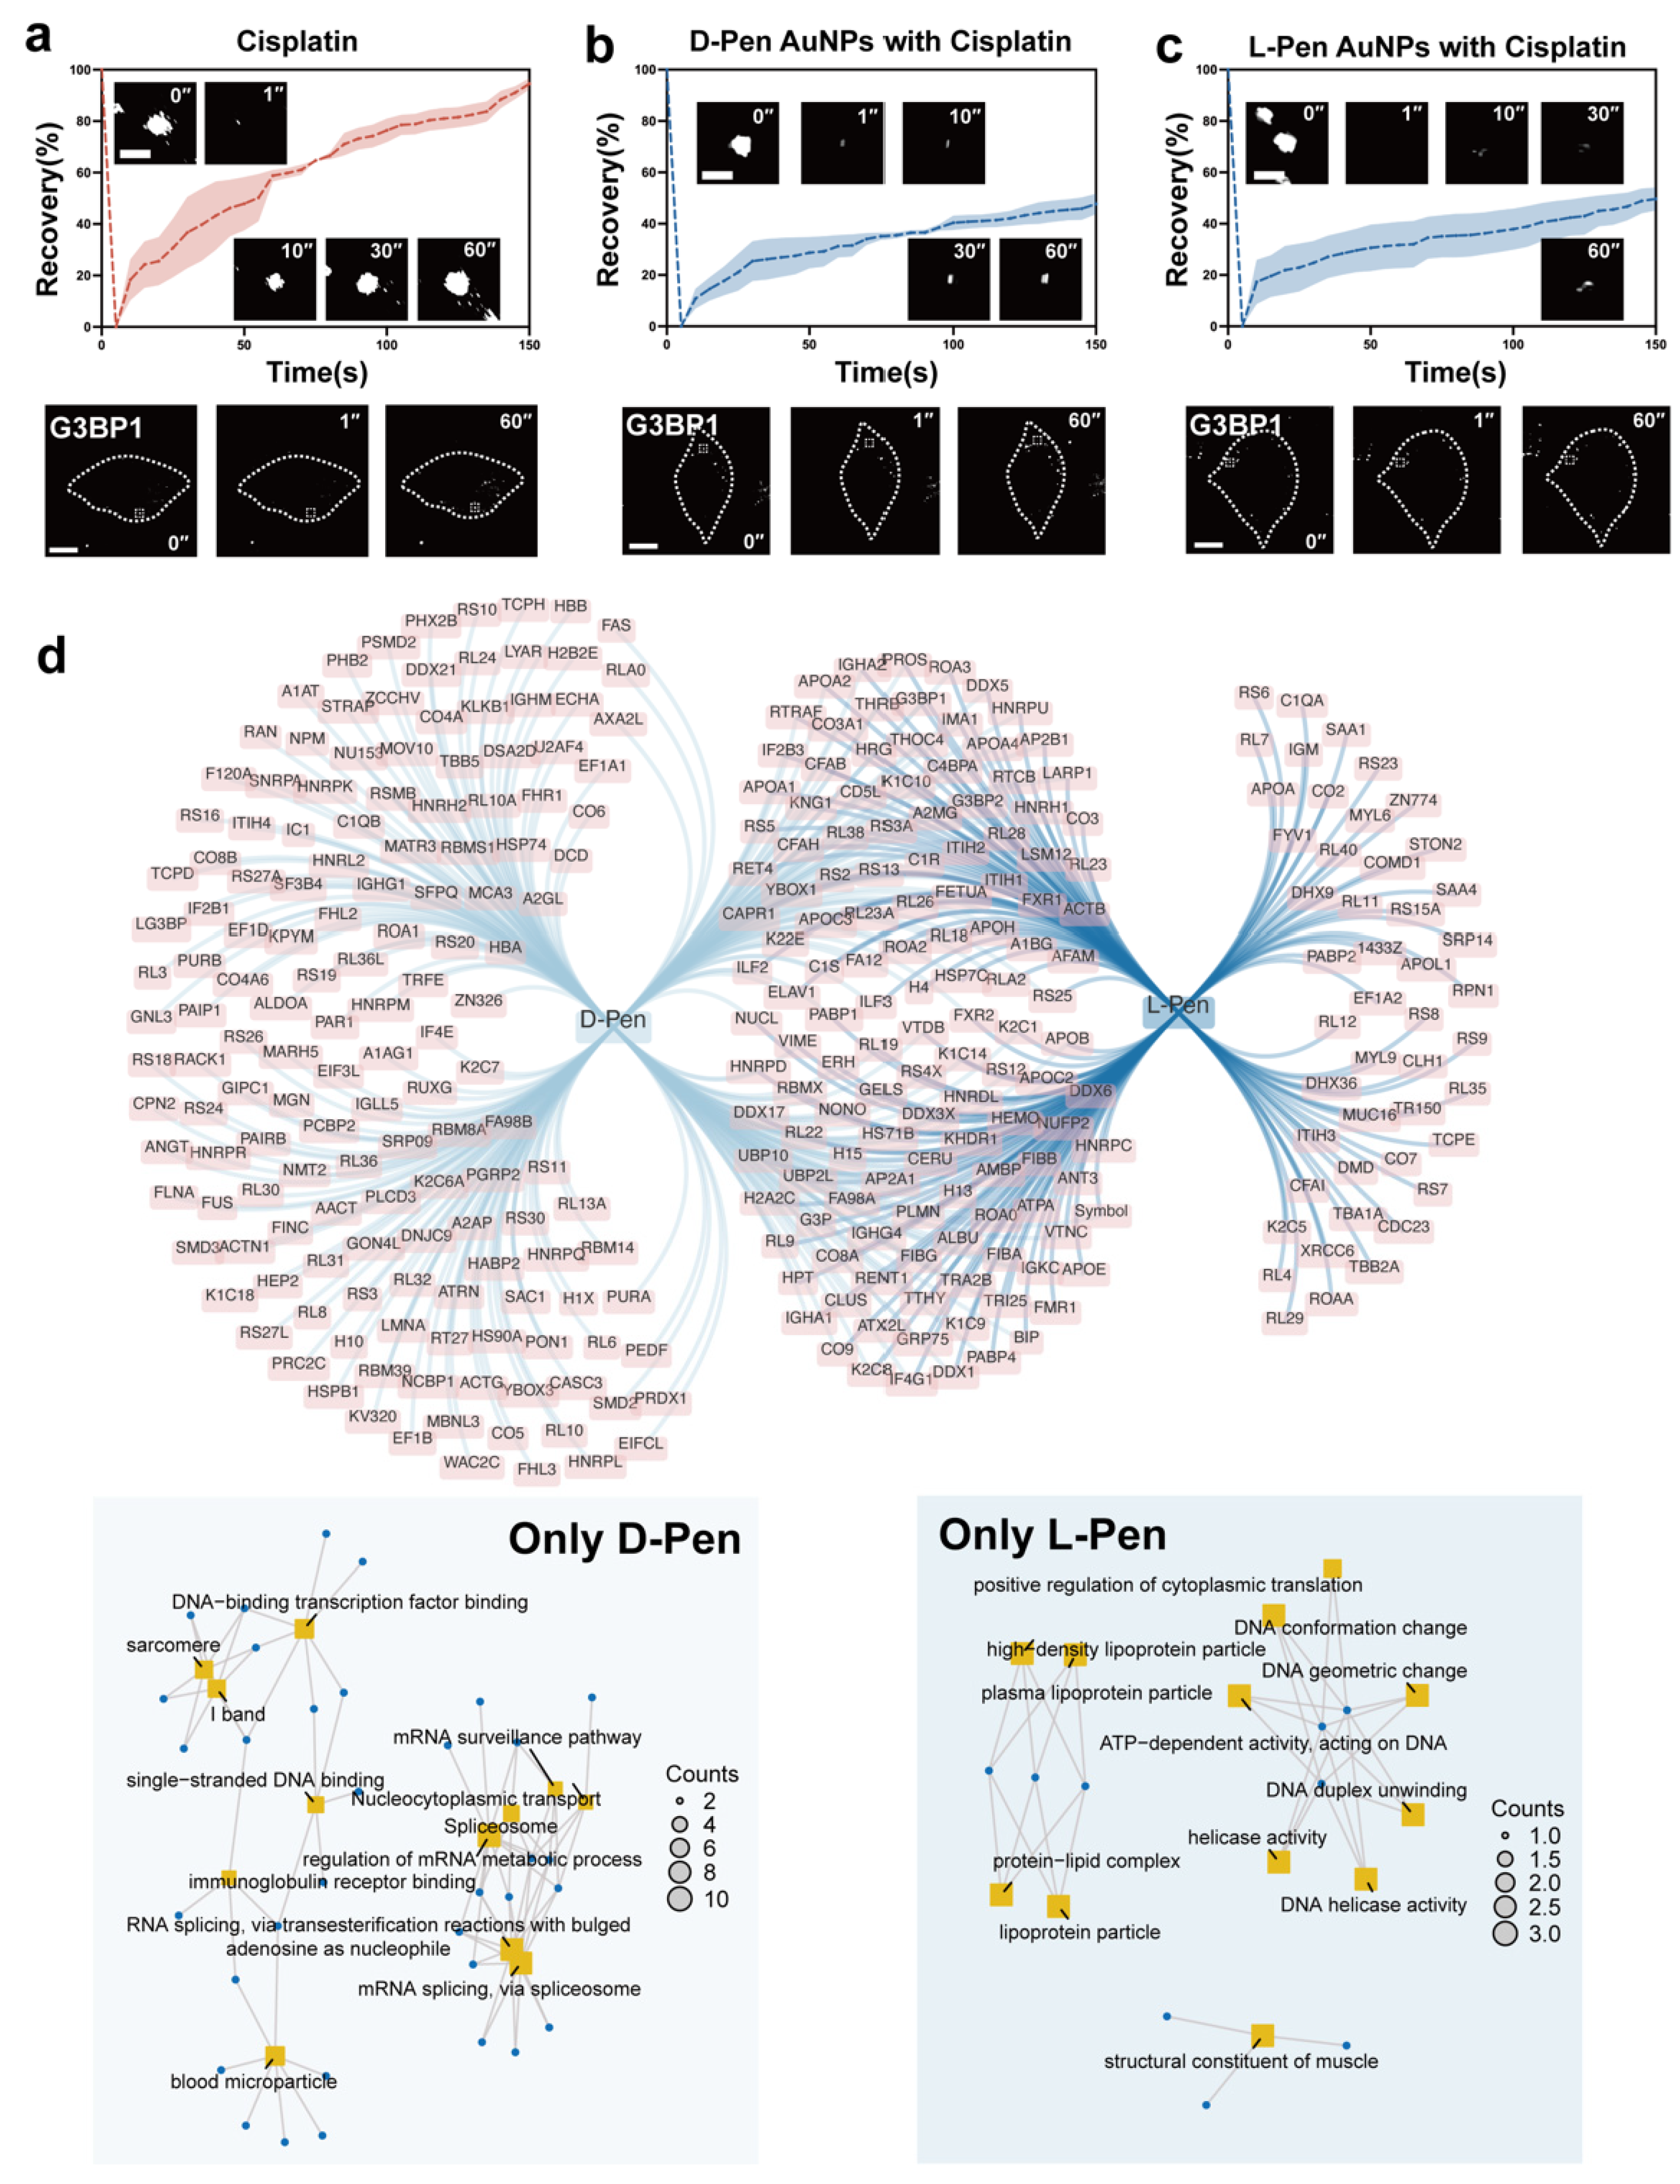
Figure 4.
(a–c) Fluorescence recovery as a function of time post photo bleaching. Relative fluorescence intensity of illuminated region was analyzed. The fluorescence recovery information of at least ten randomly depicted regions were recorded and the mean value was calculated for plotting (mean value: dashed lines). To ease the visualization, error bar was presented as shadow. Inset: representative graphs recorded at certain time points that reveal the recovery of G3BP1 fluorescence in photo-bleached stress granule. For the subcellular distribution information of illuminated region, please refer to the fluorescence graphs at bottom with lower magnification. (d) Venn diagram of proteins absorbed on D-/L-Pen-functionalized nanomaterials. In the middle of the diagram shows the overlapped components, whereas those exhibiting chirality-dependent absorption can be found on the left (for D-Pen) and right sides (for L-Pen) with corresponding GO information shown at the bottom. .
Figure 5.
(a) A schematic illustrating the pipeline of chemo-etching-assisted photo-proximity labeling and the subsequent assay to identify the intracellular protein corona components. GO information of proteins whose absorption on nanomaterials are chirality (in)dependent in HeLa ((b,d), chirality-dependent and independent, respectively) and HUVEC cells ((c,f), chirality-dependent and independent, respectively). (e) Overlapped proteins that appeared in the protein corona of L-Pen group in HeLa cells and D-Pen group in HUVEC cells and corresponding GO information (bottom).


