Submitted:
27 April 2024
Posted:
29 April 2024
You are already at the latest version
Abstract
Keywords:
1. Introduction
2. Materials and Methods
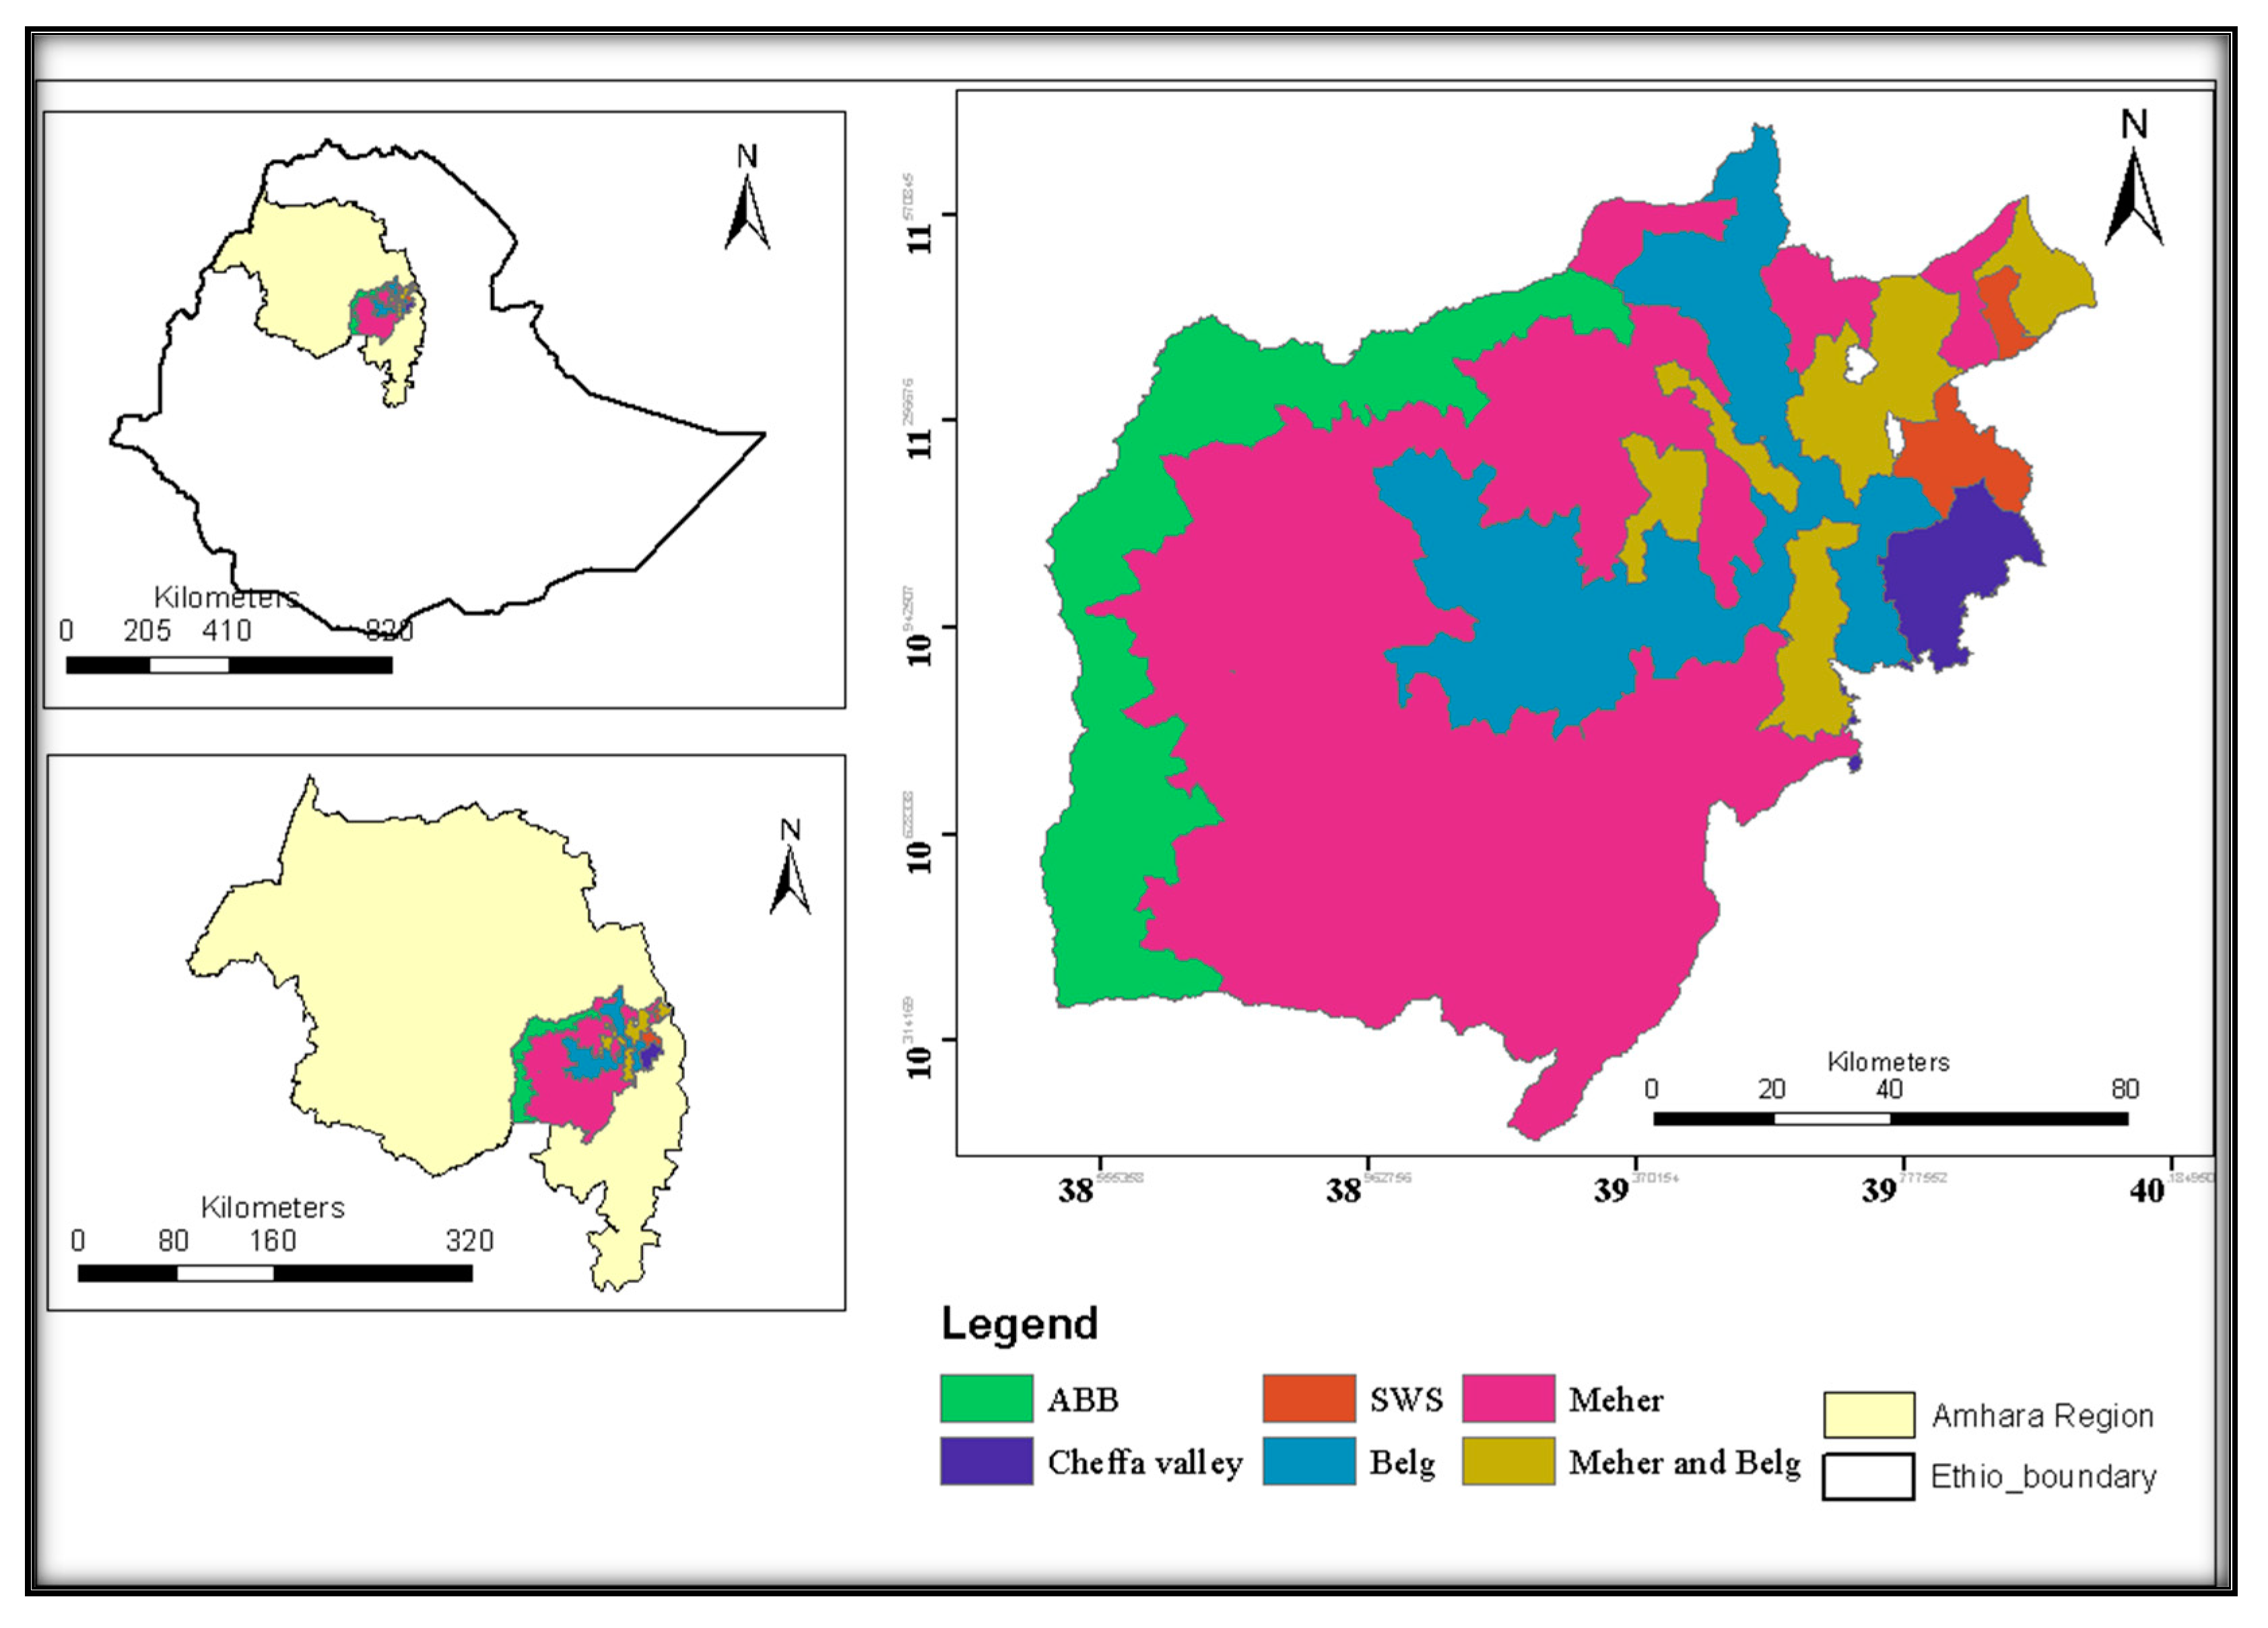
2.1. Description of the Study Area
2.2. Research Methodology
- Sampling Techniques and Sample size Determination
2.2.1. Data Sources and Data Collection Techniques
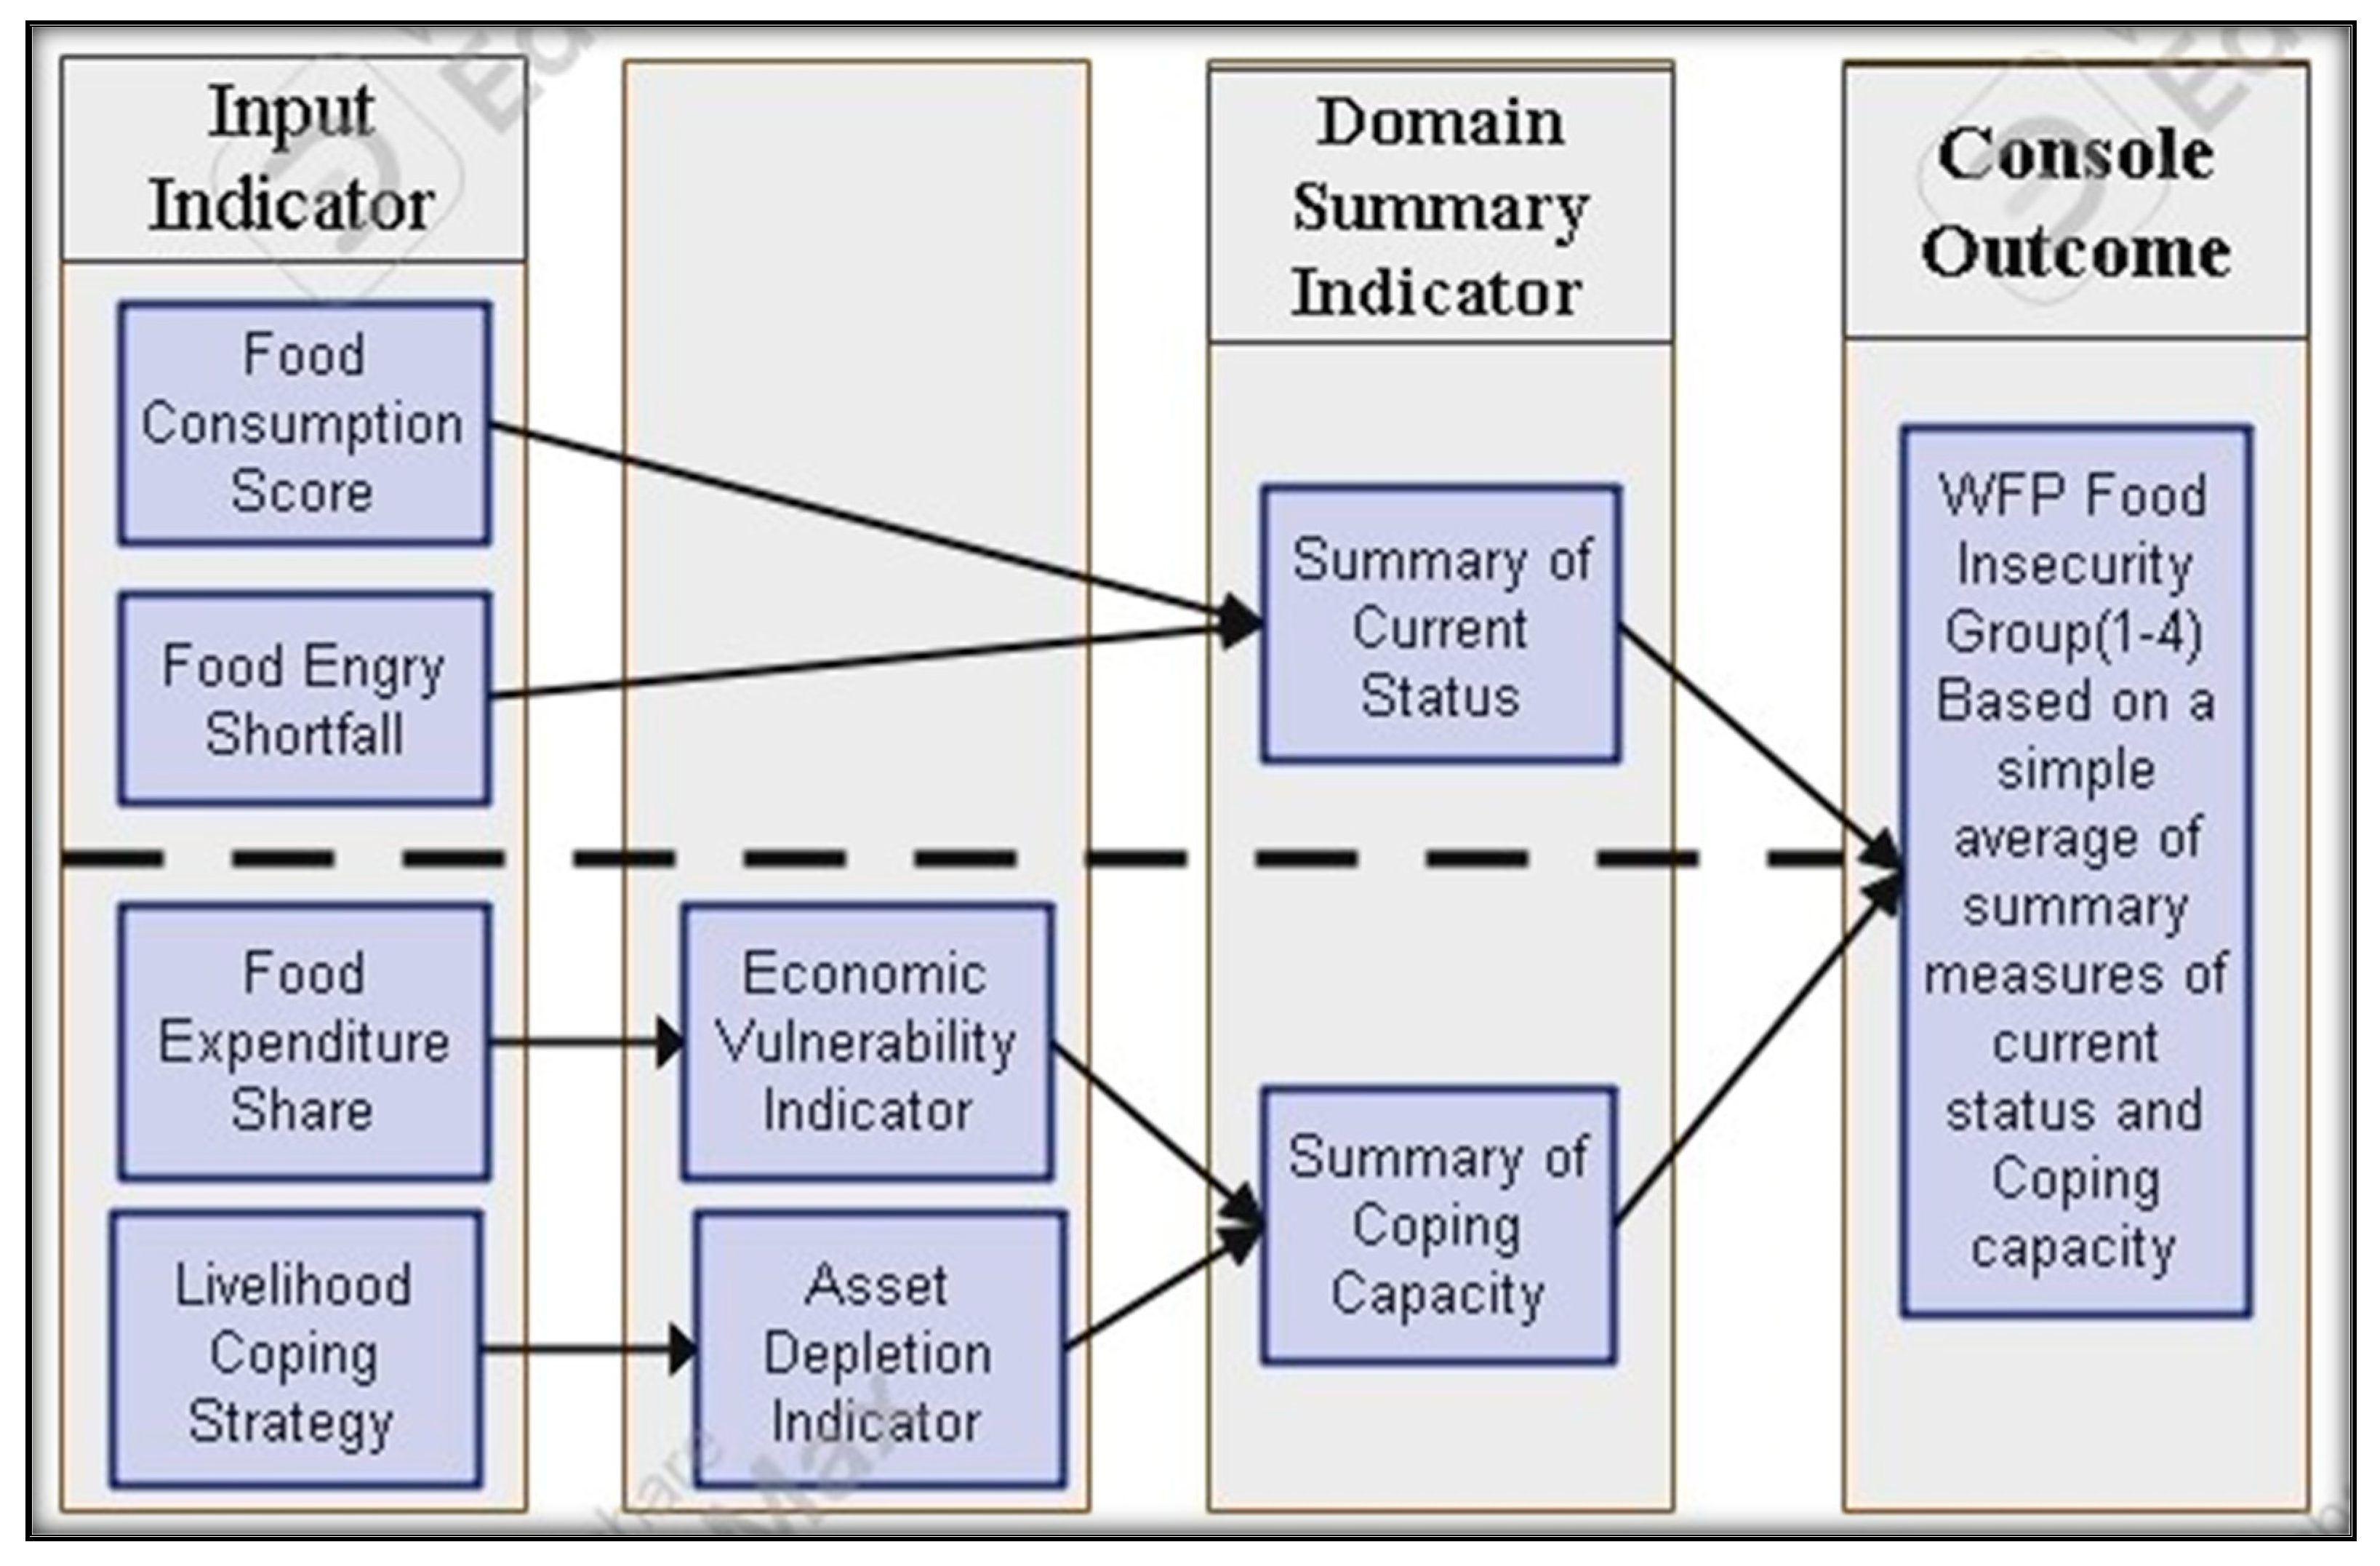
2.2.2. Data Analysis Techniques
- a)
- Food Consumption Score (FCS)
- b)
- Food Energy Shortfall Indicator
- c)
- Food Expenditure Share (FES)
- d)
- Asset Depletion Indicator (ADI)
| Domain | Indicator | Indicator score | ||||
|---|---|---|---|---|---|---|
| 1 | 2 | 3 | 4 | |||
|
Current Status |
Food Consumption Score |
Food Consumption group |
Acceptable Consumption ≥ 35.5 |
NA |
Borderline food Consumption 21.5-35 |
Poor food Consumption 0-21 |
| Food Consumption | Food energy shortfall | Kcal/p/d ≥ 2100 | Kcal/p/d<2100 Kcal/p/d≥ mean (MDER*, 2100) (1919 < kcal/p/d <2100) |
Kcal/p/d < mean (MDER, 2100), Kcal/p/d ≥ MDER (1738 < Kcal/p/d <1919) |
Kcal/p/d < MDER (Kcal/p/d <1738) |
|
|
Coping Capacity |
Economic Vulnerability | Food Expenditure Share |
Low food Expenditure Share < 50% |
Medium food Expenditure Share 50-65% |
High food Expenditure Share 65-75%) |
Very high food Expenditure Share >75% |
| Asset Depletion | Livelihood coping strategy categories | None | Employed stress strategies | Employed crisis strategies | Employed emergency strategies | |
| Food Security Index | Food Secure | Marginally Food secure | Moderately food Insecure | Severely food Insecure | ||
3. Results and Discussions
3.1. Demographic and Socio-Economic Characteristics of Respondents
3.2. Analysis of the Food Security Index
- Consumption Patterns and Food Security Status Of Households with FCS
- b.
- Food Energy Shortfall Indicator
- c.
- Households’ Food Expenditure Share (FES)
- d.
- Livelihood Coping Strategy Categories
| Domain | Indicator | Food Secure 1 |
Marginally Food secure 2 |
Moderately food Insecure 3 | Severely food Insecure 4 |
|
|---|---|---|---|---|---|---|
| Current Status |
Food Consumption | Food Consumption group |
Acceptable ≥ 35.5 48% |
NA |
Borderline 21.5-35 41.1% |
Poor 0-21 10.9% |
| Kcal | Food Energy Shortfall | ≥ 2100 45.5% |
>1919<2100 7.6% |
≥1738<1919 9% |
<1738 37.9% |
|
| Coping Capacity | Economic Vulnerability | Food Expenditure Share |
Share <50% 42.2% |
Share 50% - 65% 12.3% |
Share 65% - 75% 22.9% |
Share ˃ 75% 22.6% |
| Asset Depletion | Livelihood Coping Strategy Categories |
None 45.9% |
Stress 9.8% |
Crisis 22.9% |
Emergency 21.5% |
|
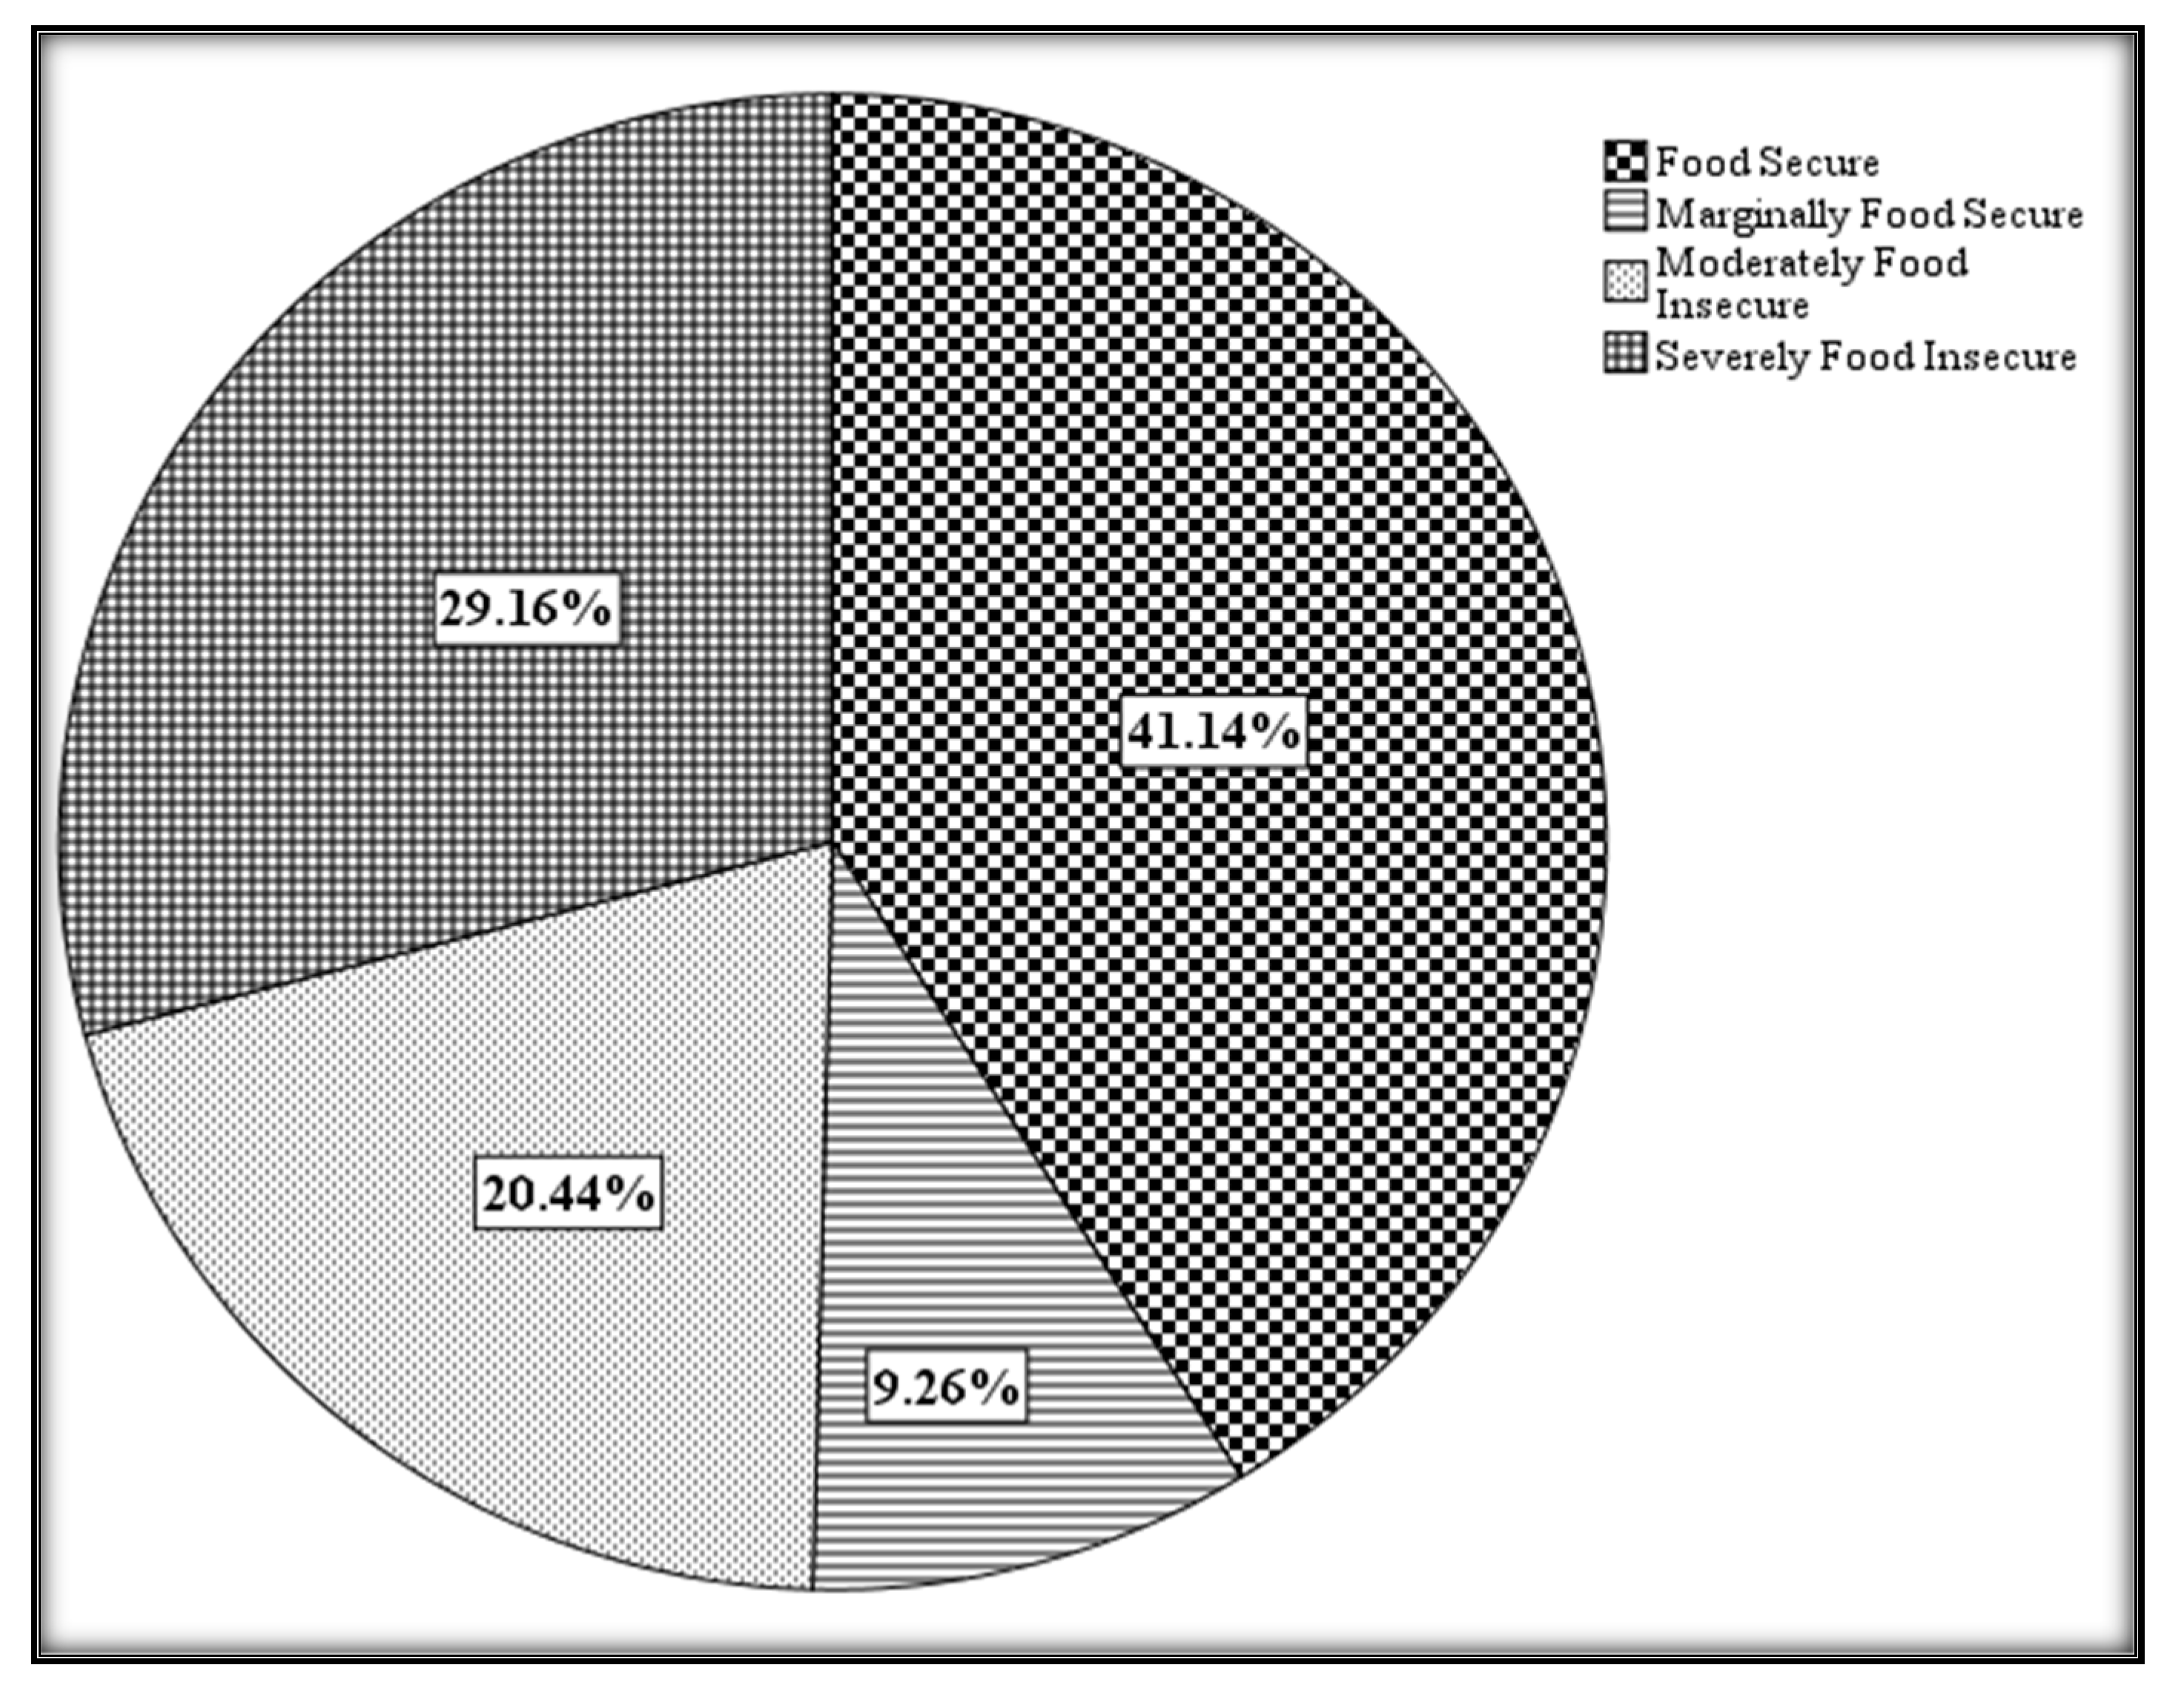
| Food Security Index | 41.1% | 9.3% | 20.4% | 29.2% | ||
4. Conclusions
Author Contributions
Funding
Data Availability Statement
Acknowledgments
Conflicts of Interest
References
- Atara, A. Tolossa, and B. Denu, Analysis of rural households’ resilience to food insecurity: Does livelihood systems/choice/matter? The case of Boricha woreda of sidama zone in southern Ethiopia. Environmental Development, 2020. 35: p. 100530. [CrossRef]
- Berry, E.M. , et al., Food security and sustainability: can one exist without the other? Public health nutrition, 2015. 18(13): p. 2293-2302. [CrossRef]
- Pinstrup-Andersen, P. , Food security: definition and measurement. Springer Science, 2009. [CrossRef]
- Derso, A. , et al., Food insecurity status and determinants among Urban Productive Safety Net Program beneficiary households in Addis Ababa, Ethiopia. PloS one, 2021. 16(9): p. e0256634. [CrossRef]
- Mohamed, A.A. , Food security situation in Ethiopia: a review study. International journal of health economics and policy, 2017. 2(3): p. 86-96. [CrossRef]
- FSIN, Global Report on food crisis 2023:Joint Analysis for better decision 2023.
- World Bank, The World Bank , Food Security Update, Washington, D.C. 2023.
- UN, The impact of COVID-19 on food security and nutrition. United Nations, 2020: p. 1-22.
- FAO, et al., The State of Food Security and Nutrition in the World 2023. Urbanization, agrifood systems transformation and healthy diets across the rural–urban continuum. Rome, FAO.
- Drammeh, W., N. A. Hamid, and A. Rohana, Determinants of household food insecurity and its association with child malnutrition in Sub-Saharan Africa: A review of the literature. Current Research in Nutrition and Food Science Journal, 2019. 7(3): p. 610-623. [CrossRef]
- Tizazu, G.Z.; Menberu, T. Food Security Status of Rural Households in Lay Gayint Woreda of South Gondar Zone, Amhara Region, Ethiopia. International Journal of African and Asian Studies 2019, 57, 12–26. [Google Scholar]
- FSIN, Global Report on food crisis 2021:Joint Analysis for better decision, F.S.I. Network, Editor. 2021.
- World Bank, World Bank Open Data. The World Bank Group, Washington, D.C. 2023.
- FEWS NET, Food Insecurity Emergency in Ethiopia leads to Second Record-Setting Year of Food Assistance Needs. Famine Early Warning Systems Network, 2023.
- Bezu, D.C. A review of factors affecting food security situation of Ethiopia: From the perspectives of FAD, economic and political economy theories. 2018, 6, 2319–2473. [Google Scholar]
- Abebaw, S.; Betru, T. A review on status and determinants of household food security in Ethiopia. Ethiopian Journal of Environmental Studies & Management 2019, 12. [Google Scholar]
- Sisha, T.A. Household level food insecurity assessment: Evidence from panel data, Ethiopia. Scientific African 2020, 7, e00262. [Google Scholar] [CrossRef]
- Ahmed, J. , The role of small scale irrigation to household food security in Ethiopia: a review paper. 2019. [CrossRef]
- FEWS NET, Ethiopia Food Security Outlook:February to September 2021.Amid high national needs, Tigray remains of greatest concern with conflict driving Emergency outcomes. 2021.
- Mohammed, Y. , et al., Meteorological drought assessment in north east highlands of Ethiopia. International Journal of Climate Change Strategies and Management, 2018. 10(1): p. 142-160. [CrossRef]
- Rosell, S. and B. Holmer, Erratic rainfall and its consequences for the cultivation of teff in two adjacent areas in South Wollo, Ethiopia. Norsk Geografisk Tidsskrift-Norwegian Journal of Geography, 2015. 69(1): p.
- Motbainor, A., A. Worku, and A. Kumie, Level and determinants of food insecurity in East and West Gojjam zones of Amhara Region, Ethiopia: a community based comparative cross-sectional study. BMC public health, 2016. 16(1): p. 1-13. [CrossRef]
- Yehuala, S., D. Melak, and W. Mekuria, The status of household food insecurity: The case of West Belesa, North Gondar, Amhara region, Ethiopia. International Journal of Scientific Research and Management, 2018. 6(6): p. 158-66. [CrossRef]
- Abdulla, A.M. Determinants of household food security and coping strategies: The case of Bule-Hora District, Borana Zone, Oromia, Ethiopia. European Journal of Food Science and Technology 2015, 3, 30–44. [Google Scholar]
- Endris, A.; Destaw, Z.; Ashenafi, M. Household food security status and food safety knowledge, attitude and practice in Tehuledere Woreda, South Wollo, Ethiopia. Ethiopian Journal of Development Research 2019, 41, 25–54. [Google Scholar]
- Mitiku, A.; Fufa, B.; Tadese, B. Empirical analysis of the determinants of rural households food security in Southern Ethiopia: The case of Shashemene District. Basic Research Journal of Agricultural Science and Review 2012, 1, 132–138. [Google Scholar]
- Maxwell, D., J. Coates, and B. Vaitla, How do different indicators of household food security compare? Empirical evidence from Tigray. Medford: Tufts University, 2013.
- Mekonen, A.A., A. B. Berlie, and M.B. Ferede, Spatial and temporal drought incidence analysis in the northeastern highlands of Ethiopia. Geoenvironmental Disasters, 2020. 7(1): p. 1-17. [CrossRef]
- Agidew, A.A. Land suitability evaluation for sorghum and barley crops in South Wollo Zone of Ethiopia. Journal of Economics and Sustainable Development 2015, 6, 14–26. [Google Scholar]
- USAID, Ethiopia Livelihood Zones. 2009.
- Mohammed, Y. , et al., Analysis of smallholder farmers’ vulnerability to climate change and variability in south Wollo, north east highlands of Ethiopia: An agro-ecological system-based approach. 2021. [CrossRef]
- SWZPC, South Wollo Zone Plan Commision: 2022 Budget year Annual Report. Dessie, Ethiopia.. 2022.
- Mitiku;, A., et al., Analysis of Economic ane Labour Environment in South Wollo. Amhara Lot 2:Linking and up scaling for Empowerment. 2019.
- WHO, Report on the Food and Nutrition Situation in South Wollo, Amhara Region, Ethiopia. 2000.
- Greene, J.C. Toward a methodology of mixed methods social inquiry. Research in the Schools 2006, 13, 93–98. [Google Scholar]
- Creswell, J.W. and J.D. Creswell, Research design: Qualitative, quantitative, and mixed methods approaches. 2017: Sage publications.
- Creswell, J.W. , Educational Research:Planning, Conducting, and Evaluating Quantitative and Qualitative Research. Fourth Edition ed. 2012, Manufactured in the United States of America: University of Nebraska–Lincoln. 673.
- Legesse, S.A.; Rao, P.; Rao, M.N. Statistical downscaling of daily temperature and rainfall data from global circulation models: In South Wollo zone, North Central Ethiopia. Abhinav-National Monthly Refereed Journal of Research In Science & Technology 2013, 2, 27–39. [Google Scholar]
- Rai, N. and B. Thapa, A study on purposive sampling method in research. Kathmandu: Kathmandu School of Law, 2015.
- Kiger, M.E. and L. Varpio, Thematic analysis of qualitative data: AMEE Guide No. 131. Medical teacher, 2020. 42(8): p. 846-854. [CrossRef]
- Braun, V. and V. Clarke, Thematic analysis. 2012. [Google Scholar]
- WFP, Consolidated Approach for Reporting Indicators of Food Security (CARI) (2nd edition). Rome: United Nations World Food. 2015.
- WFP, Consolidated Approach for Reporting Indicators of Food Security (CARI) (3rd edition). Rome: United Nations World Food Program. 2021.
- Biederlack, L. Biederlack, L. and J. Rivers, Comprehensive Food Security & Vulnerability Analysis (CFSVA): Ghana. 2009: United Nations World Food Programme.
- McKinney, P., Comprehensive food security & vulnerability analysis. VAM, 2009: p. 57-80.
- INDDEX, INDDEXProject (2018), Data4Diets: Building Blocks for Diet-related Food Security Analysis. Tufts University, Boston, MA. https://inddex.nutrition.tufts.edu/data4diets. Accessed on 25 August 2023. 2018.
- Vhurumuku, E. Food security indicators. in Workshop on integrating nutrition and food security programming for emergency response: Food and Agriculture Organization (FAO). Kenya: Nairobi. 2014.
- Smith, L.C. and A. Subandoro, Measuring food security using household expenditure surveys. Vol. 3. 2007: Intl Food Policy Res Inst.
- FAO, Minimum Dietary Energy Requirement (kcal/person/day): Food and Agriculture Organization: FAO Statistics Division. 2022.
- Mota, A.A., S. T. Lachore, and Y.H. Handiso, Assessment of food insecurity and its determinants in the rural households in Damot Gale Woreda, Wolaita zone, southern Ethiopia. Agriculture & Food Security, 2019. 8(1): p. 1-11. [CrossRef]
- Doukoro, D. , et al., Assessment of Households’ Food Security Situation in Koutiala and San Districts, Mali. Journal of Food Security, 2022. 10(3): p. 97-107. [CrossRef]
- CSA, CSA (Central Statistical Agency) (2019) Ethiopia mini demographic and health survey report, Addis Ababa, Ethiopia. 2019.
- World Bank, Ethiopia's Age Dependency Ratio: Total: Washington D.C. 2023.
- Krishnamurthy, P.K. , et al., Climate risk and food security in Nepal—analysis of climate impacts on food security and livelihoods, in CCAFS Working Paper. 2013.
- WFP, V., Food consumption analysis: calculation and use of the food consumption score in food security analysis. WFP: Rome, Italy, 2008.
- Jateno, W., B. A. Alemu, and M. Shete, Household dietary diversity across regions in Ethiopia: Evidence from Ethiopian socio-economic survey data. PLoS One, 2023. 18(4): p. e0283496. [CrossRef]
- Gerezgiher, A. , Small holder market access in Werie Leke District of Tigray National Regional State, Ethiopia: Implications for poverty reduction and food security. 2016, Addis Ababa university, Addis Ababa Ethiopia.
- INDDEX, Food Insecurity Experience Scale (FIES). International Dietary Data Expansion ProjectData4 Diets: Building Blocks for Diet-related Food Security Analysis 2022.
- Mengesha, G.S. , Food security status of peri-urban modern small scale irrigation project beneficiary female headed households in Kobo Town, Ethiopia. Journal of Food Security, 2017. 5(6): p. 259-272. [CrossRef]
- Olaimat, A.N. , et al., Food insecurity, dietary diversity, and coping strategies in Jordan during the COVID-19 pandemic: a cross-sectional study. Nutrients, 2022. 14(11): p. 2252. [CrossRef]
- Mezgabu, F.; Tolossa, D. The contribution of urban agriculture to food security of individual urban farmers in Yeka sub city, Addis Ababa. Ethiopian Journal of Development Research 2015, 37, 177_207–177_207. [Google Scholar]
- Arega, B.B. , Determinants of rural household food security in drought-prone areas of Ethiopia: case study in Lay Gaint District, Amhara Region. 2013. [CrossRef]
- Adeniyi, O.R.; Ojo, O.A. Food security status of rural farming households in Iwo, Ayedire and Ayedaade local government areas of Osun State, South-Western Nigeria. African Journal of Food, Agriculture, Nutrition and Development 2013, 13, 8209–8223. [Google Scholar] [CrossRef]
- Feyisa, M.N. , Determinants of food insecurity among rural households of South Western Ethiopia. Journal of development and agricultural economics, 2018. 10(12): p. 404-412. [CrossRef]
- Sileshi, M. Drivers of rural households’ food insecurity in Ethiopia: a comprehensive approach of calorie intake and food consumption score. Agrekon, 2023: p. 1-12.
- Yitayew, B.; Seyoum, A. Determinants of rural households’ food insecurity status and associated coping strategies in enebsie sar Mider Woreda, East Gojjam Zone of Amhara National Regional State, Ethiopia. Ethiopian Journal of Development Research 2022, 44, 77–102. [Google Scholar]
- Maniriho, A., E. Musabanganji, and P. Lebailly, Food security status and coping strategies among small-scale crop farmers in Volcanic Highlands in Rwanda. Journal of Central European Agriculture, 2022. 23(1): p. 165-178. [CrossRef]
- Tigistu, S.; Hegena, B. Determinants of food insecurity in food aid receiving communities in Ethiopia. Journal of Agriculture and Food Research 2022, 10, 100391. [Google Scholar] [CrossRef]
- Getaneh, Y. , et al., Food security status and determinants in North-Eastern rift valley of Ethiopia. Journal of Agriculture and Food Research, 2022. 8: p. 100290. [CrossRef]


| Livelihood zones |
Sample Kebele |
No of Households |
Sample units and distributed questionnaires | Returned Questionnaires | |
|---|---|---|---|---|---|
| No. | % | ||||
| Abay-Beshilo Basin (ABB) | Maskeraba | 878 | 39 | 37 | 95 |
| South Wollo and Oromia eastern lowland sorghum and cattle (SWS) |
Keteteye | 1747 | 78 | 76 | 97 |
| Chefa Valley (CHV) | Abahilme | 1458 | 65 | 62 | 95 |
| Meher-Belg | Fito | 1403 | 63 | 60 | 95 |
| Belg | Hamusit | 1593 | 72 | 68 | 94 |
| Meher | Yaya | 1449 | 65 | 64 | 98 |
| Total | 8528 | 382 | 367 | 96 | |
| Food Group | Weights | Justifications |
|---|---|---|
| Main staples (cereals, starchy tubers, and roots) | 2 | Energy-dense, usually eaten in large quantities. The protein content is lower and poorer quality than legumes, and micro-nutrients (bound by phytates) |
| Pulses (legumes and nuts) | 3 | Energy-dense, high amount of protein content but lower quality than animal protein, micronutrients (bound by phytates), low fat |
| Animal protein (meat, fish, and eggs) | 4 | Highest quality protein, micronutrients, vitamin A, energy phytates, energy-dense. Even when consumed in small quantities, improvements to the quality of the diet are large |
| Vegetables | 1 | Low energy, low protein, no fat, micronutrients |
| Fruits | 1 | Low energy, low protein, no fat, micronutrients |
| Milk & dairy products | 4 | Highest quality protein, micronutrients, Vitamin A, energy |
| Oils and fats | 0.5 | Energy-dense, but usually no other micronutrients |
| Sugar/sweets | 0.5 | Empty calories |
| Condiments | 0 | Eaten in very small quantities and have no impact on the overall diet |
| Strategies | Categories |
|---|---|
| 1. Sold household assets/goods (radio, furniture, refrigerator, television, Jewelry, etc...) | Stress |
| 2. Sold more animals (non-productive) than usual | Stress |
| 2. Spent savings | Stress |
| 3. Purchased food on credit or borrowed food | Stress |
| 4. Reduced non-food expenses on health (including drugs) and education | Crisis |
| 5. Harvested immature crops (e.g. green maize) | Crisis |
| 6. Withdrew children from school | Crisis |
| 7. Sold last female animals | Emergency |
| 8. Begging | Emergency |
| 9. Sold house or land | Emergency |
| Variables | Category | Food security status based on Kcal (%) | Of the total (%) |
Test statistic with Kcal (P-Value) |
|
|---|---|---|---|---|---|
| Food secure | Food insecure | ||||
| Age group | 20 - 34 | 35 | 65 | 4.5 | 0.035** One-way Anova |
| 35 - 49 | 47 | 53 | 47.6 | ||
| 50 - 64 | 40 | 60 | 36.1 | ||
| ≥ 65 | 58 | 42 | 11.6 | ||
| Family size | 1-2 | 53 | 47 | 4.6 | 0.001*** One-way Anova |
| 3-4 | 52 | 48 | 22.6 | ||
| 5-6 | 45 | 55 | 51.5 | ||
| 7-8 | 36 | 64 | 18.8 | ||
| >9 | 56 | 44 | 2.5 | ||
| Sex | Male | 48.6 | 51.4 | 67.8 | 0.000*** T-Test |
| Female | 39.0 | 61.0 | 32.2 | ||
| Marital status | Married | 47.6 | 52.4 | 74.9 | 0.007*** One-way Anova |
| Single | 36.4 | 63.6 | 6.0 | ||
| Divorced | 51.4 | 48.6 | 9.5 | ||
| Widowed | 28.6 | 71.4 | 9.5 | ||
| Education level | Illiterate | 43.9 | 56.1 | 42.2 | 0.000*** One-way Anova |
| Read and Write | 39.4 | 60.6 | 25.6 | ||
| Grade 1-8 | 42.1 | 57.9 | 20.7 | ||
| Grade 9-12 | 74.2 | 25.8 | 8.4 | ||
| Diploma and above | 63.6 | 36.4 | 3.0 | ||
| Farming activities | Livelihood zone | Total | |||||
|---|---|---|---|---|---|---|---|
| BB | SWS | CHV | Meher-Belg | Belg | Meher | ||
| Engagement in farming | 100.0 | 100.0 | 95.2 | 100.0 | 97.1 | 98.4 | 98.4 |
| Crop production | 100.0 | 100.0 | 95.2 | 100.0 | 95.6 | 98.4 | 98.1 |
| Livestock Rearing | 100.0 | 96.1 | 64.5 | 98.3 | 80.9 | 90.6 | 87.7 |
| Fruit Production | 35.1 | 31.6 | 9.7 | 13.3 | 2.9 | 31.2 | 19.9 |
| Beekeeping | 0 | 13.2 | 0 | 1.7 | 11.8 | 17.2 | 8.2 |
| Other Farming activities | 0 | 0 | 0 | 0 | 0 | 1.6 | 0.3 |
| Food groups | Percentage of households with intake for (number of days per week) | |||||||
|---|---|---|---|---|---|---|---|---|
| 0 day | 1 day | 2 days | 3 days | 4 days | 5days | 6 days | 7 days | |
| Grains/ Tubers | 0 | 0 | 1.1 | 1.9 | 3.8 | 9.0 | 12.5 | 71.7 |
| Vegetables | 44.1 | 36.8 | 12.5 | 4.9 | 1.1 | 0.3 | 0 | 0.3 |
| Pulses | 4.6 | 5.7 | 7.6 | 21.0 | 13.9 | 12.3 | 13.6 | 21.3 |
| Fruits | 40.3 | 33.0 | 15.8 | 5.2 | 2.7 | 1.4 | 0.3 | 1.4 |
| Meat/ fish | 68.4 | 15.5 | 10.6 | 4.1 | 0.5 | 0.5 | 0.3 | 0 |
| Milk | 69.2 | 10.6 | 16.1 | 2.2 | 0.3 | 0.8 | 0 | 0.8 |
| Oil and Fat | 25.9 | 2.5 | 17.7 | 14.4 | 7.4 | 5.7 | 1.4 | 25.1 |
| Sugar | 32.4 | 7.1 | 27.8 | 16.3 | 7.1 | 1.1 | 1.9 | 6.3 |
| Livelihood zones | Food Security Status within Livelihood Zone (%) |
Total % |
|||||
|---|---|---|---|---|---|---|---|
| Food Secure | Marginally Food Secure | Total Food Secure | Moderately Food Insecure | Severely Food Insecure | Total food Insecure | ||
| ABB | 32.4 | 16.2 | 48.6 | 16.2 | 35.1 | 51.3 | 100.0 |
| SWS | 43.4 | 17.1 | 60.5 | 26.3 | 13.2 | 39.5 | 100.0 |
| CHV | 32.3 | 9.7 | 42.0 | 21.0 | 37.1 | 58.1 | 100.0 |
| Meher-Belg | 46.7 | 5.0 | 51.7 | 25.0 | 23.3 | 48.3 | 100.0 |
| Belg | 16.2 | 5.9 | 22.1 | 20.6 | 57.4 | 78.0 | 100.0 |
| Meher | 73.4 | 3.1 | 76.5 | 10.9 | 12.5 | 23.4 | 100.0 |
| Total | 41.1 | 9.3 | 50.4 | 20.4 | 29.2 | 49.6 | 100.0 |
Disclaimer/Publisher’s Note: The statements, opinions and data contained in all publications are solely those of the individual author(s) and contributor(s) and not of MDPI and/or the editor(s). MDPI and/or the editor(s) disclaim responsibility for any injury to people or property resulting from any ideas, methods, instructions or products referred to in the content. |
© 2024 by the authors. Licensee MDPI, Basel, Switzerland. This article is an open access article distributed under the terms and conditions of the Creative Commons Attribution (CC BY) license (http://creativecommons.org/licenses/by/4.0/).


