1. Introduction
Urban air pollution is one of the biggest environmental threats and health concerns of our time. It is primarily driven by vehicular traffic emissions and is closely interact with climate change [
9,
43]. In an urban setting, street canyons pose a significant threat to pedestrian air quality due to limited dispersion. The physical structure of street canyons traps pollutants at pedestrian level, and create microclimatic conditions that can further amplify the health risks associated with air pollution [
7,
36,
48].
Among urban air pollutants, Particulate Matter (PM) stands out as the most frequent and hazardous pollutant, posing a significant threat to public health [
34,
36]. Categorized by its aerosol size as PM
2.5 and PM
10, finer PM
2.5 particles readily penetrate the lungs and long-term exposure can cause respiratory infections, lung cancer, pulmonary diseases, cardiovascular diseases, premature deaths and even exacerbate the impact of Covid-19 [
51].
The World Health Organization (WHO) and the European Union (EU) have established air quality guidelines for particulate matter (PM) concentrations in cities. These guidelines, designed to protect public health, specify safe limits for both annual and 24-hour averages [
11,
52]. For PM
2.5, the WHO recommends an annual mean of 5 μg/m
3 and a 24-hour mean of 15 μg/m
3, while the EU sets limits of 25 μg/m
3 for annual mean and 50 μg/m
3 for 24-hour mean. For PM
10, the WHO recommends an annual mean of 15 μg/m
3 and a 24-hour mean of 45 μg/m
3, while the EU sets a limit of 40 μg/m
3 for annual mean. Despite these established safe limits, nearly 96% of Europe’s urban population – approximately 450 million people – were exposed to PM
2.5 levels exceeding WHO health guidelines in 2020 [
11]. As a result, the European Commission implemented countermeasures such as stricter vehicle emission standards, cleaner fuels, transport modelling and air quality monitoring to combat urban air pollution [
10]. Currently, over 250 Europe cities, have adopted Low Emission Zones (LEZs) to support these efforts [
35,
46].
Glasgow has been facing its own battle with air pollution. For decades, it has the dubious reputation as Scotland's most polluted city for NO2 and PM concentrations, mainly due to increasing vehicular traffic and the city's historic layout of narrow streets [
26]. Periodically exceeding safe limits set by Scottish authorities, around 400 premature deaths are estimated annually in Glasgow [
26]. Furthermore, air pollution health impacts cost the National Health Service (NHS) up to £2 billion annually [
15].
Consequently, Glasgow City Centre was declared as an Air Quality Management Area (AQMA) in 2004, specifically targeting NO2 and PM reductions. This declaration led to a series of initiatives, such as the Air Quality Action Plans and the 2013 Glasgow City Centre Strategy to move away from the ‘car-oriented’ to a ‘sustainable mobility’ model [
30]. Among these efforts, the recent implementation of Low Emissions Zone, ‘Glasgow Avenues Programme’ and carbon neutrality plans highlights Glasgow's commitment to align with broader European efforts to tackle air pollution and create a healthier, more sustainable future for its residents [
13,
14,
16,
17].
While LEZs offer significant health benefits and dominantly improve air quality their implementation often imposes logistic challenges to its residents and businesses and at times increase traffic in areas outside the LEZs. [
6,
24,
33,
35]. In this context, researchers, and urban planners, worldwide, are increasingly exploring nature-based solutions (NBS) such as street trees, to improve air quality and human health. Studies have highlighted their positive influence on dispersion patterns, aerodynamic effects, and pollutant deposition [
23,
27,
53,
54]. However, evidence also suggests that under certain conditions, street trees can obstruct wind flow, potentially leading to localised pollutant accumulation [
2]. The impact of street trees on air quality ultimately depends on a complex interplay of factors, including meteorological conditions, urban geometry, emission levels, and particle sizes [
54].
This dynamic interplay between street trees, urban planning, and LEZs emphasizes the need for further research and careful consideration in designing and implementing air quality interventions. Glasgow's ambitious sustainability goals and ongoing trials of LEZs and Avenues Programme provide a valuable case study for exploring the synergies associated with these strategies. Based on Glasgow's urban structure, meteorological patterns, traffic flow dynamics, and existing green infrastructure, this research aims to develop evidence-based tree placement and configuration strategies to maximise air quality benefits and minimise potential drawbacks. By employing a holistic approach that integrates LEZs, optimized urban planning, and strategic greening initiatives, Glasgow can continue its journey towards cleaner air and a healthier future for its residents.
2. Materials and Methods
2.1. Study Area
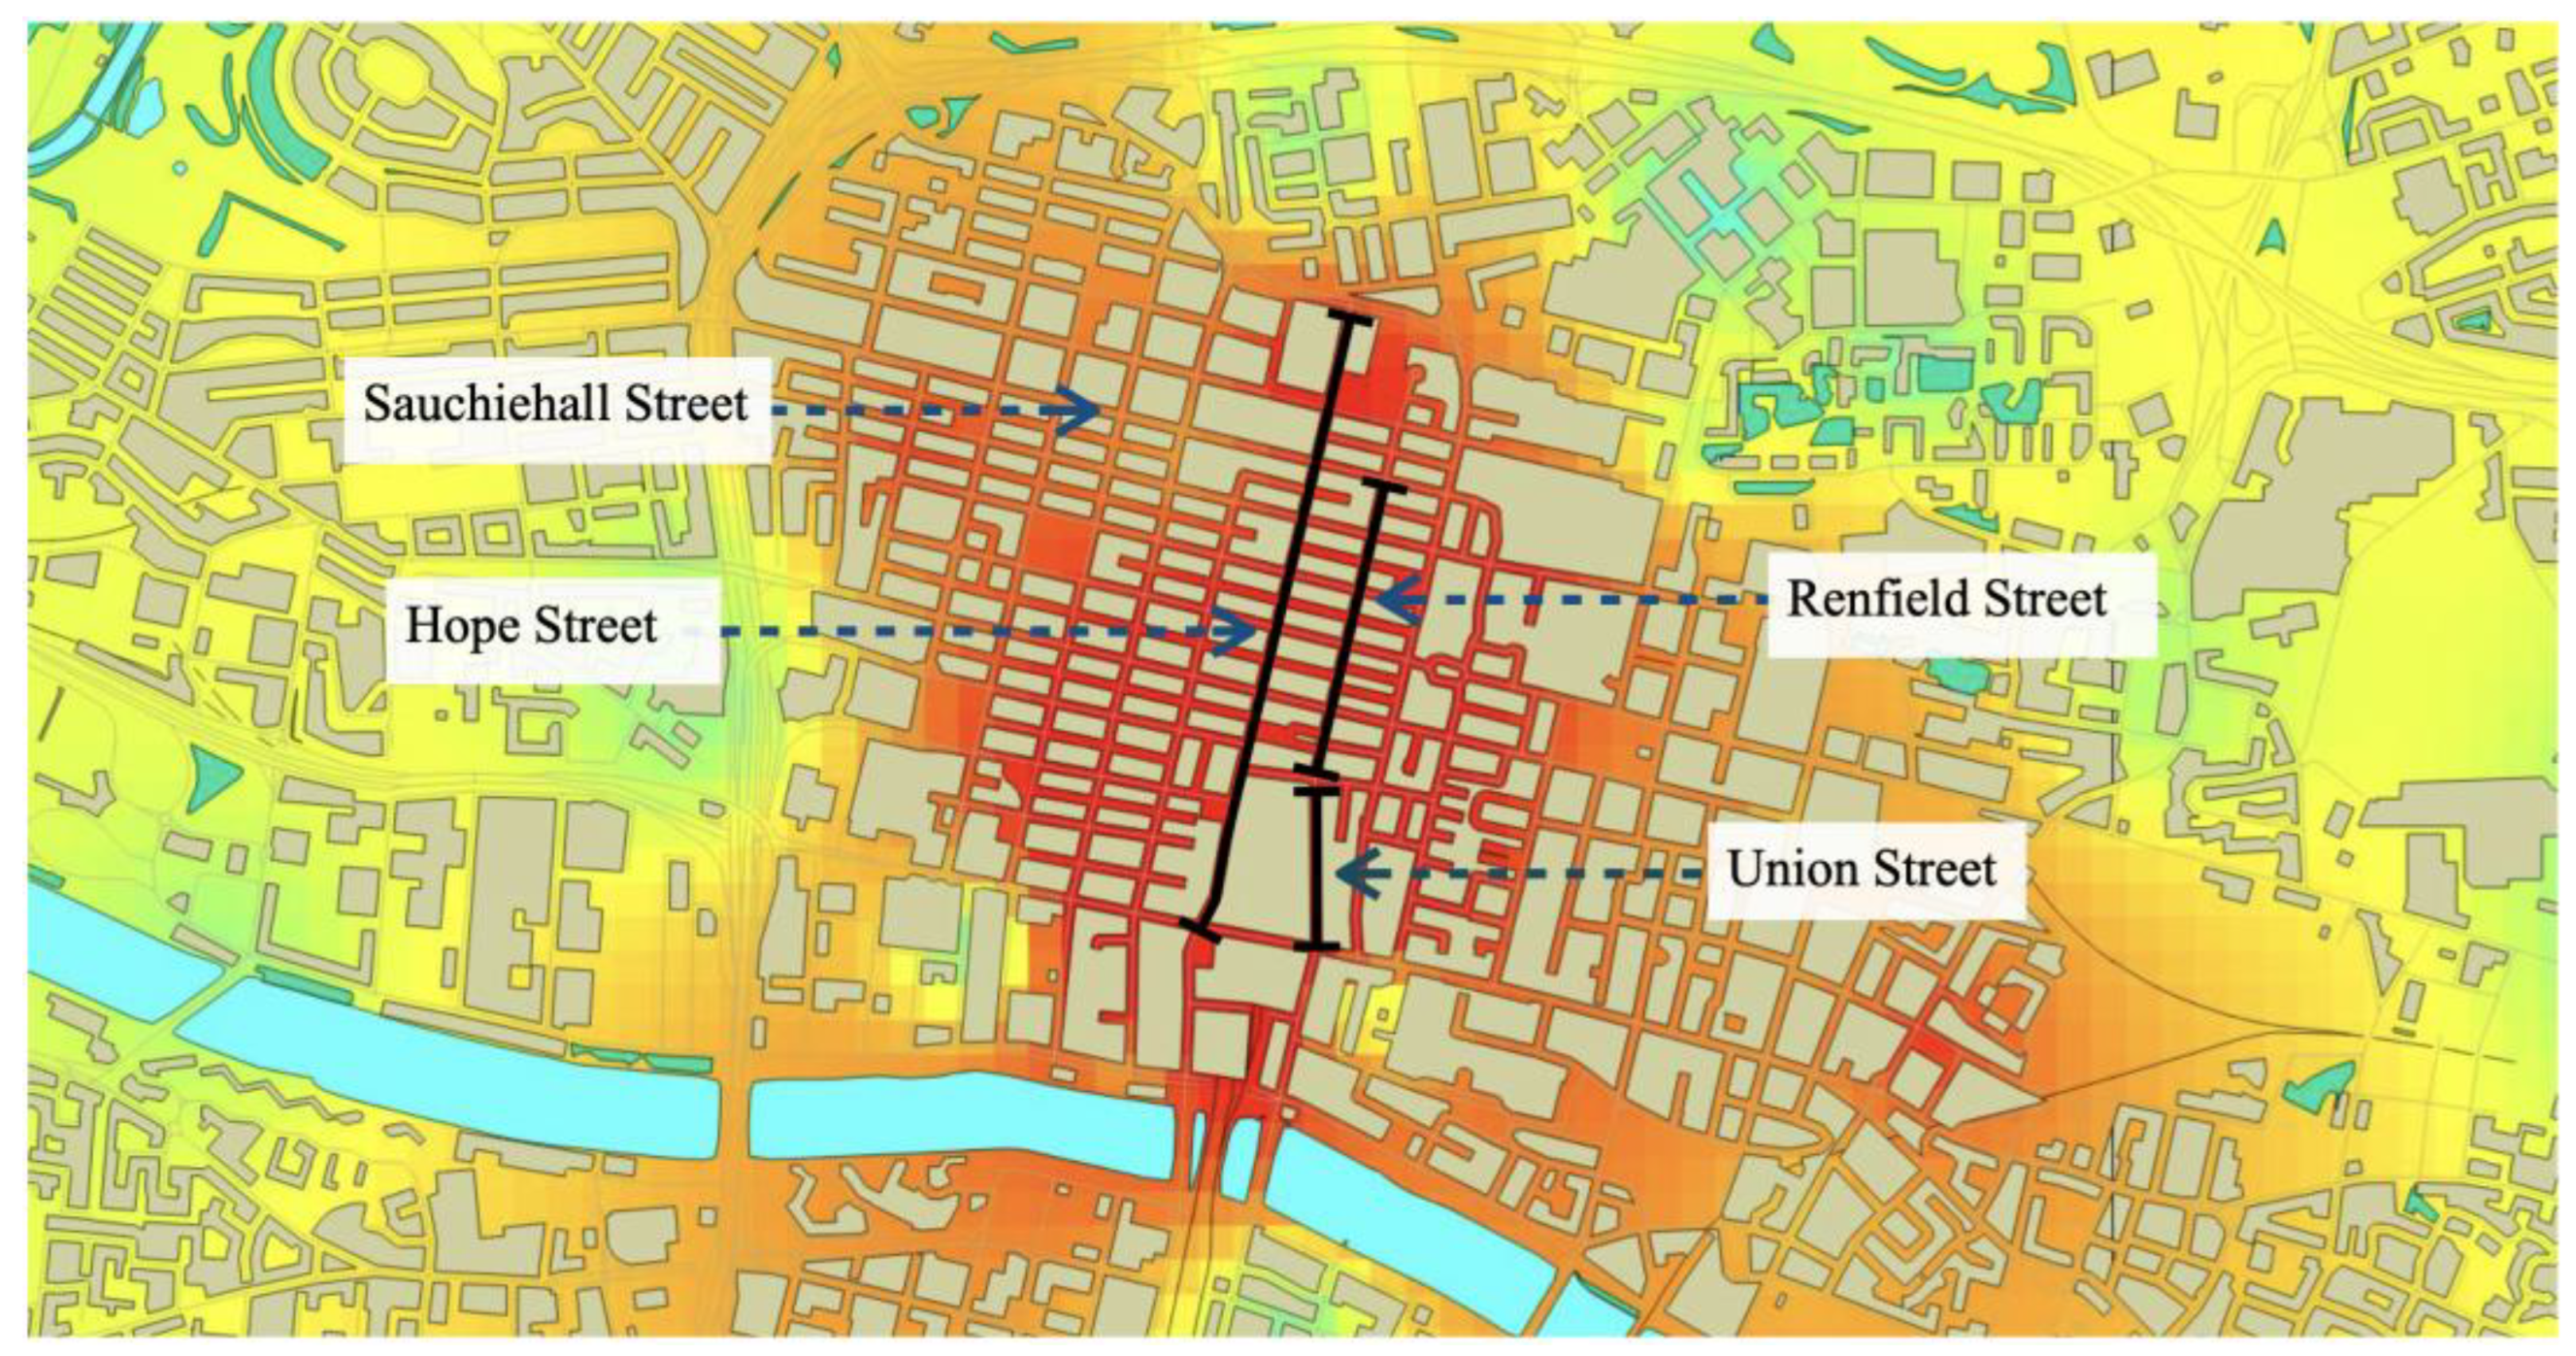
Hope Street in Glasgow City Centre was selected as the primary study area - Test Site (
Figure 1). It is a bustling north-south corridor, a major bus route and provides access to Glasgow Central Railway Station. With a narrow street geometry and high traffic volumes, Hope Street exemplifies Glasgow's pollution problem, thus making it an ideal setting to study the potential of trees to mitigate urban air pollution. For a controlled comparison, an east-west oriented Sauchiehall Street serves as the Control Site. As the first street to have been transformed into an ‘Avenue,’ Sauchiehall Street is the city's only street featuring a row of trees, offering a real-world testbed for evaluating the influence of vegetation on air pollution mitigation.
2.2. Data Collection
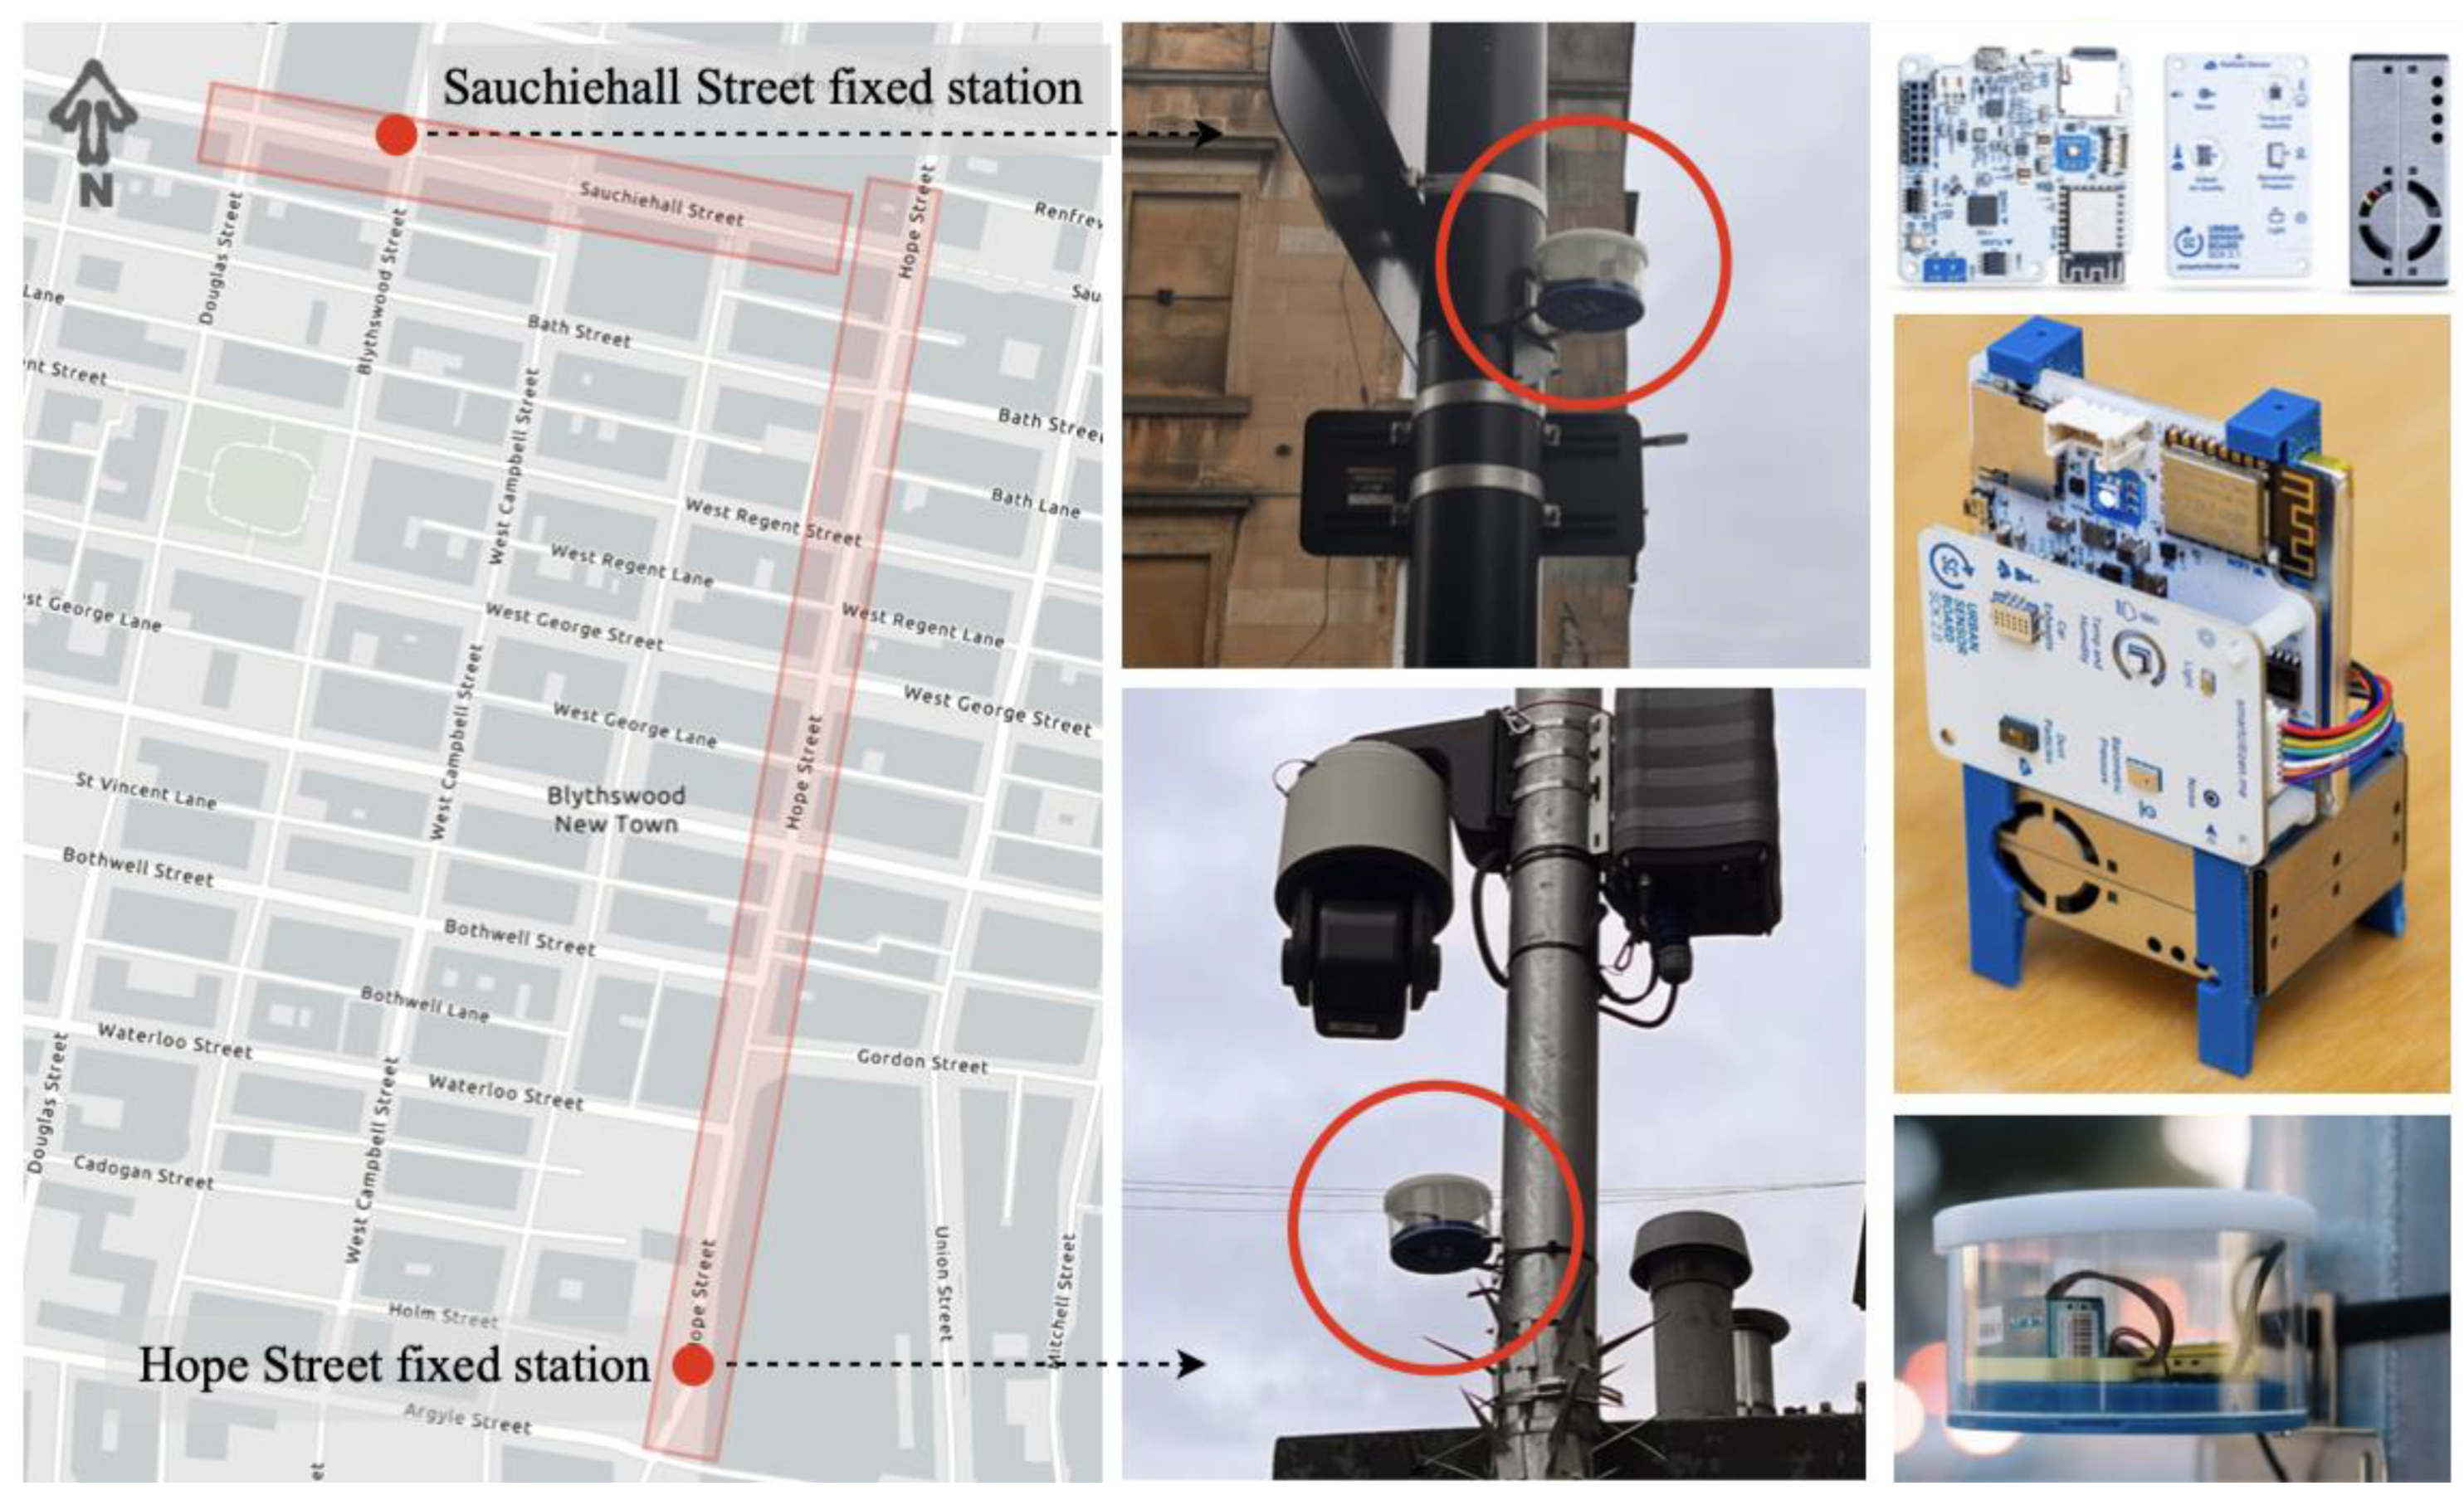
Historic street-level air pollution in Hope Street (including live PM emission data) was obtained from the existing Hope Street Kerbside Measuring Station. Additionally, to facilitate a real-time comparison, air quality, air temperature and relative humidity (RH) monitoring was conducted on Hope Street and Sauchiehall Street using two Smart Citizen 2.1 Kits (SCKs,
https://www.aqmd.gov/aq-spec/sensordetail/fablab---smart-citizen-kit-v2.1). SCKs are a low-cost, modular hardware component designed to engage citizens in air quality monitoring and raise awareness on environmental issues [
37]. These sensors monitor PM concentrations based on aerosol shape, colour, and composition, making them ideal for air quality monitoring [
41]. One SCK was strategically positioned at the Hope Street Kerbside Measuring Station for direct data comparison, while the other was placed on a traffic light at a height of 2m on Sauchiehall Street (
Figure 2). Monitoring was conducted for three consecutive days from 14th June 2022 and for 24 hours on 22nd June 2022.
To gather comprehensive data on factors affecting air quality, the study employed continuous week-long observations in both streets, recording daily traffic flow, pedestrian activity levels, and canyon geometry through aspect ratio calculations at key points. In Sauchiehall Street, the study also examined street trees, mapping their in-canyon placement, species, size, and crown geometry to support scenario formulation for subsequent analysis.
2.3. Data Analysis and Correlation
While SCKs is a promising tool for measuring air quality, it had limitations that can affect data accuracy. Placing SCKs in a closed container and the configuration of the device can overheat the device influence its readings. Studies report potential errors of around 1.3°C in temperature and -10% in RH under such conditions [
8]. Additionally, as these sensors lack inbuilt dryers to remove water vapor from the measurement samples, RH can influence PM measurements, potentially leading to miscalculations and altered results [
28,
41]. To account for such variations in the device's heat emission, measured temperature and RH datasets were calibrated and adjusted. The datasets underwent further refinement using statistical correlation tests and Root Mean Square Error (RMSE) analyses, to identify potential outliers and ensure accuracy. Subsequently, the data was cross-referenced with readings from the Kerbside Measuring Station (Reference Station) to ensure validity.
2.4. Modelling and Simulations
To simulate the potential impact of street trees on air quality within congested urban canyons, this study employed ENVI-met 5.0.3 microclimate modelling software. A 400m x 420m model domain was created replicating the busiest section of Hope Street, due to its representativeness of typical urban canyon in Glasgow, with high traffic volume, narrow geometry, and zero green cover. This model included a detailed gridded street layout with 17 representative building blocks ranging from 36m to 40m in height and the prominent Glasgow Central Station. Simulations were focused on 16th July 2022, which exhibited the highest data accuracy among the collected measurements and represented a typical summer day in Glasgow.
To calibrate the ENVI-met model and ensure its accuracy, several Validation Models (VMs) were simulated using different combinations of ENVI-met parameters and emission sources, with an aim to obtain output that led to the best agreement with the measured temperature, relative humidity (RH), and PM concentrations. The emission source, representing traffic and other background sources, was set to emit multiple pollutants, at a height of 0.3m above ground level for all simulations. Background concentrations of each pollutant were determined based on emission levels during minimum traffic hours (01:00h to 00:04h). For all simulations, a recorded wind speed of 3.5 m/s in perpendicular (270°) direction (westerly inflow, easterly outflow) was used, and the particle deposition velocity was set constant at 0.45. The VM exhibiting the lowest bias, lowest RMSE, and highest R² was chosen as the Base Model (BM), to serve as the foundation for subsequent simulations incorporating various street tree scenarios.
2.5. Research Framework and Scenario Study
This study systematically assessed the impact of street tree on local air quality dynamics in urban canyons through context-specific scenarios based on four key parameters outlined in the Glasgow Public Realm Design + Maintenance Guide (PRD+MG). This includes, (i) tree species suitable for urban environments, (ii) crown geometry (size, shape, and porosity) to influence wind flow and pollutant dispersion, (iii) tree spacing for optimised canopy coverage and pollutant disposition, and (iv) in-canyon placement (leeward or windward) to maximise air quality benefits.
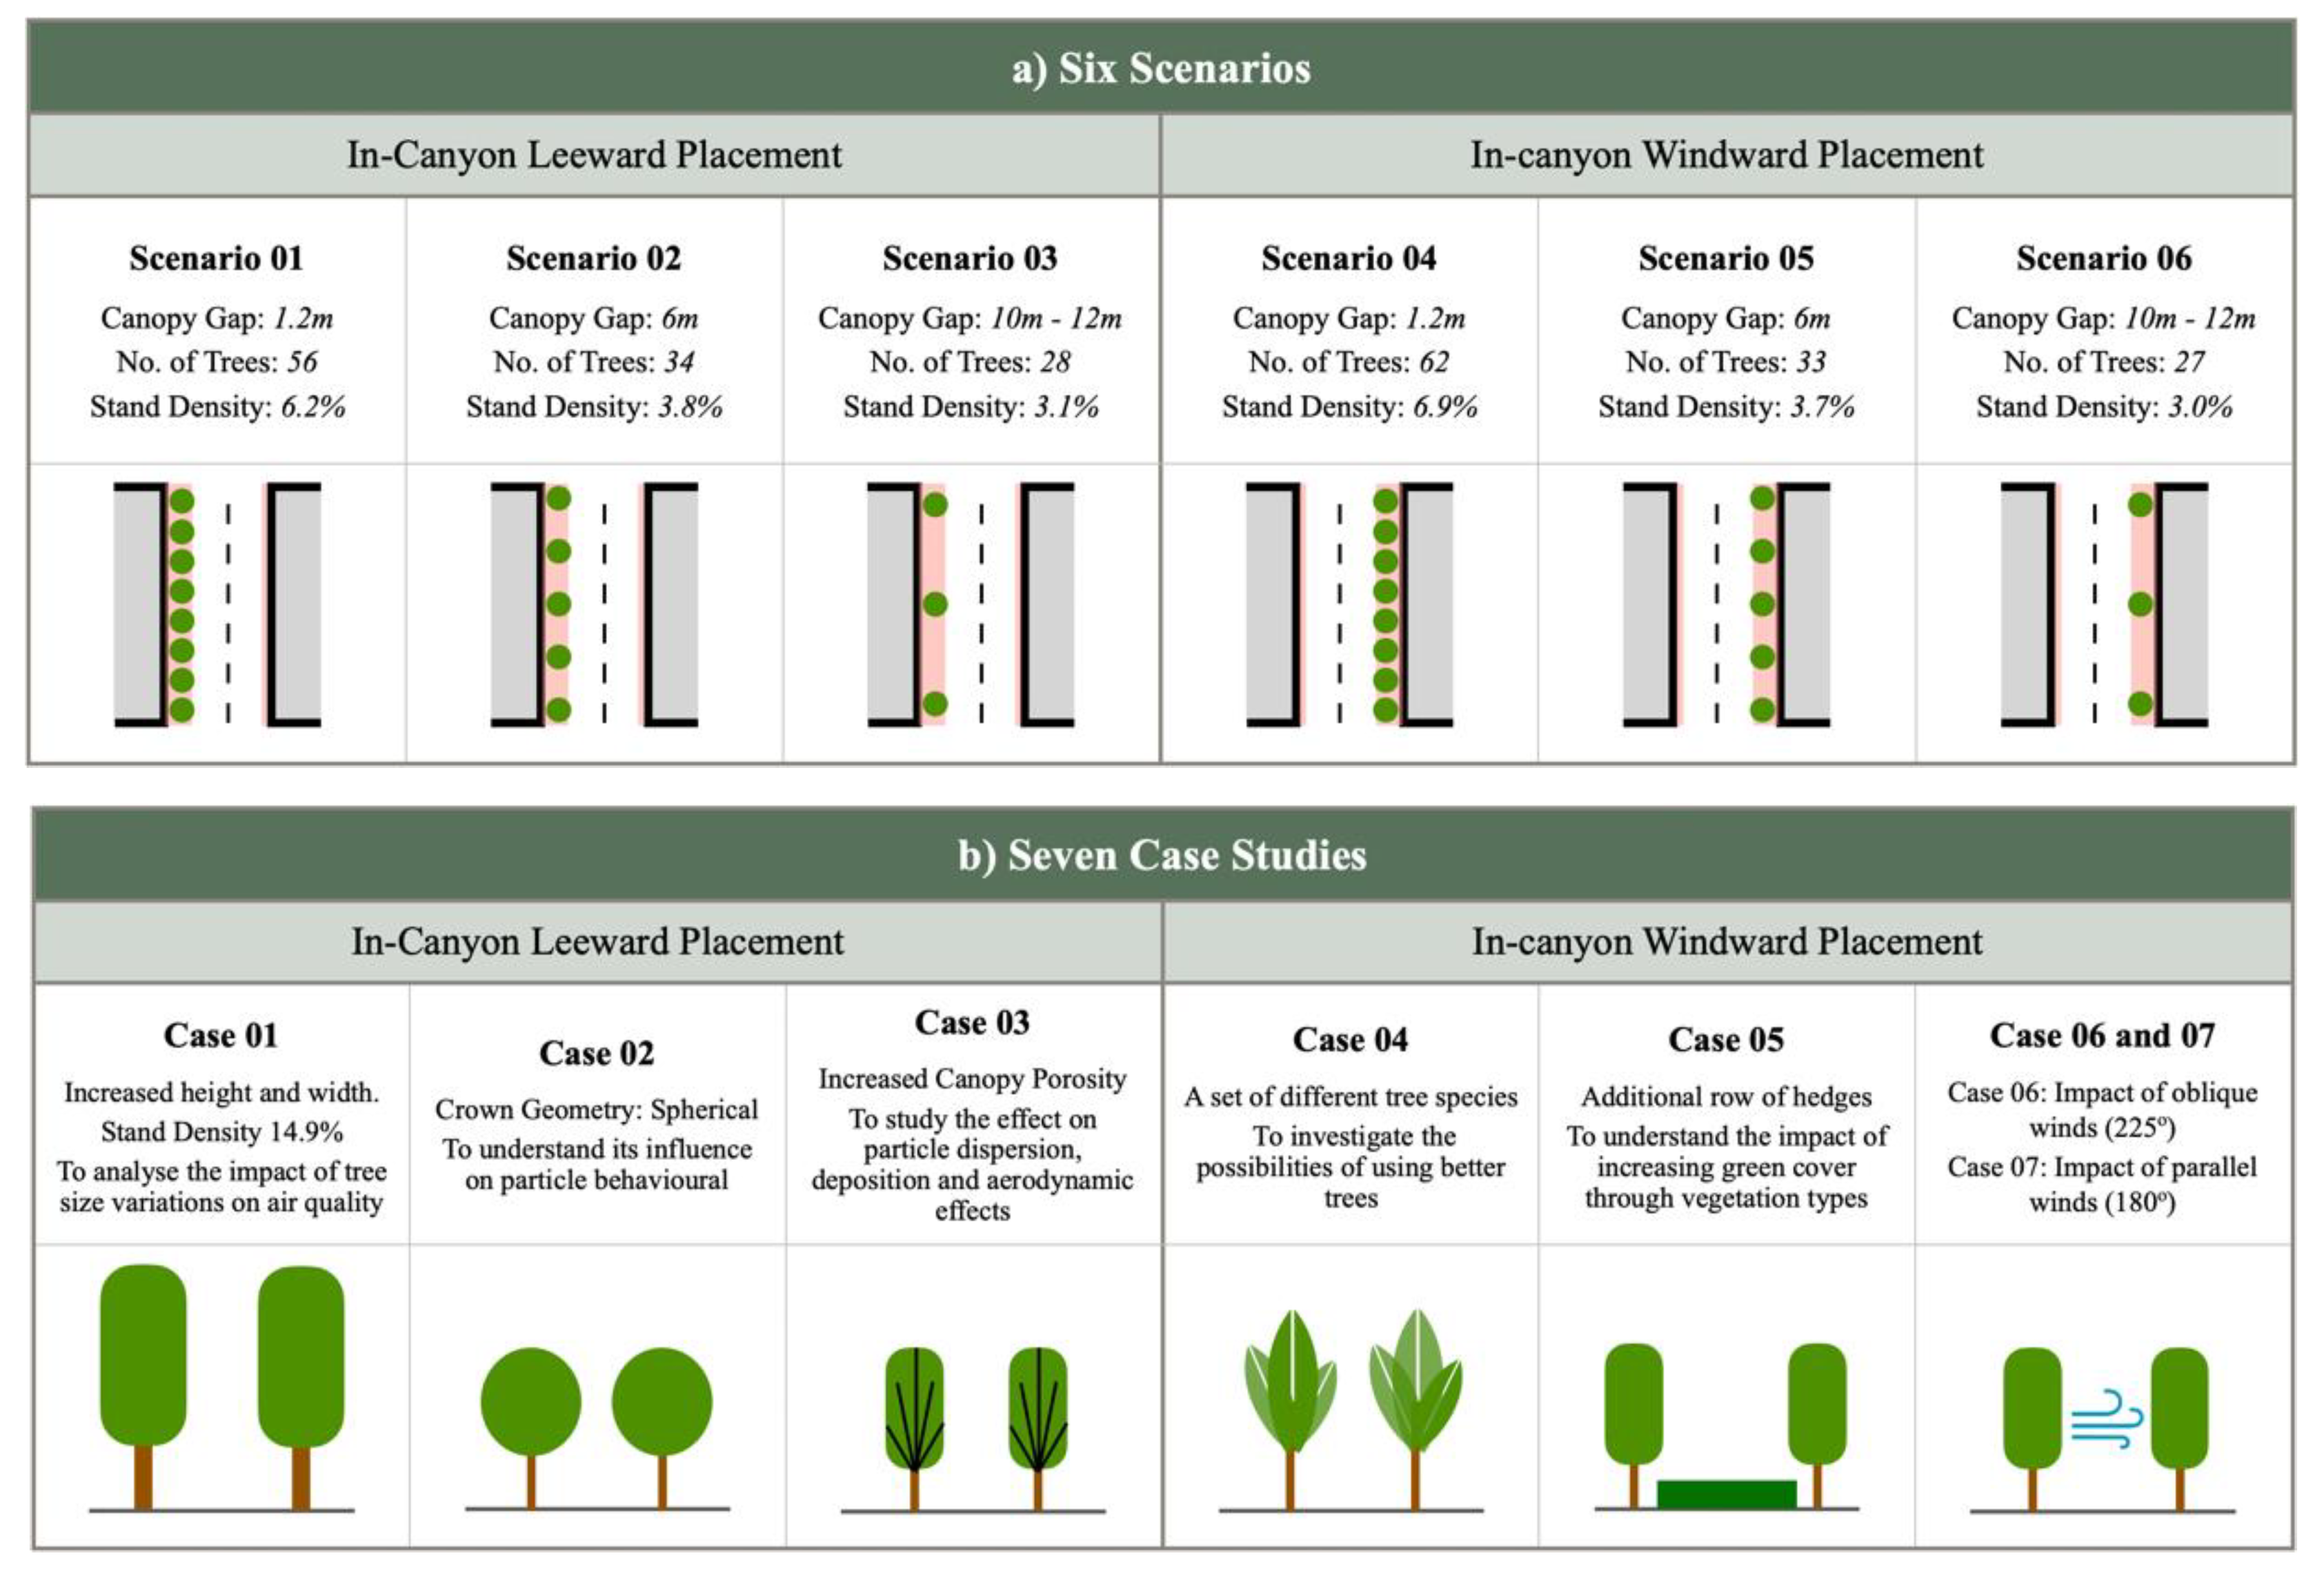
Two studies were conducted focused on Hope Street to understand the complex relationship between tree characteristics and air quality. The Sensitivity Study examined six distinct scenarios, each featuring a different tree spacing and placement strategy optimized for the BM as illustrated in
Figure 3. Three scenarios explored the impact of a row of leeward trees with different spacings, while the remaining focused on a row of windward trees. All scenarios incorporated tree species identified at their semi-maturity size in Sauchiehall Street, allowing for realistic comparisons. To conduct a street wide assessment, simulated pollutant concentrations from the six scenarios were averaged separately for multiple receptors positioned at a height of 1.8m along both the leeward and windward pavements.
Based on the optimal scenario for tree growth identified in the Sensitivity Study, the Case Studies then delved deeper into this scenario, investigating how specific characteristics of individual trees affect the outcome. As depicted in
Figure 3, seven distinct case studies were simulated, each exploring variations in configuration attributes and wind directions. Accordingly, Cases C1, C2 and C3 examined tree size, shape, porosity, respectively, and C4 investigated four alternative tree species, namely,
Acer buergerianum (Trident Maple),
Pinus sylvestris (Scotch Pine),
Tilia cordata (Littleleaf Linden) and
Sorbus intermedia (Swedish Whitebeam), chosen for their suitability in UK roadsides with high pollutant tolerance and low VOC and pollen emission. Case 5 (C5) introduced low-level hedges to increase vegetation volume for the optimal scenario while C6 and C7 investigated the impact of oblique (225°) and parallel (180°) wind on air quality, respectively.
3. Results
3.1. Data Analysis
3.1.1. Existing Particle Matter Dynamics in Hope Street
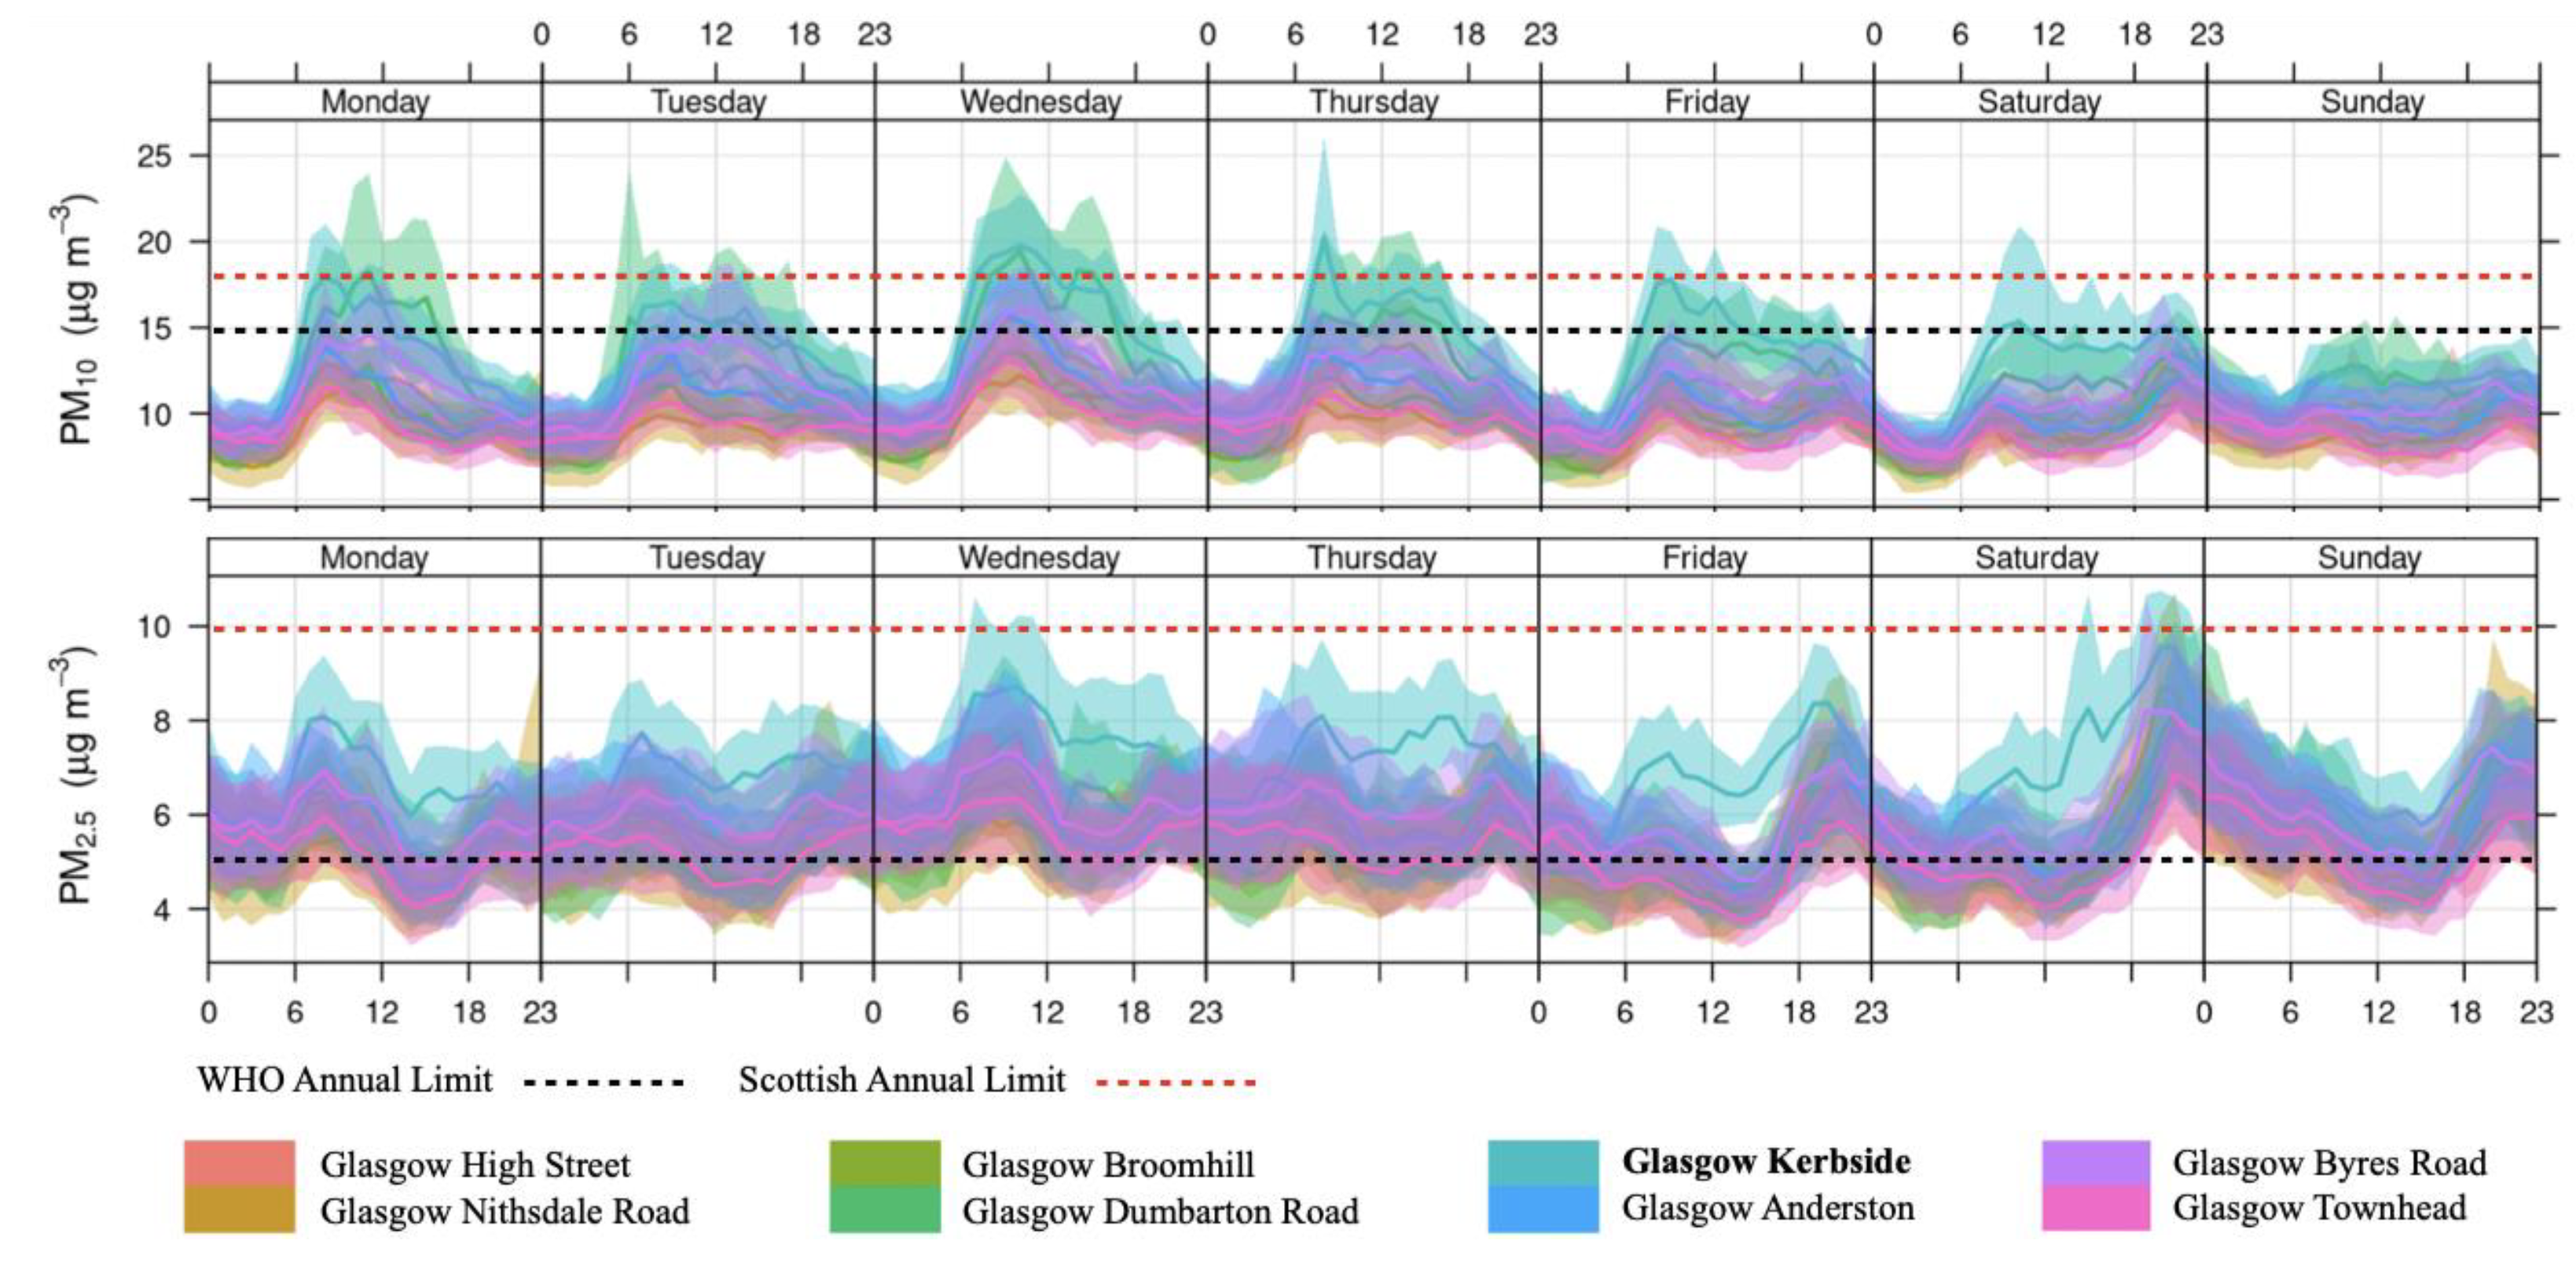
Data from the Kerbside Station offers insights into Hope Street's PM profile (
Figure 4). For over a decade, PM emissions in Hope Street consistently exceeded annual safe limits, with a brief respite in 2020 due to COVID-19 restrictions [
12]. However, emissions started rising in 2021 with traffic returning to pre-pandemic levels [
15]. The weekly averaged PM
10 levels in 2021 regularly exceeded both the Scottish and WHO annual limits. Conversely, PM
2.5 levels stayed mostly within the annual Scottish legal limits, however, consistently surpassed the stricter WHO guidelines, highlighting a gap between legal constraints and public health benchmarks. The hourly variation in PM
10 emissions reinforces a direct link between vehicular activity. PM
10 peaked during rush hours between 6:00 AM and 6:00 PM, followed by a significant drop during off-peak hours (10:00 PM and 1:00 AM), and on weekdays. PM
2.5, however, exhibited a less defined pattern, suggesting elevated background levels with a peak during morning traffic hours between 06:00h and 12:00h. Throughout the day PM
2.5 levels exceeded the WHO safe limits. Annual PM records from the Kerbside Station do not reveal clear trends or consistent seasonal variations.
Despite the current concerns, the data shows a gradual decrease in overall PM emissions in Hope Street compared to a decade ago, suggesting potential progress towards cleaner air. However, the persistent increase and the breaching of legal limits suggests that Glasgow is far from achieving its air quality targets, especially as traffic volumes continue to rise and temporary interventions introduced during the pandemic appear insufficient when restrictions are relaxed [
12].
3.1.3. Interplay of Traffic Flow, Aspect Ratios, and Street Trees
Hope Street experienced an average daily traffic volume of 8,000 vehicles, 1,800 of which were buses. Peak hours, from 10:00 to 12:00 and 16:00 to 18:00, witnessed a significant rise in activity, followed by a notable decline after 20:00. This pattern coincided with pedestrian influx, particularly around Glasgow Central Railway Station, suggesting a strong link between traffic and human activity. The street itself is roughly 18m wide, including pavements. Near Glasgow Central, buildings reach a towering 40m, creating a narrow canyon with an aspect ratio of 1.6. Near the Sauchiehall Street intersection, the building heights in Hope Street averages to about 12m, creating a shallower canyon with an aspect ratio of 0.95.
In contrast, Sauchiehall Street maintains a consistent 0.6 aspect ratio with buildings averaging 20m in height. Additionally, it hosts four distinct tree species known for absorbing CO
2 and PM
10 in urban environments [
45], namely, Norway Maple, Field Maple, Common Hornbeam, and Ginkgo biloba, all currently at their semi-mature stage. Their characteristics are detailed in
Table 1.
3.1.3. Calibration and Limitations of Smart Citizen Kits (SCKs)
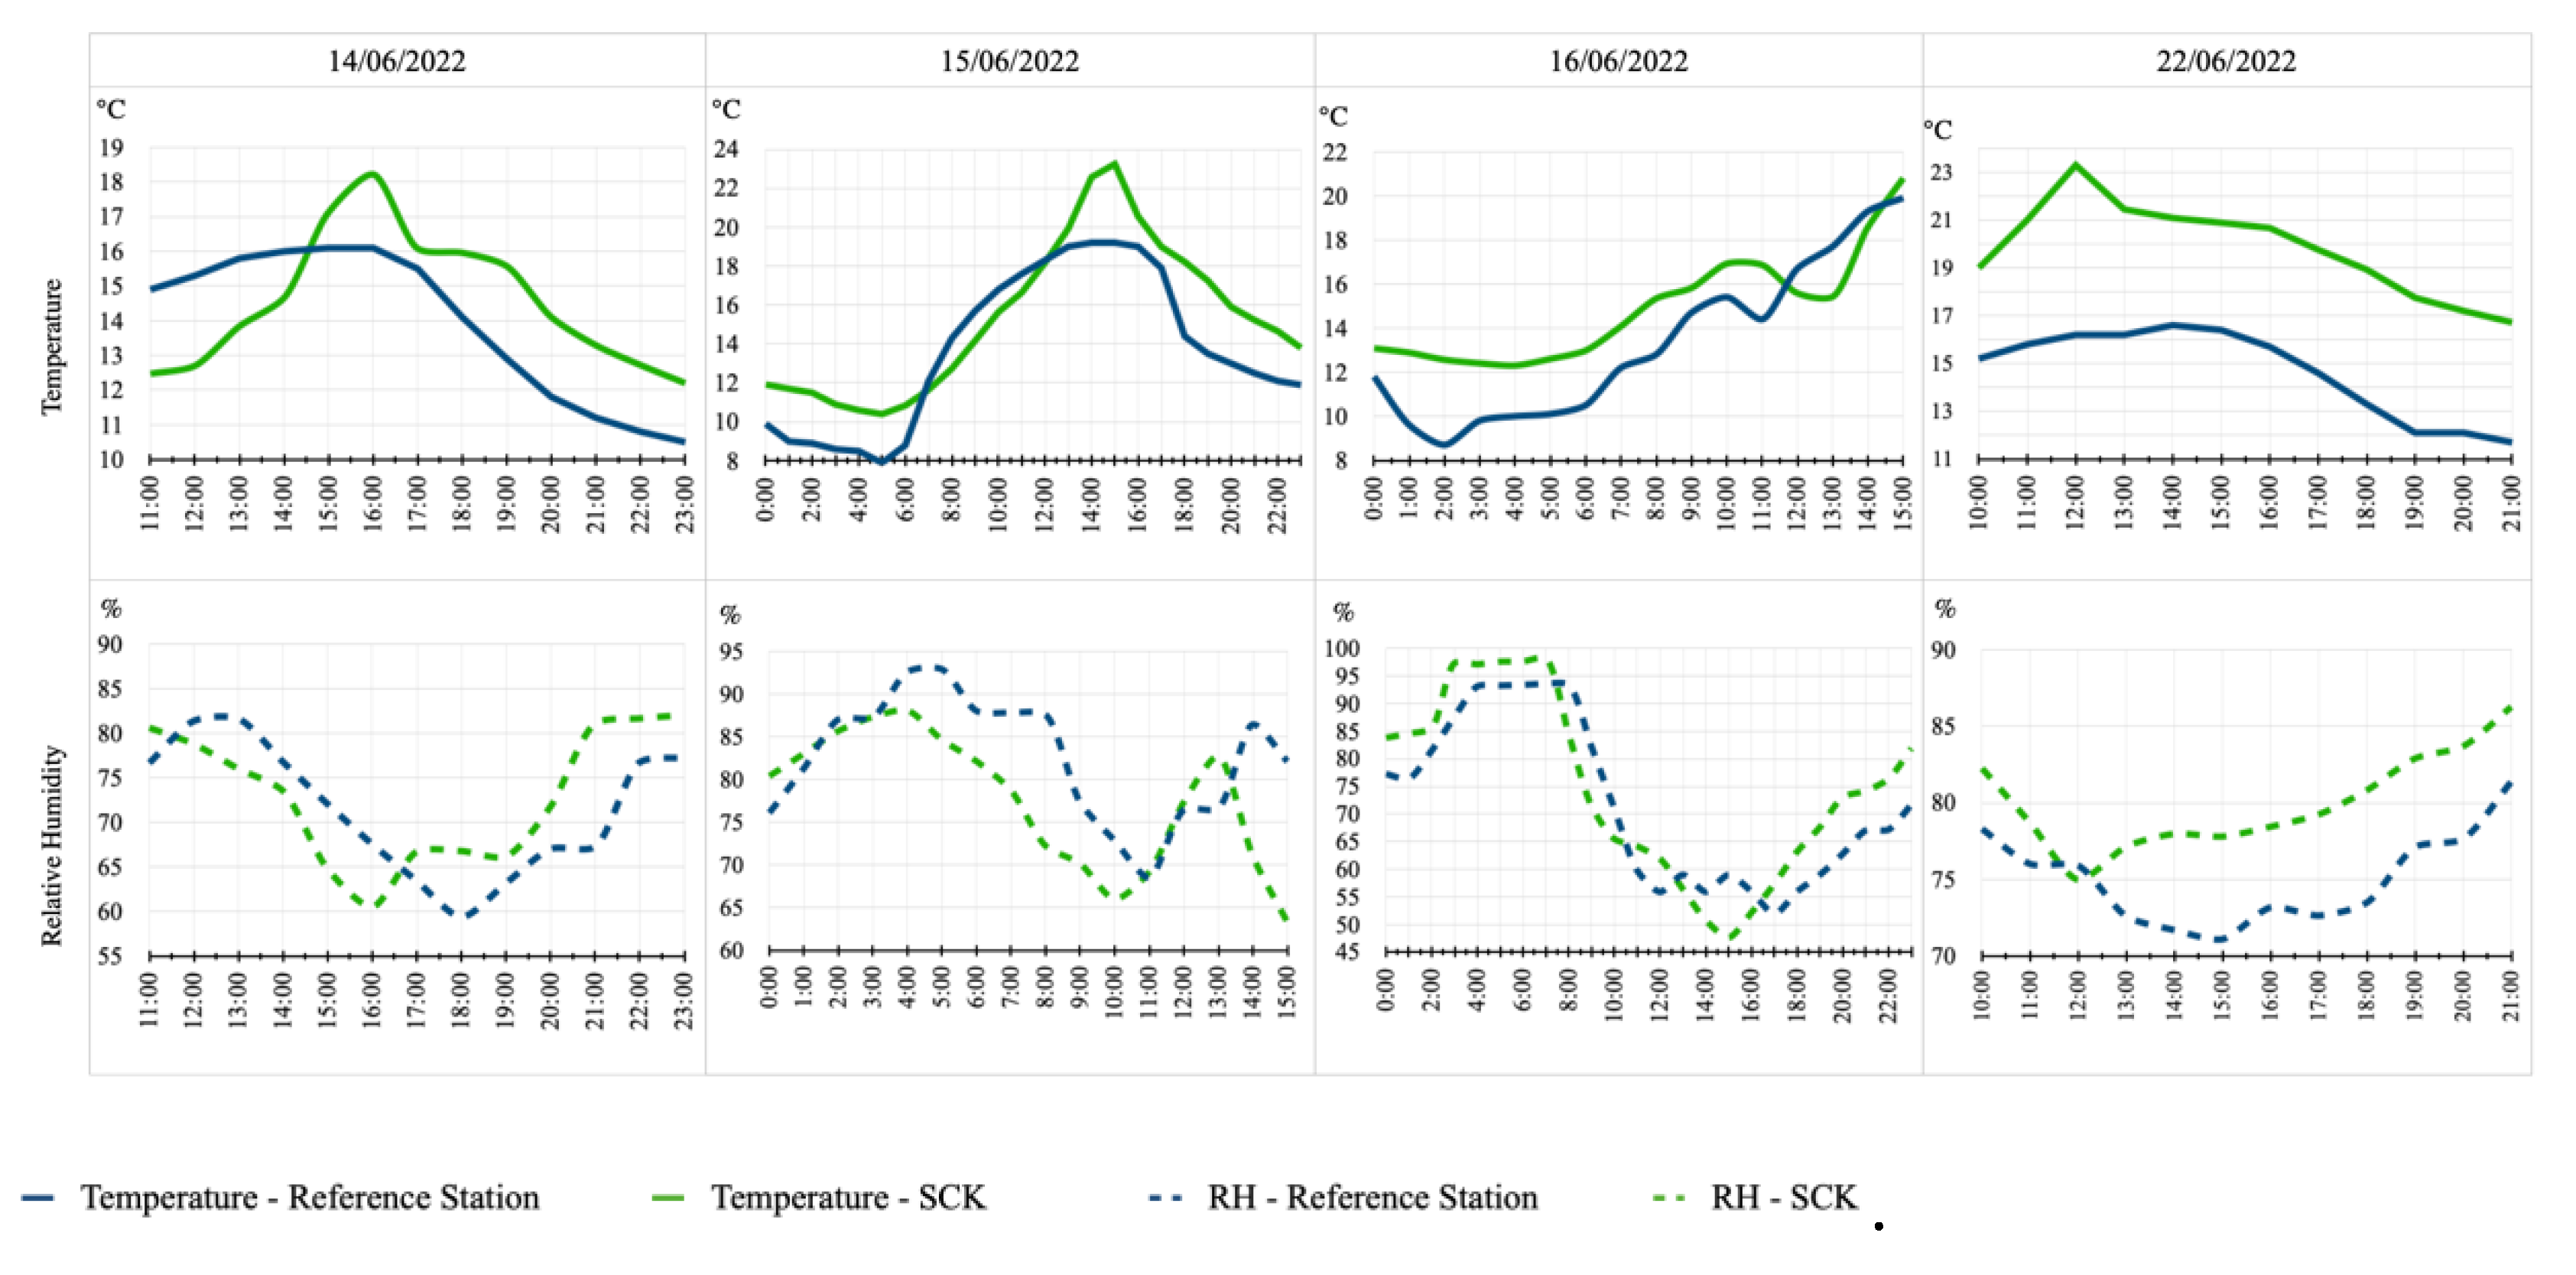
A statistical analysis was conducted to evaluate SCK data collected from Hope Street and Sauchiehall Street (
Figure 5). Measured temperature exhibited variations ranged from 2°C to 7.3°C compared to reference data due to device heating, with the highest bias on June 22nd. June 16th measurements showed the highest correlation with the reference data and the lowest RMSE for both temperature and RH, making the data viable for simulations (
Table 2).
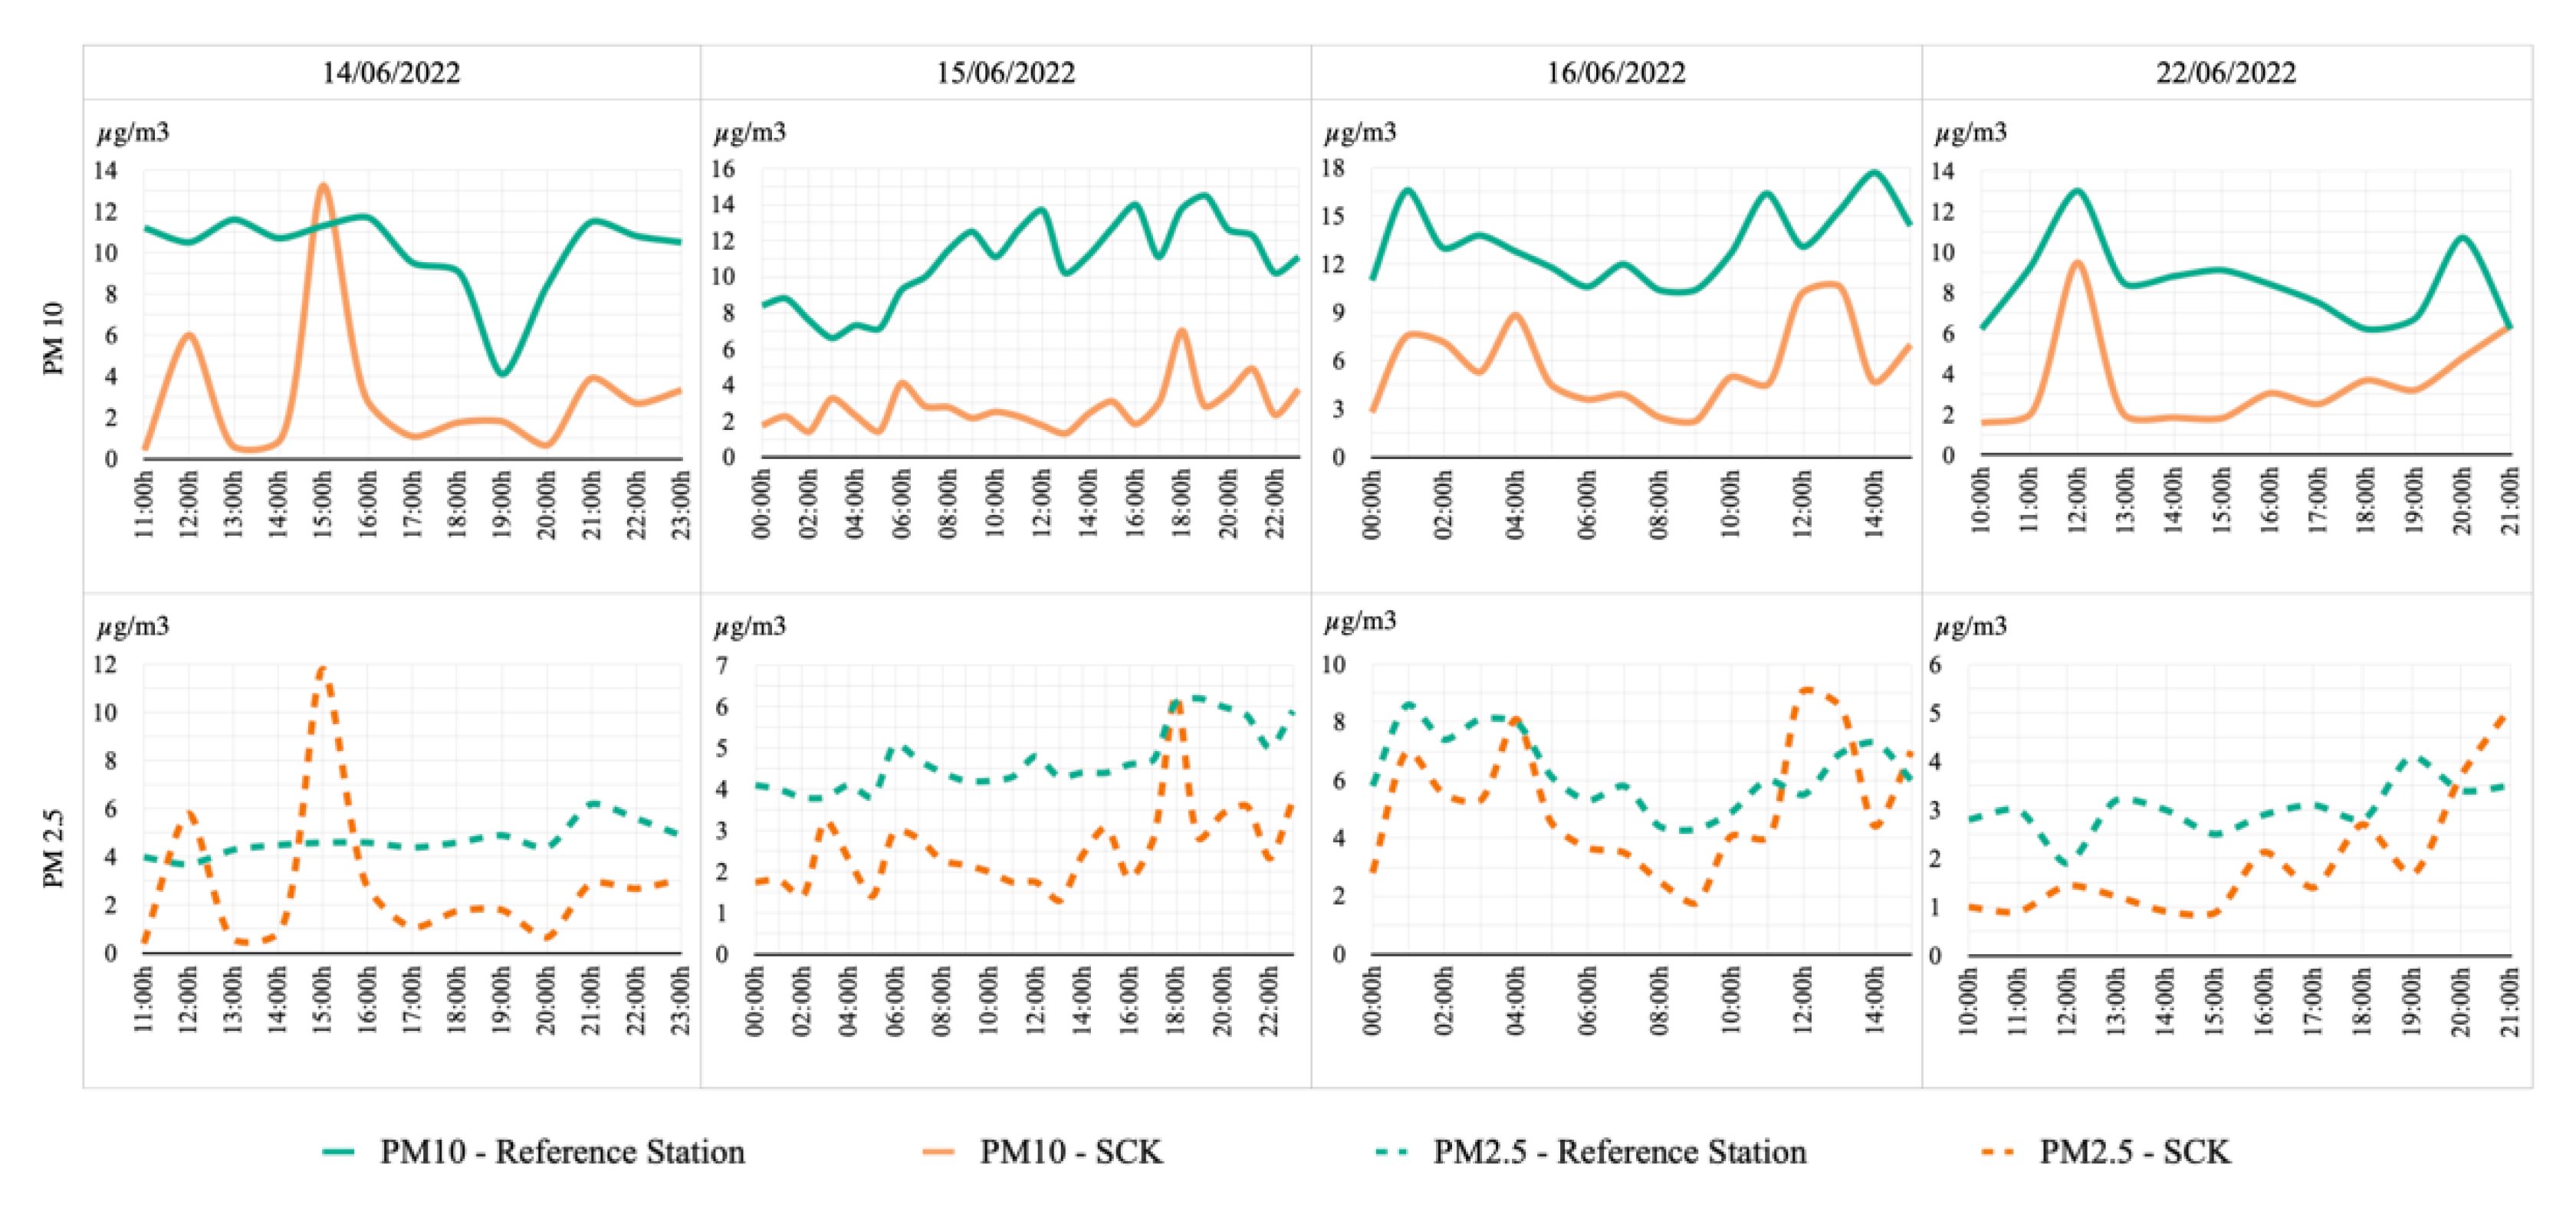
Statistical analysis of PM data revealed variations in measured PM
10 and PM
2.5 ranging from 1.9 to 5.11 μg/m³ and 2.5 to 5.6 μg/m³, respectively, compared to the reference station (
Figure 6). Notably, the device recorded identical values for both PM
10 and PM
2.5, despite marked differences in the reference data, particularly evident on 14 June 2022. Therefore, none of the measured data showed any correlation with the reference data. However, the highest bias and the lowest RMSE was shown on the 16 June 2022 (
Table 3).
3.2. Sensitivity Analysis
3.2.1. Impact of In-Canyon Tree Placement on Particle Matter Reduction
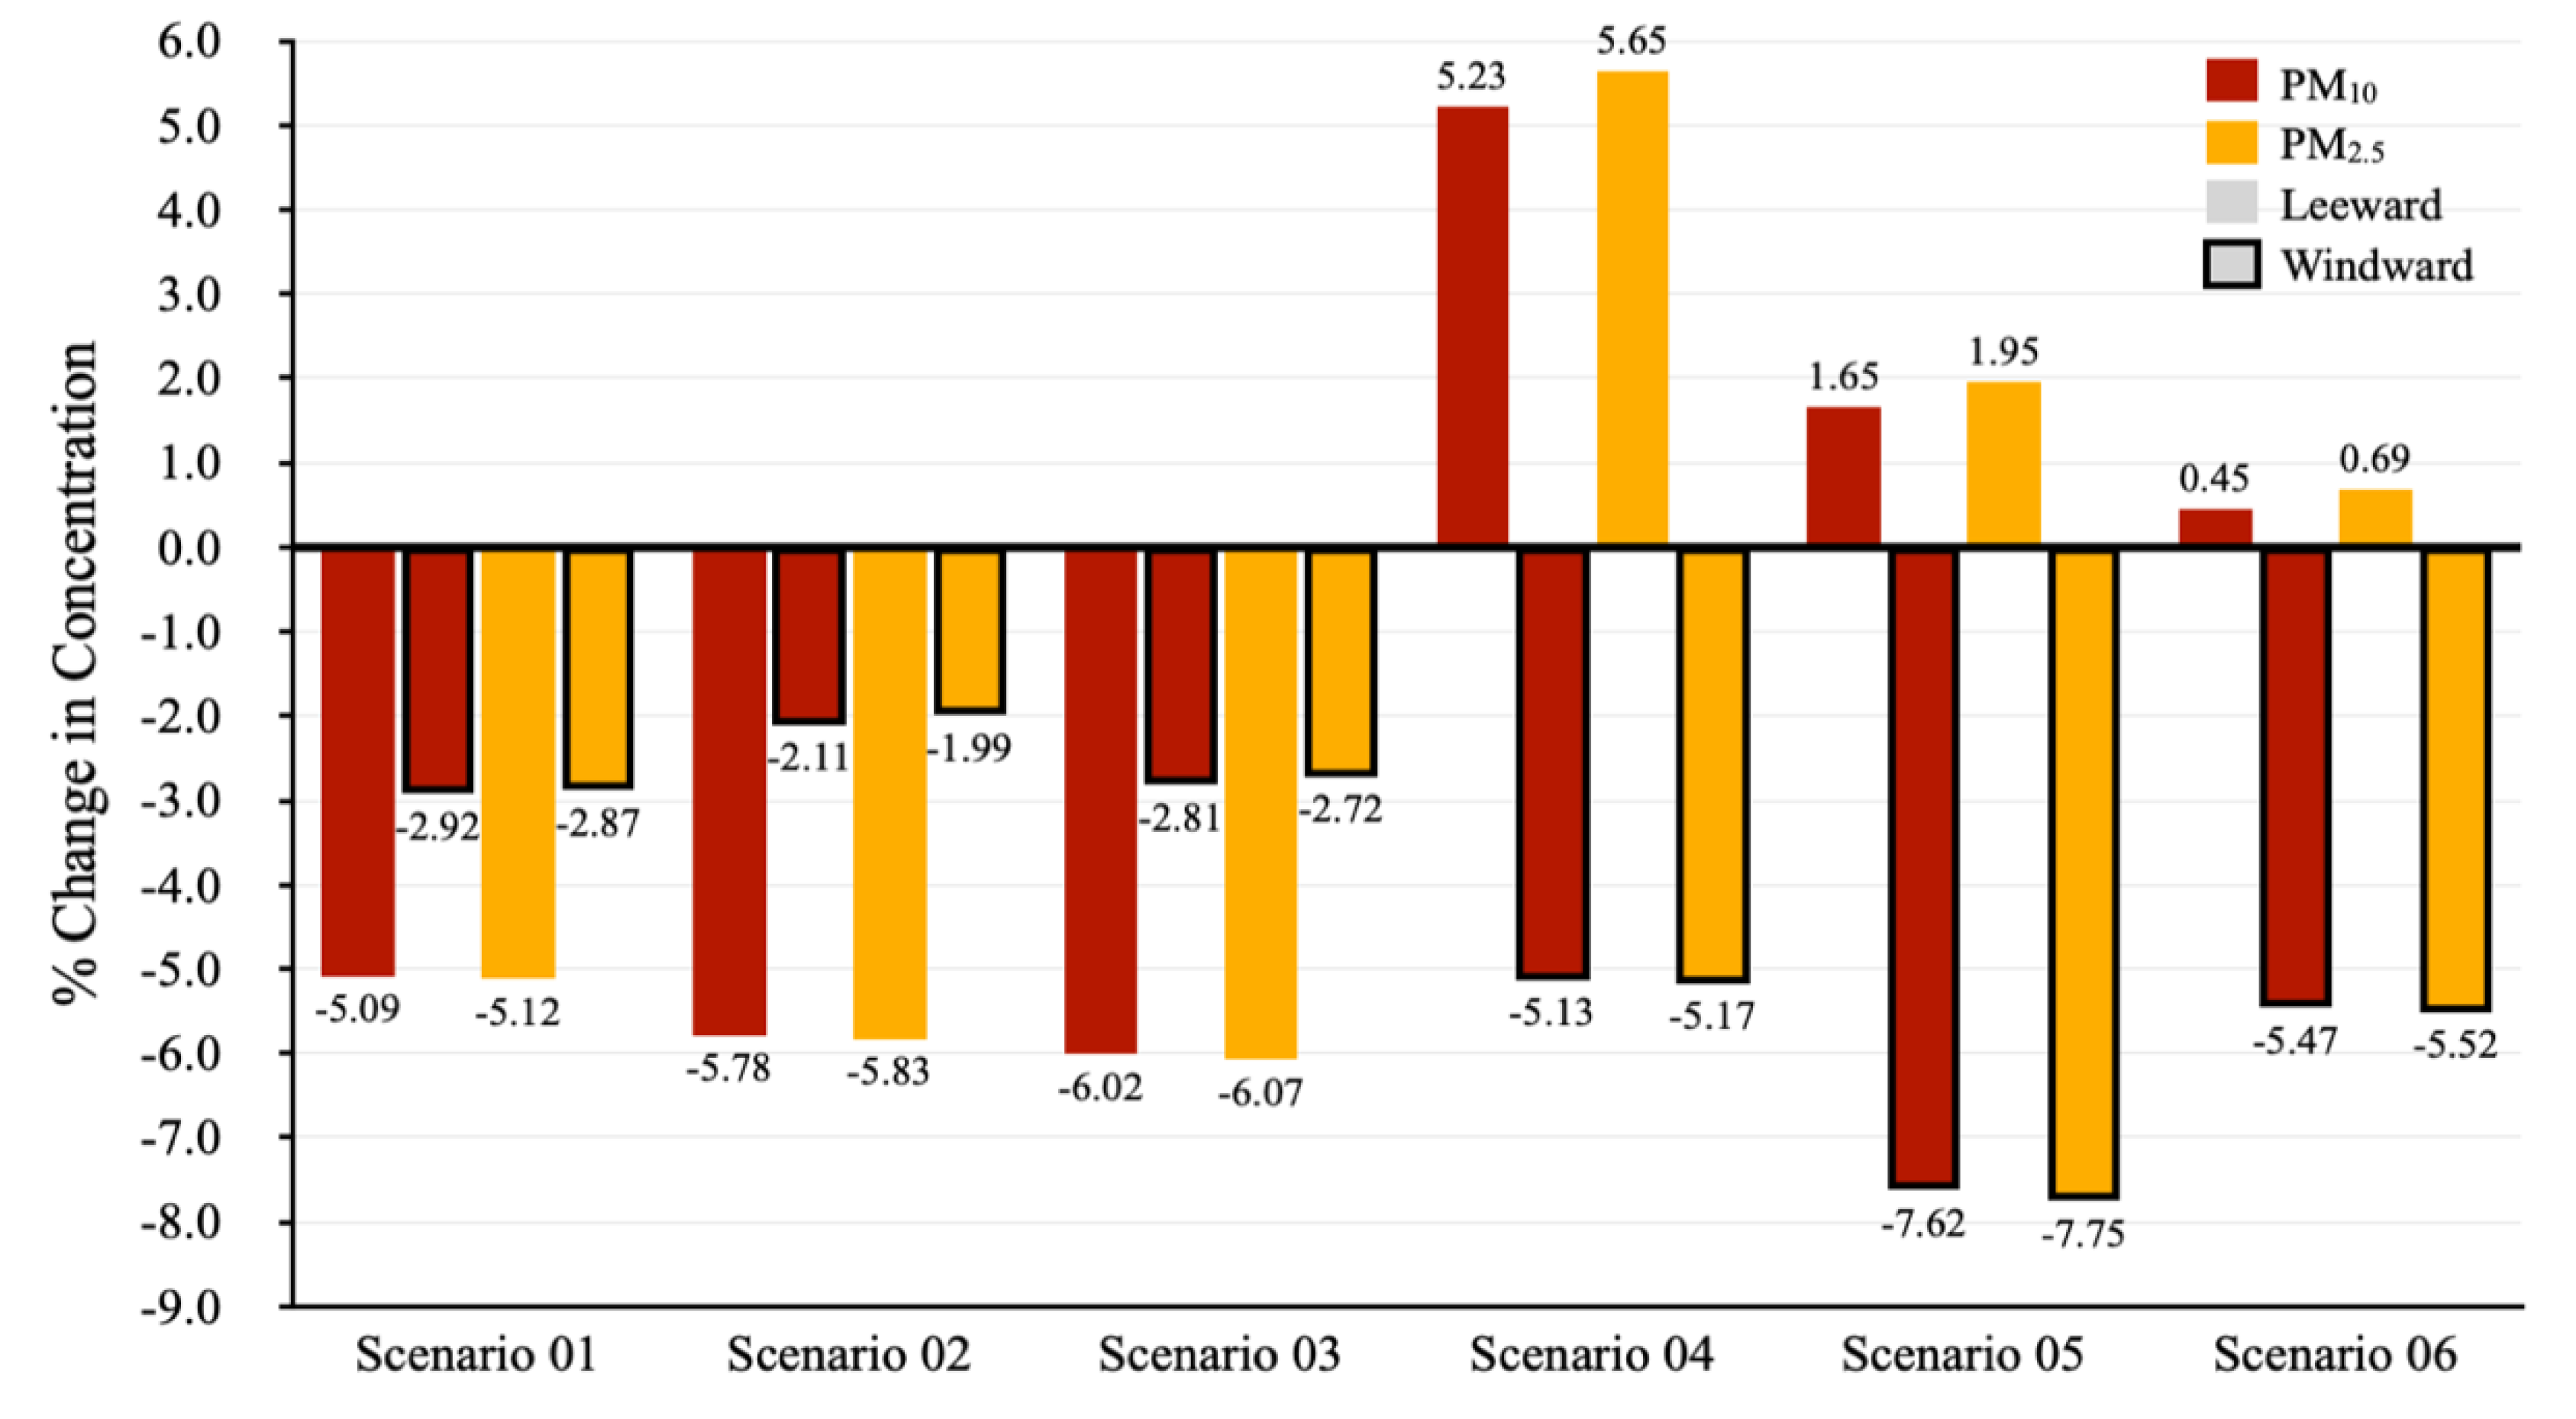
Figure 7 shows the relative difference in averaged PM
10 and PM
2.5 concentrations across windward and leeward receptors for the six scenarios. Negative values indicate pollutant reduction (improved air quality), while positive values indicate deterioration. All scenarios showed similar behaviour for both PM
10 and PM
2.5, with the most pollutant reductions observed around the vegetated pavements.
Previous studies show that avenues like street canyons with perpendicular wind typically experience higher particle concentrations on the leeward side and lower concentrations on the windward side, as windward vegetation disrupts air flow within the canyon, creating vortices that trap pollutants on the leeward pavement [
39,
50] In line with this, windward tree scenarios (S-04, S-05, S-06) significantly reduced PM on their respective windward side, while simultaneously deteriorating the air quality on the leeward side. Smaller gaps between windward trees, however, worsened leeward air quality. Conversely, increasing the canopy gap from 1.2m to 6m initially improved windward air quality, but expanding the gap to 10m did not show further benefits, suggesting a potential threshold point for increasing canopy gaps to improve air quality.
Leeward scenarios (S-01, S-02, S-03), however, reduced PM more effectively across the entire leeward pavement than windward scenarios. Furthermore, widening the canopy gaps between leeward trees further improved leeward air quality, likely due to higher wind turbulence which enhanced air circulation, aerodynamic effect, and particle dispersion more effectively [
29,
47,
49]. However, its impact on the windward air quality showed variations with increasing gaps, possibly due to changes in wind vortex patterns caused by the specific configuration.
Overall, leeward scenarios outperformed both the base scenario and windward scenarios. Notably, S-03, with its wider canopy gaps, significantly reduced particle concentrations, highlighting the positive influence of strategic tree spacing on air quality.
3.2.2. Temporal Distribution of Particles in the Street Canyon
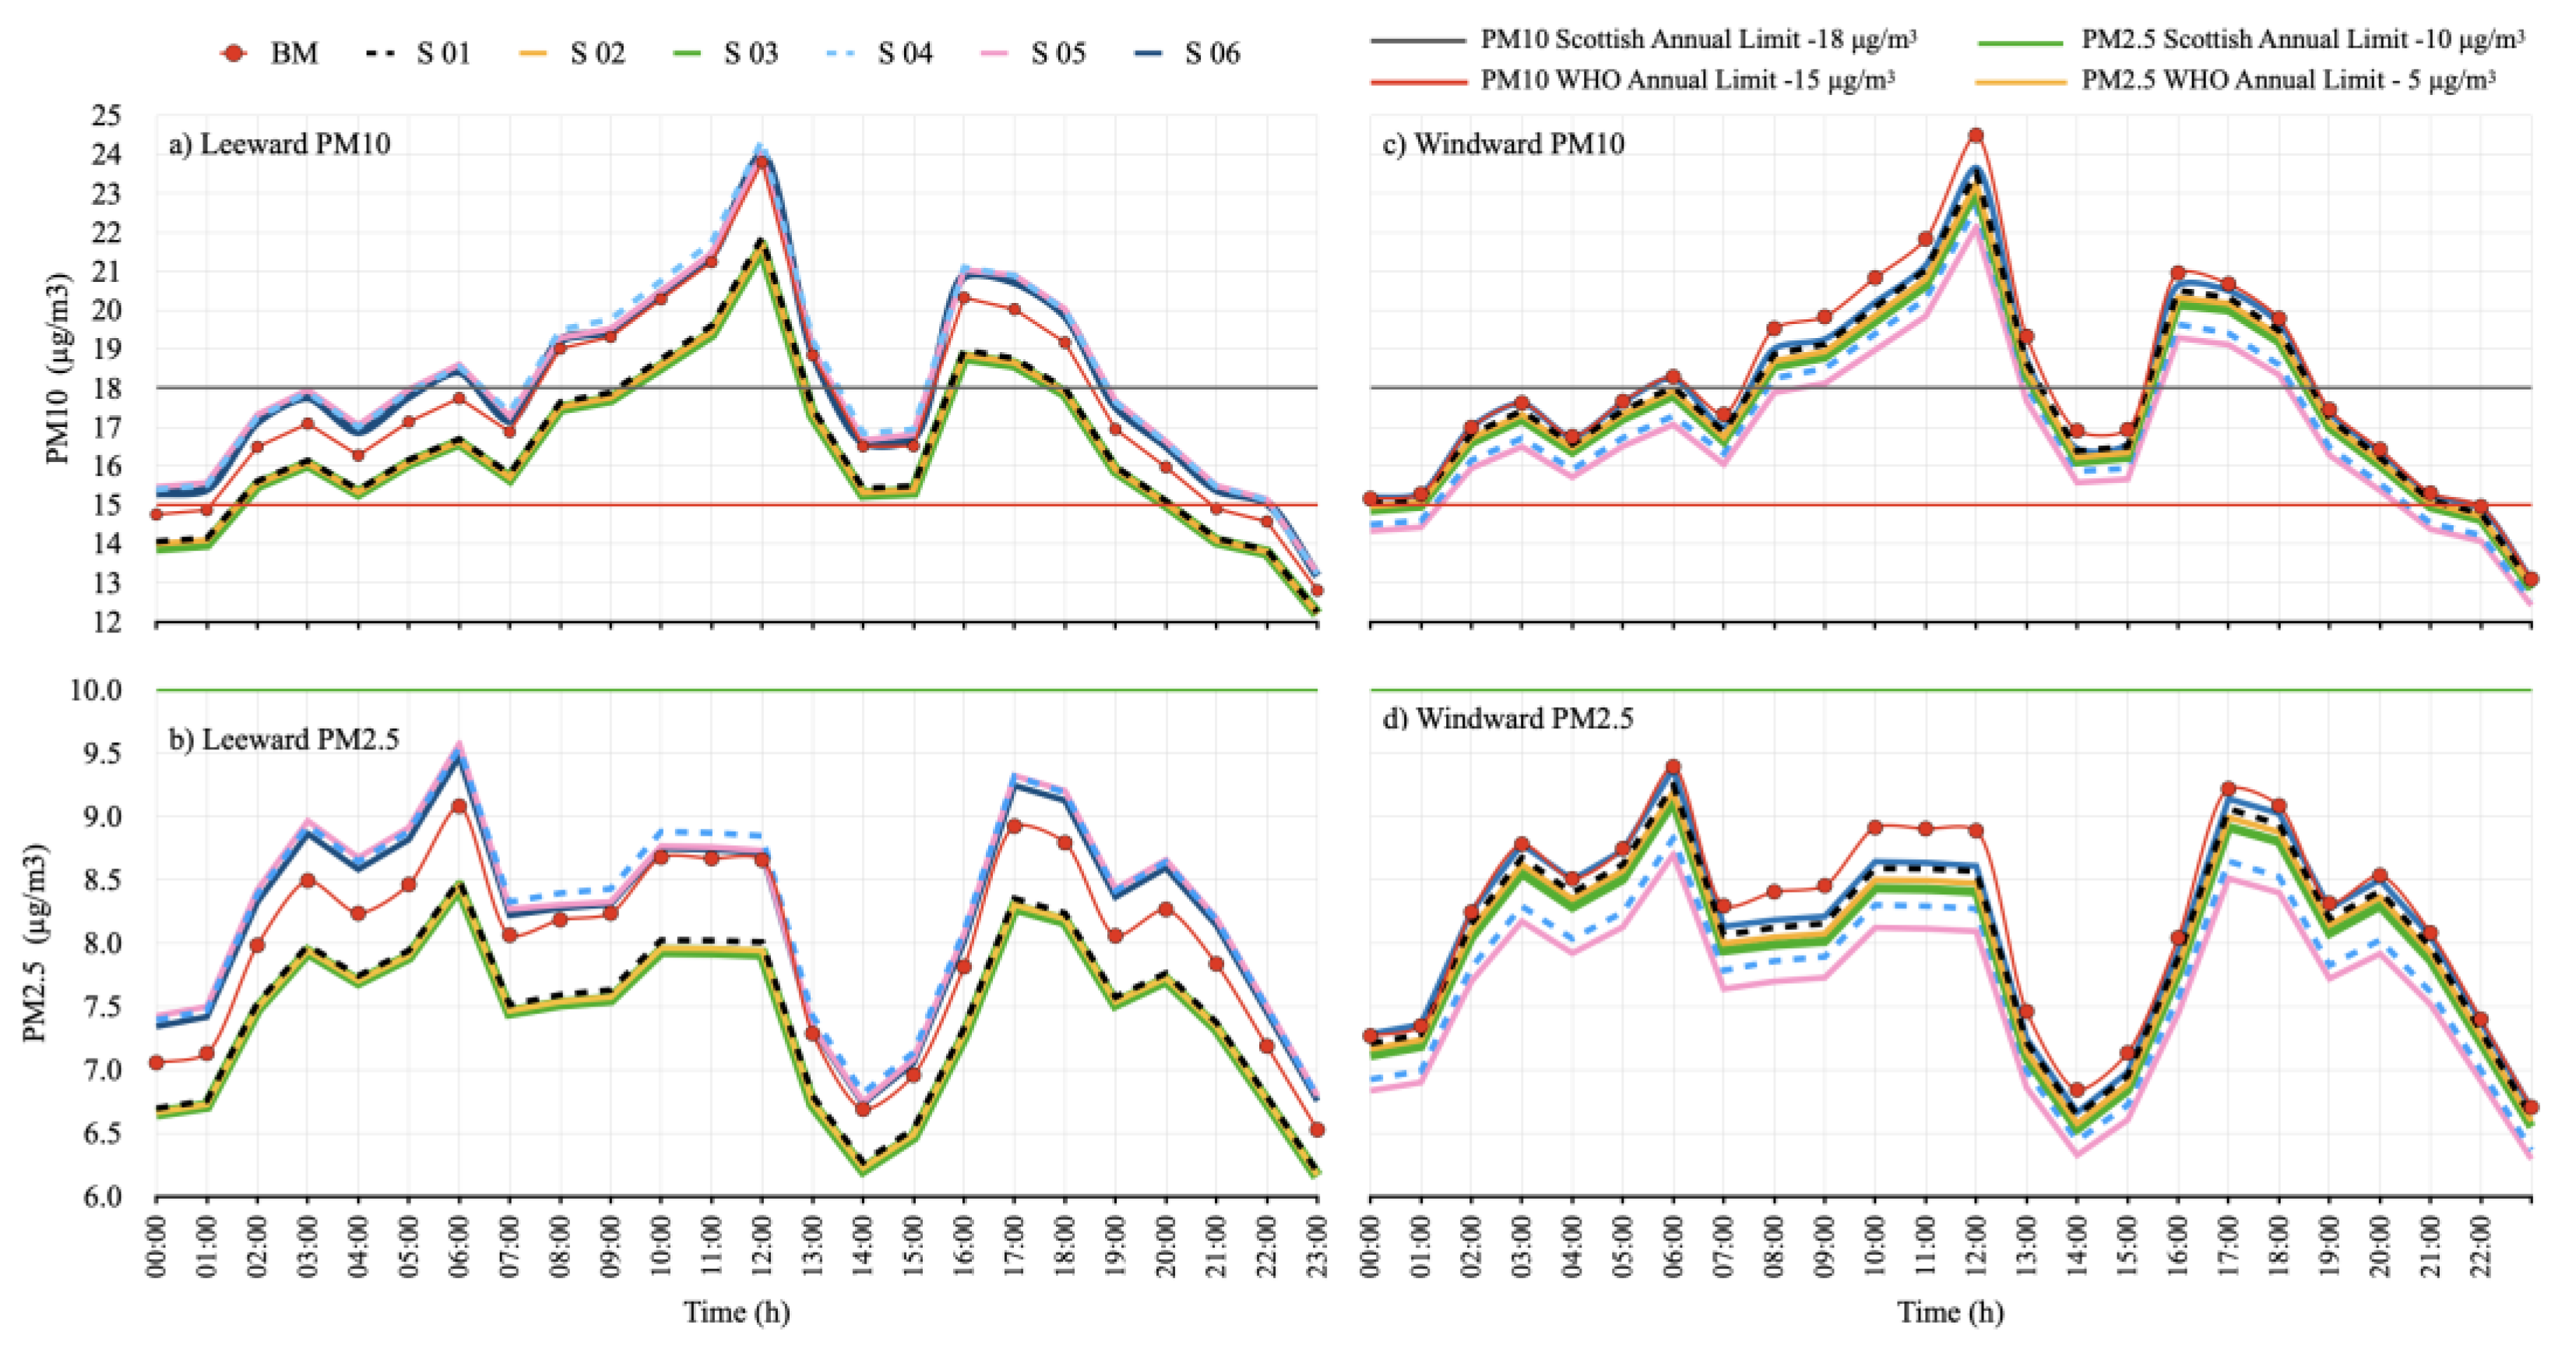
Figure 8a and
8b illustrates the impact of tree placement on hourly leeward particle concentrations, compared to the base model (BM). Unlike windward scenarios, leeward trees significantly reduced both PM
10 and PM
2.5 concentrations relative to the BM. However, both PM
10 and PM
2.5 exceeded WHO limits throughout the day across all scenarios. PM
10 concentrations surpassed Scottish legal limits during peak traffic hours (7:00h-13:00h and 15:30h-18:30h), while PM
2.5 concentrations remained within legal limits throughout the day. Overall, scenarios S-01, S-20 and S-03 consistently exhibited lower concentration levels compared to both the base model and windward scenarios, highlighting their efficacy in improving leeward air quality.
Figure 8c and 8d reveals improved windward air quality under all scenarios compared to the BM, regardless of tree placements or canopy gap sizes. PM
10 concentrations exceeded Scottish legal limits during peak hours, while windward PM
2.5 levels fell within the Scottish legal limit (10 μg/m³) throughout the day. Notably, both PM
10 and PM
2.5 concentrations exceeded WHO limits throughout the day.
3.2.3. Spatial Distribution of Particles in a Street Canyon
Tree placement significantly influences air quality, but its effectiveness depends on the canyon geometry. As seen in
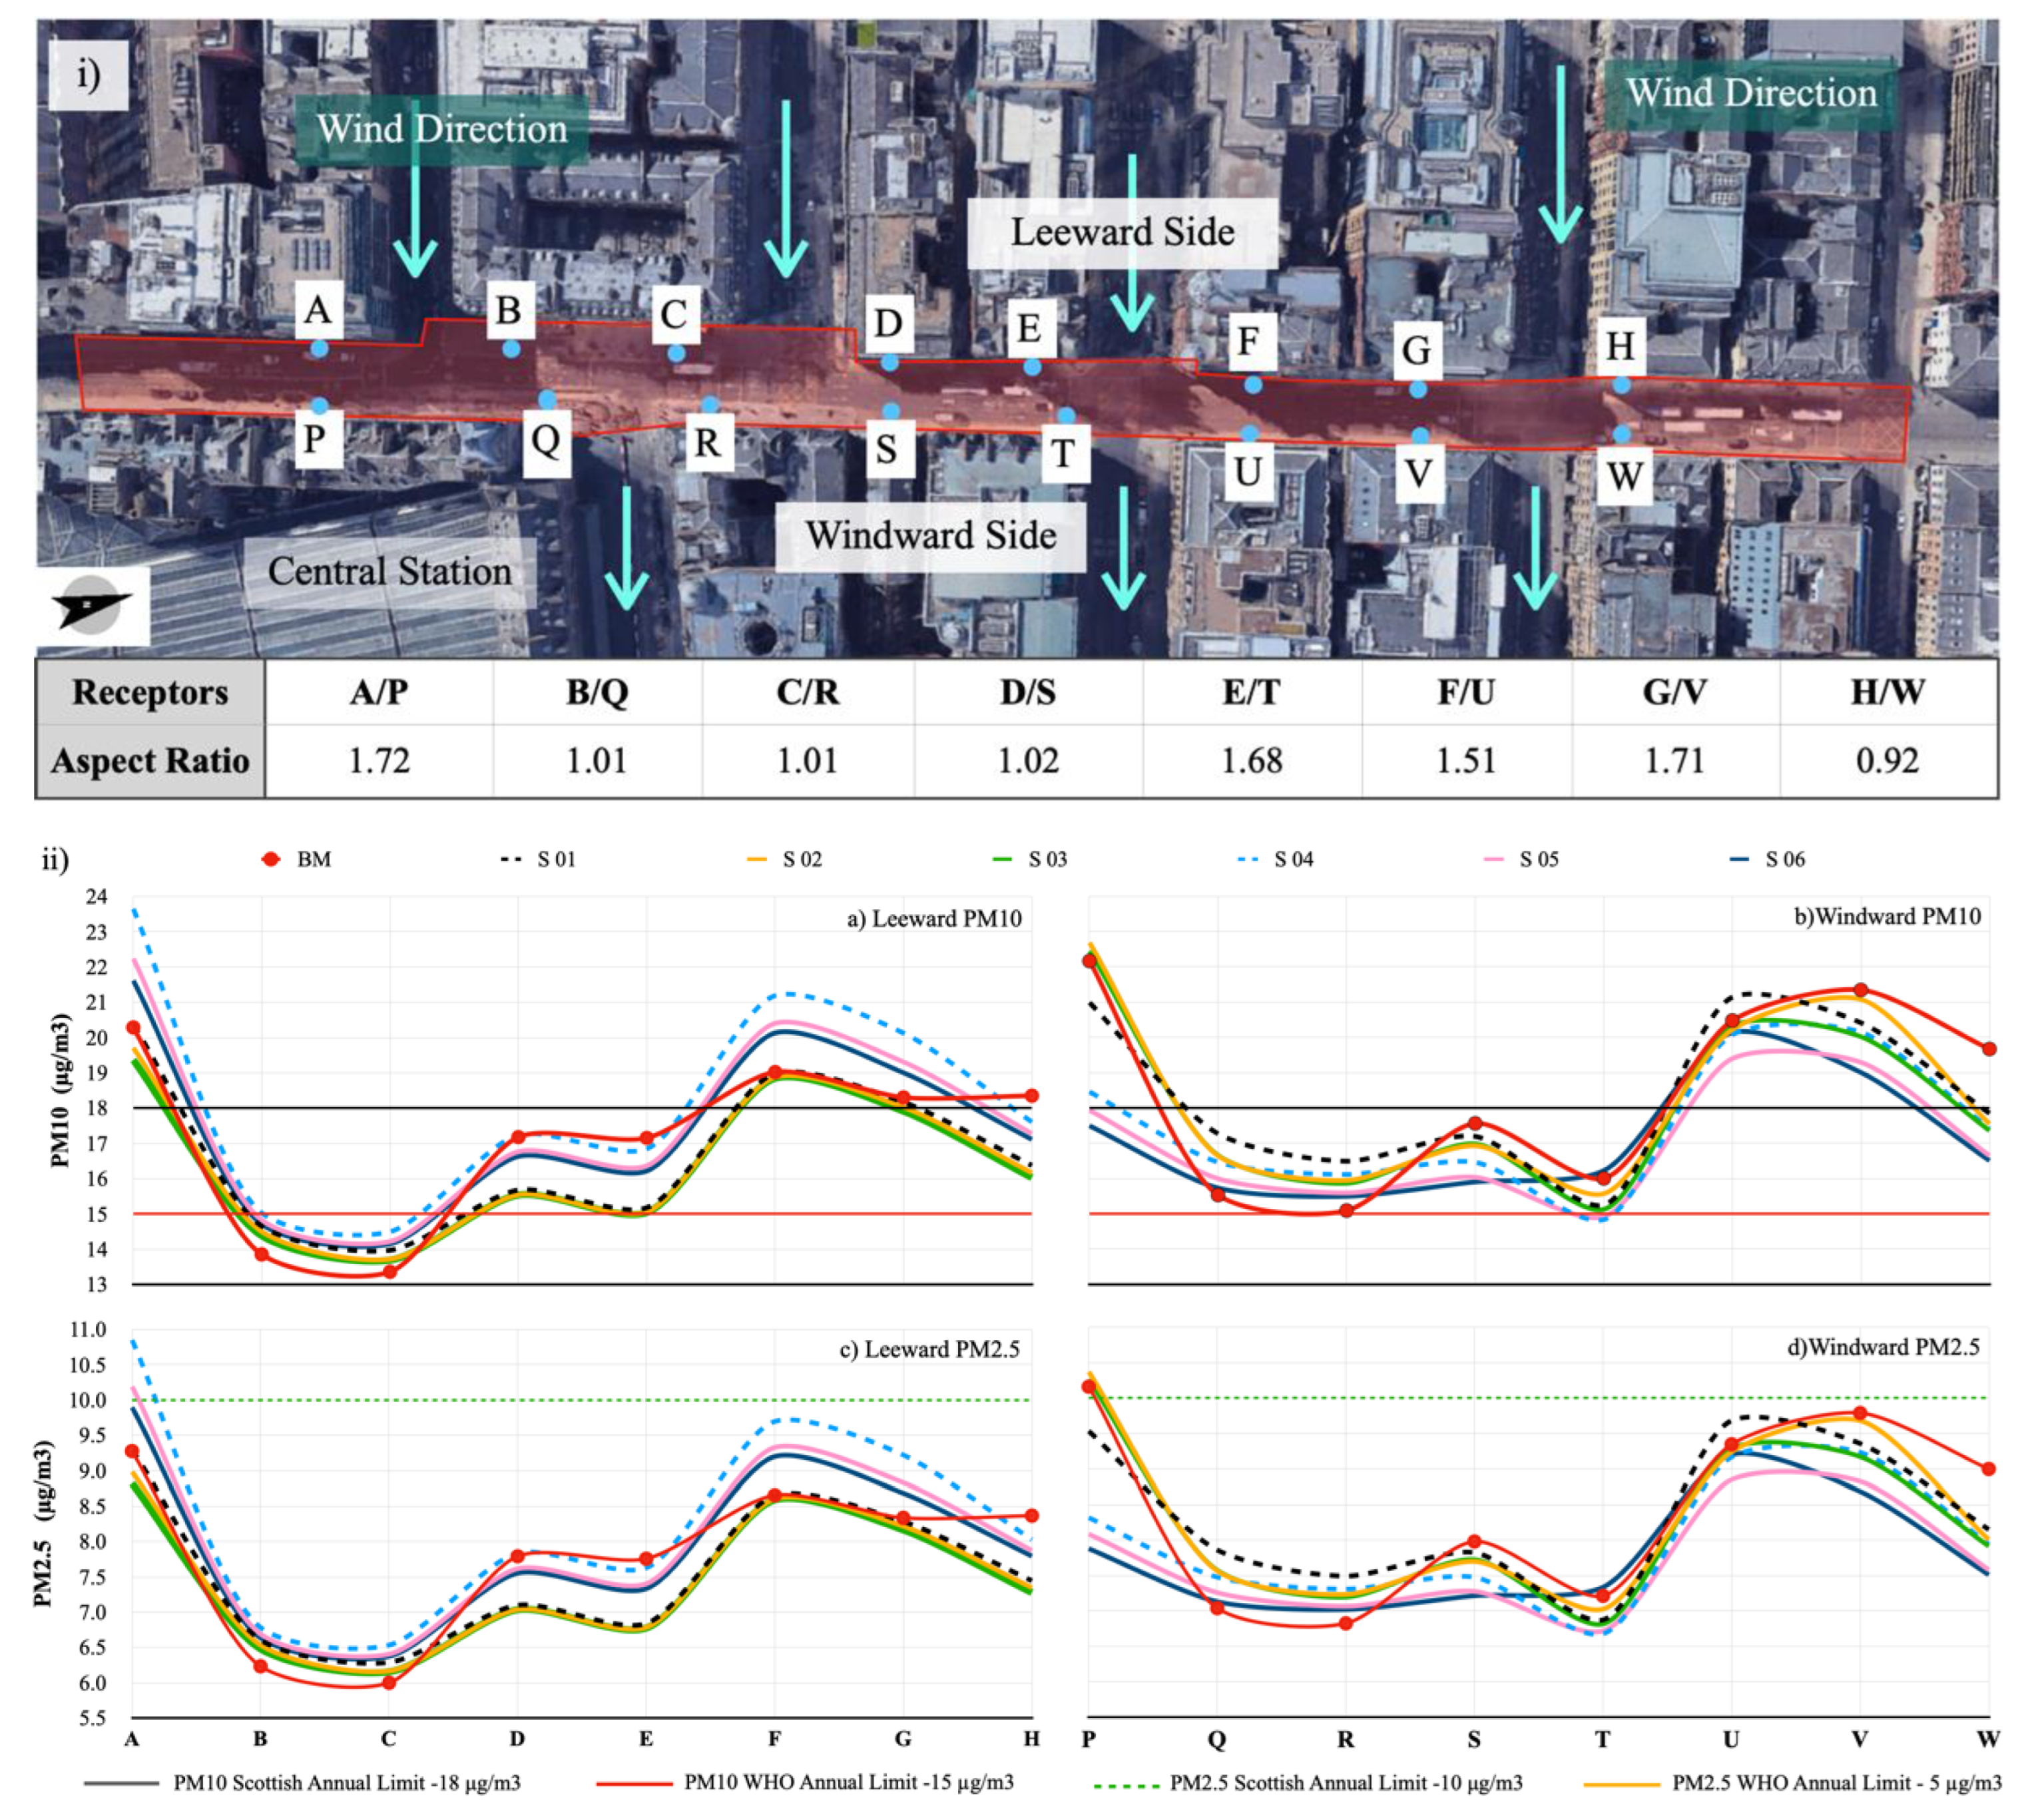
Figure 9, receptors near shallow canyon intersection appear to have achieved maximum particle reduction without trees. However, introducing trees have led to particle accumulation and worsened air quality in these areas (e.g., B and C on the leeward side, Q and R on the windward side).
Within deeper canyons, leeward air quality at receptors A, F and G remained unaffected by leeward trees, but deteriorated with windward trees compared to the base model. Windward receptors (P, U, V) generally benefited with windward trees with slight deteriorations at specific receptors with leeward trees. This trend suggests that trees in deeper canyons can reduce wind speed, potentially causing particle accumulation. However, scenarios with 10m canopy gaps (S-03 and S-06) reduced most particles from the respective tree placement sides (leeward and windward), highlighting that planting trees in deeper canyons need strategic placement to maximise air quality enhancement.
Conversely, trees seem to improve air quality at receptors near intersections (D, E, H on the leeward side; S, T, W on the windward side), likely due to corner eddies and vortexes created by perpendicular winds that facilitate particle dispersion and deposition. In addition, PM10 concentrations remained within Scottish legal limits at shallower canyon receptors and near intersections (B, C, D, E, H, Q, R, S, T, W), whereas deeper canyon receptors (A, F, G, P, U, V) exceed these standards. Notably, all scenarios exceed the stricter WHO legal limits for both PM10 and PM2.5 on both sides of the street except at receptors B & C.
3.3. Case Study Analysis
Derived from the sensitivity analysis, this section investigated the impact of specific tree properties and wind directions on street level air quality using Scenario S-03 as a baseline. Therefore, all cases featured a row of leeward trees spaced 10m apart. Outputs were averaged across 08 specific leeward and windward receptors at a height of 1.8m.
3.3.1. Optimising Vegetation Configurations for Air Quality
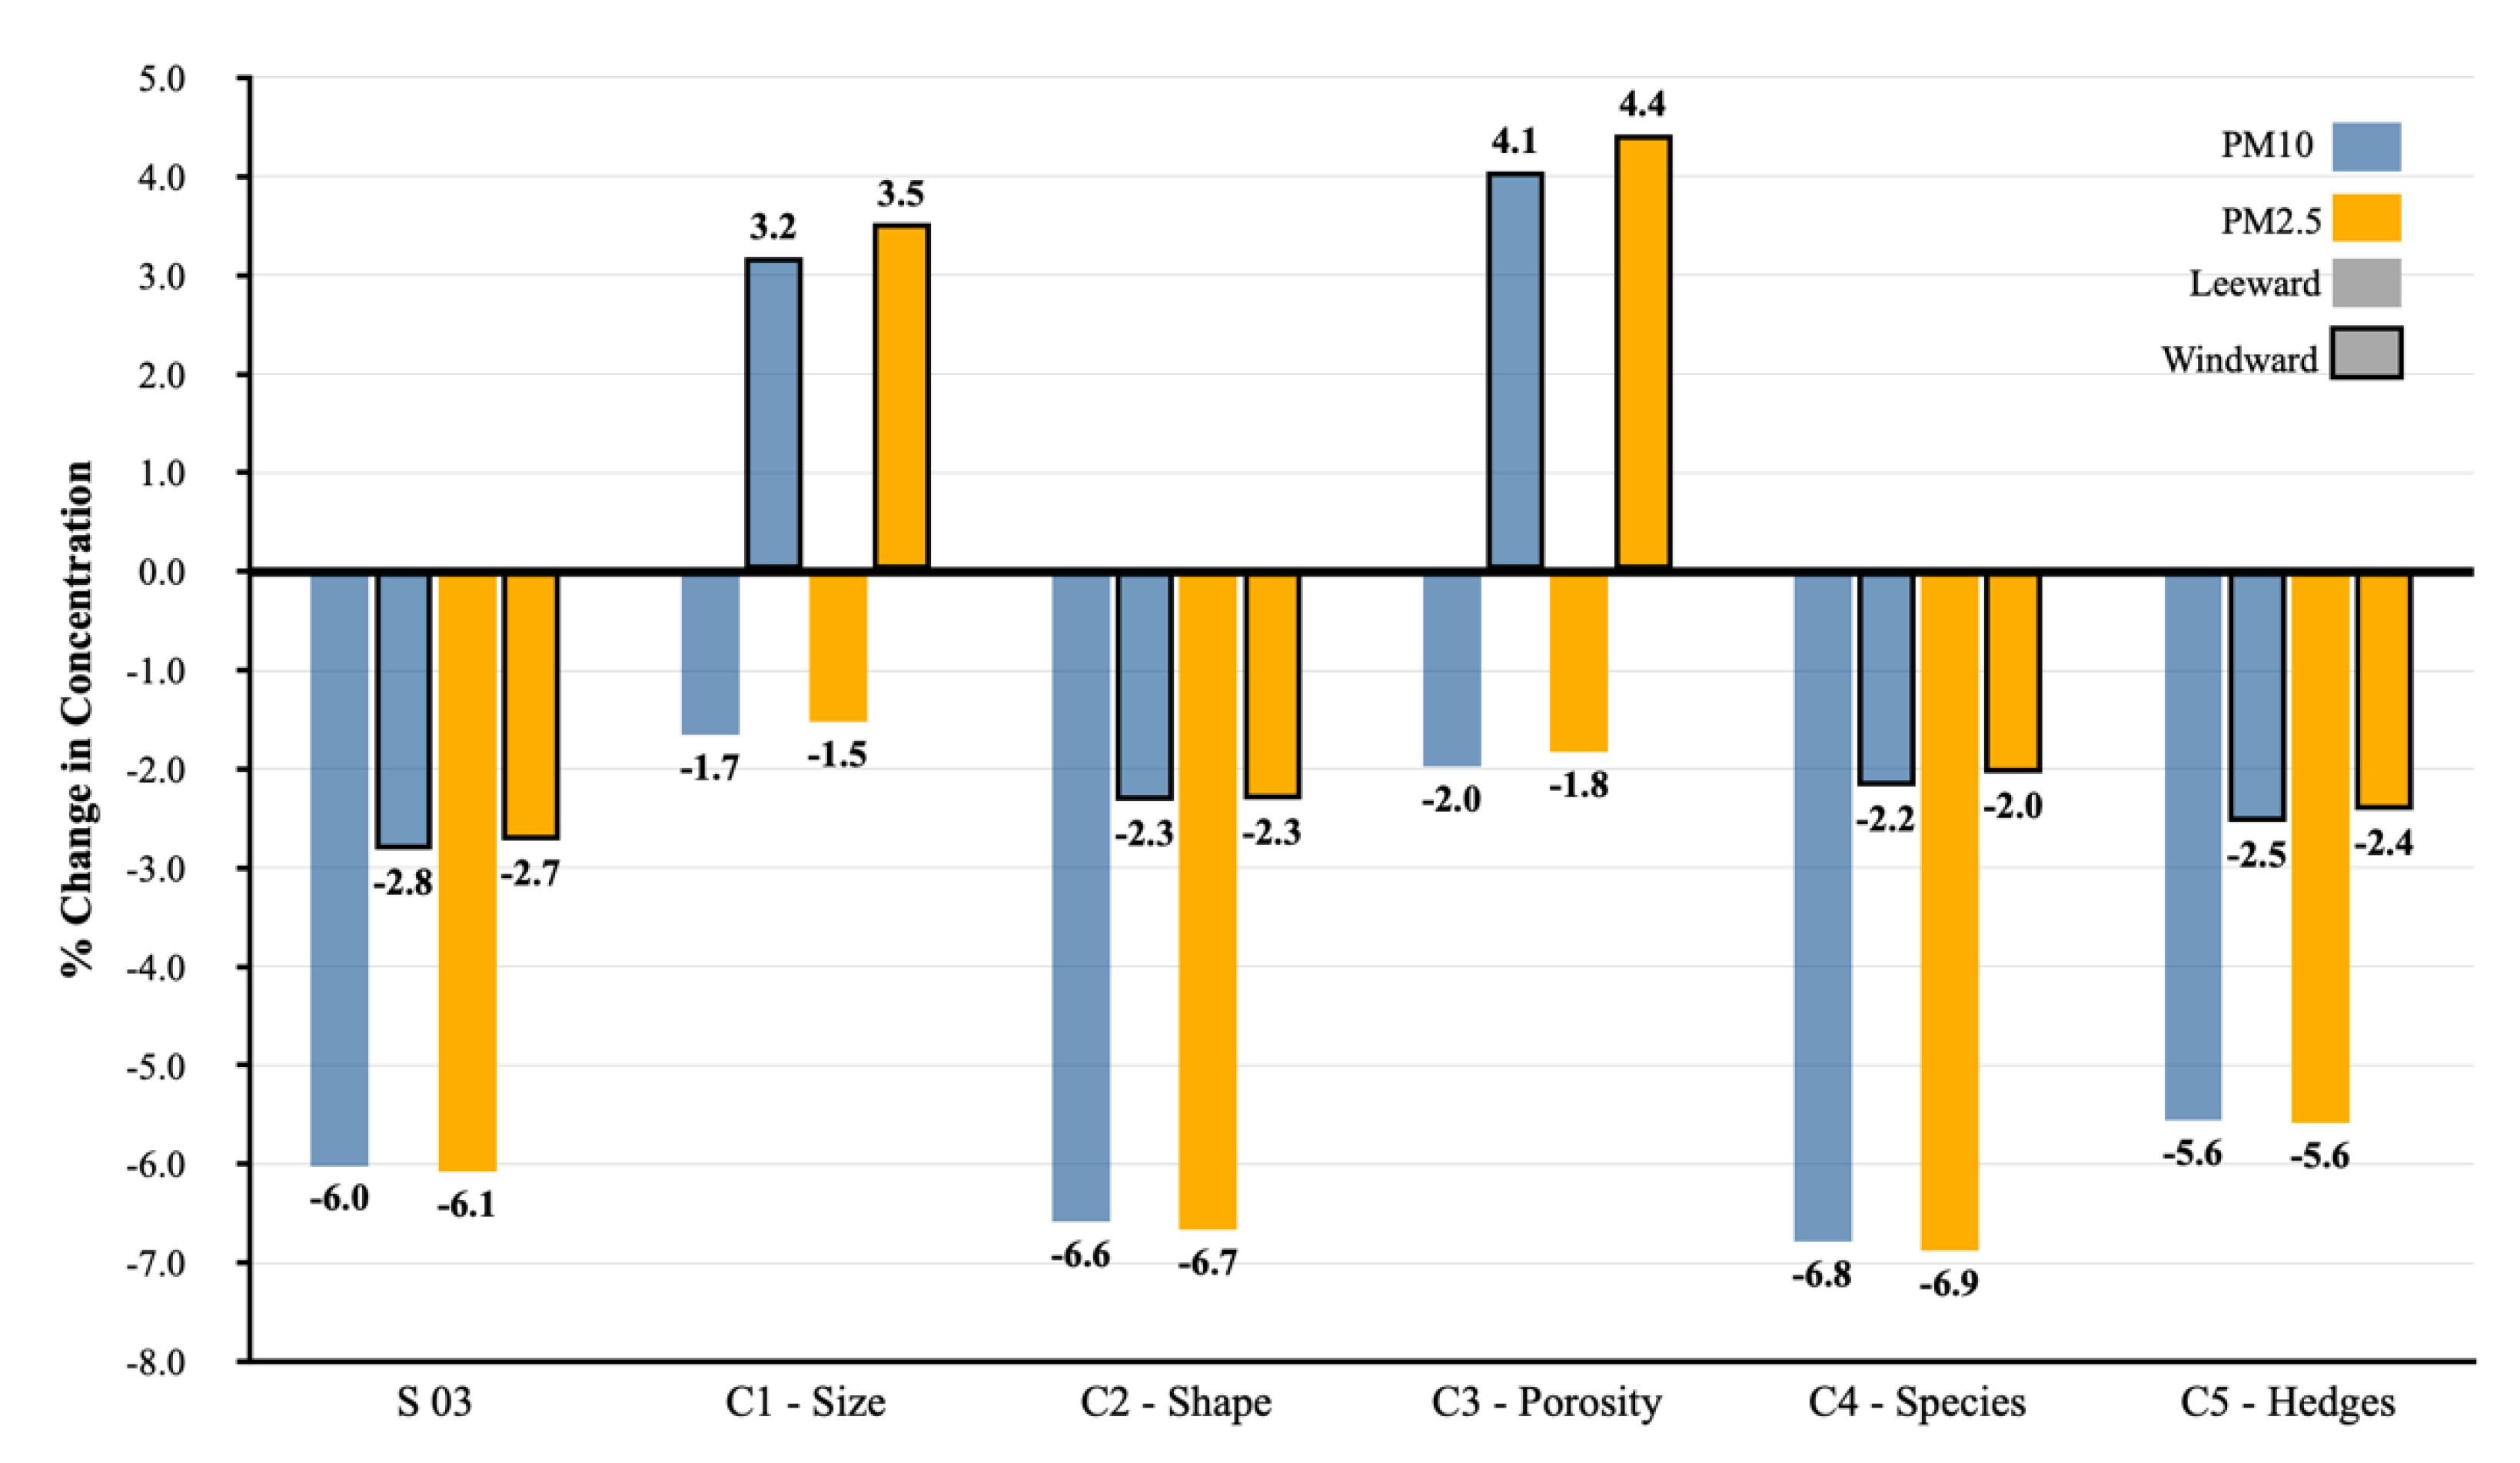
Figure 10 illustrates the relative difference in daily averaged particle concentrations in C1, C2, C3, C4 and C5 with reference to S-03.
The cases with increased tree size (C1) and reduced crown porosity (C3) led to higher overall particle concentrations compared to S-03. However, leeward concentrations on both cases were still improved compared to the BM likely due to enhanced deposition effect, but windward concentrations increased significantly, due to higher aerodynamic resistance of larger trees [
19,
50] and denser canopy acting like a barrier, causing particle accumulation [
1,
3,
21,
38]. In C1, the total deposition mass increased by 26 μg/m
3 compared to S-03, and the vertical profiles revealed higher particle concentrations in the middle of the street further emphasising the results. These two cases confirmed that larger and denser trees may weaken canyon ventilation and trap particles, especially during perpendicular winds, compared to smaller trees.
Modifying the crown shape from cylindrical to spherical (C2) and introducing alternative tree species (C4), however, yielded air quality improvements, similar to S-03, with higher reductions on the leeward side. This suggests that spherical crowns, with their potentially altered aerodynamic flow patterns, may offer slight advantages over cylindrical ones and selecting tree species based on their ecological characteristics and tolerance levels can offer significant advantages for air quality improvement. Notably, evergreen coniferous species like Pinus sylvestris offer year-round air cleansing, while deciduous species like
Tilia cordata and
Acer buergerianum provide larger surface areas for particle capture through their intricate leaf structures [
40]
Similarly, introducing hedges alongside the S-03 configuration (C5) improved air quality compared to the BM. However, C5's overall performance was slightly inferior to S-03, likely due to its higher aerodynamic resistance caused by the denser vegetation cover [
22]. Conversely, C5 showed a 52% higher total deposition mass compared to S-03, likely due to its higher surface area and proximity to pollution sources [
2,
50].
3.3.2. Street Geometry and Wind Direction Shaping Air Quality
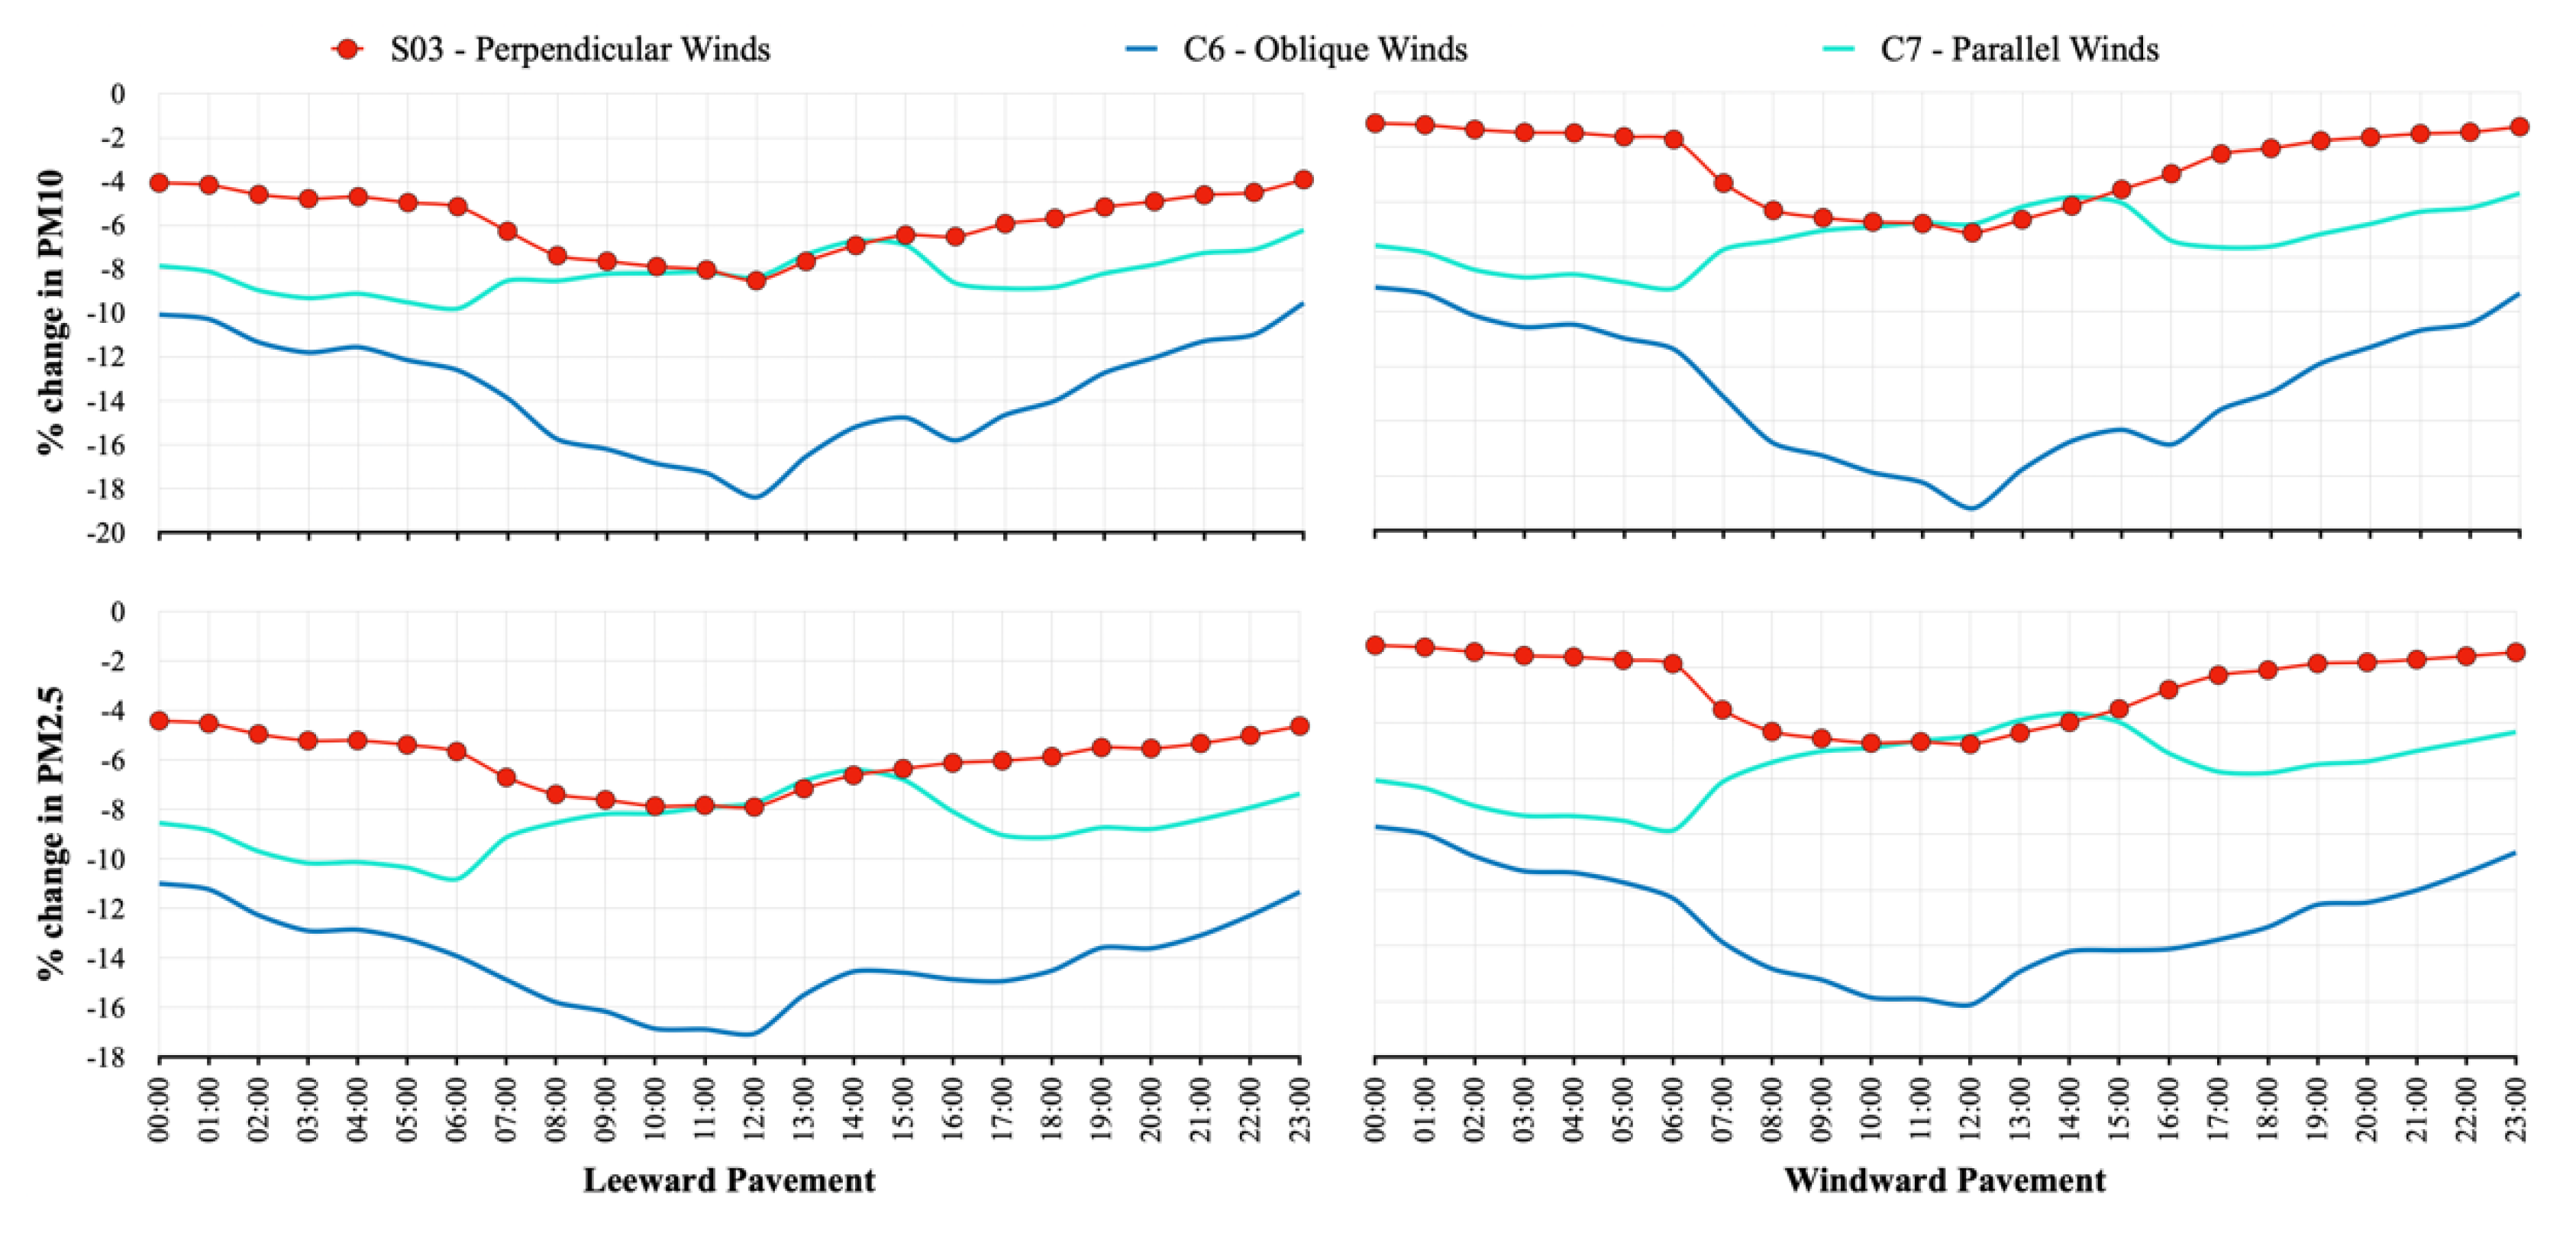
As shown in
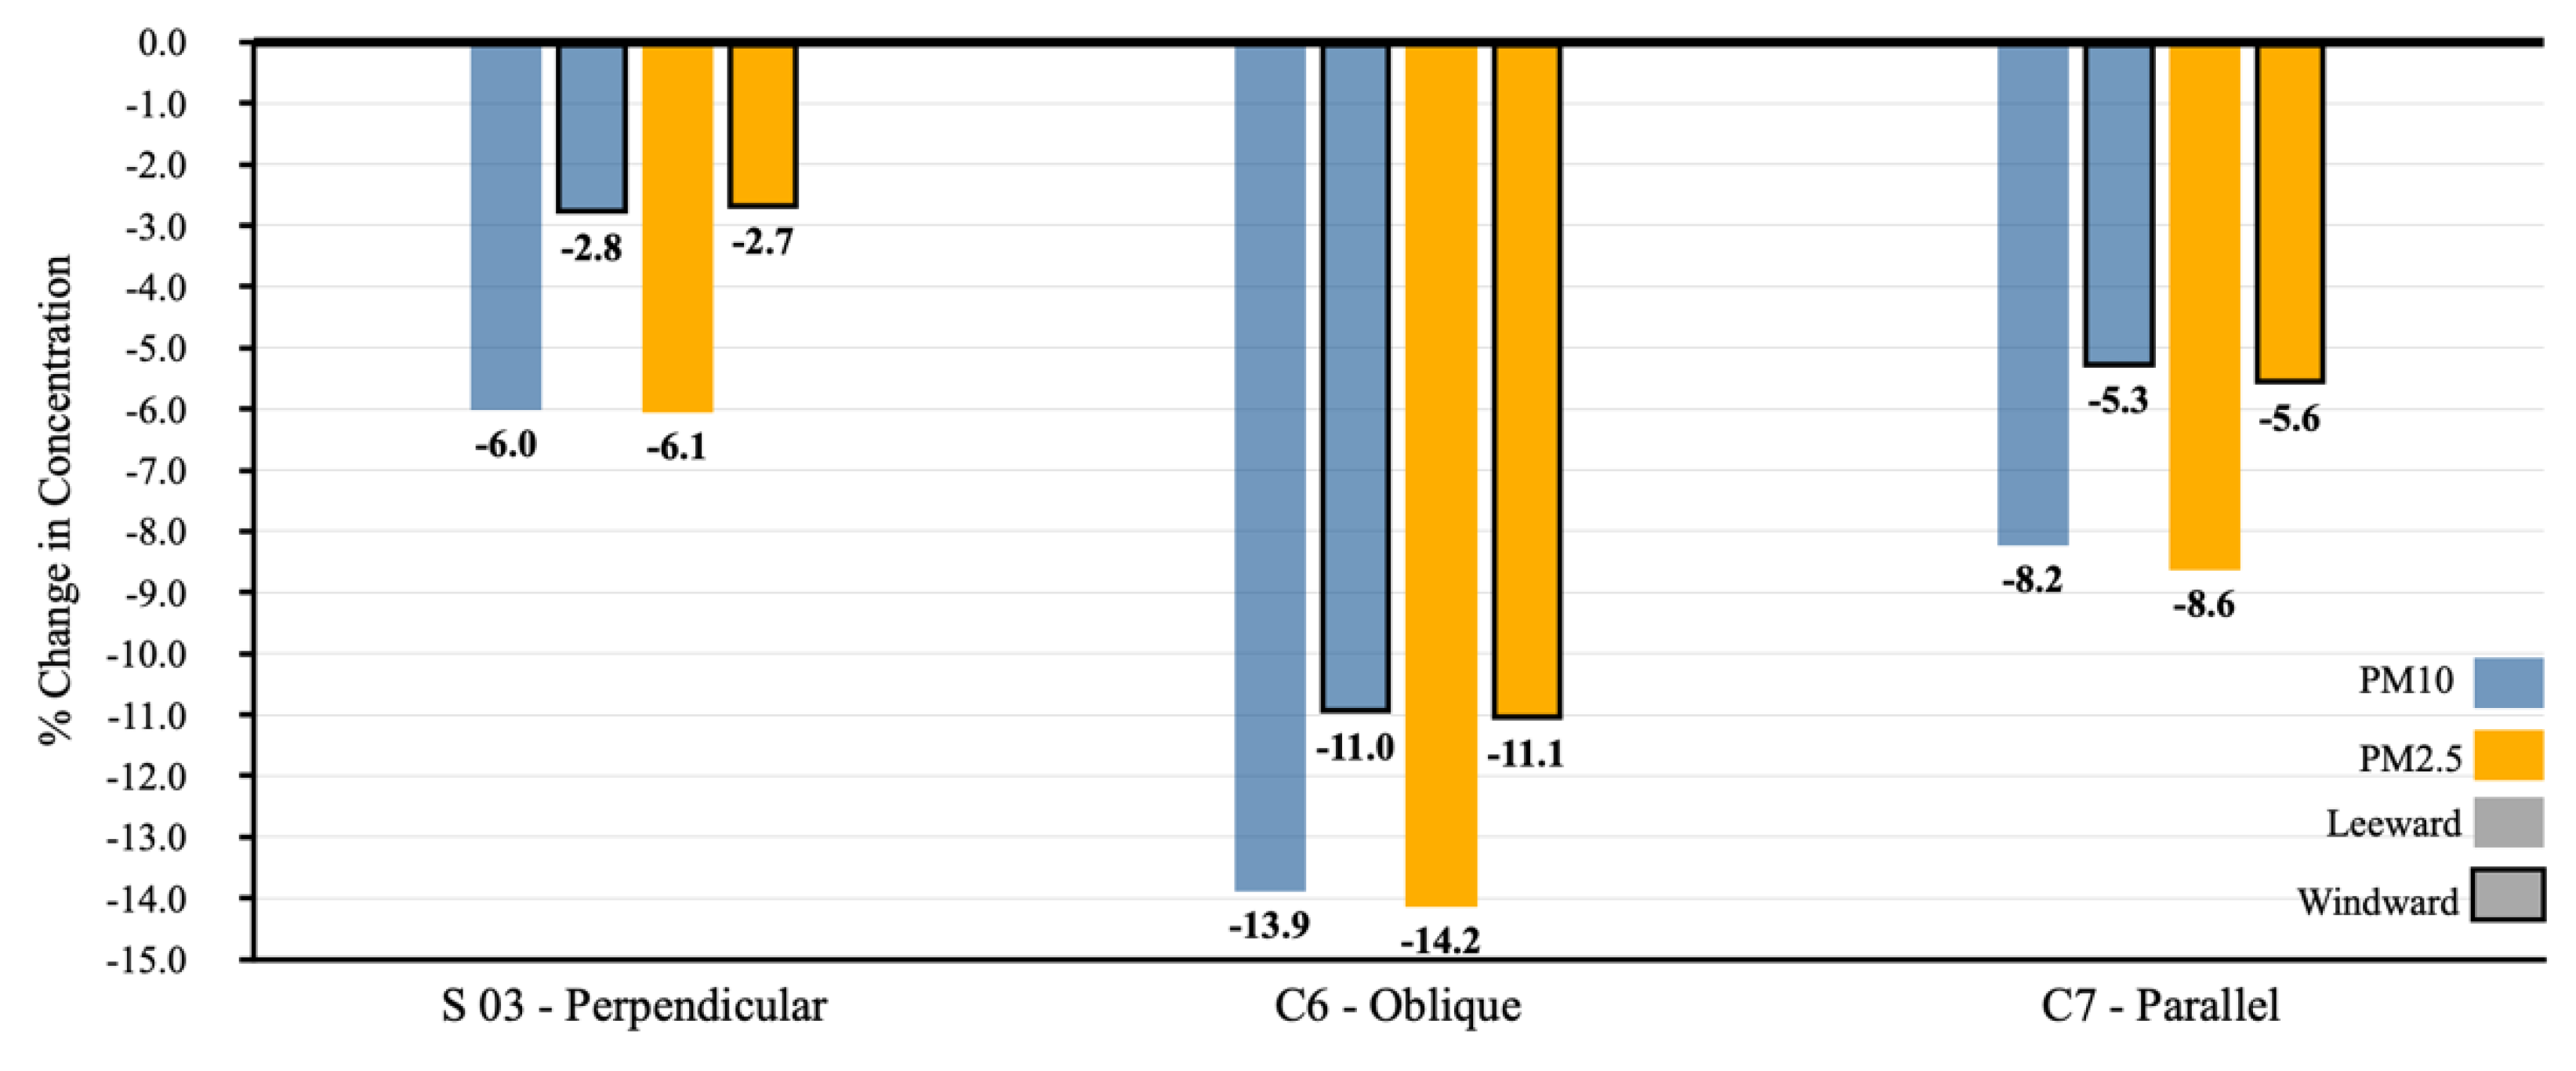
Figure 11 and 12, oblique (C6) winds led to the highest daily particle reduction throughout the street, including during peak hour (10:00 am - 3:00 pm), compared to parallel (C7) and perpendicular (S-03) winds. This aligns with existing literature, which attributes this benefit of oblique winds to the corkscrew flow pattern which arises from the interplay between superposition of horizontal wind blowing along the street axis, vertical obstructions such as trees and corner eddies near intersections [
5,
25].
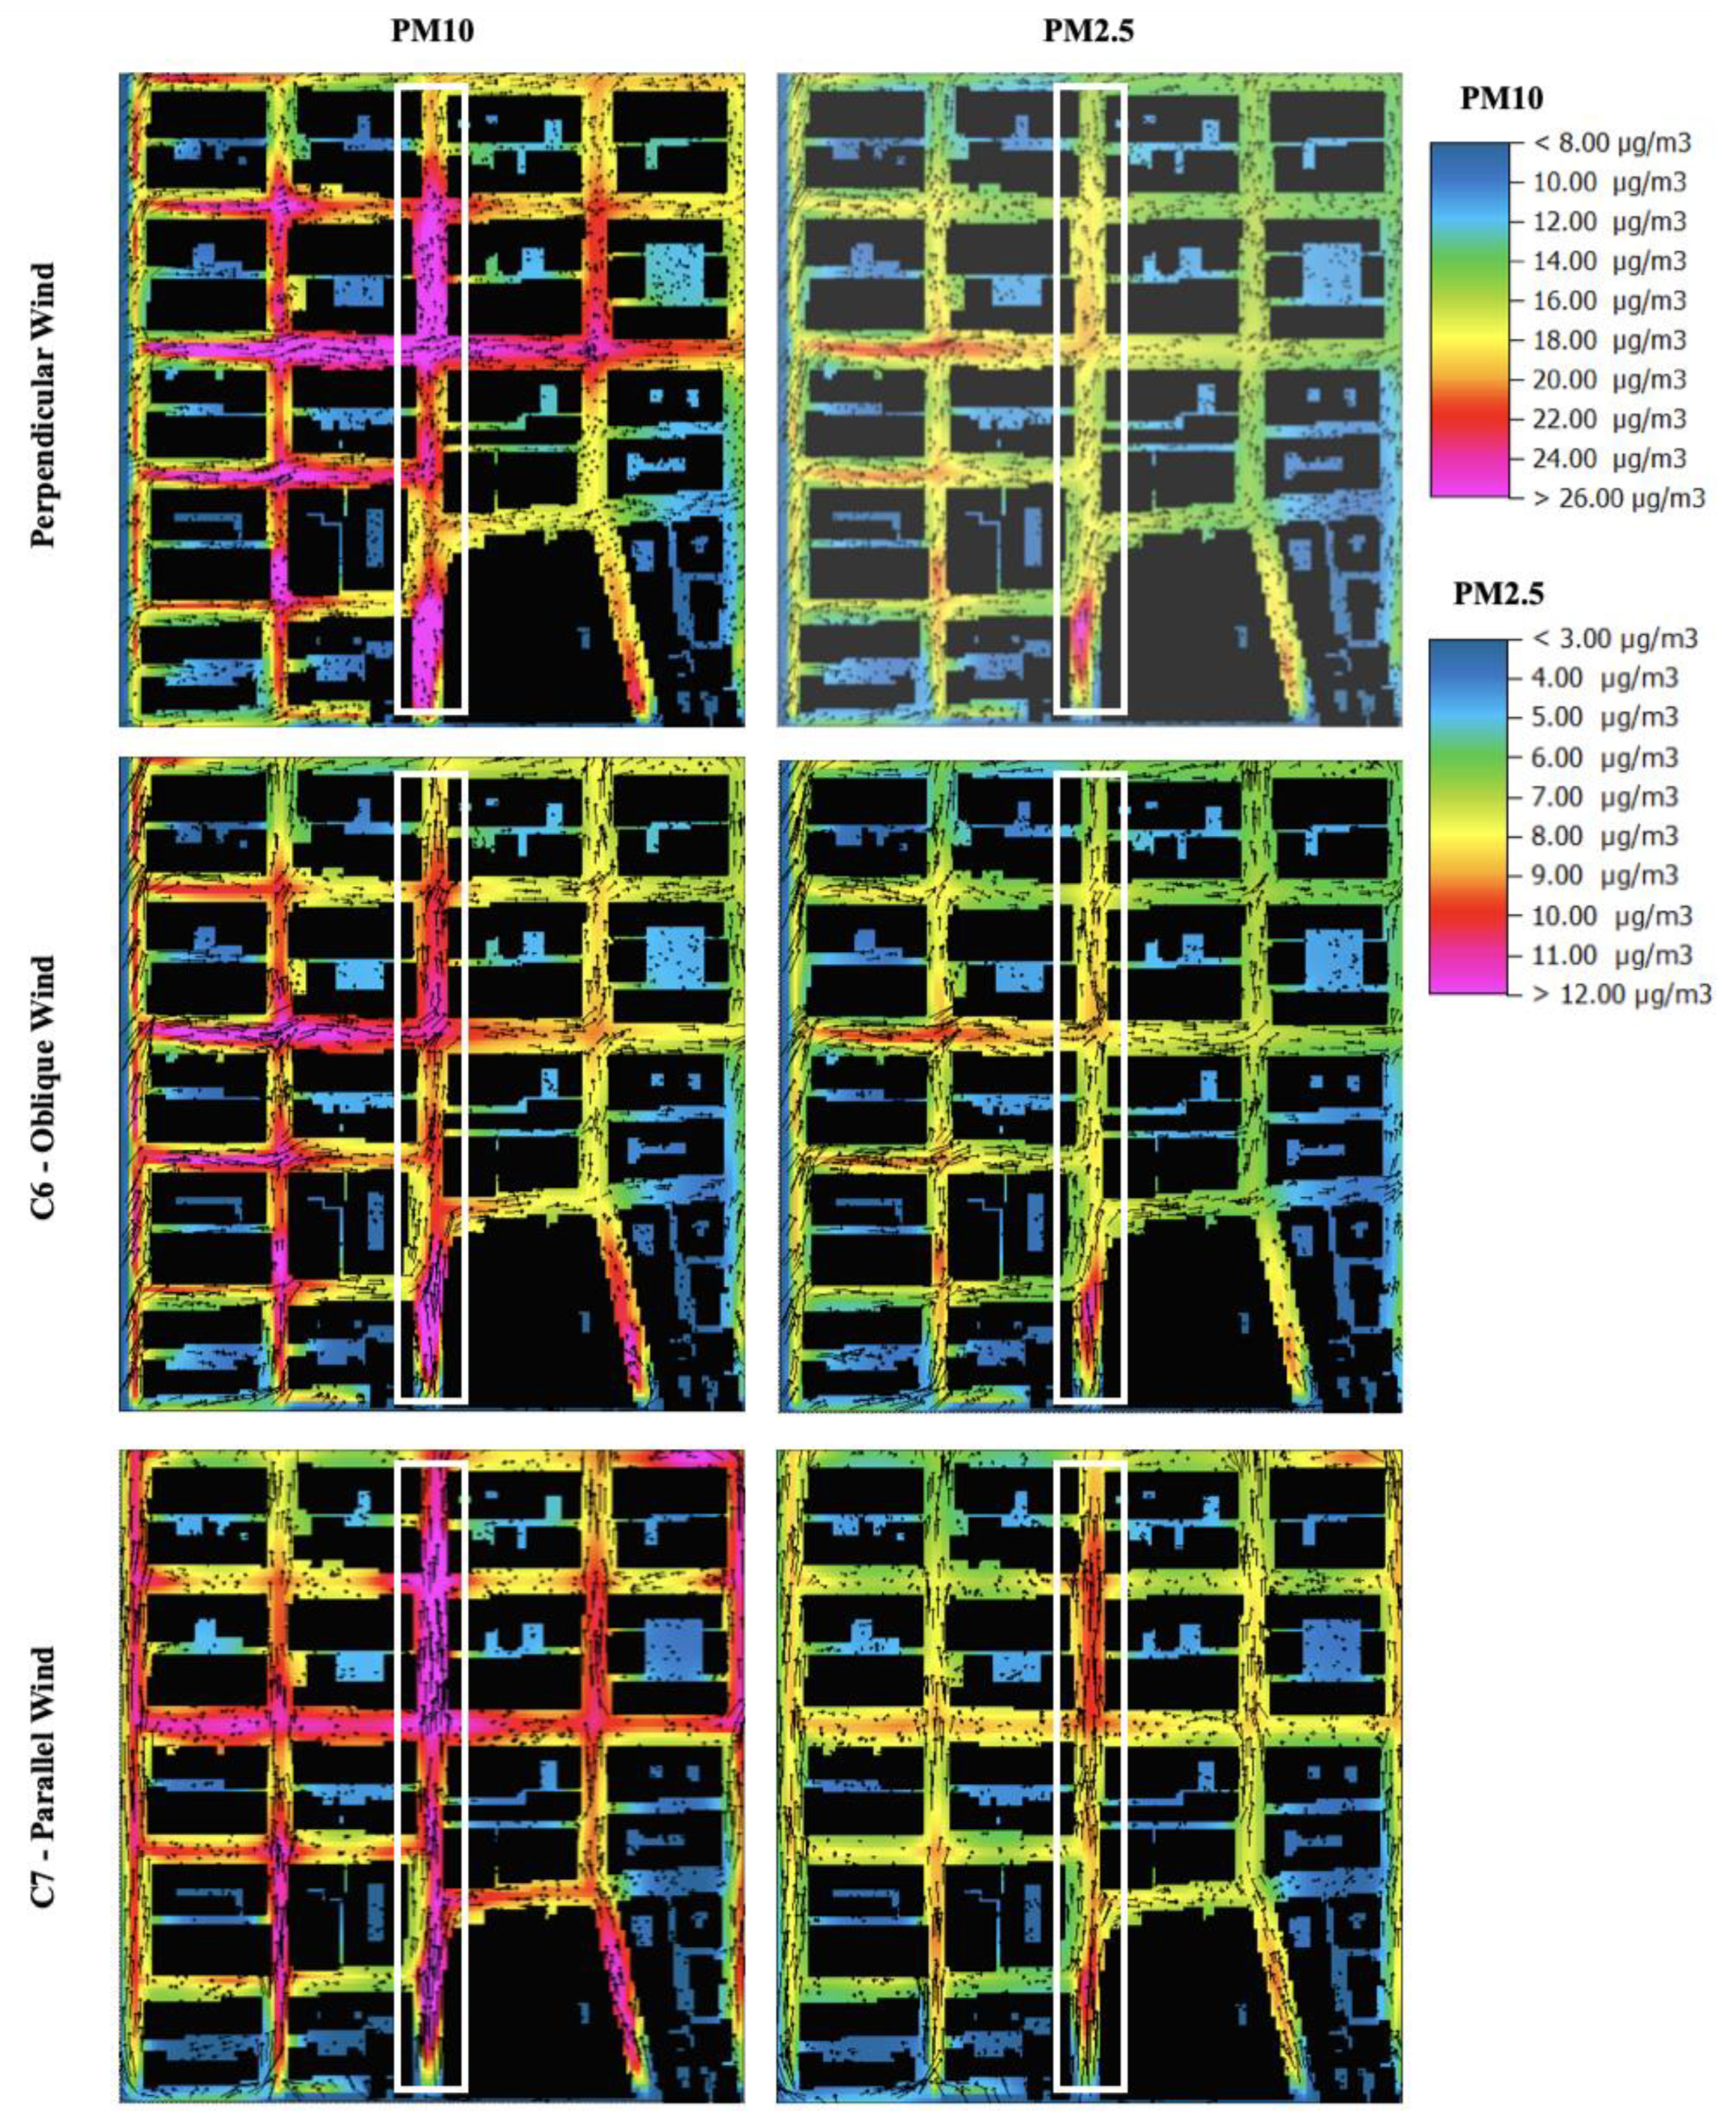
Parallel winds yielded mixed results, while offering overall daily particle reduction and potential drawbacks compared to perpendicular winds during peak traffic hours (10:00 am - 3:00 pm), as shown in
Figure 13. This inefficiency seemed to have occurred during peak hours when increased vehicles acted as a barrier and emitted more particles, intensifying pollutant at pedestrian levels. Additionally, presence of trees seems to have reduced the velocity of the horizontal flow, pushing particles along the canyon, creating stagnant zones with high concentrations towards the street end during peak hours.
Perpendicular winds offer the lowest overall daily particle reduction compared to both oblique and parallel winds. This can be attributed to two main factors: First, tree crowns blocking corner eddies crucial for dispersion [
20]; Second, west-to-east ambient winds occurring above the canyons disrupting the internal helical flow pattern within the canyon [
7], leading to higher concentrations.
Despite these challenges, S-03 tree configuration significantly improved air quality under all three wind directions, with leeward PM10 reductions up to 13.9% and leeward PM2.5 up to 14.2% compared to the BM. This makes S-03 an optimal choice for air quality enhancement in Hope Street.
4. Discussion
The fight against air pollution demands more than temporary solutions [
32,
42], especially in cities facing significant health concerns due to high PM levels. While existing research [
19,
20,
21,
50] has established a positive link between street trees and air quality improvement, it often lacks detailed analysis of optimal tree placement and impact on diverse pollutants. This study bridges this gap by analysing the interplay between street geometry, wind direction, and specific tree parameters to identify strategic tree configurations for maximising PM reduction in the complex urban setting of Hope Street, Glasgow.
This study confirms that trees are indeed an effective solution, capable of reducing PM by up to 28% under optimal conditions. It identified unique nature-based solutions for urban planners and policymakers, providing a strategic mix of tree types, spacing, and configurations tailored to Hope Street's diverse street geometry. These strategies provide a roadmap for Glasgow's Avenues Programme and Cycle by Design, contributing to its ambitious goal of becoming a climate-resilient, sustainable city by 2036.
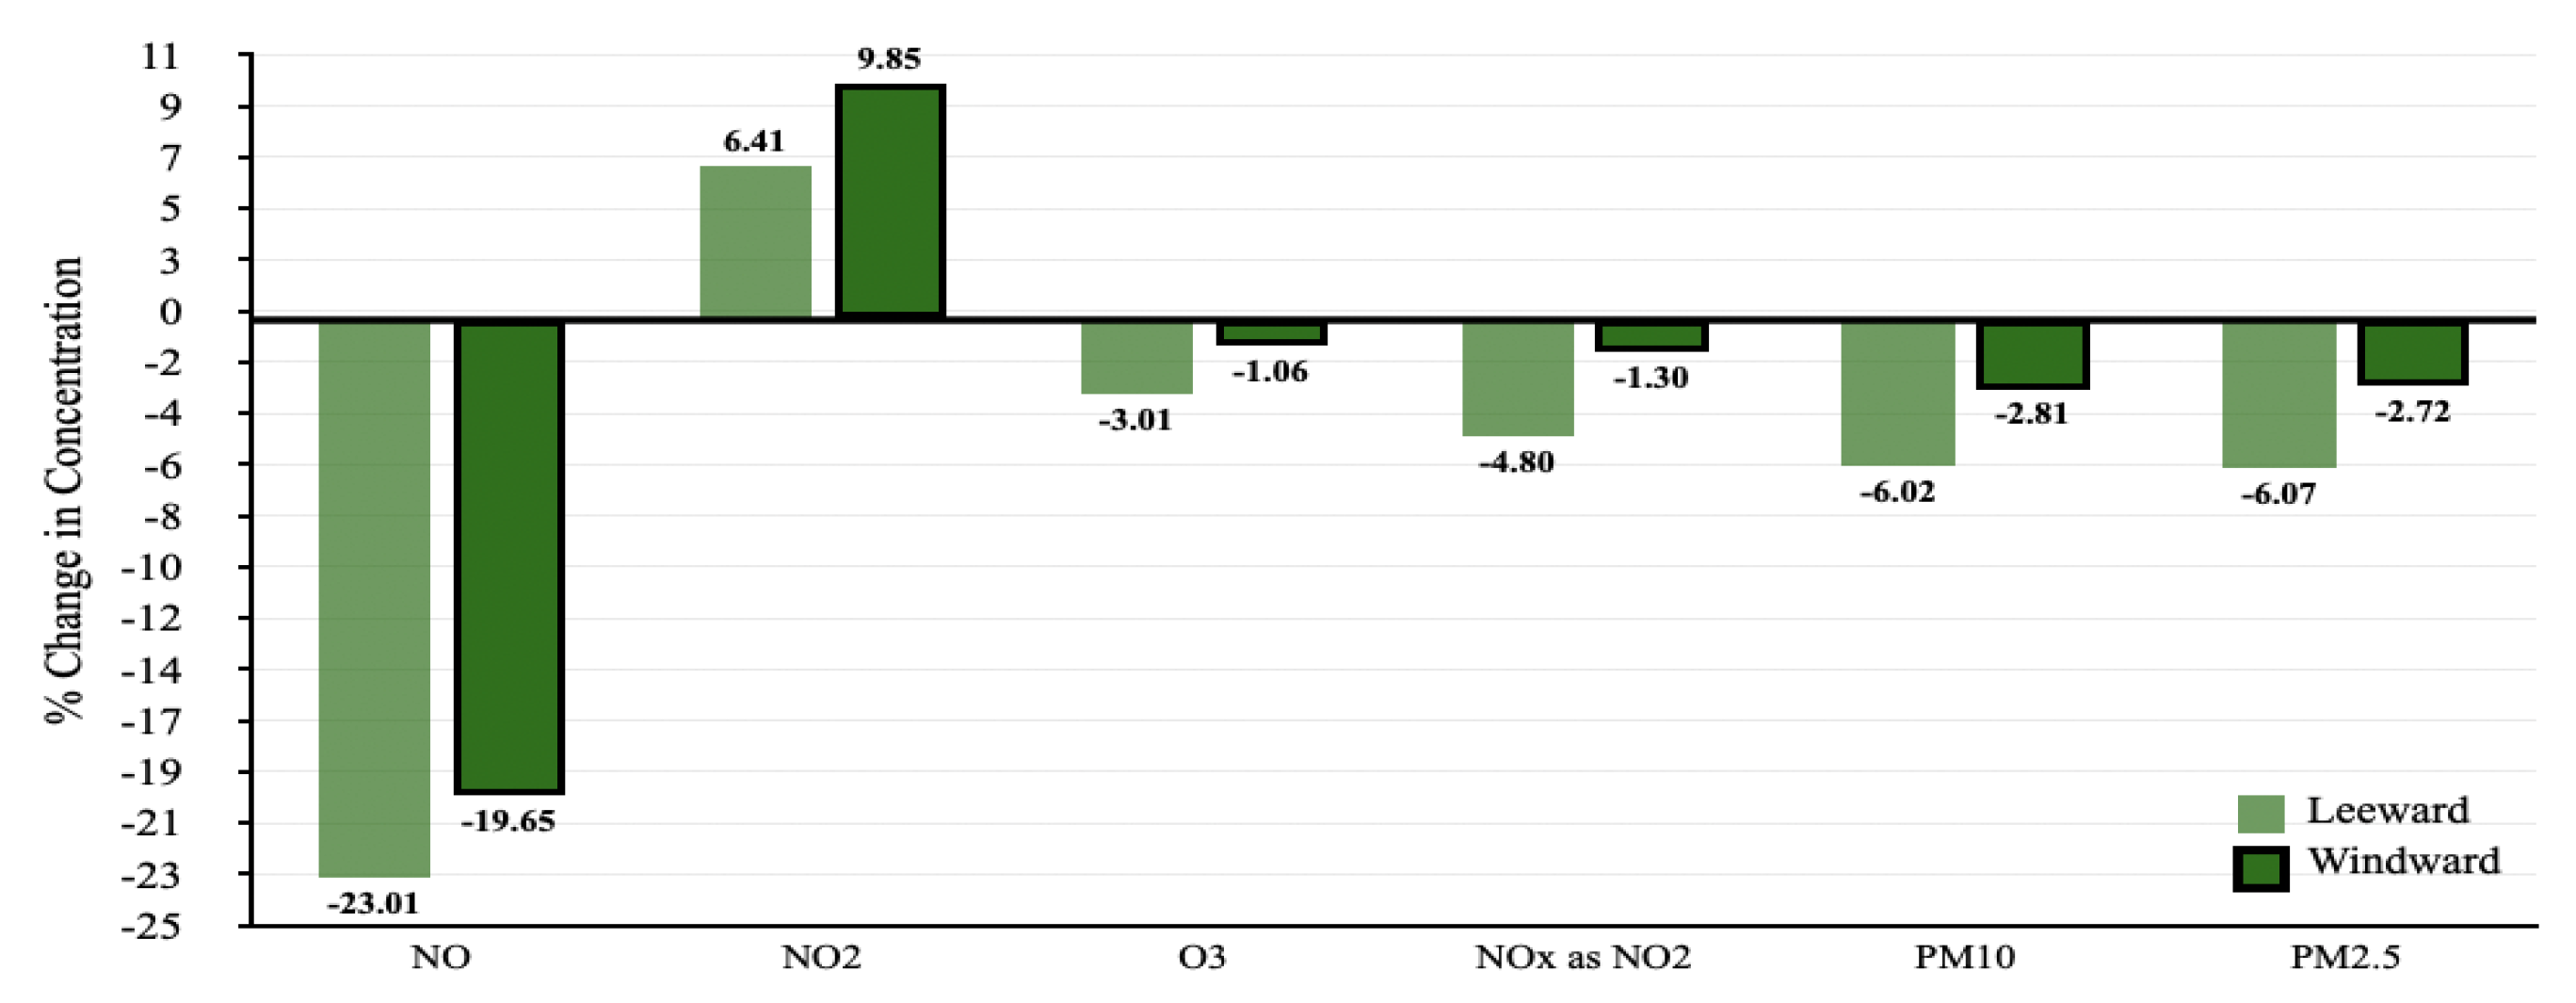
However, Glasgow's air quality challenges require a multi-pronged approach. This research also highlights the synergistic potential of combining strategic tree planting with the planned LEZ in Glasgow. While the LEZ targets a promising 60% NOx reduction through stricter vehicle emissions, its effectiveness can be amplified by 32.65% through strategic tree placement. This "co-improvement" extends beyond NOx, as trees address non-tailpipe PM sources like tire wear and resuspension, offering an additional 28% reduction in PM10 and PM2.5, and further offer a 4% reduction in harmful ground-level ozone, demonstrating the value of moving beyond single-pronged solutions.
It is important to acknowledge that even with the combined benefits of LEZs and strategic tree planting, PM concentrations in Hope Street still exceed legal limits during peak hours. This underlines the need for further research and exploration of additional strategies like optimised traffic management, speed limits, etc. [
44]. However, careful planning and consideration of potential unintended consequences are crucial to ensure the success of such multi-pronged approaches.
5. Implication for Street Design and Policy Making
This study complements Glasgow's existing air quality efforts by providing practical, site-specific design criteria for planting trees strategically in the City Centre, drawing on the principles of the Public Realm Design Strategy.
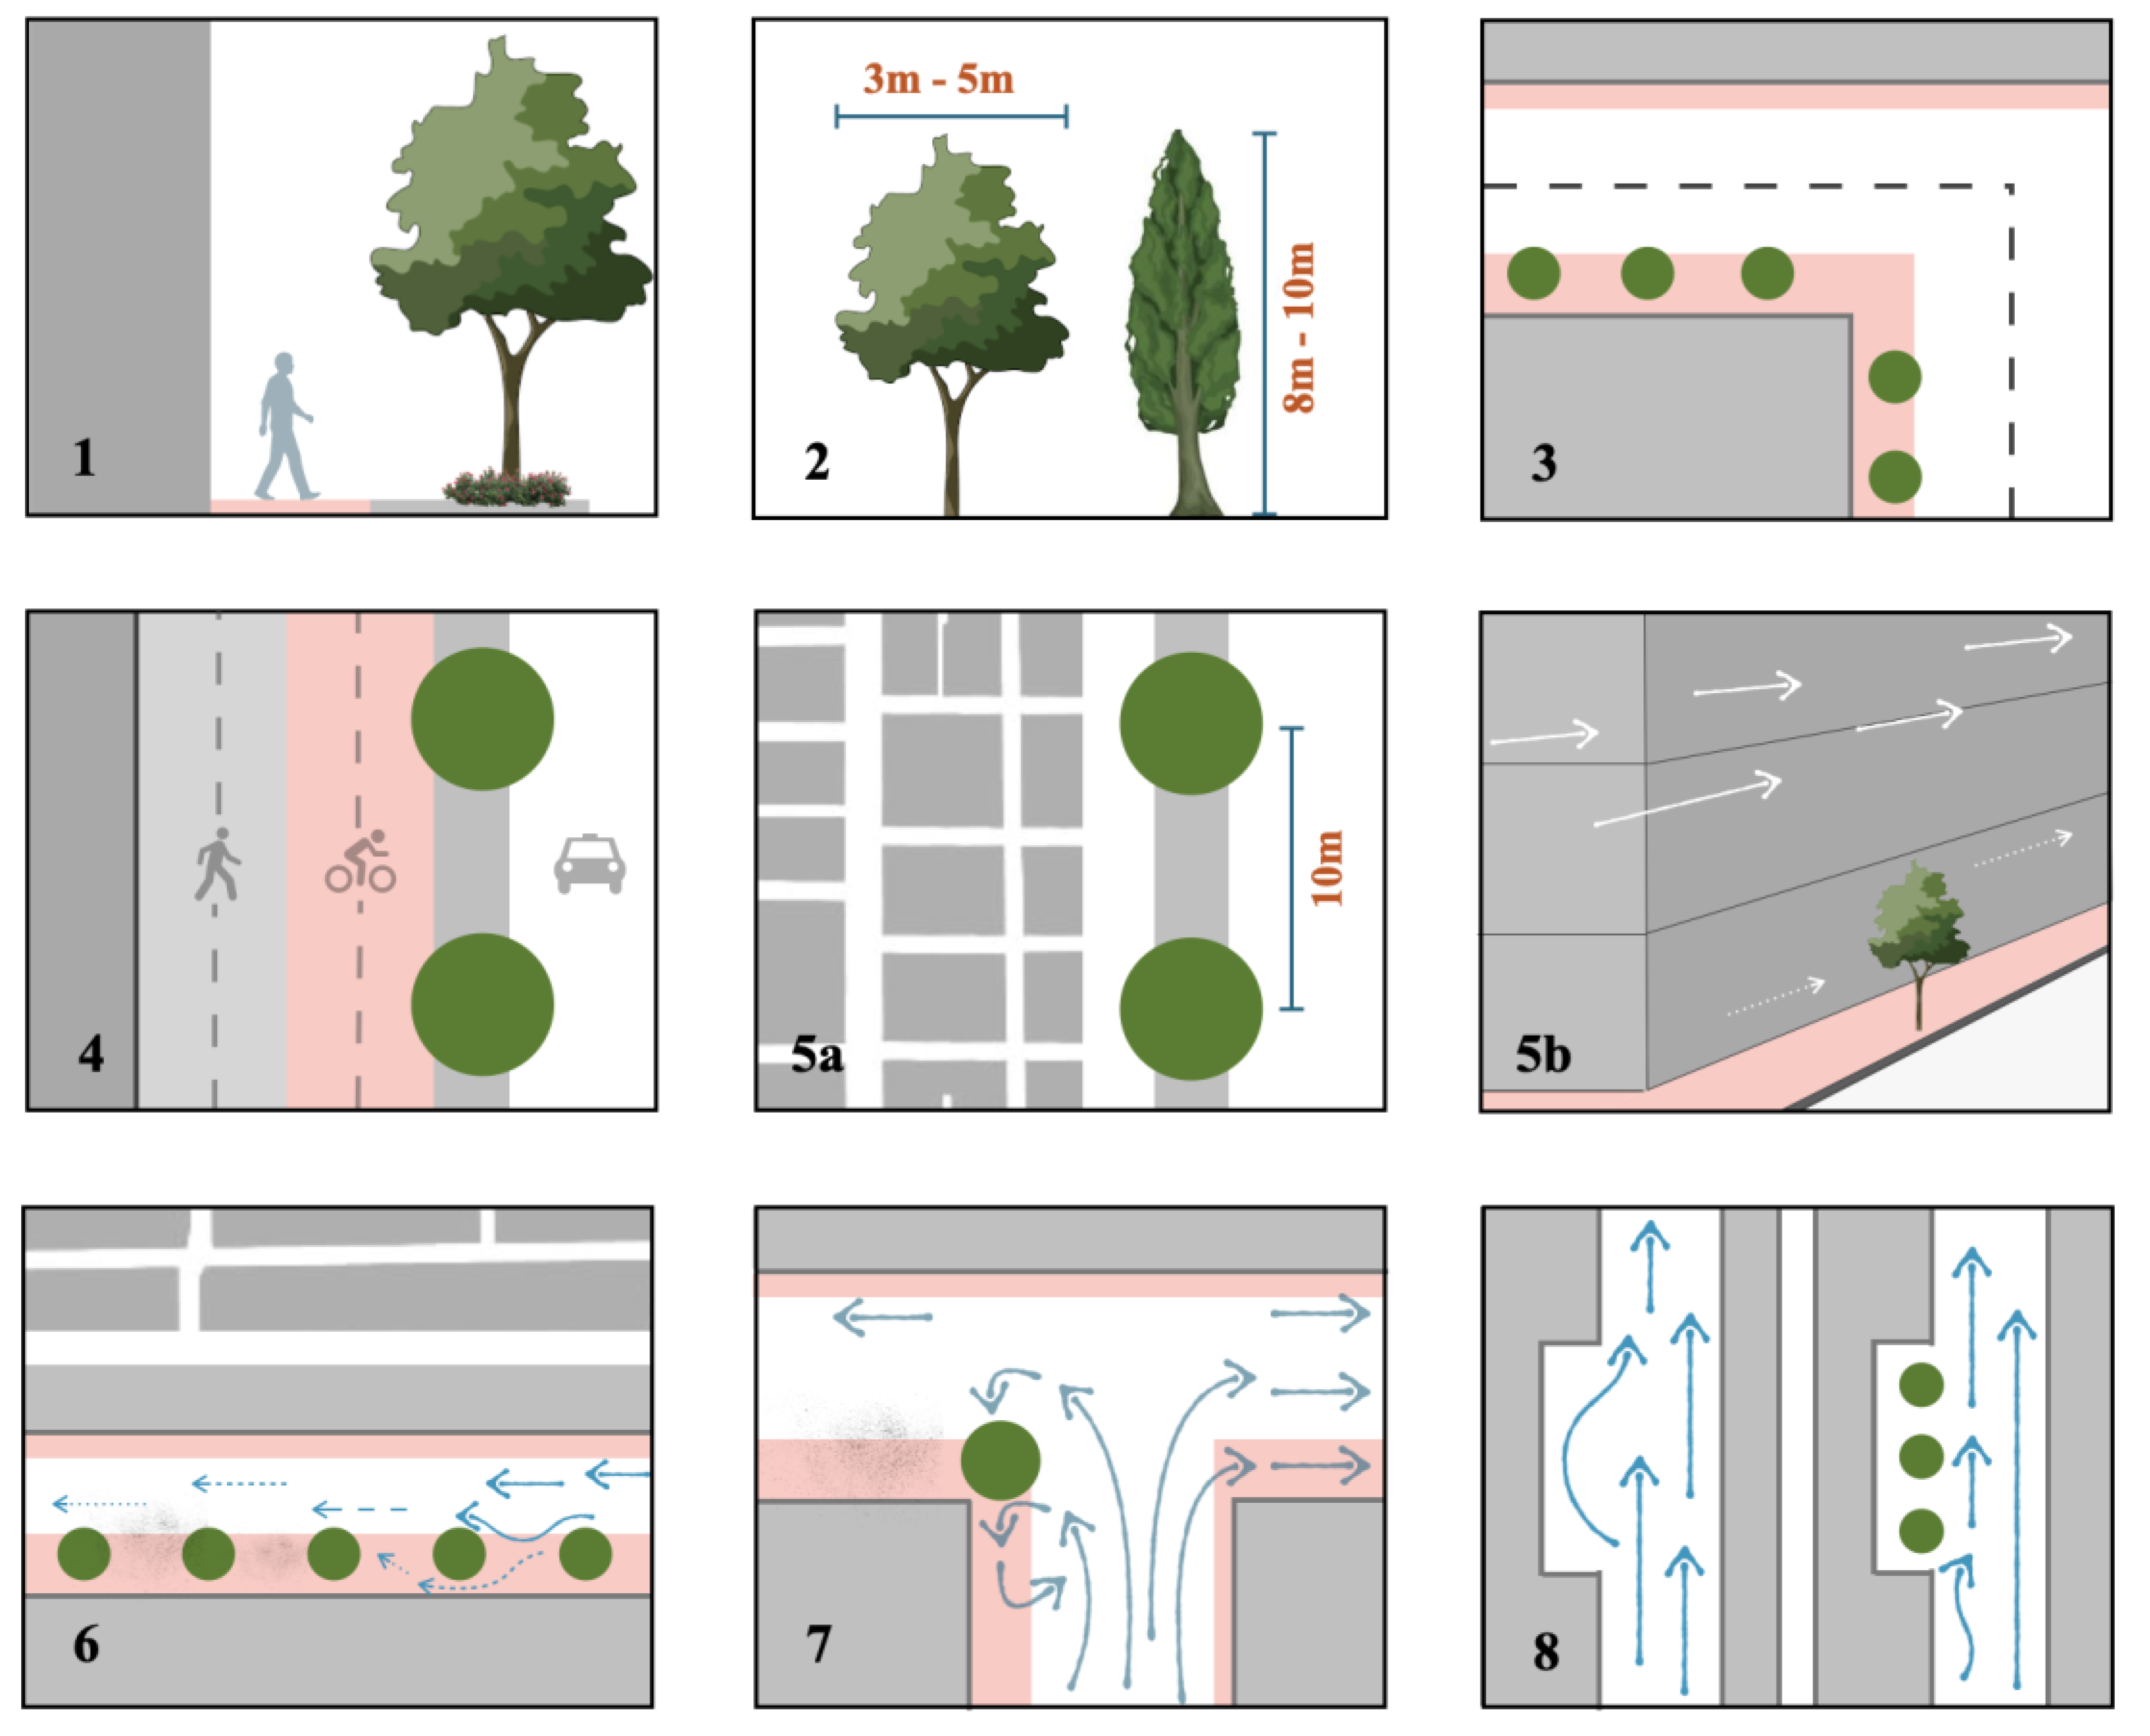
Figure 14 visually illustrates these site-specific criteria, offering city planners insights for maximum air quality improvement. Paragraph numbers below refer to the in-figure numbers in
Figure 14:
Individual trees provide better air quality improvement in street canyons compared to combinations with dense understory vegetation such as hedges or thick bushes, especially in narrower streets. While hedges offer stronger particle reduction, their high maintenance, space requirements, and potential accessibility issues make them less practical in many settings. Trees, on the other hand, offer broader benefits beyond air quality alone.
-
Tailoring tree species and characteristics to Glasgow's unique urban canyons is crucial to increase air quality benefits. Securing effective ventilation and adequate daylight penetrations is important to improve dispersion, pedestrian comfort and building views.
-
a.
Low-porosity trees in cylindrical or spherical shapes demonstrate better performance in dispersing pollutants.
-
b.
Maintaining a strategic height of 8-10 meters and a crown diameter of 3-5 meters could strike a crucial balance.
-
c.
Species like Acer platanoides 'Deborah', Acer campestre 'William Caldwell', Carpinus betulus 'Fastigiata', and Ginkgo biloba, in their semi-mature stage, exhibit ideal porosity and crown shapes for optimal particle capture.
Tree placement in Glasgow streets should follow the wind patterns. For north-south streets, such as Hope Street, placing trees towards the leeward (westerly) side is ideal due to dominant westerly winds. In east-west streets, such as Sauchiehall Street, trees on the south (leeward) side offers similar benefits during southern winds.
Integrating walking and cycling tracks between the building line and strategically placed trees on the leeward side of streets offers a dual-pronged solution. As the row of trees, optimised for wind direction, filters pollutants, it creates a healthier corridor for pedestrians and cyclists, reducing their exposure to pollutants and providing additional protection from moving vehicles.
-
Street tree spacing for air quality enhancement require an approach tailored to the specific street canyon geometry. This is because dense tree rows, while naturally appealing, can counterintuitively trap pollutants and increase pedestrian exposure if not carefully planned.
-
a.
For compact shallow street canyon geometries (AR = 1), maintaining a 10-meter gap between tree canopies strikes the perfect balance, allowing for efficient air circulation and particle capture.
-
b.
For deeper street canyon geometries (AR > 1.5), planting isolated trees with ample spacing is recommended, as wind speeds relatively reduces towards the centre of the street.
In long urban canyons with reduced wind speeds towards the centre, strategically placing trees with larger canopy gaps is recommended. This approach ensures adequate ventilation and pollutant dispersion even in areas where canyon geometry might otherwise hinder airflow.
Placement of trees near intersections can be counterproductive as it obstructs corner eddies and hindering wind flow into street canyons. In such areas, exploring alternative strategies like green walls or smaller shrubs might be more effective.
Focus on the trade-off between existing natural ventilation and tree placement. In areas with building setbacks, which already benefit from strong natural airflow can potentially diminish due to the marginal impact of additional tree-based filtration.
To ensure the long-term benefits of the proposed tree planting guidelines, their implementation should be adapted to Glasgow’s short, medium, and long-term timeframes. This flexibility allows for adjustments based on future changes in the urban landscape and potential redevelopment plans. Moreover, these findings can be extended beyond Glasgow, offering potential solutions for other Scottish cities facing similar challenges.
6. Limitations and Possible Future Directions
This study employed ENVI-met simulations to explore the potential impact of street trees on Glasgow's air quality. However, inherent software limitations and time constraints impacted the comprehensiveness of the simulations. The software's pre-defined settings restricted defining crucial parameters like variable wind speeds or specific pollutant source inputs, hindering the accuracy of real-world pollutant dynamics. Its short timeframe, focusing solely on a single summer day restricts the understanding of seasonal variations in PM levels, particularly crucial for deciduous trees whose foliage changes significantly throughout the year.
Additionally, the research timeframe limited the study to six scenarios and seven case studies, primarily focusing on tree placement in urban canyons and spacing between canopies. While it considered some variations in crown configurations, it lacked a comprehensive assessment of how other factors like different tree heights, porosities, and vegetation types (e.g., trees vs green walls) influence PM reduction. Additionally, the exclusive focus on PM, the dominant pollutant in Glasgow, overlooks other significant urban pollutants like CO, CO2, and SO2, limiting the understanding of the overall impact of trees on air quality. Notably, the study did not consider the impact of wet deposition on trees or, crucially, the influence of diverse weather conditions (solar radiation, wind speed, precipitation, etc.) on PM levels. These factors, as past studies suggest (4, 31), can significantly affect PM levels.
Finally, the study's scope was limited to roadside PM concentrations in Glasgow. Future research could expand the analysis to encompass other urban areas like squares and parks, providing a more holistic understanding of trees' role in enhancing urban air quality and climate resilience across diverse landscapes.
Author Contributions
Conceptualization, methodology, investigation, software, data curation, formal analysis, writing—original draft preparation, C.R; resources, review, methodology, supervision, validation, funding acquisition, R.E. All authors have read and agreed to the published version of the manuscript.
Funding
This research was funded by Education and Culture Executive Agency (EACEA) of the European Union, Erasmus Mundus Joint Mater Degree (MUrCS,
www.murcs.eu), Grant number: 2017-1926
Institutional Review Board Statement
Not applicable
Informed Consent Statement
Not applicable.
Data Availability Statement
The dataset, models, or codes supporting this study’s findings are available from the corresponding author upon reasonable request.
Conflicts of Interest
The authors declare no conflicts of interest.
Appendix A
Figure A1.
Percentage change in various other pollutants in S-03 in comparison to the Base Model.
Figure A1.
Percentage change in various other pollutants in S-03 in comparison to the Base Model.
Appendix B
Figure A2.
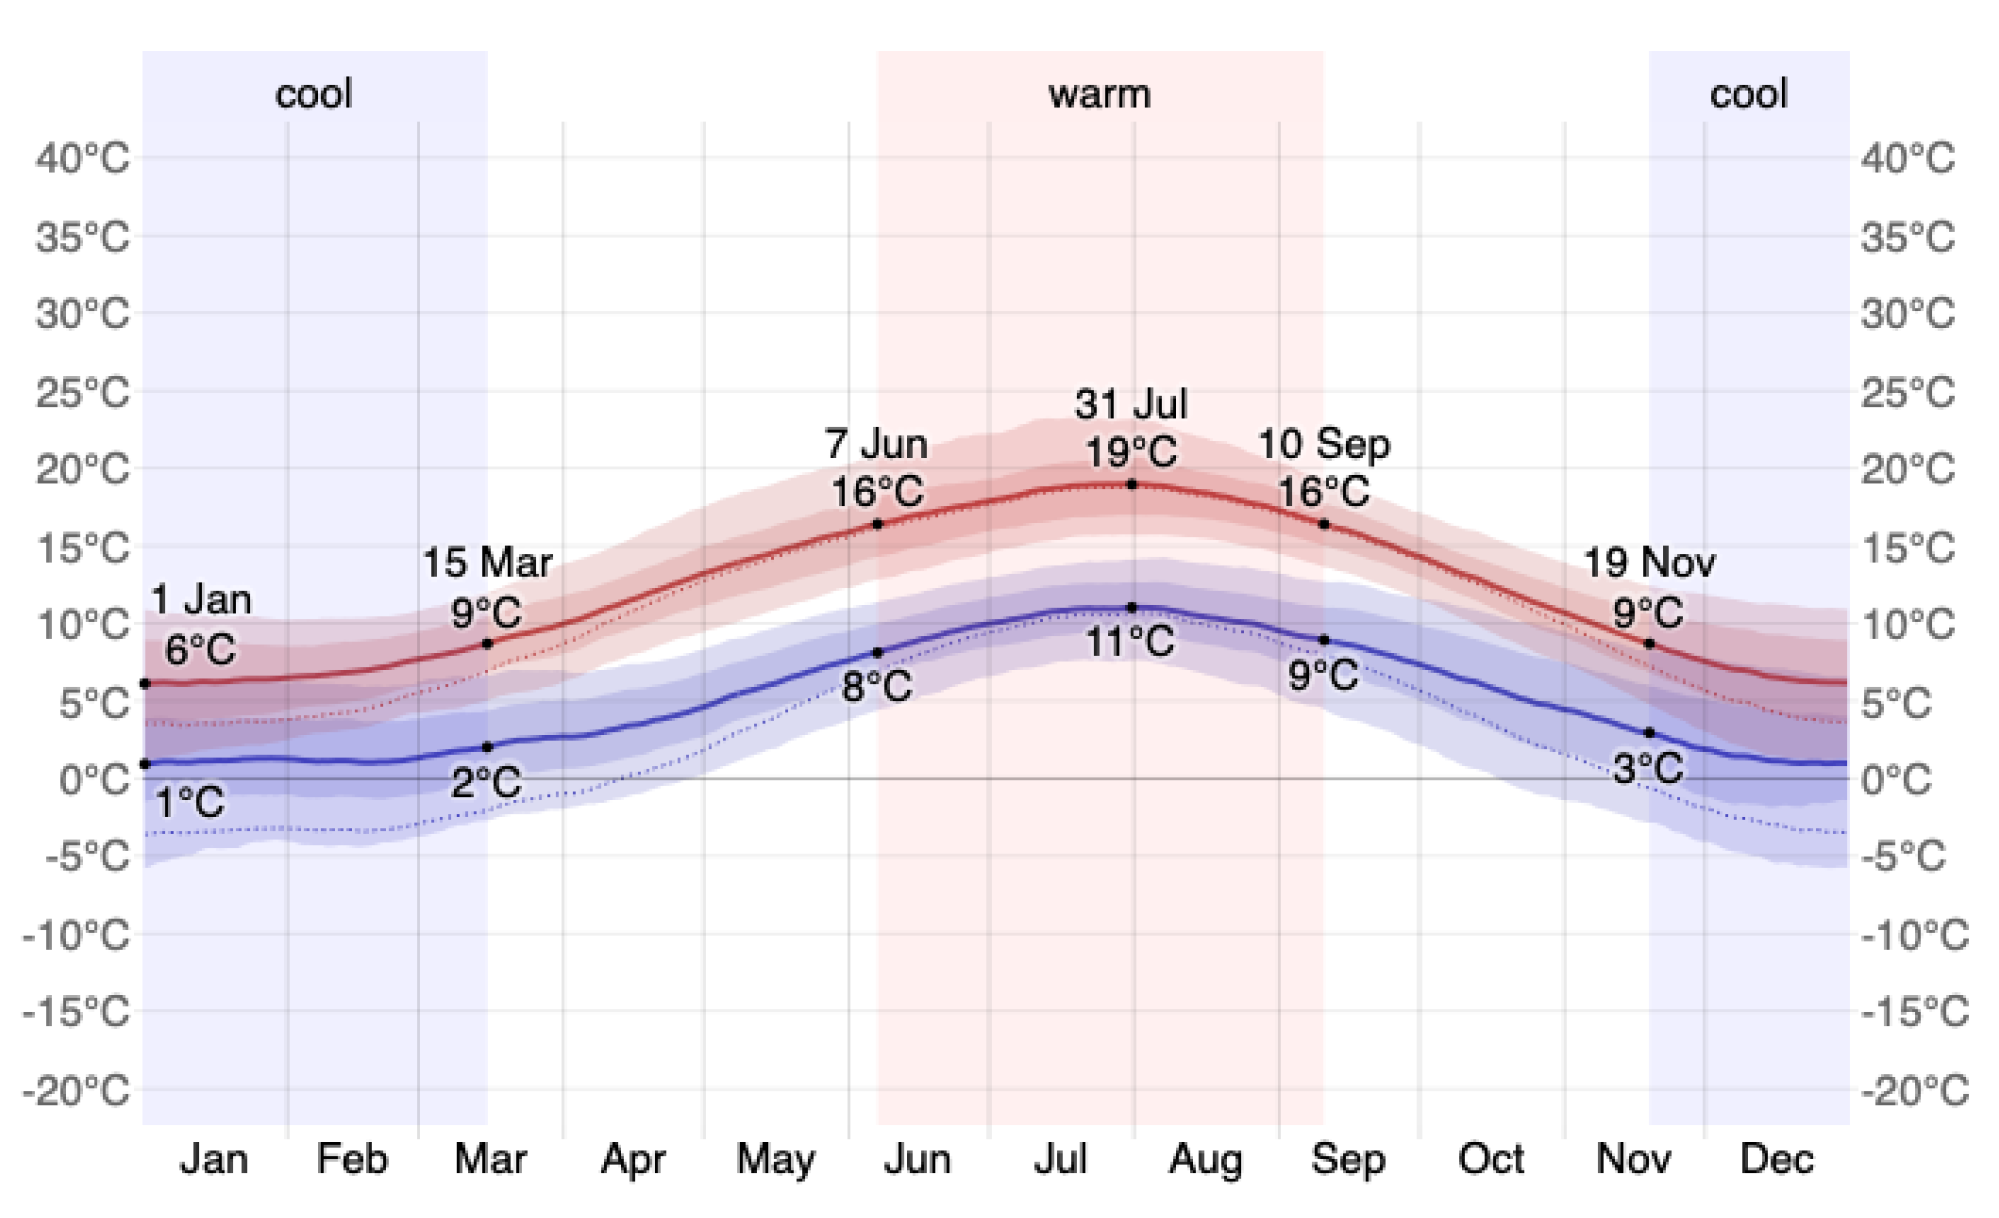
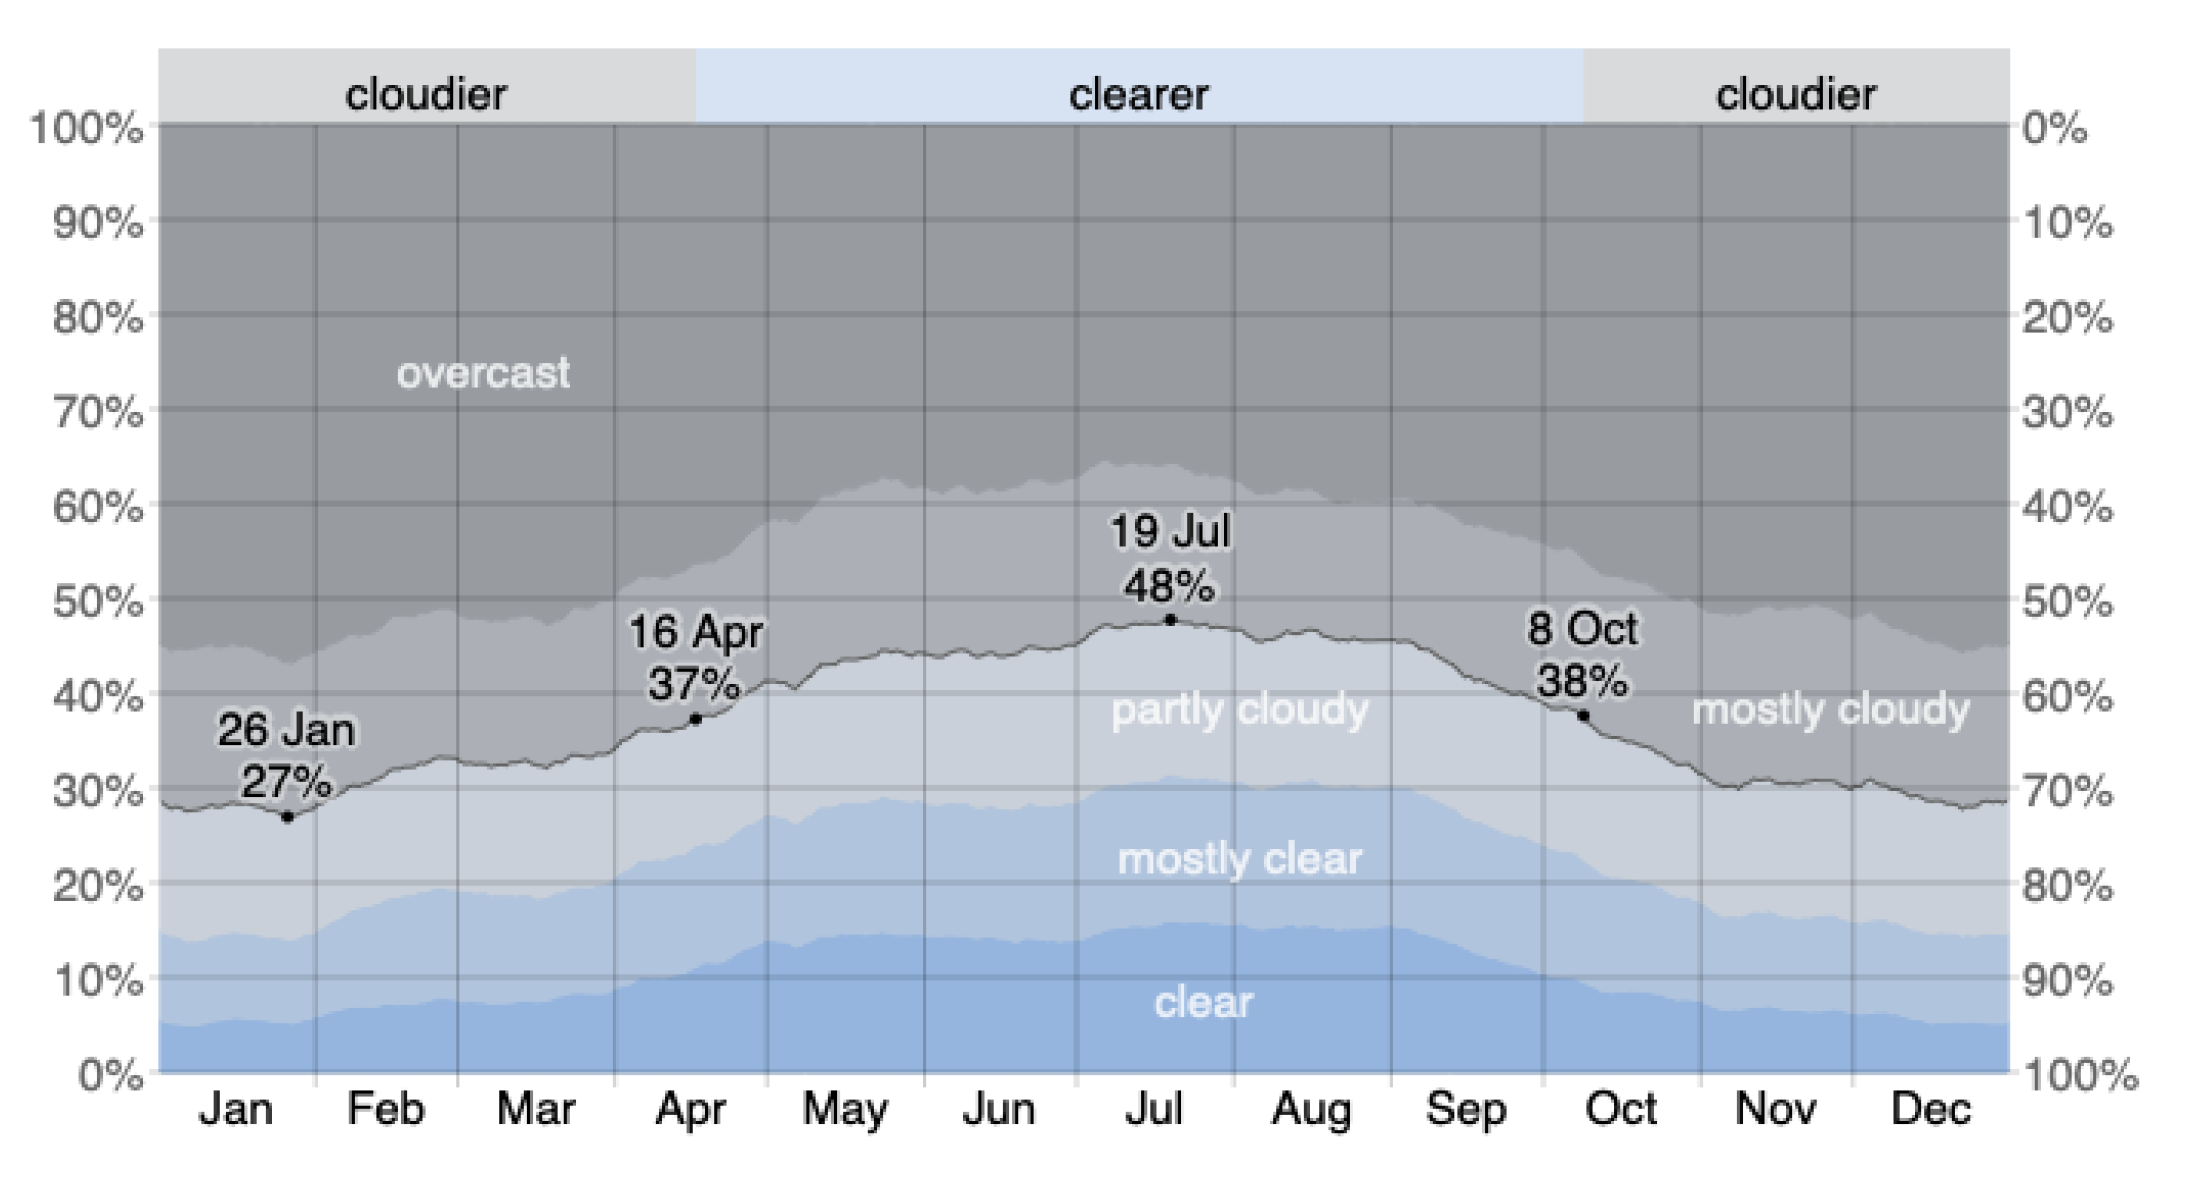
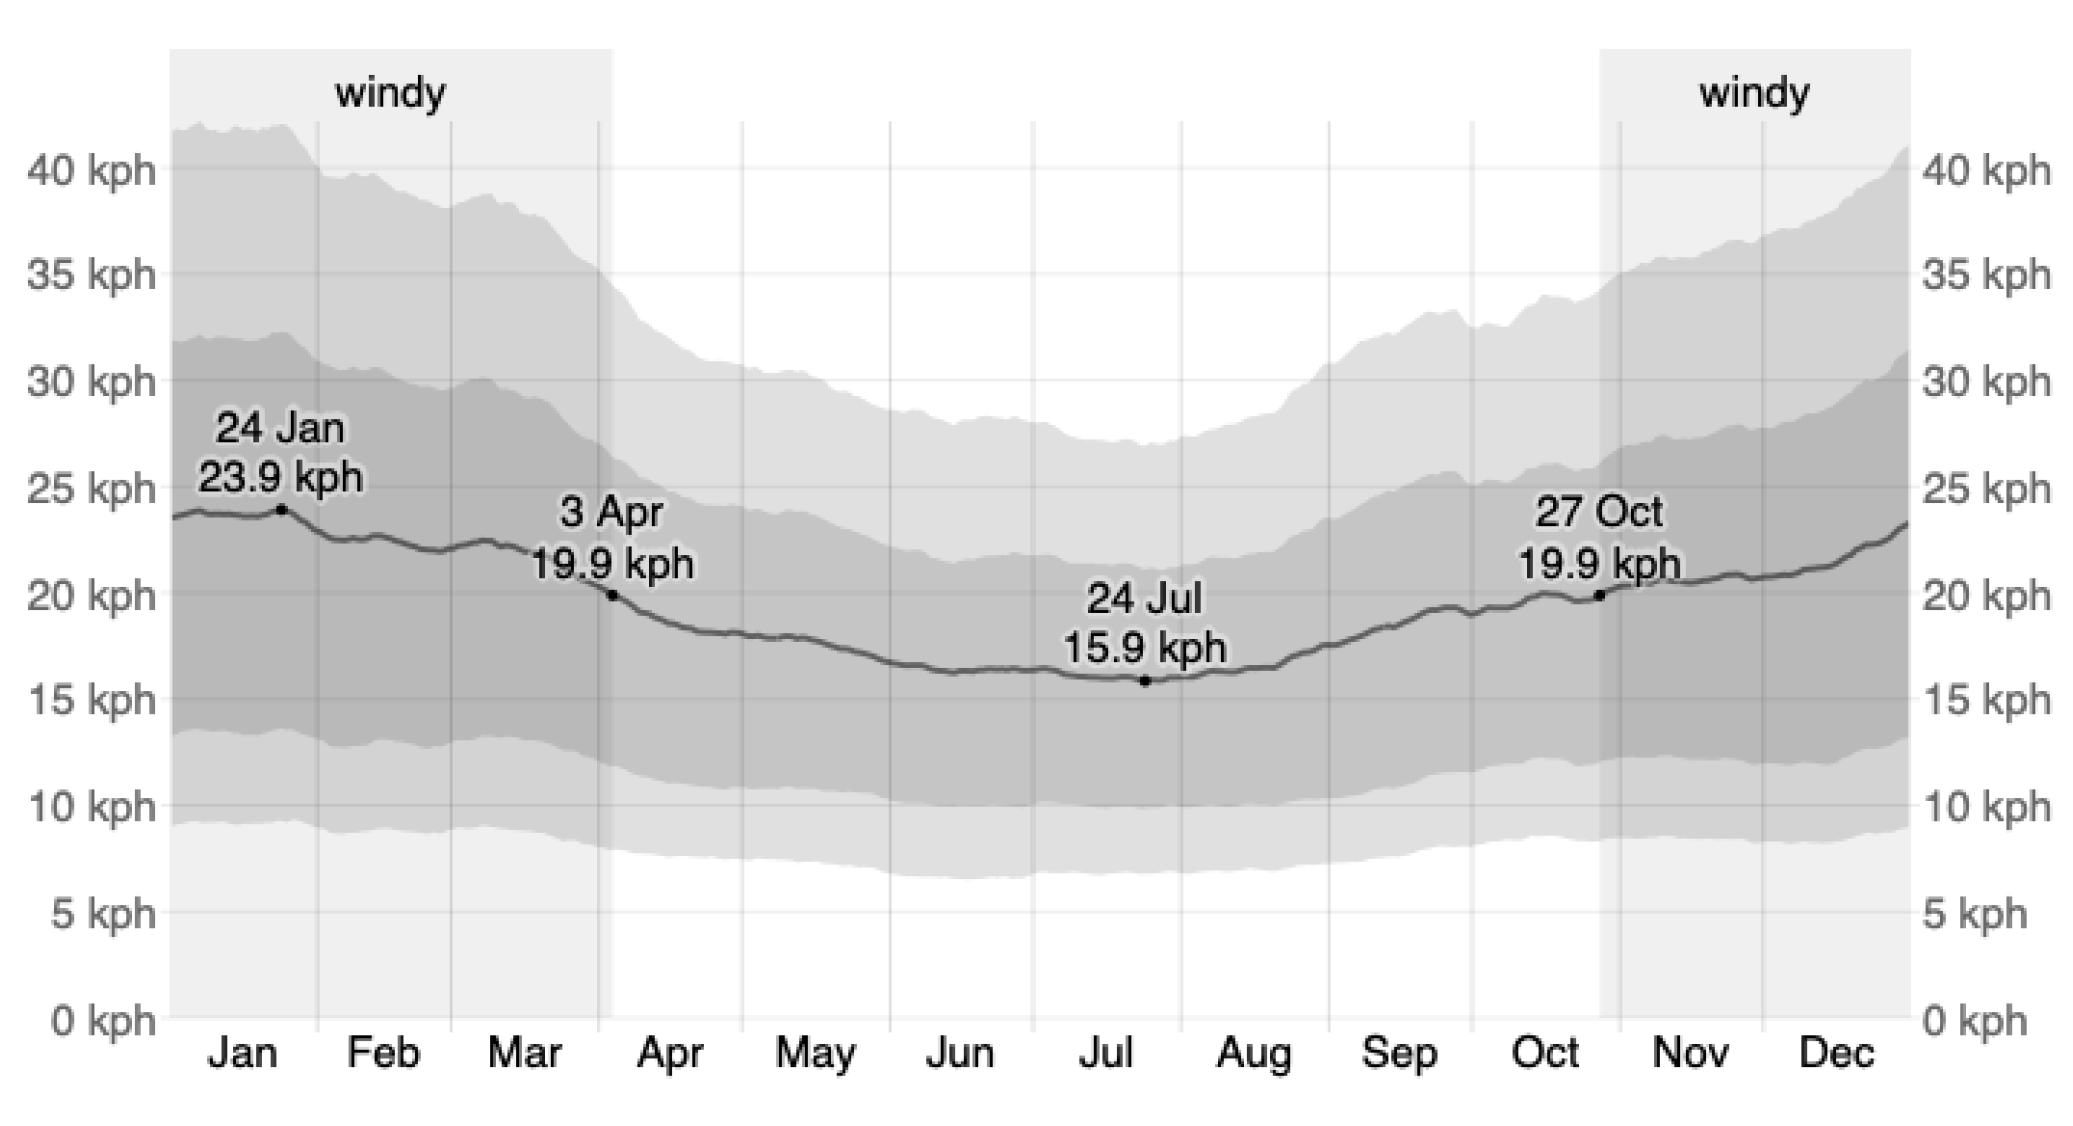
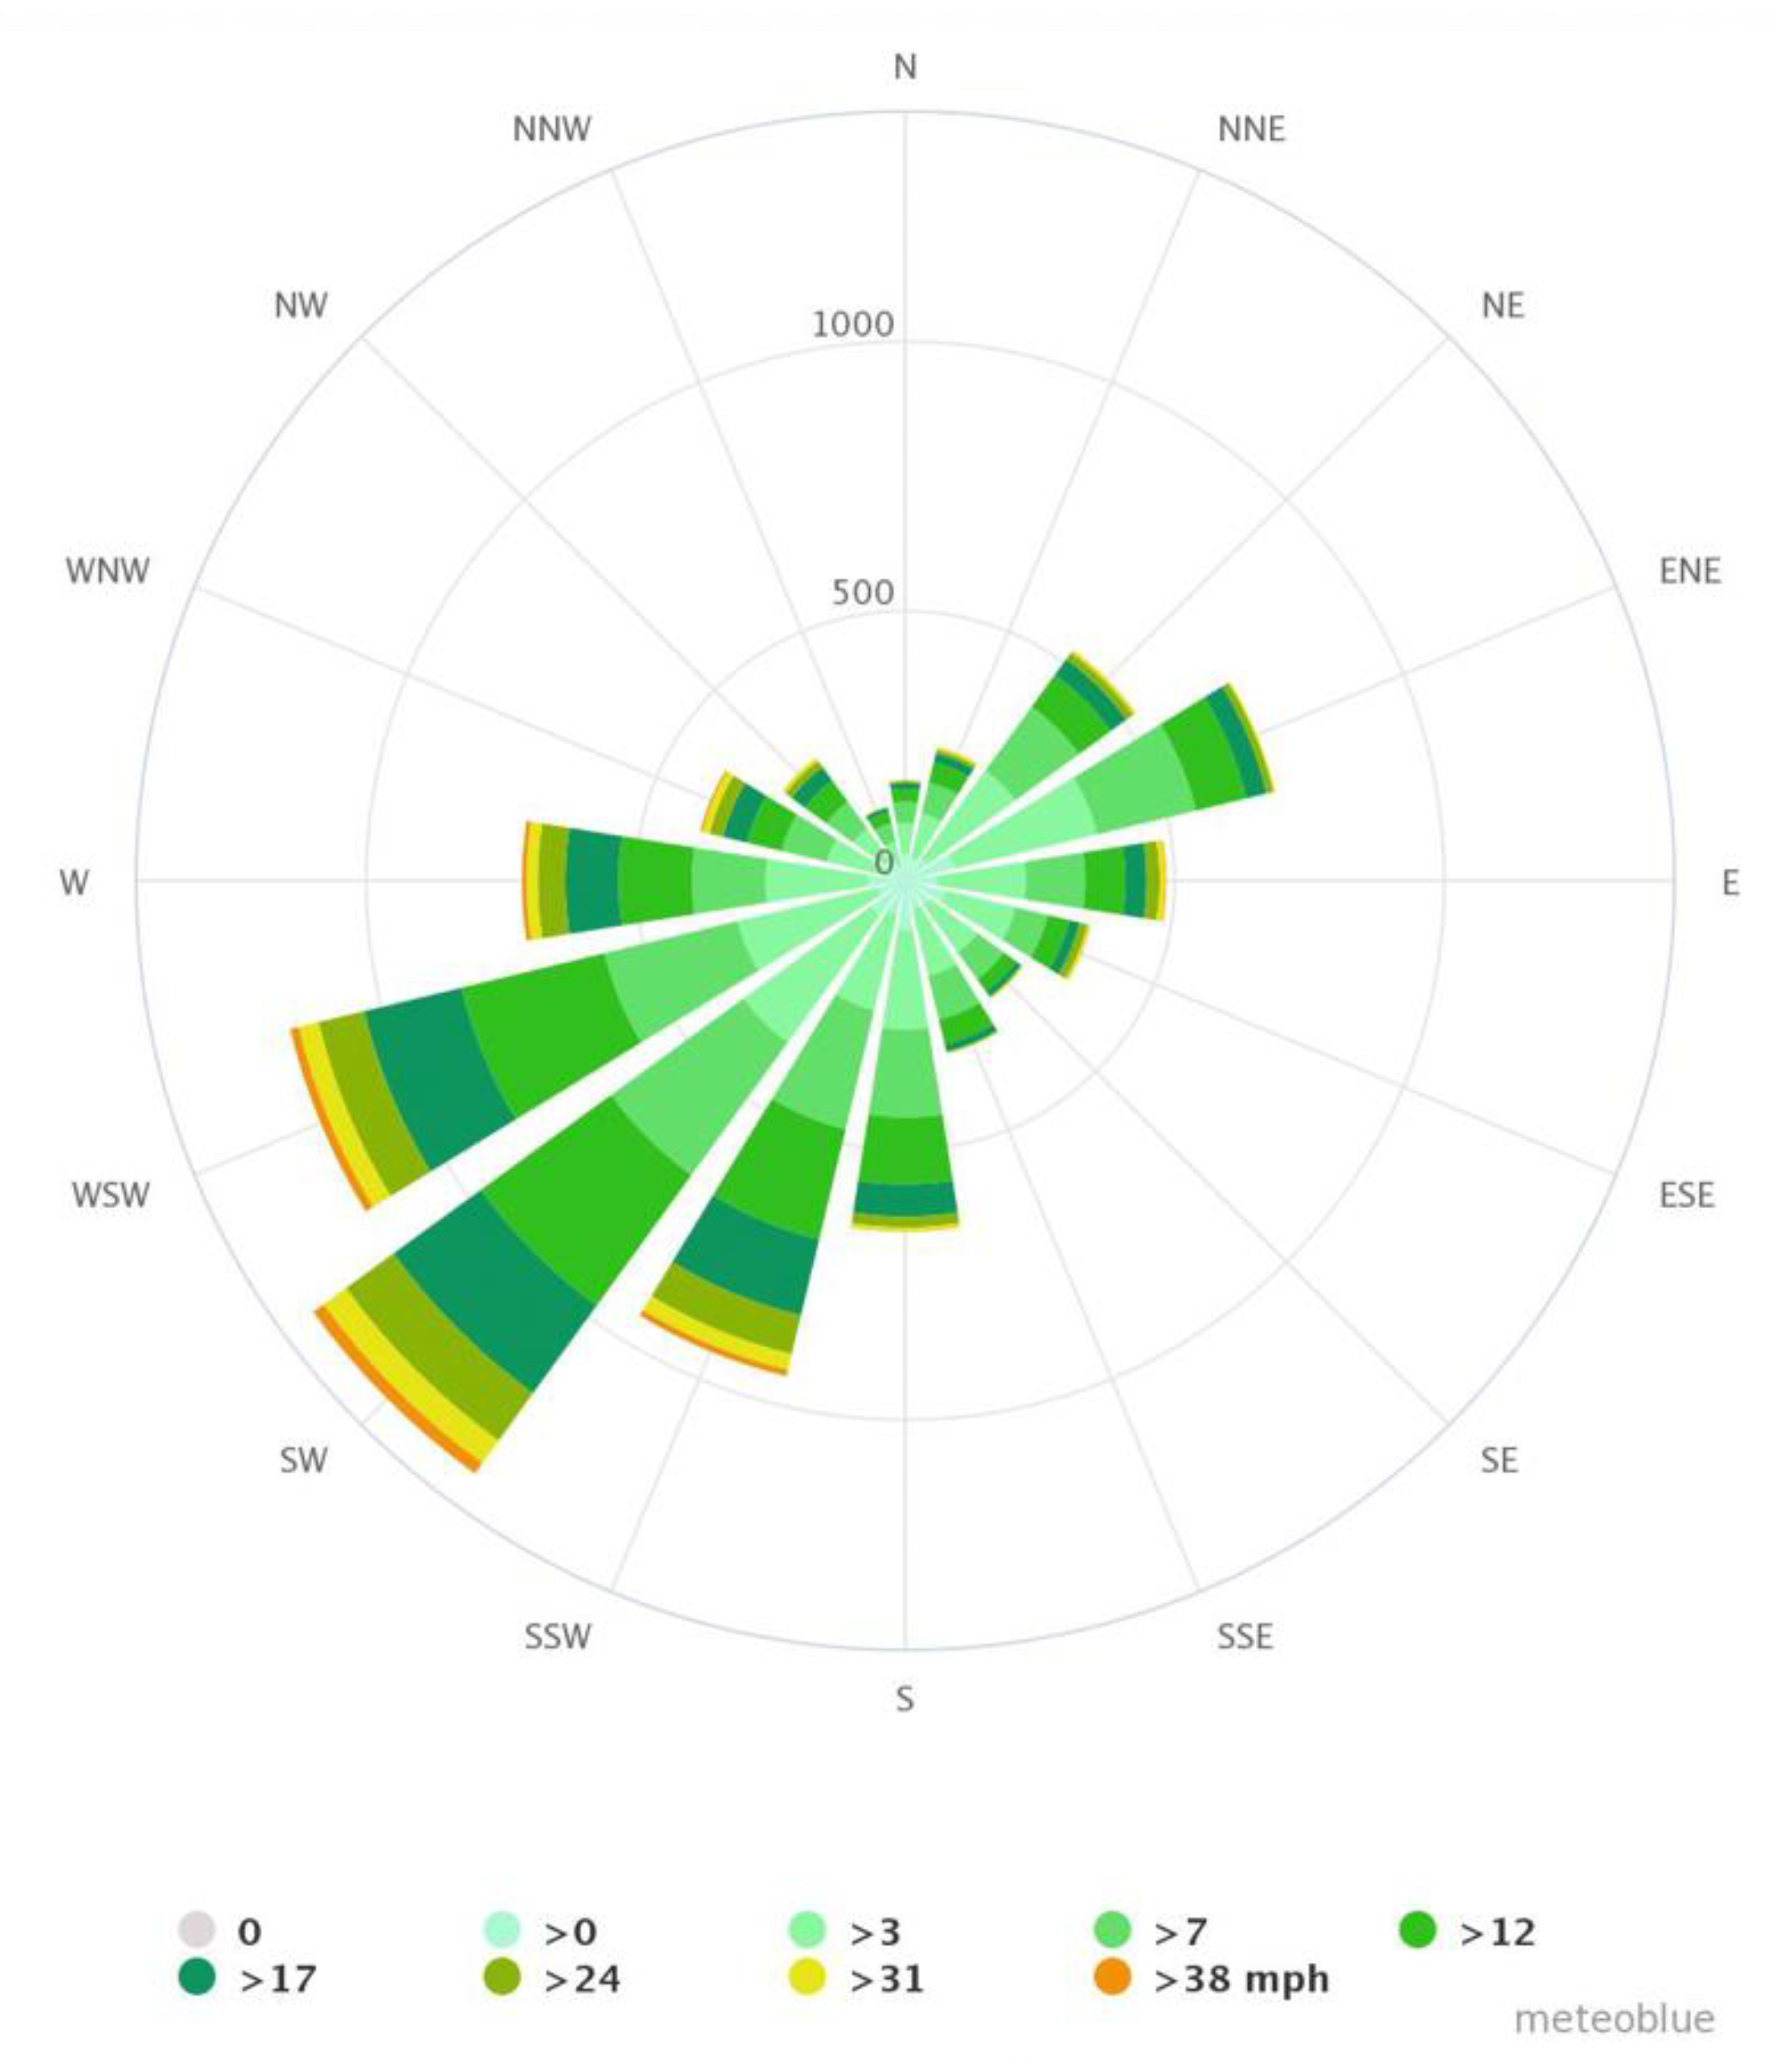
Prevailing annual temperature, sky clearance, wind speed and directions of Glasgow.
Figure A2.
Prevailing annual temperature, sky clearance, wind speed and directions of Glasgow.
Figure A3.
Annual Averaged Min. and Max. Temperature Data - Glasgow; July as the warmest months of the year.
Figure A3.
Annual Averaged Min. and Max. Temperature Data - Glasgow; July as the warmest months of the year.
Figure A4.
Annual Averaged Sky Clearance data- Glasgow; Clearest skies in July with an average sky clearance of 48%.
Figure A4.
Annual Averaged Sky Clearance data- Glasgow; Clearest skies in July with an average sky clearance of 48%.
Figure A5.
Annual Averaged Wind Speed and Direction- Glasgow; July with lowest wind speeds and dominant wind directions from Southwest.
Figure A5.
Annual Averaged Wind Speed and Direction- Glasgow; July with lowest wind speeds and dominant wind directions from Southwest.
References
- Abhijith, K.; Gokhale, S., Passive control potentials of trees and on-street parked cars in reduction of air pollution exposure in urban street canyons. Environmental Pollution 2015, 204, 99-108. [CrossRef]
- Abhijith, K.; Kumar, P.; Gallagher, J.; McNabola, A.; Baldauf, R.; Pilla, F.; Broderick, B.; Di Sabatino, S.; and Pulvirenti, B.; Air pollution abatement performances of green infrastructure in open road and built-up street canyon environments – A review. Atmospheric Environment 2017, 162, 71-86. [CrossRef]
- Baldauf, R.; Roadside vegetation design characteristics that can improve local, near-road air quality. Transportation Research Part D: Transport and Environment 2017, 52, 354-361.
- Battista, G.; Vollaro, R.; Correlation between air pollution and weather data in urban areas: Assessment of the city of Rome (Italy) as spatially and temporally independent regarding pollutants. Atmospheric Environment 2017, 165, 240-247. [CrossRef]
- Berkowicz, R.; Hertel, O.; Larsen, S.E.; Sørensen, N.N.; Nielsen, M.; Modelling traffic pollution in streets. Roskilde: Ministry of Environment and Energy, National Environmental Research Institute 1997.
- Börjesson, M.; Bastian, A.; Eliasson, J.; The economics of low emission zones. Transportation Research Part A: Policy and Practice 2021, 153, 99-114.
- Buccolieri, R.; Salim, S.; Leo, L.; Di Sabatino, S.; Chan, A.; Ielpo, P.; de Gennaro, G.; Gromke, C.; Analysis of local scale tree–atmosphere interaction on pollutant concentration in idealized street canyons and application to a real urban junction. Atmospheric Environment 2011, 45, 1702-1713.
- Camprodon, G.; González, Ó.; Barberán, V.; Pérez, M.; Smári, V.; de Heras, M.; Bizzotto, A.; Smart Citizen Kit and Station: An open environmental monitoring system for citizen participation and scientific experimentation. HardwareX 2019, 6, e00070.
- European Environment Agency. Air quality in Europe - 2019 report. 2019. Available online: https://www.eea.europa.eu/themes/publications/air-quality-in-europe-2019 (accessed on 18 August 2022).
- European Environment Agency. Health impacts of air pollution in Europe, 2021. 2021. Available online: https://www.eea.europa.eu/publications/air-quality-in-europe-2021/health-impacts-of-air-pollution (accessed on 18 August 2022).
- European Environment Agency. Europe’s air quality status - 2022. 2022. Available online: https://www.eea.europa.eu/publications/status-of-air-quality-in-Europe-2022/europes-air-quality-status-2022 (accessed on 18 August 2022).
- Friends of the Earth Scotland. Scotland’s Most Polluted Streets in 2021. 2022. Available online: https://foe.scot (accessed on 18 August 2022).
- Glasgow City Council. Glasgow City Council Low Emission Zone: Transport Scotland Act 2019. 2019. Available online: https://www.glasgow.gov.uk/CHttpHandler.ashx?id=57387&p=0.
- Glasgow City Council. 2020 Air Quality Annual Progress Report (APR) for Glasgow City Council. Local Air Quality Management. 2021. Available online: https://www.glasgow.gov.uk/CHttpHandler.ashx?id=54895&p=0.
- Glasgow City Council. Annual Statistic Reports: Air Quality in Scotland. 2021. Available online: https://www.scottishairquality.scot/laqm/statistics (accessed on 18 August 2022).
- Glasgow City Council. Glasgow Transport Strategy: Final Policy Framework. 2022. Available online: https://www.glasgow.gov.uk/CHttpHandler.ashx?id=55054&p=0 (accessed on 18 August 2022).
- Glasgow City Council. Glasgow's Low Emission Zone (LEZ). 2022. Available online: https://www.glasgow.gov.uk/LEZ (accessed on 18 August 2022).
- Glasgow City Council. Glasgow Public Realm Design + Maintenance Guide. 2020. Available online: https://www.glasgow.gov.uk/CHttpHandler.ashx?id=50702 (accessed on 18 August 2022).
- Gromke, C.; Ruck, B., Influence of trees on the dispersion of pollutants in an urban street canyon—Experimental investigation of the flow and concentration field. Atmospheric Environment 2007, 41, 3287-3302.
- Gromke, C.; Ruck, B., On the Impact of Trees on Dispersion Processes of Traffic Emissions in Street Canyons. Boundary-Layer Meteorology 2009, 131, 19-34.
- Gromke, C.; Ruck, B., Pollutant Concentrations in Street Canyons of Different Aspect Ratio with Avenues of Trees for Various Wind Directions. Boundary-Layer Meteorology 2012, 144, 41-64.
- Gromke, C.; Jamarkattel, N.; Ruck, B., Influence of roadside hedgerows on air quality in urban street canyons. Atmospheric Environment 2016, 139, 75-86.
- Grote, R.; Samson, R.; Alonso, R.; Amorim, J.; Cariñanos, P.; Churkina, G.; Fares, S.; Thiec, D.; Niinemets, Ü.; Mikkelsen, T.; Paoletti, E.; Tiwary, A.; Calfapietra, C., Functional traits of urban trees: Air pollution mitigation potential. Frontiers in Ecology and the Environment 2016, 14, 543-550.
- Gu, J.; Deffner, V.; Küchenhoff, H.; Pickford, R.; Breitner, S.; Schneider, A.; Kowalski, M.; Peters, A.; Lutz, M.; Kerschbaumer, A.; Slama, R.; Morelli, X.; Wichmann, H.; Cyrys, J., Low emission zones reduced PM10 but not NO2 concentrations in Berlin and Munich, Germany. Journal of Environmental Management 2022, 302, 114048.
- Huang, Y.; Hou, R.; Liu, Z.; Song, Y.; Cui, P.; Kim, C., Effects of Wind Direction on the Airflow and Pollutant Dispersion inside a Long Street Canyon. Aerosol and Air Quality Research 2019, 19, 1152-1171.
- IQAir, Glasgow air quality map. 2020. Available online: https://www.iqair.com/air-quality-map/uk/scotland/glasgow (accessed on 18 August 2022).
- Janhäll, S., Review on urban vegetation and particle air pollution – Deposition and dispersion. Atmospheric Environment 2015, 105, pp.130-137.
- Jayaratne, R.; Liu, X.; Thai, P.; Dunbabin, M.; Morawska, L., The influence of humidity on the performance of a low-cost air particle mass sensor and the effect of atmospheric fog. Atmospheric Measurement Techniques 2018, 11, 4883-4890.
- Jeanjean, A.; Monks, P.; Leigh, R., Modelling the effectiveness of urban trees and grass on PM2.5 reduction via dispersion and deposition at a city scale. Atmospheric Environment 2016, 147, 1-10.
- Kintrea, K.; Madgin, R., Transforming Glasgow: Beyond the Post-Industrial City, Bristol. Journal of Social Policy 2019, 51, 465-466.
- Liu, Y.; Zhou, Y.; Lu, J., Exploring the relationship between air pollution and meteorological conditions in China under environmental governance. Scientific Reports 2020, 10.
- Liu, W.; Mao, Y.; Hu, T.; Shi, M.; Zhang, J.; Zhang, Y.; Kong, S.; Qi, S.; Xing, X., Variation of pollution sources and health effects on air pollution before and during COVID-19 pandemic in Linfen, Fenwei Plain. Environmental Research 2022, 213, 113719.
- Mudway, I.; Dundas, I.; Wood, H.; Marlin, N.; Jamaludin, J.; Bremner, S.; Cross, L.; Grieve, A.; Nanzer, A.; Barratt, B.; Beevers, S.; Dajnak, D.; Fuller, G.; Font, A.; Colligan, G.; Sheikh, A.; Walton, R.; Grigg, J.; Kelly, F.; Lee, T.; Griffiths, C., Impact of London's low emission zone on air quality and children's respiratory health: A sequential annual cross-sectional study. The Lancet Public Health 2019, 4, e28-e40.
- Ningal, T.; Mills, G.; Clarke, R., Urban Leaves of Street Trees to Assess Air Quality in Dublin City Centre. Irish Geography 2014.
- Pestel, N.; Wozny, F., Health effects of Low Emission Zones: Evidence from German hospitals. Journal of Environmental Economics and Management 2021, 109, 102512.
- Pugh, T.; MacKenzie, A.; Whyatt, J.; Hewitt, C., Effectiveness of Green Infrastructure for Improvement of Air Quality in Urban Street Canyons. Environmental Science & Technology 2012, 46, 7692-7699.
- Riondato, E.; Pilla, F.; Basu, A.S.; Basu, B., Investigating the effect of trees on urban quality in Dublin by combining air monitoring with i-Tree Eco model. Sustainability Cities and Societies 2020, 61, 102356.
- Salim, S.; Cheah, S.; Chan, A., Numerical simulation of dispersion in urban street canyons with avenue-like tree plantings: Comparison between RANS and LES. Building and Environment 2011, 46, 1735-1746. [CrossRef]
- Salmond, J.; Williams, D.; Laing, G.; Kingham, S.; Dirks, K.; Longley, I.; Henshaw, G., The influence of vegetation on the horizontal and vertical distribution of pollutants in a street canyon. Science of The Total Environment 2013, 443, 287-298.
- Samson, R.; Grote, R.; Calfapietra, C.; Cariñanos, P.; Fares, S.; Paoletti, E.; Tiwary, A., Urban Trees and Their Relation to Air Pollution. Future City 2017, 21-30. [CrossRef]
- Smart Citizen Docs, A modular tool for citizen action. 2022. Available online: https://docs.smartcitizen.me (accessed on 18 August 2022).
- Singh, A.; Singh, H.; Singh, J., Green infrastructure of cities: An overview. Proceedings of the Indian National Science Academy 2020, 86.
- Szopa, S.; Naik, V.; Adhikary, B.; Artaxo, P.; Berntsen, T.; Collins, W.D.; Fuzzi, S.; Gallardo, L.; Kiendler-Scharr, A.; Klimont, Z.; Liao, H.; Unger, N.; Zanis, P., 2021: Short-Lived Climate Forcers. In Climate Change 2021: The Physical Science Basis. Intergovernmental Panel on Climate Change 2021, 817–922. Available online: https://www.ipcc.ch/report/ar6/wg1/downloads/report/IPCC_AR6_WGI_Chapter06.pdf (accessed on 18 August 2022).
- Tang, J.; McNabola, A.; Misstear, B., The potential impacts of different traffic management strategies on air pollution and public health for a more sustainable city: A modelling case study from Dublin, Ireland. Sustainable Cities and Society 2020, 60, 102229.
- Tirelli, G., Anti-Smog Trees: The Top 10 Species. EcoBnb. 2019. Available online: https://ecobnb.com/blog/2019/03/anti-smog-trees/ (accessed on 18 August 2022).
- Verbeek, T.; Hincks, S., The ‘just’ management of urban air pollution? A geospatial analysis of low emission zones in Brussels and London. Applied Geography 2022, 140, 102642.
- Viecco, M.; Jorquera, H.; Sharma, A.; Bustamante, W.; Fernando, H.; Vera, S., Green roofs and green walls layouts for improved urban air quality by mitigating particulate matter. Building and Environment 2021, 204, 108120.
- Voordeckers, D.; Lauriks, T.; Denys, S.; Billen, P.; Tytgat, T.; Van Acker, M., Guidelines for passive control of traffic-related air pollution in street canyons: An overview for urban planning. Landscape and Urban Planning 2021, 207, 103980.
- Wang, L.; Su, J.; Gu, Z; Shui, Q., Effect of Street Canyon Shape and Tree Layout on Pollutant Diffusion under Real Tree Model. Sustainability 2020, 12(5), 2105.
- Wania, A.; Bruse, M.; Blond, N.; Weber, C., Analysing the influence of different street vegetation on traffic-induced particle dispersion using microscale simulations. Journal of Environmental Management 2012, 94, 91-101.
- World Health Organization. Ambient (outdoor) air pollution. 2021. Available online: https://www.who.int/news-room/fact-sheets/detail/ambient-(outdoor)-air-quality-and-health (accessed on 18 August 2022).
- World Health Organization. WHO global air quality guidelines: particulate matter (PM2.5 and PM10), ozone, nitrogen dioxide, sulphur dioxide and carbon monoxide. 2021. Available online: https://apps.who.int/iris/handle/10665/345329 (accessed on 18 August 2022).
- Xue, F.; Li, X., The impact of roadside trees on traffic released PM 10 in urban street canyon: Aerodynamic and deposition effects. Sustainable Cities and Society 2017, 30, 195-204.
- Ysebaert, T.; Koch, K.; Samson, R.; Denys, S., Green walls for mitigating urban particulate matter pollution - A review. Urban Forestry & Urban Greening 2021, 59, 127014.
Figure 1.
Most polluted to least polluted streets in the City Centre (Black, red, and deep orange, representing streets which breach air quality legal limits) – 2013. Data source: Glasgow Public Realm Design + Maintenance Guide.
Figure 1.
Most polluted to least polluted streets in the City Centre (Black, red, and deep orange, representing streets which breach air quality legal limits) – 2013. Data source: Glasgow Public Realm Design + Maintenance Guide.
Figure 2.
Location of the two Smart Citizen 2.1 monitors and the sensor board.
Figure 2.
Location of the two Smart Citizen 2.1 monitors and the sensor board.
Figure 3.
Scenarios and Case Studies; a) Overview of the 06 street tree scenarios for Hope Street, b) Overview of the 07 Cases developed for the optimal scenario identified in the Sensitivity Study.
Figure 3.
Scenarios and Case Studies; a) Overview of the 06 street tree scenarios for Hope Street, b) Overview of the 07 Cases developed for the optimal scenario identified in the Sensitivity Study.
Figure 4.
Hourly averaged PM emissions of a typical week in Hope Street – 2021. Data source: Annual Statistics Reports, 2022.
Figure 4.
Hourly averaged PM emissions of a typical week in Hope Street – 2021. Data source: Annual Statistics Reports, 2022.
Figure 5.
Comparison of measured (green) and reference (blue) Temperature and RH datasets.
Figure 5.
Comparison of measured (green) and reference (blue) Temperature and RH datasets.
Figure 6.
Comparison of measured (orange) and reference (green) PM datasets.
Figure 6.
Comparison of measured (orange) and reference (green) PM datasets.
Figure 7.
Relative difference in averaged PM10 and PM2.5 concentrations for 06 tree placement scenarios across leeward and windward receptors, comparatively to the BM.
Figure 7.
Relative difference in averaged PM10 and PM2.5 concentrations for 06 tree placement scenarios across leeward and windward receptors, comparatively to the BM.
Figure 8.
Leeward and Windward distribution of hourly averaged PM10 and PM2.5 in all scenarios.
Figure 8.
Leeward and Windward distribution of hourly averaged PM10 and PM2.5 in all scenarios.
Figure 9.
i) Receptors points for the spatial analysis of PM along with their respective aspect ratios. ii) Particle distribution at receptors along leeward and windward canyon wall for 06 scenarios. a) Leeward PM10 distribution, and b) Windward PM10 distribution c) Leeward PM2.5 distribution, d) Windward PM2.5 distribution.
Figure 10.
Percentage change in averaged PM10 and PM2.5 for S-03, C1 (size variation), C2 (shape variation), C3 (porosity variation), C4 (variation in species) and C5 (addition of hedges) on leeward and windward side of the street compared to BM.
Figure 10.
Percentage change in averaged PM10 and PM2.5 for S-03, C1 (size variation), C2 (shape variation), C3 (porosity variation), C4 (variation in species) and C5 (addition of hedges) on leeward and windward side of the street compared to BM.
Figure 11.
Relative difference in particle concentrations for C6 and C7 compared to S-03.
Figure 11.
Relative difference in particle concentrations for C6 and C7 compared to S-03.
Figure 12.
Relative difference of hourly averaged leeward and windward behaviour of PM10 and PM2.5 concentrations under perpendicular (270o), oblique (225o) and parallel (180o) winds.
Figure 12.
Relative difference of hourly averaged leeward and windward behaviour of PM10 and PM2.5 concentrations under perpendicular (270o), oblique (225o) and parallel (180o) winds.
Figure 13.
Horizontal distribution of particles under perpendicular (270o), oblique (225o) and parallel (180o) wind directions at pedestrian level (1.8m).
Figure 13.
Horizontal distribution of particles under perpendicular (270o), oblique (225o) and parallel (180o) wind directions at pedestrian level (1.8m).
Figure 14.
A Visual Guide: 7 Street tree planting implications for urban planners in Glasgow City Centre.
Figure 14.
A Visual Guide: 7 Street tree planting implications for urban planners in Glasgow City Centre.
Table 1.
Characteristics of trees found in Sauchiehall Street utilised for the research.
Table 1.
Characteristics of trees found in Sauchiehall Street utilised for the research.
| Street Species |
Crown Shape, Density |
Mature Size |
Tolerance to Pollutants |
VOC |
Pollen |
Acer platanoides ‘Deborah’
(Norway Maple)
|
Columnar, Dense |
Large |
High |
Low |
High |
Acer campestre ‘William Caldwell’
(Field Maple)
|
Fastigiate, Dense |
Medium |
Moderate |
Low |
Moderate |
Carpinus betulus ‘Fastigiata’
(Common Hornbeam)
|
Columnar, Dense |
Medium |
Moderate |
Low |
High |
Ginkgo biloba
(Maidenhair Tree)
|
Pyramidal, Moderate |
Large |
Moderate |
Moderate |
Moderate |
Table 2.
The respective Bias, RMSE and R2 of measured and reference Temperature and RH datasets.
Table 2.
The respective Bias, RMSE and R2 of measured and reference Temperature and RH datasets.
| |
Temperature |
Relative Humidity |
| |
14 Jun |
15 Jun |
16 Jun |
22 Jun |
14 Jun |
15 Jun |
16 Jun |
22 Jun |
| Bias |
0.6 °C |
1.6 °C |
1.53 °C |
5.18 °C |
1.54% |
2.75% |
2.8% |
4.9% |
| RMSE |
1.98 °C |
2.95 °C |
1.6 °C |
2.5 °C |
6.2% |
7.5% |
5.49% |
10.6% |
| R2 |
0.3 |
0.81 |
0.84 |
0.83 |
0.41 |
0.28 |
0.82 |
0.56 |
Table 3.
The respective Bias, RMSE and R2 of measured and reference PM datasets.
Table 3.
The respective Bias, RMSE and R2 of measured and reference PM datasets.
| |
Temperature |
Relative Humidity |
| |
14 Jun |
15 Jun |
16 Jun |
22 Jun |
14 Jun |
15 Jun |
16 Jun |
22 Jun |
| Bias (µg/m3) |
-7.0 |
-8.0 |
-4.85 |
-7.59 |
-1.88 |
-2.14 |
-1.09 |
-1.16 |
| RMSE |
7.8 |
8.3 |
5.2 |
7.9 |
3.5 |
2.2 |
1.6 |
2.1 |
| R2 |
0.05 |
0.10 |
0.21 |
0.24 |
0.0 |
0.49 |
0.31 |
0.13 |
|
Disclaimer/Publisher’s Note: The statements, opinions and data contained in all publications are solely those of the individual author(s) and contributor(s) and not of MDPI and/or the editor(s). MDPI and/or the editor(s) disclaim responsibility for any injury to people or property resulting from any ideas, methods, instructions, or products referred to in the content. |
© 2024 by the authors. Licensee MDPI, Basel, Switzerland. This article is an open access article distributed under the terms and conditions of the Creative Commons Attribution (CC BY) license (http://creativecommons.org/licenses/by/4.0/).
